Central European Journal of Biology * E-mail: [email protected] Research Article Received 03 February 2010; Accepted 27 April 2010 Keywords: Salinity • Pisum sativum L. • Water regime • Macronutrients • Roots • Stems • Pods • Grains Department of Field and Vegetable Crops, Faculty of Agriculture, University of Novi Sad, 21000 Novi Sad, Republic of Serbia Ivana Maksimović*, Marina Putnik-Delić, Ivana Gani, Jovana Marić, Žarko Ilin Growth, ion composition, and stomatal conductance of peas exposed to salinity Abstract: Availability of irrigation water of appropriate quality is becoming critical in many regions. Excess salt in irrigation water represents a risk for crop yield, crop quality, and soil properties. During the short vegetation period, field peas require high amounts of water, and irrigation is often indispensable for successful production. Steady presence of NaCl (0.1, 0.2, 0.6 or 1.2 g NaCl L -1 in ½ strength Hoagland nutrient solution) under semi-controlled conditions reduced growth and resulted in shorter vegetation. Disturbances in the peas’ water regime were provoked by NaCl, as water content in pea tissues was reduced and stomatal density and stomatal diffusive resistance increased in the presence of higher NaCl concentrations. Concentration of Na + increased in all pea tissues with increased NaCl concentration in the nutrient medium. In the presence of NaCl, concentrations of K + , Ca 2+ and P i increased in roots, stems and leaves, and decreased and in pods and grains. Concentration ratios Na + /K + , Na + /Ca 2+ , K + /Ca 2+ and (Na + +K + )/Ca 2+ in various plant parts were affected as well, but magnitudes of changes were variable. Continuous presence of NaCl in concentrations frequently met in irrigation waters significantly reduced pea growth, impaired the water regime, and altered plant chemical composition. 1. Introduction The sodium ion (Na + ) is generally regarded as a beneficial element for plant metabolism, because only a few plant species cannot complete their life cycle without it, like some euchalophytes and C4 plants. For most species, including peas, Na + is not essential in any sense [1]. However, pea production requires high amounts of water during the short vegetation period, and irrigation is often required. At the same time, lack of water is a growing problem, and quality of water, loaded with pollution, further limits the application of irrigation. According to the most common classifications of the water sources and pumping stations [2], estimated usability of this water in Vojvodina, the most important agricultural region in Serbia, is of the class C4S3-C3S2 or IVb (water not suitable for irrigation). Preliminary field analyses were initiated because in Vojvodina, water that is used for irrigation has a Na + concentration between 0.201 and 0.578 g L -1 , with EC=1173-3140 µS cm -1 . On average, field peas are irrigated with 55 mm of water during vegetation. Analyses of peas produced in such conditions showed that the dry mass declined and concentrations of Na + , K + and Ca 2+ in various plant parts significantly changed [3]. Chloride ions are taken up easily by plants, and their mobility in short- and long-distance transport is high. Average content in plants is 2-20 mg g -1 DW, and optimal content is 0.2-0.4 mg g -1 DW. Cl - can affect plant growth directly by influencing photosynthesis, as it is required for the reactions of photosystem II, and indirectly, via stomatal regulation [4]. In addition, chloride also has an important function in osmoregulation at different levels and it plays an essential role in stomatal regulation. Opening and closure of stomata is mediated by fluxes of potassium and accompanying anions such as chloride and malate [5]. On a worldwide basis, the problem of chlorine toxicity is much greater than that of chlorine deficiency. On average, concentrations of chloride in the external solution of more than 20 mM can lead to toxicity in sensitive plant species, whereas in tolerant species the © Versita Sp. z o.o. 682 Cent. Eur. J. Biol.• 5(5) • 2010 • 682-691 DOI: 10.2478/s11535-010-0052-y - 10.2478/s11535-010-0052-y Downloaded from PubFactory at 09/07/2016 05:44:11PM via free access

Welcome message from author
This document is posted to help you gain knowledge. Please leave a comment to let me know what you think about it! Share it to your friends and learn new things together.
Transcript
Central European Journal of Biology
* E-mail: [email protected]
Research Article
Received 03 February 2010; Accepted 27 April 2010
Keywords: Salinity • Pisum sativum L. • Water regime • Macronutrients • Roots • Stems • Pods • Grains
Department of Field and Vegetable Crops, Faculty of Agriculture, University of Novi Sad, 21000 Novi Sad, Republic of Serbia
Ivana Maksimović*, Marina Putnik-Delić, Ivana Gani, Jovana Marić, Žarko Ilin
Growth, ion composition, and stomatal conductance of peas exposed to salinity
Abstract: Availability of irrigation water of appropriate quality is becoming critical in many regions. Excess salt in irrigation water represents a risk for crop yield, crop quality, and soil properties. During the short vegetation period, field peas require high amounts of water, and irrigation is often indispensable for successful production. Steady presence of NaCl (0.1, 0.2, 0.6 or 1.2 g NaCl L-1 in ½ strength Hoagland nutrient solution) under semi-controlled conditions reduced growth and resulted in shorter vegetation. Disturbances in the peas’ water regime were provoked by NaCl, as water content in pea tissues was reduced and stomatal density and stomatal diffusive resistance increased in the presence of higher NaCl concentrations. Concentration of Na+ increased in all pea tissues with increased NaCl concentration in the nutrient medium. In the presence of NaCl, concentrations of K+, Ca2+ and Pi increased in roots, stems and leaves, and decreased and in pods and grains. Concentration ratios Na+/K+, Na+/Ca2+, K+/Ca2+ and (Na++K+)/Ca2+ in various plant parts were affected as well, but magnitudes of changes were variable. Continuous presence of NaCl in concentrations frequently met in irrigation waters significantly reduced pea growth, impaired the water regime, and altered plant chemical composition.
1. IntroductionThe sodium ion (Na+) is generally regarded as a beneficial element for plant metabolism, because only a few plant species cannot complete their life cycle without it, like some euchalophytes and C4 plants. For most species, including peas, Na+ is not essential in any sense [1]. However, pea production requires high amounts of water during the short vegetation period, and irrigation is often required. At the same time, lack of water is a growing problem, and quality of water, loaded with pollution, further limits the application of irrigation. According to the most common classifications of the water sources and pumping stations [2], estimated usability of this water in Vojvodina, the most important agricultural region in Serbia, is of the class C4S3-C3S2 or IVb (water not suitable for irrigation). Preliminary field analyses were initiated because in Vojvodina, water that is used for irrigation has a Na+ concentration between 0.201 and 0.578 g L-1, with EC=1173-3140 µS cm-1. On average, field peas are irrigated with 55 mm of water
during vegetation. Analyses of peas produced in such conditions showed that the dry mass declined and concentrations of Na+, K+ and Ca2+ in various plant parts significantly changed [3].
Chloride ions are taken up easily by plants, and their mobility in short- and long-distance transport is high. Average content in plants is 2-20 mg g-1 DW, and optimal content is 0.2-0.4 mg g-1 DW. Cl- can affect plant growth directly by influencing photosynthesis, as it is required for the reactions of photosystem II, and indirectly, via stomatal regulation [4]. In addition, chloride also has an important function in osmoregulation at different levels and it plays an essential role in stomatal regulation. Opening and closure of stomata is mediated by fluxes of potassium and accompanying anions such as chloride and malate [5].
On a worldwide basis, the problem of chlorine toxicity is much greater than that of chlorine deficiency. On average, concentrations of chloride in the external solution of more than 20 mM can lead to toxicity in sensitive plant species, whereas in tolerant species the
© Versita Sp. z o.o.
682
Cent. Eur. J. Biol.• 5(5) • 2010 • 682-691DOI: 10.2478/s11535-010-0052-y
- 10.2478/s11535-010-0052-yDownloaded from PubFactory at 09/07/2016 05:44:11PM
via free access
Growth, ion composition, and stomatal conductance of peas exposed to salinity
concentration can be four to five times higher without reducing growth [4]. In the present paper, the two highest NaCl concentrations applied to peas were 25.1 and 50.02 mmol NaCl L-1. Symptoms of chloride toxicity that occur in the absence of sodium are also similar to symptoms of salt toxicity that occur when chloride is accompanied by sodium [6]. The concentration at which Cl- becomes toxic is probably in the same range as that for Na+ [7].
Excessive concentrations of soluble salts in the soil or nutrient solution affect plant metabolism in many ways [8,9]. It reduces water potential of the soil solution, thus forcing plants to adjust their tissues osmotically to be able to keep tissue water potential lower than that of the soil. This process leads to an increase in the salt concentration in the cells, which can result in salt toxicity. Adaptation of plants to high levels of sodium salts can be achieved in two very different ways. Plants can either exclude salts from the interior of their cells, or include salts within the leaf cells but at the same time sequester them in the vacuoles. The result of this adaptation process is maintenance of cytoplasmic salt concentration at a relatively low level [10]. Ion selectivity enables the plant to control uptake of toxic ions like Na+ and Cl– and their accumulation in the cytoplasm [11]. Plants do this either through “strict ion regulation” to keep the Na+ and Cl– out of the transpiration stream and subsequently the cytoplasm of the aerial parts of the plants [12], or through ion discrimination, enabling the plant to discriminate between chemically similar ions such as Na+ and K+ [1].
Common responses of plants to NaCl stress comprise increased concentration of reactive oxygen species (ROS), enhanced activities of antioxidant enzymes, and enhanced synthesis/accumulation of some key metabolites [13-15]. Osmotic adjustment, an important mechanism of salt tolerance, is achieved through the accumulation of compatible osmolytes in the cell [8,15-18].
There are several strategies that can be applied to improve salt tolerance of plants growing in saline soils. These include (i) presowing seed treatment (osmo-, halo-, hydro-, thermo-, and hormone-priming), (ii) exogenous application of osmolytes, osmoprotectants, and plant growth regulators to plants that under salt stress, and (iii) the use of plant selection and breeding [19].
In field experiments, the severity of major abiotic stresses such as salinity, drought, heat, frost, chilling, waterlogging, and mineral toxicity is unpredictable. Therefore, field trials are increasingly supplemented with controlled-environment physiological screening and adaptability and productivity testing of cool-season food legumes such as peas [20]. To gain clearer insight into changes provoked by the steady
presence of Na+ on pea growth, yield, water regime and chemical composition, an experiment was set up under semi-controlled conditions of a glasshouse and Na+ concentrations applied were similar to those occurring in available irrigation water.
Another effect of excessive salt is that high concentration of salts can impair the uptake of the other nutrients, such as K+, Ca2+ and Pi, and change their cation ratios. There are data on the effect of NaCl on pea growth and some of their physiological features [21-25], but Na+ concentrations in the nutrient solution are reported to be rather high. Therefore, the aim of this study was to assess, under semi-controlled conditions, the effect of the continuous presence of different Na+ concentrations similar to those present in irrigation waters on pea biomass production and yield, water content, stomatal density and conductivity, and concentrations of Na+, K+, Ca2+, and Pi in roots, stems, leaves, pods and grains. Tissue concentration ratios Na+/K+, Na+/Ca2+, K+/Ca2+ and (Na++K+)/Ca2+ were analyzed as well.
2. Experimental ProceduresPea (Pisum sativum L.) seeds (cultivar Skinado, the Netherlands) were imbibed for 2h in deionized water before sowing. Germination was done in sterile quartz sand, in an incubator, in the dark, at 26°C. Six days after germination, seedlings were divided into five planted groups. Plants were grown on ½ strength Hoagland nutrient solution [26] to which was added either 0 (control), 0.1, 0.2, 0.6, or 1.2 g NaCl L-1 (final concentrations of NaCl were 0, 4.16, 8.33, 25.01, and 50.02 mmol NaCl L-1, respectively). Each treatment consisted of 20 pots with seven plants per pot. Plants were grown in a greenhouse until the end of vegetation under a 12-h photoperiod, with day/night temperature of 25±2 / 17±2°C and relative humidity of 80%.
When grown in the field, cultivar Skinado, under our agroecological conditions, has 75 day long vegetation from emergence. The time from sowing to emergence is usually 6-7 day under favorable conditions and 10-25 day under unfavorable conditions. Flowering usually begins 54-60 days after sowing (35-45 days after emergence). The first fruit-bearing shoots occur on the 14th interstice. As this experiment was performed under glasshouse conditions and in water cultures, we expected differences in the length of particular growth phases as compared to the field conditions. As plants very often react to salt stress by shortening the growth stages, thus reducing harmful effects on important phases, we compared differences in the length of growth since the transfer of seedlings to pots until the beginning of flowering and
683 - 10.2478/s11535-010-0052-y
Downloaded from PubFactory at 09/07/2016 05:44:11PMvia free access
I. Maksimović et al.
pod formation between control and NaCl-treated plants. Nutrient solutions were aerated daily and replaced every other day. At the end of vegetation (14 days after the beginning of flowering), the analyses were performed.
For light microscopy observations, 10 replications of leaf epidermal prints were made on fully expanded intact leaves, following the procedure described by [27].
Stomatal diffusive resistance was determined on fully expanded intact leaves using a porometer (Steady State porometer, LI-1600, LI-COR Inc., Lincoln, Nebraska, USA) on adaxial and abaxial leaf epidermis, with 20 replications each. Internodes were counted on 25 plants and pods on each plant. Roots, stems, leaves, pods, and seeds were separated and analyzed. Fresh weight was measured at harvest and dry matter mass was determined after desiccation of plant material at 70°C to constant mass. Water content (WC) in pea tissues was calculated based on the fresh weight, as described by [28]:WC = ((fresh weight - dry weight)/fresh weight) x 100. Concentrations of Na+, K+ and Ca2+ were determined by flame photometry, and Pi concentration was determined spectrophotometrically by the ammonium vanadate-molybdate method [29].
Results were statistically processed to assess the significance of interactions between different NaCl concentrations and analyzed parameters. For each replicated response, the interaction organ x NaCl concentration was fitted by ordinary least square regression, modeling the nonlinear response to NaCl by linear splines using the ‘R’ environment (http://www.R-project.org) for model estimation, predictions of fit, and confidence intervals, and functions of the contributed packages ‘rms’ (http://CRAN.R-project.org/package=rms) and ‘ggplot2’ [30], the latter for graphics. Vertical bars in plots represent 95% confidence intervals.
3. Results
3.1 Effect of NaCl on pea growth and stomatal features
Fifteen days after planting and exposure of plants to solutions with different NaCl concentrations, bottom leaves of all variants started to become yellow. Twenty-seven days after planting, plants exposed to the highest NaCl concentration (1.2 g NaCl L-1) started to flower, and 4 days later (31 days after planting) flowering started in all plants treated with NaCl. In control plants flowering started 33 days after planting, in other words two days later than NaCl treated plants. The first pod appeared on plants grown in the presence of 1.2 g NaCl L-1, seven days after the beginning of flowering. In all other plants grown in the presence of NaCl and in control plants, the first pods appeared four days later (7 and 5 days since the beginning of flowering, respectively). It is obvious that in the presence of NaCl, the vegetation period was shortened and is inversely related to NaCl concentration in the nutrient solution.
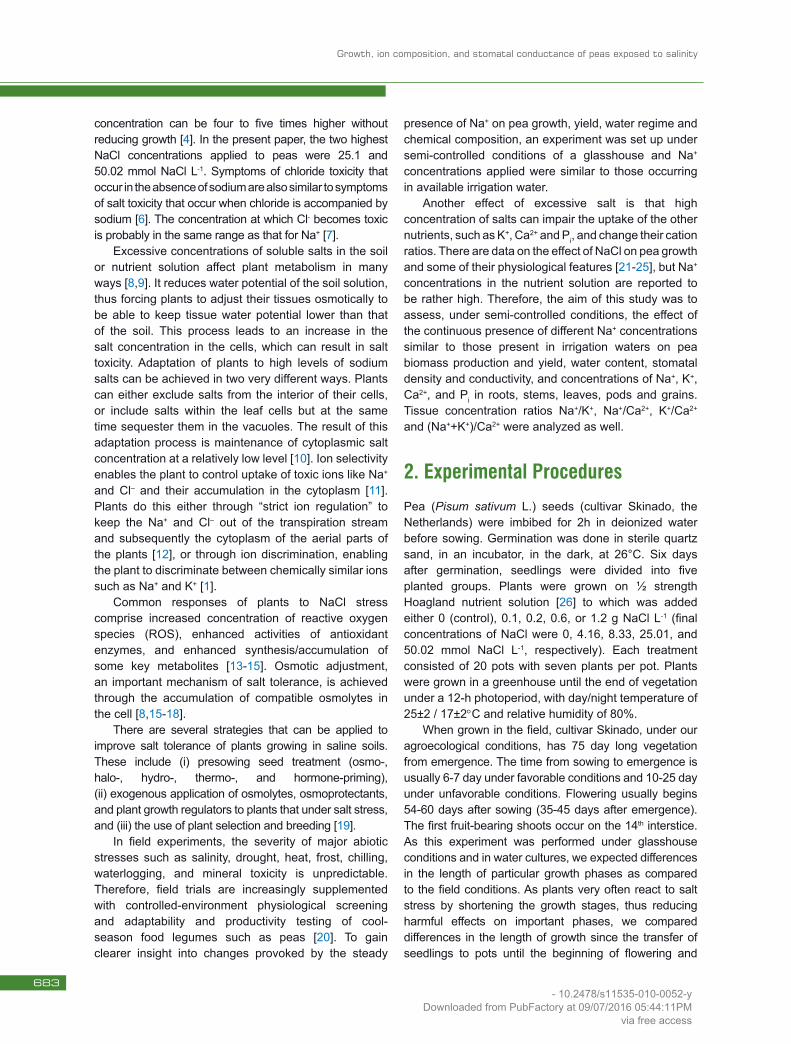
The presence of NaCl during growth reduced the dry weight (DW) of pea plants (Figure 1). This reduction was more severe in the shoots (46%) than in the roots (38%). DW of leaves and shoots were already significantly lower in the presence of 0.1 g NaCl L-1. Of all the above-ground pea parts, DW of grains was reduced the most, as much as 50.8%. NaCl concentration of 0.2 g NaCl L-1 reduced DW of all pea organs for more than 20%, except for roots, where this reduction was 7% and not statistically significant. Shoot/root ratio decreased up to 21% in the presence of NaCl (Figure 1). Regardless of the statistical significance of DW reduction in the presence of NaCl, the same declining trend was observed in all pea parts.
Figure 1. Dry weight (DW) of different pea parts (mg plant-1) and shoot/root DW ratio in the presence of 0, 0.1, 0.2, 0.6, or 1.2 g NaCl L-1 in the nutrient solution.
NaCl (g L−1)
DW
(mg
plan
t−1)
100
200
300
400
500
●
●
●
●
●
●
●
●
●
●
●
●
●
●
●
●
●
●
●
●
●
●
●
●
●
0.0 0.4 0.8 1.2
RootStemLeafPodsGrain
NaCl (g L−1)
Sho
ot D
W (m
g pl
ant−1
)
800
900
1000
1100
1200
1300
1400
1500●
●
●
●
●
0.0 0.4 0.8 1.2NaCl (g L−1)
Pod
DW
(mg
plan
t−1)
100
120
140
160
180
200
220
●
●
●
●
●
0.0 0.4 0.8 1.2NaCl (g L−1)
Sho
ot/R
oot r
atio
14
16
18
●
●
●
●
●
0.0 0.4 0.8 1.2
684 - 10.2478/s11535-010-0052-y
Downloaded from PubFactory at 09/07/2016 05:44:11PMvia free access
Growth, ion composition, and stomatal conductance of peas exposed to salinity
The declining trend of DW in the presence of NaCl is shown for pod, as individual shoot part, in the fourth segment of Figure 1.
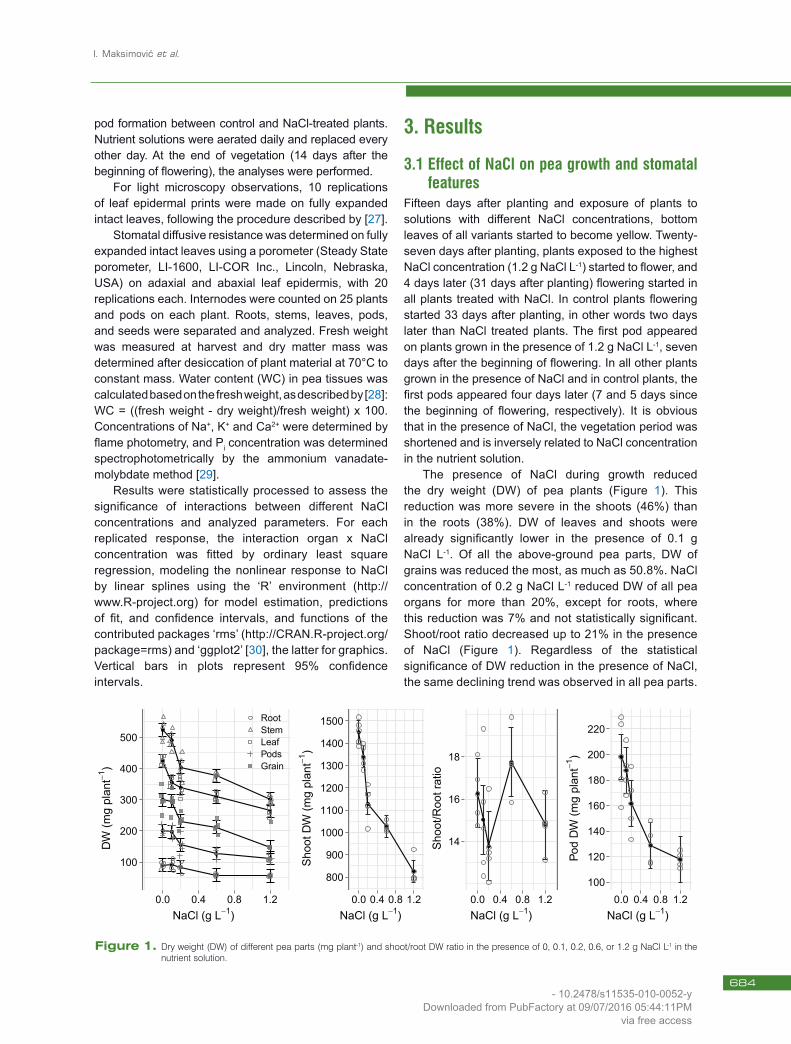
Water content in the roots was not significantly changed in the presence of NaCl (changes were lower than 1%), while in the shoots it significantly declined in the presence of 0.6 and 1.2 g NaCl L-1 (Figure 2).The highest overall change was recorded in leaves, with a reduction of 27% in the presence of 1.2 g NaCl L-1.
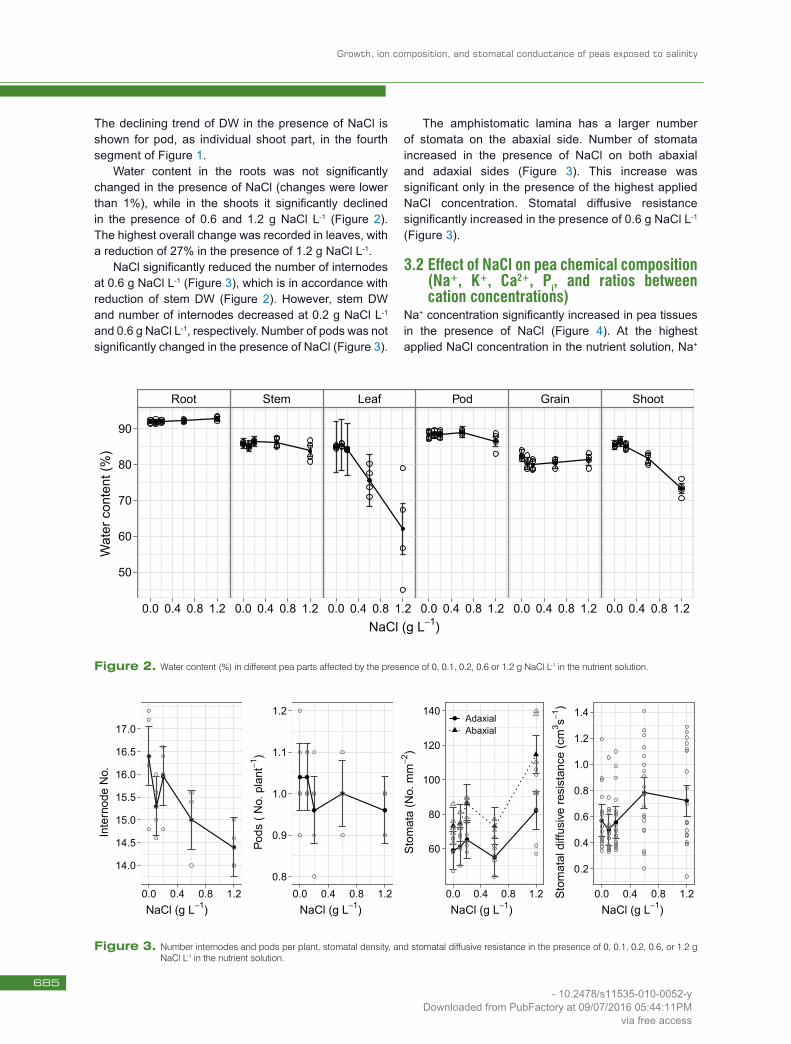
NaCl significantly reduced the number of internodes at 0.6 g NaCl L-1 (Figure 3), which is in accordance with reduction of stem DW (Figure 2). However, stem DW and number of internodes decreased at 0.2 g NaCl L-1 and 0.6 g NaCl L-1, respectively. Number of pods was not significantly changed in the presence of NaCl (Figure 3).
The amphistomatic lamina has a larger number of stomata on the abaxial side. Number of stomata increased in the presence of NaCl on both abaxial and adaxial sides (Figure 3). This increase was significant only in the presence of the highest applied NaCl concentration. Stomatal diffusive resistance significantly increased in the presence of 0.6 g NaCl L-1 (Figure 3).
3.2 Effect of NaCl on pea chemical composition (Na+, K+, Ca2+, Pi, and ratios between cation concentrations)
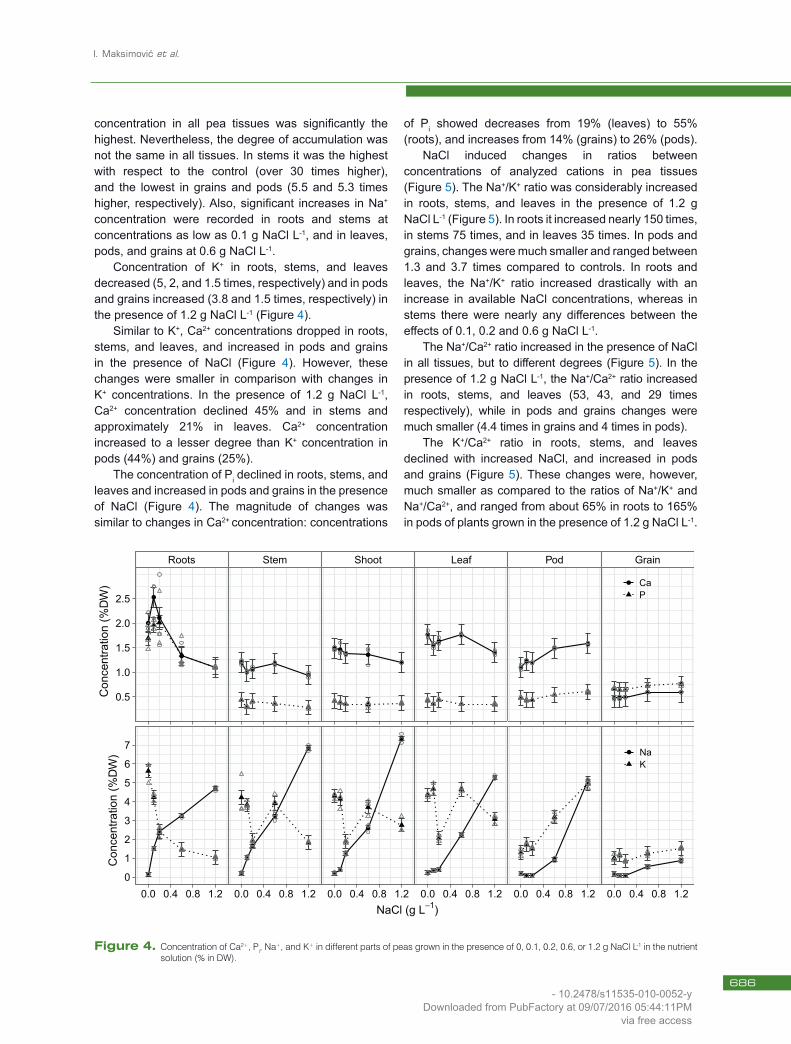
Na+ concentration significantly increased in pea tissues in the presence of NaCl (Figure 4). At the highest applied NaCl concentration in the nutrient solution, Na+
NaCl (g L−1)
Wat
er c
onte
nt (%
)
50
60
70
80
90
Root
● ● ● ● ●
0.0 0.4 0.8 1.2
Stem
●●
● ●
●
0.0 0.4 0.8 1.2
Leaf
● ●●
●
●
0.0 0.4 0.8 1.2
Pod
● ● ● ●
●
0.0 0.4 0.8 1.2
Grain
●
● ● ●●
0.0 0.4 0.8 1.2
Shoot
●●
●
●
●
0.0 0.4 0.8 1.2
Figure 2. Water content (%) in different pea parts affected by the presence of 0, 0.1, 0.2, 0.6 or 1.2 g NaCl L-1 in the nutrient solution.
NaCl (g L−1)
Inte
rnod
e N
o.
14.0
14.5
15.0
15.5
16.0
16.5
17.0
●
●
●
●
●
0.0 0.4 0.8 1.2NaCl (g L−1)
Pods
( N
o. p
lant
−1)
0.8
0.9
1.0
1.1
1.2
● ●
●
●
●
0.0 0.4 0.8 1.2NaCl (g L−1)
Sto
mat
a (N
o. m
m−2
)
60
80
100
120
140
●●
●
●
●
0.0 0.4 0.8 1.2
● AdaxialAbaxial
NaCl (g L−1)
Sto
mat
al d
iffus
ive
resi
stan
ce (c
m3 s−1
)
0.2
0.4
0.6
0.8
1.0
1.2
1.4
●
●●
●●
0.0 0.4 0.8 1.2
Figure 3. Number internodes and pods per plant, stomatal density, and stomatal diffusive resistance in the presence of 0, 0.1, 0.2, 0.6, or 1.2 g NaCl L-1 in the nutrient solution.
685 - 10.2478/s11535-010-0052-y
Downloaded from PubFactory at 09/07/2016 05:44:11PMvia free access
I. Maksimović et al.
concentration in all pea tissues was significantly the highest. Nevertheless, the degree of accumulation was not the same in all tissues. In stems it was the highest with respect to the control (over 30 times higher), and the lowest in grains and pods (5.5 and 5.3 times higher, respectively). Also, significant increases in Na+ concentration were recorded in roots and stems at concentrations as low as 0.1 g NaCl L-1, and in leaves, pods, and grains at 0.6 g NaCl L-1.
Concentration of K+ in roots, stems, and leaves decreased (5, 2, and 1.5 times, respectively) and in pods and grains increased (3.8 and 1.5 times, respectively) in the presence of 1.2 g NaCl L-1 (Figure 4).
Similar to K+, Ca2+ concentrations dropped in roots, stems, and leaves, and increased in pods and grains in the presence of NaCl (Figure 4). However, these changes were smaller in comparison with changes in K+ concentrations. In the presence of 1.2 g NaCl L-1,Ca2+ concentration declined 45% and in stems and approximately 21% in leaves. Ca2+ concentration increased to a lesser degree than K+ concentration in pods (44%) and grains (25%).
The concentration of Pi declined in roots, stems, and leaves and increased in pods and grains in the presence of NaCl (Figure 4). The magnitude of changes was similar to changes in Ca2+ concentration: concentrations
of Pi showed decreases from 19% (leaves) to 55% (roots), and increases from 14% (grains) to 26% (pods).
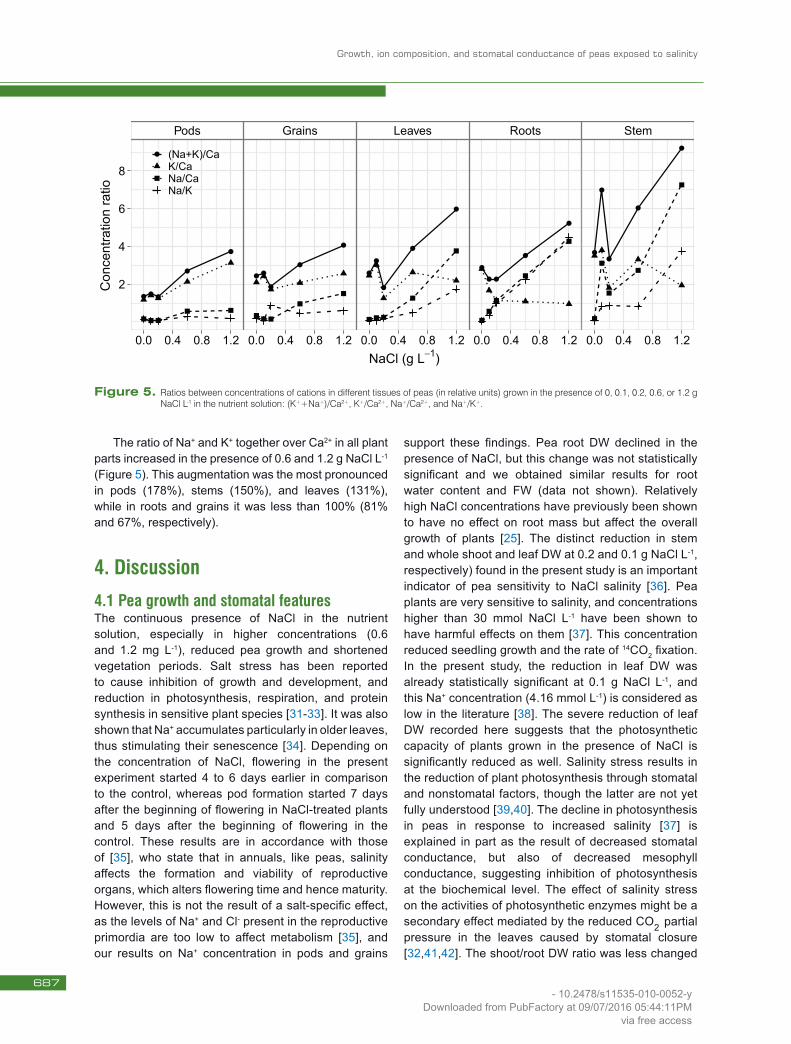
NaCl induced changes in ratios between concentrations of analyzed cations in pea tissues (Figure 5). The Na+/K+ ratio was considerably increased in roots, stems, and leaves in the presence of 1.2 g NaCl L-1 (Figure 5). In roots it increased nearly 150 times, in stems 75 times, and in leaves 35 times. In pods and grains, changes were much smaller and ranged between 1.3 and 3.7 times compared to controls. In roots and leaves, the Na+/K+ ratio increased drastically with an increase in available NaCl concentrations, whereas in stems there were nearly any differences between the effects of 0.1, 0.2 and 0.6 g NaCl L-1.
The Na+/Ca2+ ratio increased in the presence of NaCl in all tissues, but to different degrees (Figure 5). In the presence of 1.2 g NaCl L-1, the Na+/Ca2+ ratio increased in roots, stems, and leaves (53, 43, and 29 times respectively), while in pods and grains changes were much smaller (4.4 times in grains and 4 times in pods).
The K+/Ca2+ ratio in roots, stems, and leaves declined with increased NaCl, and increased in pods and grains (Figure 5). These changes were, however, much smaller as compared to the ratios of Na+/K+ and Na+/Ca2+, and ranged from about 65% in roots to 165% in pods of plants grown in the presence of 1.2 g NaCl L-1.
Con
cent
ratio
n (%
DW
)
0.5
1.0
1.5
2.0
2.5
Roots
●
●
●
●
●
Stem
●
●●●
●
Shoot
●●● ●
●
Leaf
●
●●
●
●
Pod
●●●
●●
Grain
●●●● ●
● CaP
NaCl (g L−1)
Con
cent
ratio
n (%
DW
)
0
1
2
3
4
5
6
7
●
●
●
●
●
0.0 0.4 0.8 1.2
●
●
●
●
●
0.0 0.4 0.8 1.2
●●
●
●
●
0.0 0.4 0.8 1.2
●●●
●
●
0.0 0.4 0.8 1.2
●●●
●
●
0.0 0.4 0.8 1.2
●●●
●●
0.0 0.4 0.8 1.2
● NaK
Figure 4. Concentration of Ca2+, Pi, Na+, and K+ in different parts of peas grown in the presence of 0, 0.1, 0.2, 0.6, or 1.2 g NaCl L-1 in the nutrient solution (% in DW).
686 - 10.2478/s11535-010-0052-y
Downloaded from PubFactory at 09/07/2016 05:44:11PMvia free access
Growth, ion composition, and stomatal conductance of peas exposed to salinity
The ratio of Na+ and K+ together over Ca2+ in all plant parts increased in the presence of 0.6 and 1.2 g NaCl L-1 (Figure 5). This augmentation was the most pronounced in pods (178%), stems (150%), and leaves (131%), while in roots and grains it was less than 100% (81% and 67%, respectively).
4. Discussion4.1 Pea growth and stomatal featuresThe continuous presence of NaCl in the nutrient solution, especially in higher concentrations (0.6 and 1.2 mg L-1), reduced pea growth and shortened vegetation periods. Salt stress has been reported to cause inhibition of growth and development, and reduction in photosynthesis, respiration, and protein synthesis in sensitive plant species [31-33]. It was also shown that Na+ accumulates particularly in older leaves, thus stimulating their senescence [34]. Depending on the concentration of NaCl, flowering in the present experiment started 4 to 6 days earlier in comparison to the control, whereas pod formation started 7 days after the beginning of flowering in NaCl-treated plants and 5 days after the beginning of flowering in the control. These results are in accordance with those of [35], who state that in annuals, like peas, salinity affects the formation and viability of reproductive organs, which alters flowering time and hence maturity. However, this is not the result of a salt-specific effect, as the levels of Na+ and Cl- present in the reproductive primordia are too low to affect metabolism [35], and our results on Na+ concentration in pods and grains
support these findings. Pea root DW declined in the presence of NaCl, but this change was not statistically significant and we obtained similar results for root water content and FW (data not shown). Relatively high NaCl concentrations have previously been shown to have no effect on root mass but affect the overall growth of plants [25]. The distinct reduction in stem and whole shoot and leaf DW at 0.2 and 0.1 g NaCl L-1, respectively) found in the present study is an important indicator of pea sensitivity to NaCl salinity [36]. Pea plants are very sensitive to salinity, and concentrations higher than 30 mmol NaCl L-1 have been shown to have harmful effects on them [37]. This concentration reduced seedling growth and the rate of 14CO2 fixation. In the present study, the reduction in leaf DW was already statistically significant at 0.1 g NaCl L-1, and this Na+ concentration (4.16 mmol L-1) is considered as low in the literature [38]. The severe reduction of leaf DW recorded here suggests that the photosynthetic capacity of plants grown in the presence of NaCl is significantly reduced as well. Salinity stress results in the reduction of plant photosynthesis through stomatal and nonstomatal factors, though the latter are not yet fully understood [39,40]. The decline in photosynthesis in peas in response to increased salinity [37] is explained in part as the result of decreased stomatal conductance, but also of decreased mesophyll conductance, suggesting inhibition of photosynthesis at the biochemical level. The effect of salinity stress on the activities of photosynthetic enzymes might be a secondary effect mediated by the reduced CO2 partial pressure in the leaves caused by stomatal closure [32,41,42]. The shoot/root DW ratio was less changed
NaCl (g L−1)
Con
cent
ratio
n ra
tio
2
4
6
8
Pods
● ● ●
●
●
0.0 0.4 0.8 1.2
Grains
● ●
●
●
●
0.0 0.4 0.8 1.2
Leaves
●
●
●
●
●
0.0 0.4 0.8 1.2
Roots
●
●●
●
●
0.0 0.4 0.8 1.2
Stem
●
●
●
●
●
0.0 0.4 0.8 1.2
● (Na+K)/CaK/CaNa/CaNa/K
Figure 5. Ratios between concentrations of cations in different tissues of peas (in relative units) grown in the presence of 0, 0.1, 0.2, 0.6, or 1.2 g NaCl L-1 in the nutrient solution: (K++Na+)/Ca2+, K+/Ca2+, Na+/Ca2+, and Na+/K+.
687 - 10.2478/s11535-010-0052-y
Downloaded from PubFactory at 09/07/2016 05:44:11PMvia free access
I. Maksimović et al.
in the presence of NaCl as compared to changes in root and shoot DW analyzed separately. This suggests that applied NaCl concentrations reduced pea growth quite proportionally under the present experimental conditions.
In general, the presence of NaCl had a greater impact on plant growth than on development. Number of pods was not significantly different between treatments, but the number of internodes was significantly lower at all applied NaCl concentrations. However, although statistically significant, the reduction of the number of internodes in the presence of the highest NaCl concentration (1.2 g NaCl L-1) was no greater than 12%, whereas reduction of plant DW ranged between 41% and 51%, with a 42% reduction in stem DW.
Density of stomata was significantly higher in the presence of 1.2 g NaCl L-1, suggesting that expansion (growth) of epidermal cells, including guard cells, was impaired on both abaxial and adaxial sides of the leaves. Apart from inadequate photosynthesis owing to stomatal closure and consequently limited carbon dioxide uptake under salt stress, NaCl may also inhibit cell division and expansion directly [43]. The number of epidermal cells remains more or less constant, with their size being smaller, resulting in a smaller total leaf area and higher stomatal density. According to [34], salinity reduces the ability of plant to take up water, and induces metabolic changes identical to those caused by water stress. Some of the anatomical characteristics representing adaptations to water deficit and salinity include a greater number of stomata per unit area, smaller dimensions of stomata, smaller epidermal cells, thicker cuticle, and a greater number of layers of smaller mesophyll cells [34,44]. Stomatal diffusive resistance, which is an indicator of current stomatal conductivity for gases, significantly increased in plants grown in the presence of 0.6 and 1.2 g NaCl L-1 [45] found that in maize, an increase in stomatal diffusive resistance and reduction of transpiration intensity may be explained by the closure of stomata by increasing the level of ABA in guard cells in the presence of high NaCl concentrations. The hormonal control of stomatal movement was also demonstrated by [37], who showed that pretreatment of pea seedlings with methyl jasmonate alleviated the inhibitory effect of NaCl. Reduction in stomatal conductivity indicates that pea capacity for transpiration, and hence water uptake, is significantly reduced under our experimental conditions, which may explain reduced growth. The fact that the number of stomata per unit leaf area increased did not have the final positive effect on water uptake in this experiment, since stomatal diffusive resistance
increased as well and total leaf biomass decreased in the presence of NaCl.
4.2 Accumulation and distribution of K+, Ca2+, Pi and Na+
Interactions between cations with respect to uptake and accumulation rates in different plant parts are very complex [46]. In addition, more than 50 plant enzymes require K+ as a cofactor, and these are particularly susceptible to high Na+ and high Na+/K+ ratios [8]. Excessive Na+ inhibits the uptake of K+ and Ca2+ in many plant species, such as wheat, cotton and tomato [38,47-50]. The reduction in K+ concentration observed in pea roots with an increase in NaCl concentration in the nutrient solution can be explained by the antagonism between K+ and Na+ during the uptake process [38,47]. Also, NaCl negatively affected K+ accumulation in stems and leaves, but an increase in K+ concentration in pods and grains suggests that one of mechanisms peas use to reduce the negative effect of excess Na+ is accumulation of K+ in reproductive organs. Although Na+ and K+ are chemically similar elements, they have very different roles in plant metabolism. One of the main roles of K+ is in generating turgor, which can be partially fulfilled by Na+, but the estimated extent to which Na+ can replace K+ is very variable in different species [51,52]. There is evidence that shoot Na+ concentrations (altered by spraying Na+ onto leaves) can affect the transport of K+ to the shoots, or at least leaf K+ concentrations [53]. It was shown [54] that cells of higher plants are able to discriminate against Na+. Experiments with pea and oat seedlings revealed that Na+ is actively transported outwards, probably at the plasma membrane. However, this remains to be analyzed for adult plant tissues. Na+ concentrations in pea stems found in this experiment are higher than the usual Na+ concentrations in pea tissues, which, after [55], vary between 0.01 and 0.04%.
As usual concentrations of K+ and Ca2+ in pea stems are, after [55], 2.3–2.5% and 1.7%, respectively, our results point out that K+ concentrations were reduced below the expected range only in the presence of high NaCl concentrations, whereas Ca2+ concentrations were below the expected range in all NaCl treatments.
In the presence of NaCl, Pi concentrations in roots, stems, and leaves significantly declined, and in pods and stems were augmented. Nevertheless, measured concentrations were in the range or even slightly higher than average Pi concentrations reported by [55].
Altogether, concentrations of K+, Ca2+ and Pi in pea dry matter are higher than average concentrations in leaves [55]. This can be explained by the differences in
688 - 10.2478/s11535-010-0052-y
Downloaded from PubFactory at 09/07/2016 05:44:11PMvia free access
Growth, ion composition, and stomatal conductance of peas exposed to salinity
growth conditions between water cultures and the field, as values that are available in the literature refer to the field-grown pea.
A high Na+/K+ ratio found in roots, stems, and leaves indicates metabolic disorders such as the reduction of protein synthesis and enzyme activities [56], as well as an increase in membrane permeability [57]. After [58], elevated K+ levels in the presence of NaCl, as was found in pods and grains, act osmotically, preventing Na+ influx into those tissues.
The results on pea growth, yield, water relations, and concentration of K+, Ca2+, Pi, Na+, and their ratios are the consequences of the continuous presence of NaCl in concentrations that are, after FAO (http://www.fao.org/docrep/003/T0234E/T0234E01.htm#ch1.2.1), often present in irrigation waters. According to FAO (http://www.fao.org/docrep/003/T0234E/T0234E01.htm#ch1.2.1), the usual range of Na+ concentration in irrigation waters varies between 0 and 40 mmol L-1, and concentrations tested in this experiment were 0, 4.16, 8.33, 25.01, and 50.02 mmol L-1. Nevertheless, the effect of irrigation waters and continuously present Na+ of the same concentrations cannot be exactly the same because under irrigated field conditions concentration of available Na+ varies through time. An additional factor relevant to the field pea is the response of the symbiotic nitrogen-fixing bacteria, Rhizobium leguminosarum, to salinity stress as well as interaction between peas and nitrogen-fixing bacteria under salinity stress [20].
In conclusion, for the experimental conditions chosen in this work, it was shown that the continuous presence of NaCl in concentrations frequently met in irrigation waters (i) shortened vegetation, especially the period prior to flowering, in proportions inverse to those of available NaCl, (ii) reduced pea growth as expressed as biomass production (particularly of shoots), number of internodes, and increased stomatal density, suggesting that leaf epidermal cell size was reduced as well, (iii) impaired the water regime by increasing stomatal diffusive resistance, (iv) Na+ accumulated the most in stems and leaves and the least in pods and grains, and (v) K+, Ca2+, and Pi concentrations and their ratios were altered, with the changes being much higher in vegetative than in reproductive plant parts. Such conditions of relatively mild salinity, which are likely to occur in agroecosystems, may have a significant impact not only on pea physiology and yield but on soil features as well.
AcknowledgementsThis work was supported by the Ministry of Science and Technological Development of the Republic of Serbia, Project No. TR20088 (2008-2011). The authors are grateful to Dr. Filippo Piro for help with statistical analyses.
References
[1] Gorham J.J., Bridges J., Dubcovsky J., Dvorak J., Hollington P.A., Luo M.C., et al., Genetic analysis and physiology of a trait for enhanced K/Na discrimination in wheat, New Phytol., 1997, 137, 109-116
[2] USSL (US Salinity Laboratory), Diagnosis and improvement of saline and alkali soils, US Salinity Laboratory, USDA Handbook No. 60, Madison, Wisconsin, 1954
[3] Maksimović I., Belić S., Putnik-Delić M., Gani I., The effect of sodium concentration in the irrigation water on pea yield and composition, In: Kastori R., (Ed.), Proceedings of the XII International ECO-conference, (24-27 September 2008, Novi Sad, Serbia), Ecological Movement of the City of Novi Sad, 2008, 231-235
[4] Marschner H., Mineral nutrition of higher plants, 2nd Ed., Academic Press, London, 1995
[5] Heckman J.R., Chlorine, In: Barker A.V., Pilbeam D.J., (Eds.), Handbook of plant nutrition, Taylor and Francis Group, CRC Press, 2007
[6] Parker M.B., Gaines T.P., Gascho G.J., Chloride effects on corn, Commun. Soil Sci. Plant Anal., 1985, 16, 1319-1333
[7] Greenway H., Osmond C.B. Salt responses of enzymes from species differing in salt tolerance, Plant Physiol., 1972, 49, 256-259
[8] Munns R., Tester M., Mechanisms of salinity tolerance, Annu. Rev. Plant Biol., 2008, 59, 651-681
[9] Noreen Z., Ashraf M., Assessment of variation in antioxidative defense system in salt-treated pea (Pisum sativum) cultivars and its putative use as salinity tolerance markers, J. Plant Physiol., 2009, 166, 1764-1774
[10] O’Leary J.W., Adaptive components of salt tolerance, In: Pessarakli M., (Ed.), Handbook of plant and crop physiology, Marcel Dekker Inc., New York, Basel, 2002
[11] Shannon M.C., Grieve, C.M., Tolerance of vegetable crops to salinity, Sci. Hortic., 1999, 78, 5-38
689 - 10.2478/s11535-010-0052-y
Downloaded from PubFactory at 09/07/2016 05:44:11PMvia free access
I. Maksimović et al.
[12] Harvey D.M.R., The effects of salinity on ion concentrations within the root cells of Zea mays L., Planta, 1985, 165, 242-248
[13] Tester M., Davenport R., Na+ tolerance and Na+
transport in higher plants, Ann. Bot., 2003, 91, 503-550
[14] Genc Y., McDonald K.G., Tester M., Reassessment of tissue Na+ concentration as a criterion for salinity tolerance in bread wheat, Plant Cell Environ., 2007, 30, 1486-1498
[15] Noreen Z., Ashraf M., Changes in antioxidant enzymes and some key metabolites in some genetically diverse cultivars of radish (Raphanus sativus L.), Environ. Experim. Bot., 2009, 67, 395-402
[16] Hasegawa P.M., Bressan R.A., Zhu J.K., Bohnert H.J., Plant cellular and molecular responses to high salinity, Annu. Rev. Plant Phys., 2000, 51, 463-499
[17] Ashraf M., Some important physiological selection criteria fort salt tolerance in plants, Flora, 2004, 199, 361-376
[18] Flowers T.J., Improving crop salt tolerance, J. Exp. Bot., 2004, 55, 307-319
[19] Ashraf M., Athar H.R., Harris P.J.C., Kwon T.R., Some prospective strategies for improving crop salt tolerance, Adv. Agron., 2008, 97, 45-110
[20] Stoddard F., Balko C., Erskine W., Khan H., Link W., Sarker A. Screening techniques and sources of resistance to abiotic stresses in cool-season food legumes, Euphytica, 2006, 147, 167-186
[21] Hernandez J.A., Almansa M.S., Short-term effects of salt stress on antioxidant systems and leaf water relations of pea leaves, Physiol. Plant., 2002, 115, 251-257
[22] Kav N.N.V., Srivastava S., Goonewardene L., Blade S.F., Proteome-level changes in the roots of Pisum sativum in response to salinity, Ann. Appl. Biol., 2004, 145, 217-230
[23] Ahmad P., Jhon R., Effect of salt stress on growth and biochemical parameters of Pisum sativum L., Arch. Agron Soil Sci., 2005, 51, 665-672
[24] Najafi F., Khavari-Nejad R.A., Rastgar-jazii F., Sticklen M., Physiological changes in pea (Pisum sativum L. cv. Green Arrow) under NaCl salinity, Pakistan J. Biol. Sci., 2006, 9, 974-978
[25] Najafi F., Khavari-Nejad R.A., Rastgar-jazii F., Sticklen M., Growth and some physiological attributes of pea (Pisum sativum L.) as affected by salinity, Pakistan J. Biol. Sci., 2007, 10, 2752-2755
[26] Hoagland D.R., Arnon D.I., The water-culture method for growing plants without soil, Circ. 347, Univ. Calif. Coll. Agric. Exp. Sta. Berkeley, CA, 1950, 1-32
[27] Wolf L., Mikroskopická tehnika (Microscopic technique), Státni zdravotnické nakladatelstvi (National Health Publishing), Prague, 1954, (in Czech)
[28] Turner N.C., Techniques and experimental approaches for the measurement of plant water status, Plant Soil, 1981, 58, 339-366
[29] Ministry of Agriculture, Fisheries and Food (MAFF)/Agricultural Development and Advisory Service (ADAS), The Analysis of Agricultural Materials, 3rd Ed., HMSO, London, 1986
[30] Wickham H., ggplot2: elegant graphics for data analysis, Springer New York, 2009
[31] Boyer J.S., Plant productivity and environment potential for increasing crop plant productivity, genotypic selection, Science, 1982, 218, 443-448
[32] Meloni D.A., Oliva M.A., Martinez C.A., Cambraia J., Photosynthesis and activity of superoxide dismutase, peroxidase and glutathione reductase in cotton under salt stress, Environ. Exp. Bot., 2003, 49, 69-76
[33] Pal M., Singh D.K., Rao L.S., Singh K.P., Photosynthetic characteristics and activity of antioxidant enzymes in salinity tolerant and sensitive rice cultivars, Indian J. Plant Physiol., 2004, 9, 407-412
[34] Munns R., Comparative physiology of salt and water stress, Plant Cell Environ., 2002, 25, 239-250
[35] Munns R., Rawson H.M., Effect of salinity on salt accumulation and reproductive development in the apical meristem of wheat and barley, Aust. J. Plant Physiol., 1999, 26, 459-464
[36] Keutgen A.J., Pawelzik E., Impacts of NaCl stress on plant growth and mineral nutrient assimilation in two cultivars of strawberry, Environ. Exp. Bot., 2009, 65, 170-176
[37] Velitchkova M., Fedina I., Response of photosynthesis of Pisum sativum to salt stress as affected by methyl jasmonate, Photosynthetica, 1998, 35, 89-97
[38] Box S., Schachtman D.P., The effect of low concentrations of sodium on potassium uptake and growth of wheat, Aust. J. Plant Physiol., 2000, 27, 175-182
[39] Dionisio-Sese M.L., Tobita S., Effects of salinity on sodium content and photosynthetic responses of rice seedlings differing in salt tolerance, J. Plant Physiol., 2000, 157, 54-58
[40] Sharma P.K., Hall D.O., Interaction of salt stress and photoinhibition on photosynthesis in barley and sorghum, J. Plant Physiol., 1991, 138, 614-619
690 - 10.2478/s11535-010-0052-y
Downloaded from PubFactory at 09/07/2016 05:44:11PMvia free access
Growth, ion composition, and stomatal conductance of peas exposed to salinity
[41] Lawlor D.W., Cornic G., Photosynthetic carbon assimilation and associated metabolism in relation to water deficits in higher plants, Plant Cell Environ., 2002, 25, 275-294
[42] DeRidder B.P., Salvucci M., Modulation of Rubisco activase gene expression during heat stress in cotton (Gossyoium hirsutum L.) involves post-transcriptional mechanisms, Plant Sci., 2007, 172, 246-252
[43] Zhu J.K., Plant salt tolerance, Trends Plant Sci., 2001, 6, 66-71
[44] Luković J., Maksimović I., Zorić L., Nagl N., Perčić M., Polić D., et al., Histological characteristics of sugar beet leaves potentially linked to drought tolerance, Ind. Crops Prod., 2009, 30, 281-286
[45] Jai W., Wang Y., Zhang S., Zhang J., Salt-stress-induced ABA accumulation is more sensitively triggered in roots than in shoots, J. Exp. Bot., 2002, 53, 2201-2206
[46] Gorham J., Sodium, In: Barker A.V., Pilbeam D.J., (Eds.), Handbook of plant nutrition, CRC Press, Taylor and Francis Group, 2007, 569-583
[47] Al Karaki G.N., Growth, sodium, and potassium uptake and translocation in salt-stressed tomato, J. Plant Nutr., 2000, 23, 369-379
[48] Cramer G.R., Sodium-calcium interactions under salinity stress, In: Läuchli A., Lüttge U., (Eds.), Salinity: Environment-Plants-Molecules, Dordrecht, Berlin, London, Kluwer Academic Publishers, 2002, 205-227
[49] Davenport R.J., Reid R.J., Smith F.A., Sodium–calcium interactions in two wheat species differing in salinity tolerance, Physiol. Plant., 1997, 99, 323-327
[50] Rengel Z., The role of calcium in salt toxicity, Plant Cell Environ., 1992, 15, 625-632
[51] Subbarao G.V., Wheeler R.M., Stutte G.W., Levine L.H., How far can sodium substitute for potassium in red beet, J. Plant Nutr., 1999, 22, 1745-1761
[52] Subbarao G.V., Wheeler R.M., Stutte G.W., Levine L.H., Low potassium enhances sodium uptake in red beet under moderate saline conditions, J. Plant Nutr., 2000, 23, 1449-1470
[53] Song J., Fujiyama H., Importance of Na content and water status for growth in Na-salinized rice and tomato plants, Soil Sci. Plant Nutr., 1998, 44, 197-208
[54] Higinbotham N., Etherton B., Foster R.J., Mineral ion contents and cell trans-membrane electropotentials of pea and oat seedling tissue, Plant Physiol., 1967, 42, 37-46
[55] Poulain D., Simon J.C., Teneur en azote et composition minérale des protéagineux: pois, féveroles et lupins (Nitrogen and mineral composition of the protein: peas, beans and lupins), In: Plancquaert Ph., (Ed.), Recueil des Communications - Journée ATOUT POIS, Institut Technique des Céréales et des Fourrages (ITCF), Paris, France, 1989, (in French)
[56] Brady C.J., Gibson T.S., Barlow E.W.R., Spiers J., Wyn Jones R.G., Salt tolerance in plants. I. Ions, compatible solutes and the stability of plant ribosomes, Plant Cell Environ., 1984, 7, 571-578
[57] Alam S.M., Nutrient uptake by plants under stress conditions. In: Pessarakli M., (Ed.), Handbook of plant and crop stress, 2nd Ed., Marcel Dekker Inc., New York, Basel, 1999, 285-313
[58] Jacoby B., Mechanism involved in salt tolerance of plants, In: Pessarakli M., (Ed.), Handbook of plant and crop stress, 2nd Ed., Marcel Dekker Inc., New York, Basel, 1999, 97-123
691 - 10.2478/s11535-010-0052-y
Downloaded from PubFactory at 09/07/2016 05:44:11PMvia free access
Related Documents