© New Phytologist (2001) 149 : 247–264 www.newphytologist.com 247 Research Blackwell Science Ltd Stomatal conductance of forest species after long-term exposure to elevated CO 2 concentration: a synthesis B. E. Medlyn 1,* , C. V. M. Barton 1 , M. S. J. Broadmeadow 2 , R. Ceulemans 3 , P. De Angelis 4 , M. Forstreuter 5 , M. Freeman 6 , S. B. Jackson 2 , S. Kellomäki 7 , E. Laitat 8 , A. Rey 1 , P. Roberntz 9 , B. D. Sigurdsson 9,10 , J. Strassemeyer 5 , K. Wang 7 , P. S. Curtis 11 and P. G. Jarvis 1 1 IERM, University of Edinburgh, King’s Buildings, Edinburgh, UK; 2 Forestry Commission, Alice Holt Lodge, Farnham, Surrey, UK; 3 Department of Biology, University of Antwerpen, Wilrijk, Belgium; 4 DISAFRI, University of Tuscia, Viterbo, Italy; 5 Institut für Ökologie, Technische Universität Berlin, Germany; 6 Department of Economics and Natural Resources, Royal Veterinary and Agricultural University, Denmark; 7 Faculty of Forestry, University of Joensuu, Finland; 8 Department de Biologie Vegétalé, Faculte des Sciences Agronomiques de Gembloux, Belgium; 9 Department for Production Ecology, Swedish University of Agricultural Sciences, Uppsala, Sweden; 10 Agricultural Research Institute, Keldnaholt, Reykjavik, Iceland; 11 Department of Evolution, Ecology, and Organismal Biology, Ohio State University, Columbus, OH, USA; *present address: School of Biological Science, University of New South Wales, UNSW Sydney 2052, Australia Summary • Data from 13 long-term (> 1 yr), field-based studies of the effects of elevated CO 2 concentration ([CO 2 ]) on European forest tree species were analysed using meta-analysis and modelling. Meta-analysis was used to determine mean responses across the data sets, and data were fitted to two commonly used models of stomatal conductance in order to explore response to environmental conditions and the relationship with assimilation. • Meta-analysis indicated a significant decrease (21%) in stomatal conductance in response to growth in elevated [CO 2 ] across all studies. The response to [CO 2 ] was significantly stronger in young trees than old trees, in deciduous compared to coniferous trees, and in water stressed compared to nutrient stressed trees. No evidence of acclimation of stomatal conductance to elevated [CO 2 ] was found. • Fits of data to the first model showed that growth in elevated [CO 2 ] did not alter the response of stomatal conductance to vapour pressure deficit, soil water content or atmospheric [CO 2 ]. Fits of data to the second model indicated that conductance and assimilation responded in parallel to elevated [CO 2 ] except when water was limiting. • Data were compared to a previous meta-analysis and it was found that the response of g s to elevated [CO 2 ] was much more consistent in long-term (> 1 yr) studies, emphasising the need for long-term elevated [CO 2 ] studies. By interpreting data in terms of models, the synthesis will aid future modelling studies of responses of forest trees to elevated [CO 2 ]. Key words : stomatal conductance , elevated [CO 2 ] , meta-analysis , model parameters , forests , acclimation . © New Phytologist (2001) 149 : 247–264 Author for correspondence: Belinda Medlyn Tel: +61 29385 2213 Fax: +61 29385 1558 Email: [email protected] Received: 4 May 2000 Accepted: 25 September 2000 Introduction It is well documented that stomatal conductance ( g s ) declines when exposed to a transient increase in atmospheric CO 2 concentration; a doubling of [CO 2 ] from the present ambi- ent concentration generally results in a reduction in g s of the order of 40% (Morison, 1987). If this reduction in g s should also occur in response to the current gradual increase in atmo- spheric [CO 2 ], there could be important implications for forest carbon and water balance (Field et al. , 1995). Using models based on the transient response of g s to increasing [CO 2 ], it is generally predicted that forest canopy evapotranspiration is likely to be reduced, with a resulting increase in soil moisture, and possible consequences for a wide range of ecological processes

Welcome message from author
This document is posted to help you gain knowledge. Please leave a comment to let me know what you think about it! Share it to your friends and learn new things together.
Transcript

©
New Phytologist
(2001)
149
: 247–264
www.newphytologist.com
247
Research
Blackwell Science Ltd
Stomatal conductance of forest species after long-term
exposure to elevated CO
2
concentration: a synthesis
B. E. Medlyn
1,*
, C. V. M. Barton
1
, M. S. J. Broadmeadow
2
, R. Ceulemans
3
, P. De Angelis
4
, M. Forstreuter
5
, M. Freeman
6
, S. B. Jackson
2
, S. Kellomäki
7
, E. Laitat
8
, A. Rey
1
, P. Roberntz
9
, B. D. Sigurdsson
9,10
, J. Strassemeyer
5
, K. Wang
7
, P. S. Curtis
11
and P. G. Jarvis
1
1
IERM, University of Edinburgh, King’s Buildings, Edinburgh, UK;
2
Forestry Commission, Alice Holt Lodge, Farnham, Surrey, UK;
3
Department of Biology,
University of Antwerpen, Wilrijk, Belgium;
4
DISAFRI, University of Tuscia, Viterbo, Italy;
5
Institut für Ökologie, Technische Universität Berlin, Germany;
6
Department of Economics and Natural Resources, Royal Veterinary and Agricultural University, Denmark;
7
Faculty of Forestry, University of Joensuu, Finland;
8
Department de Biologie Vegétalé, Faculte des Sciences Agronomiques de Gembloux, Belgium;
9
Department for Production Ecology, Swedish University of
Agricultural Sciences, Uppsala, Sweden;
10
Agricultural Research Institute, Keldnaholt, Reykjavik, Iceland;
11
Department of Evolution, Ecology, and Organismal Biology,
Ohio State University, Columbus, OH, USA; *present address: School of Biological Science, University of New South Wales, UNSW Sydney 2052, Australia
Summary
• Data from 13 long-term (> 1 yr), field-based studies of the effects of elevatedCO
2
concentration ([CO
2
]) on European forest tree species were analysed usingmeta-analysis and modelling. Meta-analysis was used to determine meanresponses across the data sets, and data were fitted to two commonly used modelsof stomatal conductance in order to explore response to environmental conditionsand the relationship with assimilation.• Meta-analysis indicated a significant decrease (21%) in stomatal conductancein response to growth in elevated [CO
2
] across all studies. The response to [CO
2
]was significantly stronger in young trees than old trees, in deciduous compared toconiferous trees, and in water stressed compared to nutrient stressed trees. Noevidence of acclimation of stomatal conductance to elevated [CO
2
] was found.• Fits of data to the first model showed that growth in elevated [CO
2
] did not alterthe response of stomatal conductance to vapour pressure deficit, soil water contentor atmospheric [CO
2
]. Fits of data to the second model indicated that conductance andassimilation responded in parallel to elevated [CO
2
] except when water was limiting.• Data were compared to a previous meta-analysis and it was found that theresponse of
g
s
to elevated [CO
2
] was much more consistent in long-term (> 1 yr)studies, emphasising the need for long-term elevated [CO
2
] studies. By interpretingdata in terms of models, the synthesis will aid future modelling studies of responsesof forest trees to elevated [CO
2
].
Key words
:
stomatal conductance
,
elevated [CO
2
]
,
meta-analysis
,
model parameters
,
forests
,
acclimation
.
©
New Phytologist
(2001)
149
: 247–264
Author for correspondence:
Belinda Medlyn Tel: +61 29385 2213 Fax: +61 29385 1558 Email: [email protected]
Received:
4 May 2000
Accepted:
25 September 2000
Introduction
It is well documented that stomatal conductance (
g
s
) declineswhen exposed to a transient increase in atmospheric CO
2
concentration; a doubling of [CO
2
] from the present ambi-ent concentration generally results in a reduction in
g
s
of theorder of 40% (Morison, 1987). If this reduction in
g
s
should
also occur in response to the current gradual increase in atmo-spheric [CO
2
], there could be important implications for forestcarbon and water balance (Field
et al.
, 1995). Using modelsbased on the transient response of
g
s
to increasing [CO
2
], it isgenerally predicted that forest canopy evapotranspiration islikely to be reduced, with a resulting increase in soil moisture,and possible consequences for a wide range of ecological processes
NPH028.fm Page 247 Tuesday, December 19, 2000 7:07 PM

www.newphytologist.com
©
New Phytologist
(2001)
149
: 247–264
Research248
including run-off, production, soil mineralization, and regionalclimate change (Field
et al.
, 1995, Sellers
et al.
, 1996, Thornley& Cannell, 1996, Kellomäki & Vaisanen, 1997).
However, recent results have called into question whetherlonger-term exposure to elevated [CO
2
] results in a similarreduction in stomatal conductance, particularly in woodyspecies (Saxe
et al.
, 1998, Mooney
et al.
, 1999). For example,in a meta-analysis of 48 studies with woody plants, Curtis andWang (1998) report a modest and nonsignificant reductionof just 11% in response to growth in elevated [CO
2
]. Manyof the studies incorporated in Curtis and Wang’s reviewwere, however, relatively short-term (< 1 yr), pot-based studies.Mature, field-grown trees are subject to extremely differentenvironmental conditions and constraints, and therefore maynot respond in the same way as pot-grown seedlings (Norby
et al.
, 1999). Thus, the first aim of this paper is to apply themeta-analysis approach of Curtis & Wang (1998) to examinehow stomatal conductance changes in field-grown trees afterseveral years’ exposure to elevated [CO
2
].The second aim is to interpret the stomatal conductance data
in terms of the models commonly used to extrapolate from leaf
g
s
responses to stand scale. To predict effects of elevated [CO
2
]on stand carbon and water balance it is not enough to knowthe average effect of elevated [CO
2
] on stomatal conductance;we also need to know how to incorporate that effect in models.Currently, there are two main models used to describestomatal conductance. The first, proposed by Jarvis (1976),is based on empirical stomatal responses to environmental condi-tions including incident radiation, vapour pressure deficit(VPD), temperature, soil water potential, and atmospheric[CO
2
]. These empirical responses may be altered in plants grownin elevated [CO
2
]. For example, growth in elevated [CO
2
]has been observed to cause reduced sensitivity of
g
s
to VPD(Heath, 1998), reduced sensitivity to drought (Heath &Kerstiens, 1997), and reduced sensitivity to atmospheric [CO
2
](Santrucek & Sage, 1996). Here, we investigate how the sensiti-vity of
g
s
to environmental conditions changed under elevated[CO
2
] by fitting the Jarvis (1976) model to a range of data sets.The second commonly used model of stomatal conduct-
ance (Ball
et al.
, 1987) is based on the observed correlationbetween stomatal conductance and assimilation (Wong
et al.
,1978). Assimilation rates are often observed to acclimate togrowth in high [CO
2
] (Medlyn
et al.
, 1999) and many modelsassume implicitly that stomatal conductance acclimates inparallel, based on the Ball
et al
. (1987) function (Sellers
et al.
,1996). The question of whether assimilation and
g
s
acclimateto elevated [CO
2
] in parallel or independently is only justbeginning to be tackled (Morison, 1998). In order to addressthis question, Drake
et al
. (1997) examined the Ci : Ca ratio(intercellular : atmospheric [CO
2
] ) and reported that therewas no change in this ratio overall, suggesting that
g
s
andassimilation do acclimate in tandem. However, as noted bySantrucek & Sage (1996), this ratio is not a very sensitiveindicator. In this paper, we address this problem by fitting the
Ball
et al
. (1987) model to a range of experimental data sets,and observing whether the parameters of this model changein response to elevated [CO
2
].
Materials and Methods
Measurements
The experimental data were obtained from experimentscarried out under the auspices of two major European col-laborative programmes: ECOCRAFT (Jarvis, 1998) and theNordic Research Project ‘The Likely Impact of Rising CO
2
and Temperature on Nordic Forests at Limiting and OptimalNutrient Supply’ (Roberntz
et al
., Sigurdsson
et al
., unpublished).Brief details of the experiments involved are given in Table 1.More information on the design of each experiment may befound in Pontailler
et al
. (1998) or in the individual referencesgiven in Table 2. The experiments differed in a number of ways.They used 15 different European forest tree species, includingthe most important commercial forestry species. Four maintypes of CO
2
exposure facilities were employed: branch bags(BB), open-top chambers (OTC), whole-tree chambers (WTC)and mini-ecosystems (ME). Some experiments also included nutrient,drought, temperature, or ozone factorial treatments. However,there were two factors common to all experiments: they wereall done on freely rooted plants, and all continued for at leasttwo growing seasons. In what follows, individual experimentswill be referred to by the experiment names given in Table 1.
Brief details of the measurements of stomatal conductanceare given in Table 2. Most measurements were made using gasexchange equipment, although porometers were also used inthe English Mixed OTC experiment. Only data where stomatawere given enough time to equilibrate with measurement con-ditions were included. Data from high-ozone treatments werealso excluded from the analysis.
Statistical analysis
Meta-analysis was used to estimate the mean ratio of stomatalconductance of plants grown in elevated (700
µ
mol mol
–1
) tothat of plants grown in ambient (350
µ
mol mol
–1
) [CO
2
] (theE/A ratio). The meta-analysis techniques used are thosedescribed by Curtis & Wang (1998) and implemented in thestatistical software MetaWin (Rosenberg
et al.
, 1997). Themean, standard deviation, and number of observations foreach parameter value were required. The standard deviationwas taken to be the between-chamber standard deviation, andthe number of observations was taken as the number of chamberreplicates. The standard deviation is used in the meta-analysisto weight each observation. Some observations in the datasethad no corresponding standard deviation because there wasonly one chamber replicate. These observations were includedconservatively, by assigning to them the smallest of the weightsof the other experiments. In order to satisfy the requirement
NPH028.fm Page 248 Tuesday, December 19, 2000 7:07 PM

©
New
Phytologist
(2001)
149
: 247–264
ww
w.new
phytologist.com
Research
249
Table 1
Details of experiments from which stomatal conductance data were obtained
Experiment Name Site Name, Institution
1
Lat. Long. Species Stress Additional factorsInitial age (yr)
Length of exposure
2
(yr) Stocking
3
No. of Replicates
Branch bags
Denmark
Fagus
BB Grib Skov, RVAU 55
°
59
′
N 12
°
16
′
E
Fagus sylvatica
None 36 2 800 8Scotland
Picea
BB Glencorse, UE 55
°
31
′
N 3
°
12
′
W
Picea sitchensis
Nutrient 16 4 1600 6Sweden
Picea
BB Flakaliden, SLU 64
°
07
′
N 19
°
27
′
E
Picea abies
Nutrient, None Nutrition 29 3.5 2400 6
Open-top chambers
Belgium
Picea
OTC Vielsalm, FUSAG 50
°
17
′
N 5
°
55
′
E
Picea abies
Nutrient, None Nutrition 11 9 14 2Belgium
Populus
OTC UIA Campus, UIA51
°
10
′
N 4
°24′EPopulus cv. Robusta, Populus cv. Beaupre
None 0 3 15 2
England Mixed OTC Headley, FC 52°08′N 00°50′W Quercus petraea, Fraxinus excelsior Water, None Water, Ozone4 2 3 16 2England Quercus OTC Headley, FC
52°08′N 00°50′WQuercus petraea, Quercus robur Quercus rubra
None Ozone4 1 2 36 4
Finland Pinus OTC Mekrijärvi, JOY 62°41′N 30°57′E Pinus sylvestris Nutrient Temperature 20 4 1 4Italy Macchia OTC Montalto di Castro, UVT
42°22′N 11°32′EQuercus ilex, Pistacia lentiscus, Phillyrea angustifolia
Water 30 6 13 3
Scotland Betula OTC Glencorse, UE 55°31′N 3°12′W Betula pendula Nutrient 0 4 1 6
Mini-ecosystemsGermany Fagus ME TUB Campus, TUB 52°28′N 13°18′E Fagus sylvatica None 1 4 25 1Germany Quercus ME TUB Campus , TUB 52°28′N 13°18′E Quercus robur None 1 3 16 1
Whole-tree chambersIceland Populus WTC Gunnarsholt, ARI 63°51′N 20°13′W Populus trichocarpa Nutrient, None Nutrition 4 3 1 4
Notes: (1) Institution Codes: ARI, Icelandic Agricultural Research Institute; FC, U.K. Forestry Commission Research Agency; FUSAG, Faculté Universitaire des Sciences Agronomiques de Gembloux; JOY, University of Joensuu; RVAU, Royal Veterinary and Agricultural University; SLU, Swedish University of Agricultural Sciences; TUB, Technical University of Berlin; UE, University of Edinburgh; UIA, Universitaire Instelling Antwerpen; UPS, Universite de Paris-Sud; UVT, University of Viterbo. (2) Length of exposure in growing seasons. (3) Stocking is in stems ha–1 for branch bag experiments, otherwise in plants per chamber. (4) Values from plants exposed to elevated ozone were omitted from this review.
NP
H028.fm
Page 249 T
uesday, Decem
ber 19, 2000 7:07 PM

ww
w.new
phytologist.com©
New
Phytologist (2001) 149: 247–264
Research
250
Table 2 Details of stomatal conductance measurements from which data were obtained
Experiment Name Equipment Field/Lab Climatic Conditions Sampling References
Branch bagsDenmark Fagus BB Ciras-1 (PP Systems) Field Light saturation. ambient T (23–30°C).
Ambient VPD (1.7–3.2 kPa). Growth [CO2]Three leaves from each branch. (Branches in mid-canopy)
Freeman (1998)
Scotland Picea BB ADC LCA3 + light source Field Light saturation. Ambient T (18–35°C). Ambient VPD (0.7–3.1 kPa). Growth [CO2]
One shoot of each age class. (Branches of 3rd whorl)
Barton & Jarvis (1999)
Sweden Picea BB Li-Cor 6200 Field Light saturation. Ambient T (5–24°C). Ambient VPD (0–1.1 kPa). Growth [CO2]
Current shoots. (Branches in mid-canopy)
Roberntz & Stockfors (1998)
Open-top chambersBelgium Picea OTC Binos 100 IRGA Field Light saturation (> 800 µmol m–2 s–1). T (15–20°C).
VPD: < 1.0 kPa. Growth [CO2].Randomly sampled. Laitat et al. (2000)
Belgium Populus OTC ADC-LCA3 Field Light saturation. T: 25–30°C. rh: 30–50%. Growth and reciprocal [CO2].
2 or 3 ramets per clone. Will & Ceulemans (1997)
England Mixed OTC Delta-T AP4 porometer Field Ambient PAR (25–1100 µmol m–2 s–1). Ambient T (20–35°C). Ambient VPD (0–4 kPa). Growth [CO2]
Youngest fully expanded mature leaves sampled from top of canopy growing in full sun.
Broadmeadow & Jackson (2000)
England Quercus OTC ADC-LCA3 Field Ambient PAR (25–1200 µmol m–2 s–1). Ambient T (10–34°C). Ambient VPD (0–4 kPa). Growth [CO2]
Youngest fully expanded mature leaves sampled from top of canopy growing in full sun.
unpublished
Finland Pinus OTC ADC-LCA4 Lab T: 7.0–33.0°C. PAR: 50–1400 µmol m−2 s−1 [CO2]: 20–1400 µmol mol−1. VPD: 0.3–2.0 kPa.
Current shoot from second whorl. Kellomäki & Wang (1996)
Italy Macchia OTC ADC-LCA4 Field Ambient PAR. Ambient T (25–38°C). Ambient VPD (0–6 kPa). Growth [CO2].
Five to 10 sun leaves for each species. Scarascia-Mugnozza et al. (1996)
Scotland Betula OTC Li-Cor 6200 + home-made light source
Field Light saturation. Ambient T (20–30°C). Ambient VPD (0.8–3.0 kPa). Growth [CO2]
Three leaves per tree from the middle-bottom crown.
Rey & Jarvis (1998)
Mini-ecosystemsGermany Fagus ME Walz CMS-400 Field Light saturation. T (25°C). VPD (1.3 kPa). Eight [CO2]. Range of canopy depths. Strassemeyer &
Forstreuter (1998)
Germany Quercus ME Walz CMS-400 Field Light saturation. T (25°C). VPD (1.3 kPa). Eight [CO2]. Range of canopy depths. unpublished
Whole-tree chambersIceland Populus WTC Li-Cor 6200 + QB6200
light sourceField Light saturation. Ambient T (2–20°C). Ambient VPD
(0.1–0.9 kPa). Growth and reciprocal [CO2]Youngest fully expanded sun leaves. Sigurdsson et al.
(2001)
VPD, Vapour pressure deficit; T, temperature.
NP
H028.fm
Page 250 T
uesday, Decem
ber 19, 2000 7:07 PM

© New Phytologist (2001) 149: 247–264 www.newphytologist.com
Research 251
Table 3 Mean values of stomatal conductance to water vapour at ambient and elevated [CO2] taken from experiments listed in Table 1
Species Date Treatment Treatment Ambient SD n Mean Elevated SD n E : A
CONIFERSSweden Picea BBPicea abies 1994 Unfert. 107 20.1 5 91 29.8 5 0.85Picea abies 1994 Fert. 103 8.6 4 107 38.9 4 1.04Picea abies* 1995 Unfert. 134 22.6 6 126 24.4 6 0.94Picea abies* 1995 Fert. 157 20.9 6 149 45.1 6 0.95Belgium Picea OTCPicea abies Jul 96 Fert. 47 1 48 1 1.01Picea abies Jul 96 Unfert. 75 1 53 1 0.70Picea abies* Aug 97 Fert. 101 1 104 1 1.03Picea abies* Aug 97 Unfert. 126 1 82 1 0.66Scotland Picea BB Needle age1
Picea sitchensis 13/7/93 C + 1 75 28.1 6 30 3.4 3 0.40Picea sitchensis 22/7/93 C + 1 77 52.1 4 74 57.1 4 0.96Picea sitchensis 10/8/93 C + 1 89 56.3 5 56 28.7 5 0.64Picea sitchensis 24/8/93 C + 1 79 34.6 6 56 35.7 6 0.71Picea sitchensis 28/9/93 C + 1 93 38.8 6 47 25.5 6 0.50Picea sitchensis 12/7/93 C 143 40.4 6 108 42.3 6 0.76Picea sitchensis 22/7/93 C 117 51.8 4 124 35.5 3 1.05Picea sitchensis 10/8/93 C 112 32.8 5 120 74.1 5 1.07Picea sitchensis* 24/8/93 C 98 30.9 6 94 39.6 6 0.96Picea sitchensis 28/9/93 C 67 26.2 6 73 45.6 6 1.10Finland Pinus OTCPinus sylvestris* 1994 Amb. T 145 10.6 4 121 10.4 4 0.84Pinus sylvestris* 1994 Elev. T 152 8.7 4 142 9.3 4 0.94
BROADLEAF EVERGREENItaly Macchia OTCMeasurements at low VPD (1 kPa)Quercus ilex* Jun 94 153 53.0 2 135 0.0 2 0.89Pistacia lentiscus* Jun 94 305 14.1 2 183 102.5 2 0.60Phillyrea angustifolia* Jun 94 234 1.8 2 188 1 0.80Measurements at normal VPD (2–4 kPa)Quercus ilex Jun 94 47 3.8 3 44 7.1 3 0.93Pistacia lentiscus Jun 94 105 28.5 3 59 5.0 3 0.56Phillyrea angustifolia Jun 94 103 10.3 3 88 34.9 3 0.85
DECIDUOUSEngland Mixed OTCQuercus petraea* Jun 96 +H2O 213 47.5 2 156 37.5 2 0.73Quercus petraea* Jun 96 –H2O 152 19.6 2 99 23.7 2 0.65Fraxinus excelsior* Jun 96 +H2O 185 59.4 2 99 11.3 2 0.54Fraxinus excelsior* Jun 96 –H2O 68 4.9 2 44 6.3 2 0.65England Quercus OTCQuercus petraea* Aug 98 175 4.6 4 122 27.0 4 0.70Quercus robur* Aug 98 180 49.3 4 99 17.9 4 0.55Quercus rubra* Aug 98 108 1.8 4 67 15.6 4 0.62Germany Quercus MEQuercus robur Aug 96 131 1 96 1 0.73Quercus robur Aug 97 116 1 102 1 0.87Quercus robur* Aug 98 80 1 51 1 0.63Scotland Betula OTCBetula pendula Jun 94 289 202.6 5 193 155.6 5 0.67Betula pendula Jul 94 279 102.4 6 235 136.0 5 0.84Betula pendula* Aug 94 220 65.9 6 167 78.9 6 0.76Betula pendula Sept 94 177 39.3 6 103 24.3 6 0.58Belgium Populus OTCPopulus cv. Beaupré May 95 214 18.4 2 200 2.3 2 0.94Populus cv. Beaupré* Aug 95 244 10.0 2 222 24.9 2 0.91Populus cv. Robusta May 95 231 3.3 2 203 7.9 2 0.88Populus cv. Robusta* Aug 95 243 9.0 2 217 41.5 2 0.89
NPH028.fm Page 251 Tuesday, December 19, 2000 7:07 PM

www.newphytologist.com © New Phytologist (2001) 149: 247–264
Research252
that observations be independent, the observation made inmid-growing season in the final year of the experiment wasused if more than one observation was available (Table 3).The meta-analysis was done on the natural logarithm of theresponse ratios, as described by Hedges et al. (1999). A mixed-model analysis was assumed (Gurevitch & Hedges, 1993).Further details of the meta-analysis procedure are given byMedlyn et al. (1999).
Meta-analysis was first used to compare the results from thedata set compiled here with that compiled by Curtis & Wang(1998), by combining the two data sets. We then performeda meta-analysis of long-term, field-based studies only; four ofthe studies considered by Curtis & Wang (1998) fitted thesecriteria and hence were retained in the data set for this meta-analysis. These four studies were on Liriodendron tulipifera andQuercus alba (Gunderson et al., 1993), Maranthes corymbosa(Eamus et al. 1995) and Pinus taeda (Liu & Teskey, 1995).
In addition to the statistical meta-analysis, data were fittedwhere possible to one or both stomatal conductance models( Jarvis, 1976, Ball et al., 1987). The Jarvis (1976) model expressesstomatal conductance as a multiplicative combination of re-sponses to several environmental factors, for example:
g s = g smax f1 (Ca) f2 (D) f3 (T ) f4 (I ) f5 (ψ) Eqn 1
(g smax, the maximum value of stomatal conductance underoptimal environmental conditions; f1 … f5, functions rangingfrom 0 to 1; Ca, atmospheric [CO2] (µmol mol–1); D, leaf toair vapour pressure deficit (kPa); T, leaf temperature (°C); I,incident PAR (µmol m–2 s–1); ψ, soil water potential (MPa).)
The derivation of all parameters of this model requiresmeasurements of g s under varying conditions of all variables,and the variables should not be correlated ( Jarvis, 1976). Suchdatasets are difficult to obtain in practice; in most cases thedatasets we had available included responses to only one ortwo of these variables. Thus, in place of the full model, weindividually fitted as many of the functions f1 … f5 as possibleto each dataset.
We also fitted the Ball et al. (1987) model, which relatesstomatal conductance to assimilation as follows:
g s = g0 + g1 An hs/Ca Eqn 2
(An, the net assimilation rate (µmol m–2 s–1); hs, the relativehumidity at the leaf surface; g0 and g1, the parameters to befitted.) All model fits were performed using SigmaPlot forWindows Version 5.0 (SPSS Inc.). Stomatal conductanceparameters obtained were stored for future reference in theECOCRAFT parameter database (Medlyn & Jarvis, 1999).
Results
Meta-analysis
Response of stomatal conductance to growth in elevated[CO2] The mean values of stomatal conductance underambient and elevated [CO2] from each experiment in theEcocraft/Nordic data set are given in Table 3. Meta-analysiswas used to calculate the mean effect of [CO2] on stomatal con-ductance from these values (Table 4). A significant reduction
Table 3 continued
Species Date Treatment Treatment Ambient SD n Mean Elevated SD n E : A
Iceland Populus WTCPopulus trichocarpa 15/6/96 Unfert. 143 43.2 4 153 9.6 4 1.07Populus trichocarpa 15/7/96 Unfert. 239 89.0 4 260 21.6 4 1.09Populus trichocarpa* 30/7/96 Unfert. 352 80.1 3 400 114.0 4 1.14Populus trichocarpa 15/8/96 Unfert. 344 76.3 4 448 109.0 4 1.30Populus trichocarpa 11/9/96 Unfert. 346 62.6 4 400 263.4 4 1.16Populus trichocarpa 15/6/96 Fert. 239 105.9 4 150 48.5 4 0.63Populus trichocarpa 15/7/96 Fert. 377 33.8 4 375 53.8 4 1.00Populus trichocarpa* 30/7/96 Fert. 555 145.4 4 493 106.1 4 0.89Populus trichocarpa 15/8/96 Fert. 507 76.7 4 437 71.1 4 0.86Populus trichocarpa 11/9/96 Fert. 589 77.0 4 512 116.3 4 0.87Germany Fagus MEFagus sylvatica 1994 88 1 67 1 0.76Fagus sylvatica 1995 74 1 42 1 0.57Fagus sylvatica 1996 91 1 78 1 0.86Fagus sylvatica* 1997 74 1 62 1 0.85Denmark Fagus BBFagus sylvatica* Jul 96 179 72.1 8 171 61.6 8 0.96
Values are given in mmol m−2 s−1. For conifers, values are expressed on a projected leaf area basis. Values indicated with * were included in the meta-analysis. SD, standard deviation of replicates; n, number of replicate chambers in which g s was measured; E : A, ratio of mean value at elevated [CO2] to that at ambient [CO2]. Note: (1) C, current-year needles.
NPH028.fm Page 252 Tuesday, December 19, 2000 7:07 PM
© New Phytologist (2001) 149: 247–264 www.newphytologist.com
Research 253
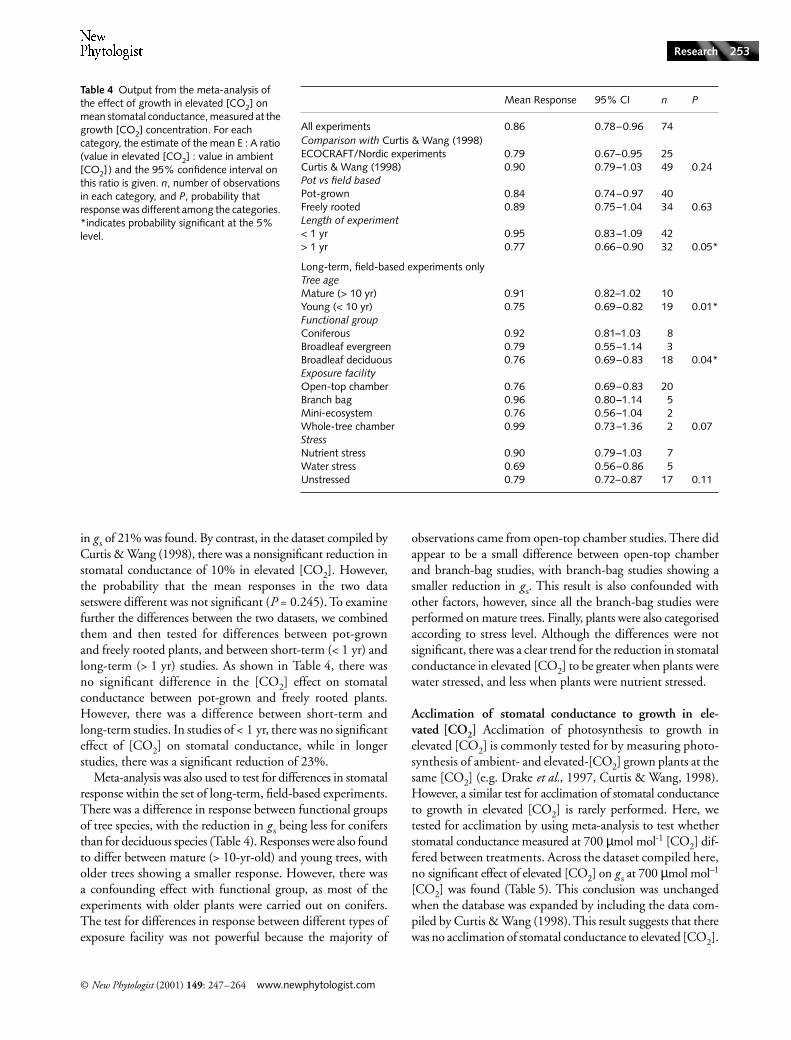
in g s of 21% was found. By contrast, in the dataset compiled byCurtis & Wang (1998), there was a nonsignificant reduction instomatal conductance of 10% in elevated [CO2]. However,the probability that the mean responses in the two datasetswere different was not significant (P = 0.245). To examinefurther the differences between the two datasets, we combinedthem and then tested for differences between pot-grownand freely rooted plants, and between short-term (< 1 yr) andlong-term (> 1 yr) studies. As shown in Table 4, there wasno significant difference in the [CO2] effect on stomatalconductance between pot-grown and freely rooted plants.However, there was a difference between short-term andlong-term studies. In studies of < 1 yr, there was no significanteffect of [CO2] on stomatal conductance, while in longerstudies, there was a significant reduction of 23%.
Meta-analysis was also used to test for differences in stomatalresponse within the set of long-term, field-based experiments.There was a difference in response between functional groupsof tree species, with the reduction in g s being less for conifersthan for deciduous species (Table 4). Responses were also foundto differ between mature (> 10-yr-old) and young trees, witholder trees showing a smaller response. However, there wasa confounding effect with functional group, as most of theexperiments with older plants were carried out on conifers.The test for differences in response between different types ofexposure facility was not powerful because the majority of
observations came from open-top chamber studies. There didappear to be a small difference between open-top chamberand branch-bag studies, with branch-bag studies showing asmaller reduction in g s. This result is also confounded withother factors, however, since all the branch-bag studies wereperformed on mature trees. Finally, plants were also categorisedaccording to stress level. Although the differences were notsignificant, there was a clear trend for the reduction in stomatalconductance in elevated [CO2] to be greater when plants werewater stressed, and less when plants were nutrient stressed.
Acclimation of stomatal conductance to growth in ele-vated [CO2] Acclimation of photosynthesis to growth inelevated [CO2] is commonly tested for by measuring photo-synthesis of ambient- and elevated-[CO2] grown plants at thesame [CO2] (e.g. Drake et al., 1997, Curtis & Wang, 1998).However, a similar test for acclimation of stomatal conductanceto growth in elevated [CO2] is rarely performed. Here, wetested for acclimation by using meta-analysis to test whetherstomatal conductance measured at 700 µmol mol-1 [CO2] dif-fered between treatments. Across the dataset compiled here,no significant effect of elevated [CO2] on g s at 700 µmol mol–1
[CO2] was found (Table 5). This conclusion was unchangedwhen the database was expanded by including the data com-piled by Curtis & Wang (1998). This result suggests that therewas no acclimation of stomatal conductance to elevated [CO2].
Mean Response 95% CI n P
All experiments 0.86 0.78–0.96 74Comparison with Curtis & Wang (1998)ECOCRAFT/Nordic experiments 0.79 0.67–0.95 25Curtis & Wang (1998) 0.90 0.79–1.03 49 0.24Pot vs field basedPot-grown 0.84 0.74–0.97 40Freely rooted 0.89 0.75–1.04 34 0.63Length of experiment< 1 yr 0.95 0.83–1.09 42> 1 yr 0.77 0.66–0.90 32 0.05*
Long-term, field-based experiments onlyTree ageMature (> 10 yr) 0.91 0.82–1.02 10Young (< 10 yr) 0.75 0.69–0.82 19 0.01*Functional groupConiferous 0.92 0.81–1.03 8Broadleaf evergreen 0.79 0.55–1.14 3Broadleaf deciduous 0.76 0.69–0.83 18 0.04*Exposure facilityOpen-top chamber 0.76 0.69–0.83 20Branch bag 0.96 0.80–1.14 5Mini-ecosystem 0.76 0.56–1.04 2Whole-tree chamber 0.99 0.73–1.36 2 0.07StressNutrient stress 0.90 0.79–1.03 7Water stress 0.69 0.56–0.86 5Unstressed 0.79 0.72–0.87 17 0.11
Table 4 Output from the meta-analysis of the effect of growth in elevated [CO2] on mean stomatal conductance, measured at the growth [CO2] concentration. For each category, the estimate of the mean E : A ratio (value in elevated [CO2] : value in ambient [CO2]) and the 95% confidence interval on this ratio is given. n, number of observations in each category, and P, probability that response was different among the categories. *indicates probability significant at the 5% level.
NPH028.fm Page 253 Tuesday, December 19, 2000 7:07 PM

www.newphytologist.com © New Phytologist (2001) 149: 247–264
Research254
The Jarvis (1976) model: Environmental effects on stomatal conductance
Response to vapour pressure deficit (VPD) For severalof the datasets, the only independent variable to whichstomatal conductance could be related was VPD. Light levelsvaried but did not appear to affect stomatal conductance, andtemperature was highly correlated with VPD. The FinlandPinus OTC dataset, by contrast, included response curves ofstomatal conductance to VPD with all other variables heldconstant. We chose to fit a simple linear response to VPD toensure that the same model could be fitted to all data sets. Theequation fitted (cf. eqn 1) was:
g s = g smax (1 – D/D0) Eqn 3
(D0, the value of VPD at which stomatal conductance becomeszero.)
We tested whether the response of g s to VPD is affected bygrowth in elevated [CO2], examining whether the parameterD0 was altered between treatments. As a note of clarification:we chose to test for changes in D0 rather than changes in theslope of the g s-VPD response because it is well known that theslope is highly correlated with the magnitude of g s at low VPD(e.g. Oren et al., 1999), which is often reduced by growth inelevated [CO2].
The values of D0 found for each experiment are shownin Table 6, and the responses of g s to VPD are illustrated inFig. 1. The experiments included studies on mature conifers,mature beech, oak saplings, and water-stressed macchia spe-cies. In none of these experiments did the value of D0 changesignificantly, indicating that the response of g s to VPD isunaffected by growth in elevated [CO2] for a wide range ofenvironmental conditions and species.
Response to soil water content The response to soil watercontent was examined by comparing the watered anddroughted low-ozone treatments in the England Mixed OTCexperiment. A set of data with VPD < 1.0 kPa was used.Values from both irrigation treatments were combined toobtain a response of stomatal conductance to soil watercontent, shown in Fig. 2. To these responses the followingsimple model was fitted (cf. eqn 1):
g s = g smax (1 – ψ/ψ0) Eqn 4
(ψ0, the value of soil water potential (MPa) at which stomatalconductance becomes zero.) The parameter ψ0 was examinedto test whether sensitivity to soil water content changed in elevated[CO2]. The values of this parameter are given in Table 7 andillustrate that, while sensitivity of g s to soil water potential wasmuch higher in F. excelsior than in Q. robur, there was no effectof growth [CO2] on this sensitivity for either species.
Sensitivity to atmospheric [CO2] The effect of long-termgrowth in elevated [CO2] on stomatal conductance is indicatedby the results of the meta-analysis (Table 4). However, onecan also ask whether the sensitivity of stomata to transientchanges in [CO2] is affected by growth at elevated [CO2]. Toinvestigate this possibility, we utilised measurements of g s madeat ambient and doubled [CO2] in both ambient and elevated[CO2] treatments. To these data we fitted the linear model:
g s = g smax (1 – (1 – a)(Ca/350 – 1)) Eqn 5
(the parameter a, the fractional response in g s to a doublingin [CO2] from 350 to 700 µmol mol–1, and is comparable tothe E : A ratio obtained in the meta-analysis.) Values of thisparameter are shown in Table 8. The sensitivity to [CO2]
Mean Response 95% CI n P
All experiments 0.94 0.84–1.05 21Comparison with Curtis & Wang (1998)ECOCRAFT/Nordic experiments 1.02 0.85–1.23 9Curtis & Wang, 1998 0.89 0.77–1.03 12 0.25
Table 5 Meta-analysis of the effect of growth in elevated [CO2] on mean stomatal conductance, measured at a constant [CO2] concentration (700 µmol mol−1).
Experiment Species/Treatment Ambient [CO2] Elevated [CO2]
Denmark Fagus BB 3.42 (0.60) 3.62 (0.34)England Mixed OTC Watered (Q. robur) 6.66 (0.99) 4.43 (0.41)England Mixed OTC Droughted (Q. robur) 5.75 (1.00) 5.95 (1.38)Finland Pinus OTC Ambient temperature 4.72 (0.38) 3.85 (0.26)Finland Pinus OTC Elevated temperature 7.30 (0.79) 6.29 (0.56)Italy Macchia OTC Q. ilex 8.56 (1.26) 7.92 (1.06)Italy Macchia OTC P. angustifolia 9.71 (5.61) 14.4 (5.34)Scotland Picea BB C + 1 needles1 4.00 (0.90) 3.64 (0.76)
Table 6 Values of D0 (kPa), the Jarvis model parameter describing the response to VPD (eqn 5). The standard error is given in parentheses. 1Needles from previous year.
NPH028.fm Page 254 Tuesday, December 19, 2000 7:07 PM

© New Phytologist (2001) 149: 247–264 www.newphytologist.com
Research 255
Fig. 1 Response of stomatal conductance to vapour pressure deficit (VPD). Closed squares, ambient [CO2]; open squares, elevated [CO2]. Solid and dotted lines show regressions fitted to ambient and elevated [CO2] treatments, respectively. (a) Scotland Picea BB, C + 1 needles. (b) Finland Pinus OTC, ambient temperature treatment. (c) Finland Pinus OTC, elevated temperature treatment. (d) England Mixed OTC, Quercus robur, watered treatment. (e) England Mixed OTC, Quercus robur, droughted treatment. (f) Denmark Fagus BB. (g) Italy Macchia OTC, Quercus ilex. (h) Italy Macchia OTC, Phillyrea angustifolia.
NPH028.fm Page 255 Tuesday, December 19, 2000 7:07 PM

www.newphytologist.com © New Phytologist (2001) 149: 247–264
Research256
over the range 350–700 µmol mol–1 in ambient conditionsvaried considerably between experiments. In the two coniferexperiments, stomatal conductance showed a relatively smallsensitivity to [CO2] (a approx. 0.8–1.0), and this sensitivitywas unchanged by growth in elevated [CO2]. A similarpattern was seen for the two poplar cultivars in the BelgiumPopulus OTC experiment. By contrast, for the other broad-leaf species, the sensitivity of g s to [CO2] was strong in theambient [CO2] treatments (a approx. 0.6) but tended to bereduced slightly by growth in elevated [CO2].
The Ball et al. (1987) model: relationship between stomatal conductance and assimilation
The meta-analysis of stomatal conductance measured at700 µmol mol–1 [CO2] indicated that there was no acclimationof stomatal conductance to elevated [CO2] (Table 5). By contrast,a similar meta-analysis of photosynthesis data from the sameexperiments indicated that photosynthetic rates measured at
700 µmol mol–1 [CO2] were significantly reduced by 9% inelevated [CO2] (Medlyn et al., 1999). Thus, a preliminaryconclusion might be that stomatal conductance and photo-synthesis do not respond to long-term growth in elevated[CO2] in the same way. This question was investigated inmore detail using the Ball et al. (1987) model (eqn 2), whichis based on the relationship between photosynthesis andstomatal conductance. If photosynthesis and stomatal con-ductance acclimate to long-term growth in elevated [CO2] in
Fig. 2 Response of stomatal conductance to soil water potential. Closed squares: ambient [CO2]; open squares: elevated [CO2]. Solid and dotted lines show regressions fitted to ambient and elevated [CO2] treatments, respectively. (a) England Mixed OTC, Quercus robur. (b) England Mixed OTC, Fraxinus excelsior.
Table 7 Values of ψ0 (MPa), the Jarvis model parameter describing response to soil water potential (eqn 6). The standard error is given in parentheses
Experiment SpeciesAmbient [CO2] (MPa)
Elevated [CO2] (MPa)
England Mixed OTC Q. robur −0.45 (0.23) −0.36 (0.14)England Mixed OTC F. excelsior −0.18 (0.02) −0.20 (0.02)
NPH028.fm Page 256 Tuesday, December 19, 2000 7:07 PM

© New Phytologist (2001) 149: 247–264 www.newphytologist.com
Research 257
parallel, then the parameters of the model should notchange. Applying the model at ambient and elevated [CO2]concentration, we have
g s(Ca=350) = g0 + g1 An(Ca=350) hs/350 Eqn 6
and
g s (Ca=700) = g0 + g1 An(Ca=700) hs/700. Eqn 7
Dividing eqn 7 by eqn 6, and assuming the parameter g0 tobe negligible, if the parameter g1 is unchanged between ambientand elevated [CO2] then the E/A ratio of photosynthesis(An(Ca=700)/An(Ca=350)) should be approximately twice theE/A ratio of stomatal conductance (gs(Ca=700)/gs(Ca=350)),whether or not acclimation has occurred. Thus, as a first testof whether stomatal conductance and assimilation acclimate(or do not acclimate) in parallel to growth in elevated [CO2],we plotted the E/A ratio of g s against the E/A ratio of An and
Experiment Species/Treatment Ambient [CO2] Elevated [CO2]
Belgium Populus OTC Populus cv. Beaupré 1.02 (0.04) 0.94 (0.02)Belgium Populus OTC Populus cv. Robusta 0.93 (0.04) 0.91 (0.03)Finland Pinus OTC Ambient temperature 1.07 (0.06) 1.03 (0.07)Finland Pinus OTC Elevated temperature 1.04 (0.04) 1.00 (0.04)Germany Fagus ME 0.61 (0.03) 0.76 (0.03)Germany Quercus ME 0.60 (0.12) 0.67 (0.05)Italy Macchia OTC Q. ilex 0.60 (0.04) 0.71 (0.04)Italy Macchia OTC P. lentiscus 0.65 (0.04) 0.80 (0.09)Scotland Picea BB C needles 0.79 (0.02) 0.83 (0.02)
Table 8 Values of a, the Jarvis model parameter describing the short-term response to atmospheric [CO2] (eqn 7). The standard error is given in parentheses
Fig. 3 Effect of elevated [CO2] on stomatal conductance, expressed as a ratio of the elevated [CO2] value to the ambient [CO2] value, versus the effect on assimilation. Closed symbols, conifers; open symbols, broadleaved species. The dashed line indicates the 1:2 line.
Table 9 Parameters of the Ball et al. (1987) model (eqn 2). P, probability that fitted lines for ambient and elevated [CO2] treatments are coincident
Ambient equation r2 n Elevated equation r2 n Combined equation r2 n PCO2 effecton slope
Denmark Fagus BB y = –0.02 + 12.7x 0.95 8 y = –0.003 + 12.1x 0.91 8 y = –0.008 + 12.3x 0.93 16 0.26 0.95Italy Macchia OTCPhillyrea angustifolia y = 0.033 + 10.09x 0.66 24 y = 0.048 + 1.85x 0.22 23 y = 0.039 + 6.47x 0.36 47 < 0.001 0.18Pistacia lentiscus y = 0.042 + 8.16x 0.73 23 y = 0.028 + 13.41x 0.50 20 y = 0.042 + 8.62x 0.63 43 0.18 1.64Quercus ilex y = 0.024 + 6.23x 0.52 25 y = 0.029 + 3.28x 0.35 23 y = 0.030 + 3.68x 0.37 46 0.15 0.53Scotland Betula OTC y = 0.084 + 9.37x 0.15 69 y = –0.018 + 18.62x 0.42 66 y = 0.043 + 12.1x 0.30 135 0.06 1.99Scotland Picea BB (C needles)
y = 0.043 + 6.44x 0.20 29 y = 0.023 + 7.62x 0.74 27 y = 0.031 + 7.29x 0.73 56 0.54 1.18
Scotland Picea BB (C + 1 needles)
y = 0.027 + 5.19x 0.71 29 y = 0.009 + 7.05x 0.83 28 y = 0.018 + 5.88x 0.88 57 0.15 1.36
Sweden Picea BB y = 0.054 + 2.93x 0.67 21 y = 0.032 + 4.56x 0.53 21 y = 0.052+ 3.21x 0.59 42 0.07 1.56
NPH028.fm Page 257 Tuesday, December 19, 2000 7:07 PM

www.newphytologist.com © New Phytologist (2001) 149: 247–264
Research258
Fig. 4 Fits of the Ball et al. (1987) stomatal conductance model (eqn 2). Closed squares, ambient [CO2]; open squares, elevated [CO2]. Solid and dotted lines show regressions fitted to ambient and elevated [CO2] treatments, respectively. (a) Denmark Fagus BB. (b) Italy Macchia OTC, Phillyrea angustifolia. (c) Italy Macchia OTC, Pistacia lentiscus. (d) Italy Macchia OTC, Quercus ilex. (e) Scotland Betula OTC. (f) Scotland Picea BB, C needles. (g) Scotland Picea BB, C + 1 needles. (h) Sweden Picea BB.
NPH028.fm Page 258 Tuesday, December 19, 2000 7:07 PM

© New Phytologist (2001) 149: 247–264 www.newphytologist.com
Research 259
compared the plot to the 1 : 2 line (Fig. 3). Some scatter is tobe expected, since g s and An were not always measured underthe same conditions. However, the plot appears to follow the1 : 2 line, suggesting that the linkage between stomatal conduct-ance and assimilation is unchanged by growth in elevated [CO2].
A better test of this conclusion was made by fitting the Ballet al. (1987) model to a series of data sets to test how the rela-tionship changed between ambient and elevated [CO2] grownplants. Parameters from the model fits are given in Table 9,and the data are illustrated in Fig. 4. In the nonwater-stressedexperiments (Sweden, Denmark, Scotland) the slope of therelationship tended to increase slightly but this shift was notsignificant. In the water-stressed Italian experiment, differentspecies responded in strikingly different ways. For one shrub,Phillyrea angustifolia, there was a small increase in the slopeof the relationship, as for the nonwater-stressed experiments,whereas for a different shrub, Pistacia lentiscus, there was a highlysignificant reduction in the slope of the relationship. Thesespecies clearly have different strategies to cope with water limita-tion (Scarascia-Mugnozza et al., 1996). In summary, it seemsfair to conclude that, in general, the slope of the Ball et al. (1987)relationship is unlikely to be changed significantly by growthin elevated [CO2], indicating that stomata and photosynthesisdo respond in parallel. However, the divergent results obtainedin the Italian Macchia OTC experiment suggest that this con-clusion should be further tested under water-stressed conditions.
Discussion
Effect of elevated [CO2] on mean stomatal conductance
The meta-analysis of stomatal conductance values (Table 4)indicates that there was a significant 21% decrease of stomatalconductance in response to growth in elevated [CO2] acrossthis set of 13 long-term studies with woody species. Thisresult contrasts with the study by Curtis & Wang (1998) whoperformed a similar meta-analysis on stomatal conductancein 48 studies with woody plants and found a modest andnonsignificant reduction of 11% in response to elevated[CO2]. An analysis of our database combined with that ofCurtis & Wang (1998) indicated that the chief differencebetween the two databases was the length of the studies included.Experiments of less than 1 year showed no reduction in g sin elevated [CO2], while experiments of > 1 yr showed asignificant reduction in g s of 23%. This result appears to runcounter to the idea recently put forward that the transientreduction in g s in response to elevated [CO2] will beattenuated by long-term growth in elevated [CO2] (Saxe et al.,1998, Mooney et al., 1999, Norby et al., 1999). However, a plotof the response of g s to elevated [CO2] versus length ofexposure (Fig. 5) illustrates that the key difference between‘short-term’ (< 1 yr) and longer-term experiments is variability.
Fig. 5 Effect of elevated [CO2] on stomatal conductance, expressed as a ratio of the elevated [CO2] value to the ambient [CO2] value, as a function of length of exposure to elevated [CO2]. Filled symbols, data from Curtis & Wang (1998); open symbols, data from the current set of experiments. The dashed line indicates a ratio of 1.
NPH028.fm Page 259 Tuesday, December 19, 2000 7:07 PM

www.newphytologist.com © New Phytologist (2001) 149: 247–264
Research260
Reported responses of g s in short-term experiments are highlyvariable, whereas the responses in long-term experiments aremuch more consistent. The reason for the high variability inshort-term experiments is not immediately evident. There isno similar distinction between pot-grown and freely rootedplants, thus ruling out any artefact related to restricted rootvolume, such as that proposed by Saxe et al. (1998). However,one conclusion that may be drawn from Fig. 5 is that long-term experiments are essential in studies of elevated [CO2]effects on stomatal conductance.
The meta-analysis (Table 4) indicated a significant effectof functional type on the response of stomata to [CO2],with conifers responding less strongly to elevated [CO2] thandeciduous and evergreen broadleaf species. Saxe et al. (1998)also reported a similar difference between functional groups.However, the meta-analysis also showed a significant effect oftree age on stomatal response. The two factors were confounded,with most experiments on older trees (> 10 yr) being onconifers, and most experiments on saplings being with decidu-ous species. Hence, from the meta-analysis, it was not pos-sible to determine which was the principal cause of the differencebetween categories. Examination of nonconfounded cases tendsto suggest that the difference may lie in tree age rather thanfunctional type. In a branch bag study on mature beech therewas no reduction in stomatal conductance or transpiration inelevated [CO2] (Dufrêne et al., 1993, Pontailler et al., 1994).In a second study on mature beech, the [CO2] effect onstomatal conductance varied through the season, with decreasesin June and September but no effect in July and an increasein August (Freeman, 1998). On the other hand, literaturereports from long-term field-based experiments with youngconifers tend to show a strong reduction in g s (−17% in Pinusponderosa, Surano et al., 1986, −38% in P. taeda, Fetcher et al.,1988, up to −40% in P. taeda, Tissue et al., 1997, −35%in current needles of P. sitchensis, C. Barton, unpublished).Differences in the stomatal response related to age or tofunctional type both appear plausible. The observation thatstomata of conifers are generally unresponsive to Ca has beeninvoked to explain the difference in response of g s to elevated[CO2] between conifers and broadleaf species (Saxe et al.,1998), while many studies have shown a reduction instomatal conductance with increasing tree age (Kolb et al.,1997). New FACE (free-air CO2 enrichment) studies on maturetrees may shed some light on this question (e.g. Ellsworth,2000).
Effect of elevated [CO2] on responses of gS to
environmental factors
Curtis (1996) found that the response of g s to elevated[CO2] was strongest in unstressed plants, and noted that thisappeared to conflict with the observation by Sage (1994) thatenvironmental stress accentuates the effect of elevated [CO2]on g s. Meta-analysis of our data suggests that this conflict may
be resolved by observing that different kinds of stress affect theresponse of g s to elevated [CO2] in different ways. Nutrientstress (the most common type of stress in the dataset of Curtis(1996)) appeared to reduce the response of g s to elevated [CO2],whereas water stress increased the response, as noted by Sage(1994).
The response of g s to elevated [CO2] under water stress isof particular interest, since the higher temperatures predictedto follow increases in atmospheric [CO2] are likely to increasepotential evapotranspiration and thus the frequency of droughtstress. The enhanced water-use efficiency almost universallyobserved under elevated [CO2] seems to offer the potential forprotection from this stress. For this reason we examined theeffect of elevated [CO2] on responses of stomatal conductanceto two important factors influencing plant water relations,leaf to air vapour pressure deficit and soil water potential.
We found that stomatal sensitivity to VPD was unchangedby growth in elevated [CO2] in any of the experiments(Fig. 1), in that the value of VPD at which stomatal conduct-ance became zero (D0) was unchanged. A number of studieshave found similar results. Will & Teskey (1997) reported nochange in VPD sensitivity in three species (Quercus rubra,Populus deltoides × nigra, Pinus sylvestris) with a small increasein sensitivity in a fourth species (Cercis canadensis). Goodfellowet al. (1997) and Tognetti et al. (1998) present data showingthat D0 is unchanged by growth in elevated [CO2] in Mangiferaindica and Quercus ilex, respectively. Morison & Gifford(1983) also noted that the most common pattern was forstomatal responses to humidity to remain unchanged bygrowth in elevated [CO2]. However, there are exceptions tothis pattern, such as the study by Heath (1998), where stronglydecreased stomatal sensitivity to VPD was found in seedlingsof F. sylvatica, Castanea sativa and Q. robur. Hollinger (1987)also reported reduced sensitivity to VPD in two youngconifers. These two studies were, however, carried out on pot-grown seedlings exposed to elevated [CO2] for less than 1 yearand hence may be less likely to reflect responses of field-growntrees than the experiments considered here.
With regard to soil water potential, we present dataindicating that stomatal sensitivity to soil water potential wasunchanged by growth in elevated [CO2] for young saplings ofoak and ash (Fig. 2). Similar results have been demonstratedby Morison & Gifford (1984) and Centritto et al. (1999) forwheat and potted cherry (Prunus avium) seedlings, respectively.However, a convincing counter-example to this pattern waspresented by Heath & Kerstiens (1997), who show a much-reduced response of stomatal conductance to soil water con-tent in potted beech seedlings exposed to elevated [CO2] fortwo growing seasons.
In summary, therefore, we found that mean stomatal con-ductance tended to be reduced strongly by growth in elevated[CO2] when plants were water-stressed, but that the sensitiv-ity of stomatal conductance to VPD and soil water potentialwas unchanged. Other literature studies are generally in
NPH028.fm Page 260 Tuesday, December 19, 2000 7:07 PM

© New Phytologist (2001) 149: 247–264 www.newphytologist.com
Research 261
agreement with these observations, except for those presentedby Heath & Kerstiens (1997) and Heath (1998), in whichstomatal conductance was found to be less sensitive to VPDand soil water content when grown in elevated [CO2]. We donot currently have a framework that would allow us to inter-pret these results. Optimality arguments, for example, wouldsuggest that stomata should be more sensitive to soil watercontent at elevated [CO2], since under elevated [CO2] wateravailability is relatively more limiting to growth. The behaviourobserved by Heath and Kerstiens (1997) would, as they note,lead to increased risk of drought damage.
Acclimation of stomatal conductance and relationship with assimilation
Although the acclimation of photosynthesis to elevated[CO2] has been much studied (Gunderson & Wullschleger,1994, Sage, 1994, Besford et al., 1998, Medlyn et al., 1999),less attention has been paid to the acclimation of stomatalconductance. A particularly important question, highlightedby Morison (1998), is whether stomata acclimate in parallel tophotosynthesis, maintaining the tight linkage between thetwo processes observed at ambient [CO2] (Wong et al., 1978),or whether they can acclimate independently.
We examined whether stomatal conductance acclimated togrowth in elevated [CO2] by performing a meta-analysis of g sdata measured at a constant [CO2] (700 µmol mol−1) (Table 5).This analysis indicated that, overall, there was no acclimationof g s to elevated [CO2]. Pursuing this further, we also exam-ined the sensitivity of stomata to [CO2] under ambient andelevated [CO2] growth conditions (Table 8). In ambient con-ditions, stomatal sensitivity to [CO2] differed greatly betweenspecies, with responses ranging from zero to a 40% decreasein stomatal conductance in response to a doubling of [CO2]from 350 to 700 µmol mol−1. Growth in elevated [CO2]appeared to slightly attenuate [CO2] sensitivity in thosespecies that were [CO2] sensitive, but not to affect the speciesthat were not. Other studies generally show no change in[CO2] sensitivity of g s (Radoglou et al., 1992, Johnsen, 1993,Berryman et al., 1994, Tuba et al., 1994), although one studyreports a greatly reduced sensitivity to [CO2] (Santrucek &Sage, 1996).
While this analysis indicates little or no acclimation ofstomatal conductance to elevated [CO2], a similar meta-analysis of photosynthesis data from the same set of experi-ments suggested that photosynthesis did acclimate (Medlynet al., 1999). Hence, we examined whether the relationshipbetween stomatal conductance and photosynthesis was changedunder elevated [CO2]. First, we compared the effect of elevated[CO2] on stomatal conductance with the effect on photosynthesis(Fig. 3) and found a close coupling between the two processes,suggesting that they do acclimate in parallel. Taking thisfurther, we applied a model of stomatal conductance that isbased on the relationship with assimilation (Ball et al., 1987)
to eight separate datasets. We found that the model parametersdid not change after growth in elevated [CO2], except underconditions of water stress (Table 9).
Other studies using the Ball et al. (1987) model havegenerally also found no change in model parameters betweenambient and elevated [CO2] treatments (Kellomäki & Wang,1997, Strassemeyer & Forstreuter, 1997; Liozon et al., 2000).Other authors have examined the linkage between assimilationand stomatal conductance by examining the ratio of intercellularto atmospheric [CO2] (C i : Ca ratio) and have generally observedno effect of elevated [CO2] on this ratio (Sage, 1994, Drakeet al., 1997). The exceptions noted by Sage (1994) were underconditions of water stress. Hence, we conclude that the rela-tionship between assimilation and stomatal conductance isgenerally unchanged by growth under elevated [CO2], butmay change under conditions of water stress.
This conclusion appears difficult to reconcile with theobservation that stomatal conductance does not acclimate toelevated [CO2], while photosynthesis does. One problemis that stomata respond much more slowly to changes inenvironmental conditions (scale of hours) than does photo-synthesis (scale of minutes). Although we attempted to excludedata where stomata would not have had time to respondfully to imposed measurement conditions, it is possible thatstomata had not reached equilibrium conditions in some ofthe measurements, which would affect the observed rela-tionship between g s and assimilation. However, the morelikely reason for the apparent contradiction is that signific-antly fewer datasets were available to assess the acclimationof stomatal conductance (9, Table 5) than acclimation ofphotosynthesis (17, Medlyn et al., 1999). This limitednumber of data sets may not have been sufficient to detect asmall acclimation in stomatal conductance.
Implications for modelling
To assess the implications of changes in stomatal conductancein elevated [CO2] on future forest stand growth and water use,it is important to be able to predict stomatal conductance(Morison, 1998). Hence, in this paper, we have focused, notmerely on the absolute size of the response of g s to [CO2], butalso on how to model g s under elevated [CO2].
There are drawbacks to the way that the models were fitted.The meta-analysis was performed on mid-season values,omitting values from early and late-season, which could causeproblems when scaling up to a whole year. However, theredoes not appear to be a strong seasonality in the response ofgs to elevated [CO2] (Table 3), so this omission may not begrave. The parameterisation of the model of Jarvis (1976)requires an extensive dataset including measurements of g s undervarying conditions of all variables, and the variables shouldnot be correlated. In the absence of such comprehensive datasets, we could only fit individual response curves (equations3–5). Furthermore, we chose to use simple linear response
NPH028.fm Page 261 Tuesday, December 19, 2000 7:07 PM

www.newphytologist.com © New Phytologist (2001) 149: 247–264
Research262
curves, instead of the nonlinear functions commonly used( Jarvis, 1976). This choice was made to minimise the numberof parameters fitted and enhance comparability of parametersbetween datasets. For the second model, we chose to use theform presented by Ball et al. (1987) rather than the alternativeformulation suggested by Leuning (1995) that is currentlygaining ground amongst modellers (Van Wijk et al., 2000).The Ball et al. (1987) form is easier to fit and more readilycompared across experiments because it has fewer parametersand is linear.
Despite these drawbacks to the way the models were fitted,this study has enabled some general conclusions aboutmodelling of stomatal conductance in elevated [CO2] condi-tions – and highlighted several areas in which more data arerequired before we can have confidence in modelling.
To reflect the reduction in g s indicated by the meta-analysis(Table 4), the maximum stomatal conductance (g smax) inthe Jarvis (1976) model (eqn 1) could be reduced by 21%.However, the meta-analysis indicated that either differentfunctional groups, or different ages of trees, respond differ-ently to elevated [CO2]. This issue must be resolved before wecan confidently model the response of g smax to elevated [CO2].Also in the Jarvis (1976) model, our review has shown that thefunctions relating stomatal conductance to VPD ( f (D0) ), soilwater potential ( f (ψ0)) and atmospheric [CO2] ( f (Ca) ) weregenerally unchanged in elevated [CO2] and hence do notneed to be modified. However, these functions have beenshown to be altered in some studies: in particular, Heath &Kerstiens (1997) and Heath (1998) found reduced sensitivityto VPD and soil water potential in young deciduous trees.More careful, quantitative studies of the interactive effects ofVPD, water stress and elevated [CO2] on stomatal conduct-ance in freely rooted plants are required to clarify whether, andhow, the functions f (D0) and f (ψ0) are altered by growth inelevated [CO2].
For the Ball et al. (1987) model it appears that parametersare unchanged under elevated [CO2] and hence the modelmay be applied unmodified in most circumstances. However,the model may need to be modified for plants growing inwater-limited environments, as suggested by the stronglysignificant shift in the relationship observed for the macchiashrub species Phillyrea angustifolia. Further work needs to beundertaken to investigate how this relationship is be affectedby water stress and its interaction with [CO2].
After many years of research, we thus now have a consistentbody of data on which to base models of stomatal conduct-ance under elevated [CO2]. We note in conclusion, however,that the models of stomatal conductance used in this paper areentirely empirical, and our description of stomatal responsesto elevated [CO2] is essentially phenomenological. A majorchallenge that remains is to develop mechanistic models ofstomatal conductance that will allow us to explain, rather thanto merely describe, the response of stomatal conductance toelevated [CO2] (e.g. Assmann, 1999).
Acknowledgements
This work was supported by the EC Environment andClimate Research Programme, Climate and Natural Hazardssubprogramme (contract ENV4-CT95-0077). This workcontributes to the Global Change and Terrestrial Ecosystems(GCTE) core project of the International Geosphere-BiosphereProgramme (IGBP).
ReferencesAssmann SM. 1999. The cellular basis of guard cell sensing of rising CO2.
Plant, Cell & Environment 22: 629–637.Ball JT, Woodrow IE, Berry JA. 1987. A model predicting stomatal
conductance and its contribution to the control of photosynthesis under different environmental conditions. In: Biggins J, ed. Progress in photosynthesis research. Dordrecht, The Netherlands: Martinus-Nijhoff Publishers, 221–224.
Barton CVM, Jarvis PG. 1999. Growth response of branches of Picea sitchensis to four years exposure to elevated atmospheric carbon dioxide concentration. New Phytologist 144: 233–243.
Berryman CA, Eamus D, Duff GA. 1994. Stomatal responses to a range of variables in two tropical tree species grown with CO2 enrichment. Journal of Experimental Botany 45: 539–546.
Besford R, Mousseau M, Matteucci G. 1998. Biochemistry, physiology and biophysics of photosynthesis. In: Jarvis PG, ed. European forests and global change: the likely impacts of rising CO2 and temperature. Cambridge, UK: Cambridge University Press, 29–78.
Broadmeadow MSJ, Jackson SB. 2000. Growth responses of Quercus petraea, Fraxinus excelsior and Pinus sylvestris to elevated carbon dioxide, ozone and water supply. New Phytologist 146: 437–451.
Centritto M, Magnani F, Lee HSJ, Jarvis PG. 1999. Interactive effects of elevated [CO2] and drought on cherry (Prunus avium) seedlings. II. Photosynthetic capacity and water relations. New Phytologist 141: 141–153.
Curtis PS. 1996. A meta-analysis of leaf gas exchange and nitrogen in trees grown under elevated carbon dioxide. Plant, Cell & Environment 19: 127–137.
Curtis PS, Wang X. 1998. A meta-analysis of elevated CO2 effects on woody plant mass, form, and physiology. Oecologia 113: 299–313.
Drake BG, Gonzalez-Meler MA, Long SP. 1997. More efficient plants: a consequence of rising atmospheric CO2? Annual Review of plant physiology and plant molecular biology 48: 609–639.
Dufrêne E, Pontailler JY, Saugier B. 1993. A branch bag technique for simultaneous CO2 enrichment and assimilation measurements on beech (Fagus sylvatica L.). Plant Cell & Environment 15: 1131–1138.
Eamus D, Berryman CA, Duff GA. 1995. Assimilation, stomatal conductance, specific leaf area and chlorophyll responses to elevated CO2 of Maranthes corymbosa, a tropical rain forest species. Australian Journal of Plant Physiology 20: 741–755.
Ellsworth DS. 2000. Seasonal CO2 assimilation and stomatal limitations in a Pinus taeda canopy. Tree Physiology 20: 435–445.
Fetcher N, Jaeger CH, Strain BR, Sionit N. 1988. Long-term elevation of atmospheric CO2 concentration and the carbon exchange rates of saplings of Pinus taeda L. & Liquidambar styraciflua L. Tree Physiology 4: 255–262.
Field CB, Jackson RB, Mooney HA. 1995. Stomatal responses to increased CO2: implications from the plant to the global scale. Plant, Cell & Environment 18: 1214–1225.
Freeman M. 1998. Leaf gas exchange in mature beech (Fagus sylvatica L.) exposed to long-term elevated CO2 in branch bags. PhD thesis, Royal Veterinary and Agricultural University, Denmark.
Goodfellow J, Eamus D, Duff G. 1997. Diurnal and seasonal changes in the impact of CO2 enrichment on assimilation, stomatal conductance and
NPH028.fm Page 262 Tuesday, December 19, 2000 7:07 PM

© New Phytologist (2001) 149: 247–264 www.newphytologist.com
Research 263
growth in a long-term study of Mangifera indica in the wet-dry tropics of Australia. Tree Physiology 17: 291–299.
Gunderson CA, Norby RJ, Wullschleger SD. 1993. Foliar gas exchange responses of two deciduous hardwoods during 3 years of growth in elevated CO2: no loss of photosynthetic enhancement. Plant, Cell & Environment 16: 797–807.
Gunderson CA, Wullschleger SD. 1994. Photosynthetic acclimation in trees to rising atmospheric CO2: a broader perspective. Photosynthesis Research 39: 369–388.
Gurevitch J, Hedges LV. 1993. Meta-analysis: combining the results of independent experiments. In: Scheiner SM, Gurevitch J, eds. Design and analysis of ecological experiments. New York, USA: Chapman & Hall, 378–398.
Heath J. 1998. Stomata of trees growing in CO2-enriched air show reduced sensitivity to vapour pressure deficit and drought. Plant, Cell & Environment 21: 1077–1088.
Heath J, Kerstiens G. 1997. Effects of elevated CO2 on leaf gas exchange in beech and oak at two levels of nutrient supply: consequences for sensitivity to drought in beech. Plant, Cell & Environment 20: 57–67.
Hedges LV, Gurevitch J, Curtis PS. 1999. The meta-analysis of response ratios in experimental ecology. Ecology 80: 1150–1156.
Hollinger DY. 1987. Gas exchange and dry matter allocation responses to elevation of atmospheric CO2 concentration in seedlings of three tree species. Tree Physiology 3: 193–202.
Jarvis PG. 1976. The interpretation of the variations in leaf water potential and stomatal conductance found in canopies in the field. Philosophical Transactions of the Royal Society of London Series B 273: 593–510.
Jarvis PG. 1998. European forests and global change: the likely impacts of rising CO2 and temperature. Cambridge, UK: Cambridge University Press.
Johnsen KH. 1993. Growth and ecophysiological responses of black spruce seedlings to elevated CO2 under varied water and nutrient additions. Canadian Journal of Forest Research 23: 1033–1042.
Kellomäki S, Vaisanen H. 1997. Modelling the dynamics of the forest ecosystem for climate change studies in the boreal conditions. Ecological Modelling 97: 121–140.
Kellomäki S, Wang K. 1996. Photosynthetic responses to needle water potentials in Scots pine after a four-year exposure to elevated CO2 and temperature. Tree Physiology 16: 765–772.
Kellomäki S, Wang K. 1997. Photosynthetic responses of Scots pine to elevated CO2 and nitrogen supply: results of a branch-in-bag experiment. Tree Physiology 17: 231–240.
Kolb TE, Fredericksen TS, Steiner KC, Skelly JM. 1997. Issues in scaling tree size and age responses to ozone: a review. Environmental Pollution 98: 195–208.
Laitat E, Chermanne B, Portier B. 2000. Biomass, carbon and nitrogen allocation in open top chambers under ambient and elevated CO2 and in a mixed forest stand. A tentative approach for scaling up from the experiments of Vielsalm. In: Ceulemans R, Veroustraete F, Gond V, Van Rensbergen J, eds. Forest ecosystem modelling, upscaling and remote sensing. The Hague, The Netherlands: SPB Academic Publishing bv, 33–59.
Leuning R. 1995. A critical appraisal of a combined stomatal-photosynthesis model for C3 plants. Plant, Cell & Environment 18: 339–355.
Liozon R, Badeck F-W, Genty B, Meyer S, Saugier B. 2000. Leaf photo-synthetic characteristics of beech (Fagus sylvatica L.) saplings stands during three years of CO2 exposure. Tree Physiology 20: 239–248.
Liu S, Teskey RO. 1995. Responses of foliar gas exchange to long-term elevated CO2 concentrations in mature loblolly pine trees. Tree Physiology 15: 351–359.
Medlyn BE, Badeck F-W, de Pury DGG, Barton CVM, Broadmeadow MSJ, Ceulemans R, de Angelis P, Forstreuter M, Jach ME, Kellomäki S, Laitat E, Marek M, Philippot S, Rey A, Strassemeyer J, Laitinen K, Liozon R, Portier B, Roberntz P,
Wang K, Jarvis PG. 1999. Effects of elevated [CO2] on photosynthesis in European forest species: a meta-analysis of model parameters. Plant, Cell & Environment 22: 1475–1495.
Medlyn BE, Jarvis PG. 1999. Design and use of a database of model parameters from elevated [CO2] experiments. Ecological Modelling 124: 69–83.
Mooney HA, Canadell J, Chapin FS, Ehleringer J, Körner Ch, McMurtrie RE, Parton WJ, Pitelka L, Schulze E-D. 1999. Ecosystem physiology responses to global change. In: Walker BH, Steffen WL, Canadell J, Ingram JSI, eds. The terrestrial biosphere and global change. Implications for natural and managed ecosystems. Cambridge, UK: Cambridge University Press, 141–189.
Morison JIL. 1987. Intercellular CO2 concentration and stomatal response to CO2. In: Zeiger E, Cowan IR, Farquhar GD, eds. Stomatal Function. Stanford, CA, USA: Stanford University Press, 229–251.
Morison JIL. 1998. Stomatal response to increased CO2 concentration. Journal of Experimental Botany 49: 443–452.
Morison JIL, Gifford RM. 1983. Stomatal sensitivity to carbon dioxide and humidity. Plant Physiology 71: 789–796.
Morison JIL, Gifford RM. 1984. Plant growth and water use with limited water supply in high CO2 concentrations. I. Leaf area, water use and transpiration. Australian Journal of Plant Physiology 11: 361–374.
Norby RJ, Wullschleger SD, Gunderson CA, Johnson DW, Ceulemans R. 1999. Tree responses to rising CO2 in field experiments: implications for the future forest. Plant, Cell & Environment 22: 683–714.
Oren R, Sperry JS, Katul GG, Pataki DE, Ewers BE, Phillips N, Schäfer KVR. 1999. Survey and synthesis of intra- and interspecific variation in stomatal sensitivity to vapour pressure deficit. Plant, Cell & Environment 22: 1515–1526.
Pontailler J-Y, Barton CVM, Durrant D, Forstreuter M. 1998. How can we study CO2 impacts on trees and forests? In: Jarvis PG, ed. European forests and global change: the likely impacts of rising CO2 and temperature. Cambridge, UK: Cambridge University Press, 1–28.
Pontailler J-Y, Dufrêne E, Saugier B, Saumain E. 1994. Long term CO2 enrichment and gas exchange measurement on branches of mature beeches (Fagus sylvatica L.). In: Mousseau, M, ed. Responses of trees and forests to global change. ECOCRAFT/ICAT International Symposium, Dourdan, France. Abstracts, 41.
Radoglou KM, Aphalo P, Jarvis PG. 1992. Response of photosynthesis, stomatal conductance and water use efficiency to elevated CO2 and nutrient supply in acclimated seedlings of Phaseolus vulgaris L. Annals of Botany 70: 257–264.
Rey A, Jarvis PG. 1998. Long-term photosynthetic acclimation to increased atmoshperic CO2 concentration in young birch (Betula pendula) trees. Tree Physiology 18: 441–450.
Roberntz P, Stockfors J. 1998. Effects of elevated CO2 concentration and nutrition on net photosynthesis, stomatal conductance and needle respiration of field-grown Norway spruce trees. Tree Physiology 18: 233–241.
Rosenberg MS, Adams DC, Gurevitch J. 1997. Metawin: statistical software for meta-analysis with resampling tests, version 1.0. Sunderland, MA, USA: Sinauer Associates.
Sage RF. 1994. Acclimation of photosynthesis to increasing atmospheric CO2: the gas-exchange perspective. Photosynthesis Research 39: 351–368.
Santrucek J, Sage RF. 1996. Acclimation of stomatal conductance to a CO2-enriched atmosphere and elevated temperature in Chenopodium album. Australian Journal of Plant Physiology 23: 467–478.
Saxe H, Ellsworth DS, Heath J. 1998. Tree and forest functioning in an enriched CO2 atmosphere. New Phytologist 139: 395–436.
Scarascia-Mugnozza GE, De Angelis P, Matteucci G, Kuzminsky E. 1996. Carbon metabolism and plant growth under elevated CO2 in a natural Quercus ilex macchia stand. In: Koch GW, Mooney HA, eds. Carbon dioxide and terrestrial ecosystems. San Diego, CA, USA: Academic Press, 209–230.
Sellers PJ, Bounoua L, Collatz GJ, Randall DA, Dazlich DA, Los SO,
NPH028.fm Page 263 Tuesday, December 19, 2000 7:07 PM

www.newphytologist.com © New Phytologist (2001) 149: 247–264
Research264
Berry JA, Fung I, Tucker CJ, Field CB, Jensen TG. 1996. Comparison of radiative and physiological effects of doubled atmospheric CO2 on climate. Science 271: 1402–1406.
Sigurdsson BD, Thorgeirsson H, Linder S. 2001. Growth and dry-matter partitioning of young Populus trichocarpa trees during three years of elevated fertilisation. Tree Physiology. (In press.)
Strassemeyer J, Forstreuter M. 1997. Parameterization of a leaf gas-exchange model for Fagus sylvatica L. using microcosms grown under ambient and elevated CO2. Landschaftsentwicklung and Umweltforschung 107: 61–72.
Surano KA, Daley PF, Houpis JLJ, Shinn JH, Helms JA, Palassou RJ, Costella MP. 1986. Growth and physiological responses of Pinus ponderosa Dougl. Ex P. Laws. to long-term elevated CO2 concentrations. Tree Physiology 2: 243–259.
Thornley JHM, Cannell MGR. 1996. Temperate forest responses to carbon dioxide, temperature and nitrogen: a model analysis. Plant, Cell & Environment 19: 1331–1348.
Tissue DT, Thomas RB, Strain BR. 1997. Atmospheric CO2 enrichment increases growth and photosynthesis of Pinus taeda : a 4 year experiment in the field. Plant, Cell & Environment 20: 1123–1134.
Tognetti R, Longobucco A, Miglietta F, Raschi A. 1998. Transpiration
and stomatal behaviour of Quercus ilex plants during the summer in a Mediterranean carbon dioxide spring. Plant, Cell & Environment 21: 613–622.
Tuba Z, Szente K, Koch J. 1994. Response of photosynthesis, stomatal conductance, water use efficiency and production to long-term elevated CO2 in winter wheat. Journal of Plant Physiology 144: 661–668.
Van Wijk MT, Dekker SC, Bouten W, Bosveld FC, Kohsiek W, Kramer K, Mohren GMJ. 2000. Modeling daily gas exchange of a Douglas-fir forest: comparison of three stomatal conductance models with and without a soil water stress function. Tree Physiology 20: 115–122.
Will RE, Ceulemans R. 1997. Effects of elevated CO2 concentration on photosynthesis, respiration and carbohydrate status of coppice Populus hybrids. Physiologia Plantarum 100: 933–939.
Will RE, Teskey RO. 1997. Effect of irradiance and vapour pressure deficit on stomatal response to CO2 enrichment of four tree species. Journal of Experimental Botany 48: 2095–2102.
Wong SC, Cowan IR, Farquhar GD. 1978. Stomatal conductance correlates with photosynthetic capacity. Nature 282: 424–426.
NPH028.fm Page 264 Tuesday, December 19, 2000 7:07 PM
Related Documents