1 GROUP ASSIGNMENT COMPUTATIONAL MATHEMATICS AND STATISTICS (KKKC6114) LECTURER: DR. EDGAR SCAVINO @ OMAR EDGAR GROUP MEMBER: MASTURA BINTI OMAR - P65374 ZAINAL ABIDIN B. NORDIN - P65373 HASRUL 'NISHAM BIN ROSLY - P65393 ZETI MAZIANNA BINTI MAZLAN - P65372 KALAIVANI A/P A.TARUMARAJA - P65540

Welcome message from author
This document is posted to help you gain knowledge. Please leave a comment to let me know what you think about it! Share it to your friends and learn new things together.
Transcript
1
GROUP ASSIGNMENT
COMPUTATIONAL MATHEMATICS AND STATISTICS
(KKKC6114)
LECTURER:
DR. EDGAR SCAVINO @ OMAR EDGAR
GROUP MEMBER:
MASTURA BINTI OMAR - P65374
ZAINAL ABIDIN B. NORDIN - P65373
HASRUL 'NISHAM BIN ROSLY - P65393
ZETI MAZIANNA BINTI MAZLAN - P65372
KALAIVANI A/P A.TARUMARAJA - P65540
2
1.0 OBJECTIVE OF MINI PROJECT
In this project, a machine produced 250 sets of cylinders. Each diameter and length is given in the data file. The goal of this project is to verify if the 2 distributions of values are normal and if there is any correlation between the values.
2.0 CALCULATION
2.1. MEAN AND STANDARD DEVIATION OF EACH DISTRIBUTION.
Value of mean and standard deviation for each distribution is calculated by using Excel. Formula used in the calculation is:
1. Total = “SUM” 2. Mean = “AVERAGE” 3. Standard deviation = “STDEV”
a) Diameter distribution.
!"#$%,∑! = 2,513.30
!"#$, ! = ∑!!= !"#$.!
!"#= 10.05
!"#$%#&% !"#$%&$'(,! = !!!! !
!!!!! = 0.96
b) Length distribution.
!"#$%,∑! = 5,014.92
!"#$, ! = ∑!!= !"#$.!"
!"#= 20.06
!"#$%#!! !"#$%&$'(,! = !!!! !
!!!!! = 1.89
3
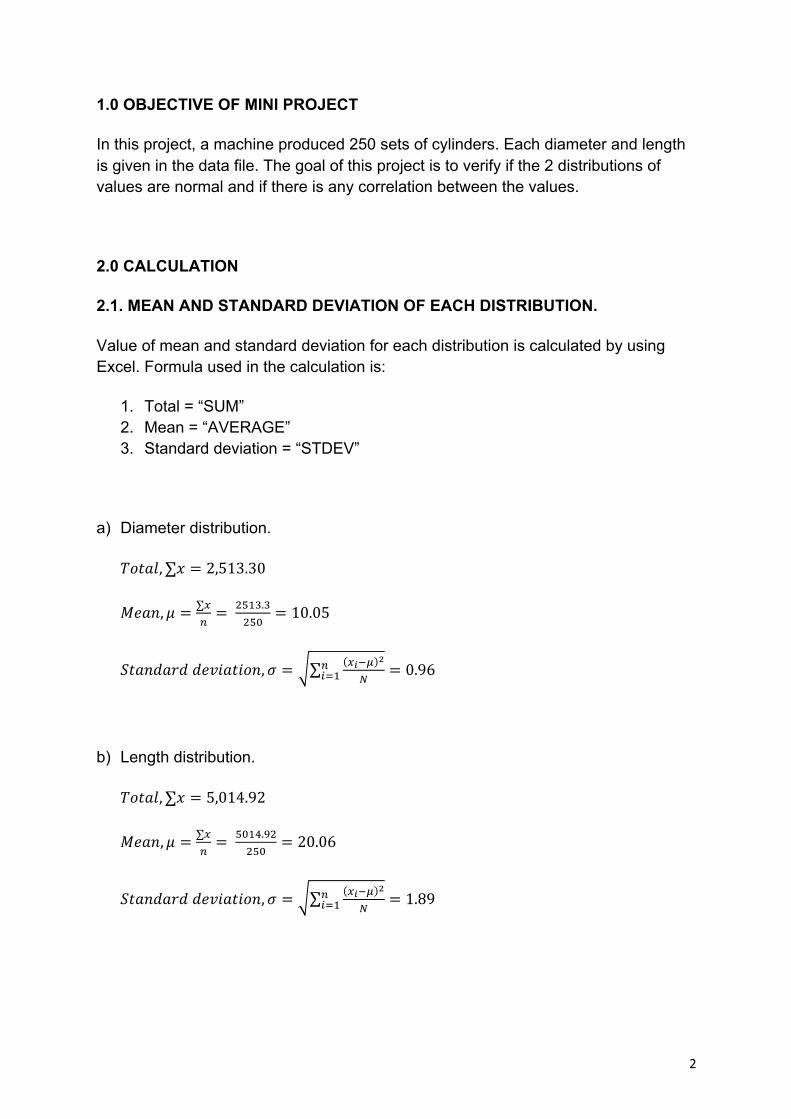
2.2 VERIFY IF THE DISTRIBUTIONS ARE NORMAL (alpha=0.05)
2.2.1. Diameter distribution
Hypothesis:
Ho = The distribution of value is normal with ! = 10.05 and ! = 0.96
Ha = The distribution of calls does not have normal distribution
Class Frequency
observed, fo P(x<value) Frequency
expected, fe !! − !!
!! − !! !
!!
x < 8 7 0.0163 4.09 2.91 2.070 8 < x < 9 24 0.1206 30.15 -6.15 1.254
9 < x < 10 92 0.3421 85.53 6.47 0.490 10 < x < 11 81 0.3595 89.88 -8.88 0.876 11 < x < 12 38 0.14 35.00 3.00 0.257
x > 12 8 0.0211 5.28 2.73 1.408
Total 250 0.99966 249.92 0.085 6.356
Example calculation for P(x<value) calculation:
a) For x < 8,
i) ! ! < 8 = ! ! < !!!".!"!.!"
= 0.0163
ii) Expected frequency, !! = 0.01636 250 = 4.09
4
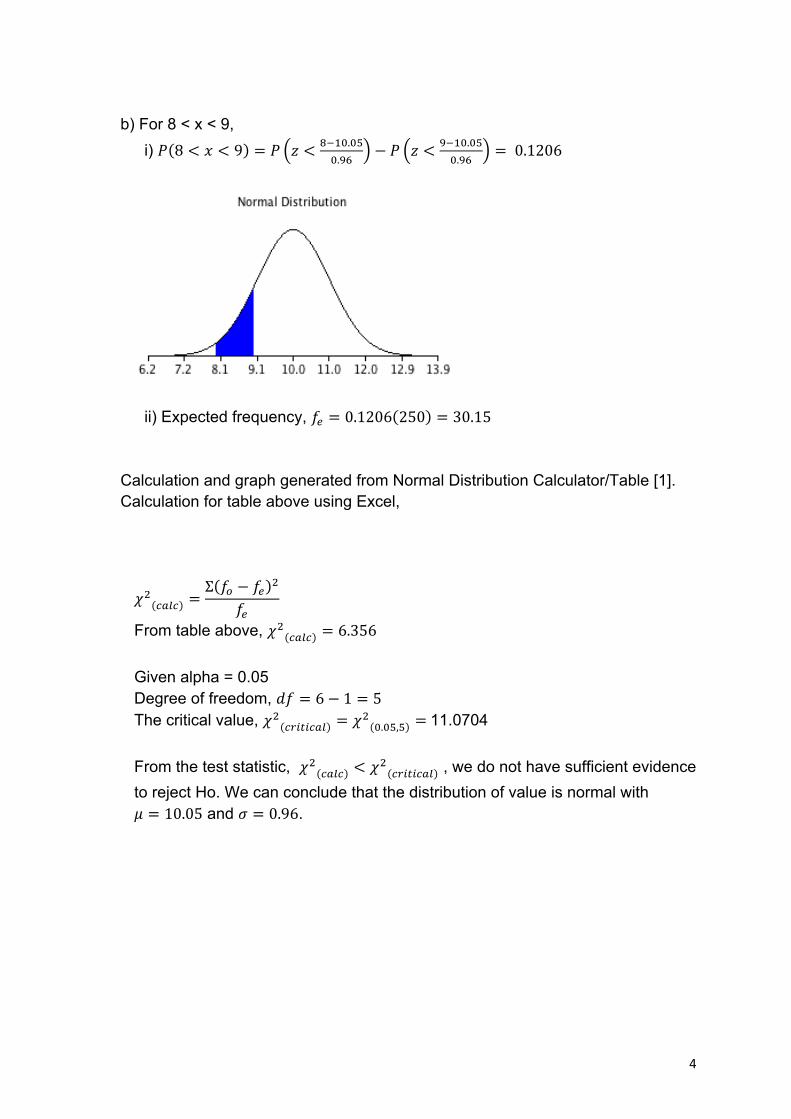
b) For 8 < x < 9, i) ! 8 < ! < 9 = ! ! < !!!".!"
!.!"− ! ! < !!!".!"
!.!"= 0.1206
ii) Expected frequency, !! = 0.1206 250 = 30.15 Calculation and graph generated from Normal Distribution Calculator/Table [1]. Calculation for table above using Excel,
!! !"#! =Σ !! − !! !
!!
From table above, !! !"#! = 6.356 Given alpha = 0.05 Degree of freedom, !" = 6− 1 = 5 The critical value, !! !"#$#!%& = !! !.!",! = 11.0704 From the test statistic, !! !"#! < !! !"#$#!%& , we do not have sufficient evidence to reject Ho. We can conclude that the distribution of value is normal with ! = 10.05 and ! = 0.96.
5
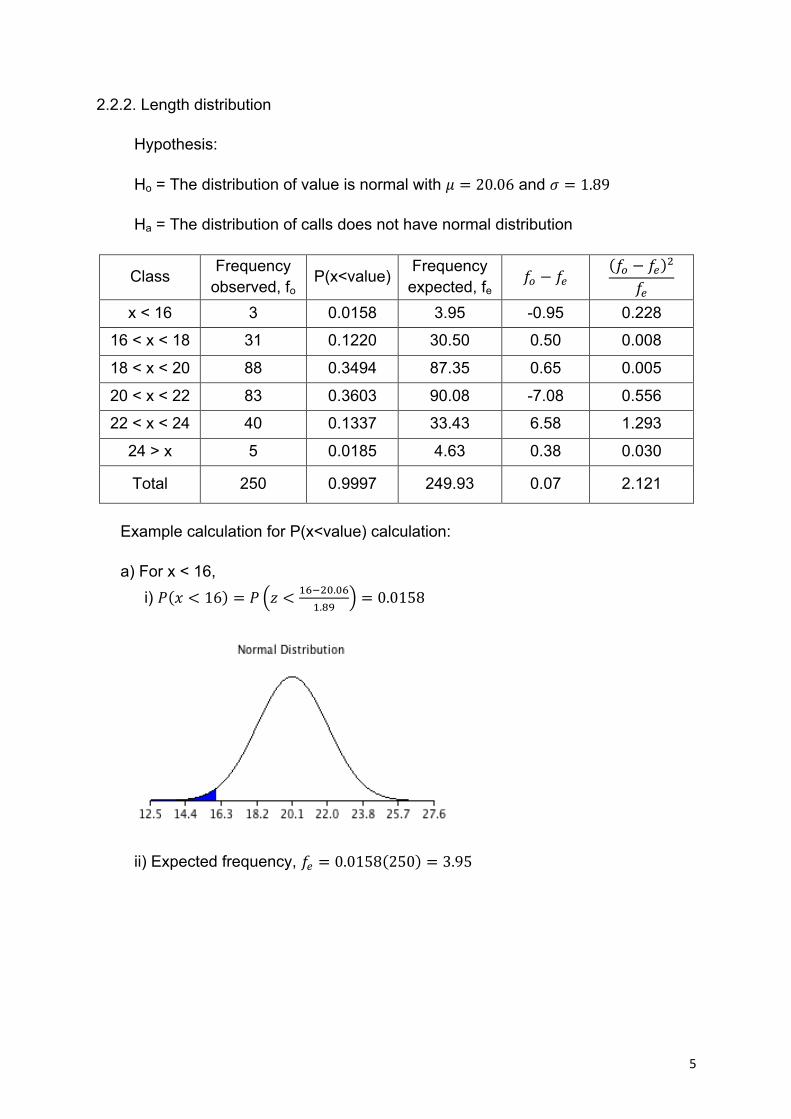
2.2.2. Length distribution
Hypothesis:
Ho = The distribution of value is normal with ! = 20.06 and ! = 1.89
Ha = The distribution of calls does not have normal distribution
Class Frequency
observed, fo P(x<value) Frequency
expected, fe !! − !!
!! − !! !
!!
x < 16 3 0.0158 3.95 -0.95 0.228
16 < x < 18 31 0.1220 30.50 0.50 0.008
18 < x < 20 88 0.3494 87.35 0.65 0.005
20 < x < 22 83 0.3603 90.08 -7.08 0.556
22 < x < 24 40 0.1337 33.43 6.58 1.293
24 > x 5 0.0185 4.63 0.38 0.030
Total 250 0.9997 249.93 0.07 2.121
Example calculation for P(x<value) calculation:
a) For x < 16, i) ! ! < 16 = ! ! < !"!!".!"
!.!"= 0.0158
ii) Expected frequency, !! = 0.0158 250 = 3.95
6
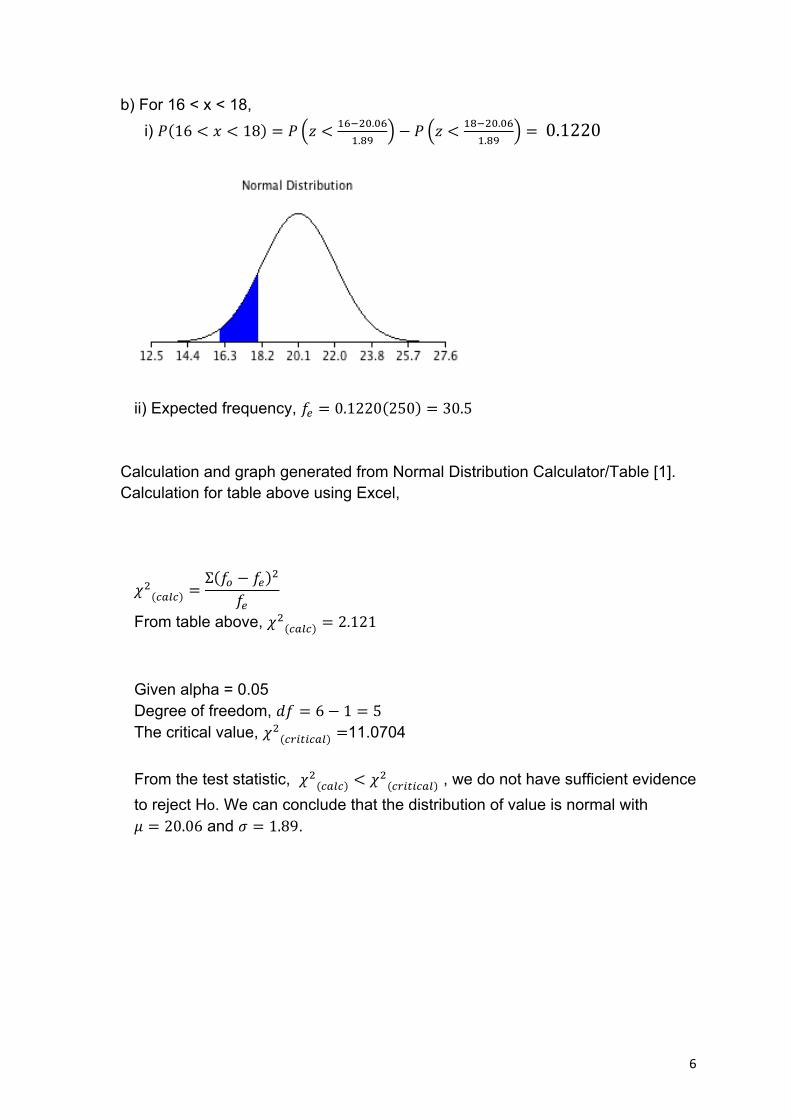
b) For 16 < x < 18, i) ! 16 < ! < 18 = ! ! < !"!!".!"
!.!"− ! ! < !"!!".!"
!.!"= 0.1220
ii) Expected frequency, !! = 0.1220 250 = 30.5
Calculation and graph generated from Normal Distribution Calculator/Table [1]. Calculation for table above using Excel,
!! !"#! =Σ !! − !! !
!!
From table above, !! !"#! = 2.121
Given alpha = 0.05 Degree of freedom, !" = 6− 1 = 5 The critical value, !! !"#$#!%& =11.0704 From the test statistic, !! !"#! < !! !"#$#!%& , we do not have sufficient evidence to reject Ho. We can conclude that the distribution of value is normal with ! = 20.06 and ! = 1.89.
7
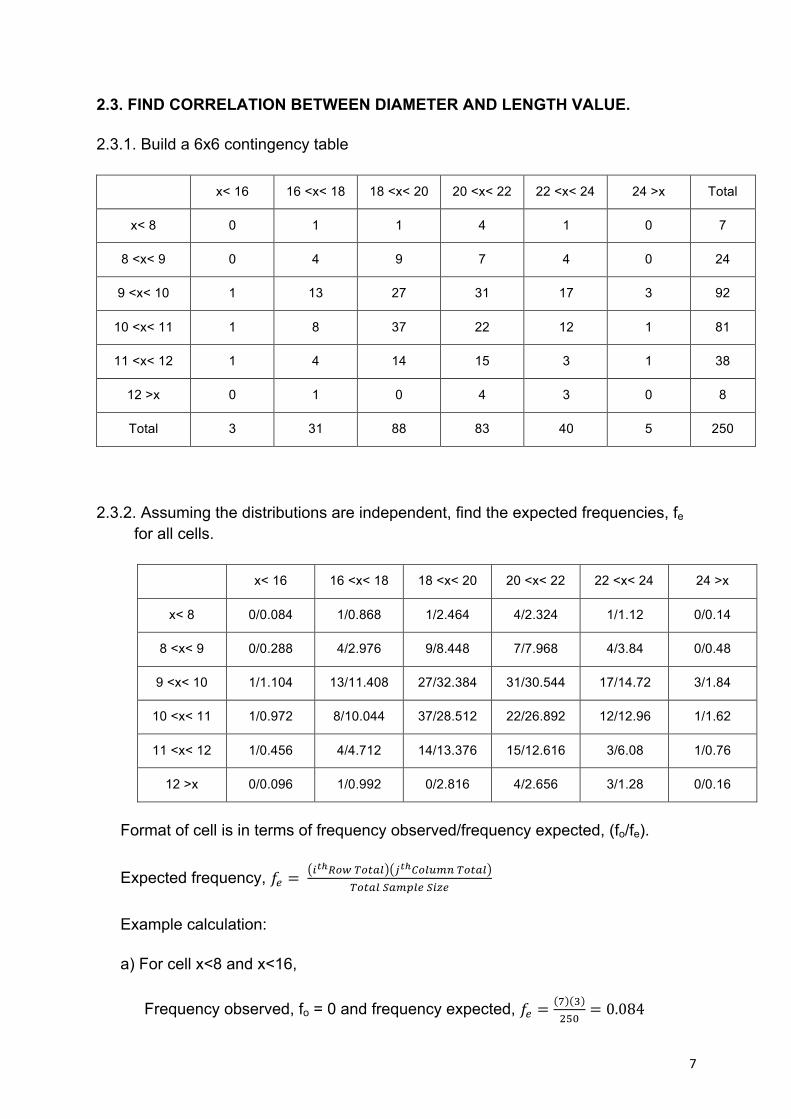
2.3. FIND CORRELATION BETWEEN DIAMETER AND LENGTH VALUE.
2.3.1. Build a 6x6 contingency table
x< 16 16 <x< 18 18 <x< 20 20 <x< 22 22 <x< 24 24 >x Total
x< 8 0 1 1 4 1 0 7
8 <x< 9 0 4 9 7 4 0 24
9 <x< 10 1 13 27 31 17 3 92
10 <x< 11 1 8 37 22 12 1 81
11 <x< 12 1 4 14 15 3 1 38
12 >x 0 1 0 4 3 0 8
Total 3 31 88 83 40 5 250
2.3.2. Assuming the distributions are independent, find the expected frequencies, fe for all cells.
x< 16 16 <x< 18 18 <x< 20 20 <x< 22 22 <x< 24 24 >x
x< 8 0/0.084 1/0.868 1/2.464 4/2.324 1/1.12 0/0.14
8 <x< 9 0/0.288 4/2.976 9/8.448 7/7.968 4/3.84 0/0.48
9 <x< 10 1/1.104 13/11.408 27/32.384 31/30.544 17/14.72 3/1.84
10 <x< 11 1/0.972 8/10.044 37/28.512 22/26.892 12/12.96 1/1.62
11 <x< 12 1/0.456 4/4.712 14/13.376 15/12.616 3/6.08 1/0.76
12 >x 0/0.096 1/0.992 0/2.816 4/2.656 3/1.28 0/0.16
Format of cell is in terms of frequency observed/frequency expected, (fo/fe).
Expected frequency, !! = !!!!"# !"#$% !!!!"#$%& !"#$%
!"#$% !"#$%& !"#$
Example calculation:
a) For cell x<8 and x<16,
Frequency observed, fo = 0 and frequency expected, !! =! !!"#
= 0.084
8
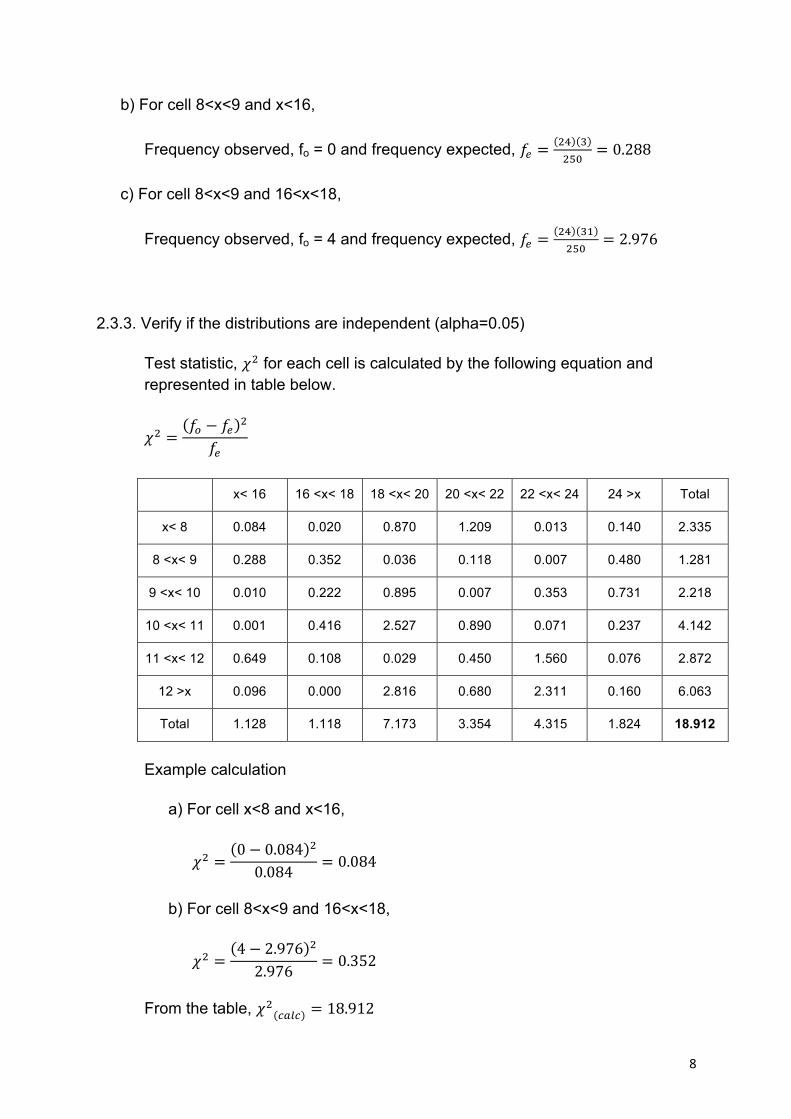
b) For cell 8<x<9 and x<16,
Frequency observed, fo = 0 and frequency expected, !! =!" !!"#
= 0.288
c) For cell 8<x<9 and 16<x<18,
Frequency observed, fo = 4 and frequency expected, !! =!" !"!"#
= 2.976
2.3.3. Verify if the distributions are independent (alpha=0.05)
Test statistic, !! for each cell is calculated by the following equation and represented in table below.
!! =!! − !! !
!!
x< 16 16 <x< 18 18 <x< 20 20 <x< 22 22 <x< 24 24 >x Total
x< 8 0.084 0.020 0.870 1.209 0.013 0.140 2.335
8 <x< 9 0.288 0.352 0.036 0.118 0.007 0.480 1.281
9 <x< 10 0.010 0.222 0.895 0.007 0.353 0.731 2.218
10 <x< 11 0.001 0.416 2.527 0.890 0.071 0.237 4.142
11 <x< 12 0.649 0.108 0.029 0.450 1.560 0.076 2.872
12 >x 0.096 0.000 2.816 0.680 2.311 0.160 6.063
Total 1.128 1.118 7.173 3.354 4.315 1.824 18.912
Example calculation
a) For cell x<8 and x<16,
!! =0− 0.084 !
0.084 = 0.084
b) For cell 8<x<9 and 16<x<18,
!! =4− 2.976 !
2.976 = 0.352
From the table, !! !"#! = 18.912
9
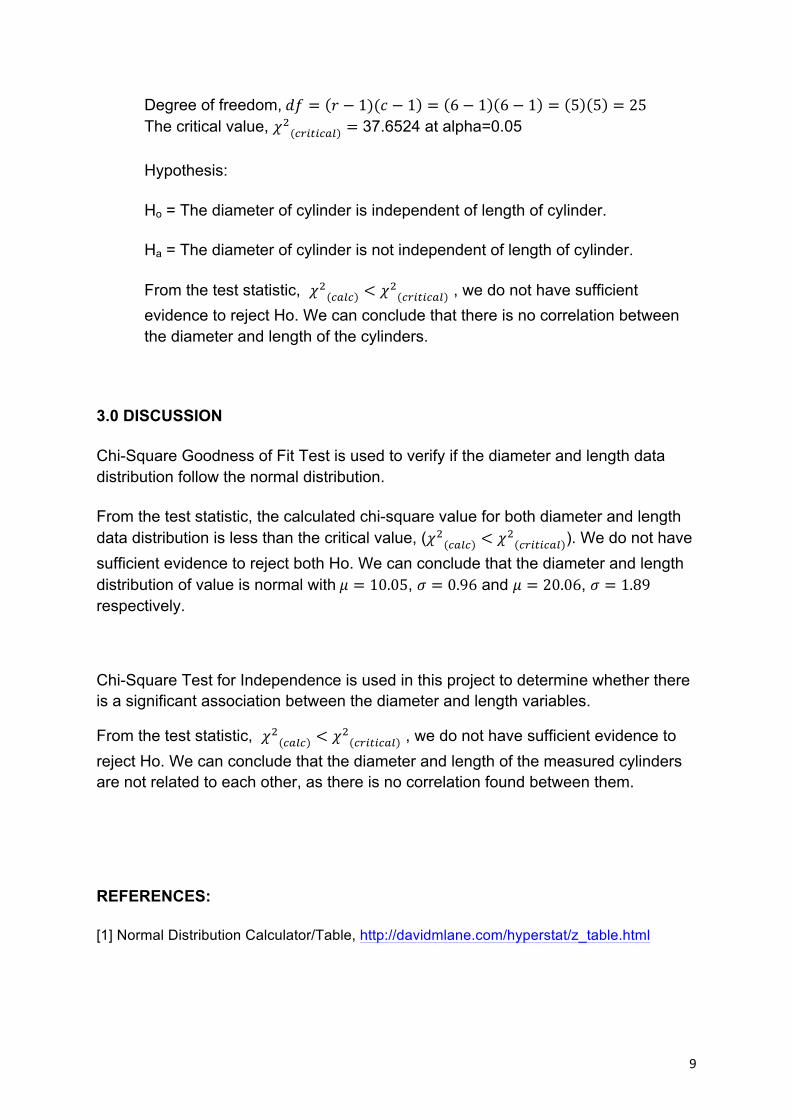
Degree of freedom, !" = ! − 1)(! − 1 = 6− 1 6− 1 = 5 5 = 25 The critical value, !! !"#$#!%& = 37.6524 at alpha=0.05
Hypothesis:
Ho = The diameter of cylinder is independent of length of cylinder.
Ha = The diameter of cylinder is not independent of length of cylinder.
From the test statistic, !! !"#! < !! !"#$#!%& , we do not have sufficient evidence to reject Ho. We can conclude that there is no correlation between the diameter and length of the cylinders.
3.0 DISCUSSION
Chi-Square Goodness of Fit Test is used to verify if the diameter and length data distribution follow the normal distribution.
From the test statistic, the calculated chi-square value for both diameter and length data distribution is less than the critical value, (!! !"#! < !! !"#$#!%& ). We do not have sufficient evidence to reject both Ho. We can conclude that the diameter and length distribution of value is normal with ! = 10.05, ! = 0.96 and ! = 20.06, ! = 1.89 respectively.
Chi-Square Test for Independence is used in this project to determine whether there is a significant association between the diameter and length variables.
From the test statistic, !! !"#! < !! !"#$#!%& , we do not have sufficient evidence to reject Ho. We can conclude that the diameter and length of the measured cylinders are not related to each other, as there is no correlation found between them.
REFERENCES:
[1] Normal Distribution Calculator/Table, http://davidmlane.com/hyperstat/z_table.html
Related Documents