SHELL Strategic Management SHELL

Welcome message from author
This document is posted to help you gain knowledge. Please leave a comment to let me know what you think about it! Share it to your friends and learn new things together.
Transcript
SHELL
Strategic Management
SHELL
1. INTODUCTION
2. PESTLE ANALYSIS
3. EFE MATRIX
4. IFE MATRIX
5. IE MATRIX
6. CONCLUSION
7. REFERENCES
OUTLINE
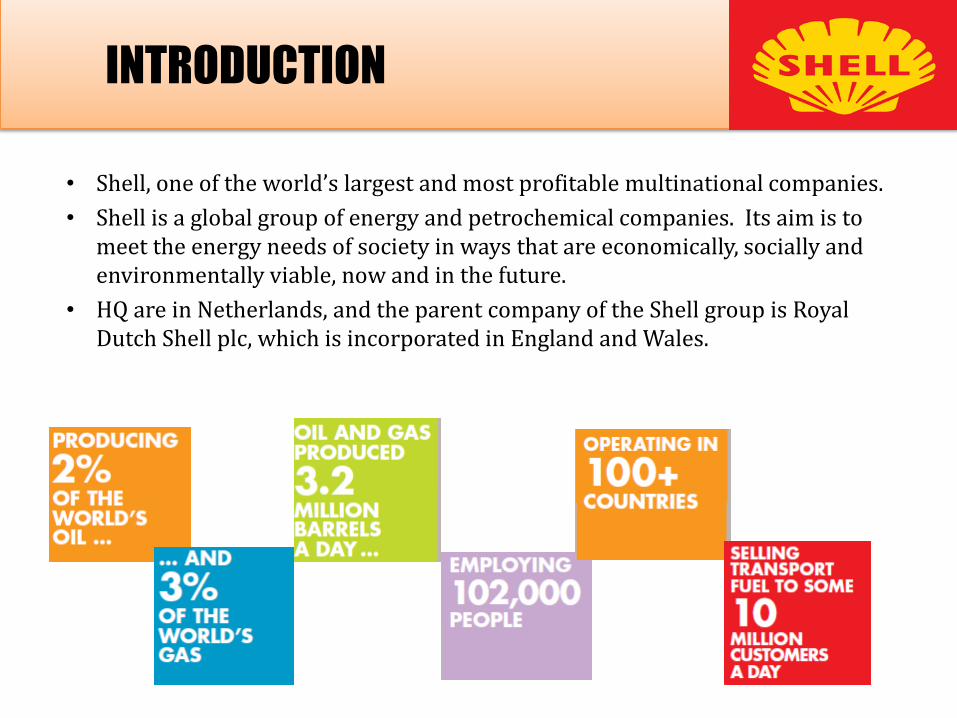
• Shell, one of the world’s largest and most profitable multinational companies.
• Shell is a global group of energy and petrochemical companies. Its aim is to meet the energy needs of society in ways that are economically, socially and environmentally viable, now and in the future.
• HQ are in Netherlands, and the parent company of the Shell group is Royal Dutch Shell plc, which is incorporated in England and Wales.
INTRODUCTION
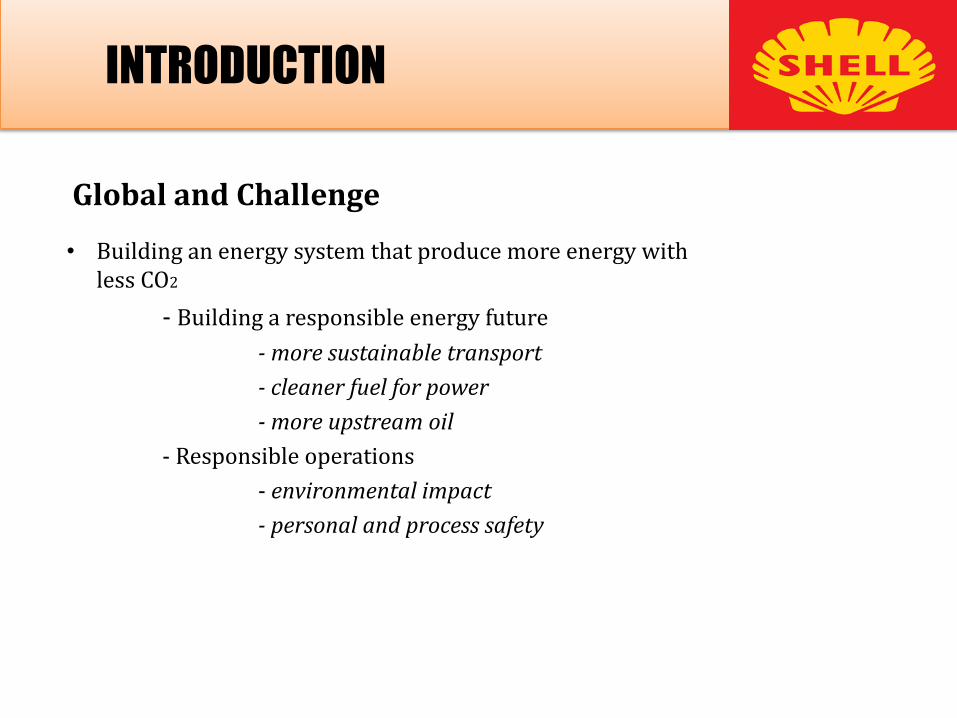
Global and Challenge
• Building an energy system that produce more energy with less CO2
- Building a responsible energy future
- more sustainable transport
- cleaner fuel for power
- more upstream oil
- Responsible operations
- environmental impact
- personal and process safety
INTRODUCTION
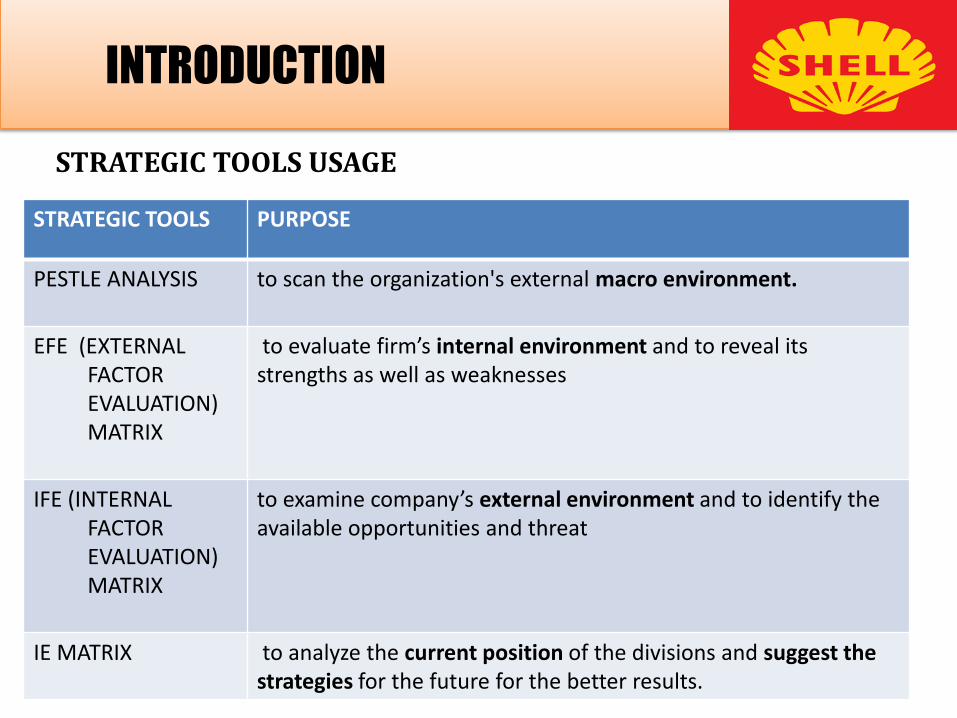
STRATEGIC TOOLS USAGE
INTRODUCTION
STRATEGIC TOOLS PURPOSE
PESTLE ANALYSIS to scan the organization's external macro environment.
EFE (EXTERNAL FACTOR EVALUATION) MATRIX
to evaluate firm’s internal environment and to reveal its strengths as well as weaknesses
IFE (INTERNAL FACTOR EVALUATION) MATRIX
to examine company’s external environment and to identify the available opportunities and threat
IE MATRIX to analyze the current position of the divisions and suggest the strategies for the future for the better results.
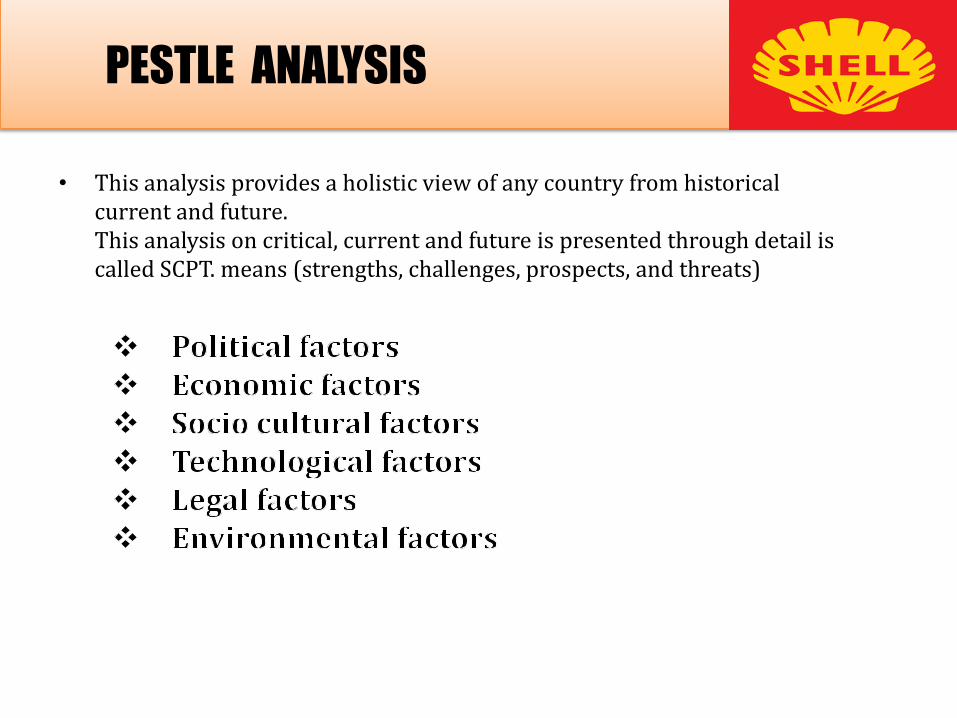
• This analysis provides a holistic view of any country from historical current and future.This analysis on critical, current and future is presented through detail is called SCPT. means (strengths, challenges, prospects, and threats)
PESTLE ANALYSIS
• Government policy and ideology-Economic Transformation Programme (“ETP”) – GNI to be USD15000 by 2020
-Strategic Reform Initiatives (“SRIs”)- Globally competitive-Performance Management and Delivery Unit (“PEMANDU”)- 20% revenue from Oil and gas
• Taxation and social insurance policy -Income Tax Act, 1974 (PITA) - 38%
• Social welfare policies • Foreign trade regulations and regulatory agencies
-Export duty of 10% Industrial Building AllowanceInfrastructure AllowanceTariff Related Incentives
• Business and economic growth cycles
• Interest rates
• Inflation rates,
• Average disposable income,
• Levels of unemployment and
• Deprivation
• Demographic trends
• Increased cultural diversity
• Distribution of income
• Social mobility
• Life style
• Education
• Employment law
• Health and safety legislation
• Regulatory systems and product safety rules
• Technology capabilities and computerisation
- Peninsular Gas Utilisation (PGU) project
• Automation
-Centralised utility facilities
- Supply of utilities such as power, industrial gases, water and steam
• Internet,
• Mobile phone technologies
• Environmental protection legislation
• Waste disposal policies
• Energy consumption regulations
- Environment Technology Park
Incorporating a training centre, a waste collection and processing centre as well as raw material management and storage facilities, maintenance and servicing facilities.
• Political section on Malaysia provides get the information about the whole political system governors indicators and all key figures in the country.
• From economic section we get all outlines of the economics stories of the country and is provides balanced between assessments on core macro economical issues.
• In social section of Malaysia country it enables understanding of consumer demographics by the income distribution, rural market and urban market segmentation health care and education scenario in country.
• Technological section provides all strategies information and communication of the technology, technological laws and policies, gapes patterns data also.
• In legal section we can get information about legal structure, corporate laws, business setup procedures and tax information
IFE & EFE Matrix
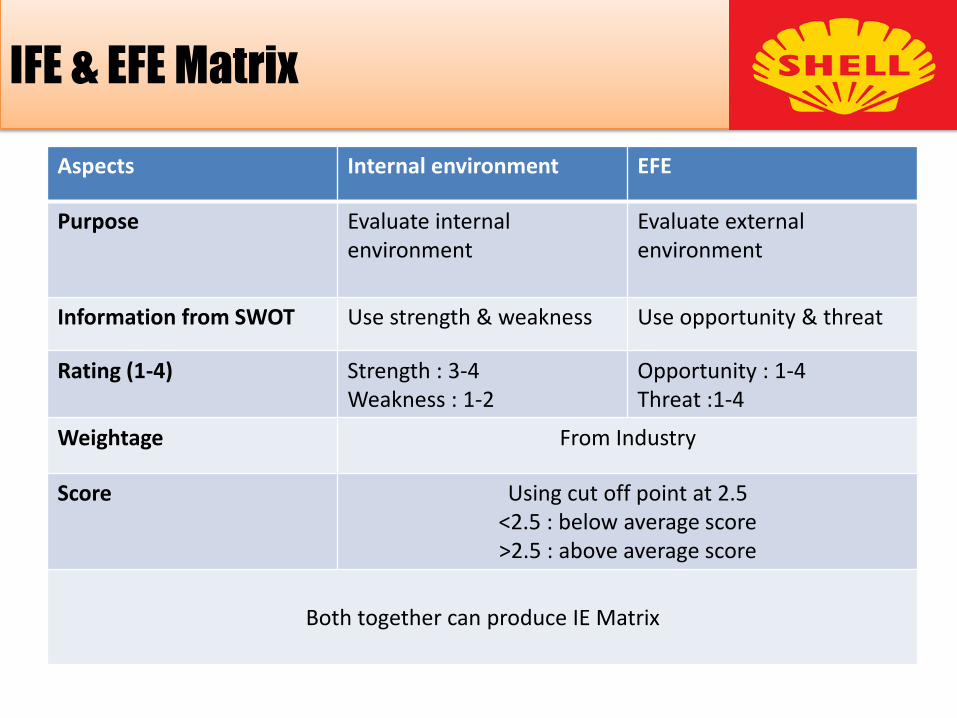
Aspects Internal environment EFE
Purpose Evaluate internalenvironment
Evaluate external environment
Information from SWOT Use strength & weakness Use opportunity & threat
Rating (1-4) Strength : 3-4Weakness : 1-2
Opportunity : 1-4Threat :1-4
Weightage From Industry
Score Using cut off point at 2.5<2.5 : below average score>2.5 : above average score
Both together can produce IE Matrix
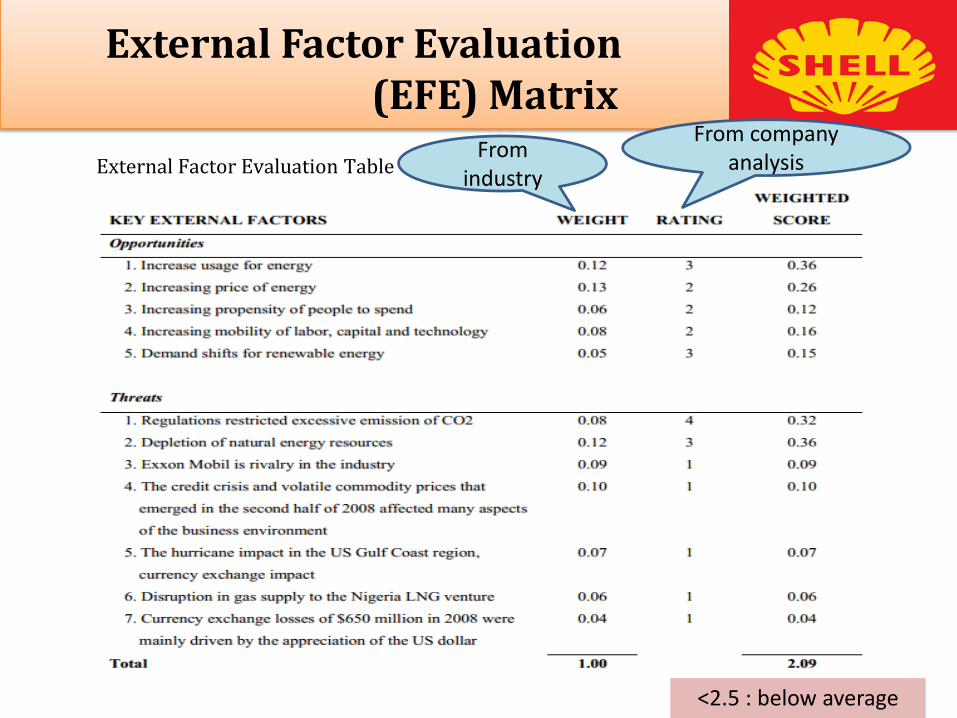
External Factor Evaluation (EFE) Matrix
External Factor Evaluation TableFrom
industry
From company analysis
<2.5 : below average
Internal Factor Evaluation (IFE) Matrix
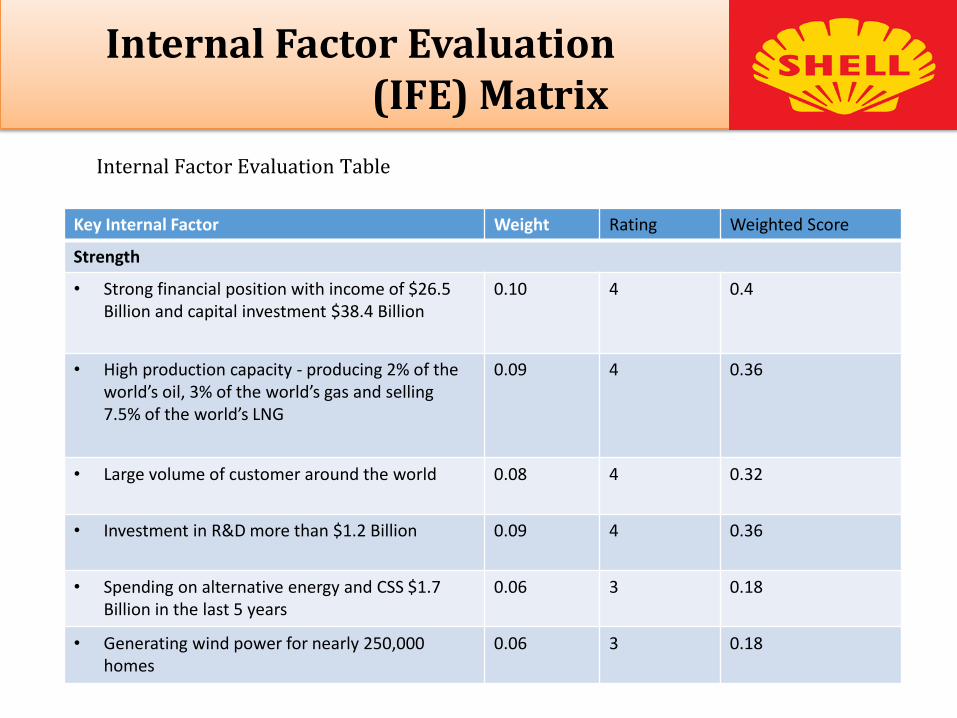
Internal Factor Evaluation Table
Key Internal Factor Weight Rating Weighted Score
Strength
• Strong financial position with income of $26.5 Billion and capital investment $38.4 Billion
0.10 4 0.4
• High production capacity - producing 2% of the world’s oil, 3% of the world’s gas and selling 7.5% of the world’s LNG
0.09 4 0.36
• Large volume of customer around the world 0.08 4 0.32
• Investment in R&D more than $1.2 Billion 0.09 4 0.36
• Spending on alternative energy and CSS $1.7 Billion in the last 5 years
0.06 3 0.18
• Generating wind power for nearly 250,000 homes
0.06 3 0.18
Internal Factor Evaluation (IFE) Matrix
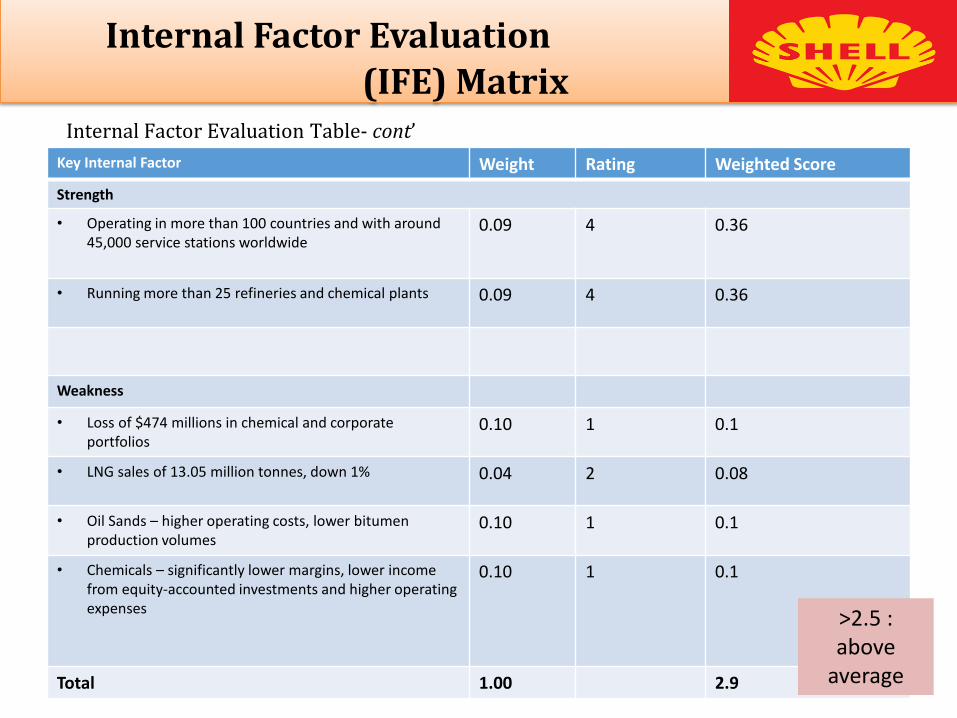
Internal Factor Evaluation Table- cont’
Key Internal Factor Weight Rating Weighted Score
Strength
• Operating in more than 100 countries and with around 45,000 service stations worldwide
0.09 4 0.36
• Running more than 25 refineries and chemical plants 0.09 4 0.36
Weakness
• Loss of $474 millions in chemical and corporate portfolios
0.10 1 0.1
• LNG sales of 13.05 million tonnes, down 1% 0.04 2 0.08
• Oil Sands – higher operating costs, lower bitumen production volumes
0.10 1 0.1
• Chemicals – significantly lower margins, lower income from equity-accounted investments and higher operating expenses
0.10 1 0.1
Total 1.00 2.9
>2.5 : above
average
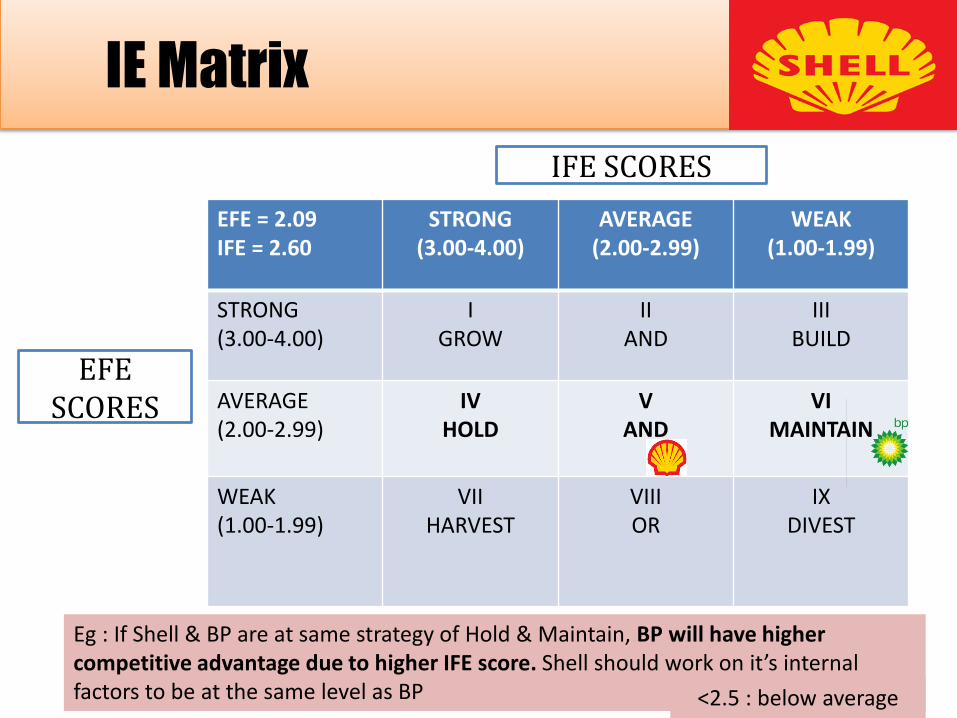
IE Matrix
EFE = 2.09IFE = 2.60
STRONG (3.00-4.00)
AVERAGE(2.00-2.99)
WEAK(1.00-1.99)
STRONG (3.00-4.00)
IGROW
IIAND
IIIBUILD
AVERAGE(2.00-2.99)
IVHOLD
VAND
VIMAINTAIN
WEAK(1.00-1.99)
VIIHARVEST
VIIIOR
IXDIVEST
IFE SCORES
EFE SCORES
Eg : If Shell & BP are at same strategy of Hold & Maintain, BP will have higher competitive advantage due to higher IFE score. Shell should work on it’s internal factors to be at the same level as BP <2.5 : below average
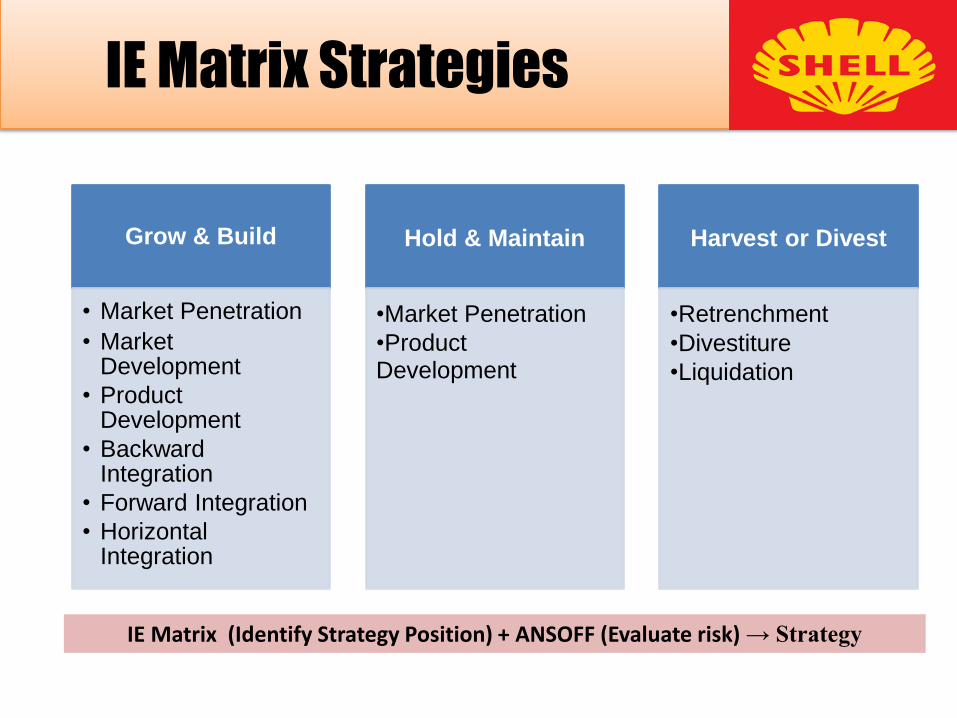
IE Matrix Strategies
Grow & Build
• Market Penetration
• Market Development
• Product Development
• Backward Integration
• Forward Integration
• Horizontal Integration
Hold & Maintain
•Market Penetration
•Product Development
Harvest or Divest
•Retrenchment
•Divestiture
•Liquidation
IE Matrix (Identify Strategy Position) + ANSOFF (Evaluate risk) → Strategy
CONCLUSION
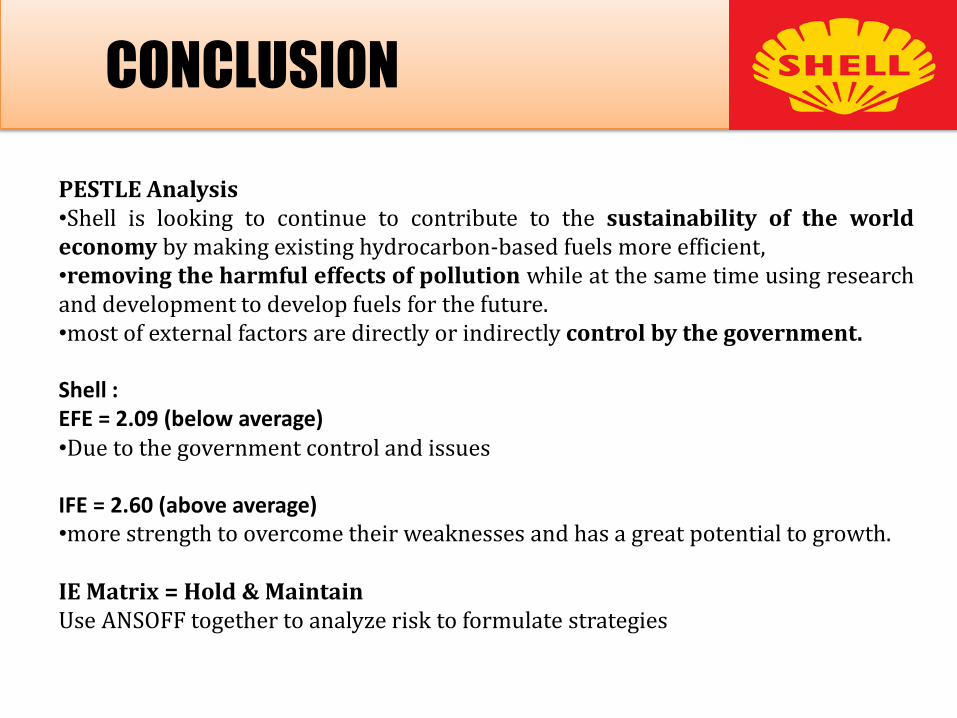
PESTLE Analysis•Shell is looking to continue to contribute to the sustainability of the worldeconomy by making existing hydrocarbon-based fuels more efficient,•removing the harmful effects of pollution while at the same time using researchand development to develop fuels for the future.•most of external factors are directly or indirectly control by the government.
Shell :EFE = 2.09 (below average)•Due to the government control and issues
IFE = 2.60 (above average)•more strength to overcome their weaknesses and has a great potential to growth.
IE Matrix = Hold & MaintainUse ANSOFF together to analyze risk to formulate strategies
References
1. Royal Dutch Shell Plc Annual Review and Summary Financial Statements 2008
2. Royal Dutch Shell Plc Sustainability Report 2008
3. Fred R. David, Strategic Management concepts and cases, 2007, 11th Edition, Pearson Education International
Related Documents