13 th World Conference on Earthquake Engineering Vancouver, B.C., Canada August 1-6, 2004 Paper No. 2104 GROUND RESPONSE ANALYSIS FOR SEISMIC DESIGN IN FRASER RIVER DELTA, BRITISH COLUMBIA Uthaya M. UTHAYAKUMAR 1 and Ernest NAESGAARD 1 SUMMARY Major changes to the seismic design provisions have been proposed for the 2005 edition of the National Building Code of Canada. The changes include: increase of return period; seismic hazard in terms of spectral acceleration; period dependent site effects and classification; force reduction factors and method of analysis. The Fraser River delta, which lies within an active seismic area, is composed of a thick sequence of unconsolidated silts, sands and clayey silts overlying dense to very dense Pleistocene glacial sediments. This paper presents the results of the ground response analysis for four sites in the delta with firm ground depth of 30 m, 50 m, 150 m and 300 m. The results indicate significant amplification of the earthquake motions for all four sites for periods longer than 0.2 second. INTRODUCTION Major changes to the seismic design provisions have been proposed for the 2005 edition of the National Building Code of Canada (NBCC 2005). The changes include: increase of return period form 475 years to 2500 years; seismic hazard in terms of spectral acceleration; period dependent site effects and classification; force reduction factors and method of analysis (Heidebrcht [1]). The current National Building Code of Canada, NBCC 1995 [2] specifies seismic hazard in terms of Peak Ground Acceleration (PGA) and Peak Ground Velocity (PGV). Period dependent site effects and classification are not clearly defined in NBCC 1995. Seismic hazard in the proposed NBCC 2005 is defined by PGA and spectral accelerations at periods of 0.2, 0.5, 1.0 and 2.0 seconds. The above noted PGAs and spectral accelerations are defined for “firm ground” conditions. “Firm ground” is defined as the layer of soils comprising very dense soil or soft rock with a shear wave velocity of 360 m/s to 760 m/s (Finn [3], Adams [4]). The proposed changes from NBCC 1995 to 2005 include an increase of firm ground PGA from 0.23g to 0.5g for sites in Richmond, which is located within the Fraser River delta. g is the acceleration of gravity. The Fraser River delta, which lies within an active seismic area, is one of the heavily populated areas in western Canada. Several high rise buildings, hospitals, Vancouver International Airport, a ferry terminal, port facilities, high-tech buildings, industrial plants, schools and major transportation networks, including 1 Trow Associates Inc., 7025 Greenwood Street, Burnaby, B.C., Canada, V5A 1X7. [email protected]

Welcome message from author
This document is posted to help you gain knowledge. Please leave a comment to let me know what you think about it! Share it to your friends and learn new things together.
Transcript
13th World Conference on Earthquake Engineering Vancouver, B.C., Canada
August 1-6, 2004 Paper No. 2104
GROUND RESPONSE ANALYSIS FOR SEISMIC DESIGN IN FRASER RIVER DELTA, BRITISH COLUMBIA
Uthaya M. UTHAYAKUMAR1 and Ernest NAESGAARD1
SUMMARY Major changes to the seismic design provisions have been proposed for the 2005 edition of the National Building Code of Canada. The changes include: increase of return period; seismic hazard in terms of spectral acceleration; period dependent site effects and classification; force reduction factors and method of analysis. The Fraser River delta, which lies within an active seismic area, is composed of a thick sequence of unconsolidated silts, sands and clayey silts overlying dense to very dense Pleistocene glacial sediments. This paper presents the results of the ground response analysis for four sites in the delta with firm ground depth of 30 m, 50 m, 150 m and 300 m. The results indicate significant amplification of the earthquake motions for all four sites for periods longer than 0.2 second.
INTRODUCTION Major changes to the seismic design provisions have been proposed for the 2005 edition of the National Building Code of Canada (NBCC 2005). The changes include: increase of return period form 475 years to 2500 years; seismic hazard in terms of spectral acceleration; period dependent site effects and classification; force reduction factors and method of analysis (Heidebrcht [1]). The current National Building Code of Canada, NBCC 1995 [2] specifies seismic hazard in terms of Peak Ground Acceleration (PGA) and Peak Ground Velocity (PGV). Period dependent site effects and classification are not clearly defined in NBCC 1995. Seismic hazard in the proposed NBCC 2005 is defined by PGA and spectral accelerations at periods of 0.2, 0.5, 1.0 and 2.0 seconds. The above noted PGAs and spectral accelerations are defined for “firm ground” conditions. “Firm ground” is defined as the layer of soils comprising very dense soil or soft rock with a shear wave velocity of 360 m/s to 760 m/s (Finn [3], Adams [4]). The proposed changes from NBCC 1995 to 2005 include an increase of firm ground PGA from 0.23g to 0.5g for sites in Richmond, which is located within the Fraser River delta. g is the acceleration of gravity. The Fraser River delta, which lies within an active seismic area, is one of the heavily populated areas in western Canada. Several high rise buildings, hospitals, Vancouver International Airport, a ferry terminal, port facilities, high-tech buildings, industrial plants, schools and major transportation networks, including
1 Trow Associates Inc., 7025 Greenwood Street, Burnaby, B.C., Canada, V5A 1X7. [email protected]

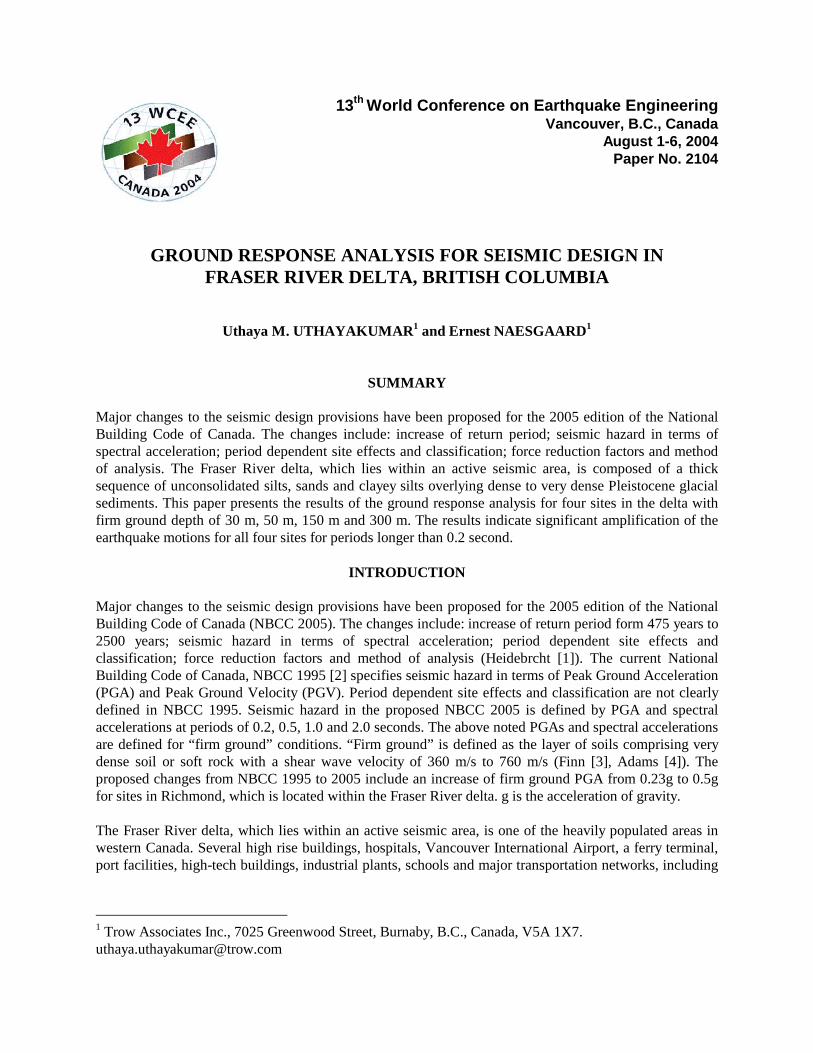
several major bridges and the immersed tube George Massey Tunnel, several sewer treatment plants, and dykes are located within the delta. The Fraser River delta is a geologically young feature, formed since the end of the last glaciation about 10,000 years ago. The delta is underlain by thick Quaternary sediments and Tertiary sedimentary rocks separated by an unconformity with up to 800 m relief (Clague, [5]). The Pleistocene sediments are overlain by up to 300 m thick Holocene deltaic deposits. The deltaic deposits consists of clayey silt overlain by interbedded clayey silt and silty sand, which is overlain by a layer of 10 m to 30 m thick sands. The sand is overlain by several metres of floodplain silts and peat. Fig. 1 shows the extent of the delta in plan and Fig. 2 shows a typical cross section across the delta in the north-south direction. Previous ground response analyses using firm ground PGA of 0.035g to 0.21g have indicated that significant ground motion amplification would occur within certain areas of the delta when the earthquake induced shear waves propagate through the above noted deltaic soils (Harris [6], Sy [7], Byrne and Anderson [8]). From a study of the earthquake records obtained within the delta, Cassidy and Rogers [9] report that small level shaking from moderate earthquakes could be amplified 2 to 6 times relative to firm ground sites. Response of the Fraser River delta sediments for larger level shaking, such as with firm ground PGA of 0.5g is not known. This paper presents the results of ground response analysis obtained for firm ground PGA of 0.5g. For comparison results from analyses with firm ground PGA of 0.23g are also presented. Four sites within the delta with firm ground depths of 30 m, 50 m, 150 m and 300 m were considered. The computer program SHAKE91 (Idriss [10]) was used for the analysis.
GROUND RESPONSE ANALYSIS Ground response analyses were carried out for four sites, named as Sites A, B, C and D. The locations of the sites are shown in Figs. 1 and 2. The Site A is located near the Richmond City Hall at No. 3 Road and Granville Avenue, the Sites C and D are located near the Oak Street Bridge south approach. Site B is located between the Sites A and C with an assumed firm ground depth as described below. Description of soil conditions at the four sites are given below:
Site A: Data from the Geological Survey of Canada’s deep test hole TH96-01 (Dallimore [11]) and other shallow test holes was utilized for the study of this site. Soil profile at this site consist of an approximately metre thick silty sand fill, followed by a 3 m thick clayey silt layer, overlying a 17 m thick sand layer. Below the sand layer is approximately 280 m thick clayey silt, with occasional thin sandy silt and sandy layers, extending to the Pleistocene sediments. Natural moisture content of the clayey silt varied from 20% to 45% with the majority of the data falling between 28% to 35% range. Plasticity Index varied from 8 to 24 for the upper 275 m and varied from 34 to 37 for the bottom 25 m of the clayey silt layer. Site B: Soil profile at Site B is similar to that at Site A except that the firm ground (Pleistocene sediments) is assumed to be at 150 m depth. Site C: Soil profile at Site C consist of a metre thick sand layer, followed by approximately 2 m thick clayey silt overlying an approximately 15 m thick sand layer. Below this sand layer, a 35 m thick clayey silt layer, extending to the top of the Pleistocene till-like soils is noted (Macleod [13]). Natural moisture content of the clayey silt overlying the sand was in the range of 32 to 38 %. Plasticity Index for the upper clayey silt was found to be about 9 from one sample.
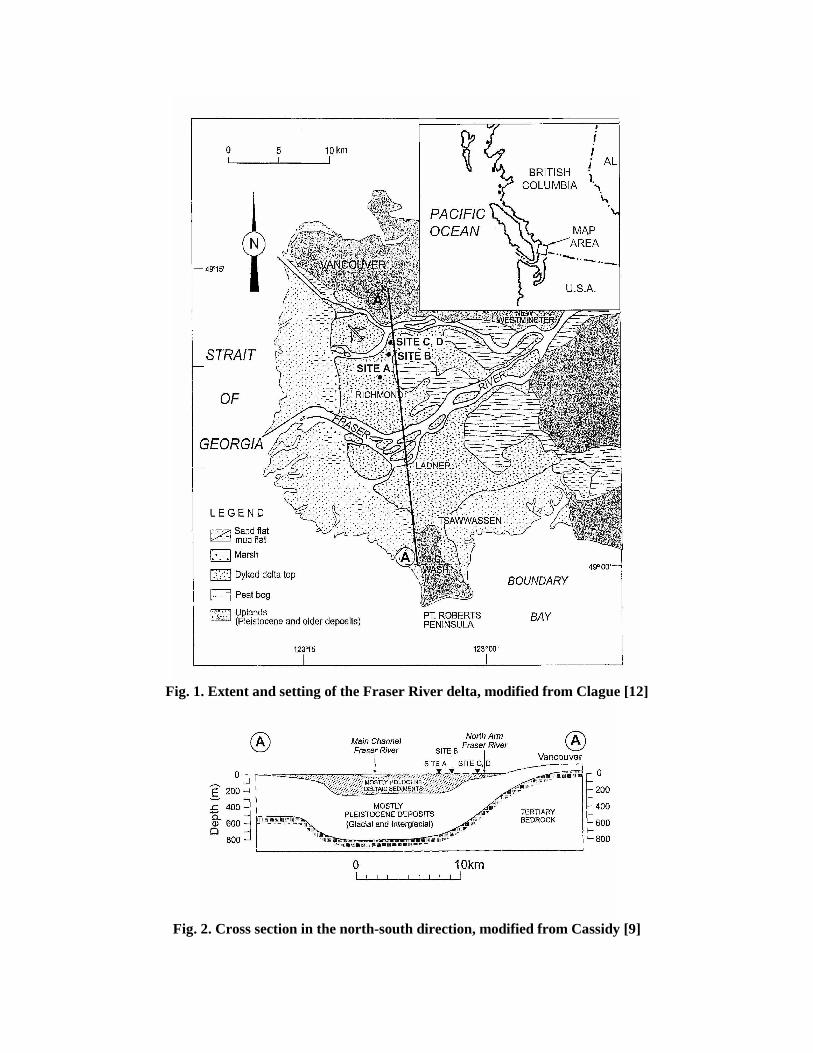
Fig. 1. Extent and setting of the Fraser River delta, modified from Clague [12]
Fig. 2. Cross section in the north-south direction, modified from Cassidy [9]
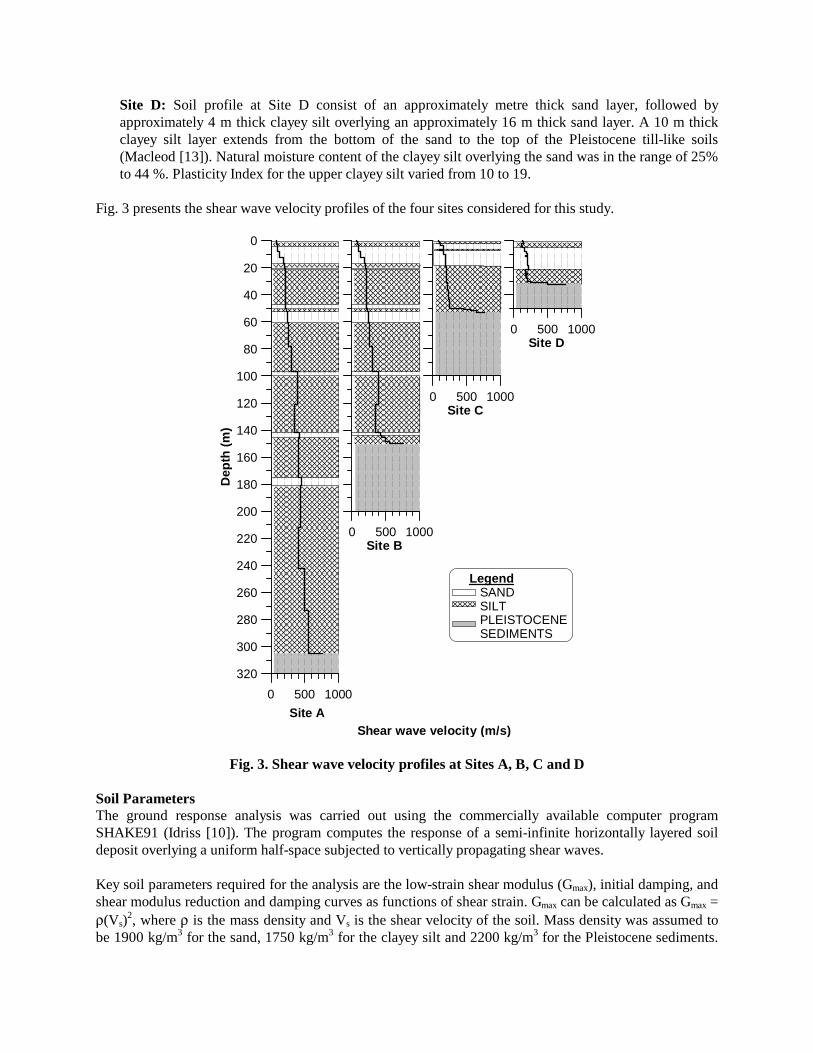
Site D: Soil profile at Site D consist of an approximately metre thick sand layer, followed by approximately 4 m thick clayey silt overlying an approximately 16 m thick sand layer. A 10 m thick clayey silt layer extends from the bottom of the sand to the top of the Pleistocene till-like soils (Macleod [13]). Natural moisture content of the clayey silt overlying the sand was in the range of 25% to 44 %. Plasticity Index for the upper clayey silt varied from 10 to 19.
Fig. 3 presents the shear wave velocity profiles of the four sites considered for this study.
0 500 1000
Shear wave velocity (m/s)
320
300
280
260
240
220
200
180
160
140
120
100
80
60
40
20
0D
epth
(m
)
0 500 1000Site B
0 500 1000Site C
0 500 1000Site D
Legend SAND SILT PLEISTOCENE SEDIMENTS
Site A
Fig. 3. Shear wave velocity profiles at Sites A, B, C and D Soil Parameters The ground response analysis was carried out using the commercially available computer program SHAKE91 (Idriss [10]). The program computes the response of a semi-infinite horizontally layered soil deposit overlying a uniform half-space subjected to vertically propagating shear waves. Key soil parameters required for the analysis are the low-strain shear modulus (Gmax), initial damping, and shear modulus reduction and damping curves as functions of shear strain. Gmax can be calculated as Gmax = ρ(Vs)
2, where ρ is the mass density and Vs is the shear velocity of the soil. Mass density was assumed to be 1900 kg/m3 for the sand, 1750 kg/m3 for the clayey silt and 2200 kg/m3 for the Pleistocene sediments.
Top of the Pleistocene sediments (also referred to as Firm Ground) was assumed as the elastic half space. Shear wave velocity profiles of the four sites are shown in Fig. 3. The following assumptions were made with regard to shear modulus reduction and damping curves:
1. shear modulus reduction curve for sand was assumed as the upper bound curve of Seed [14]; 2. damping curve for sand was assumed as the lower bound of Seed [14]; 3. shear modulus reduction and damping curves for clayey silt were assumed to be the curves
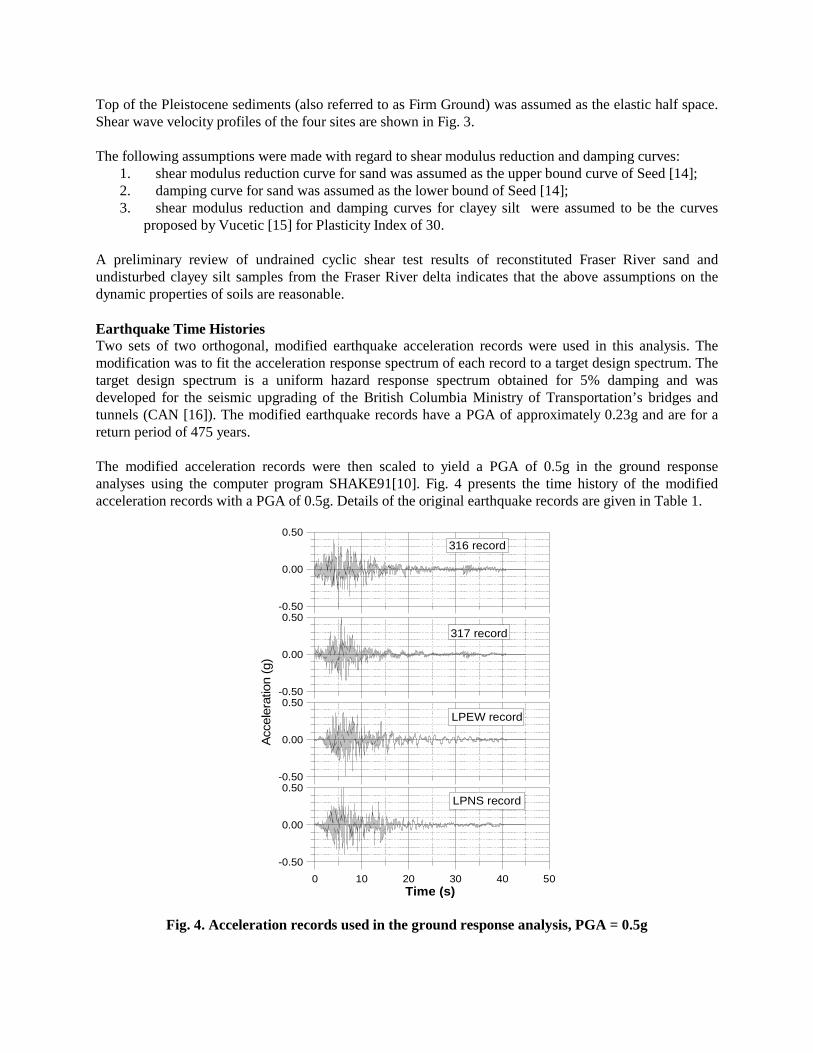
proposed by Vucetic [15] for Plasticity Index of 30. A preliminary review of undrained cyclic shear test results of reconstituted Fraser River sand and undisturbed clayey silt samples from the Fraser River delta indicates that the above assumptions on the dynamic properties of soils are reasonable. Earthquake Time Histories Two sets of two orthogonal, modified earthquake acceleration records were used in this analysis. The modification was to fit the acceleration response spectrum of each record to a target design spectrum. The target design spectrum is a uniform hazard response spectrum obtained for 5% damping and was developed for the seismic upgrading of the British Columbia Ministry of Transportation’s bridges and tunnels (CAN [16]). The modified earthquake records have a PGA of approximately 0.23g and are for a return period of 475 years. The modified acceleration records were then scaled to yield a PGA of 0.5g in the ground response analyses using the computer program SHAKE91[10]. Fig. 4 presents the time history of the modified acceleration records with a PGA of 0.5g. Details of the original earthquake records are given in Table 1.
-0.50
0.00
0.50
-0.50
0.00
0.50
-0.50
0.00
0.50
Acc
eler
atio
n (g
)
0 10 20 30 40 50Time (s)
-0.50
0.00
0.50
316 record
317 record
LPEW record
LPNS record
Fig. 4. Acceleration records used in the ground response analysis, PGA = 0.5g
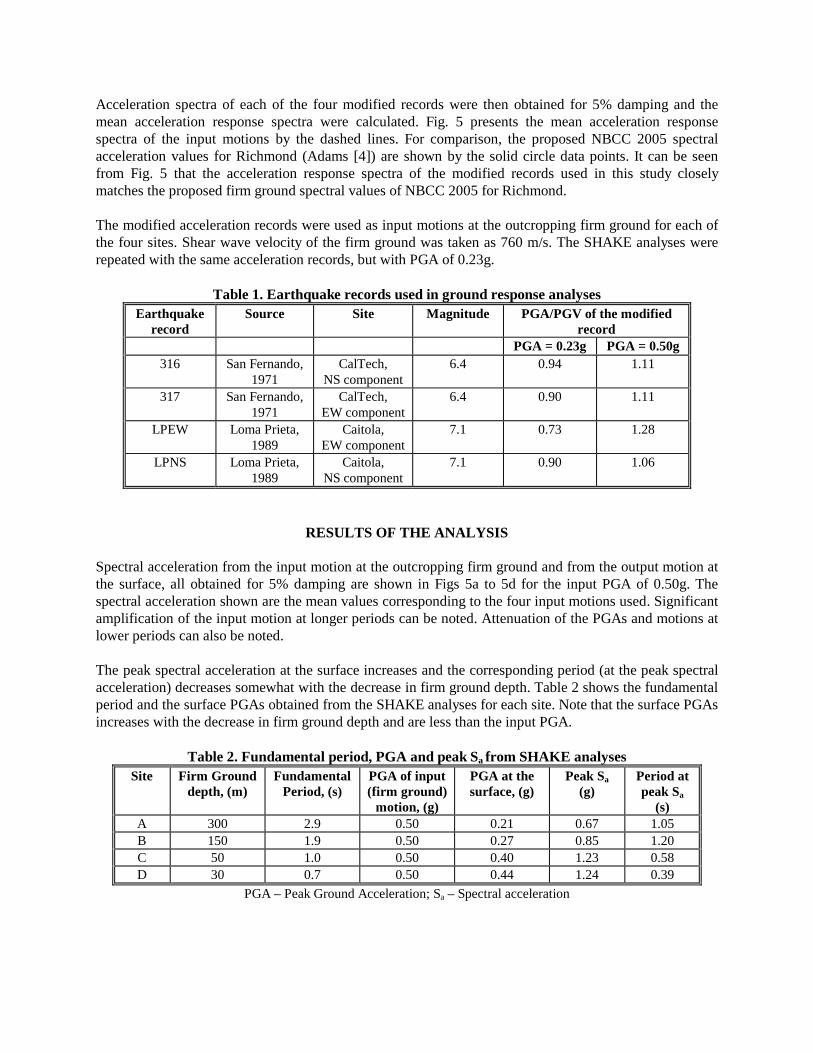
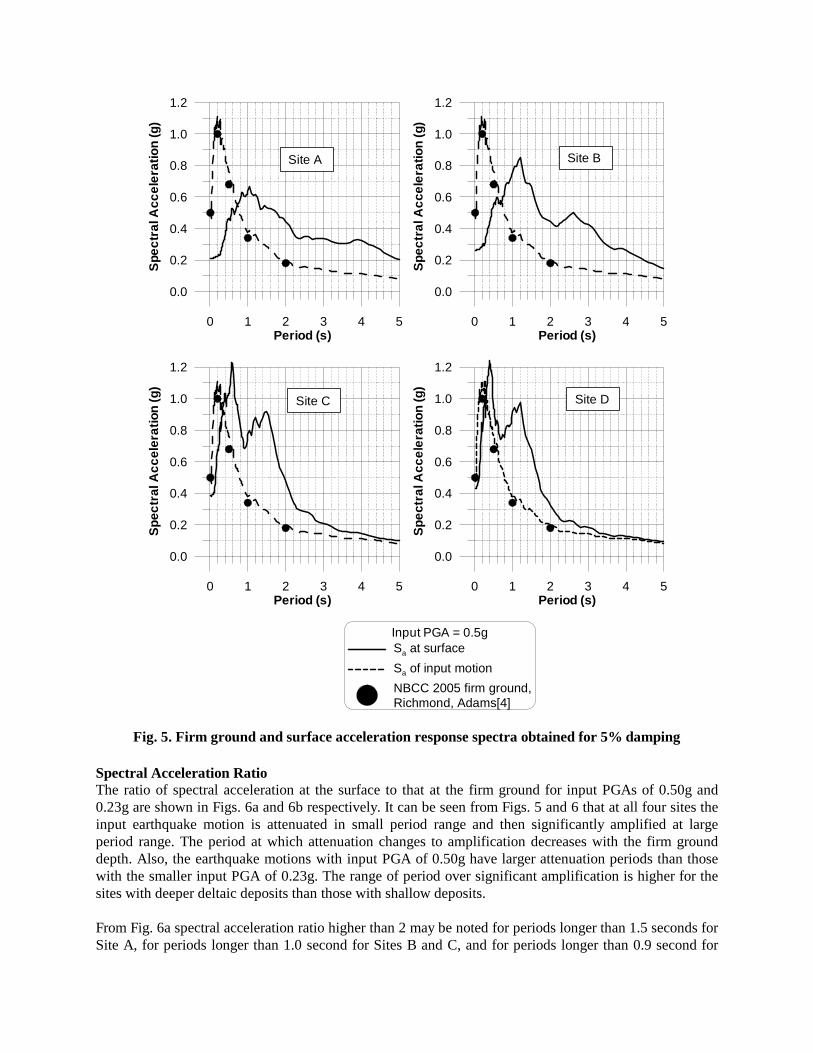
Acceleration spectra of each of the four modified records were then obtained for 5% damping and the mean acceleration response spectra were calculated. Fig. 5 presents the mean acceleration response spectra of the input motions by the dashed lines. For comparison, the proposed NBCC 2005 spectral acceleration values for Richmond (Adams [4]) are shown by the solid circle data points. It can be seen from Fig. 5 that the acceleration response spectra of the modified records used in this study closely matches the proposed firm ground spectral values of NBCC 2005 for Richmond. The modified acceleration records were used as input motions at the outcropping firm ground for each of the four sites. Shear wave velocity of the firm ground was taken as 760 m/s. The SHAKE analyses were repeated with the same acceleration records, but with PGA of 0.23g.
Table 1. Earthquake records used in ground response analyses Earthquake
record Source Site Magnitude PGA/PGV of the modified
record PGA = 0.23g PGA = 0.50g
316 San Fernando, 1971
CalTech, NS component
6.4 0.94 1.11
317 San Fernando, 1971
CalTech, EW component
6.4 0.90 1.11
LPEW Loma Prieta, 1989
Caitola, EW component
7.1 0.73 1.28
LPNS Loma Prieta, 1989
Caitola, NS component
7.1 0.90 1.06
RESULTS OF THE ANALYSIS Spectral acceleration from the input motion at the outcropping firm ground and from the output motion at the surface, all obtained for 5% damping are shown in Figs 5a to 5d for the input PGA of 0.50g. The spectral acceleration shown are the mean values corresponding to the four input motions used. Significant amplification of the input motion at longer periods can be noted. Attenuation of the PGAs and motions at lower periods can also be noted. The peak spectral acceleration at the surface increases and the corresponding period (at the peak spectral acceleration) decreases somewhat with the decrease in firm ground depth. Table 2 shows the fundamental period and the surface PGAs obtained from the SHAKE analyses for each site. Note that the surface PGAs increases with the decrease in firm ground depth and are less than the input PGA.
Table 2. Fundamental period, PGA and peak Sa from SHAKE analyses Site Firm Ground
depth, (m) Fundamental
Period, (s) PGA of input (firm ground)
motion, (g)
PGA at the surface, (g)
Peak Sa (g)
Period at peak Sa
(s) A 300 2.9 0.50 0.21 0.67 1.05 B 150 1.9 0.50 0.27 0.85 1.20 C 50 1.0 0.50 0.40 1.23 0.58 D 30 0.7 0.50 0.44 1.24 0.39
PGA – Peak Ground Acceleration; Sa – Spectral acceleration
0 1 2 3 4 5Period (s)
0.0
0.2
0.4
0.6
0.8
1.0
1.2
Spe
ctra
l Acc
eler
atio
n (g
)Site A
0 1 2 3 4 5Period (s)
0.0
0.2
0.4
0.6
0.8
1.0
1.2
Spe
ctra
l Acc
eler
atio
n (g
)
Site B
0 1 2 3 4 5Period (s)
0.0
0.2
0.4
0.6
0.8
1.0
1.2
Spe
ctra
l Acc
eler
atio
n (g
)
0 1 2 3 4 5Period (s)
0.0
0.2
0.4
0.6
0.8
1.0
1.2
Spe
ctra
l Acc
eler
atio
n (g
)
Input PGA = 0.5gSa at surface
Sa of input motion
NBCC 2005 firm ground,Richmond, Adams[4]
Site C Site D
Fig. 5. Firm ground and surface acceleration response spectra obtained for 5% damping Spectral Acceleration Ratio The ratio of spectral acceleration at the surface to that at the firm ground for input PGAs of 0.50g and 0.23g are shown in Figs. 6a and 6b respectively. It can be seen from Figs. 5 and 6 that at all four sites the input earthquake motion is attenuated in small period range and then significantly amplified at large period range. The period at which attenuation changes to amplification decreases with the firm ground depth. Also, the earthquake motions with input PGA of 0.50g have larger attenuation periods than those with the smaller input PGA of 0.23g. The range of period over significant amplification is higher for the sites with deeper deltaic deposits than those with shallow deposits. From Fig. 6a spectral acceleration ratio higher than 2 may be noted for periods longer than 1.5 seconds for Site A, for periods longer than 1.0 second for Sites B and C, and for periods longer than 0.9 second for
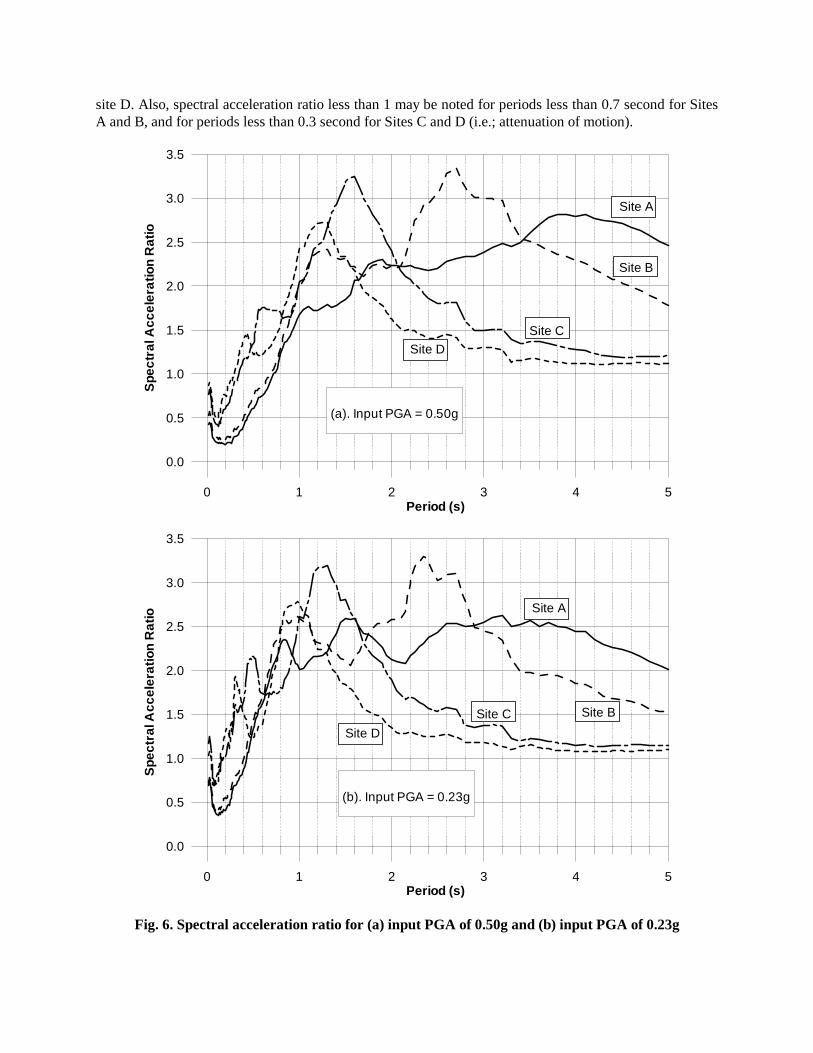
site D. Also, spectral acceleration ratio less than 1 may be noted for periods less than 0.7 second for Sites A and B, and for periods less than 0.3 second for Sites C and D (i.e.; attenuation of motion).
0 1 2 3 4 5Period (s)
0.0
0.5
1.0
1.5
2.0
2.5
3.0
3.5S
pec
tral
Acc
ele
ratio
n R
atio
(a). Input PGA = 0.50g
Site C
Site A
Site D
Site B
0 1 2 3 4 5Period (s)
0.0
0.5
1.0
1.5
2.0
2.5
3.0
3.5
Spe
ctra
l Acc
eler
atio
n R
atio
(b). Input PGA = 0.23g
Site C
Site A
Site D
Site B
Fig. 6. Spectral acceleration ratio for (a) input PGA of 0.50g and (b) input PGA of 0.23g
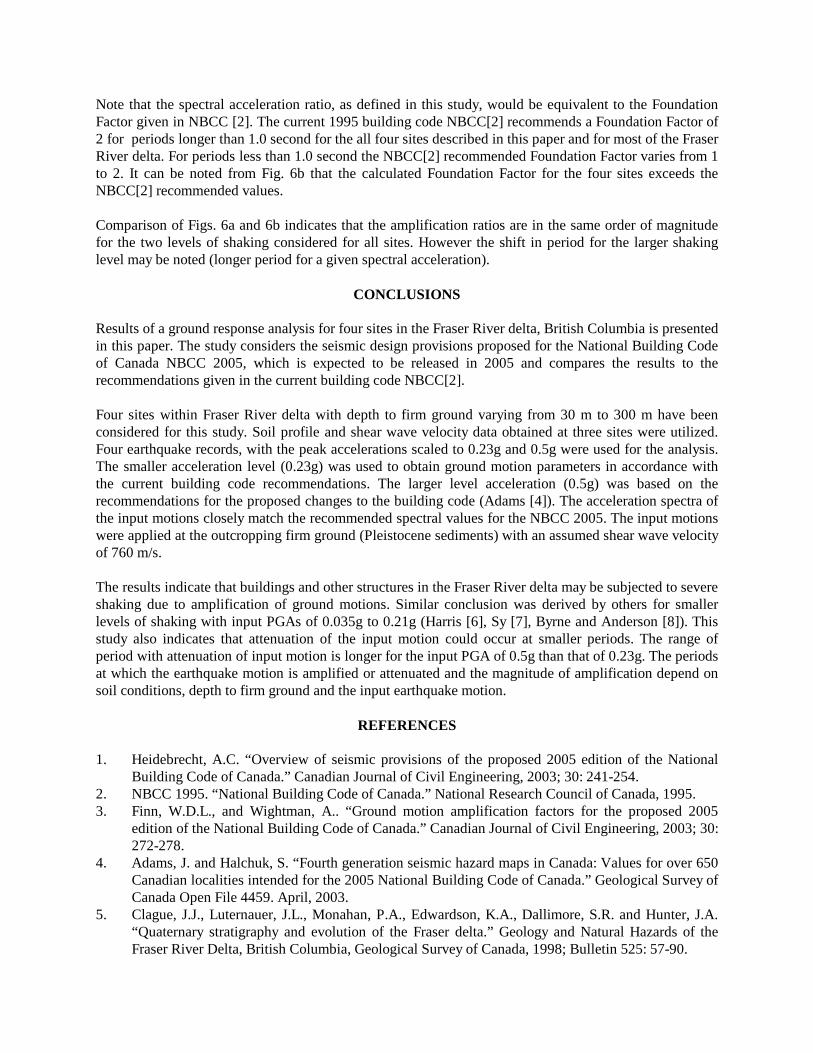
Note that the spectral acceleration ratio, as defined in this study, would be equivalent to the Foundation Factor given in NBCC [2]. The current 1995 building code NBCC[2] recommends a Foundation Factor of 2 for periods longer than 1.0 second for the all four sites described in this paper and for most of the Fraser River delta. For periods less than 1.0 second the NBCC[2] recommended Foundation Factor varies from 1 to 2. It can be noted from Fig. 6b that the calculated Foundation Factor for the four sites exceeds the NBCC[2] recommended values. Comparison of Figs. 6a and 6b indicates that the amplification ratios are in the same order of magnitude for the two levels of shaking considered for all sites. However the shift in period for the larger shaking level may be noted (longer period for a given spectral acceleration).
CONCLUSIONS Results of a ground response analysis for four sites in the Fraser River delta, British Columbia is presented in this paper. The study considers the seismic design provisions proposed for the National Building Code of Canada NBCC 2005, which is expected to be released in 2005 and compares the results to the recommendations given in the current building code NBCC[2]. Four sites within Fraser River delta with depth to firm ground varying from 30 m to 300 m have been considered for this study. Soil profile and shear wave velocity data obtained at three sites were utilized. Four earthquake records, with the peak accelerations scaled to 0.23g and 0.5g were used for the analysis. The smaller acceleration level (0.23g) was used to obtain ground motion parameters in accordance with the current building code recommendations. The larger level acceleration (0.5g) was based on the recommendations for the proposed changes to the building code (Adams [4]). The acceleration spectra of the input motions closely match the recommended spectral values for the NBCC 2005. The input motions were applied at the outcropping firm ground (Pleistocene sediments) with an assumed shear wave velocity of 760 m/s. The results indicate that buildings and other structures in the Fraser River delta may be subjected to severe shaking due to amplification of ground motions. Similar conclusion was derived by others for smaller levels of shaking with input PGAs of 0.035g to 0.21g (Harris [6], Sy [7], Byrne and Anderson [8]). This study also indicates that attenuation of the input motion could occur at smaller periods. The range of period with attenuation of input motion is longer for the input PGA of 0.5g than that of 0.23g. The periods at which the earthquake motion is amplified or attenuated and the magnitude of amplification depend on soil conditions, depth to firm ground and the input earthquake motion.
REFERENCES 1. Heidebrecht, A.C. “Overview of seismic provisions of the proposed 2005 edition of the National
Building Code of Canada.” Canadian Journal of Civil Engineering, 2003; 30: 241-254. 2. NBCC 1995. “National Building Code of Canada.” National Research Council of Canada, 1995. 3. Finn, W.D.L., and Wightman, A.. “Ground motion amplification factors for the proposed 2005
edition of the National Building Code of Canada.” Canadian Journal of Civil Engineering, 2003; 30: 272-278.
4. Adams, J. and Halchuk, S. “Fourth generation seismic hazard maps in Canada: Values for over 650 Canadian localities intended for the 2005 National Building Code of Canada.” Geological Survey of Canada Open File 4459. April, 2003.
5. Clague, J.J., Luternauer, J.L., Monahan, P.A., Edwardson, K.A., Dallimore, S.R. and Hunter, J.A. “Quaternary stratigraphy and evolution of the Fraser delta.” Geology and Natural Hazards of the Fraser River Delta, British Columbia, Geological Survey of Canada, 1998; Bulletin 525: 57-90.
6. Harris, J.B., Hunter, J.A., Luternauer, J.L., and Finn, W.D.L. “Site amplification modeling of the Fraser delta, British Columbia.” Proceedings of the 48th Canadian Geotechnical Conference, Vancouver, British Columbia. Sept. 25-27, 1995; 2: 947-954.
7. Sy, A., Henderson, P.W., Lo, R.C., Siu, D.Y., Finn, W.D.L. and Heidebrecht, A.C. “Ground motion repose for the Fraser delta, British Columbia.” Proceedings of the 4th International Conference on Seismic Zonation, Stanford, California. 1991; 2: 343-350.
8. Byrne, P.M. and Anderson, D. L. “Earthquake design in Richmond, B.C., Version II.” Soil Mechanics Series No. 109, Department of Civil Engineering, University of British Columbia, Vancouver, British Columbia. 1987.
9. Casidy, J. F. and Rogers, G.C. “Seismic site response in the Greater Vancouver, British Columbia area: spectral ratios from moderate earthquakes”. Canadian Geotechnical Journal. 1999; 36: 195-209.
10. Idriss, I.M. and Sun, J.I. “SHAKE91. A computer program for conducting equivalent linear seismic response analyses of horizontally layered soil deposits.” Program modified based on the original SHAKE program by Schnabel, Lysmer and Seed. Department of Civil & Environmental Engineering, University of California, Davis, California. November, 1992.
11. Dallimore, S.R., Edwardson, K.A., Hunter, J.A., Meldrum, J.L., Luternauer, J.L. and Clague, J.J. “Lithologic, geotechnical and geophysical logs for a deep borehole at Richmond City Hall, British Columbia.” Geological Survey of Canada Open File Report 3356. 1996.
12. Clague, J.J. “Geologic setting of the Fraser River delta.” Geology and Natural Hazards of the Fraser River Delta, British Columbia, Geological Survey of Canada, 1998; Bulletin 525: 7-16.
13. Macleod Geotechnical Ltd. “Seismic safety retrofit of Oak Street Bridge, Final Geotechnical report.” Report prepared for the British Columbia Ministry of Transportation. October 1994.
14. Seed, H.B., Wong, R.T., Idriss, I.M. and Tokimatsu, K. “Soil moduli and damping factors for dynamic analyses of cohesionless soils” Journal of Geotechnical Engineering, 1986; 112(11): 1016-1032.
15. Vucetic, M. and Dobry, R. “Effect of soil plasticity on cyclic response.” Journal of Geotechnical Engineering, 1991; 117(1): 89-107.
16. CAN, “Internal report to the B.C. Ministry of Transportation by Cherry, Nathan and Anderson for the Seismic Upgrading of Pitt River Bridges”, 1999.
Related Documents


