TEAM 3 PRESENTS:

Grolsch: Growing Globally Case Analysis
Aug 17, 2015
Welcome message from author
This document is posted to help you gain knowledge. Please leave a comment to let me know what you think about it! Share it to your friends and learn new things together.
Transcript

TEAM 3 PRESENTS:

ABOUT US1
The brewing industry has failed to keep pace with the changes in consumers’ preferences for drinks.
This has created a mainstream category that is under pressure from other drinks.
Grolsch believes in the strength of beer in the drinks market.
VISION MISSIONGrolsch is going to break through the mainstream and restore beer’s premium status.

PRODUCT LINE22
GROLSCH PREMIUM LAGER
SWINGTOP BOTTLE
NEWBOTTLE
CANS
OTHER PRODUCTS
AMBER ALEPREMIUM
WEIZENPREMIUM BLONDE
AMSTERDAM RANGE

HISTORY3
Willem Neerfedlt purchases a brewery in the Dutch town of Groenlo, near the German border.
1615
Grolsch’s iconic – and trademarked – ceramic swingtop bottle, which was advertised as easy to open and allowing storage of beer for later consumption.
1897
1922
Family members agree to an IPO on the Amsterdam Stock Exchange, brining a non-family member into management for the first time in history.
1984
Groslch merges operations with a nearby brewery in Enschede, but retains Grolsch as the brewery’s principal brand.
1995
Dutch government honors Grolsch with the coveted ‘Royal’ title, renamed as Royal Grolsch N.V..
Begin building a modern brewery, which, after disruptions and disturbances, started up in 2004.
1998
2007
SABMiller, the world’s 2nd largest brewer, announces friendly takeover of Royal Grolsch N.V. of the Netherlands.

REASSESSING GLOBAL STRATEGY4
Historically focused on developed markets i.e. UK, US, Canada, Australia, New Zealand, and France
Interested in developing premium beer business
Focused on markets in their infancy and with growth potential i.e. Latin America and Africa

INDUSTRY DYNAMICS26
• Global demand grew at 2.7%• Growth driven by developing regions – APAC,
Central & South America, & Eastern Europe• Developed regions growth either flat or decreased
2000 20050
100
200
300
400
500
WEST EUROPE (TOP 10) EAST EUROPE (TOP 5)CENTRAL & SOUTH AMERICA (TOP 5) NORTH AMERICAASIA (TOP 5) AUSTRALASIAMIDDLE EAST/NORTH AFRICA (TOP 5) REST OF AFRICA (TOP 5)
HL in
MM
2000-2005 HECTOLITERS CONSUMED BY REGION
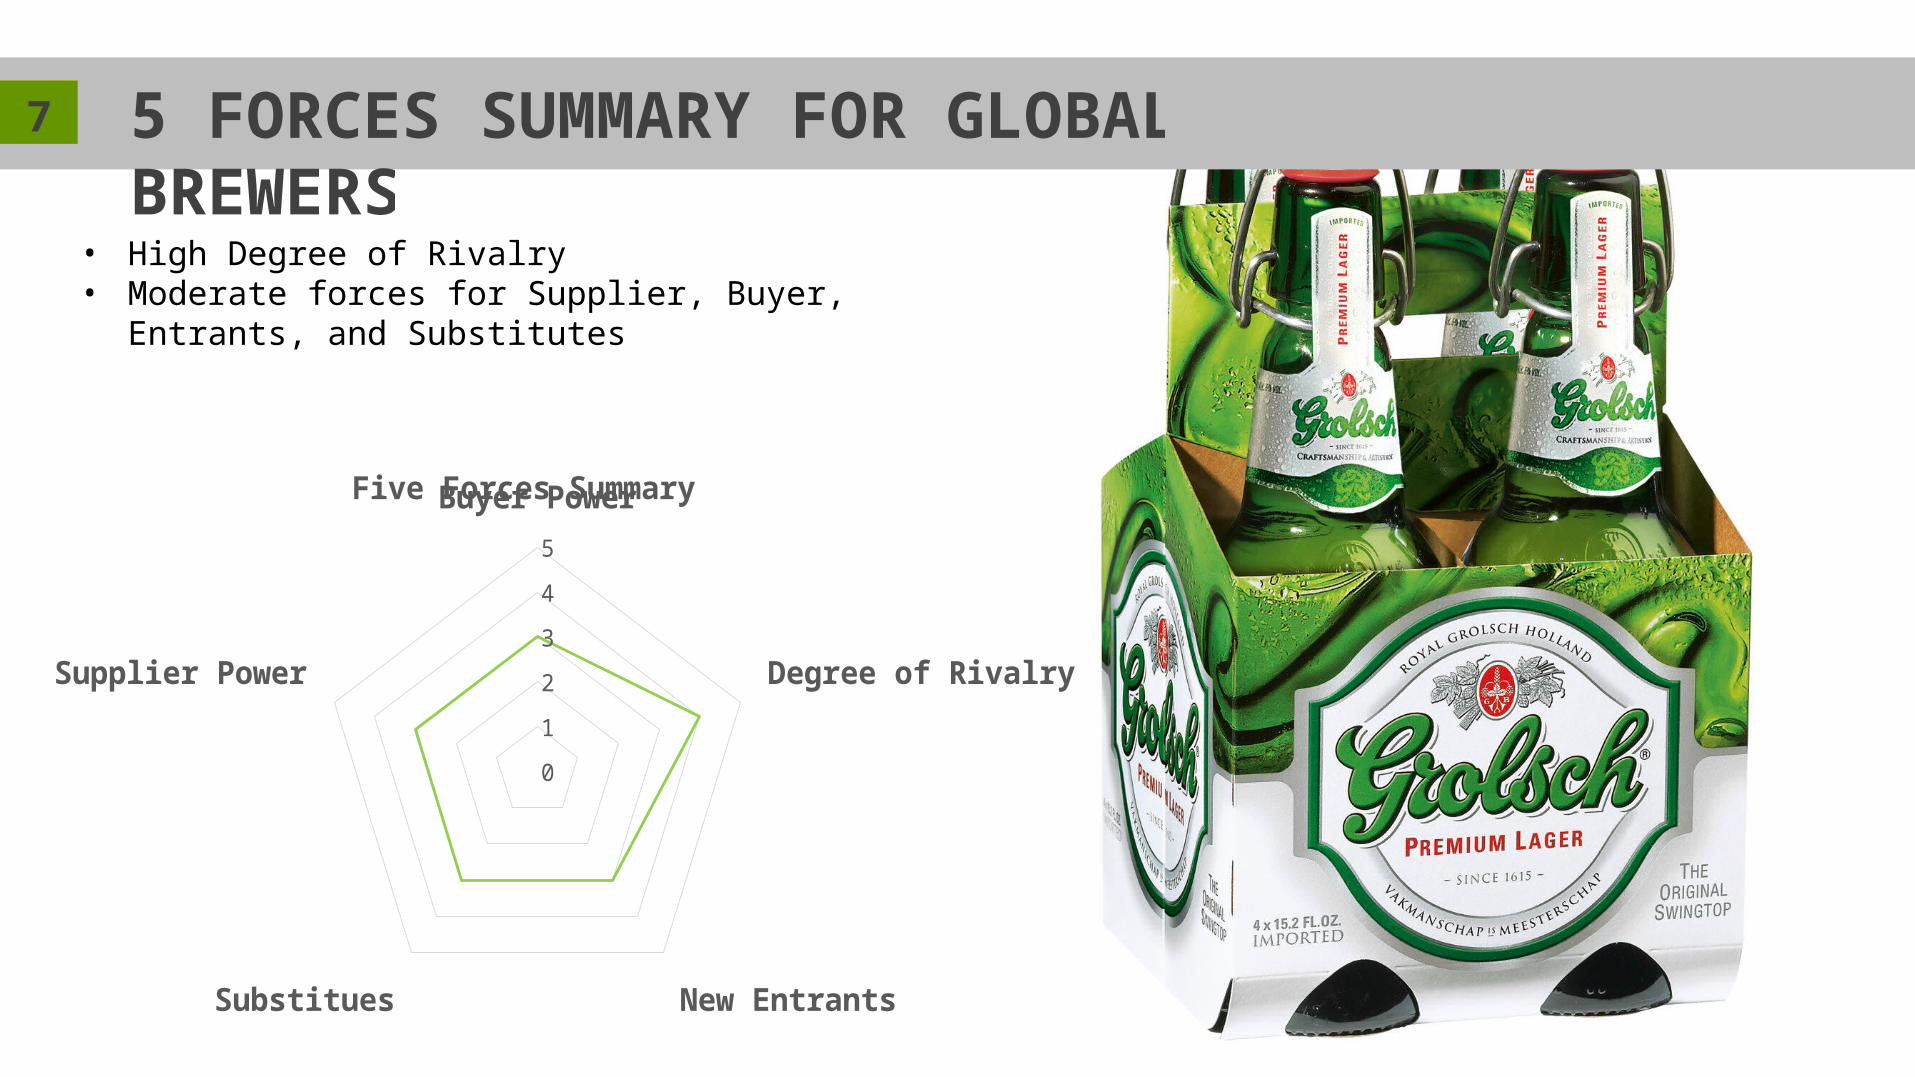
5 FORCES SUMMARY FOR GLOBAL BREWERS27
• High Degree of Rivalry• Moderate forces for Supplier, Buyer, Entrants, and Substitutes
Buyer Power
Degree of Rivalry
New EntrantsSubstitues
Supplier Power
0
1
2
3
4
5
Five Forces Summary

5 FORCES DRILL FOR GLOBAL BREWERS28
Backwards Integration
Buyer Independence
Buyer Size
Financial Muscle
Low-Cost Switching
Oligopsony Threat
Price Sensitivty
Product Dispensibility
Tendency to Switch
Undifferentiated Product
0
5
Buyer Power
Comptetior SizeEasy to Expand
Hard to Exit
Lack of Diversity
Low Cost Switching
Low Fixed CostNumber of Players
Similarity of Players
Storage Costs
Undifferentiated Product
Zero Sum Game
0
1
2
3
4
5
Rivalry
Beneficial Alternative
Low Cost SwitchingCheap Alternative
0
5Substitutes
Differentiated InputForward Integration
Importance of Quality/Cost
No Substitute Inputs
Oligopoly ThreatPlayer Dispensability
Player Independence
Supplier Size
Switching Costs
0
2
4
Supplier Power
Distribution AccessibleIncumbents Acquiescent
Little IP Involved
Little Regulation
Low Fixed Costs
Low-Cost SwitchingMarket Growth
Scale Unimportant
Suppliers Accessible
Undifferentiated Product
Weak Brands
0
2
4
New Entrants

ADDITIONAL KEY EXTERNAL FACTORS29
GLOBAL POPULATION OF PEOPLE IN 18 to 34 AGE RANGE
WORLD PRICE OF WHEAT
WORLD PRICE OF GLASS
GLOBAL CONSUMER SPENDING
WORLD PRICE OF ALUMINUM

GEOGRAPHIC DISTRIBUTION OF SALES
210
GEOGRAPHIC DISTRIBUTION OF
SALESINBEV SABMILLER ANHEUSER -
BUSCH HEINEKEN CARLSBERG MODELO MOLSON
CENTRAL & SOUTH AMERICA 42% 22% 1% 2% 0% 69% 22%
NORTH AMERICA 5% 29% 83% 7% 0% 28% 74%
ASIA 19% 2% 14% 4% 8% 1% 0%
AUSTRALASIA 0% 0% 0% 1% 0% 1% 0%
WEST EUROPE 15% 4% 2% 36% 31% 2% 24%
EAST EUROPE 20% 21% 0% 34% 60% 0% 0%
MIDDLE EAST & NORTH AFRICA 0% 0% 0% 2% 0% 0% 0%
REST OF AFRICA 0% 21% 0% 15% 1% 0% 0%
• Most of the major players at the time featured one or two outstanding markets
• Only Inbev and SABMiller displayed a diversified sales portfolio

TRENDS TOWARD CONSOLIDATION
211
Anheuser-Busch InBev
19.60%
SABMiller13.30%
Heineken N.V.9.40%Carlsberg A/S
7.30%
Other50.40%
2010 Global Market Share
Anheuser - Busch9%
SABMiller9%
Heineken6%
Carlsberg5%
Modelo3%
Molson3%
Inbev13%
Other53%
2006 Global Market Share
Anheuser-Busch InBev33%
SABMiller17%
Heineken N.V.17%
Carls-berg A/S
6%
Other27%
2015 Market Share

• No 1 or 2 position in 75 countries in 6 continents, mostly developing markets
• 200+ beverage brands
• Expertise in local value creation
• Largest Coca-Cola bottler in Africa
• No strong northern European beer brand on its portfolio
• No presence in Western European markets
• Overall volume growth in emerging markets
• Introduce the Premium beer category into its existing markets
• Optimize manufacturing and distribution costs
• Volumes of Standard beer are stagnant
• Industry consolidation mode. Prime targets for acquisition are more and more scarce
• Become a potential target for an uninvited acquisition
SWOT ANALYSIS25
STRENGTHS
• Premium Product (Taste, Quality)
• Historic brand with official Royal recognition (Royal Groslch)
• Patented Swingtop bottle
WEAKNESSES
• Distribution in International Markets
• International Execution
• Mostly unknown outside of northern Europe
OPPORTUNITIES
• Amsterdam economy brand
• Very low participation in North American markets
• Developing markets in Asia, Latin America and Africa
• New plant in the Netherlands
THREATS
• Markets shrinking in developed markets
• Entrance of new brands in the traditional Grolsch territory in eastern Netherland
• New craft beers entering the premium segment

GLOBAL FOOTPRINT14
SAB IMPORTSAB OPERATION
GROLSCH MARKETAMSTERDAM MARKET

AAA ANALYSIS213
10% 10%
8%
6%
0
4%
2%
8%
6%
4%
2%
100%
20%
40%
60%
80%
ADAPTATION
AGGREGATION
ARBITRAGE

MABA215
MARKET ATTRACTIVENESS BUSINESS ASSESSMENTAnalyzed:• Total Volume and Volume Growth of Grolsch
premium lager• Variable Commercial Contribution• Grolsch’s share of premium lager segment
Analyzed :• Total Volume and Volume Growth (International
Premium Lager Segment)• Price Premium between Brands• Geographic & Cultural Distances
• Measured differences in:• Difference in Languages• Non-Membership v. Membership in EU• Cost of Transport• Difference in GDP per Capita

POSSIBLE “KEY” MARKETS216
Sources:1- http://geert-hofstede.com/netherlands.html2-http://www.dutycalculator.com/hs-lookup/626889/hs-tariff-code-for-beer/3- http://hts.usitc.gov/
| SOUTH AFRICA : Former Dutch Colony: Similar language: Emerging Market: High levels of Indulgence1 : Existing presence SABMiller
C: [not significant]A: [not significant]G: Physical DistanceE: Different currencies
+ | COLOMBIA
: Existing presence SABMiller: Emerging Market: High levels of Indulgence1 : Virgin Premium Beer market
C: Different languagesA: [not significant]G: Physical DistanceE: Different currencies &
Import Tariffs2
+
| USA : Existing presence SABMiller: No import tariffs on beer3
: High levels of Indulgence1 : American preference for Imported beer
C: Different languagesA: Existence of Dry LawsG: Physical DistanceE: Developed Market
+ | POLAND : Relatively close : Growing demand: Familiar market: Learn from past experience
C: Language, IndulgenceA: [not significant]G: [not significant]E: Different currencies
+
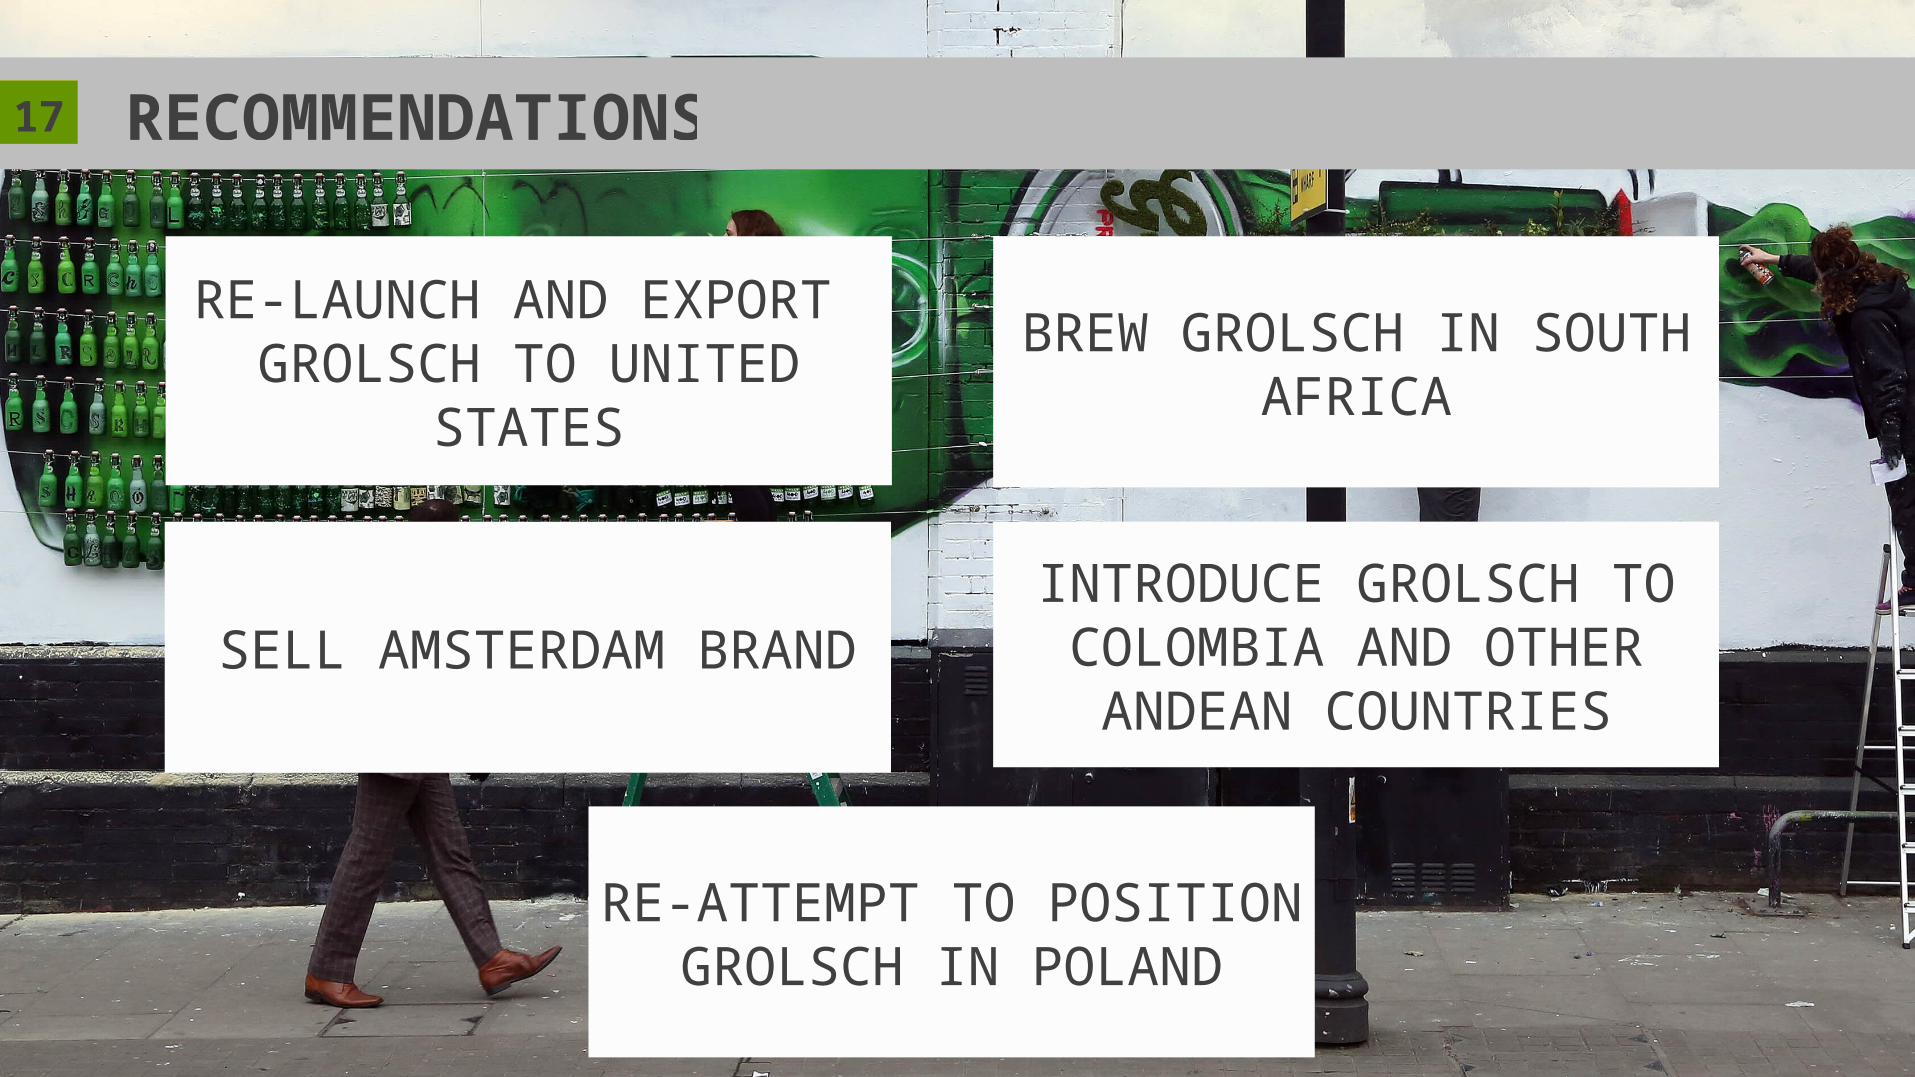
RECOMMENDATIONS217
RE-LAUNCH AND EXPORT GROLSCH TO UNITED STATES
SELL AMSTERDAM BRANDINTRODUCE GROLSCH TO COLOMBIA AND OTHER
ANDEAN COUNTRIES
BREW GROLSCH IN SOUTH AFRICA
RE-ATTEMPT TO POSITION GROLSCH IN POLAND


BAR TALK220
What lessons can be drawn from where Grolsch has been most
successful?
Did the merger with SABMiller add value? If so, how?
What additional recommendations on strategy
would you make?What changes has Grolsch made to address the challenges faced?
How can Grolsch enter and compete in targeted markets? ●●●
●●●
●●●

THANK YOU!
Related Documents