LIMNOLOGY AND OCEANOGRAPHY July 1980 Volume 25 Number 4 Limnol. Oceanogr., 25(4), 1980, 583-596 @ 1980, by the American Society of Limnology and Oceanography, Inc. Grazing patterns of copepods in the upwelling system off Peru Carl M. Boyd and Sharon L. Smith’ Department of Oceanography, Dalhousie University, Halifax, Nova Scotia B3H 451 Timothy J. Cowles Woods Hole Oceanographic Institution, Woods Hole, Massachusetts 02543 The amount of food eaten by copepods of three genera (estimated from chlorophyll and pheophytin in the guts of the animals) was measured to determine the depth and also the time of day of the maximum and minimum intensity of feeding. Copepods were taken with a large volume (800 liters .min-‘) pumping system at five depths (O-85 m) and twelve sampling intervals (every 4 h) at three stations in the Peruvian upwelling system. Results indicate that Euculnnus could withstand periods of 12 h in anoxic layers, but Cnlanus and Centropages tended to be found in waters having more than 0.8 and 0.2 ml O,.liter-‘, that in situ filtration rates could be derived which were in accord with filtration rates obtained from laboratory studies, that individuals of the three genera migrated in and out of the 5-m surface layer when food was abundant but did not show a coherent diurnal vertical migration when food was scarce, and that the three genera maintained different feeding strategies which were amplified when food was scarce. The results are consistent with the concepts of resource allocation and separation of niches by species. Feeding by herbivorous copepods has been extensively studied during the last decade in an attempt to understand en- ergy exchanges in the aquatic environ- ment. A great deal has been learned about feeding behavior by capturing co- pepods of interest, bringing them into the laboratory, and allowing them to feed un- der controlled conditions. The studies of Mullin (1963), Frost (1972), Paffenhiifer (1971), and others have established the transfer functions that relate rates of food ingestion to concentrations of food avail- able to the animals and have stimulated l Present address: Brookhaven National Labora- tory, Upton, New York 11973. interest in studies of diurnal feeding rhythms, mechanisms of food retention, and strategies of feeding of marine co- pepods. Although these laboratory studies have elucidated many components of feeding by copepods, they are limited by the ar- tificial constraints of the laboratory ex- periment wherein animals that have been brusquely captured by a plankton net are kept in an abnormal light regime in containers that restrict excursions and are fed phytoplankton species that are often unknown to them. Other workers have attempted to remove the element of unfamiliar food by allowing animals to feed in the laboratory on particles that 583

Welcome message from author
This document is posted to help you gain knowledge. Please leave a comment to let me know what you think about it! Share it to your friends and learn new things together.
Transcript
LIMNOLOGY AND
OCEANOGRAPHY
July 1980
Volume 25
Number 4
Limnol. Oceanogr., 25(4), 1980, 583-596 @ 1980, by the American Society of Limnology and Oceanography, Inc.
Grazing patterns of copepods in the upwelling system off Peru
Carl M. Boyd and Sharon L. Smith’ Department of Oceanography, Dalhousie University, Halifax, Nova Scotia B3H 451
Timothy J. Cowles Woods Hole Oceanographic Institution, Woods Hole, Massachusetts 02543
The amount of food eaten by copepods of three genera (estimated from chlorophyll and pheophytin in the guts of the animals) was measured to determine the depth and also the time of day of the maximum and minimum intensity of feeding. Copepods were taken with a large volume (800 liters .min-‘) pumping system at five depths (O-85 m) and twelve sampling intervals (every 4 h) at three stations in the Peruvian upwelling system. Results indicate that Euculnnus could withstand periods of 12 h in anoxic layers, but Cnlanus and Centropages tended to be found in waters having more than 0.8 and 0.2 ml O,.liter-‘, that in situ filtration rates could be derived which were in accord with filtration rates obtained from laboratory studies, that individuals of the three genera migrated in and out of the 5-m surface layer when food was abundant but did not show a coherent diurnal vertical migration when food was scarce, and that the three genera maintained different feeding strategies which were amplified when food was scarce. The results are consistent with the concepts of resource allocation and separation of niches by species.
Feeding by herbivorous copepods has been extensively studied during the last decade in an attempt to understand en- ergy exchanges in the aquatic environ- ment. A great deal has been learned about feeding behavior by capturing co- pepods of interest, bringing them into the laboratory, and allowing them to feed un- der controlled conditions. The studies of Mullin (1963), Frost (1972), Paffenhiifer (1971), and others have established the transfer functions that relate rates of food ingestion to concentrations of food avail- able to the animals and have stimulated
l Present address: Brookhaven National Labora- tory, Upton, New York 11973.
interest in studies of diurnal feeding rhythms, mechanisms of food retention, and strategies of feeding of marine co- pepods.
Although these laboratory studies have elucidated many components of feeding by copepods, they are limited by the ar- tificial constraints of the laboratory ex- periment wherein animals that have been brusquely captured by a plankton net are kept in an abnormal light regime in containers that restrict excursions and are fed phytoplankton species that are often unknown to them. Other workers have attempted to remove the element of unfamiliar food by allowing animals to feed in the laboratory on particles that
583
584 Boyd et al.
occur coincidentally with the copepods in nature (Poulet 1974; Cowles 1979), but the criticisms and virtues that derive from bringing animals into the laboratory still remain.
It is difficult or impossible to answer several very interesting and important questions with existing laboratory tech- niques: Do animals eat more at the sur- face than at depth, in keeping with some current ideas concerning vertical migra- tion? Do animals eat all the time or in- termittently? Do animals synchronize their feeding activity according to diurnal rhythms? Are the vertical excursions of copepods associated with the availability of food or with other environmental char- acteristics? Do animals partition their en- vironment? These questions have impor- tant consequences in interpreting the biology of copepods and served as focal points in our study.
Haney (1971) tried to study feeding in situ by measuring ingestion of prepared food by zooplankters trapped for a short period in a large water bottle, and Mack- as and Bohrer (1976) by measuring the quantity of chlorophyll and pheophytin in the guts of selected species of cope- pods taken from plankton samples. The procedure of Mackas and Bohrer has the advantage that all elements that might regulate feeding of the individual are un- influenced by the experimental design up to the instant the animal is captured. With some qualifications, the quantity of chlorophyll and its degradation products in the gut of a copepod indicates how much phytoplankton the animal has re- cently ingested and should be correlated with its grazing rate. Chlorophyll serves as a naturally occurring label, and it can be used conceptually as if it were a ra- dioisotopic label. Among the limitations of the technique are that only feeding on particles containing chlorophyll or its degradation products will be measured; if the animal had been feeding on detri- tus devoid of these compounds, no feed- ing would be measured; and, if the ani- mal were feeding carnivorously, only the chlorophyll products that might have been in the gut of the prey species would
be detected It is therefore necessary to limit the use of this technique to those species whose feeding characteristics are to some extent known.
We used i.he technique of Mackas and Bohrer (1976) in a study of grazing by four species of Calanoid copepods in the region of UF welling off the coast of Peru at about 15’S as part of the Coastal Up- welling Ecosystems Analysis, expedition Joint II during April 1977. The four species cho$;en, Calanus chilensis Brod- sky, Eucalaws inermis Giesbrecht, Eu- calanus subtenuis Giesbrecht, and Cen- tropages bra chiatus Dana, were abundant in the system (Heinrich 1973); Calanus and Eucalaws are believed to be pre- dominantly herbivorous genera, and Centropage,; an omnivorous genus.
Samples ‘were taken from three loca- tions at fivl? depths; sampling was re- peated at 4-h intervals for 44 h at the sta- tions listed below.
Midshelf: water depth = 118 m; 15”5,O’S, 75’30.5’W; 12, 13, 14 April 1977; surfac 3 water temperature = 16.3”C; at 85 m = 15.O”C.
Shelfbreclk: water depth = 480 m; 15”1O,O’S, ‘75’35,O’W; 15, 16, 17 April 1977; surface water temperature = 16.3”C; at 85 m = 14.5”C.
Offshore: depth = 3,100 m; 15”51.5’S, 76’25.O’W; :Zl, 22, 23 April 1977; surface water temperature = 21.O”C; at 85 m = 14.O”C.
The three: areas were separated by 8 and 64 nautical miles (15 and 119 km); the fundamental difference was proxim- ity to the coastline and a gradation in ef- fects of coastal upwelling.
This proj ?ct was carried out as part of the Coastal Upwelling Ecosystems Anal- ysis study Joint II in March and April 1977 off thl: coast of Peru. The coopera- tive aspect:; of CUEA gave us access to data, equipment, and samples that would rarely be alrailable in a smaller study. D. Judkins provided us the opportunity to collect plankton samples from the large pumping s!lstem and W. Keith (RV Mel- uille) helped us in sample collection and analysis. VC’e are especially indebted to 0. Gomez for assistance in sorting the
Copepod feeding patterns 585
copepods. The CUEA study and the re- search of S.L.S. and T.J.C. were funded through the U.S. National Science Foun- dation; S.L.S. was also supported by a Killam postdoctoral fellowship. The re- search expenses of C.M.B. were funded by grants from the National Research Council of Canada and the North Atlantic Treaty Organization.
Methods Animals were coPlected with a pump-
system having a 12.6-cm-i&d. hose which was lowered vertically to depth. Water was discharged by a centrifugal pump on the ship through a fine mesh conical plankton net (202 pm) at volumes of about 800 liters *min-l. Samples were collected as the inlet of the hose was low- ered from one depth to another over an interval of about 5 min, yielding a sample from about 4 m3 of water for each stratum: l-5 m, lo-15 m, 15-20 m, 25-35 m, and 65-84 m. The sampling intervals chosen represent a compromise between a de- sire for total vertical coverage and the practical constraints imposed by frequent sampling during a 44-h time series. We left a large interval between 35 and 65 m because very few copepods were found within this oxygen-poor zone. Plankton samples were examined immediately un- der a dissecting microscope, and 20 spec- imens of each of four species (when avail- able) were pipetted into vials containing a small amount of 0.22pm filtered sea- water. These specimens included adults and late copepodites. The contents of the vials were filtered onto 25-mm Gelman type A-E glass-fiber filters and ground with 10 ml of 90% aqueous acetone, The operation, from collection of the samples to extraction, required only a few min- utes. The slurry containing filter fibers, acetone, and extracted pigments was fil- tered through a Gelman A-E filter, and the fluorescence of the filtrate was mea- sured before and after acidification with 5% vol/vol HCl with a Turner Designs lo-050 fluorometer. Chlorophyll and pheophytin concentrations in the guts of the four species were calculated from flu- orescence of pigments extracted from
whole bodies of the copepods. The fol- lowing formulae give concentrations of pheophytin a and chlorophyll a in ng * animal-l:
pheophytin a = K[(RFa) - Fo]u .
3 n
chlorophyll a = K(Fo - Fa)u *
n
The constant K (75.4 during this study) was derived from instrument calibration and is normally used to express concen- tration of pigments in pg per liter of sea- water. The value 0 is the volume in ml of 90% acetone in which the pigments were extracted, n is the number of animals in the sample (usually ZO), Fo and Fa are the fluorescence readings before and af- ter acidification with two drops of 5% vol/ vol HCI. The acidification ratio (R) was 2.08. These formulae depart from those used by Mackas and Bohrer (1976) and express pheophytin a and chlorophyll a in absolute units (ng pigment * animal-l). Jeffrey (1974) pointed out that digestion of chlorophyll by copepods results in pheophorbide, the double-decomposi- tion product of chlorophyll, and that very little pheophytin occurs in fecal pellets. We were not able to carry out the chro- matographic separation required to dis- tinguish between pheophorbide and pheophytin, and consequently we group the two compounds as “pheophytin.”
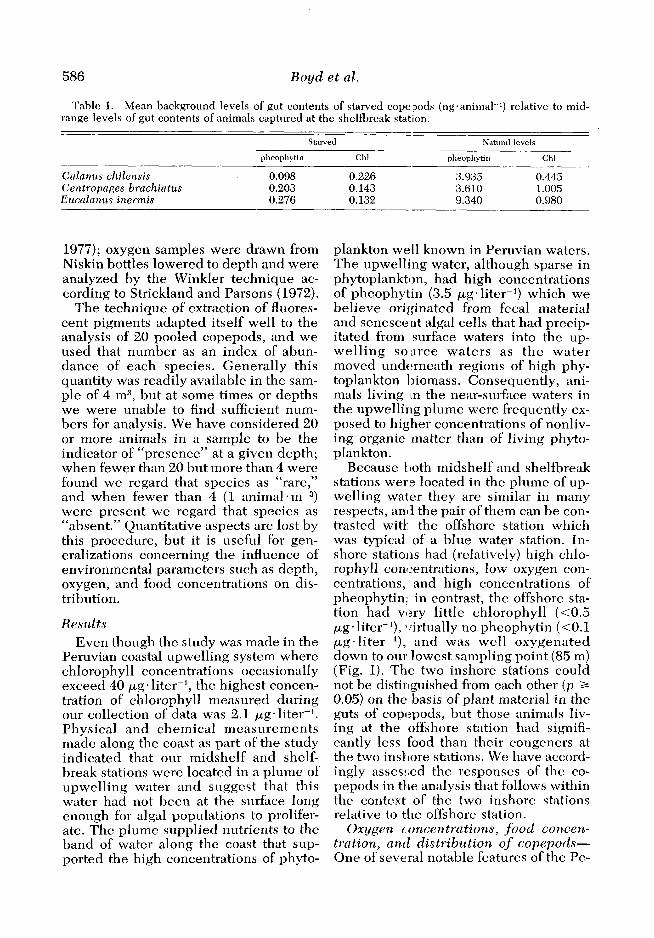
Fluorescence of organic compounds and pigments other than chlorophyll and pheophytin would add an error to these measurements. To assess this potential error, we measured the fluorescence of copepods that had been starved in fil- tered seawater for 24 h and found low concentrations, indicating that back- ground levels of fluorescence were gen- erally not a significant component of the fluorescence of animals taken recently from the ocean. The background levels are compared to fluorescence levels from fed animals in Table 1.
Water samples drawn from the dis- charge of the pump were analyzed for chlorophyll a and pheophytin a (Loren- zen 1966) and nutrients (Dugdale et al.
586 Boyd et al.
Table 1. Mean background levels of gut contents of starved copepods (ngaanimal-‘) relative to mid- range levels of gut contents of animals captured at the shelfbreak station.
Starved Natural levels
pheophytin Chl pheophytin Chl
Calanus chilensis 0.098 0.226 3.935 0.445 Centropages hrachiatus 0.203 0.143 3.610 1.005 Eucalanus inermis 0.276 0.132 9.340 0.980
1977); oxygen samples were drawn from Niskin bottles lowered to depth and were analyzed by the Winkler technique ac- cording to Strickland and Parsons (1972).
The technique of extraction of Auores- cent pigments adapted itself well to the analysis of 20 pooled copepods, and we used that number as an index of abun- dance of each species. Generally this quantity was readily available in the sam- ple of 4 m3, but at some times or depths we were unable to find sufficient num- bers for analysis. We have considered 20 or more animals in a sample to be the indicator of “presence” at a given depth; when fewer than 20 but more than 4 were found we regard that species as “rare,” and when fewer than 4 (1 animal -In+) were present we regard that species as “absent.” Quantitative aspects are lost by this procedure, but it is useful for gen- eralizations concerning the influence of environmental parameters such as depth, oxygen, and food concentrations on dis- tribution.
Results Even though the study was made in the
Peruvian coastal upwelling system where chlorophyll concentrations occasionally exceed 40 pg * liter- l, the highest concen- tration of chlorophyll measured during our collection of data was 2.1 pg. liter-‘. Physical and chemical measurements made along the coast as part of the study indicated that our midshelf and shelf- break stations were located in a plume of upwelling water and suggest that this water had not been at the surface long enough for algal populations to prolifer- ate. The plume supplied nutrients to the band of water along the coast that sup- ported the high concentrations of phyto-
plankton well known in Peruvian waters. The upwelling water, although sparse in phytoplankton, had high concentrations of pheophytin (3.5 pg. liter-‘) which we believe originated from fecal material and senescent algal cells that had precip- itated from surface waters into the up- welling source waters as the water moved underneath regions of high phy- toplankton 1,iomass. Consequently, ani- mals living in the near-surface waters in the upwelling plume were frequently ex- posed to higher concentrations of nonliv- ing organic matter than of living phyto- plankton.
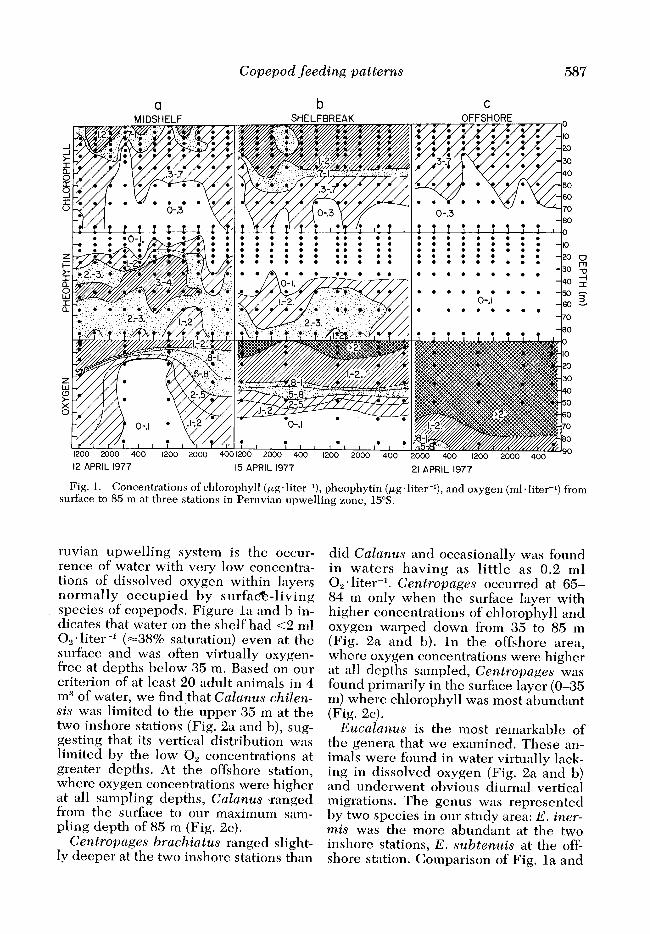
Because both midshelf and shelfbreak stations were located in the plume of up- welling water they are similar in many respects, and the pair of them can be con- trasted wit1 the offshore station which was typical of a blue water station. In- shore stations had (relatively) high chlo- rophyll con:entrations, low oxygen con- centrations, and high concentrations of pheophytin; in contrast, the offshore sta- tion had very little chlorophyll (co.5 pg. liter-l), llirtually no pheophytin (co.1 pg*literrL), and was well oxygenated down to our lowest sampling point (85 m) (Fig. 1). The two inshore stations could not be distinguished from each other (p 2 0.05) on the basis of plant material in the guts of copc:pods, but those animals liv- ing at the offshore station had signifi- cantly less food than their congeners at the two inshore stations. We have accord- ingly assessed the responses of the co- pepods in tire analysis that follows within the context of the two inshore stations relative to the offshore station.
Oxygen concentrations, food concen- tration, und distribution of copepods- One of several notable features of the Pe-
Copepod feeding patterns 587
b C OFFSHORE MIDSHELF
0
IO
20
30
40
50
60
70
BO
12 APRIL 1977 15 APRIL 1977 21 APRIL 1977
Fig. 1. Concentrations of chlorophyll (pg*litcr-‘), pheophytin (pg’liter-l), and oxygen (ml-liter-‘) from surface to 85 m at three stations in Peruvian upwelling zone, 15%.
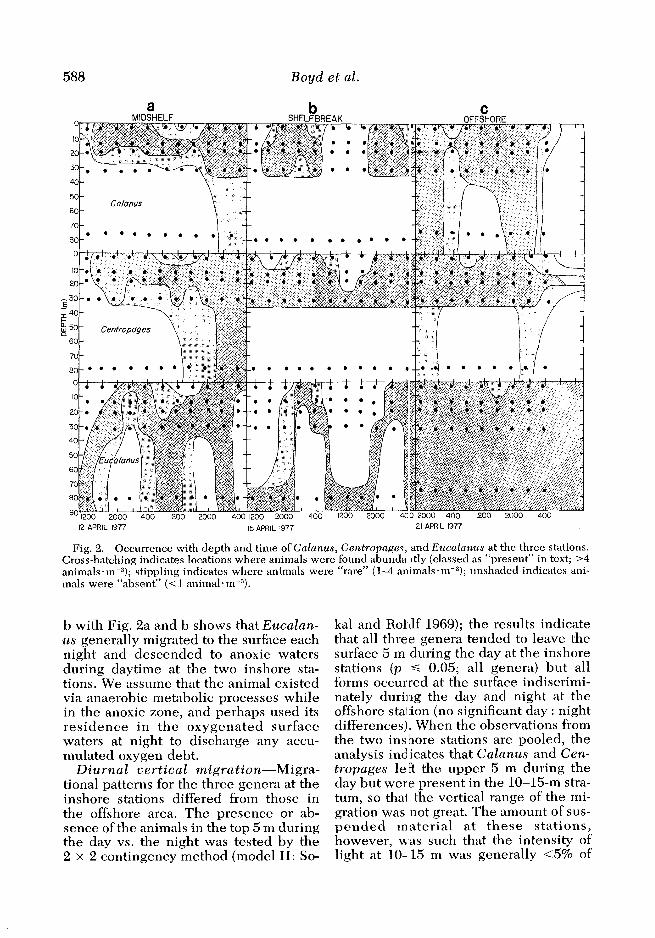
ruvian upwelling system is the occur- rence of water with very low concentra- tions of dissolved oxygen within layers normally occupied by surfa&-living species of copepods. Figure la and b in- dicates that water on the shelf had <2 ml 0, * liter-l (-38% saturation) even at the surface and was often virtually oxygen- free at depths below 35 m. Based on our criterion of at least 20 adult animals in 4 m3 of water, we find that Calanus chilen- sis was limited to the upper 35 m at the two inshore stations (Fig. 2a and b), sug- gesting that its vertical distribution was limited by the low 0, concentrations at greater depths. At the offshore station, where oxygen concentrations were higher at all sampling depths, Calanus \ranged from the surf&e to our maximum sam- pling depth of 85 m (Fig. SC).
Centropages brachiatus ranged slight- ly deeper at the two inshore stations than
did Calanus and occasionally was found in waters having as little as 0.2 ml Oz. liter-l. Centropages occurred at 65- 84 m only when the surface layer with higher concentrations of chlorophyll and oxygen warped down from 35 to 85 m (Fig. 2a and b). In the offshore area, where oxygen concentrations were higher at all depths sampled, Centropages was found primarily in the surface layer (O-35 m) where chlorophyll was most abundant (Fig. 2~).
Eucalanus is the most remarkable of the genera that we examined. These an- imals were found in water virtually lack- ing in dissolved oxygen (Fig. 2a and b) an d underwent obvious diurnal vertical migrations. The genus was represented by two species in our study area: E. iner- mis was the more abundant at the two inshore stations, E. subtenuis at the off- shore station. Comparison of Fig. la and
588 Boyd et al.
12 APRIL 1977 15 APRIL 1977 21 APRIL 1977
Fig. 2. Occurrence with depth and time of Calanus, Centropnges, and Eucnlunus at the three stations. Cross-hatching indicates locations where animals were found abunda ltly (classed as “present” in text; >4 animals*me3); stippling indicates where animals were “rare” ( 14 animals * m-3); unshaded indicates ani- mals were “absent” (<l animal*m+).
b with Fig. 2a and lo shows that Eucalan- us generally migrated to the surface each night and descended to anoxic waters during daytime at the two inshore sta- tions. We assume that the animal existed via anaerobic metabolic processes while in the anoxic zone, and perhaps used its residence in the oxygenated surface waters at night to discharge any accu- mulated oxygen debt.
Diurnal vertical migration-kligra- tional patterns for the three genera at the inshore stations differed from those in the offshore area. The presence or ab- sence of the animals in the top 5 m during the day vs. the night was tested by the 2 x 2 contingency method (model II: So-
kal and Rollf 1969); the results indicate that all three genera tended to leave the surface 5 m during the day at the inshore stations (p d 0.05; all genera) but all forms occurred at the surface indiscrimi- nately during the day and night at the offshore stai:ion (no significant day : night differences). When the observations from the two inshore stations are pooled, the analysis indicates that Calanus and Cen- tropages left the upper 5 m during the day but were present in the 10-15-m stra- tum, so that the vertical range of the mi- gration was not great. The amount of sus- pended material at these stations, however, was such that the intensity of light at IO-15 m was generally <5% of
Copepod feeding patterns 589
a b C
l l .
. .
. .
I I I
7.5-f .
. .
Cenlr opages . . . .
5- . . .
l . . l . l *
,.;,y :.‘,: : : 0.4. 0: l . :* .
1 I 1 It 1 1.1 I I 1 .
. .
15-t . l , .
l . Eucdunus l . . . .
. . . . l
. .
1 I 1 I 1 1 I I I I I I I I
.5 I 1.5 2 2.5 3 35 .5 I 1.5 2. 2.5 3 3.5
CHLOROPHYLL PHEOPHYTIN
.
. l ‘.
CHLOROPHYLL AND
PHEOPHYTIN
(pg. liter-‘)
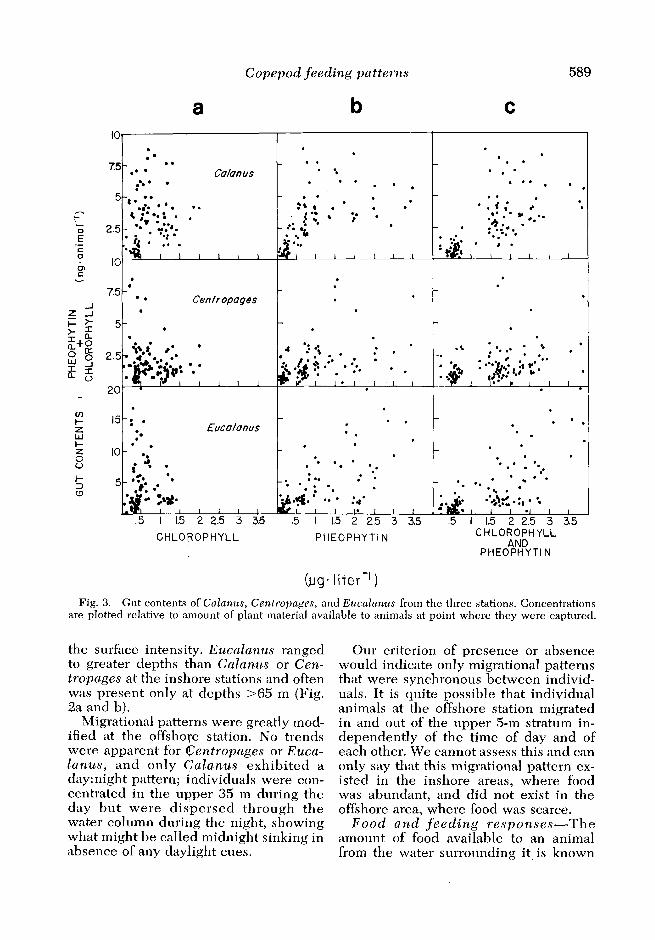
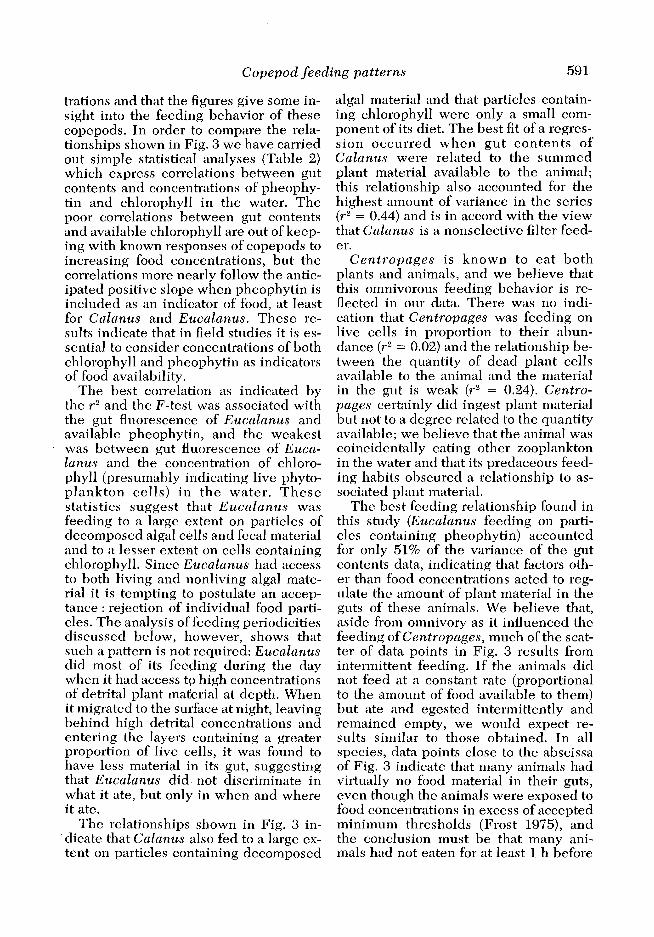
Fig. 3. Gut contents of Cnlunus, Centropa~es, and Euculunus from the three stations. Concentrations are plotted relative to amount of plant material available to animals at point where they were captured.
the surface intensity. Eucalanus ranged to greater depths than Calanus or Cen- tropages at the inshore stations and often was present only at depths >65 m (Fig. 2a and b).
Migrational patterns were greatly mod- ified at the offshore station, No trends were apparent for Gentropages or Euca- Zanus, and only Calanus exhibited a day:night pattern; individuals were con- centrated in the upper 35 m during the day but were dispersed through the water column during the night, showing what might be called midnight sinking in absence of any daylight cues.
Our criterion of presence or absence would indicate only migrational patterns that were synchronous between individ- uals. It is quite possible that individual animals at the offshore station migrated in and out of the upper 5-m stratum in- dependently of the time of day and of each other. We cannot assess this and can only say that this migrational pattern ex- isted in the inshore areas, where food was abundant, and did not exist in the offshore area, where food was scarce.
Food and feeding responses-The amount of food available to an animal from the water surrounding it is known
590 Boyd et al.
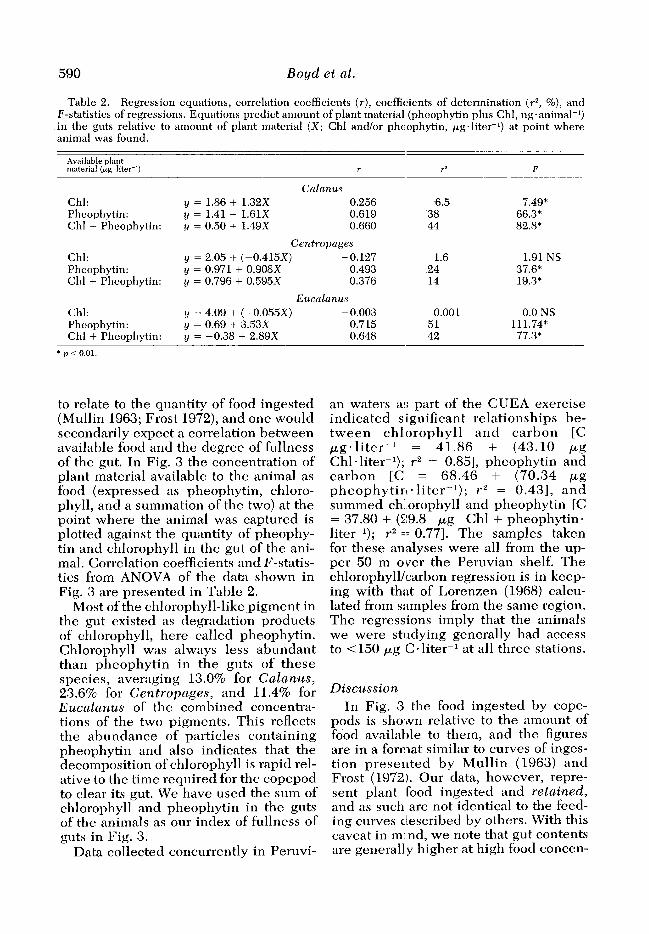
Table 2. Regression equations, correlation coefficients (r), coeffic:ients of determination (F, %), and F-statistics of regressions. Equations predict amount of plant material (pheophytin plus Chl, ngeanimal-I) in the guts relative to amomlt of plant material (X; Chl and/or pheophytin, pg.liter-‘) at point where animal was found.
Available plant materiel (pg. liter-‘)
Chl: Pheophytin: Chl + Pheophytin:
Chl: Pheophytin: Chl + Pheophytin:
Chl: Pheophytin: Chl + Pheophytin:
r
Cnln1aus y = 1.86 + 1.32X 0.256 y = 1.41 + 1.61X 0.619 y = 0.50 + 1.49x 0.660
Cefl tropages y = 2.05 -I- (-0.415X) -0.127 y = 0.971 + 0.908X 0.493 y = 0.796 + 0.595X 0.376
Eucalanus y = 4.09 + (-0.055X) - 0.003 y = 0.69 -t 3.53X 0.715 y = -0.38 + 2.89X 0.648
r2 F
6.5 7.49* 38 66.3” 44 82.8*
1.6 1.91 NS 24 37.6* 14 19.3*
0.001 0.0 NS 51 111.74* 42 77.3”
* p < 0.01.
to relate to the quantity of food ingested (Mullin 1963; Frost 1972), and one would secondarily expect a correlation between available food and the degree of fullness of the gut. In Fig. 3 the concentration of plant material available to the animal as food (expressed as pheophytin, chloro- phyll, and a summation of the two) at the point where the animal was captured is plotted against the quantity of pheophy- tin and chlorophyll in the gut of the ani- mal. Correlation coefficients and F-statis- tics from ANOVA of the data shown in Fig. 3 are presented in Table 2.
Most of the chlorophyll-like pigment in the gut existed as degradation products of chlorophyll, here called pheophytin. Chlorophyll was always less abundant than pheophytin in the guts of these species, averaging 13.0% for Calanus, 23.6% for Centropages, and 11.4% for Eucalanus of the combined concentra- tions of the two pigments. This reflects the abundance of particles containing pheophytin and also indicates that the decomposition of chlorophyll is rapid rel- ative to the time required for the copepod to clear its gut. We have used the sum of chlorophyll and pheophytin in the guts of the animals as our index of fullness of guts in Fig. 3.
Data collected concurrently in Peruvi-
an waters as part of the CUEA exercise indicated significant relationships be- tween chlorophyll and carbon [C pg. liter -I = 41.86 + (43.10 rug Chl * liter-l); r 2 = O.&S], pheophytin and carbon [C = 68.46 + (70.34 pg pheophytin. liter-‘); r2 = 0.431, and summed ch’orophyll and pheophytin [C = 37.80 + (S:9.8 ,ug Chl + pheophytin. liter-l); r2 q = 0.771. The samples taken for these analyses were all from the up- per 50 m over the Peruvian shelf. The chlorophyll/carbon regression is in keep- ing with that of Lorenzen (1968) calcu- lated from s:lmples from the same region. The regressions imply that the animals we were stlldying generally had access to ~150 pg C-liter-l at all three stations.
Discussion In Fig. 3 the food ingested by cope-
pods is sho.wn relative to the amount of food available to them, and the figures are in a format similar to curves of inges- tion presented by Mullin (1963) and Frost (1972). Our data, however, repre- sent plant food ingested and retained, and as such are not identical to the feed- ing curves clescribed by others. With this caveat in m: nd, we note that gut contents are generally higher at high food concen-
Copepod feeding patterns 591
trations and that the figures give some in- sight into the feeding behavior of these copepods. In order to compare the rela- tionships shown in Fig. 3 we have carried out simple statistical analyses (Table 2) which express correlations between gut contents and concentrations of pheophy- tin and chlorophyll in the water. The poor correlations between gut contents and available chlorophyll are out of keep- ing with known responses of copepods to increasing food concentrations, but the correlations more nearly follow the antic- ipated positive slope when pheophytin is included as an indicator of food, at least for Calanus and Eucalanus. These re- sults indicate that in field studies it is es- sential to consider concentrations of both chlorophyll and pheophytin as indicators of food availability.
The best correlation as indicated by the r2 and the F-test was associated with the gut fluorescence of EucaZanus and available pheophytin, and the weakest was between gut fluorescence of Euca- Zanus and the concentration of chloro- phyll (presumably indicating live phyto- plankton cells) in the water. These statistics suggest that Eucalanus was feeding to a large extent on particles of decomposed algal cells and fecal material and to a lesser extent on cells containing chlorophyll. Since Eucalanus had access to both living and nonliving algal mate- rial it is tempting to postulate an accep- tance : rejection of individual food parti- cles. The analysis of feeding periodicities discussed below, however, shows that such a pattern is not required: Eucalanus did most of its feeding during the day when it had access tp high concentrations of detrital plant material at depth. When it migrated to the surface at night, leaving behind high detrital concentrations and entering the layers containing a greater proportion of live cells, it was found to have less material in its gut, suggesting that Eucalanus did not discriminate in what it ate, but only in when and where it ate.
The relationships shown in Fig. 3 in- dicate that Calanus also fed to a large ex- tent on particles containing decomposed
algal material and that particles contain- ing chlorophyll were only a small com- ponent of its diet. The best fit of a regres- sion occurred when gut contents of Calanus were related to the summed plant material available to the animal; this relationship also accounted for the highest amount of variance in the series (r2 = 0.44) and is in accord with the view that Calanus is a nonselective filter feed- er.
Centropages is known to eat both plants and animals, and we believe that this omnivorous feeding behavior is re- flected in our data. There was no indi- cation that Centropages was feeding on live cells in proportion to their abun- dance (r2 = 0.02) and the relationship be- tween the quantity of dead plant cells available to the animal and the material in the gut is weak (r2 = 0.24). Centro- pages certainly did ingest plant material but not to a degree related to the quantity available; we believe that the animal was coincidentally eating other zooplankton in the water and that its predaceous feed- ing habits obscured a relationship to as- sociated plant material.
The best feeding relationship found in this study (Eucalanus feeding on parti- cles containing pheophytin) accounted for only 51% of the variance of the gut contents data, indicating that factors oth- er than food concentrations acted to reg- ulate the amount of plant material in the guts of these animals. We believe that, aside from omnivory as it influenced the feeding of Centropages, much of the scat- ter of data points in Fig. 3 results from intermittent feeding. If the animals did not feed at a constant rate (proportional to the amount of food available to them) but ate and egested intermittently and remained empty, we would expect re- sults similar to those obtained. In all species, data points close to the abscissa of Fig. 3 indicate that many animals had virtually no food material in their guts, even though the animals were exposed to food concentrations in excess of accepted minimum thresholds (Frost 1975), and the conclusion must be that many ani- mals had not eaten for at least 1 h before
592 Boyd et al.
CAL ANUS
PHEOPHYTIN AND CHLOROPHYLL (pg *liter-‘)
I o ,’
I 2 3
PHEOPHYTIN AND CHLOROPHYLL (pg .liter-‘)
8- =‘ ‘k
3 P 6-
22
g 4- cl
z -I G 2-
L 0
C E-UCAL ANUS -
1 OI I I J 2 3 4
PHEOPHYTIN dND CHLOROPHYLL (pg. liter-‘)
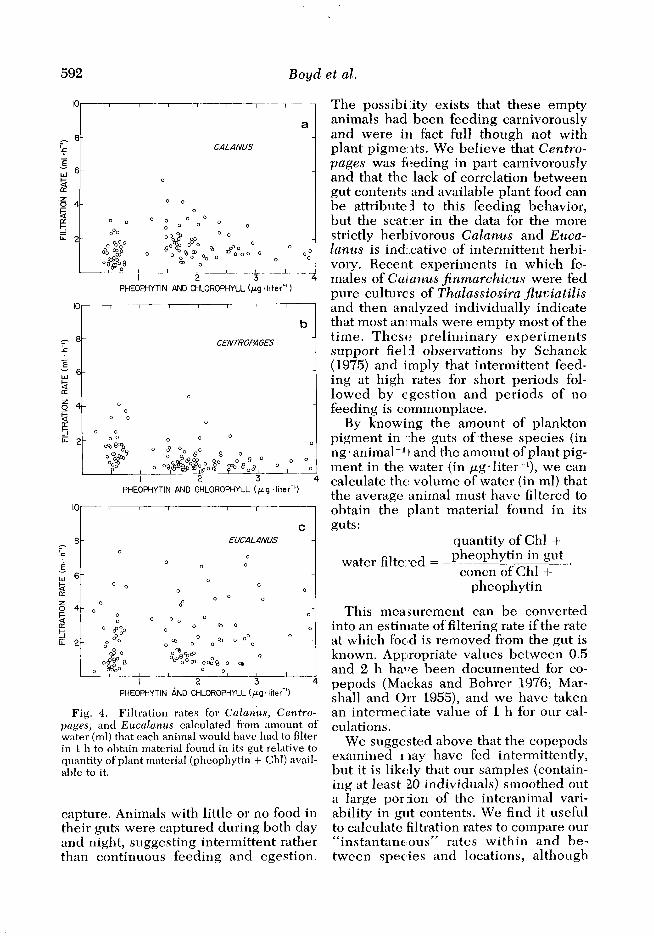
Fig. 4. Filtration rates for Calanus, Centro- pages, and Eucalanus calculated from amount of water (ml) that each animal would have had to filter in 1 h to obtain material found in its gut relative to quantity of plant material (pheophytin + Chl) avail- able to it.
capture. Animals with little or no food in their guts were captured during both day and night, suggesting intermittent rather than continuous feeding and egestion.
The possibility exists that these empty animals had been feeding carnivorously and were in fact full though not with plant pigme.lts. We believe that Centro- pages was fi:eding in part carnivorously and that the lack of correlation between gut contents and available plant food can be attribute3 to this feeding behavior, but the scat:er in the data for the more strictly herbivorous Calanus and Euca- Zanus is ind:cative of intermittent herbi- vory. Recent experiments in which fe- males of Caianus finmarchicus were fed pure cultures of Thalassiosira Jluviatilis and then analyzed individually indicate that most animals were empty most of the time. These: preliminary experiments support field observations by Schanck (1975) and imply that intermittent feed- ing at high rates for short periods fol- lowed by egestion and periods of no feeding is commonplace.
By knowing the amount of plankton pigment in :he guts of these species (in ng * animal-l I and the amount of plant pig- ment in the water (in pg. liter-‘), we can calculate thcb volume of water (in ml) that the average animal must have filtered to obtain the plant material found in its guts:
quantity of Chl +
water filte:*ed = pheophytin in gut ’ concn of Chl +
pheophytin
This measurement can be converted into an estinlate of filtering rate if the rate at which focld is removed from the gut is known. Appropriate values between 0.5 and 2 h haAle been documented for co- pepods (Mackas and Bohrer 1976; Mar- shall and Orr 1955), and we have taken an intermed iate value of 1 h for our cal- culations.
We suggested above that the copepods examined rlay have fed intermittently, but it is likely that our samples (contain- ing at least 20 individuals) smoothed out a large portion of the interanimal vari- ability in gilt contents. We find it useful to calculate filtration rates to compare our “instantanr ous” rates within and be- tween species and locations, although
Copepod feeding patterns
GUT CONTENTS
593
0 DAY NIGHT DAY
0 DAY NIGHT DAY
IO IO
20 20
30 30
OhsiORE 4o 40
50 50
60 60
70 70 CEMROPAGES 80 80
ffFSHORE
0 DAY NIGHT DAY
IO
20
30
40
50
60
70
t CENTROPAGES
80
0 DAY NIGHT DAY
IO
20
30
40
50
60
70
80
0 DAY NIGHT DAY
IO
20
30
40
50
60
70
80
m = PRESENT = FEEDING
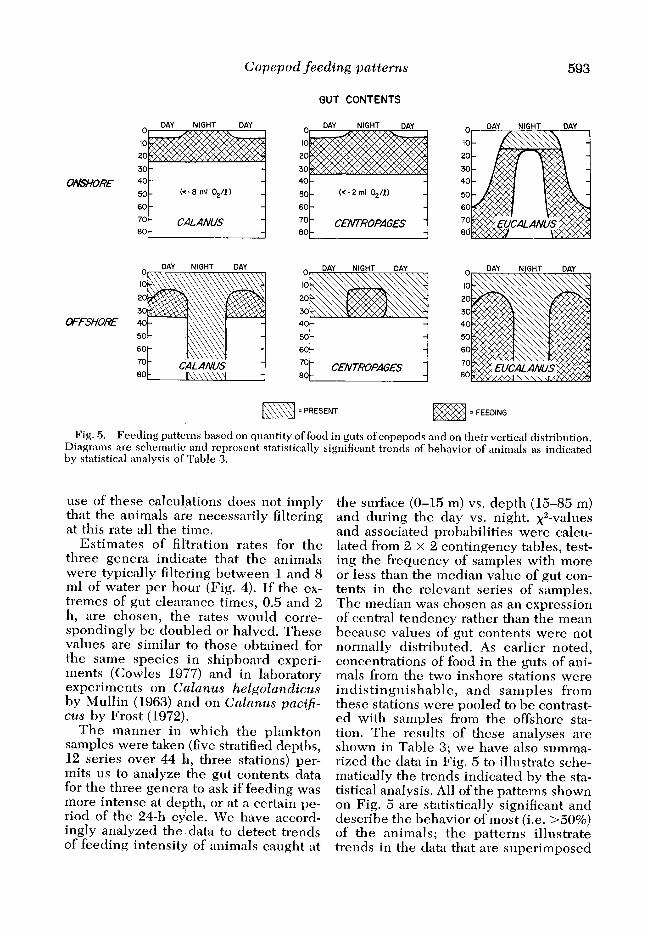
Fig. 5. Feeding patterns based on quantity of food in guts of copepods and on their vertical distribution. Diagrams are schematic and represent statistically significant trends of behavior of animals as indicated by statistical analysis of Table 3.
use of these calculations does not imply that the animals are necessarily filtering at this rate all the time.
Estimates of filtration rates for the three genera indicate that the animals were typically filtering between 1 and 8 ml of water per hour (Fig. 4). If the ex- tremes of gut clearance times, 0.5 and 2 h, are chosen, the rates would corre- spondingly be doubled or halved. These values are similar to those obtained for the same species in shipboard experi- ments (Cowles 1977) and in laboratory experiments on Calanus helgolandicus by Mullin (1963) and on Calanus paci$- cus by Frost (1972).
The manner in which the plankton samples were taken (five stratified depths, 12 series over 44 h, three stations) per- mits us to analyze the gut contents data for the three genera to ask if feeding was more intense at depth, or at a certain pe- riod of the 24-h cycle. We have accord- ingly analyzed the data to detect trends of feeding intensity of animals caught at
the surface (O-15 m) vs. depth (15-85 m) and during the day vs. night. x2-values an d associated probabilities were calcu- lated from 2 x 2 contingency tables, test- ing the frequency of samples with more or less than the median value of gut con- tents in the relevant series of samples. The median was chosen as an expression of central tendency rather than the mean because values of gut contents were not normally distributed. As earlier noted, concentrations of food in the guts of ani- mals from the two inshore stations were indistinguishable, and samples from these stations were pooled to be contrast- ed with samples from the offshore sta- tion. The results of these analyses are shown in Table 3; we have also summa- rized the data in Fig. 5 to illustrate sche- matically the trends indicated by the sta- tistical analysis. All of the patterns shown on Fig. 5 are statistically significant and describe the behavior of most (i.e. ~50%) of the animals; the patterns illustrate trends in the data that are superimposed
594 Boyd et al.
FILTRATION
0 DAY NIGHT DAY
IO
20
0rrsHoRE 4”:
50
60
70
80
0 DAY NIGHT DA”
IO
20
30
40
50
60
70 CENTRO/?AGES 80
0 DAY NIGHT DAY
IO
20
30
40
50
60
70 CENTRO?AGES 80
0 DAY NIGHT DAY
IO
20
30
40
50
60
70
80
= PRESENT = FEEDING
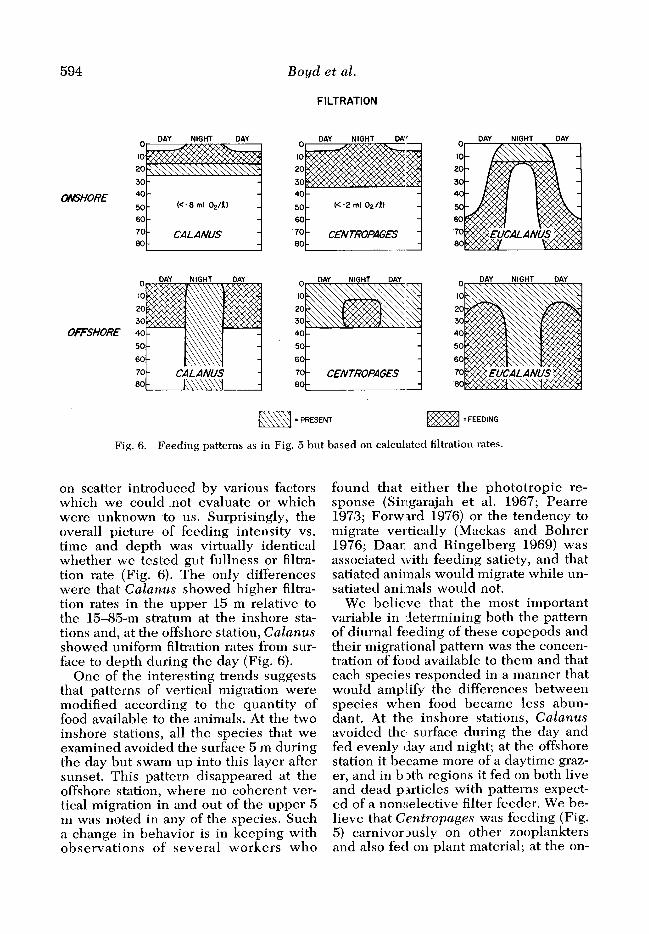
Fig. 6. Feeding patterns as in Fig, 5 but based on calculated filtration rates.
on scatter introduced by various factors which we could not evaluate or which were unknown to us. Surprisingly, the overall picture of feeding intensity vs. time and depth was virtually identical whether we tested gut fullness or filtra- tion rate (Fig. 6). The only differences were that Calanus showed higher filtra- tion rates in the upper 15 m relative to the 15-85-m stratum at the inshore sta- tions and, at the offshore station, Calanus showed uniform filtration rates from sur- face to depth during the day (Fig. 6).
One of the interesting trends suggests that patterns of vertical migration were modified according to the quantity of food available to the animals. At the two inshore stations, all the species that we examined avoided the surface 5 m during the day but swam up into this layer after sunset. This pattern disappeared at the offshore station, where no coherent ver- tical migration in and out of the upper 5 m was noted in any of the species. Such a change in behavior is in keeping with observations of several workers who
found that either the phototropic re- sponse (Sirlgarajah et al. 1967; Pearre 1973; Forward 1976) or the tendency to migrate vertically (Mackas and Bohrer 1976; Daar and Ringelberg 1969) was associated \vith feeding satiety, and that satiated anilnals would migrate while un- satiated aninals would not.
We believe that the most important variable in determining both the pattern of diurnal feeding of these copepods and their migrational pattern was the concen- tration of food available to them and that each species responded in a manner that would amplify the differences between species when food became less abun- dant. At the inshore stations, Calanus avoided thee surface during the day and fed evenly day and night; at the offshore station it became more of a daytime graz- er, and in b lth regions it fed on both live and dead particles with patterns expect- ed of a nonselective filter feeder. We be- lieve that Centropages was feeding (Fig. 5) carnivor ~~sly on other zooplankters and also fed on plant material; at the on-
Copepod feeding patterns 595
a
. . 2 6 FL
shore stations it fed on plant material uni- formly day and night, but it became a nighttime feeder at the offshore station. Eucalanus also possessed behavioral pat- terns that isolated it from the other two genera; at the onshore stations it alone entered the anoxic zone where it fed dur- ing the day on detrital particles, and at night it swam to the surface but reduced its intensity of feeding. It kept its pattern of daytime feeding at the offshore station, but minimized interactions with Calanus by living at greater depths than Calanus.
The differing behavioral patterns of these copepods fit into the concepts of niche separation and resource allocation as advocated by Schoener (1974a) and others. Schoener (1974h) argued that when food is scarce animals will broaden their habitat (in this case the copepod species will range through greater depths of water) and will exhibit a decreased specialization on food types; Cowles (1979) has documented this latter modi- fication of feeding behavior for C. chi- lensis, C. brachiatus, and E. inermis. Schoener also argued that temporal spe- cialization of feeding is unlikely to occur when food is relatively abundant (inshore), but becomes increasingly like- ly as food abundance decreases (off- shore). Temporal specialization can oc- cur when it becomes less expensive in terms of energy for an animal to wait out periods of low food abundance. The uniqueness of these behavioral patterns is perhaps a device by which three kinds of apparently similar animals-Ca2anus, Centropages, and Eucalanus-can coex- ist during periods of low food availability in an environment that is superficially homogeneous.
References COWLES, T. J. 1977. Copepod feeding in the Peru
upwelling system. Ph.D. thesis, Duke Univ. 173 p.
-. 1979. The feeding responses of copepods from the Peru upwelling system: Food size se- lection. J. Mar. Res. 37: 601-622.
DAAN, N., AND J. RINGELBERC. 1969. Further studies on the positive and negative phototactic reaction of Daphnia magna Straus. Neth. J. Zool. 19: 525-540.
596 Boyd et al.
DUGDALE, R. C., J. J, GOEFUNG, R. T. BARBER, R. L. SMITH, AND T. T. PACKARD. 1977. Denitri- fication and hydrogen sulfide in the Peru up- welling region during 1976. Deep-Sea Res. 24: 601-608.
FORWARD, R. B., JH. 1976. Light and diurnal ver- tical migration: Photobehavior and photophy- siology of plankton, p. 157-209. Zn K. C. Smith [ed.], Photochemical and photobiological re- views, v. 1. Plenum.
FROST, B. W. 1972. Effects of size and concentra- tion of food particles on the feeding behavior of the marine planktonic copepod Calanus pu- c~j&s. Limnol. Oceanogr. 17: 805-815.
-. 1975. A threshold feeding behavior in CaZ- anus puc@us. Limnol. Oceanogr. 20: 263- 266.
HANEY, J. F. 1971. An in situ method for the mea- surement of zooplankton grazing rates. Limnol. Oceanogr. 16: 970-976.
HEINRICH, A. K. 1973. Horizontal distribution of copepods in the Peru current region. Ocean- ology 13: 97-103.
JEFFREY, S. W. 1974. Profiles of photosynthetic pigments in the ocean using thin-layer chro- matography. Mar. Biol. 26: 101-110.
LOFENZEN, C. J, 1966. A method for the continu- ous measurement of in vivo chlorophyll con- centration. Deep-Sea Res. 13: 223-227.
-* 1968. Carbon/chlorophyll relationships in an upwelling area. Limnol. Oceanogr. 13: 202- 204.
MACKAS, D. L., AND R. BOHRER. 1976. Fluores- cence analysis of zooplankton gut contents and an investigation of diel feeding patterns. J. Exp. Mar. Biol. Ecol. 25: 77-85.
MARSHALL, S. M., AND A. P. ORR. 1955. The bi- ology of a marine copepod. Oliver and Boyd.
MULLIN, M. kv[. 1963. Some factors affecting the feeding of marine copepods of the genus Cul- unus. Limlkol. Oceanogr. 8: 239-250.
PAFFENH~FER, G. A. 1971. Grazing and ingestion rates of nauplii, copepodids and adults of the marine pla nktonic copepod Culunus helgolun- dicus. Mar, Biol. 11: 286-298.
PEARFE, S., JR 1973. Vertical migration and feed- ing in Sugi ‘tu elegans Verrill. Ecology 54: 303- 314.
POULET, S. A. 1974. Seasonal grazing of Pseudo- calanus minutus on particles. Mar. Biol. 25: 109-123.
SCHNACK, S. II. 1975. Untersuchungen zur Nah- rungsbiologie der Copopeden (Crustacea) in der Kieler Bucht. Ph.D. thesis, Inst. Meeres- kunde, Kicl. 141 p.
SCHOENER, T. W. 1974u. Resource partitioning in ecological communities. Science 185: 27-39.
-. 1974b. The compression hypothesis and temporal resource partitioning. Proc. Natl. Acad. Sci. 71: 4169-4172.
SINGARAJAH, K. V., J. MOYSE, AND E. W. KNIGHT- JONES. 1957. The effect of feeding upon the phototactic: behaviour of cirriped nauplii. J. Exp. Mar. Biol. Ecol. 2: 144-153.
SOKAL, R. R., AND F. J. ROHLF. 1969. Biometry. Freeman.
STRICKLAND, J, D., AND T. R. PARSONS. 1972. A practical 1- andbook of seawater analysis, 2nd ed. Bull. Fish. Res. Bd. Can. 167.
Submitted: 13 March 1979 Accepted: 14 January 1980
Erratum In the book review by T. T. Macan in tile May 1980 issue
(Vol. 25, No. 3, p. 580), th e correct names of the editors of An introduction to the aquatic insects of North America are R. W. Merritt and K. W. Cummins.
Related Documents