Graphs of Sine and Cosine Functions Section 4.5

Graphs of Sine and Cosine Functions Section 4.5 Objectives Sketch the graphs of sine and cosine functions and their variations. Use amplitude and period.
Dec 16, 2015
Welcome message from author
This document is posted to help you gain knowledge. Please leave a comment to let me know what you think about it! Share it to your friends and learn new things together.
Transcript

Graphs of Sine and Cosine Functions
Section 4.5

Objectives
• Sketch the graphs of sine and cosine functions and their variations.
• Use amplitude and period to help sketch the graphs of sine and cosine functions.
• Sketch translations of graphs of sine and cosine.


360°90° 180° 270°
315°225°
270°
0°180°
90°
45°
30°
330°
300°
60°
240°
135°
210°
150°
120°
y = sin x
–1
1

90° 180° 270° 360°
315°225°
270°
0°180°
90°
45°
30°
330°
300°
60°
240°
135°
210°
150°
120°
y = sin x

𝑦=sin 𝑥 ,0 ≤𝑥≤2𝜋
Values of (x, y) on the graph of
Sine starts at the sea shore
∎

Graph of the Sine FunctionTo sketch the graph of y = sin x we don’t need many points, just the key points.These are the maximum points, the minimum points, and the intercepts.
0-1010sin x
0x2
2
32
Divide the cycle of into four equal parts. Then, connect the five critical points on the graph with a smooth curve that extends in both directions beyond the five points. A single cycle is called a period.
y
2
3
2
22
32
2
5
1
1
x
y = sin x

Amplitude
• The amplitude is the maximum height above or below the center line.
• The standard sine curve y = sin x has an amplitude = 1
• y = The equation has an amplitude = |A|
• has an amplitude of 2.
• has an amplitude of 2.
Amplitude

Period• The period is
the distance between two peaks or valleys.
• y = sin x has period 2π
• y = sin(Bx) has
period
Period
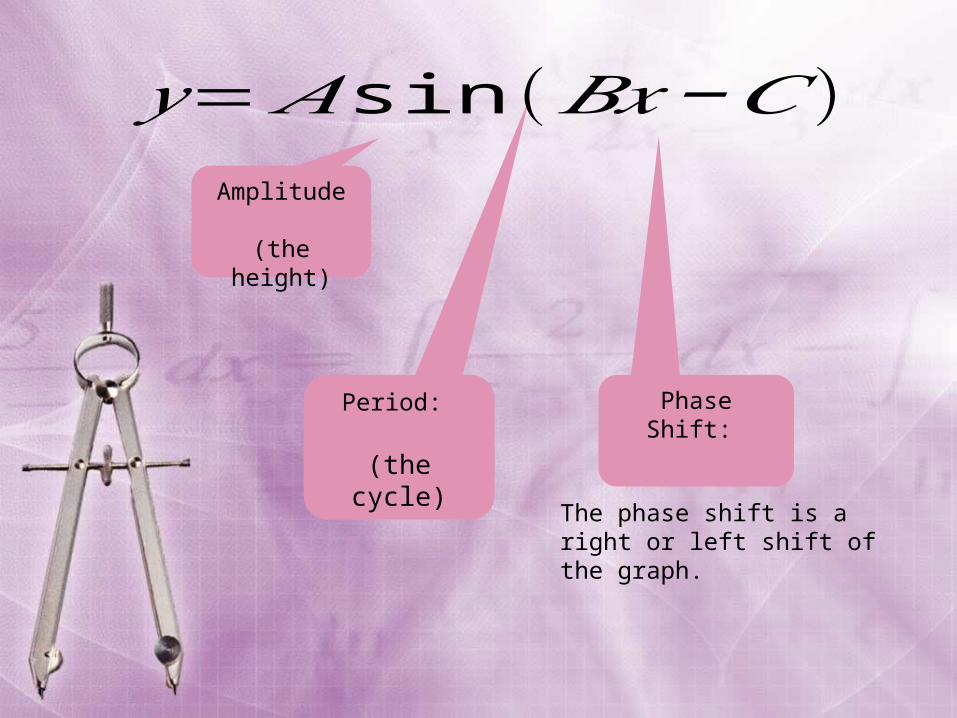
Amplitude
(the height)
Period:
(the cycle)
Phase Shift:
𝑦=𝐴 sin(𝐵𝑥−𝐶)
The phase shift is a right or left shift of the graph.
2
32
4
y
x
4
2
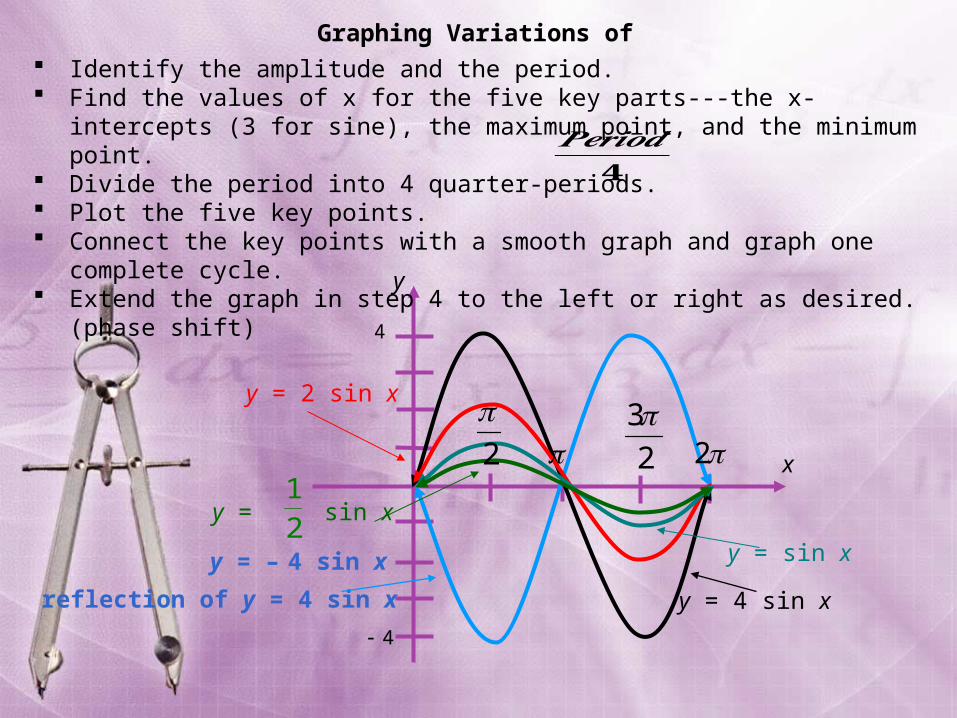
y = – 4 sin x
reflection of y = 4 sin x y = 4 sin x
y = 2 sin x
1
2y = sin x
y = sin x
Identify the amplitude and the period. Find the values of x for the five key parts---the x-intercepts (3 for sine), the
maximum point, and the minimum point. Divide the period into 4 quarter-periods. Plot the five key points. Connect the key points with a smooth graph and graph one complete cycle. Extend the graph in step 4 to the left or right as desired. (phase shift)
Graphing Variations of
𝑷𝒆𝒓𝒊𝒐𝒅𝟒

Free Graph Paper for Graphing Trig Functions
http://mathbits.com/MathBits/StudentResources/GraphPaper/GraphPaper.htm
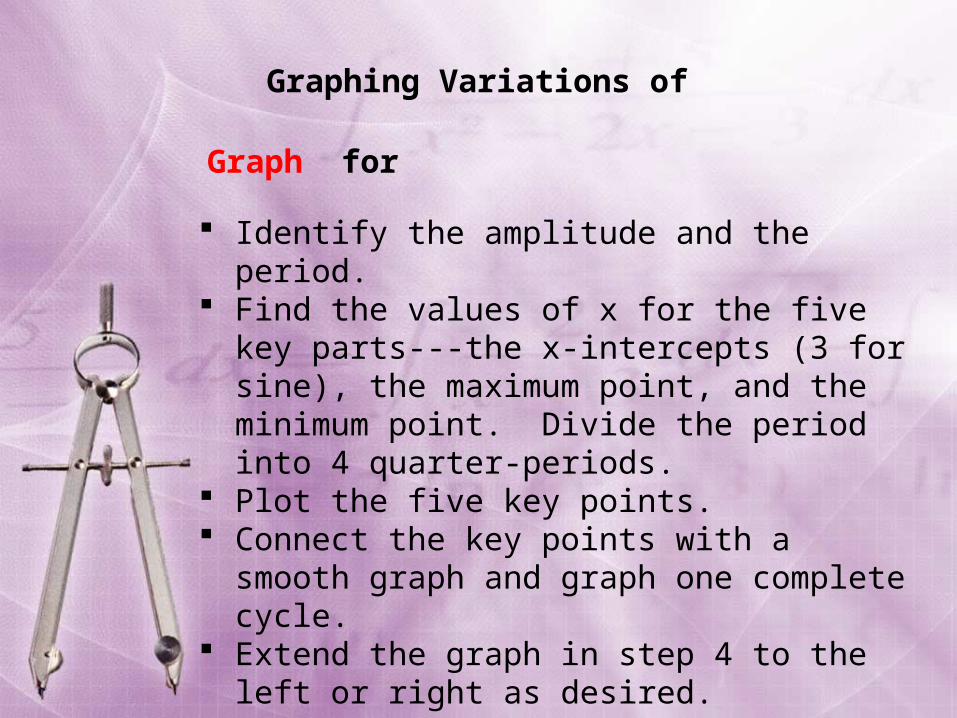
Graphing Variations of
Identify the amplitude and the period. Find the values of x for the five key parts---the x-
intercepts (3 for sine), the maximum point, and the minimum point. Divide the period into 4 quarter-periods.
Plot the five key points. Connect the key points with a smooth graph and
graph one complete cycle. Extend the graph in step 4 to the left or right as
desired.
Graph for
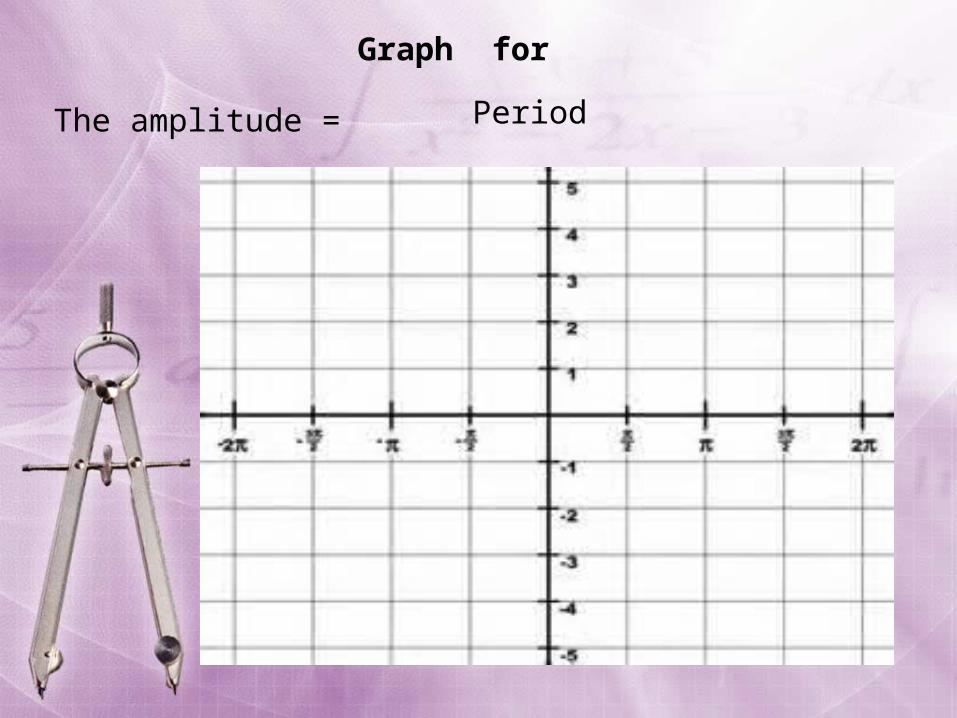
Graph for
The amplitude = Period

Graph for
The amplitude = Period
2
y
2
6
x2
6
53
3
26
6
3
2
3
2
020–20y = –2 sin 3x
0x
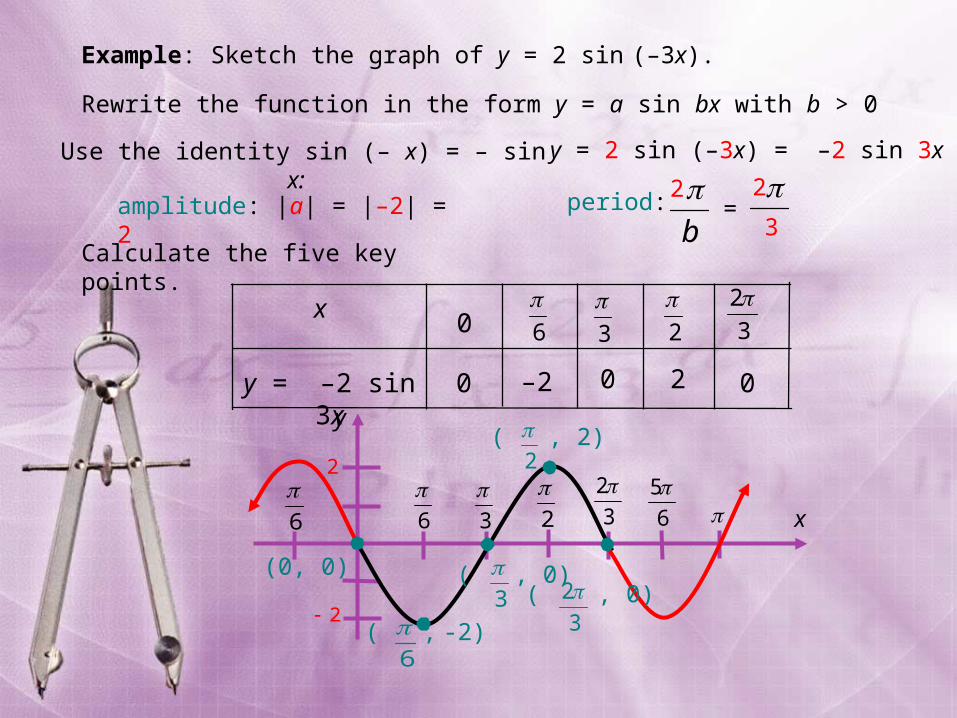
Example: Sketch the graph of y = 2 sin (–3x).
Rewrite the function in the form y = a sin bx with b > 0
amplitude: |a| = |–2| = 2
Calculate the five key points.
(0, 0) ( , 0)3
( , 2)2
( , -2)6
( , 0)
3
2
Use the identity sin (– x) = – sin x: y = 2 sin (–3x) = –2 sin 3x
period:b
2 23
=
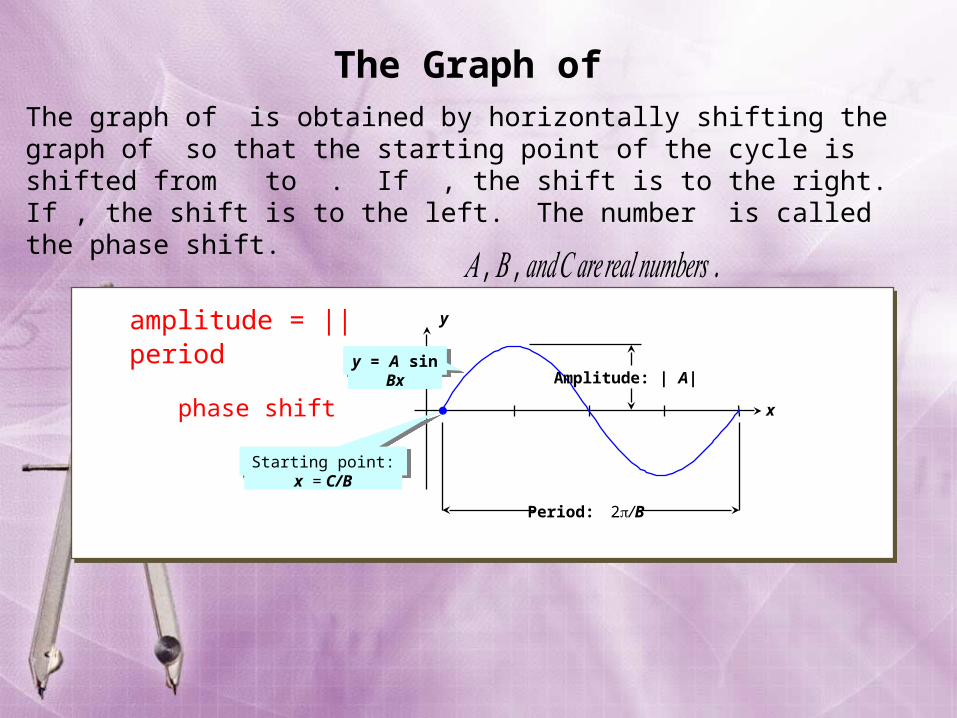
amplitude = ||period
amplitude = ||period
x
y
Amplitude: | A|
Period: 2/B
y = A sin Bx
Starting point: x = C/B
The Graph of The graph of is obtained by horizontally shifting the graph of so that the starting point of the cycle is shifted from to . If , the shift is to the right. If , the shift is to the left. The number is called the phase shift.
phase shift
𝐴 ,𝐵 ,𝑎𝑛𝑑𝐶𝑎𝑟𝑒𝑟𝑒𝑎𝑙𝑛𝑢𝑚𝑏𝑒𝑟𝑠 .
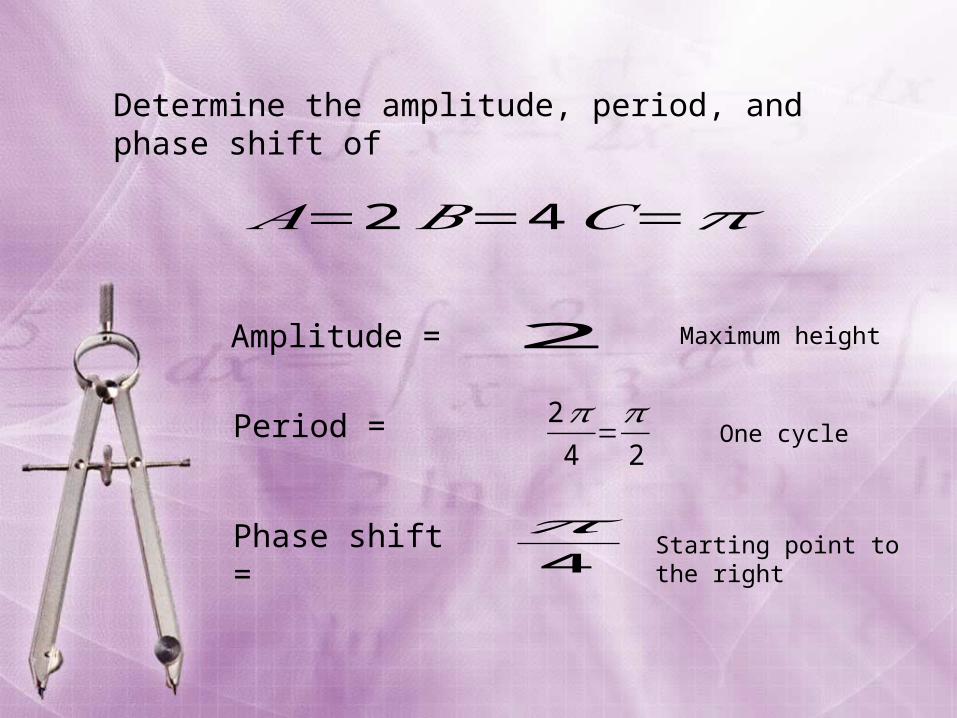
Determine the amplitude, period, and phase shift of
Amplitude = 2
Period = 2𝜋4
=𝜋2
Phase shift = 𝜋4
𝐴=2𝐵=4𝐶=𝜋
Maximum height
One cycle
Starting point to the right

Graph Amp = 2
Period =
Phase shift =
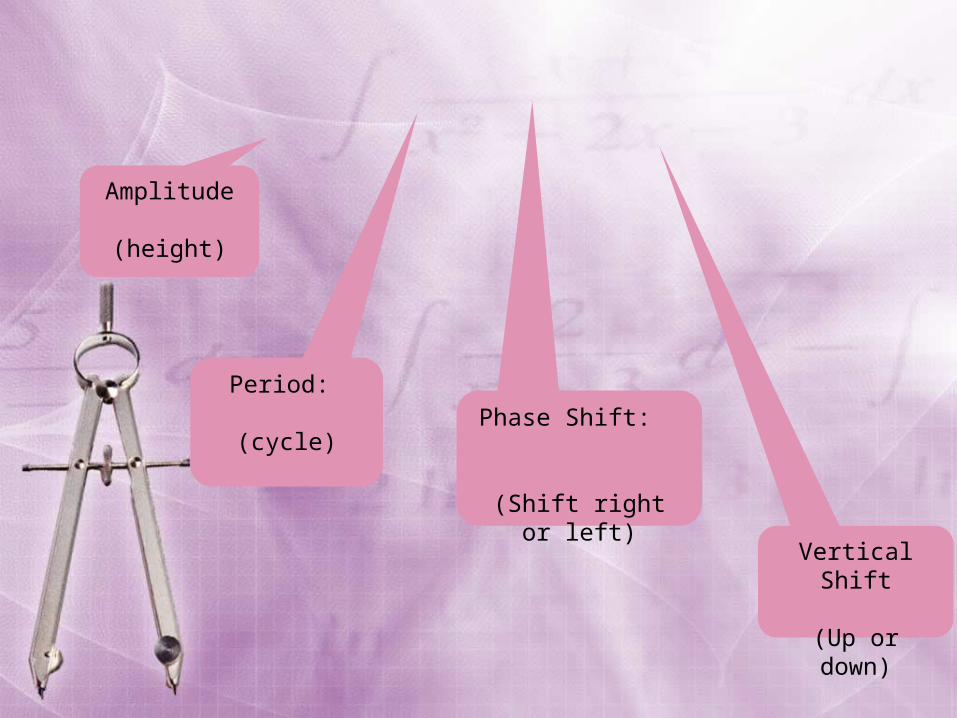
Amplitude
(height)
Period:
(cycle)Phase Shift:
(Shift right or left)
Vertical Shift
(Up or down)

Vertical shift is the amount that the red curve is moved up (or down) compared to the reference (black) curve.
A positive shift means an upward displacement while a negative shift means a downward displacement.
vertical shift
This black curve is for reference.
y = a sin(bx – c) + d

Graph of Sine Applet
Identify the amplitude and the period, the phase shift, and the vertical shift.
Find the values of x for the five key parts---the x-intercepts (3 for sine), the maximum point, and the minimum point. Divide the period into 4 quarter-periods.
Find and plot the five key points. Connect the key points with a smooth graph and
graph one complete cycle. Extend the graph in step 4 to the left or right and up
or down as desired
Graphing a Function in the Form
Determine the amplitude, period, and phase shift and vertical shift of . Then graph one period of the function.

Graph
ExampleGraph y = 2 sin(4x + ) - 1.
SolutionExpress y in the form A sin(Bx – C) + D.
Amplitude = 2
Period
Phase shift =
Vertical shift is down 1unit.

Example 1: Sketch the graph of y = sin (–x).
Use the identity sin (–x) = – sin x
The graph of y = sin (–x) is the graph of y = sin x reflected in the x-axis.
y
x
2y = sin x
y = sin (–x)

𝑦=cos𝑥 ,−2𝜋≤ 𝑥≤2𝜋
Values of (x, y) on the graph of
Cosine starts on the cliff
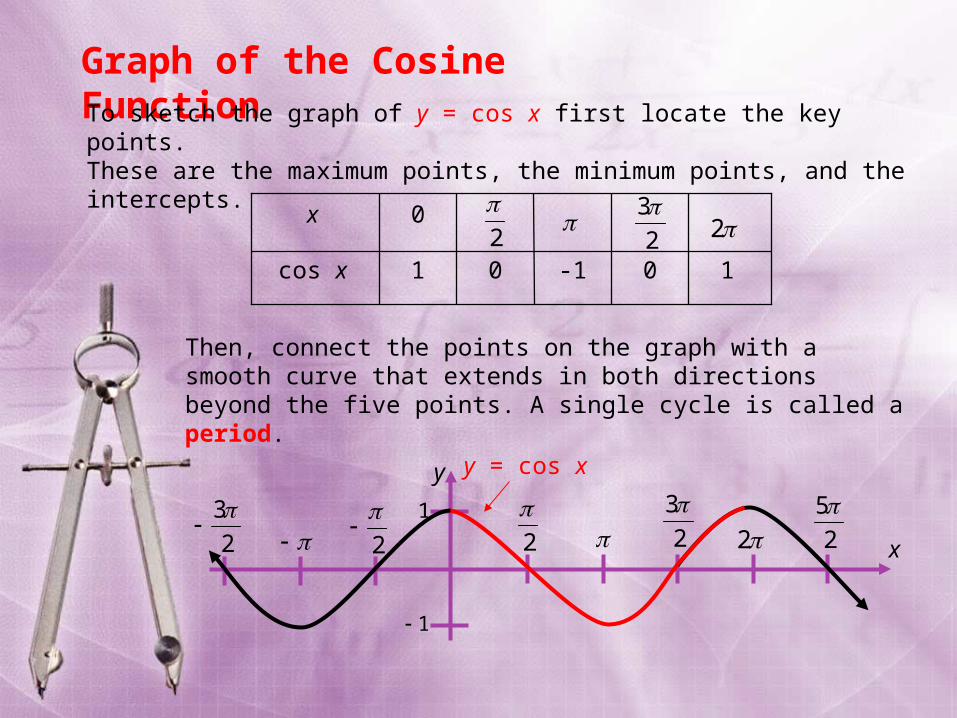
Graph of the Cosine FunctionTo sketch the graph of y = cos x first locate the key points.These are the maximum points, the minimum points, and the intercepts.
10-101cos x
0x2
2
32
Then, connect the points on the graph with a smooth curve that extends in both directions beyond the five points. A single cycle is called a period.
y
2
3
2
22
32
2
5
1
1
x
y = cos x

Graphing Variations of
Identify the amplitude and the period. Find the intercepts (one y-intercept and two x-
intercepts, the maximum point, and the minimum point. Divide the period into 4 quarter-periods.
Plot the five key points. Connect the key points with a smooth graph and
graph one complete cycle. Extend the graph in step 4 to the left or right as
desired.
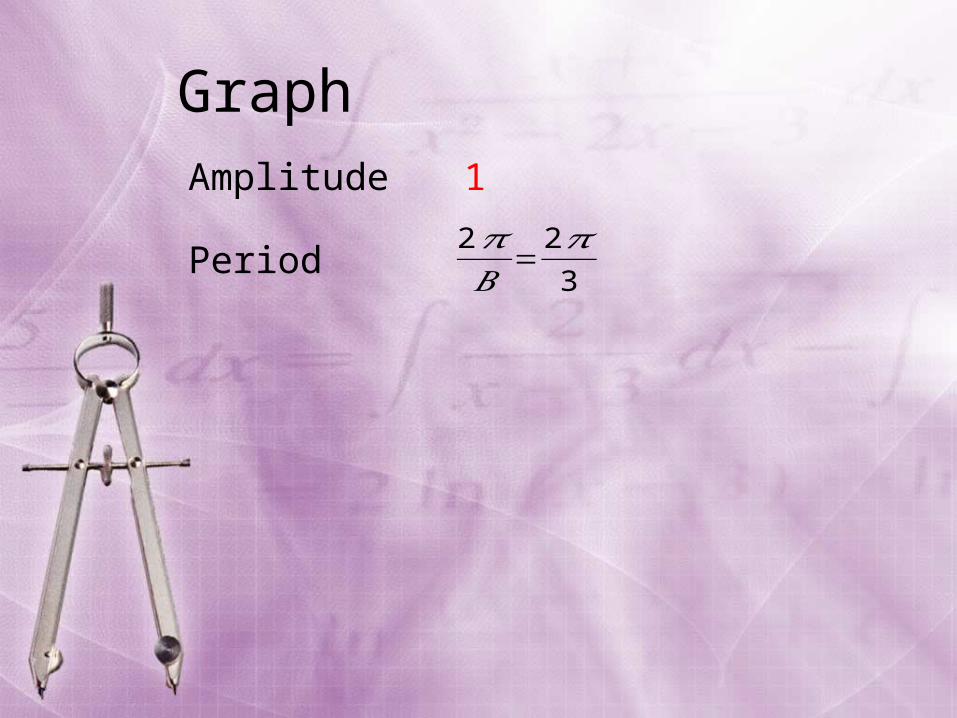
Graph Amplitude 1
Period2𝜋𝐵
=2𝜋3

y
1
123
2
x 32 4
Example: Sketch the graph of y = 3 cos x
Partition the interval [0, 2] into four equal parts. Find the five key points; graph one cycle; then repeat the cycle over the interval.
maxx-intminx-intmax
30-303y = 3 cos x
20x2
2
3
(0, 3)
2
3( , 0)( , 0)
2
2( , ,3)
( , –3)

Amplitude
(the height)
Period:
(the cycle)
Phase Shift:
𝑦=𝐴 cos (𝐵𝑥−𝐶 )
The phase shift is a right or left shift of the graph.
The Graph of
The graph of is obtained by horizontally shifting the graph of so that the starting point of the cycle is shifted from to . If , the shift is to the right. If , the shift is to the left. The number is called the phase shift.
amplitude =
period =


Determine the amplitude and period of
Identify the amplitude and the period. Find the intercepts (one y-intercept and two x-intercepts,
the maximum point, and the minimum point. Divide the period into 4 quarter-periods.
Plot the five key points. Connect the key points with a smooth graph and graph
one complete cycle. Extend the graph in step 4 to the left or right as desired.
Graph of Cosine Applet
Graphing a Function in the Form
http://www.analyzemath.com/cosine/cosine_applet.html

Determine the amplitude and period of .
Graph one period of the function.
Identify the amplitude, the period, and the phase shift. Find the intercepts (one y-intercept and two x-intercepts,
the maximum point, and the minimum point. Divide the period into 4 quarter-periods.
Plot the five key points. Connect the key points with a smooth graph and graph
one complete cycle. Extend the graph in step 4 to the left or right as desired.
Graph of Cosine Applet
Graphing a Function in the Form

dcbxa )sin(Amplitude
Period: 2π/bPhase Shift:
c/b
Vertical Shift
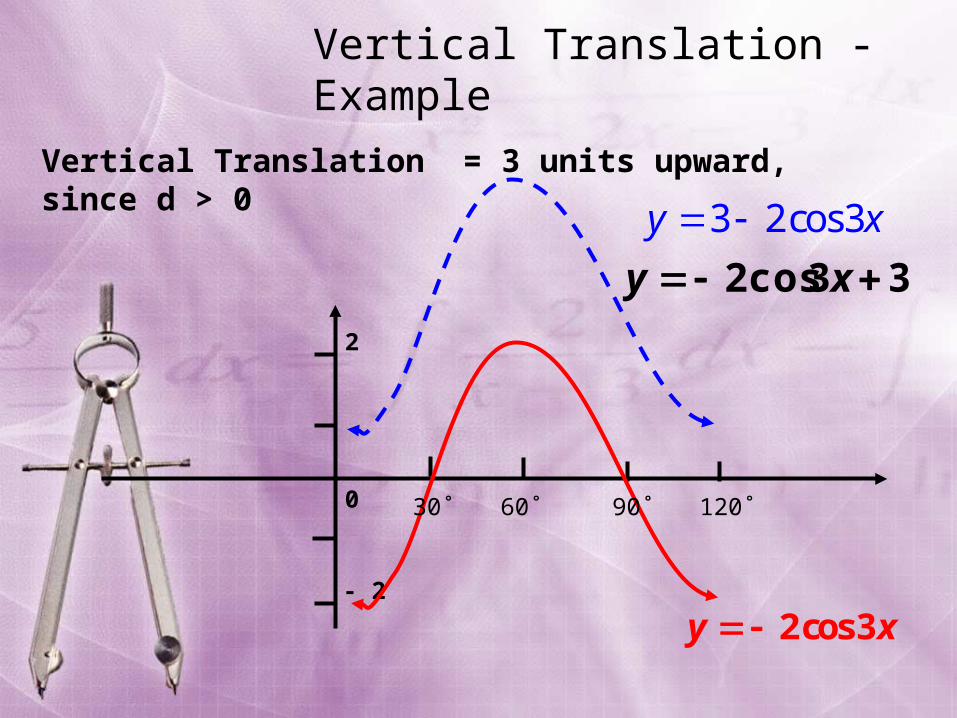
Vertical Translation - Example
3 2cos3y x 33cos2 xy
Vertical Translation = 3 units upward, since d > 0
xy 3cos2- 2
0
2
60˚30˚ 90˚ 120˚
y
x
2
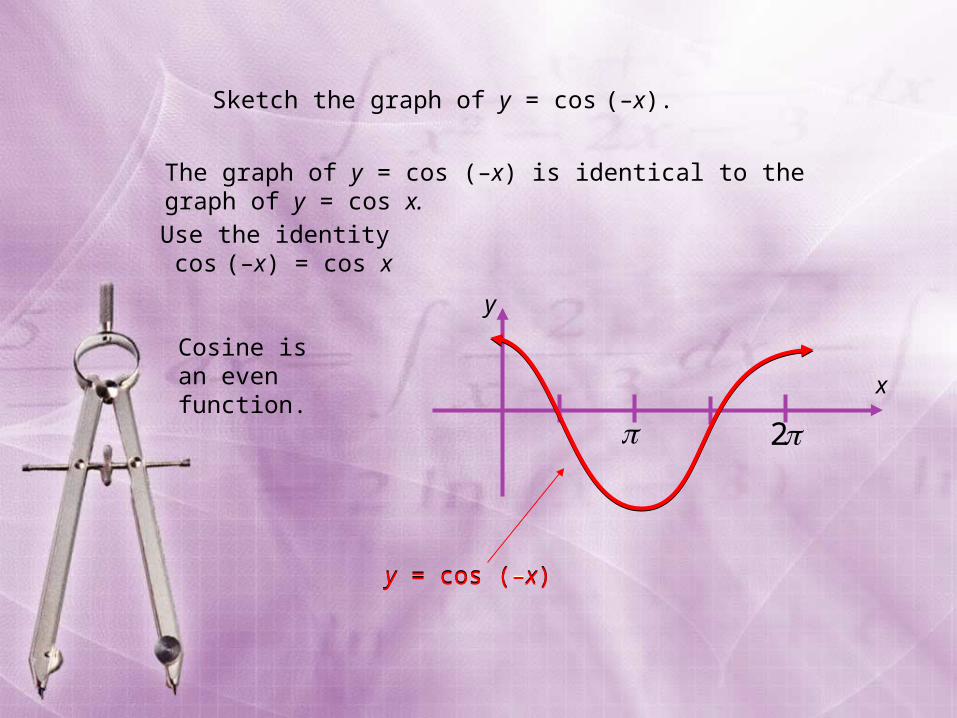
y = cos (–x)
Sketch the graph of y = cos (–x).
Use the identity cos (–x) = cos x
The graph of y = cos (–x) is identical to the graph of y = cos x.
y = cos (–x)
Cosine is an even function.

Related Documents