GRAFIKA KOMPUTER ~ M. Ali Fauzi

GRAFIKA KOMPUTER ~ M. Ali Fauzi. Drawing 2 D Graphics.
Dec 30, 2015
Welcome message from author
This document is posted to help you gain knowledge. Please leave a comment to let me know what you think about it! Share it to your friends and learn new things together.
Transcript

GRAFIKA KOMPUTER~ M. Ali Fauzi

Drawing
2D Graphics

VIEWPORTTRANSFORMATION

Recall :Coordinate SystemglutReshapeFunc(reshape);
void reshape(int w, int h){
glViewport(0,0,(GLsizei) w, (GLsizei) h);glMatrixMode(GL_PROJECTION);glLoadIdentity();gluOrtho2D(-1.0, 1.0, -1.0, 1.0);
}

World Coordinate System

World Coordinate System
00 1 2-2 -1
1
2
-1

World Coordinate System
~ The representation of an object is measured in some physical or abstract units.~ Space in which the object geometry is defined.

World Window
0 1 2-2 -1
1
2
-1

World Window
0 1 2-2 -1
1
2
-1

World Window
~ Rectangle defining the part of the world we wish to display.~ Area that can be seen (what is captured by the camera), measured in OpenGL coordinates.
World Window
~ Known as clipping-area
void reshape(int w, int h){
glViewport(0,0,(GLsizei) w, (GLsizei) h);glMatrixMode(GL_PROJECTION);glLoadIdentity();gluOrtho2D(-1.0, 1.0, -1.0, 1.0);
}
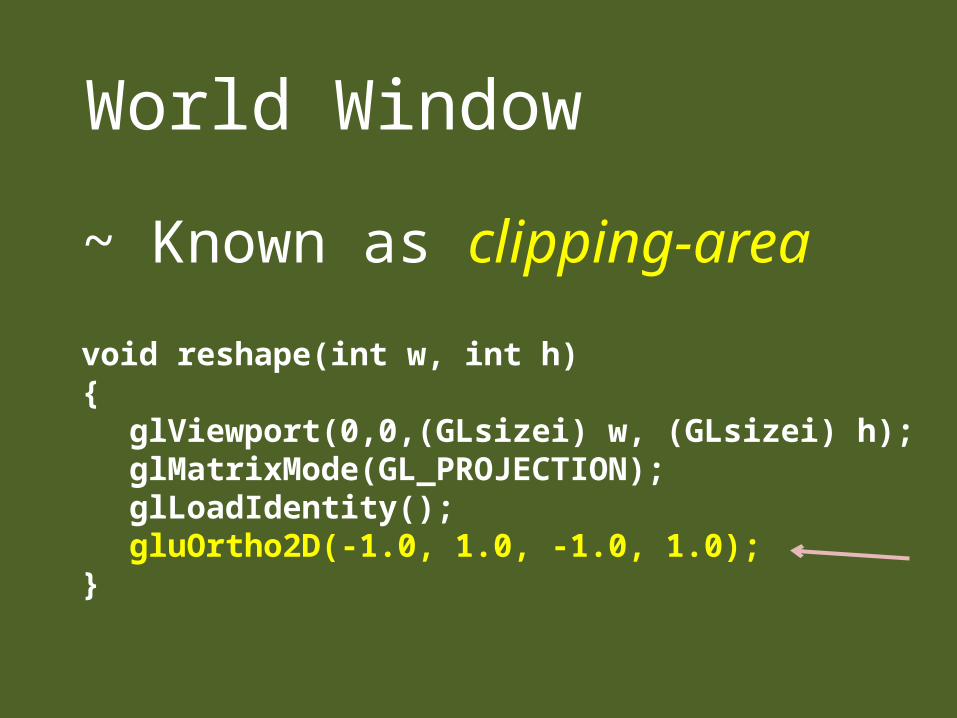
The Default
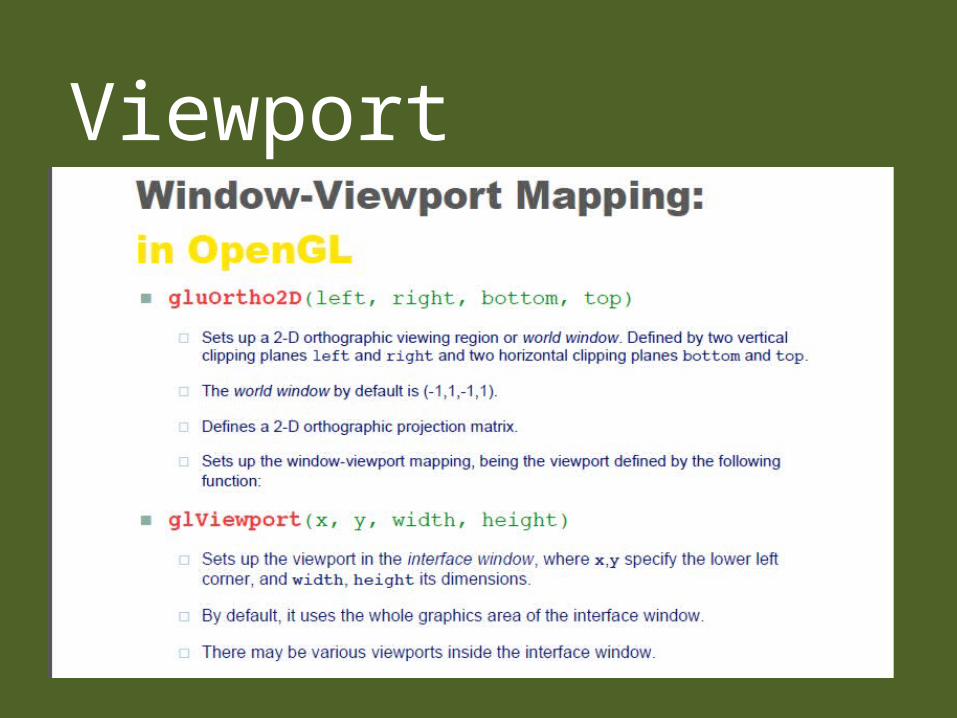
The default OpenGL 2D clipping-area is an orthographic view with x and y in the range of -1.0
and 1.0, i.e., a 2x2 square with centered at the origin.

World Window
~ Reset to the default
void reshape(int w, int h){
glViewport(0,0,(GLsizei) w, (GLsizei) h);glMatrixMode(GL_PROJECTION);glLoadIdentity();gluOrtho2D(-1.0, 1.0, -1.0, 1.0);
}

ViewportScreen
Screenwindow
InterfaceWindow
Viewport

Screen Coordinate System
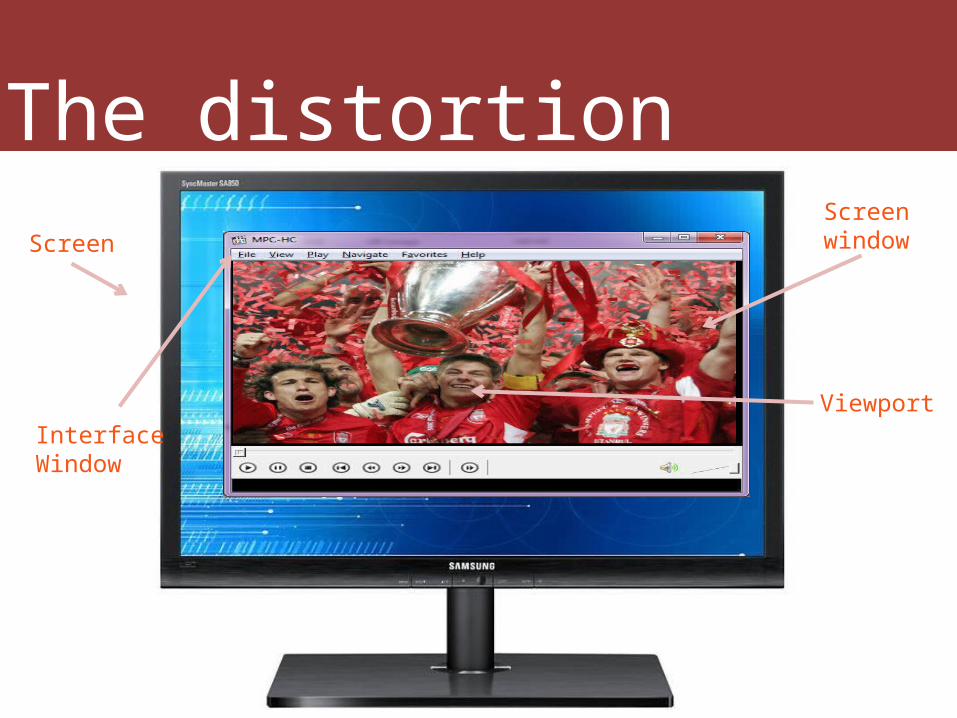
~ Space in which the image is displayed
~ For example : 800x600 pixels
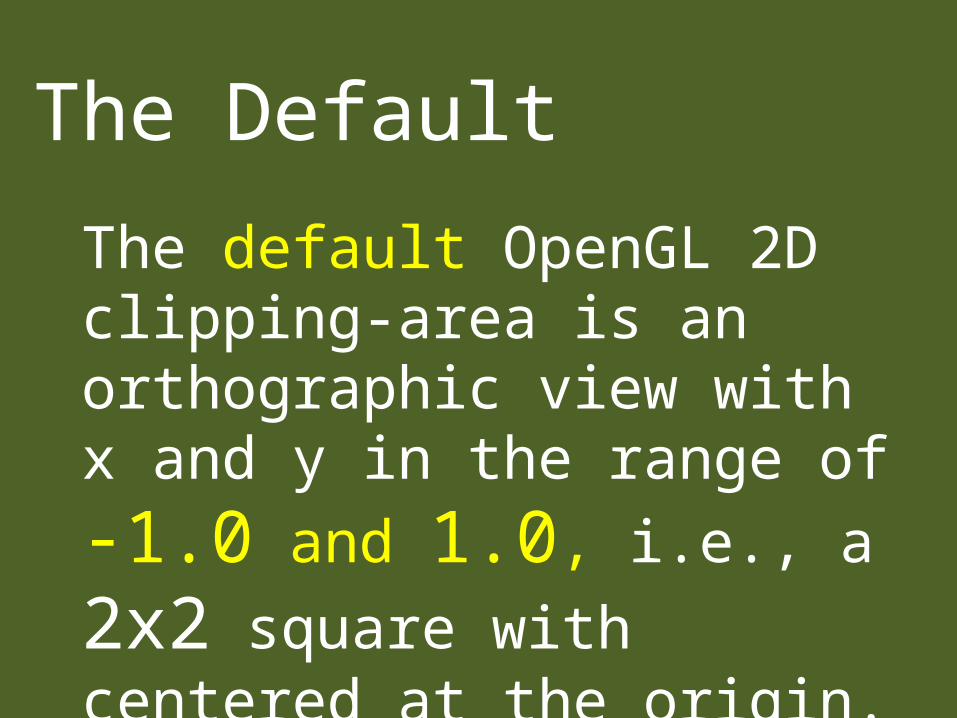
Interface Window
~ Visual representation of the screen coordinate system for windowed displays
glutInitWindowSize(320, 320); glutInitWindowPosition(50, 50);

Vewport
~ A rectangle on the interface window defining where the image will appear, ~ The default is the entire screen or interface window.

Viewport

Interface Window
~ Set the viewport to the entire screen / windowvoid reshape(int w, int h){
glViewport(0,0,(GLsizei) w, (GLsizei) h);glMatrixMode(GL_PROJECTION);glLoadIdentity();gluOrtho2D(-1.0, 1.0, -1.0, 1.0);
}

Interface Window
~ Set the viewport to half of the screen / window
glutInitWindowSize(320, 320); glutInitWindowPosition(50, 50);
--------------------------------
glViewport(0,0,160,160);

ViewportScreen
Screenwindow
InterfaceWindow
Viewport
Viewport
Viewport Transformation
~ The Process called viewport transformation

THE ASPECT RATIOPROBLEM
The distortionScreen
Screenwindow
InterfaceWindow
Viewport

The distortionScreen
Screenwindow
InterfaceWindow
Viewport

Ratio
~ R = Aspect Ratio of World

Ratio

Keeping the RatioScreen
Screenwindow
InterfaceWindow
Viewport

Keeping the RatioScreen
Screenwindow
InterfaceWindow
Viewport

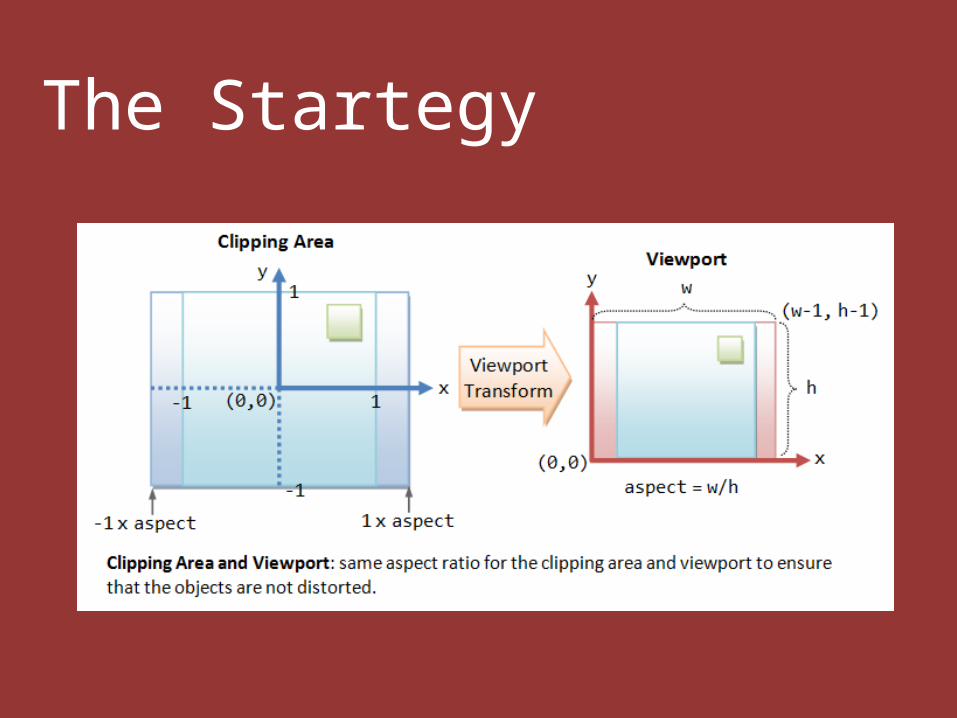
The Startegy
~ To avoid distortion, we must change the size of the world window accordingly.~ For that, we assume that the initial world window is a square with side length L

The Startegy
~ DefaultglOrtho2D (-L, L, -L, L);
~ For example L=1, glOrtho2D (-1, 1, -1, 1);

The Startegy
if (w <= h)glOrtho2D(-L, L, -L * h/w, L * h/w);
elseglOrtho2D(-L * w/h, L * w/h, -L, L);
if (w <= h)glOrtho2D(-1, 1, -1 * h/w, 1 * h/w);
elseglOrtho2D(-1 * w/h, 1 * w/h, -1, L);
The Startegy
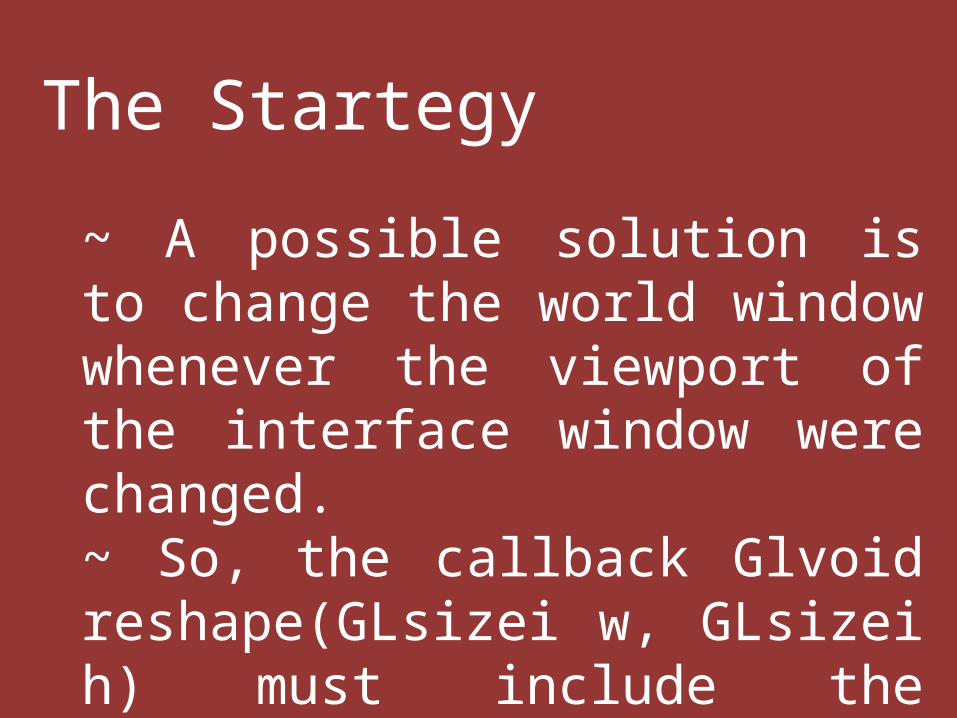
The Startegy
~ A possible solution is to change the world window whenever the viewport of the interface window were changed. ~ So, the callback Glvoid reshape(GLsizei w, GLsizei h) must include the following code :

void reshape(GLsizei width, GLsizei height) {
if (height == 0) height = 1; GLfloat aspect = (GLfloat)width/(GLfloat)height; glViewport(0, 0, width, height); glMatrixMode(GL_PROJECTION); glLoadIdentity(); if (width >= height) {
gluOrtho2D(-1.0 * aspect, 1.0 * aspect, -1.0, 1.0);
} else {
gluOrtho2D(-1.0, 1.0, -1.0 / aspect, 1.0 / aspect);
} }

/* Handler for window re-size event. Called back when the window first appears and whenever the window is re-sized with its new width and height */ void reshape(GLsizei width, GLsizei height) {
// GLsizei for non-negative integer // Compute aspect ratio of the new window if (height == 0) height = 1; // To prevent divide by 0 GLfloat aspect = (GLfloat)width / (GLfloat)height; // Set the viewport to cover the new window glViewport(0, 0, width, height); // Set the aspect ratio of the clipping area to match the viewport glMatrixMode(GL_PROJECTION); glLoadIdentity(); // Reset the projection matrix if (width >= height) {
// aspect >= 1, set the height from -1 to 1, with larger width gluOrtho2D(-1.0 * aspect, 1.0 * aspect, -1.0, 1.0);
} else {
// aspect < 1, set the width to -1 to 1, with larger height gluOrtho2D(-1.0, 1.0, -1.0 / aspect, 1.0 / aspect);
} }

2DTRANSFORMATION

Transformation
Is The geometrical changes of an object from a current state to modified state.
Why Needed?
To manipulate the initially created object and to display the modified object without having to redraw it

Transformation PipelineVertex Modelview
MatrixProjection
MatrixPerspective
DivisionViewport
Transformation
ObjectCoordinates
EyeCoordinates
ClipCoordinates
Normalizeddevice
Coordinates
WindowCoordinates
GL_MODELVIEW modeglTranslate()glRotate()glScale()glLoadMatrix()glMultMatrix()gluLookAt()
GL_PROJECTION modeglOrtho()gluOrtho2D()glFrustum()gluPerspective()
glViewport()

Types of Transformation
~ Modeling. In 3D graphics, handles moving objects around the scene.~ Viewing.In 3D graphics, specifies the location of the camera.
Types of Transformation
~ Projection.Defines the viewing volume and clipping planes from eye coordinate to clip coordinates.

Types of Transformation
~ Viewport. Maps the projection of the scene into the rendering window.~ Modelview.Combination of the viewing and modeling transformations.

Transformation Matrix
Transformations in OpenGL using matrix concept
Matrix Modes
~ ModelView Matrix (GL_MODELVIEW)
These concern model-related operations such as translation, rotation, and scaling, as well as viewing transformations.
Matrix Modes
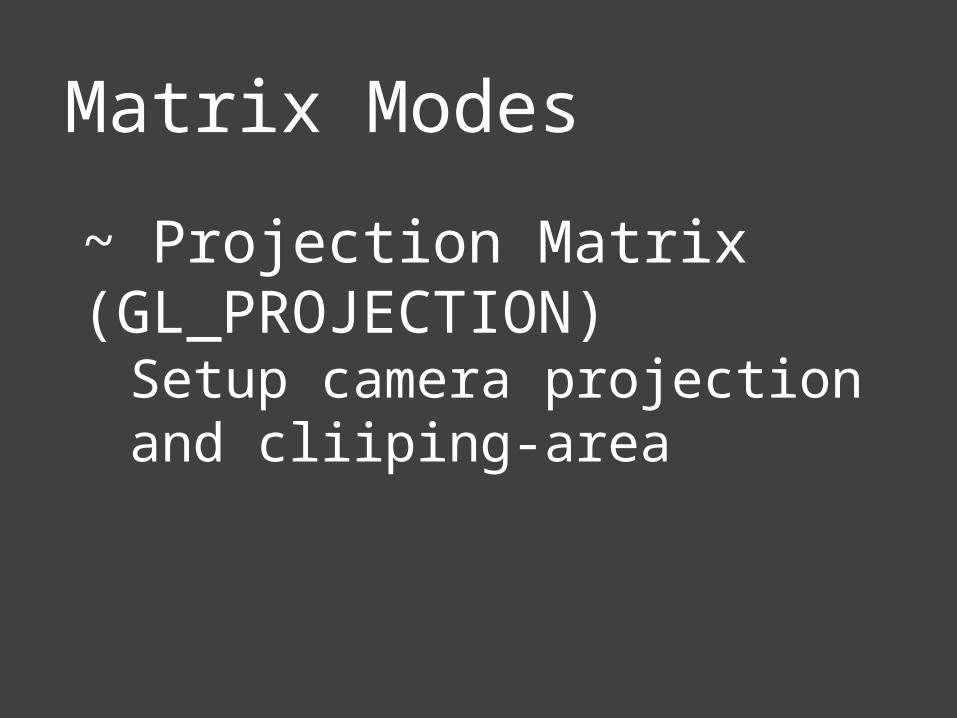
~ Projection Matrix (GL_PROJECTION)
Setup camera projection and cliiping-area

Transformation PipelineVertex Modelview
MatrixProjection
MatrixPerspective
DivisionViewport
Transformation
ObjectCoordinates
EyeCoordinates
ClipCoordinates
Normalizeddevice
Coordinates
WindowCoordinates
GL_MODELVIEW modeglTranslate()glRotate()glScale()glLoadMatrix()glMultMatrix()gluLookAt()
GL_PROJECTION modeglOrtho()gluOrtho2D()glFrustum()gluPerspective()
glViewport()

Why do we use matrix?
~ More convenient organization of data.~ More efficient processing~ Enable the combination of various concatenations

THE MATRIX
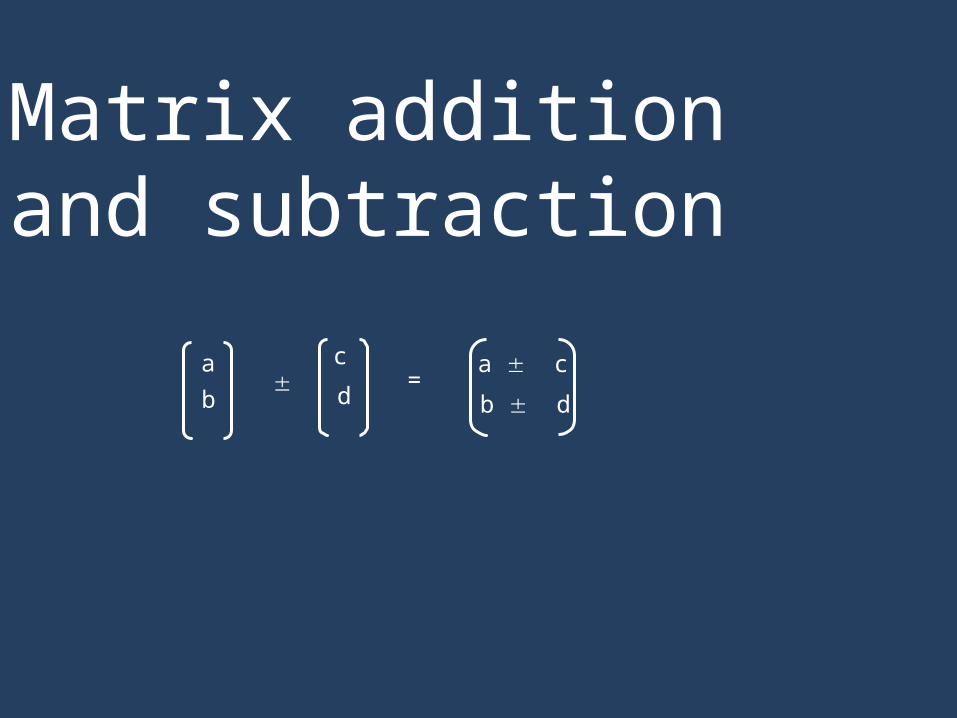
Matrix addition and subtraction
a
b
c
d a c
b d=
Matrix addition and subtraction
1-3
56+
=

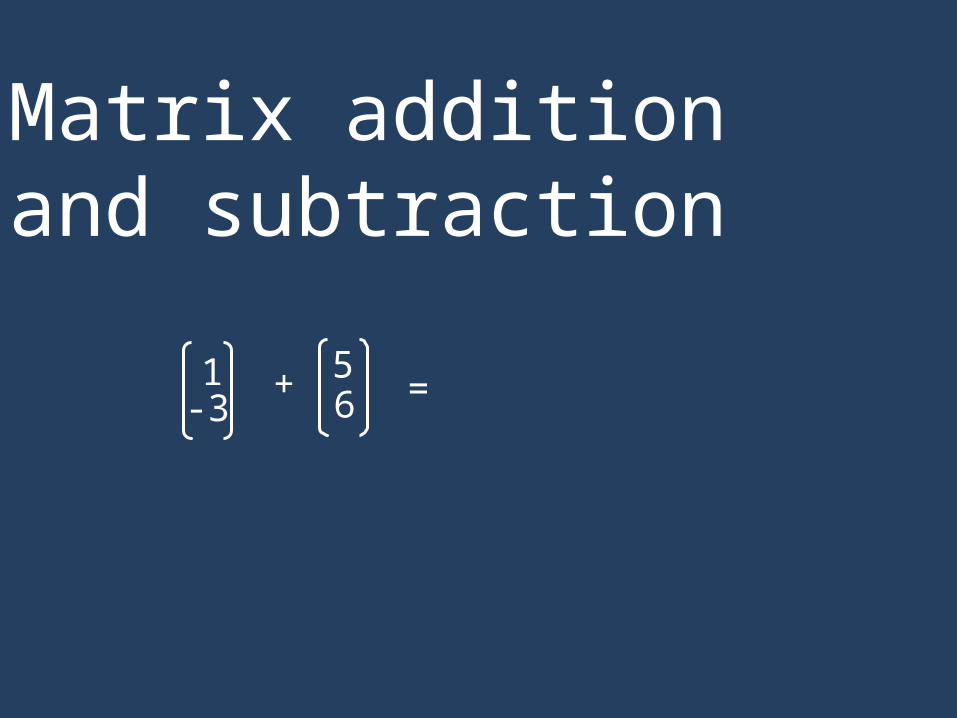
Matrix addition and subtraction
1-3
56+
=63

Matrix addition and subtraction
1-3
+ =
3 1-1 4
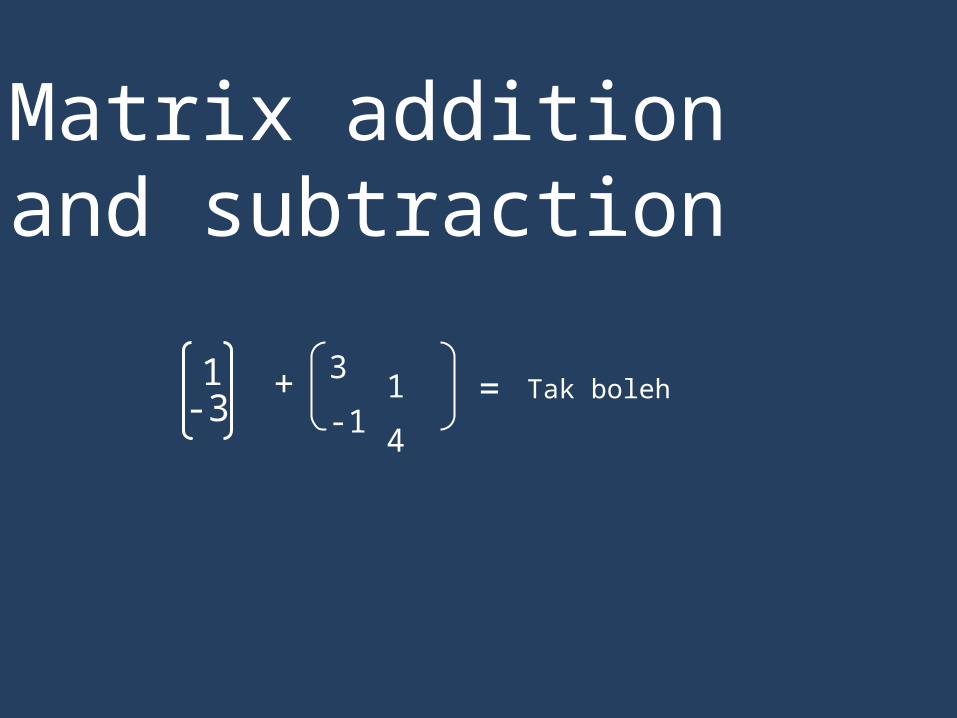
Matrix addition and subtraction
1-3
+ =
3 1-1 4
Tak boleh

Matrix Multiplication
a bc d
e fg h. =
a.e + b.g a.f + b.hc.e + d.g c.f + d.h
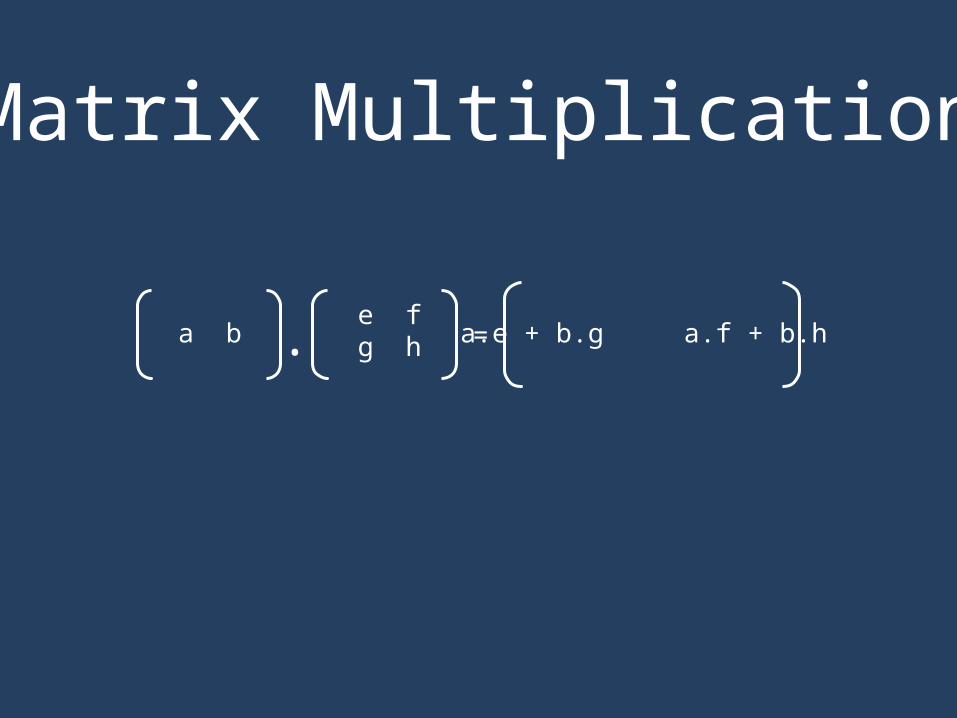
Matrix Multiplication
a be fg h. = a.e + b.g a.f + b.h

Matrix Multiplication
1 2 1 23 1. =

Matrix Multiplication
1 2 1 23 1. = 6 6

Matrix Multiplication
12
1 23 1. =

Matrix Multiplication
12
1 23 1. = Tak boleh

Matrix Types
efe f
Row Vector Column Vector

Matrix Multiplication
a bc d
ef. =
e fa bc d. =
e fa cb d. =
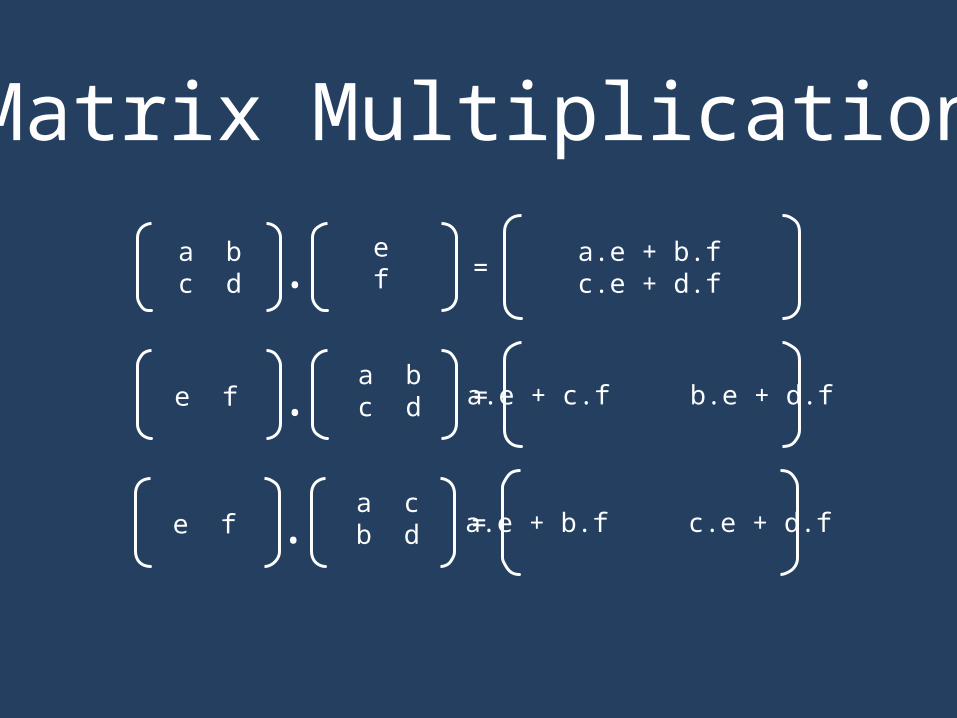
Matrix Multiplication
a bc d
ef. =
a.e + b.fc.e + d.f
e fa bc d. = a.e + c.f b.e + d.f
e fa cb d. = a.e + b.f c.e + d.f

Matrix Math
We’ll use the column-vector representation for a point.
y
x

Matrix Math
Which implies that we use pre-multiplication of the transformation – it appears before the point to be transformed in the equation.
DyCx
ByAx
y
x
DC
BA

THETRANSFORMATION
Translation
A translation moves all points in an object along the same straight-line path to new positions.

Translation
The path is represented by a vector, called the translation or shift vector.
x’y’
xy
tx
ty
= +
New Position Current Position Translation Vector
P' = P + T

Translation
x’y’
xy
tx
ty
= +
(2, 2) tx= 6
ty=4
?
x’y’
22
64
= +
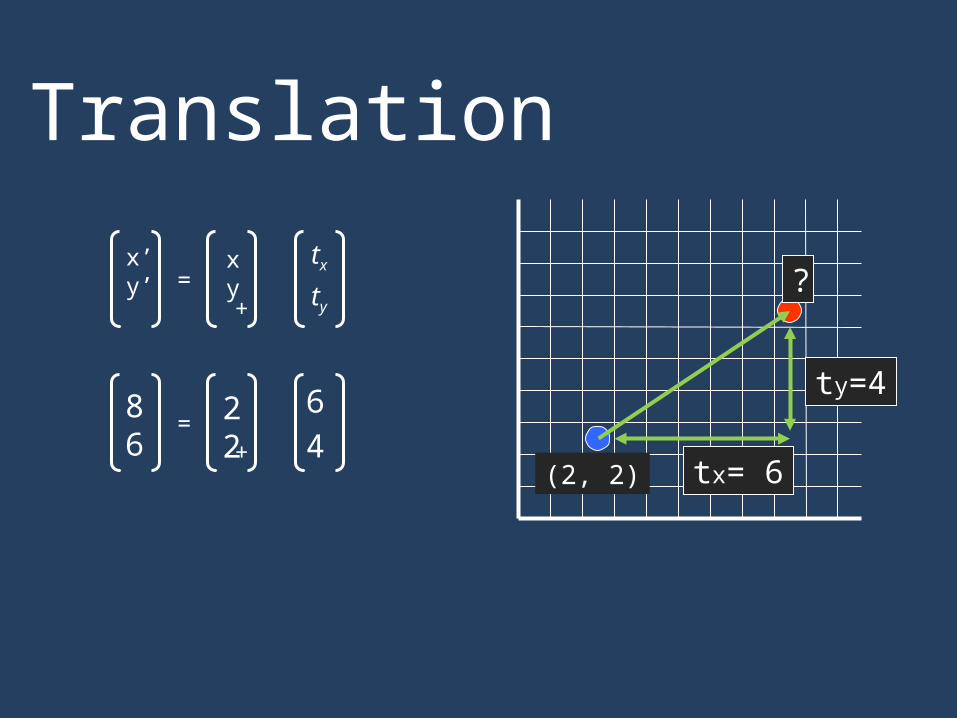
Translation
x’y’
xy
tx
ty
= +
(2, 2) tx= 6
ty=4
?
86
22
64
= +

Rotation
A rotation repositions all points in an object along a circular path in the plane centered at the pivot point.

Rotation
P
P’
p'x = px cos – py sin
p'y = px sin + py cos

Rotation
The transformation using Rotation Matrix
New Position Rotation Matrix Current Position
P' = R . P
y
x
y
x
cossin
sincos
'
'

Rotation
The transformation using Rotation Matrix
New Position Rotation Matrix Current Position
P' = R . P
y
x
yx
yx
cossin
sincos
cossin
sincos
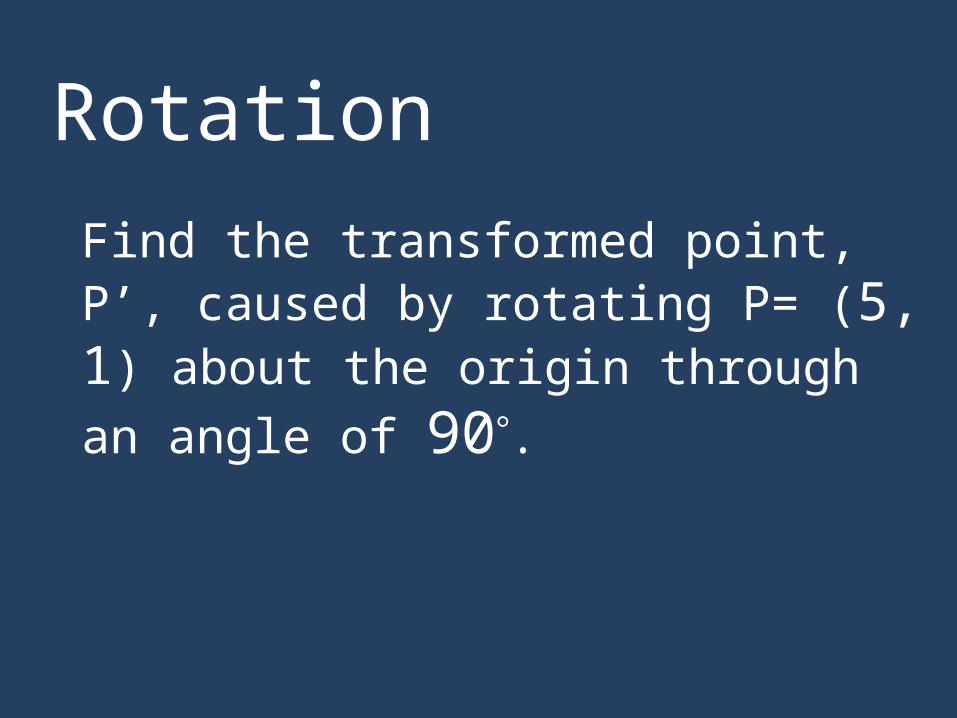
Rotation
Find the transformed point, P’, caused by rotating P= (5, 1) about the origin through an angle of 90.
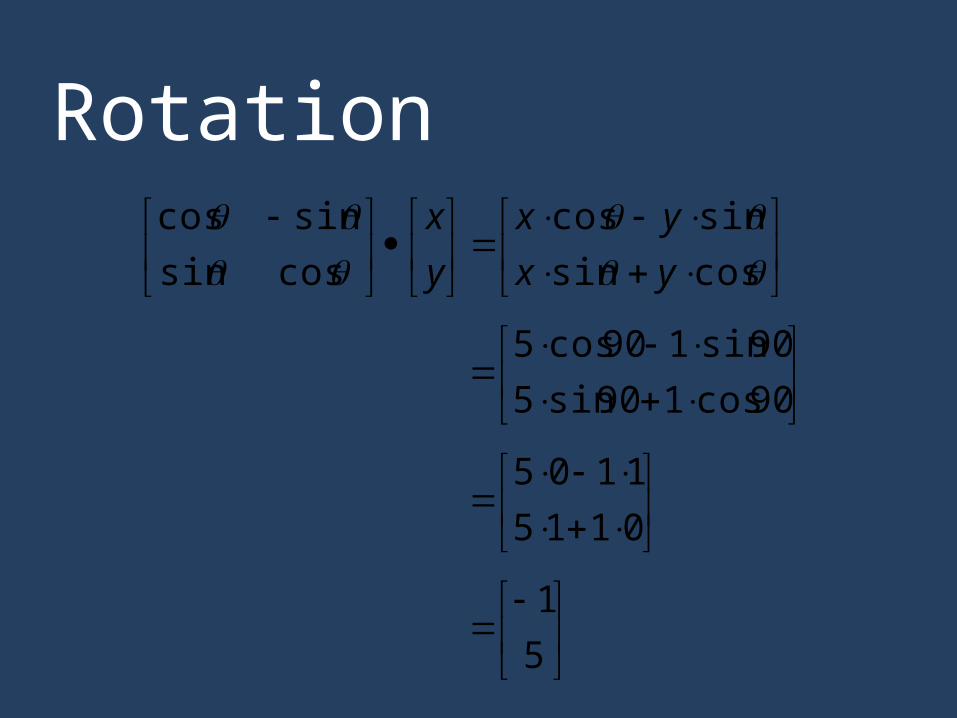
Rotation
cossin
sincos
cossin
sincos
yx
yx
y
x
90cos190sin5
90sin190cos5
0115
1105
5
1

Scaling
Scaling changes the size of an object and involves two scale factors, Sx and Sy for the x- and y- coordinates respectively.

Scaling
Scales are about the origin.
P
P’
p'x = sx • px
p'y = sy • py

Scaling
The transformation using Scale Matrix
New Position Scale Matrix Current Position
P' = S • P
y
x
Sy
Sx
y
x
0
0
'
'

Scaling
The transformation using Scale Matrix
New Position Scale Matrix Current Position
P' = S • P
y
x
Sy
Sx
ySy
xSx
0
0
.
.

Scaling
If the scale factors are in between 0 and 1 the points will be moved closer to the origin the object will be smaller.
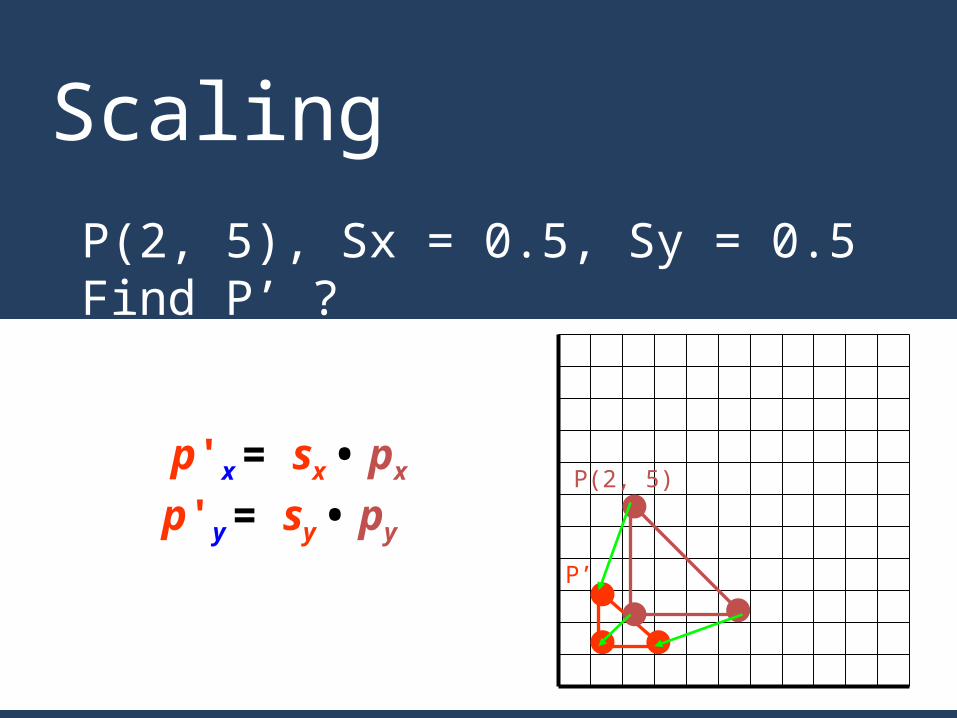
Scaling
P(2, 5), Sx = 0.5, Sy = 0.5Find P’ ?
p'x = sx • px
p'y = sy • py
P(2, 5)
P’

Scaling
If the scale factors are larger than 1 the points will be moved away from the origin the object will be larger.

Scaling
P(2, 5), Sx = 2, Sy = 2Find P’ ?
p'x = sx • px
p'y = sy • py
P(2, 5)
P’

Scaling
If the scale factors are not the same, Sx Sy differential scalingChange in size and shape

Scaling
If the scale factors are the same, Sx = Sy uniform scaling
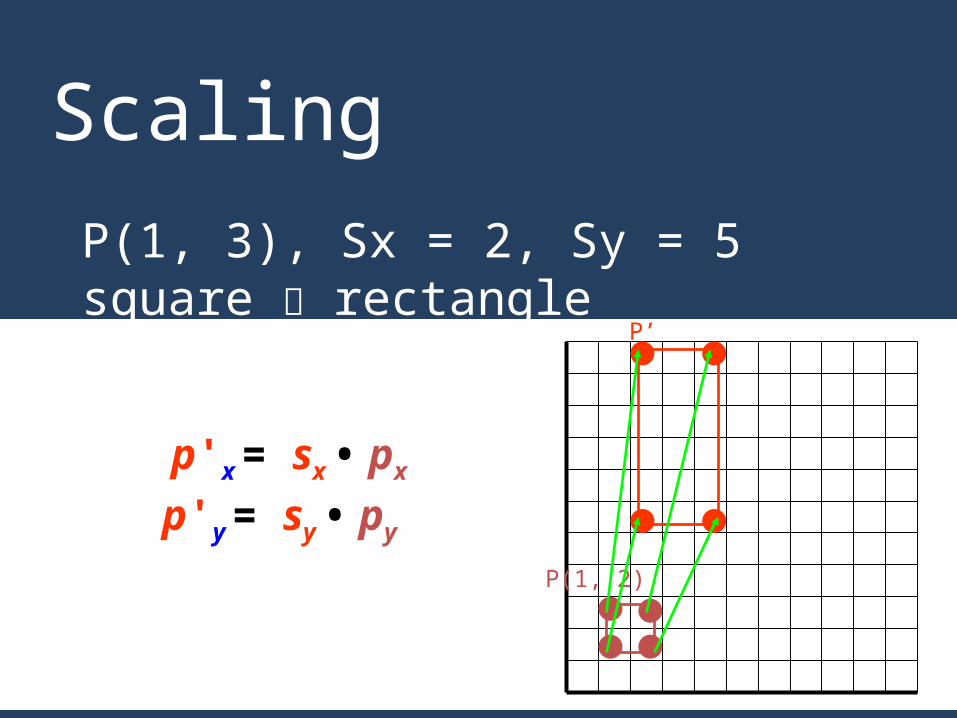
Scaling
P(1, 3), Sx = 2, Sy = 5square rectangle
p'x = sx • px
p'y = sy • py
P(1, 2)
P’

Scaling
What does scaling by 1 do?Sx=1 , Sy=1

Scaling
What does scaling by 1 do?Sx=1 , Sy=1 Nothing changedWhat is that matrix called?

Scaling
What does scaling by 1 do?Sx=1 , Sy=1 Nothing changedWhat is that matrix called?Identity Matrix
y
x
y
x
10
01

Scaling
What does scaling by a negative value do? Sx=-2 , Sy=-2

Scaling
What does scaling by a negative value do? Sx=-2 , Sy=-2 Moved to Different Quadran

COMBINING TRANSFORMATIONS

Combining Transf
For example, we want to rotate/scale then we want to do translation
P' = M • P + A

Combining Transf
For example, we want to translate, then we want to rotate and sclae
P' = S • R • (A + P)

Combining Transf
P (Px,Py)=(4 , 6) : Translate(6 , -3) -> Rotation(60˚) -> Scaling
(0.5 , 2.0)P' = S • R • (A + P)

Combining Transf
3
10
3
6
6
4
'
'
Ty
Tx
Py
Px
y
x
2.10
4.2
3
10
5.087.0
87.05.0
60cos60sin
60sin60cos
'
'
Py
Px
y
x
3.20
2.1
2.10
4.2
20
05.0
0
0
'
'
Py
Px
Sy
Sx
y
x
Combining Transf
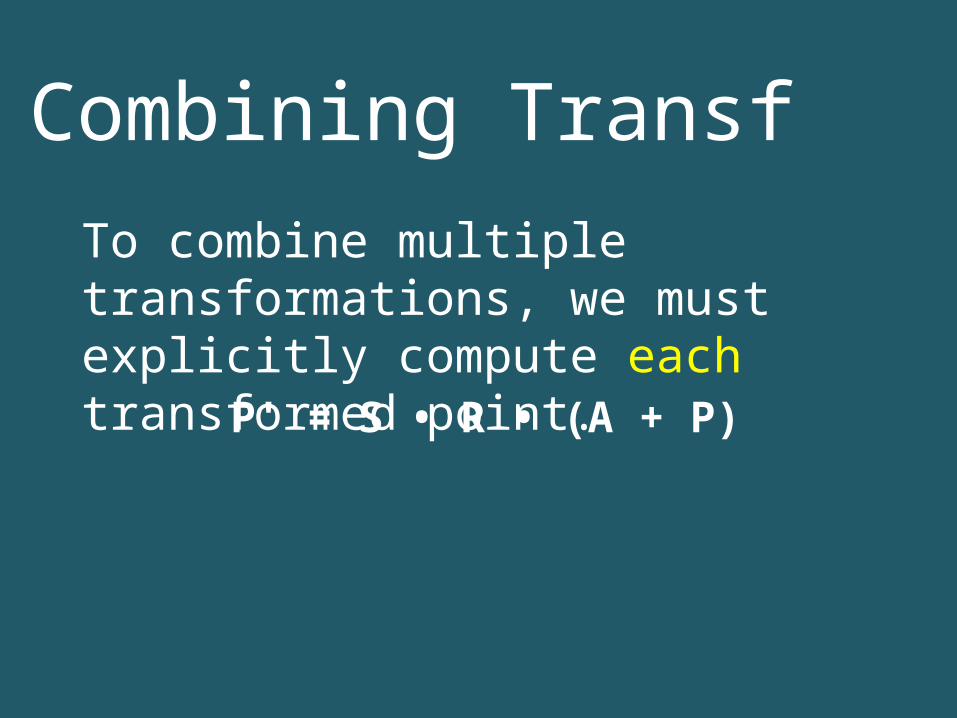
To combine multiple transformations, we must explicitly compute each transformed point.P' = S • R • (A + P)

Combining Transf
It’d be nicer if we could use the same matrix operation all the time. But we’d have to combine multiplication and addition into a single operation.P' = S • R • (A + P)

Combining Transf
Let’s move our problem into one dimension higher
HOMOGENOUS COORDINATES

Homogenous Coord
Let point (x, y) in 2D be represented by point (x, y, 1) in the new space.
y y
x
x
w
Homogenous Coord
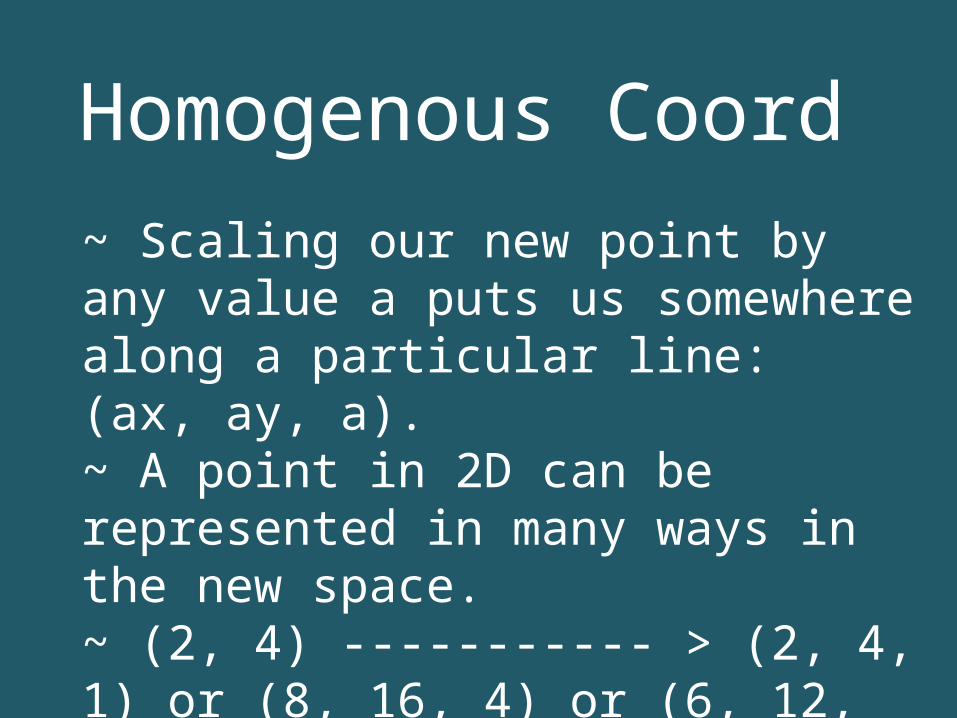
~ Scaling our new point by any value a puts us somewhere along a particular line: (ax, ay, a).~ A point in 2D can be represented in many ways in the new space.~ (2, 4) ----------- > (2, 4, 1) or (8, 16, 4) or (6, 12, 3) or (2, 4, 1) or etc.
Homogenous Coord
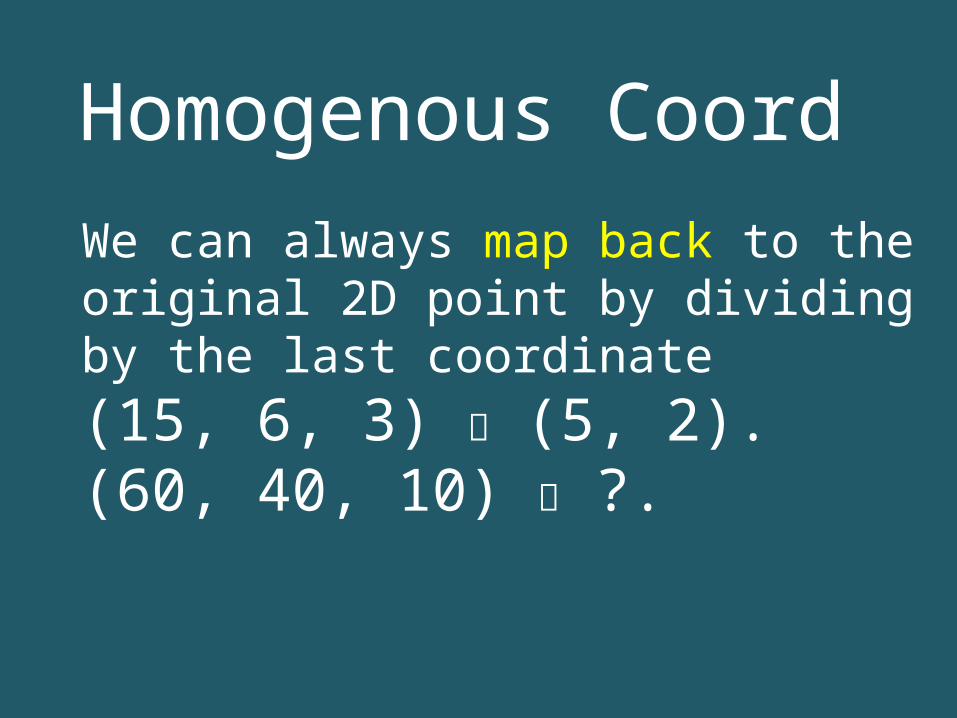
We can always map back to the original 2D point by dividing by the last coordinate(15, 6, 3) (5, 2).(60, 40, 10) ?.

Homogenous Coord
The fact that all the points along each line can be mapped back to the same point in 2D gives this coordinate system its name – homogeneous coordinates.

Homogenous Coord
With homogeneous coordinates, we can combine multiplication and addition into a single operation.

Homogenous Coord
Point in column-vector:
Our point now has three coordinates. So our matrix is needs to be 3x3.
1
y
x
y
x

Homogenous Coord
Translation:
x’y’
xy
tx
ty
= +
1100
10
01
1
y
x
t
t
y
x
y
x

Homogenous Coord
Rotation:
y
x
y
x
cossin
sincos
'
'
1100
0cossin
0sincos
1
y
x
y
x
Homogenous Coord
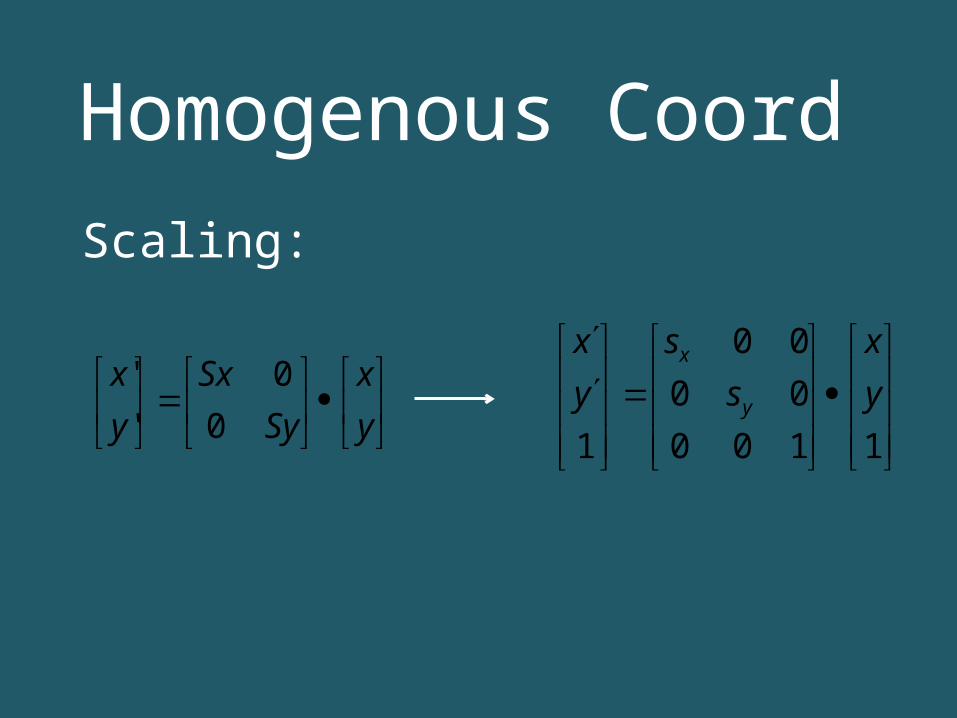
Scaling:
1100
00
00
1
y
x
s
s
y
x
y
x
y
x
Sy
Sx
y
x
0
0
'
'

Homogenous Coord
P (Px,Py)=(4 , 6) : Translate(6 , -3) -> Rotation(60˚) -> Scaling
(0.5 , 2.0)
1
3.20
2.1
1
6
4
100
310
601
100
060cos60sin
060sin60cos
100
020
005.0
1
Qy
Qx

Homogenous Coord
We can represent any sequence of transformations as a single matrix
1
3.20
2.1
1
6
4
100
310
601
100
060cos60sin
060sin60cos
100
020
005.0
1
Qy
Qx

Homogenous Coord
Does the order of operations matter?

Homogenous CoordYes, the order does matter!
1. Translate2. Rotate
1. Rotate2. Translate

Homogenous CoordYes, the order does matter!A . B = B . A?

Homogenous CoordYes, the order does matter!A . B B . A
dhcfdgce
bhafbgae
hg
fe
dc
ba
hdgbhcga
fdebfcea
dc
ba
hg
fe
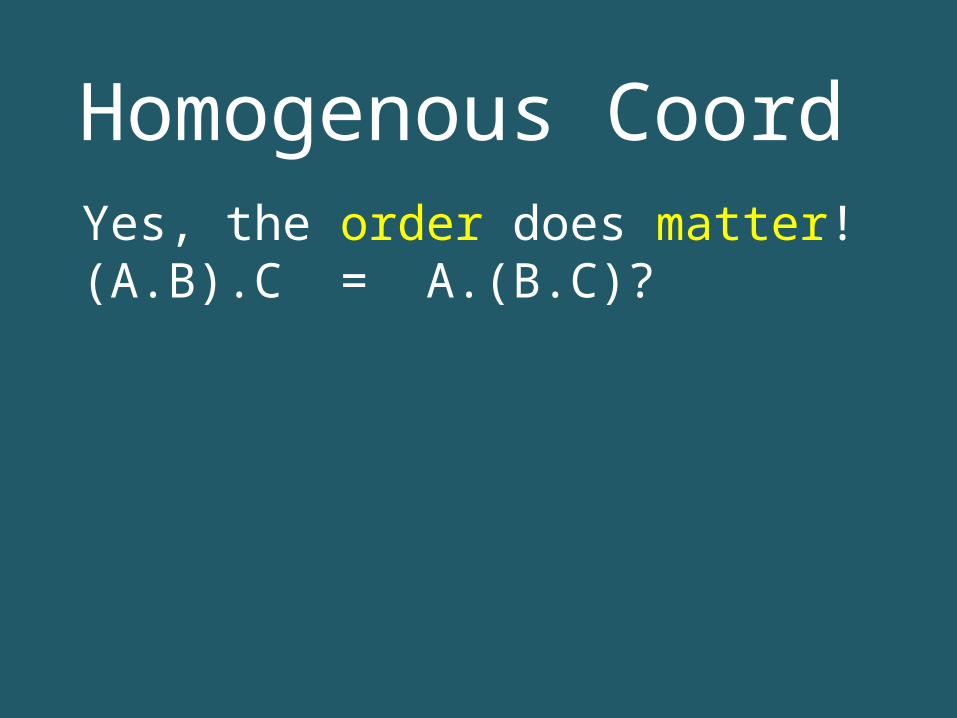
Homogenous CoordYes, the order does matter!(A.B).C = A.(B.C)?
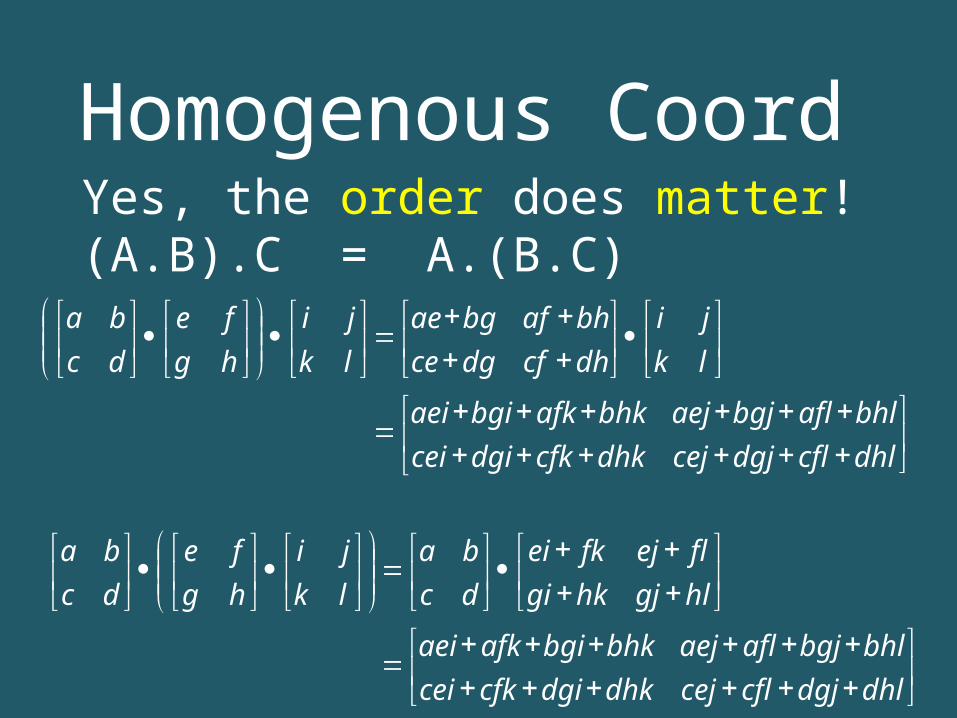
Homogenous CoordYes, the order does matter!(A.B).C = A.(B.C)
ûëúù
êé
++++++++++++
=
úû
ùêë
é·ú
û
ùêë
é++++
=
dhlcfldgjcejdhkcfkdgiceibhlaflbgjaejbhkafkbgiaei
lkji
dhcfdgcebhafbgae
úû
ùêë
é·÷÷
ø
öççè
æúû
ùêë
é·ú
û
ùêë
é
lkji
hgfe
dcba
úû
ùêë
é++++++++++++
=
úû
ùêë
é++++
·úû
ùêë
é=
dhldgjcflcejdhkdgicfkceibhlbgjaflaejbhkbgiafkaei
hlgjhkgiflejfkei
dcba
÷÷ø
öççè
æúû
ùêë
é·ú
û
ùêë
é·ú
û
ùêë
é
lkji
hgfe
dcba

Composite Transformation Matrix• Arrange the transformation matrices in order from
right to left.• General Pivot- Point Rotation
• Operation :-1. Translate (pivot point is moved to origin)2. Rotate about origin3. Translate (pivot point is returned to original
position)
T(pivot) • R() • T(–pivot)

T(pivot) • R() • T(–pivot)
1 0 -tx
0 1 -ty
0 0 1
cos -sin 0sin cos 0 0 0 1
1 0 tx
0 1 ty
0 0 1 . .
cos -sin -tx cos+ ty sin + tx
sin cos -tx sin - ty cos + ty
0 0 1
cos -sin -tx cos+ ty sin sin cos -tx sin - ty cos 0 0 1
1 0 tx
0 1 ty
0 0 1 .
Composite Transformation Matrix
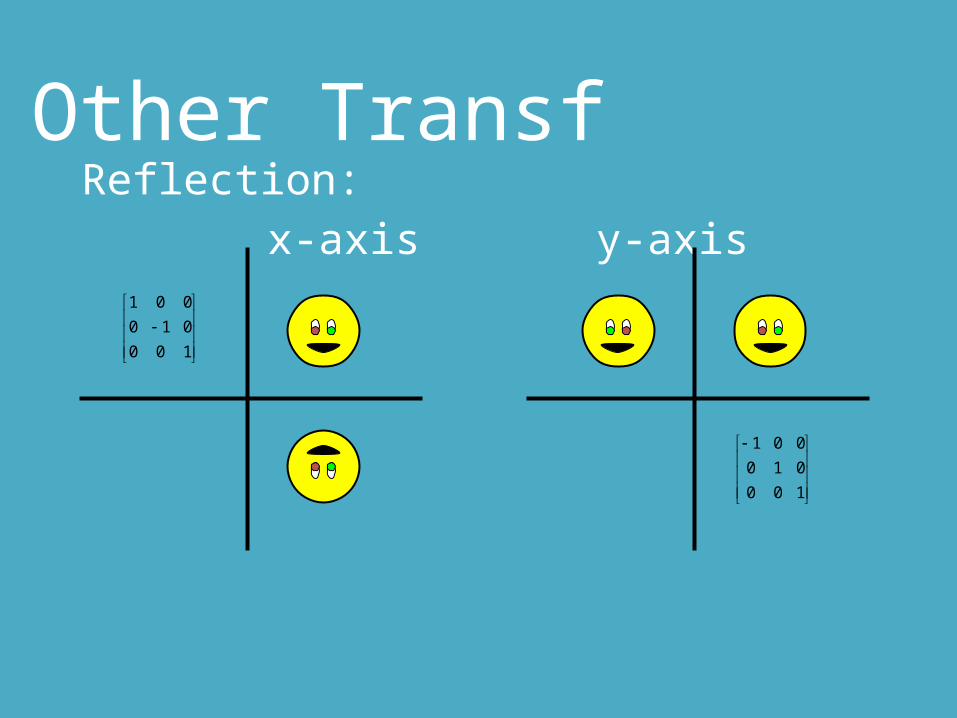
Reflection: x-axis y-axis
100
010
001
100
010
001
Other Transf

Reflection: origin line
x=y
100
010
001
100
001
010
Other Transf

• Shearing-x
• Shearing-y
1100
010
01
1
)( Py
PxS
Qy
Qx
SxShear
1100
01
001
1
)( Py
Px
SQy
Qx
SyShear
Sebelum Sesudah
Sebelum Sesudah
Shearing
Related Documents