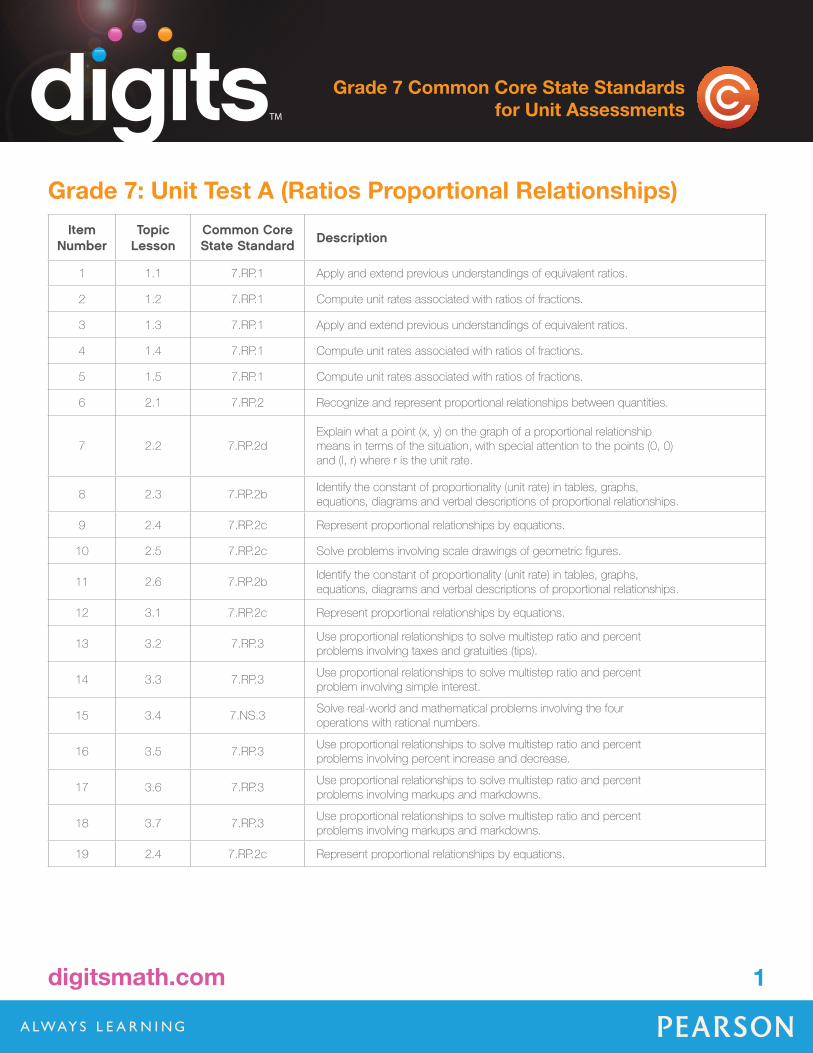
digitsmath.com 1 Grade 7 Common Core State Standards for Unit Assessments Item Number Topic Lesson Common Core State Standard Description 1 1.1 7.RP.1 Apply and extend previous understandings of equivalent ratios. 2 1.2 7.RP.1 Compute unit rates associated with ratios of fractions. 3 1.3 7.RP.1 Apply and extend previous understandings of equivalent ratios. 4 1.4 7.RP.1 Compute unit rates associated with ratios of fractions. 5 1.5 7.RP.1 Compute unit rates associated with ratios of fractions. 6 2.1 7.RP.2 Recognize and represent proportional relationships between quantities. 7 2.2 7.RP.2d Explain what a point (x, y) on the graph of a proportional relationship means in terms of the situation, with special attention to the points (0, 0) and (l, r) where r is the unit rate. 8 2.3 7.RP.2b Identify the constant of proportionality (unit rate) in tables, graphs, equations, diagrams and verbal descriptions of proportional relationships. 9 2.4 7.RP.2c Represent proportional relationships by equations. 10 2.5 7.RP.2c Solve problems involving scale drawings of geometric figures. 11 2.6 7.RP.2b Identify the constant of proportionality (unit rate) in tables, graphs, equations, diagrams and verbal descriptions of proportional relationships. 12 3.1 7.RP.2c Represent proportional relationships by equations. 13 3.2 7.RP.3 Use proportional relationships to solve multistep ratio and percent problems involving taxes and gratuities (tips). 14 3.3 7.RP.3 Use proportional relationships to solve multistep ratio and percent problem involving simple interest. 15 3.4 7.NS.3 Solve real-world and mathematical problems involving the four operations with rational numbers. 16 3.5 7.RP.3 Use proportional relationships to solve multistep ratio and percent problems involving percent increase and decrease. 17 3.6 7.RP.3 Use proportional relationships to solve multistep ratio and percent problems involving markups and markdowns. 18 3.7 7.RP.3 Use proportional relationships to solve multistep ratio and percent problems involving markups and markdowns. 19 2.4 7.RP.2c Represent proportional relationships by equations. Grade 7: Unit Test A (Ratios Proportional Relationships)

Welcome message from author
This document is posted to help you gain knowledge. Please leave a comment to let me know what you think about it! Share it to your friends and learn new things together.
Transcript
digitsmath.com 1
Grade 7 Common Core State Standardsfor Unit Assessments
Item Number
Topic Lesson
Common Core State Standard Description
1 1.1 7.RP.1 Apply and extend previous understandings of equivalent ratios.
2 1.2 7.RP.1 Compute unit rates associated with ratios of fractions.
3 1.3 7.RP.1 Apply and extend previous understandings of equivalent ratios.
4 1.4 7.RP.1 Compute unit rates associated with ratios of fractions.
5 1.5 7.RP.1 Compute unit rates associated with ratios of fractions.
6 2.1 7.RP.2 Recognize and represent proportional relationships between quantities.
7 2.2 7.RP.2dExplain what a point (x, y) on the graph of a proportional relationship means in terms of the situation, with special attention to the points (0, 0)and (l, r) where r is the unit rate.
8 2.3 7.RP.2bIdentify the constant of proportionality (unit rate) in tables, graphs, equations, diagrams and verbal descriptions of proportional relationships.
9 2.4 7.RP.2c Represent proportional relationships by equations.
10 2.5 7.RP.2c Solve problems involving scale drawings of geometric figures.
11 2.6 7.RP.2bIdentify the constant of proportionality (unit rate) in tables, graphs, equations, diagrams and verbal descriptions of proportional relationships.
12 3.1 7.RP.2c Represent proportional relationships by equations.
13 3.2 7.RP.3Use proportional relationships to solve multistep ratio and percent problems involving taxes and gratuities (tips).
14 3.3 7.RP.3Use proportional relationships to solve multistep ratio and percent problem involving simple interest.
15 3.4 7.NS.3Solve real-world and mathematical problems involving the four operations with rational numbers.
16 3.5 7.RP.3Use proportional relationships to solve multistep ratio and percent problems involving percent increase and decrease.
17 3.6 7.RP.3Use proportional relationships to solve multistep ratio and percent problems involving markups and markdowns.
18 3.7 7.RP.3Use proportional relationships to solve multistep ratio and percent problems involving markups and markdowns.
19 2.4 7.RP.2c Represent proportional relationships by equations.
Grade 7: Unit Test A (Ratios Proportional Relationships)
digits Grade 7 Common Core Standards for Unit Assessments
digitsmath.com 2
Item Number
Topic Lesson
Common Core State Standard Description
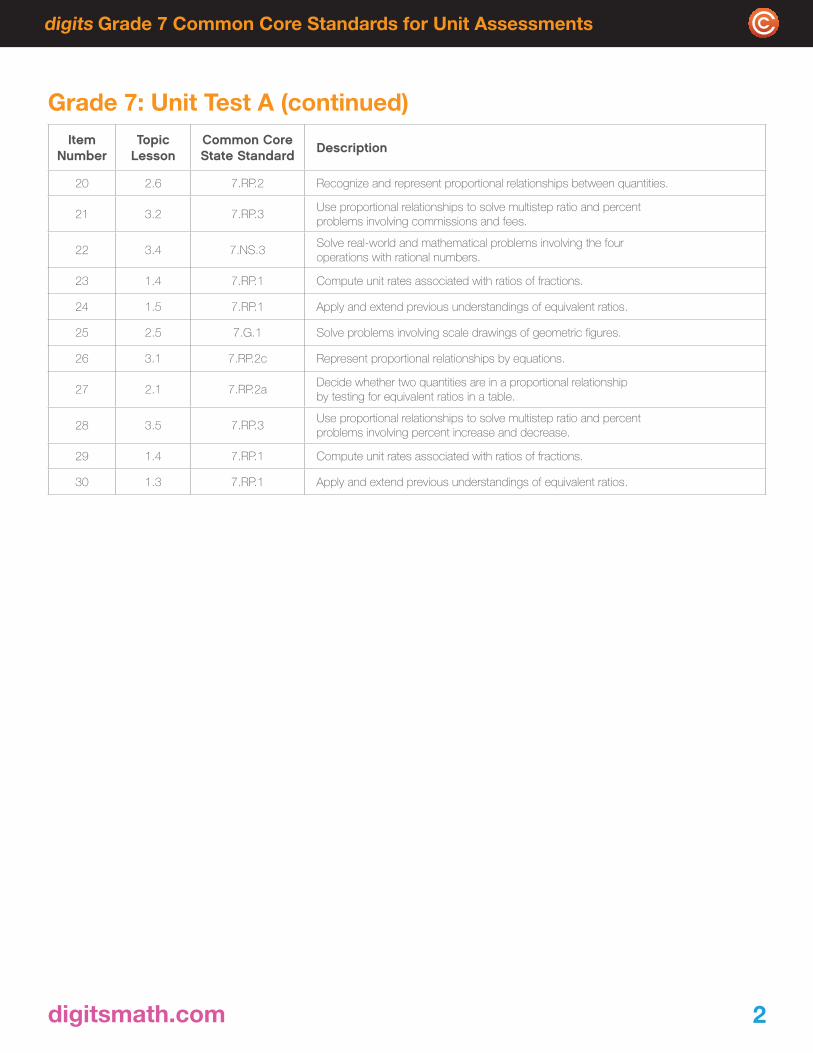
20 2.6 7.RP.2 Recognize and represent proportional relationships between quantities.
21 3.2 7.RP.3Use proportional relationships to solve multistep ratio and percent problems involving commissions and fees.
22 3.4 7.NS.3Solve real-world and mathematical problems involving the four operations with rational numbers.
23 1.4 7.RP.1 Compute unit rates associated with ratios of fractions.
24 1.5 7.RP.1 Apply and extend previous understandings of equivalent ratios.
25 2.5 7.G.1 Solve problems involving scale drawings of geometric figures.
26 3.1 7.RP.2c Represent proportional relationships by equations.
27 2.1 7.RP.2aDecide whether two quantities are in a proportional relationship by testing for equivalent ratios in a table.
28 3.5 7.RP.3Use proportional relationships to solve multistep ratio and percent problems involving percent increase and decrease.
29 1.4 7.RP.1 Compute unit rates associated with ratios of fractions.
30 1.3 7.RP.1 Apply and extend previous understandings of equivalent ratios.
Grade 7: Unit Test A (continued)
digits Grade 7 Common Core Standards for Unit Assessments
digitsmath.com 3
Item Number
Topic Lesson
Common Core State Standard Description
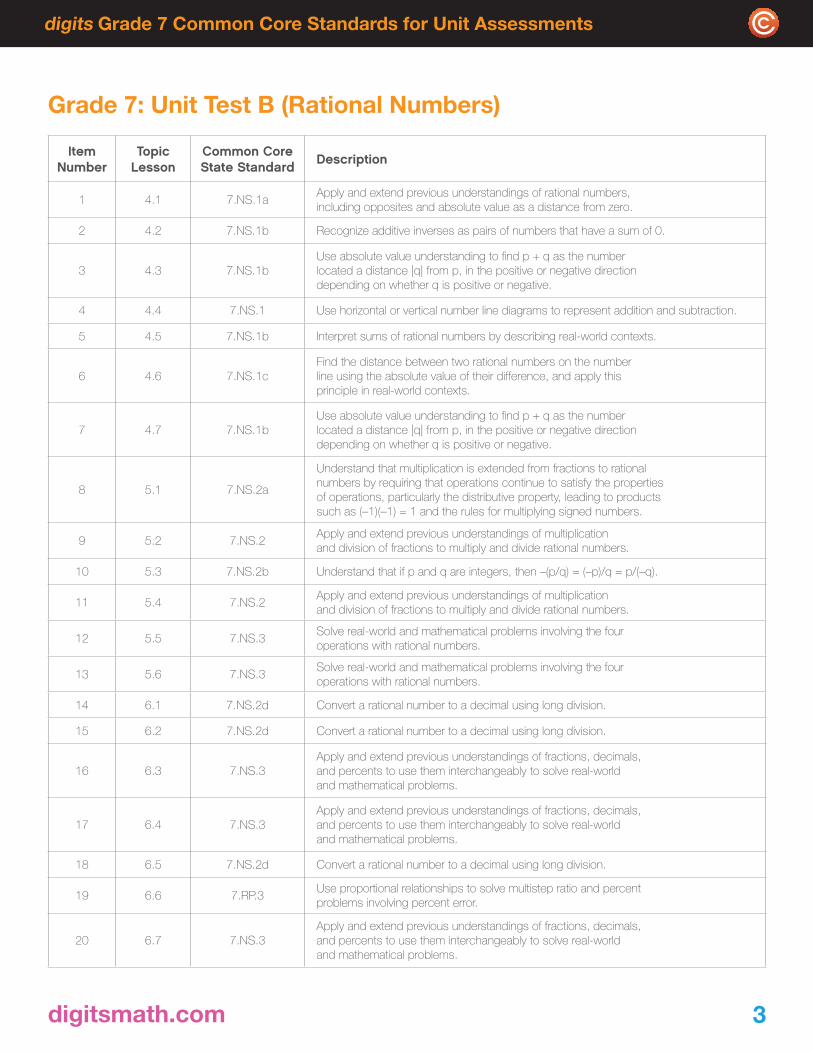
1 4.1 7.NS.1aApply and extend previous understandings of rational numbers, including opposites and absolute value as a distance from zero.
2 4.2 7.NS.1b Recognize additive inverses as pairs of numbers that have a sum of 0.
3 4.3 7.NS.1bUse absolute value understanding to find p + q as the number located a distance |q| from p, in the positive or negative direction depending on whether q is positive or negative.
4 4.4 7.NS.1 Use horizontal or vertical number line diagrams to represent addition and subtraction.
5 4.5 7.NS.1b Interpret sums of rational numbers by describing real-world contexts.
6 4.6 7.NS.1cFind the distance between two rational numbers on the number line using the absolute value of their difference, and apply this principle in real-world contexts.
7 4.7 7.NS.1bUse absolute value understanding to find p + q as the number located a distance |q| from p, in the positive or negative direction depending on whether q is positive or negative.
8 5.1 7.NS.2a
Understand that multiplication is extended from fractions to rational numbers by requiring that operations continue to satisfy the properties of operations, particularly the distributive property, leading to products such as (–1)(–1) = 1 and the rules for multiplying signed numbers.
9 5.2 7.NS.2Apply and extend previous understandings of multiplication and division of fractions to multiply and divide rational numbers.
10 5.3 7.NS.2b Understand that if p and q are integers, then –(p/q) = (–p)/q = p/(–q).
11 5.4 7.NS.2Apply and extend previous understandings of multiplication and division of fractions to multiply and divide rational numbers.
12 5.5 7.NS.3Solve real-world and mathematical problems involving the four operations with rational numbers.
13 5.6 7.NS.3Solve real-world and mathematical problems involving the four operations with rational numbers.
14 6.1 7.NS.2d Convert a rational number to a decimal using long division.
15 6.2 7.NS.2d Convert a rational number to a decimal using long division.
16 6.3 7.NS.3Apply and extend previous understandings of fractions, decimals, and percents to use them interchangeably to solve real-world and mathematical problems.
17 6.4 7.NS.3Apply and extend previous understandings of fractions, decimals, and percents to use them interchangeably to solve real-world and mathematical problems.
18 6.5 7.NS.2d Convert a rational number to a decimal using long division.
19 6.6 7.RP.3Use proportional relationships to solve multistep ratio and percent problems involving percent error.
20 6.7 7.NS.3Apply and extend previous understandings of fractions, decimals, and percents to use them interchangeably to solve real-world and mathematical problems.
Grade 7: Unit Test B (Rational Numbers)

digits Grade 7 Common Core Standards for Unit Assessments
digitsmath.com 4
Item Number
Topic Lesson
Common Core State Standard Description
21 4.7 7.NS.1cFind the distance between two rational numbers on the number line using the absolute value of their difference, and apply this principle in real-world contexts.
22 4.6 7.NS.1cFind the distance between two rational numbers on the number line using the absolute value of their difference, and apply this principle in real-world contexts.
23 4.1 7.NS.1a Describe situations in which opposite quantities combine to make 0.
24 5.2 7.NS.2Apply and extend previous understandings of multiplication and division of fractions to multiply and divide rational numbers.
25 5.3 7.NS.2bUnderstand that integers can be divided, provided that the divisor is not zero, and every quotient of integers (with non-zero divisor) is a rational number.
26 4.2 7.NS.1b Recognize additive inverses as pairs of numbers that have a sum of 0.
27 4.4 7.NS.1 Use horizontal or vertical number line diagrams to represent addition and subtraction.
28 6.1 7.NS.2d Convert a rational number to a decimal using long division.
29 5.5 7.NS.2d Apply properties of operations as strategies to multiply and divide rational numbers.
30 5.2 7.NS.2a
Understand that multiplication is extended from fractions to rational numbers by requiring that operations continue to satisfy the properties of operations, particularly the distributive property, leading to products such as (–1)(–1) = 1 and the rules for multiplying signed numbers.
Grade 7: Unit Test B (continued)
digits Grade 6 Common Core Standards for Mathematical Content (continued)digits Grade 7 Common Core Standards for Unit Assessments
digitsmath.com 5
Grade 7: Unit Test C (Expressions and Equations)
Item Number
Topic Lesson
Common Core State Standard Description
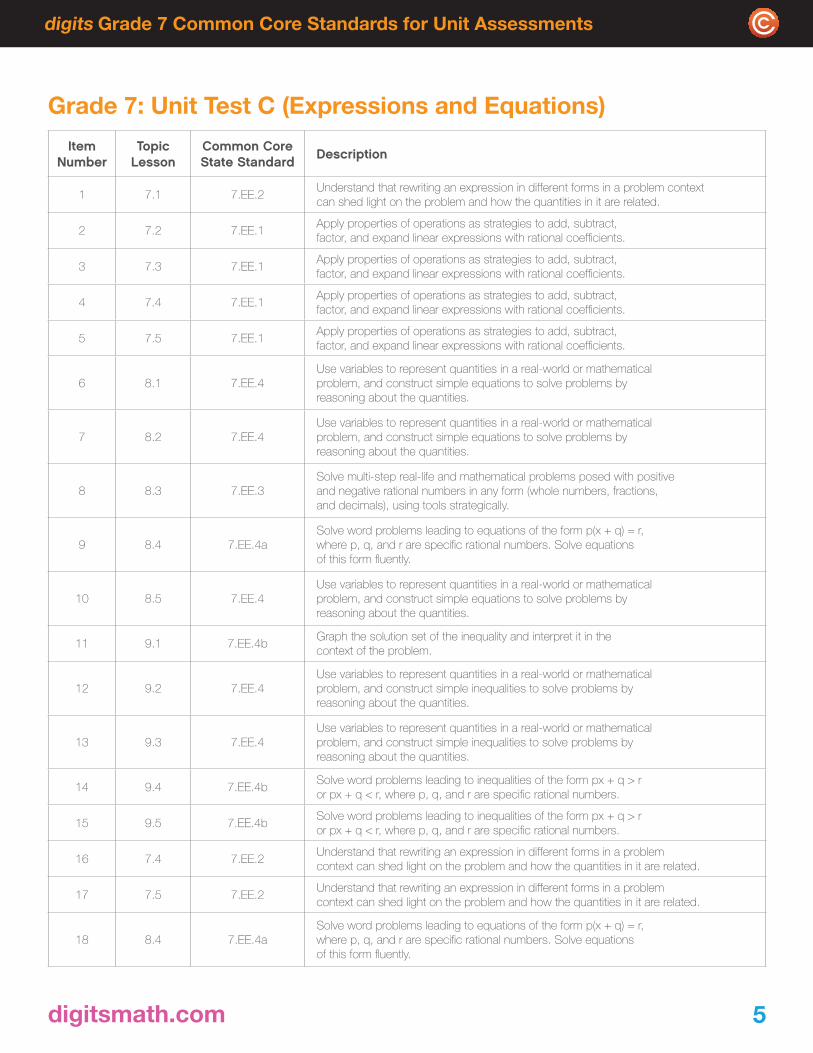
1 7.1 7.EE.2Understand that rewriting an expression in different forms in a problem context can shed light on the problem and how the quantities in it are related.
2 7.2 7.EE.1Apply properties of operations as strategies to add, subtract, factor, and expand linear expressions with rational coefficients.
3 7.3 7.EE.1Apply properties of operations as strategies to add, subtract, factor, and expand linear expressions with rational coefficients.
4 7.4 7.EE.1Apply properties of operations as strategies to add, subtract, factor, and expand linear expressions with rational coefficients.
5 7.5 7.EE.1Apply properties of operations as strategies to add, subtract, factor, and expand linear expressions with rational coefficients.
6 8.1 7.EE.4Use variables to represent quantities in a real-world or mathematical problem, and construct simple equations to solve problems by reasoning about the quantities.
7 8.2 7.EE.4Use variables to represent quantities in a real-world or mathematical problem, and construct simple equations to solve problems by reasoning about the quantities.
8 8.3 7.EE.3Solve multi-step real-life and mathematical problems posed with positive and negative rational numbers in any form (whole numbers, fractions, and decimals), using tools strategically.
9 8.4 7.EE.4aSolve word problems leading to equations of the form p(x + q) = r, where p, q, and r are specific rational numbers. Solve equations of this form fluently.
10 8.5 7.EE.4Use variables to represent quantities in a real-world or mathematical problem, and construct simple equations to solve problems by reasoning about the quantities.
11 9.1 7.EE.4bGraph the solution set of the inequality and interpret it in the context of the problem.
12 9.2 7.EE.4Use variables to represent quantities in a real-world or mathematical problem, and construct simple inequalities to solve problems by reasoning about the quantities.
13 9.3 7.EE.4Use variables to represent quantities in a real-world or mathematical problem, and construct simple inequalities to solve problems by reasoning about the quantities.
14 9.4 7.EE.4bSolve word problems leading to inequalities of the form px + q > r or px + q < r, where p, q, and r are specific rational numbers.
15 9.5 7.EE.4bSolve word problems leading to inequalities of the form px + q > r or px + q < r, where p, q, and r are specific rational numbers.
16 7.4 7.EE.2Understand that rewriting an expression in different forms in a problem context can shed light on the problem and how the quantities in it are related.
17 7.5 7.EE.2Understand that rewriting an expression in different forms in a problem context can shed light on the problem and how the quantities in it are related.
18 8.4 7.EE.4aSolve word problems leading to equations of the form p(x + q) = r, where p, q, and r are specific rational numbers. Solve equations of this form fluently.
digits Grade 7 Common Core Standards for Unit Assessments
digitsmath.com 6
Item Number
Topic Lesson
Common Core State Standard Description
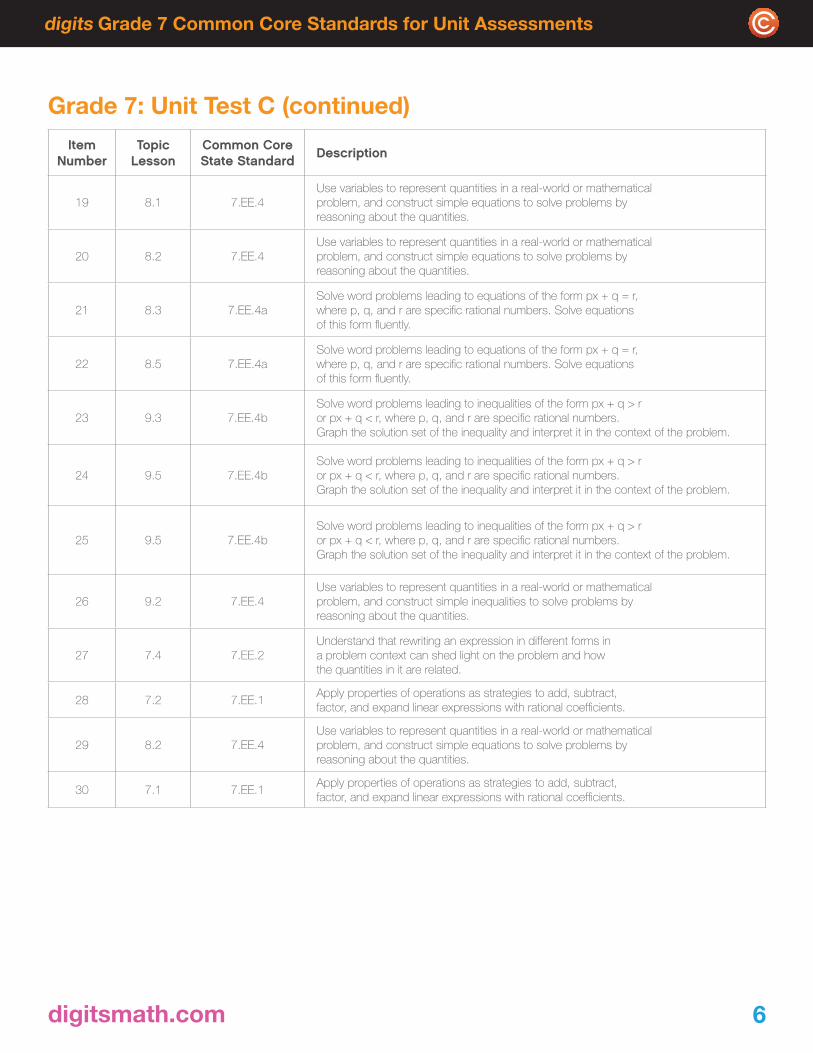
19 8.1 7.EE.4Use variables to represent quantities in a real-world or mathematical problem, and construct simple equations to solve problems by reasoning about the quantities.
20 8.2 7.EE.4Use variables to represent quantities in a real-world or mathematical problem, and construct simple equations to solve problems by reasoning about the quantities.
21 8.3 7.EE.4aSolve word problems leading to equations of the form px + q = r, where p, q, and r are specific rational numbers. Solve equations of this form fluently.
22 8.5 7.EE.4aSolve word problems leading to equations of the form px + q = r, where p, q, and r are specific rational numbers. Solve equations of this form fluently.
23 9.3 7.EE.4bSolve word problems leading to inequalities of the form px + q > r or px + q < r, where p, q, and r are specific rational numbers. Graph the solution set of the inequality and interpret it in the context of the problem.
24 9.5 7.EE.4bSolve word problems leading to inequalities of the form px + q > r or px + q < r, where p, q, and r are specific rational numbers.Graph the solution set of the inequality and interpret it in the context of the problem.
25 9.5 7.EE.4bSolve word problems leading to inequalities of the form px + q > r or px + q < r, where p, q, and r are specific rational numbers.Graph the solution set of the inequality and interpret it in the context of the problem.
26 9.2 7.EE.4Use variables to represent quantities in a real-world or mathematical problem, and construct simple inequalities to solve problems by reasoning about the quantities.
27 7.4 7.EE.2Understand that rewriting an expression in different forms in a problem context can shed light on the problem and how the quantities in it are related.
28 7.2 7.EE.1Apply properties of operations as strategies to add, subtract, factor, and expand linear expressions with rational coefficients.
29 8.2 7.EE.4Use variables to represent quantities in a real-world or mathematical problem, and construct simple equations to solve problems by reasoning about the quantities.
30 7.1 7.EE.1Apply properties of operations as strategies to add, subtract, factor, and expand linear expressions with rational coefficients.
Grade 7: Unit Test C (continued)
digits Grade 7 Common Core Standards for Unit Assessments
digitsmath.com 7
Item Number
Topic Lesson
Common Core State Standard Description
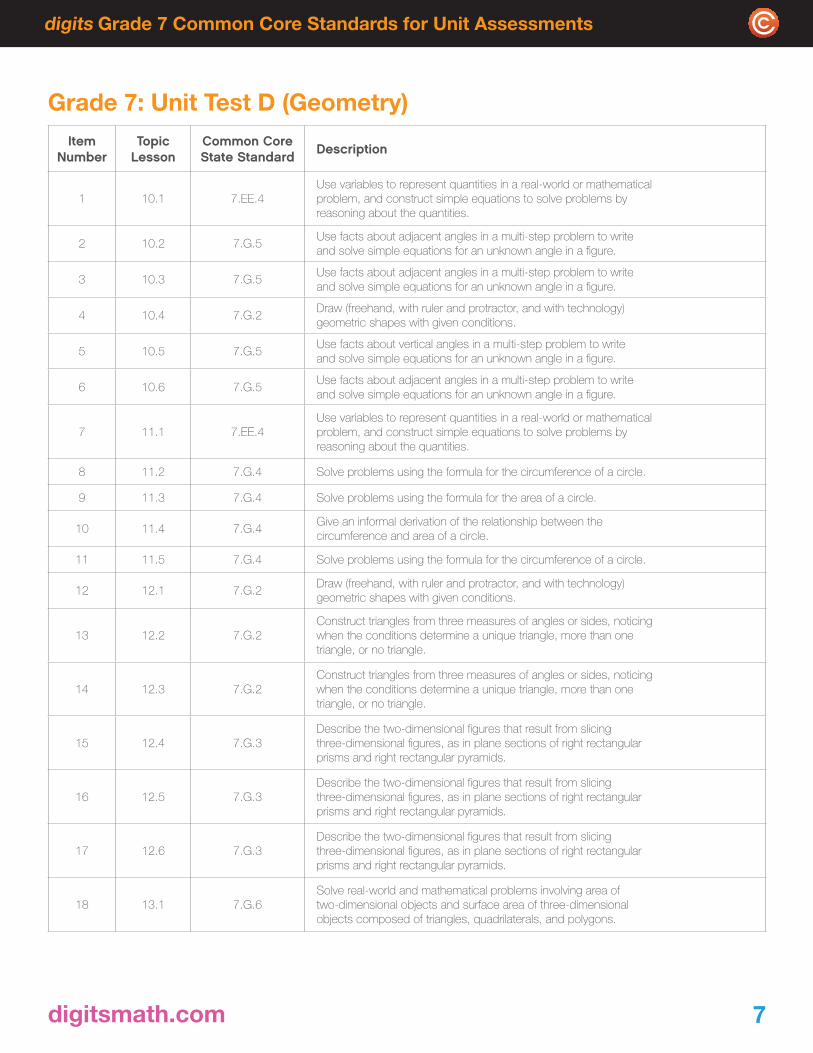
1 10.1 7.EE.4Use variables to represent quantities in a real-world or mathematical problem, and construct simple equations to solve problems by reasoning about the quantities.
2 10.2 7.G.5Use facts about adjacent angles in a multi-step problem to write and solve simple equations for an unknown angle in a figure.
3 10.3 7.G.5Use facts about adjacent angles in a multi-step problem to write and solve simple equations for an unknown angle in a figure.
4 10.4 7.G.2Draw (freehand, with ruler and protractor, and with technology) geometric shapes with given conditions.
5 10.5 7.G.5Use facts about vertical angles in a multi-step problem to write and solve simple equations for an unknown angle in a figure.
6 10.6 7.G.5Use facts about adjacent angles in a multi-step problem to write and solve simple equations for an unknown angle in a figure.
7 11.1 7.EE.4Use variables to represent quantities in a real-world or mathematical problem, and construct simple equations to solve problems by reasoning about the quantities.
8 11.2 7.G.4 Solve problems using the formula for the circumference of a circle.
9 11.3 7.G.4 Solve problems using the formula for the area of a circle.
10 11.4 7.G.4Give an informal derivation of the relationship between the circumference and area of a circle.
11 11.5 7.G.4 Solve problems using the formula for the circumference of a circle.
12 12.1 7.G.2Draw (freehand, with ruler and protractor, and with technology) geometric shapes with given conditions.
13 12.2 7.G.2Construct triangles from three measures of angles or sides, noticing when the conditions determine a unique triangle, more than one triangle, or no triangle.
14 12.3 7.G.2Construct triangles from three measures of angles or sides, noticing when the conditions determine a unique triangle, more than one triangle, or no triangle.
15 12.4 7.G.3Describe the two-dimensional figures that result from slicing three-dimensional figures, as in plane sections of right rectangular prisms and right rectangular pyramids.
16 12.5 7.G.3Describe the two-dimensional figures that result from slicing three-dimensional figures, as in plane sections of right rectangular prisms and right rectangular pyramids.
17 12.6 7.G.3Describe the two-dimensional figures that result from slicing three-dimensional figures, as in plane sections of right rectangular prisms and right rectangular pyramids.
18 13.1 7.G.6Solve real-world and mathematical problems involving area of two-dimensional objects and surface area of three-dimensional objects composed of triangles, quadrilaterals, and polygons.
Grade 7: Unit Test D (Geometry)

digits Grade 7 Common Core Standards for Unit Assessments
digitsmath.com 8
Grade 7: Unit Test D (continued)Item
NumberTopic
LessonCommon Core State Standard Description
19 13.2 7.G.6Solve real-world and mathematical problems involving area of two-dimensional objects and volume of three-dimensional objects composed of triangles, quadrilaterals, and polygons.
20 13.3 7.G.6Solve real-world and mathematical problems involving area of two-dimensional objects and surface area of three-dimensional objects composed of triangles, quadrilaterals, and polygons.
21 13.4 7.G.6Solve real-world and mathematical problems involving area of two-dimensional objects and volume of three-dimensional objects composed of triangles, quadrilaterals, and polygons.
22 13.5 7.G.6Solve real-world problems involving surface area and volume of a three-dimensional object composed of right prisms.
23 11.4 7.G.4Give an informal derivation of the relationship between the circumference and area of a circle.
24 12.5 7.G.3Describe the two-dimensional figures that result from slicing three-dimensional figures, as in plane sections of right rectangular prisms and right rectangular pyramids.
25 13.2 7.G.6Solve real-world and mathematical problems involving area of two-dimensional objects and volume of three-dimensional objects composed of triangles, quadrilaterals, and polygons.
26 11.2 7.G.4 Solve problems using the formula for the circumference of a circle.
27 10.3 7.G.5Use facts about complementary angles in a multi-step problem to write and solve simple equations for an unknown angle in a figure.
28 13.4 7.G.5Solve real-world and mathematical problems involving area of two-dimensional objects and volume of three-dimensional objects composed of triangles, quadrilaterals, and polygons.
29 10.2 7.G.2 Name parts of a geometric figure using appropriate letters and symbols.
30 13.1 7.G.6Solve real-world and mathematical problems involving area of two-dimensional objects and surface area of three-dimensional objects composed of triangles, quadrilaterals, and polygons.
digits Grade 7 Common Core Standards for Unit Assessments
digitsmath.com 9
Item Number
Topic Lesson
Common Core State Standard Description
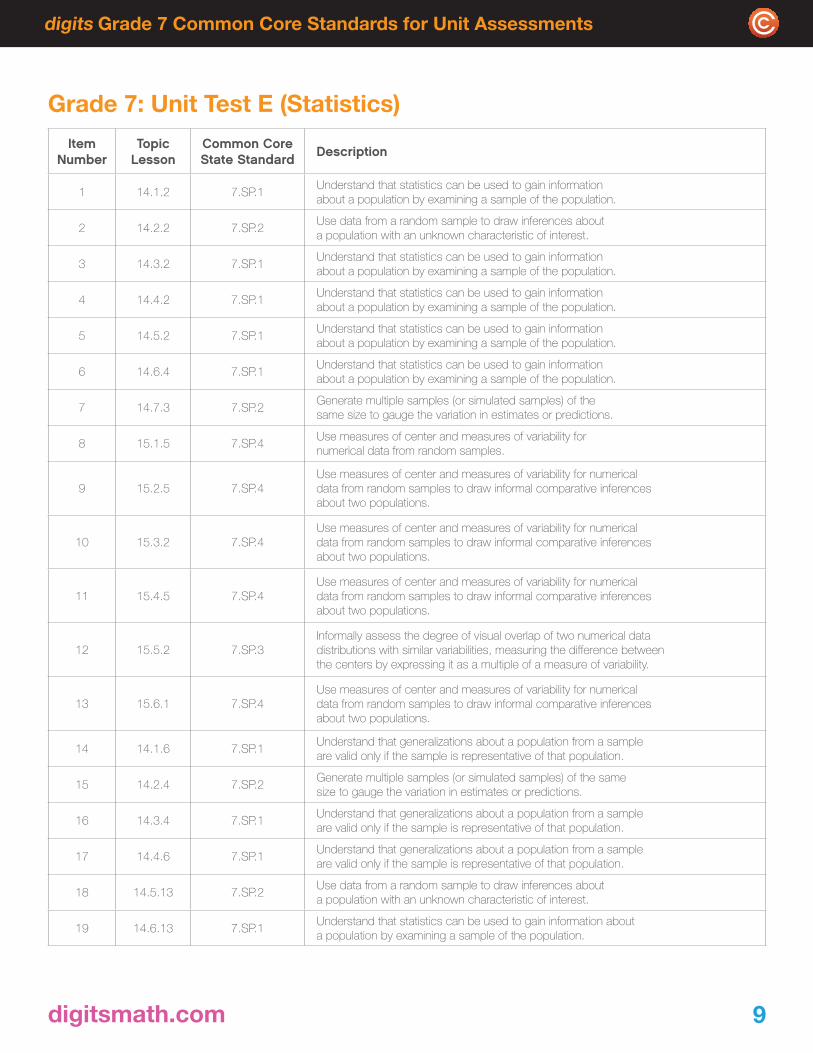
1 14.1.2 7.SP.1Understand that statistics can be used to gain information about a population by examining a sample of the population.
2 14.2.2 7.SP.2Use data from a random sample to draw inferences about a population with an unknown characteristic of interest.
3 14.3.2 7.SP.1Understand that statistics can be used to gain information about a population by examining a sample of the population.
4 14.4.2 7.SP.1Understand that statistics can be used to gain information about a population by examining a sample of the population.
5 14.5.2 7.SP.1Understand that statistics can be used to gain information about a population by examining a sample of the population.
6 14.6.4 7.SP.1Understand that statistics can be used to gain information about a population by examining a sample of the population.
7 14.7.3 7.SP.2Generate multiple samples (or simulated samples) of the same size to gauge the variation in estimates or predictions.
8 15.1.5 7.SP.4Use measures of center and measures of variability for numerical data from random samples.
9 15.2.5 7.SP.4Use measures of center and measures of variability for numerical data from random samples to draw informal comparative inferences about two populations.
10 15.3.2 7.SP.4Use measures of center and measures of variability for numerical data from random samples to draw informal comparative inferences about two populations.
11 15.4.5 7.SP.4Use measures of center and measures of variability for numerical data from random samples to draw informal comparative inferences about two populations.
12 15.5.2 7.SP.3Informally assess the degree of visual overlap of two numerical data distributions with similar variabilities, measuring the difference between the centers by expressing it as a multiple of a measure of variability.
13 15.6.1 7.SP.4Use measures of center and measures of variability for numerical data from random samples to draw informal comparative inferences about two populations.
14 14.1.6 7.SP.1Understand that generalizations about a population from a sample are valid only if the sample is representative of that population.
15 14.2.4 7.SP.2Generate multiple samples (or simulated samples) of the same size to gauge the variation in estimates or predictions.
16 14.3.4 7.SP.1Understand that generalizations about a population from a sample are valid only if the sample is representative of that population.
17 14.4.6 7.SP.1Understand that generalizations about a population from a sample are valid only if the sample is representative of that population.
18 14.5.13 7.SP.2Use data from a random sample to draw inferences about a population with an unknown characteristic of interest.
19 14.6.13 7.SP.1Understand that statistics can be used to gain information about a population by examining a sample of the population.
Grade 7: Unit Test E (Statistics)
digits Grade 7 Common Core Standards for Unit Assessments
digitsmath.com 10
Item Number
Topic Lesson
Common Core State Standard Description
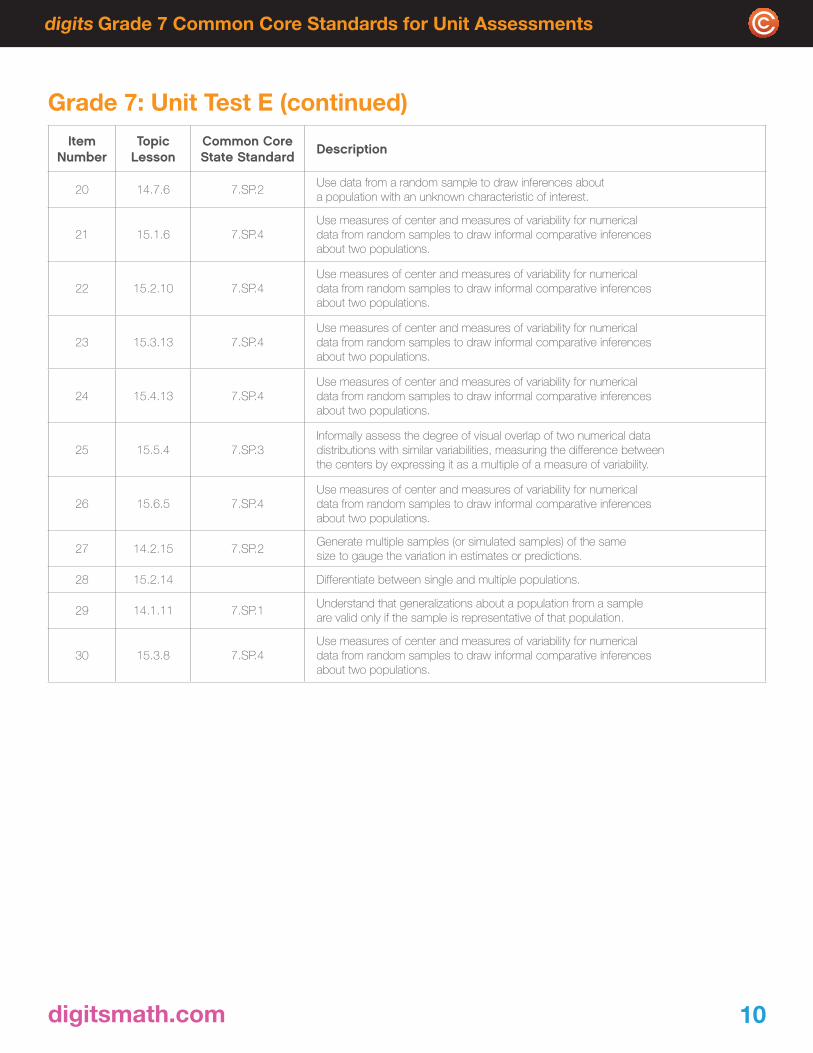
20 14.7.6 7.SP.2Use data from a random sample to draw inferences about a population with an unknown characteristic of interest.
21 15.1.6 7.SP.4Use measures of center and measures of variability for numerical data from random samples to draw informal comparative inferences about two populations.
22 15.2.10 7.SP.4Use measures of center and measures of variability for numerical data from random samples to draw informal comparative inferences about two populations.
23 15.3.13 7.SP.4Use measures of center and measures of variability for numerical data from random samples to draw informal comparative inferences about two populations.
24 15.4.13 7.SP.4Use measures of center and measures of variability for numerical data from random samples to draw informal comparative inferences about two populations.
25 15.5.4 7.SP.3Informally assess the degree of visual overlap of two numerical data distributions with similar variabilities, measuring the difference between the centers by expressing it as a multiple of a measure of variability.
26 15.6.5 7.SP.4Use measures of center and measures of variability for numerical data from random samples to draw informal comparative inferences about two populations.
27 14.2.15 7.SP.2Generate multiple samples (or simulated samples) of the same size to gauge the variation in estimates or predictions.
28 15.2.14 Differentiate between single and multiple populations.
29 14.1.11 7.SP.1Understand that generalizations about a population from a sample are valid only if the sample is representative of that population.
30 15.3.8 7.SP.4Use measures of center and measures of variability for numerical data from random samples to draw informal comparative inferences about two populations.
Grade 7: Unit Test E (continued)
digits Grade 7 Common Core Standards for Unit Assessments
digitsmath.com 11
Item Number
Topic Lesson
Common Core State Standard Description
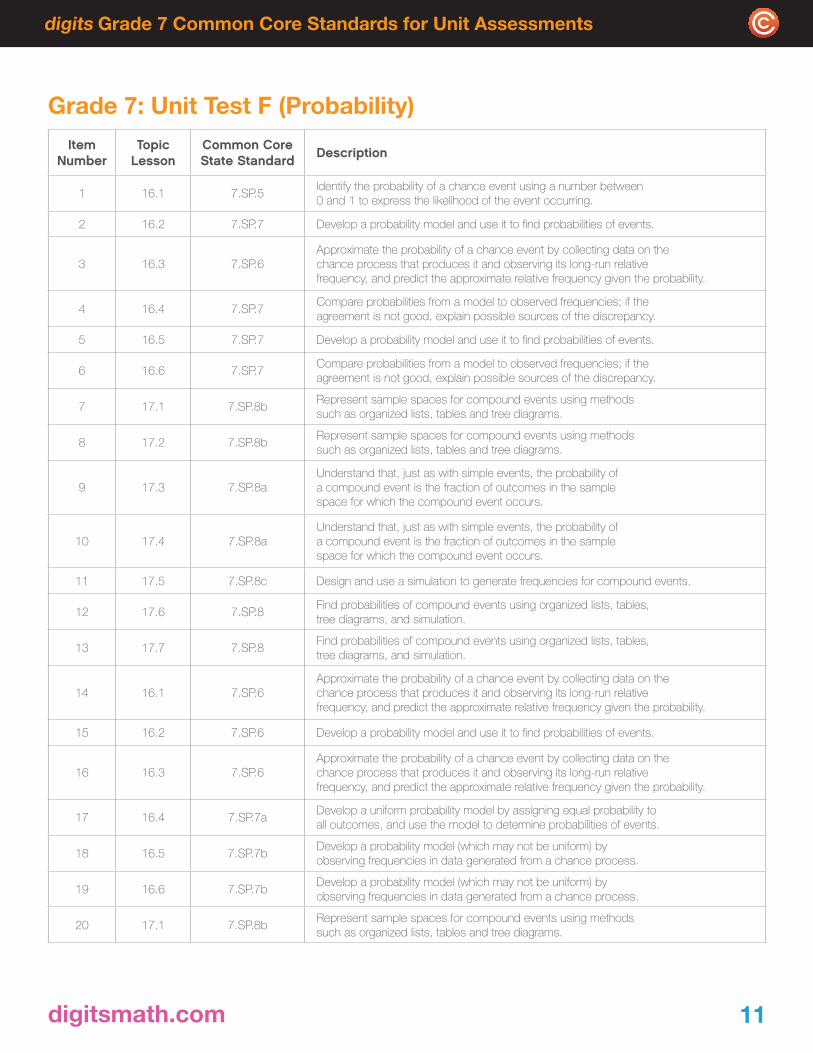
1 16.1 7.SP.5Identify the probability of a chance event using a number between 0 and 1 to express the likelihood of the event occurring.
2 16.2 7.SP.7 Develop a probability model and use it to find probabilities of events.
3 16.3 7.SP.6Approximate the probability of a chance event by collecting data on the chance process that produces it and observing its long-run relative frequency, and predict the approximate relative frequency given the probability.
4 16.4 7.SP.7Compare probabilities from a model to observed frequencies; if the agreement is not good, explain possible sources of the discrepancy.
5 16.5 7.SP.7 Develop a probability model and use it to find probabilities of events.
6 16.6 7.SP.7Compare probabilities from a model to observed frequencies; if the agreement is not good, explain possible sources of the discrepancy.
7 17.1 7.SP.8bRepresent sample spaces for compound events using methods such as organized lists, tables and tree diagrams.
8 17.2 7.SP.8bRepresent sample spaces for compound events using methods such as organized lists, tables and tree diagrams.
9 17.3 7.SP.8aUnderstand that, just as with simple events, the probability of a compound event is the fraction of outcomes in the sample space for which the compound event occurs.
10 17.4 7.SP.8aUnderstand that, just as with simple events, the probability of a compound event is the fraction of outcomes in the sample space for which the compound event occurs.
11 17.5 7.SP.8c Design and use a simulation to generate frequencies for compound events.
12 17.6 7.SP.8Find probabilities of compound events using organized lists, tables, tree diagrams, and simulation.
13 17.7 7.SP.8Find probabilities of compound events using organized lists, tables, tree diagrams, and simulation.
14 16.1 7.SP.6Approximate the probability of a chance event by collecting data on the chance process that produces it and observing its long-run relative frequency, and predict the approximate relative frequency given the probability.
15 16.2 7.SP.6 Develop a probability model and use it to find probabilities of events.
16 16.3 7.SP.6Approximate the probability of a chance event by collecting data on the chance process that produces it and observing its long-run relative frequency, and predict the approximate relative frequency given the probability.
17 16.4 7.SP.7aDevelop a uniform probability model by assigning equal probability to all outcomes, and use the model to determine probabilities of events.
18 16.5 7.SP.7bDevelop a probability model (which may not be uniform) by observing frequencies in data generated from a chance process.
19 16.6 7.SP.7bDevelop a probability model (which may not be uniform) by observing frequencies in data generated from a chance process.
20 17.1 7.SP.8bRepresent sample spaces for compound events using methods such as organized lists, tables and tree diagrams.
Grade 7: Unit Test F (Probability)

Grade 7 Common Core State Standardsfor Unit Assessments
Item Number
Topic Lesson
Common Core State Standard Description
21 17.2 7.SP.8bRepresent sample spaces for compound events using methods such as organized lists, tables and tree diagrams.
22 17.3 7.SP.8bIdentify the outcomes in a sample space that compose a compound event described in everyday language.
23 17.4 7.SP.8Find probabilities of compound events using organized lists, tables, tree diagrams, and simulation.
24 17.5 7.SP.8c Design and use a simulation to generate frequencies for compound events.
25 17.6 7.SP.8Find probabilities of compound events using organized lists, tables, tree diagrams, and simulation.
26 17.7 7.SP.7Compare probabilities from a model to observed frequencies; if the agreement is not good, explain possible sources of the discrepancy.
27 17.2 7.SP.8bRepresent sample spaces for compound events using methods such as organized lists, tables and tree diagrams.
28 16.6 7.SP.7Compare probabilities from a model to observed frequencies; if the agreement is not good, explain possible sources of the discrepancy.
29 17.5 7.SP.8c Design and use a simulation to generate frequencies for compound events.
30 17.6 7.SP.8Find probabilities of compound events using organized lists, tables, tree diagrams, and simulation.
Grade 7: Unit Test F (continued)
PearsonSchool.com800-848-9500Copyright Pearson Education, Inc., or its affiliates. All rights reserved.
PDF.1
112.
DI.P
C.R
H
Mat
1224
13
Related Documents