June 2014 Government Subsidies in Canada: A $684 Billion Price Tag Taxpayer Subsidies to Corporations, Government Businesses, and Consumers by Mark Milke

Welcome message from author
This document is posted to help you gain knowledge. Please leave a comment to let me know what you think about it! Share it to your friends and learn new things together.
Transcript

June 2014
Government Subsidies in Canada: A $684 Billion Price Tag Taxpayer Subsidies to Corporations, Government Businesses, and Consumers
by Mark Milke
June 2014
Government Subsidies in Canada: A $684 Billion Price TagTaxpayer subsidies to corporations,
government businesses, and consumers
by Mark Milke

fraserinstitute.org

fraserinstitute.org / i
Contents
Executive summary / iii
Introduction: subsidies and the common good / 1
Findings / 5
Examples of resistance to business subsidies, and a way forward / 23
Conclusion: areas for future study and recommendations / 24
References / 26
About the authors / 45
Acknowledgments / 46
Publishing information / 47
Supporting the Fraser Institute / 48
Purpose, funding, & independence / 49
About the Fraser Institute / 50
Editorial Advisory Board / 51

fraserinstitute.org

fraserinstitute.org / iii
Executive summary
This study attempts to measure the scope of government subsidies in Canada using three data sets. The first is from Statistics Canada, and spans the 1981 to 2009 fiscal years (2009 being the last available year in the series). The data accounts for subsidies to private sector business and government business enterprises, though without specifics on individual companies. This data set also includes transfers to consumers—not direct, but courtesy of reduced electricity and heating bills where the consumer pays less than the market rate.
The national statistical agency does not distinguish between these con-sumer subsidies and a “normal” subsidy to a business, which is unfortunate, as in some select cases other data sources indicate that such consumer sub-sidies in some years were significant. This report will, in selected examples, note where some of those consumer subsidies have occurred, in order to put overall government transfers in more detailed context where possible. However, the main focus and purpose of this study is to analyze subsidies from Canadian governments to businesses (private sector and government sector) and this is where most of the discussion will occur.
The second set of data is from an Access to Industry Canada request that covers the fiscal years 1961 to 2013. It contains information about Industry Canada subsidies to specific private sector companies. The third set is derived from VIA Rail annual reports that cover the period between the fiscal years 1996 to 2012. The purpose of using these additional two data sets is to provide some additional detail specific to the issue of business subsidies, detail which the first set of data from Statistics Canada does not provide.
Data set 1: Statistics Canada data on government subsidiesAlmost $684 billion since 1981
Between April 1, 1980 and March 31, 2009, federal, provincial, and local gov-ernments spent $683.9 billion on subsidies to private sector business, gov-ernment business enterprises, and consumers (though consumers may not be aware that, to use one example, subsidies were applied to their electricity
iv / Government Subsidies in Canada: A $684 Billion Price Tag
fraserinstitute.org
and heating bills, reducing the amounts payable to something less than the market rates). The breakdown for the three decade period amounted to:
• $342.6 billion from the federal government;
• $287.0 billion from provincial governments;
• $54.2 billion from local governments.
On an annual basis:
• Total federal, provincial, and local subsidies were highest in 1984 at $34.8 billion. They fell to a low of $11.6 billion in 1998 and stood at $24.4 billion as of 2009.
• The per-taxpayer cost for such subsidies for those who filed and paid taxes ranged from an annual high of $3,268 (in 1984) to a low of $797 (in 1998). In 2009, the per-taxpayer amount for subsidies to business was $1,507. (It is appropriate to include even the consumer subsidies in the per-taxpayer calculation. That is because there is a revenue loss to governments when the proceeds of electricity auctions, for example, are applied to consumer bills instead of directed into government treasuries. Similarly, when governments, using their Crown corporations, artificially reduce power bills, there is also foregone revenue to the treasury.)
• As a percentage of GDP, the peak year for total federal provincial and municipal subsidies was 1984 (3.7 percent of GDP) while the low was in 1998 (0.9 percent). As of 2009, such subsidies amounted to 1.5 percent of GDP.
• Federally, subsidies were at their highest in 1984 ($23.1 billion) and at their lowest in 1996 ($5.7 billion). In 2009, federal subsidies to private and government businesses totalled just under $7.8 billion.
• Included in that federal data was a breakout of subsidies given to agriculture. (Such a breakout was available only at the federal level.) It shows that federal subsidies to agriculture were as high as $5.4 billion in 1987, as low as $524 million in 1995, and in 2009 amounted to $922 million.
• Provincially, the highest year for subsidies was 2003 ($14.7 billion); the lowest year was 1997 ($6.0 billion). In 2009, the figure was $13.3 billion.
• Locally, there was a negative expenditure in 1998 (-$2.6 billion); the highest expenditure year for subsidies was in 2009 ($3.3 billion) in 2009.

Government Subsidies in Canada: A $684 Billion Price Tag / v
fraserinstitute.org
Among the provinces, the 1981–2009 subsidy totals were as follows: Quebec, $115.5 billion; Alberta, $49.9 billion; Ontario, $46.7 billion; British Columbia, $34.5 billion; Saskatchewan, $18.3 billion; Manitoba, $10.5 billion; Nova Scotia, $4.6 billion; Newfoundland and Labrador, $3.1 billion; New Brunswick, $2.4 billion; Prince Edward Island, $1.5 billion.
The high subsidies in some provinces such as Ontario and Alberta in the early 2000s are partly a result of reducing electricity and power bills for consumers. The subsidies relate to government-mandated reductions in power bills in the early to mid-2000s. Statistics Canada did not distinguish between “pure” government subsidies to private and government businesses and those of the consumer variety.
In Quebec, over the decades, subsidies have increased in almost every year with few exceptions. The lowest year recorded for subsidies was in 1981, at just over $1.7 billion. The highest year was in 2009, with $7.2 billion spent. Quebec has a large number of Crown corporations and is also highly inter-ventionist. Both factors might explain why that province spent $115.5 bil-lion on subsidies to private and government enterprises between 1981 and 2009. According to Statistics Canada, there is no indication that the subsidies were for consumers, but instead were directed towards business. Simply put, Quebec spends a significant amount on subsidies to private and government business.
Data set 2: Industry Canada since 1961
The second data set is more straightforward and concerns subsidies to private sector businesses from one federal department, Industry Canada. Between 1961 and 2013, the federal department of industry disbursed $22.4 billion to businesses. Of the $22.4 billion disbursed, the top 10 recipients received just under $8.5 billion, or 38 percent of all money disbursed.
At present, of the remaining eight of the 10 companies still active, net income (profits) collectively amounted to $17.1 billion while cash-on-hand amounted to $33.4 billion.
In short, many corporations or their parent companies that receive corporate welfare are anything but start-ups. Also, in many cases, cash-on-hand possessed by the company or parent company far exceeds the total ori-ginal corporate welfare amount disbursed. This calls into question at least one justification for policy that allots subsidies to business—that taxpayer assist-ance is required to fill in for market failure and a lack of capital. Insofar as the recipients are large and well-established companies and not “acorn” start-ups, the justification for such subsidies would appear to be weak.
vi / Government Subsidies in Canada: A $684 Billion Price Tag
fraserinstitute.org
Data set 3: VIA Rail since 1996
The data for the third set is also more straightforward. VIA Rail is an example of taxpayer subsidies to a government business enterprise. In VIA’s case, the subsidies have been substantial, with operating and capital subsidies from the federal government amounting to $4.5 billion between 1996 and 2012. To compare, VIA Rail has received more federal government subsidies (and this since just 1996) than even Pratt & Whitney Canada Corp. which has received $3.3 billion in subsidies since 1970.
Examples of policy and popular resistance to subsidies for business
Policy and popular resistance to business subsidies and a decline in the prac-tice does on occasion occur. In Ontario, for example, in the 1994 “Common Sense Revolution” party platform, the then Ontario Progressive Conservative party committed to reduce business subsidies. “We will cut business subsidies and reduce government grants,” read the document. After winning power in 1995, spending on all subsidies was reduced to $476 million by 1999 from a decade high of $1.8 billion in 1991 (Statistics Canada, 2014a).
After the high-profile failures of industrial policy in the late 1980s and early 1990s, Alberta reduced spending on business subsidies for a period between the early 1990s and late 1990s. In British Columbia, after several high-profile and costly interventions in the 1990s, the provincial government refused further subsidies to an ailing pulp mill and also refused to engage in preferential treatment on shipbuilding contracts for the coastal ferry service.
More recently, in another example how a costly subsidy aroused pub-lic ire, in 2012, after the then New Democratic Party government of Nova Scotia awarded a $304-million loan to Irving Shipyards, most of it forgiv-able, the loan became an election issue in 2013. The incumbent party lost the election and the then-opposition Nova Scotia Liberals, who had opposed the loan, won.
Areas for future study and recommendations
A number of gaps in understanding business subsidies in Canada are evident in the available data. The empirical record and thus public understanding could be strengthened with the following reforms:
• For Statistics Canada, revised approaches to data collection would be helpful. A distinction should be made between taxpayer subsidies directed

Government Subsidies in Canada: A $684 Billion Price Tag / vii
fraserinstitute.org
towards private business and those directed towards government business enterprises, with a further distinction made between any subsidies to consumers and those flowing to businesses.
• Federal, provincial and local governments should consider winding down and ending business assistance programs within departments, sub-agencies, other departments, their sub-agencies, and in and to Crown corporations.
• Governments should consider requiring transparency for existing subsidy agreements including repayments or the lack thereof, though this may require changes to federal and provincial Access to Information/Freedom of Information laws to lift the veil of secrecy that often shrouds the repayment records of individual companies.
• Governments should support international efforts to end subsidies, including strengthening bilateral and multilateral free trade agreements to more clearly prohibit such subsidies. It is in Canada’s interest to reduce rules against our imports and to be able to compete with non-subsidized companies from other jurisdictions.

viii / fraserinstitute.org

fraserinstitute.org / 1
Introduction: subsidies and the common good
This study attempts to measure the scope of government subsidies in Canada using three data sets. The first is from Statistics Canada (2014a), and spans the 1981 to 2009 fiscal years (2009 being the last available year in the series).1 The data accounts for subsidies to private sector business and government busi-ness enterprises, though without specifics on individual companies. This data set also includes transfers to consumers—not direct, but courtesy of reduced electricity and heating bills where the consumer pays less than the market rate.
The national statistical agency does not distinguish between these con-sumer subsidies and a “normal” subsidy to a business, which is unfortunate, as in some select cases other data sources indicate that such consumer subsidies in some years were significant. This report will, in selected examples, note where some of those consumer subsidies have occurred, in order to put overall government transfers in more detailed context where possible. However, the main focus and purpose of this study is to analyze subsidies from Canadian governments to businesses (private sector and government sector) and this is where most of the discussion will occur.
The second set of data is from an Access to Information request to Industry Canada (Industry Canada, 2013) that covers the fiscal years 1961 to 2013. It contains information about Industry Canada subsidies and specific private sector companies. The third set is derived from VIA Rail annual reports (Via Rail, 1998-2012) that cover the period between the fiscal years 1996 to 2012. The purpose of using these additional two data sets is to pro-vide some additional detail specific to the issue of business subsidies, detail which the first set of data from Statistics Canada does not provide.
1. Fiscal years for governments usually run from April 1 to March 31. The reader should thus assume that references to years, unless otherwise specified, refer to government fis-cal years; so “1981” refers to April 1, 1980 to March 31, 1981, for example.
2 / Government Subsidies in Canada: A $684 Billion Price Tag
fraserinstitute.org
With those data sets in mind, then, this report will: briefly survey justi-fications for the practice of disbursing taxpayer dollars to business in particu-lar; provide a summary review of the literature on that subject (a more com-prehensive review is found in past reports); note the findings from the data sets; provide examples of jurisdictions and politicians that have on occasion refused to subsidize corporations; offer suggestions for further study; and finally, offer suggestions for reform of the practice.
Business subsidies: some terms, and the focus of this study
It is useful to put the practice of transferring taxpayer dollars to business in some context. The practice of using taxpayer dollars to subsidize individual businesses is known by a variety of terms: “targeting” in some academic litera-ture on the subject (i.e., subsidies that are “targeted” to a particular business or sector) or, in industrial policy, “investment.” More colloquially, the prac-tice is known as “corporate welfare” or “crony capitalism.” Whichever term is preferred, it is a multi-billion dollar practice. Since 2007, the Fraser Institute has published six corporate welfare reports on government subsidies to busi-ness (see Milke, 2007, 2008, 2009, 2011, 2012, and 2013). They include a look at repayment records by recipient businesses at the federal Department of Industry and a province-specific analysis for the province of Ontario.
A government subsidy to business occurs when a government transfers tax dollars to business for reasons other than the receipt of goods or services. De facto subsidies can also occur where a preferential tax reduction, deduc-tion, credit, or exemption is directed at one business or sector; such prefer-ential tax treatment mimics direct subsidies even when no cheques are cut.
There are other examples of business- or industry-specific favours from governments to business: trade protection, the granting of domestic monop-olies (e.g., “supply management” boards), and preferential “Canada first” bid-ding for government contracts. These are all examples of how governments create an uneven playing field between companies, domestic or international, but they are beyond the scope of this study. Instead, this report will concen-trate on government transfers of tax dollars to business for reasons other than the receipt of goods or services. This focus has been chosen in past studies and here because that practice is at least partly measurable using Statistics Canada and selected departmental spending.
Government Subsidies in Canada: A $684 Billion Price Tag / 3
fraserinstitute.org
Theoretical justifications for business subsidies
The practice of corporate welfare assumes market failure. In general terms, in economic theory, two market failures are often noted that may justify sub-sidies: first, when the market underprovides or cannot provide some public good or positive externality (an example is basic research and development with no commercially viable component); second, when a capital market imperfection exists, such as when certain firms cannot access financing (Mintz and Smart, 2003). Thus, it is possible that business subsidies in the form of loans or loan guarantees may help improve the allocation of credit. Some also cite Michael Porter (2003) and his assertion that the performance of regional economies is strongly influenced by the strength of local “clusters,” as well as the vitality and plurality of innovation.
In the real world, it is unclear whether such market failures are ser-ious enough to justify intervention, or whether business subsidies are the best vehicle for solving these market failures. For instance, if the goal is to subsidize basic research then it is possible that governments can remedy that omission through scientific granting agencies (as is already the case). This may well be preferable to transfers to a specific business or sector that may have competitors for their product or for capital allocation. Additionally, as this study will show, recipients of subsidies are often large firms that already enjoy relatively easy access to capital. Finally, whether political officials or civil servants possess the knowledge to solve these market failures is an open question. If private market failures demonstrate how difficult it is for private investors to identity in advance which opportunities and companies will be successful and profitable, it is not clear why governments—composed of pol-itical officials and civil servants with no direct interest and no personal capital at stake—would be able to improve on the private sector record.
Peer-reviewed research on business subsidies does not support claims that corporate welfare is responsible for economic growth or job creation, two of the most oft-heard claims. At best, a generous interpretation of the literature suggests that subsidies may, in very specific locations, produce some effect on local economic behaviour. Also, this impact is typically offset by losses elsewhere in the economy from tax rates that are greater than would be the case without business subsidies.
Notably, the Organisation for Economic Co-operation and Development (OECD) observes that the strategic promotion of industries, especially research and development intensive industries, is a significant justification advanced by governments, despite the possibility of unintended distortions in the alloca-tion of productive capital (OECD, 2006). Also, the World Trade Organization (2006) notes that even when considering the most celebrated examples of assistance to business—industrial policy in East Asia—the results indicate that, at best, industrial policy made “a minor contribution to growth in Asia.”

4 / Government Subsidies in Canada: A $684 Billion Price Tag
fraserinstitute.org
A full review of the literature on business subsidies is available in a past report (Milke, 2007: 27–36). In summary, that literature overwhelmingly con-cludes that corporate welfare may not have a demonstrable positive impact upon the economy, employment, and tax revenues because of the substitu-tion effect: a positive impact in a town, city, province, or country that is then typically offset by losses elsewhere in the economy, including tax rates that are greater than would be the case without business subsidies. A fair read-ing of the literature suggests that subsidies to business may not be the best means by which to encourage economic and employment growth. With that noted, here are the findings from the three data sets which help illuminate the size of government subsidies in Canada, with a particular focus on busi-ness subsidies.

fraserinstitute.org / 5
Findings
Data set 1: Statistics Canada since 1981
The first set of findings comes from Statistics Canada data (2014a). This is an historical series that begins in the fiscal year 1981 and ends in 2009. This data tracks the tax dollars disbursed by three levels of government (federal, provincial, and local) to private sector corporations, government business enterprises (GBEs) including but not limited to select Crown corporations, and consumers. (All figures in this report have been adjusted for inflation to 2013 dollars unless otherwise noted; Statistics Canada, 2014b.)
Statistics Canada was unable to provide a breakdown between the three types of subsidies, a distinction which would have been useful. However, from the point of view of the taxpaying public or a potential competitor, the fact that a private business or a government business receives a subsidy might be a distinction without much of a practical difference. For instance, that Pratt and Whitney and VIA Rail alike both receive taxpayer subsidies has the same effect upon taxpayers—money is transferred. It also has the same effect on competitors—competing aerospace manufacturers and competing bus and airline companies are disadvantaged due to taxpayer-financed competition.2
Some but not all GBEs are included in the figures here. Statistics Canada includes only those businesses which it considers independent of government (Statistics Canada, 2014c).3
2. In addition, while consumer subsidies are not analyzed on their merits here, the tax-payer-consumer relationship is also artificial (though useful to analyze when data is avail-able), in that insofar as taxpayer treasuries are foregoing revenue in order to reduce power or heating bills, there is a cost to taxpayers.3. The full list of considerations to determine independence is as follows: whether the Lieutenant Governor in Council or a Minister holds control; the entity’s budget must be approved by the government; the entity must submit an annual, audited report to a government; the entity’s financial accounts are subject to examination by an Auditor General; the government finances the entity’s current operations, in total or large part; the government finances the entity’s investments, in total or large part; the government approves or guarantees loans contracted by the entity; the government controls fees charged by the entity; the government openly allows itself to be exposed to the financial
6 / Government Subsidies in Canada: A $684 Billion Price Tag
fraserinstitute.org
According to Statistics Canada, the following guidelines are used to determine what qualifies as a subsidy:
6.4 Subsidies are unrequited payments made to business sector enti-ties by governments to affect the current costs of production or the final prices of the goods and services produced or the incomes arising from that production.
6.5 Subsidies on production include payments made to business to influence the mix of factors of production used in their operations. They include assistance for training and other payments to reduce the cost of labour as well as payments to compensate producers for the interest costs of capital, property and other taxes, etc.
6.6 Subsidies on products directly affect either the price of those goods and services or the incomes arising from their production and sale. These subsidies include payments to reduce the price of, for example, passenger rail travel and other transportation services such as ferries and electricity, natural gas and other home-heating fuels. Also includ-ed in subsidies on products are payments to farmers to compensate them for low market prices for their products and to enhance their incomes from that production.
(Statistics Canada, 2008)
Some of the subsidies to business in the Statistics Canada guidelines (item 6.6) and in the data set are explicitly intended to benefit consumers through lower prices. In the 2000s, an example of this occurred in Alberta, where the province mandated that some proceeds from electricity auctions be used to defray the power bills of residential and industrial users (Alberta, 2009).
In such instances, such subsidies are better labeled indirect subsidies to consumers, even though the consumers in question never received a cheque but a lower power or energy bill instead. Here, it would be helpful to know how
risks and rewards associated with a venture; the entity performs a regulatory function; the entity is exempt from income tax; the entity is a trust wherein the government has the authority to access the trust’s assets; the entity provides goods and/or services only to a government; the entity delivers a government service such as administering government programs or implementing government policies that provide a collective or individual benefit; the public has no free choice to acquire or reject the good or service; the entity charges prices that are not economically significant; the entity gets its primary income from non-market activities; government transfers or grants cover any deficit generated by the entity; the entity’s employees negotiate collective agreements with a government (Statistics Canada, 2014c).
Government Subsidies in Canada: A $684 Billion Price Tag / 7
fraserinstitute.org
much of the spending is directed to consumers versus that which is intended to help producers qua producers. Unfortunately, Statistics Canada makes no distinction in its data set between “flow through” subsidies to consumers and
“normal” subsidies to business. Such market distortions are beyond the scope of this analysis but should be kept in mind as the reader looks at the statistics.
Statistics Canada ceased producing this series after 2009. Still, the three decades’ worth of data provides some sense of the size of subsidies at the federal, provincial, and local government levels. All figures in this first data set are adjusted for inflation to 2013 dollars. The annual figures are thus apple-to-apple comparisons.4
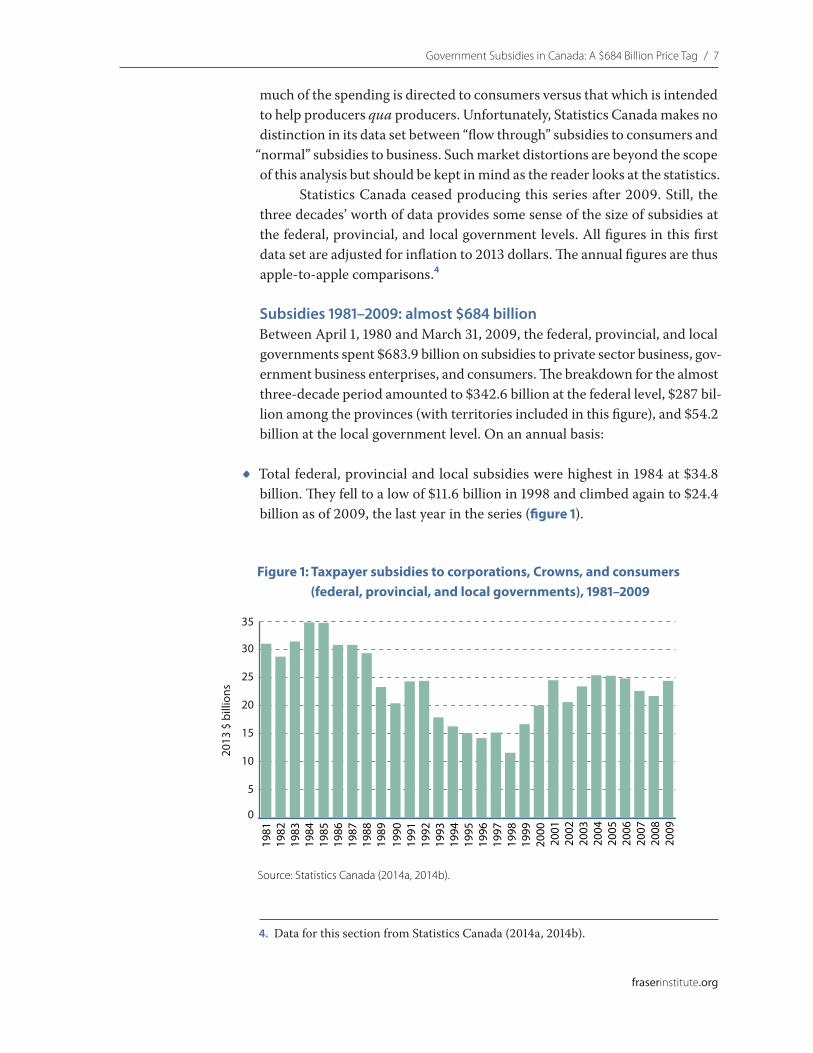
Subsidies 1981–2009: almost $684 billionBetween April 1, 1980 and March 31, 2009, the federal, provincial, and local governments spent $683.9 billion on subsidies to private sector business, gov-ernment business enterprises, and consumers. The breakdown for the almost three-decade period amounted to $342.6 billion at the federal level, $287 bil-lion among the provinces (with territories included in this figure), and $54.2 billion at the local government level. On an annual basis:
• Total federal, provincial and local subsidies were highest in 1984 at $34.8 billion. They fell to a low of $11.6 billion in 1998 and climbed again to $24.4 billion as of 2009, the last year in the series (figure 1).
4. Data for this section from Statistics Canada (2014a, 2014b).
0
5
10
15
20
25
30
35
2009
2008
2007
2006
2005
2004
2003
2002
2001
2000
1999
1998
1997
1996
1995
1994
1993
1992
1991
1990
1989
1988
1987
1986
1985
1984
1983
1982
1981
2013
$ b
illio
ns
Figure 1: Taxpayer subsidies to corporations, Crowns, and consumers (federal, provincial, and local governments), 1981–2009
Source: Statistics Canada (2014a, 2014b).
8 / Government Subsidies in Canada: A $684 Billion Price Tag
fraserinstitute.org
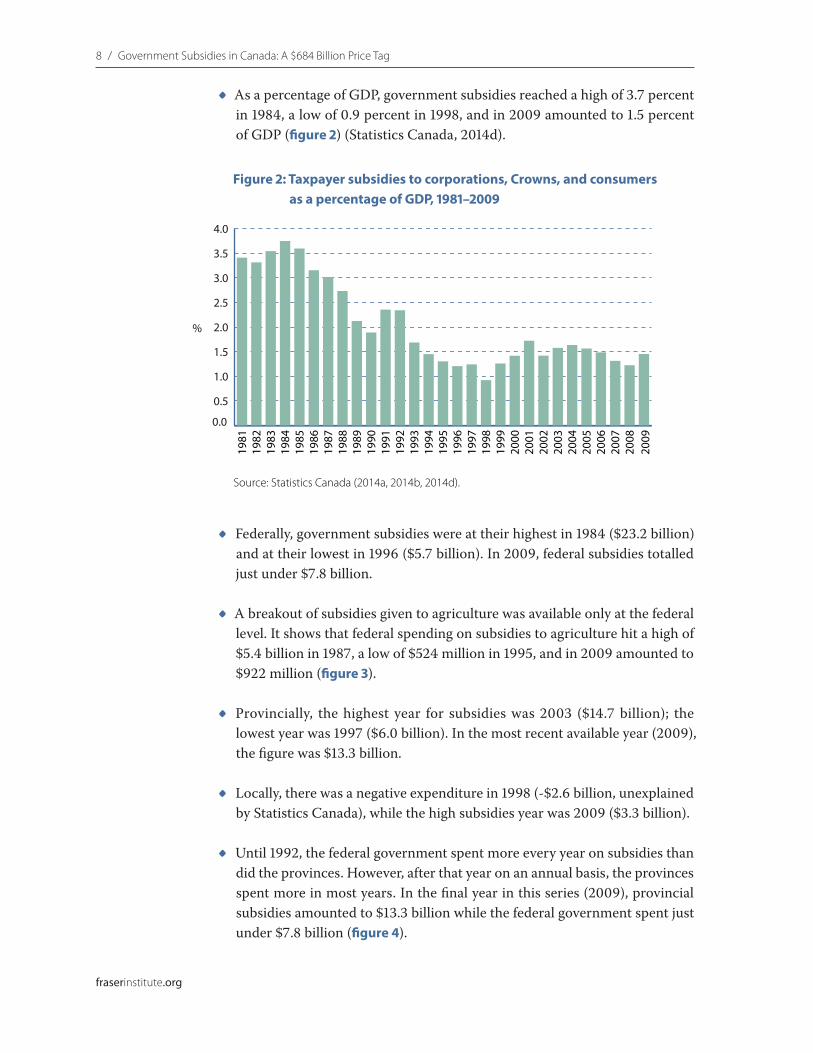
• As a percentage of GDP, government subsidies reached a high of 3.7 percent in 1984, a low of 0.9 percent in 1998, and in 2009 amounted to 1.5 percent of GDP (figure 2) (Statistics Canada, 2014d).
• Federally, government subsidies were at their highest in 1984 ($23.2 billion) and at their lowest in 1996 ($5.7 billion). In 2009, federal subsidies totalled just under $7.8 billion.
• A breakout of subsidies given to agriculture was available only at the federal level. It shows that federal spending on subsidies to agriculture hit a high of $5.4 billion in 1987, a low of $524 million in 1995, and in 2009 amounted to $922 million (figure 3).
• Provincially, the highest year for subsidies was 2003 ($14.7 billion); the lowest year was 1997 ($6.0 billion). In the most recent available year (2009), the figure was $13.3 billion.
• Locally, there was a negative expenditure in 1998 (-$2.6 billion, unexplained by Statistics Canada), while the high subsidies year was 2009 ($3.3 billion).
• Until 1992, the federal government spent more every year on subsidies than did the provinces. However, after that year on an annual basis, the provinces spent more in most years. In the final year in this series (2009), provincial subsidies amounted to $13.3 billion while the federal government spent just under $7.8 billion (figure 4).
0.0
0.5
1.0
1.5
2.0
2.5
3.0
3.5
4.0
2009
2008
2007
2006
2005
2004
2003
2002
2001
2000
1999
1998
1997
1996
1995
1994
1993
1992
1991
1990
1989
1988
1987
1986
1985
1984
1983
1982
1981
%
Figure 2: Taxpayer subsidies to corporations, Crowns, and consumers as a percentage of GDP, 1981–2009
Source: Statistics Canada (2014a, 2014b, 2014d).

Government Subsidies in Canada: A $684 Billion Price Tag / 9
fraserinstitute.org
0
5
10
15
20
25
2009
2008
2007
2006
2005
2004
2003
2002
2001
2000
1999
1998
1997
1996
1995
1994
1993
1992
1991
1990
1989
1988
1987
1986
1985
1984
1983
1982
1981
2013
$ b
illio
ns
Figure 3: Total federal spending on subsidies versus (federal only) subsidies to agriculture, 1981–2009
Source: Statistics Canada (2014a, 2014b).
Federal (including agricultural subsidies) Agriculture (federal only)
-5
0
5
10
15
20
25
2009
2008
2007
2006
2005
2004
2003
2002
2001
2000
1999
1998
1997
1996
1995
1994
1993
1992
1991
1990
1989
1988
1987
1986
1985
1984
1983
1982
1981
2013
$ b
illio
ns
Figure 4: Taxpayer subsidies to corporations, Crowns, and consumers (federal, provincial, and local governments), 1981–2009
Source: Statistics Canada (2014a, 2014b).
Federal Provincial Local

10 / Government Subsidies in Canada: A $684 Billion Price Tag
fraserinstitute.org
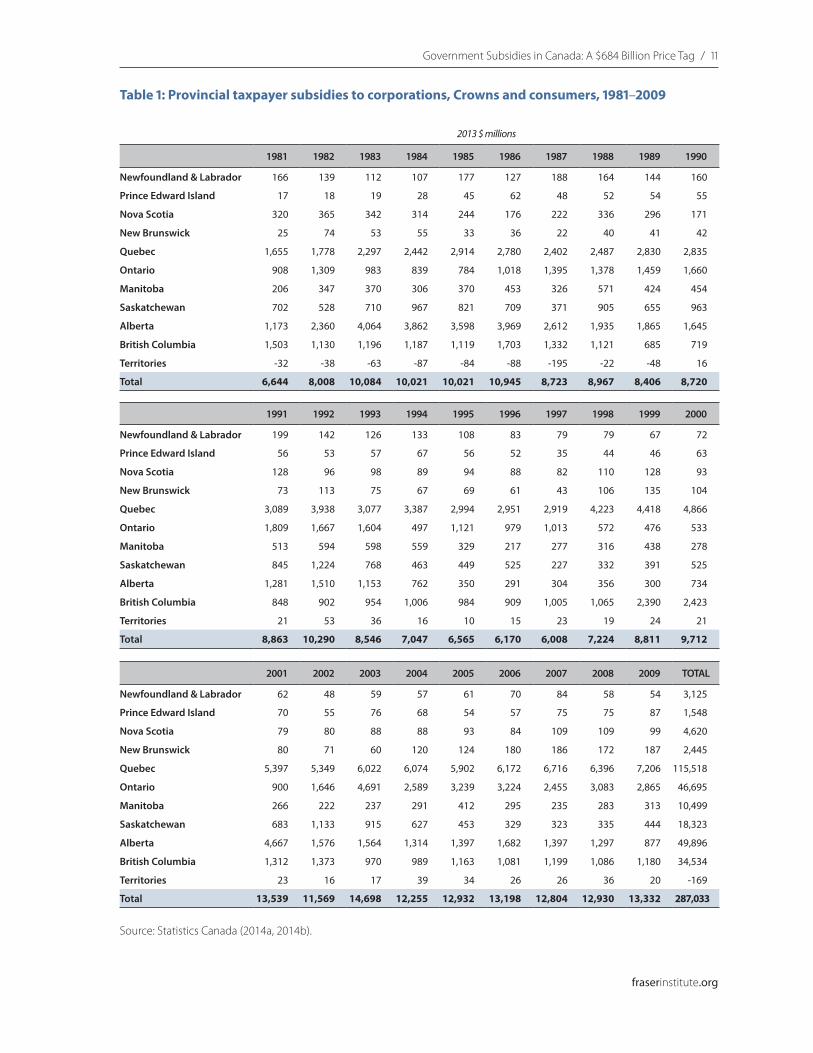
Provincial subsidies: a breakdownCollectively, the provinces spent $287 billion on subsidies between 1981 and 2009 (table 1). The 1981–2009 totals were as follows: Quebec, $115.5 billion; Alberta, $49.9 billion; Ontario, $46.7 billion; British Columbia, $34.5 billion; Saskatchewan, $18.3 billion; Manitoba, $10.5 billion; Nova Scotia, $4.6 bil-lion; Newfoundland and Labrador, $3.1 billion; New Brunswick, $2.4 billion; Prince Edward Island, $1.5 billion.
Provincial subsidies in the four largest provincesOf the four largest provinces in population, Ontario, Quebec, British Columbia, and Alberta, the west-coast province spent the least on subsidies to private business, government business enterprises, and consumers. BC spent $34.5 billion on subsidies between 1981 and 2009. The lowest year for spending of this sort was in 1989 ($685 million) with the most money spent in 1999 and also in 2000 ($2.4 billion in each year). In contrast, the shoulder years of 1998 and 2001 saw expenditures of $1.1 billion and $1.3 billion respectively.
Statistics Canada was not able to provide a breakdown of the data or the anomalies in it. However, there were some high-profile and unique expenditures in the province of British Columbia in or near these years, which would have been booked as subsidies to business. They included a provincial government write-off in the year 2000 of $1.1-billion worth of debt incurred by the BC Ferries Corporation. BC Ferries, then a provincial Crown corpora-tion, incurred some of that debt in part because of three “fast ferries” esti-mated by the provincial auditor general to have cost $462 million (British Columbia, 2000a: 27, 2000b: 567). Also, the Auditor General chronicled provincial subsidies provided to the Skeena Cellulose pulp and paper mill at a cost of $323 million over several years in the period examined here (British Columbia, 2003: 36). Both of these would have been registered in the Statistics Canada data as subsidies (Statistics Canada, 2014c).
In Alberta, subsidies were substantial in the early 1980s, most often because of transfers to businesses. Subsidies ranged from $1.2 billion in 1981 to $4 billion in 1983. In the 1990s, some spending on business was booked due to the failure of earlier provincially guaranteed loans to businesses, which cost the provincial treasury $2.2 billion by the early 1990s (Alberta, 1996: 1160). That development led the province of Alberta to pass the Business Financial Assistance Limitations Act in 1996, which restricted the practice (Alberta, 1996). Subsequently, Premier Klein regularly boasted of being out of the business of being in business, though smaller amounts were still disbursed in the last half of the 1990s. That noted, annual spending on business sub-sidies in the later 1990s did decline by over 90 percent when compared with the highest-spending years in the 1980s. Between 1995 and 1999, Alberta’s spending on business subsidies ranged between a low of $291 million (1996) to a high of just $356 million (1998).
Government Subsidies in Canada: A $684 Billion Price Tag / 11
fraserinstitute.org
Table 1: Provincial taxpayer subsidies to corporations, Crowns and consumers, 1981–2009
2013 $ millions
1981 1982 1983 1984 1985 1986 1987 1988 1989 1990
Newfoundland & Labrador 166 139 112 107 177 127 188 164 144 160
Prince Edward Island 17 18 19 28 45 62 48 52 54 55
Nova Scotia 320 365 342 314 244 176 222 336 296 171
New Brunswick 25 74 53 55 33 36 22 40 41 42
Quebec 1,655 1,778 2,297 2,442 2,914 2,780 2,402 2,487 2,830 2,835
Ontario 908 1,309 983 839 784 1,018 1,395 1,378 1,459 1,660
Manitoba 206 347 370 306 370 453 326 571 424 454
Saskatchewan 702 528 710 967 821 709 371 905 655 963
Alberta 1,173 2,360 4,064 3,862 3,598 3,969 2,612 1,935 1,865 1,645
British Columbia 1,503 1,130 1,196 1,187 1,119 1,703 1,332 1,121 685 719
Territories -32 -38 -63 -87 -84 -88 -195 -22 -48 16
Total 6,644 8,008 10,084 10,021 10,021 10,945 8,723 8,967 8,406 8,720
1991 1992 1993 1994 1995 1996 1997 1998 1999 2000
Newfoundland & Labrador 199 142 126 133 108 83 79 79 67 72
Prince Edward Island 56 53 57 67 56 52 35 44 46 63
Nova Scotia 128 96 98 89 94 88 82 110 128 93
New Brunswick 73 113 75 67 69 61 43 106 135 104
Quebec 3,089 3,938 3,077 3,387 2,994 2,951 2,919 4,223 4,418 4,866
Ontario 1,809 1,667 1,604 497 1,121 979 1,013 572 476 533
Manitoba 513 594 598 559 329 217 277 316 438 278
Saskatchewan 845 1,224 768 463 449 525 227 332 391 525
Alberta 1,281 1,510 1,153 762 350 291 304 356 300 734
British Columbia 848 902 954 1,006 984 909 1,005 1,065 2,390 2,423
Territories 21 53 36 16 10 15 23 19 24 21
Total 8,863 10,290 8,546 7,047 6,565 6,170 6,008 7,224 8,811 9,712
2001 2002 2003 2004 2005 2006 2007 2008 2009 TOTAL
Newfoundland & Labrador 62 48 59 57 61 70 84 58 54 3,125
Prince Edward Island 70 55 76 68 54 57 75 75 87 1,548
Nova Scotia 79 80 88 88 93 84 109 109 99 4,620
New Brunswick 80 71 60 120 124 180 186 172 187 2,445
Quebec 5,397 5,349 6,022 6,074 5,902 6,172 6,716 6,396 7,206 115,518
Ontario 900 1,646 4,691 2,589 3,239 3,224 2,455 3,083 2,865 46,695
Manitoba 266 222 237 291 412 295 235 283 313 10,499
Saskatchewan 683 1,133 915 627 453 329 323 335 444 18,323
Alberta 4,667 1,576 1,564 1,314 1,397 1,682 1,397 1,297 877 49,896
British Columbia 1,312 1,373 970 989 1,163 1,081 1,199 1,086 1,180 34,534
Territories 23 16 17 39 34 26 26 36 20 -169
Total 13,539 11,569 14,698 12,255 12,932 13,198 12,804 12,930 13,332 287,033
Source: Statistics Canada (2014a, 2014b).
12 / Government Subsidies in Canada: A $684 Billion Price Tag
fraserinstitute.org
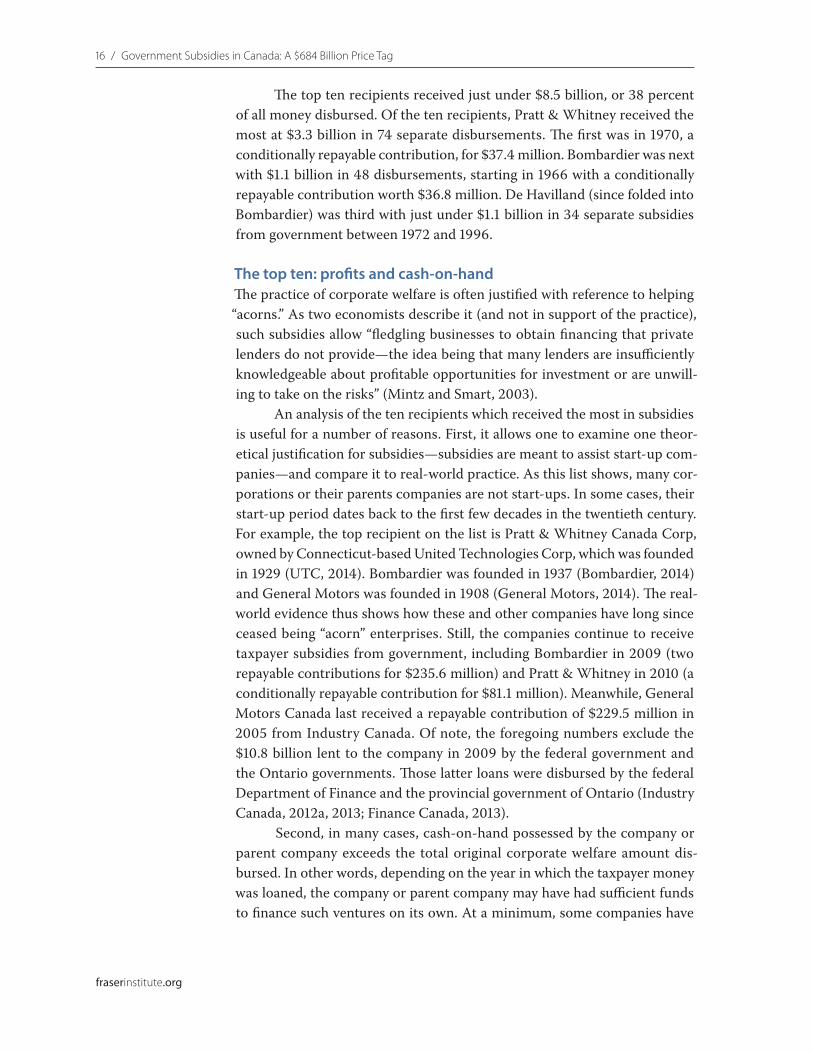
More recently, since 2000, the highest year for subsidies in Alberta was in fiscal 2001 with $4.7 billion spent, which was significantly higher than the $734 million spent in 2000.
Some explanations for the high figure can be found in other data sources. Alberta budget documents from the period note (nominal) $700 million in subsidies to farmers and ranchers in the 2000 crop year, which would have been accounted for in fiscal year 2001. In addition, the proceeds of two electricity auctions held in 2000 worth (nominal) $2 billion and used to reduce power bills in the province accounted for another spike in tracked subsidies that year. The $2-billion refund was required by provincial legisla-tion. In addition, another $690 million (nominal) was sent to Albertans dir-ectly that year as an energy tax refund (Alberta, 2001: 22-23). In addition, in subsequent years, additional proceeds from electricity auctions were again used to reduce power bills by an additional $840 million (nominal) between 2006 and 2009 (Balancing Pool, 2010: 5).
In Alberta, there were additional subsidies in the past decade that are more clearly subsidies to business. In 2003, the province spent (nominal) $1.1 billion in disaster assistance to the agricultural sector (Alberta, 2003: 26). In 2004, the province spent (nominal) $776 million in subsidies for disaster assistance to the agricultural sector in response to the Bovine Spongiform Encephalopathy (“mad cow”) crisis (Alberta, 2004: 24). Also, the province rebated some heating bill expenses to consumers between November 2003 and March 2009 (Alberta, 2009).5
In total, between 1981 and 2009, Alberta spent $49.9 billion on sub-sidies, though this includes the reduction in power and other energy bills to consumers.
In Ontario, subsidies ranged from a low of $476 million (1999) to a high of almost $4.7 billion (2003). As with Alberta, there is a noticeable one-year rise, in this case from 2002 to 2003. In Ontario’s case, Statistics Canada attributes the jump in part to consumer subsidies that year for power bills in Ontario (Statistics Canada, 2014c). Indeed, the Ontario government required Ontario Power Generation (OPG) to reduce power rates though the Market Power Mitigation Agreement. The Agreement capped power rates on a per kilowatt basis. Anything above the cap (3.8 cents per kilowatt) and higher rates required a subsidy to be paid to consumers. Such payments rose from $335 million (nominal) in 2002 to almost $1.7 billion (nominal) in 2003, thus explaining part of the dramatic rise in subsidies by 2003 (Ontario Power Generation, 2003: 61).
5. A subsidy was triggered when natural gas prices exceeded a selected price level (Statistics Canada, 2008). The government then paid the difference between the actual market price and the lower, targeted maximum price for consumers. The rebate was paid to producers who then discounted the individual residential bill accordingly on a per gigajoule basis (Alberta, 2009).

Government Subsidies in Canada: A $684 Billion Price Tag / 13
fraserinstitute.org
Between 1981 and 2009, Ontario’s total subsidies to businesses, gov-ernment business enterprises, and consumers totaled $46.7 billion. Since the turn of the millennium, on an annual basis, subsidies have never been lower than $2.5 billion annually (in 2007).
In Quebec over the decades, subsidies have increased in almost every year with few exceptions. The lowest year recorded for subsidies was 1981, at just under $1.7 billion. The highest year was 2009, with $7.2 billion spent. Quebec has a large number of Crown corporations and is also highly inter-ventionist. Both factors might explain why that province spent $115.5 billion on subsidies to private and government enterprises between 1981 and 2009. According to Statistics Canada, there is no indication of any significant sub-sidies for consumers; they were directed instead towards private and gov-ernment businesses (Statistics Canada, 2014c). Simply put, Quebec spends a significant amount on subsidies to private and government business.
Data set 2: Department of Industry
The second data set results from an Access to Information request to Industry Canada and is more straightforward than the previous Statistics Canada data. The Access data set shows payments made by the federal Department of Industry between (fiscal years) 1961 and 2013 (Industry Canada, 2013). When compared with the first set of statistics, the number is small—but it concerns just one federal department, the federal Department of Industry. It excludes all other federal departments, as well as provincial and municipal subsidies to private business and GBEs.
Adjusted for inflation to 2013 dollars, the federal Department of Industry disbursed $22.4 billion through assistance programs. This was the total after removing non-corporate entities such as governments, educational institutions, health care authorities and foundations.6 This second set of data is useful in that it highlights which companies sought and received disburse-ments from at least one department.7
6. The list of business subsidies includes entries for some agencies and corporations that are “middlemen” between the Department of Industry and business, or are industry associations. Examples of the first would be “community future” organizations where the listings show subsequent intent to provide assistance to business at a local level, and also Western Economic Diversification, which disbursed significant money to forestry com-panies in 2004. An example of the second would be the Canadian Apparel Association. Note also that the author has excluded any government business enterprises that might have appeared on the Industry Canada list in order to focus on private business in this analysis.7. It may be helpful to know that there are some major disbursements that do not appear on Industry Canada lists. For example, the 2009 automotive bailout of Chrysler and General Motors was recorded directly through the federal Department of Finance. Also,

14 / Government Subsidies in Canada: A $684 Billion Price Tag
fraserinstitute.org
Type of disbursement The $22.4 billion was disbursed to businesses in 44,424 separate payments, with $9 billion in grants and $13.4 billion in loans. The money was disbursed through ten types of expenditures, sorted and categorized under two general headings—grants and loans (table 2).
$9 billion in subsidies not expected to be repaid: “grants”Grants, conditional grants, contributions, interest contributions, and other assistance: these are all akin to grants even if under a different moniker. In these categories, the government “does not expect to receive any goods or ser-vices directly in return, to be repaid or to receive a financial return” (Treasury Board, 2001). In these five categories, as per the government’s conditions for grants et al., some repayments occasionally occur as a result of an audit, over-payment, or initial conditions for the grant later found not to have been satisfied.
disbursements to the same would also not be included in the much larger Statistics Canada data, as the Statistics Canada data ends as at March 31, 2009. The bailout for General Motors and Chrysler took place in June 2009.
Table 2: Type of Industry Canada assistance to business, 1961–2013
$ millions
Grant 352
Conditional grant 132
Contribution 8,054
Interest contribution 81
Other assistance 379
Subtotal 8,998
Repayable contributions 1,920
Conditionally repayable contributions 10,746
Conditional/unconditional repayable contributions 204
Participation loans 45
Loan guarantees 478
Subtotal 13,393
Total 22,392
Sources: Industry Canada (2013); Statistics Canada (2014b).
Government Subsidies in Canada: A $684 Billion Price Tag / 15
fraserinstitute.org
$13.4 in subsidies expected to be repaid: “loans” or loan guaranteesRepayable contributions, conditionally repayable contributions and condi-tional/unconditional repayable contributions, participation loans, and loan guarantees: these are all subsidies to business that are expected to be repaid in whole or in part (Treasury Board, 2009), and are thus “loans” in common parlance.8 In the case of loan guarantees, subsidies result from the promise that the government will repay a lender the amount guaranteed if the bor-rower defaults (Treasury Board, 2009). Some repayments occur in this cat-egory where the government later recoups some initially written-off capital.
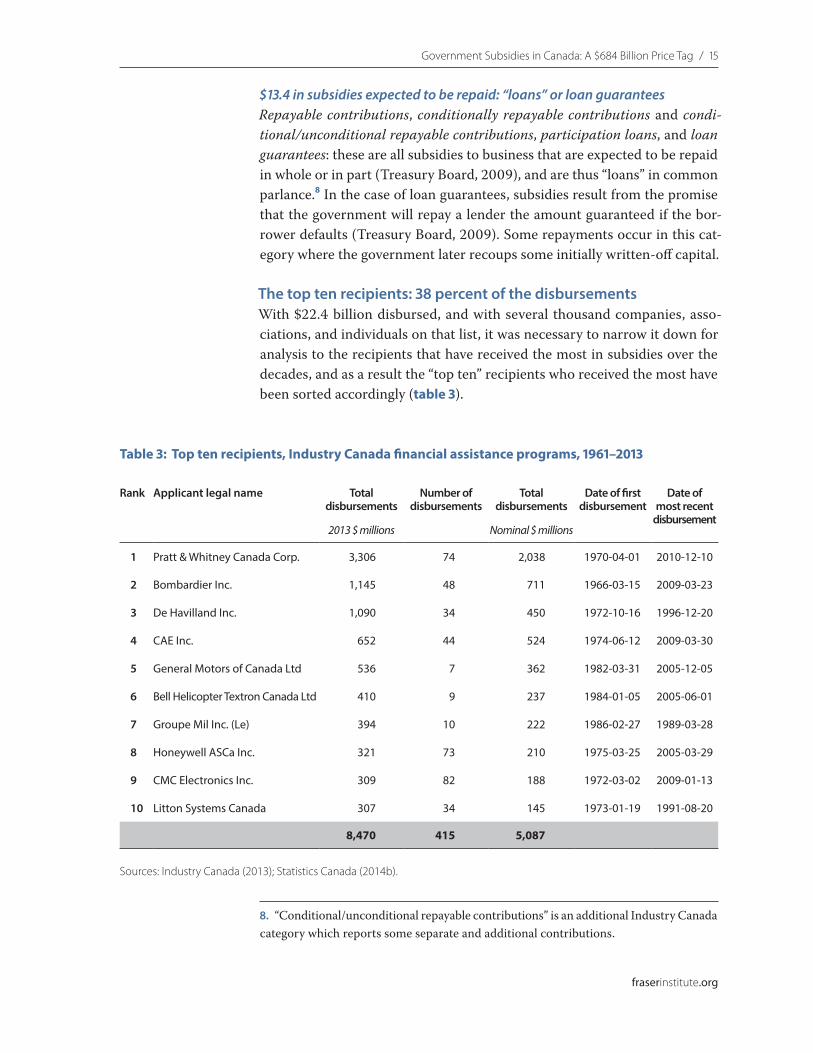
The top ten recipients: 38 percent of the disbursementsWith $22.4 billion disbursed, and with several thousand companies, asso-ciations, and individuals on that list, it was necessary to narrow it down for analysis to the recipients that have received the most in subsidies over the decades, and as a result the “top ten” recipients who received the most have been sorted accordingly (table 3).
8. “Conditional/unconditional repayable contributions” is an additional Industry Canada category which reports some separate and additional contributions.
Table 3: Top ten recipients, Industry Canada financial assistance programs, 1961–2013
Rank Applicant legal name Total disbursements
2013 $ millions
Number of disbursements
Total disbursements
Nominal $ millions
Date of first disbursement
Date of most recent
disbursement
1 Pratt & Whitney Canada Corp. 3,306 74 2,038 1970-04-01 2010-12-10
2 Bombardier Inc. 1,145 48 711 1966-03-15 2009-03-23
3 De Havilland Inc. 1,090 34 450 1972-10-16 1996-12-20
4 CAE Inc. 652 44 524 1974-06-12 2009-03-30
5 General Motors of Canada Ltd 536 7 362 1982-03-31 2005-12-05
6 Bell Helicopter Textron Canada Ltd 410 9 237 1984-01-05 2005-06-01
7 Groupe Mil Inc. (Le) 394 10 222 1986-02-27 1989-03-28
8 Honeywell ASCa Inc. 321 73 210 1975-03-25 2005-03-29
9 CMC Electronics Inc. 309 82 188 1972-03-02 2009-01-13
10 Litton Systems Canada 307 34 145 1973-01-19 1991-08-20
8,470 415 5,087
Sources: Industry Canada (2013); Statistics Canada (2014b).
16 / Government Subsidies in Canada: A $684 Billion Price Tag
fraserinstitute.org
The top ten recipients received just under $8.5 billion, or 38 percent of all money disbursed. Of the ten recipients, Pratt & Whitney received the most at $3.3 billion in 74 separate disbursements. The first was in 1970, a conditionally repayable contribution, for $37.4 million. Bombardier was next with $1.1 billion in 48 disbursements, starting in 1966 with a conditionally repayable contribution worth $36.8 million. De Havilland (since folded into Bombardier) was third with just under $1.1 billion in 34 separate subsidies from government between 1972 and 1996.
The top ten: profits and cash-on-handThe practice of corporate welfare is often justified with reference to helping “acorns.” As two economists describe it (and not in support of the practice), such subsidies allow “fledgling businesses to obtain financing that private lenders do not provide—the idea being that many lenders are insufficiently knowledgeable about profitable opportunities for investment or are unwill-ing to take on the risks” (Mintz and Smart, 2003).
An analysis of the ten recipients which received the most in subsidies is useful for a number of reasons. First, it allows one to examine one theor-etical justification for subsidies—subsidies are meant to assist start-up com-panies—and compare it to real-world practice. As this list shows, many cor-porations or their parents companies are not start-ups. In some cases, their start-up period dates back to the first few decades in the twentieth century. For example, the top recipient on the list is Pratt & Whitney Canada Corp, owned by Connecticut-based United Technologies Corp, which was founded in 1929 (UTC, 2014). Bombardier was founded in 1937 (Bombardier, 2014) and General Motors was founded in 1908 (General Motors, 2014). The real-world evidence thus shows how these and other companies have long since ceased being “acorn” enterprises. Still, the companies continue to receive taxpayer subsidies from government, including Bombardier in 2009 (two repayable contributions for $235.6 million) and Pratt & Whitney in 2010 (a conditionally repayable contribution for $81.1 million). Meanwhile, General Motors Canada last received a repayable contribution of $229.5 million in 2005 from Industry Canada. Of note, the foregoing numbers exclude the $10.8 billion lent to the company in 2009 by the federal government and the Ontario governments. Those latter loans were disbursed by the federal Department of Finance and the provincial government of Ontario (Industry Canada, 2012a, 2013; Finance Canada, 2013).
Second, in many cases, cash-on-hand possessed by the company or parent company exceeds the total original corporate welfare amount dis-bursed. In other words, depending on the year in which the taxpayer money was loaned, the company or parent company may have had sufficient funds to finance such ventures on its own. At a minimum, some companies have

Government Subsidies in Canada: A $684 Billion Price Tag / 17
fraserinstitute.org
certainly had ample time and resources to reimburse taxpayers for the sub-sidies they have received in the past.
As table 3 showed, many firms that receive assistance from the gov-ernment are regular recipients. As table 4 shows, the net earnings and cash-on-hand for such companies is often substantial, at least in their most recent annual reports.
Of the ten companies that received the most in total disbursements, one is no longer a reporting entity (Le Groupe Mill Inc.) and another was folded into another corporation (de Havilland into Bombardier in 1992). In total, all ten companies received $8.5 billion in disbursements from Industry Canada over the decades. At present, of the remaining eight companies still active, according to the most recent annual reports available, net income (profits) collectively amounted to $17.1 billion while cash-on-hand amounted to $33.4 billion.
Table 4: Financial health of top ten recipients, Industry Canada financial assistance programs
Rank Applicant legal name(Parent company where applicable / other information)
Total disbursements
1961–2013
Net income of company/parent
Cash on hand, most recent year
Year
2013 CA$ millions 2013 CA$ millions 2013 CA$ millions
1 Pratt & Whitney Canada Corp.(United Technologies Corp.)
3,306 5,568 4,887 2012
2 Bombardier Inc. 1,145 603 2,922 2012
3 De Havilland Inc.(Acquired by Bombardier in 1992)
1,090 n/a n/a n/a
4 CAE Inc. 652 142 260 2013
5 General Motors of Canada Ltd(General Motors Company)
536 6,223 18,683 2012
6 Bell Helicopter Textron Canada Ltd(Textron)
410 597 1,398 2012
7 Groupe Mil Inc. (Le)(Inactive/no reports available)
394 n/a n/a n/a
8 Honeywell ASCa Inc.(Honeywell)
321 2,973 4,700 2012
9 CMC Electronics Inc.(Esterline)
309 158 168 2013
10 Litton Systems Canada(L-3)
307 832 354 2012
8,470 17,096 33,373
Sources: Bank of Canada (2014); Industry Canada (2013); Statistics Canada (2014b); individual company annual reports where available.
18 / Government Subsidies in Canada: A $684 Billion Price Tag
fraserinstitute.org
Repayments to Industry Canada Industry Canada did not provide repayment records for the companies in question in this author’s most recent Access to Information request. The result is that repayment records of these and other companies are unclear.9 The request sought repayment data by company but the request was denied under Section 20(1) of the Act, which prevents disclosure for commercially sensitive data. In addition, at least one company, Montreal-based aerospace manufacturer Bombardier, a recipient of federal assistance since 1966, filed an objection to any release of its repayment information. It did so in February 2012, filing in the Federal Court of Canada (2012). The result of that objec-tion has not yet been decided in court.10
In past Access to Information reports regarding Industry Canada pro-grams where repayment was required, between 1981 and 2012, repayment records indicate less than 29 percent of required repayments had been made as of 2012 across all programs (Industry Canada, 2012b).
In perhaps the best example of how, even many decades later, repay-ments do not approach even the initial disbursements, consider the Defense Industry Productivity Program (DIPP). That program was in existence from 1968, along with several predecessors in the 1960s, and was terminated in 1995 (Industry Canada, 1998: 35–54). Pre-1982 numbers are not available, so with an analysis of the 1982 to 1995 period, repayments records as of 2012 show just a 35.6 percent repayment record. In other words, for a program that dated back to the 1960s—which ceased making payments to companies in 1995—by 2012, just under two-thirds of anticipated repayments had yet to arrive (Industry Canada, 2012b).
9. Industry Canada does provide a partial record of repayments on its website with the permission of companies who agree. However, the information is not comprehensive. For example, Bombardier is listed under the Technologies Partnerships repayment status report as having received $139,582,652 and having repaid $186,367,371 (both nominal figures), but that only partially accounts for the total $711 million (nominal and over $1.1 billion in 2013 dollars) lent or granted to the company over the decades. Nor do such figures include the loans and grants to de Havilland, folded into Bombardier in 1992. Similarly, Pratt & Whitney is listed as having received $1,040,116,125 under the same program and having repaid $220,040,486. Pratt & Whitney has been loaned or granted just over $2 billion (nominal; over $3.3 billion in 2013 dollars) over the decades, so pub-lic disclosure by the companies and the federal government is at present incomplete (Industry Canada, 2012a, 2013, 2014).10. Given this, a previous Access to Information request (Industry Canada 2012a) was used to “fill in” information with reference to Bombardier. In my 2013 Access request, Bombardier records were all blacked out by the department in its response because of the legal action (Federal Court of Canada, 2012). Until that matter is resolved, Industry Canada cannot provide details on Bombardier. I have thus used the previous Access request, though if the company received a disbursement between April 1, 2012 and March 31, 2013, such an amount will not be included here.
Government Subsidies in Canada: A $684 Billion Price Tag / 19
fraserinstitute.org
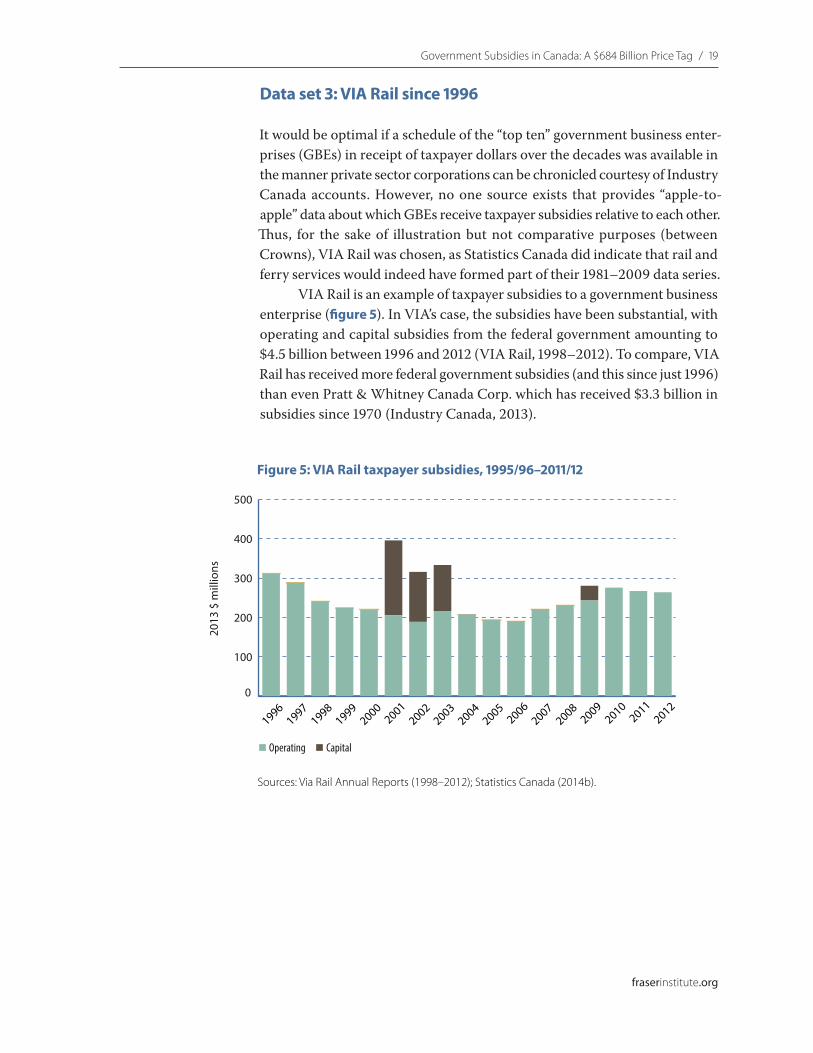
Data set 3: VIA Rail since 1996
It would be optimal if a schedule of the “top ten” government business enter-prises (GBEs) in receipt of taxpayer dollars over the decades was available in the manner private sector corporations can be chronicled courtesy of Industry Canada accounts. However, no one source exists that provides “apple-to-apple” data about which GBEs receive taxpayer subsidies relative to each other. Thus, for the sake of illustration but not comparative purposes (between Crowns), VIA Rail was chosen, as Statistics Canada did indicate that rail and ferry services would indeed have formed part of their 1981–2009 data series.
VIA Rail is an example of taxpayer subsidies to a government business enterprise (figure 5). In VIA’s case, the subsidies have been substantial, with operating and capital subsidies from the federal government amounting to $4.5 billion between 1996 and 2012 (VIA Rail, 1998–2012). To compare, VIA Rail has received more federal government subsidies (and this since just 1996) than even Pratt & Whitney Canada Corp. which has received $3.3 billion in subsidies since 1970 (Industry Canada, 2013).
0
100
200
300
400
500
20122011
20102009
20082007
20062005
20042003
20022001
20001999
19981997
1996
2013
$ m
illio
ns
Figure 5: VIA Rail taxpayer subsidies, 1995/96–2011/12
Sources: Via Rail Annual Reports (1998–2012); Statistics Canada (2014b).
Operating Capital

20 / Government Subsidies in Canada: A $684 Billion Price Tag
fraserinstitute.org
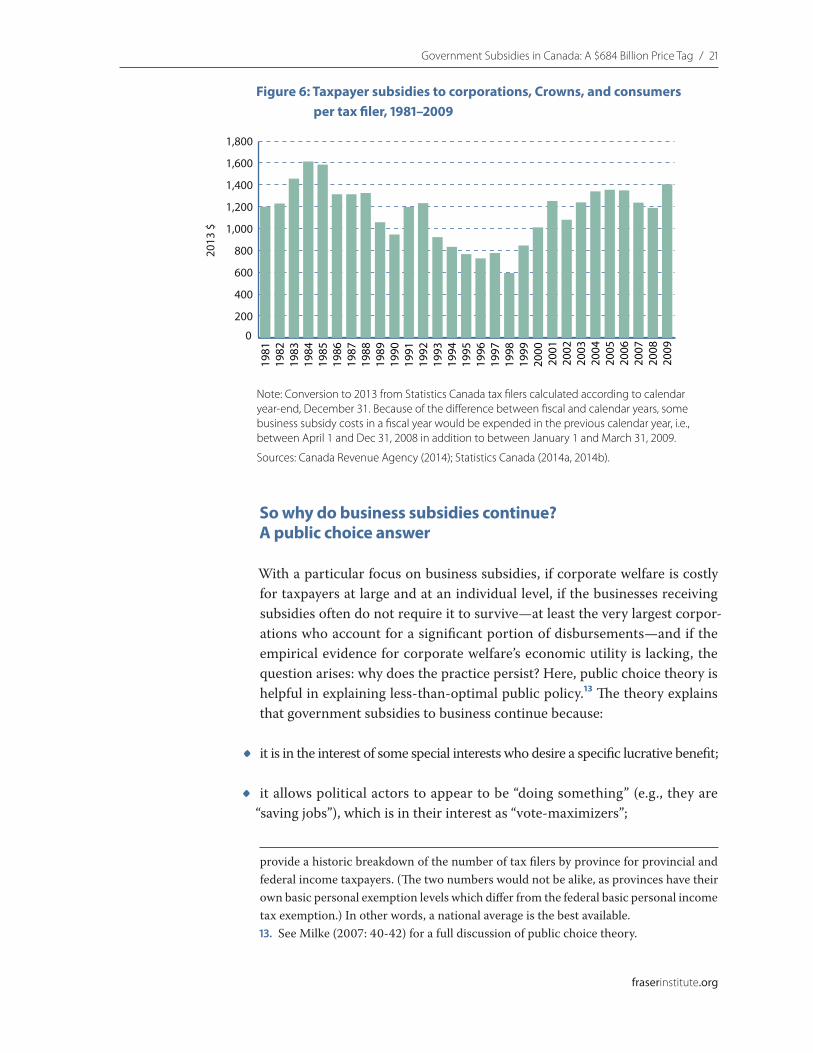
Circling back to the Statistics Canada data: $1,507 per tax filer in 2009
In addition to the initial cost of subsidies that most observers would readily identify—the money spent and/or the interest cost on money borrowed—another loss must be recorded with respect to subsidies: opportunity costs. An opportunity cost represents the lost potential for another use for that same money, and the lost potential returns from that money. For example, a consumer with limited resources who spends $1,000 on a new television and later sees a piano for the same amount cannot buy it. The lost opportunity to buy the piano is the opportunity cost. The same is true of taxes and personal choices foregone.
Of note, it is appropriate to include even the consumer subsidies in the per-taxpayer calculation. That is because there is a revenue loss to gov-ernments when the proceeds of electricity auctions, for example, are applied to consumer bills instead of directed into government treasuries. Similarly, when governments, using their Crown corporations, artificially reduce power bills, there is also foregone revenue to the treasury.11
The Statistics Canada data chronicled at the beginning of this study noted $684 billion in subsidies to private businesses, government business enterprises, and consumers between 1981 and 2009. In the case of Canadians who filed and paid taxes between 1981 and 2009, the cost of those subsidies ranged from an annual high of $3,268, in 1984, to a low of $797, in 1998 (figure 6). For those who paid income taxes in 2009, the last year available, the per-taxpayer amount was $1,507 (Statistics Canada, 2014a, 2014b; Canada Revenue Agency, 2014).
In other words, a dual income couple in Canada in 2009 would (if they paid income taxes that year) have seen a $3,014 “bill” for government subsidies, on average.12 That is the opportunity cost for taxpayers who paid tax in 2009.
11. This study does not address the usefulness of such subsidies—some, such as power bill subsidies which benefit low-income households, are helpful and useful, but those that reduce the power cost for high-income earners are unnecessary. Again, given the lack of distinction in the data, the per-taxpayer calculation must include subsidies to consumers.12. Note that this is an average for total subsidies—federal, provincial, and local, across Canada, in the years specified divided by the total number of tax filers who paid income tax. This likely overstates the amount paid by some tax filers and understates the amount paid by others, depending on the province or territory in which one lives. To gain a more precise look, one would have to calculate the number of tax filers in each province in each year by that province’s share of total tax filers to calculate a federal number, then perform the same calculation for each province for provincial subsidies, and then perform it again for local subsidies in each province. Problematically, Statistics Canada does not have local subsidies broken down by province. Also, Canada Revenue Agency statistics do not
Government Subsidies in Canada: A $684 Billion Price Tag / 21
fraserinstitute.org
So why do business subsidies continue? A public choice answer
With a particular focus on business subsidies, if corporate welfare is costly for taxpayers at large and at an individual level, if the businesses receiving subsidies often do not require it to survive—at least the very largest corpor-ations who account for a significant portion of disbursements—and if the empirical evidence for corporate welfare’s economic utility is lacking, the question arises: why does the practice persist? Here, public choice theory is helpful in explaining less-than-optimal public policy.13 The theory explains that government subsidies to business continue because:
• it is in the interest of some special interests who desire a specific lucrative benefit;
• it allows political actors to appear to be “doing something” (e.g., they are “saving jobs”), which is in their interest as “vote-maximizers”;
provide a historic breakdown of the number of tax filers by province for provincial and federal income taxpayers. (The two numbers would not be alike, as provinces have their own basic personal exemption levels which differ from the federal basic personal income tax exemption.) In other words, a national average is the best available.13. See Milke (2007: 40-42) for a full discussion of public choice theory.
0
200
400
600
800
1,000
1,200
1,400
1,600
1,800
2009
2008
2007
2006
2005
2004
2003
2002
2001
2000
1999
1998
1997
1996
1995
1994
1993
1992
1991
1990
1989
1988
1987
1986
1985
1984
1983
1982
1981
2013
$
Figure 6: Taxpayer subsidies to corporations, Crowns, and consumers per tax �ler, 1981–2009
Note: Conversion to 2013 from Statistics Canada tax �lers calculated according to calendar year-end, December 31. Because of the di�erence between �scal and calendar years, some business subsidy costs in a �scal year would be expended in the previous calendar year, i.e., between April 1 and Dec 31, 2008 in addition to between January 1 and March 31, 2009.
Sources: Canada Revenue Agency (2014); Statistics Canada (2014a, 2014b).

22 / Government Subsidies in Canada: A $684 Billion Price Tag
fraserinstitute.org
• it is not likely to be opposed by most civil servants as that would contradict their own self-interest (e.g., for job security and/or a larger budget);
• its cost per person is not enough to arouse the general public to active opposition; and,
• its cancellation would politically endanger some and offend others in a small group of politicians and bureaucrats, including the caucus and other civil servants.
In short, business subsidies continue because of the business-specific, political, and bureaucratic rationale—and not because of the economic rationale.

fraserinstitute.org / 23
Examples of resistance to business subsidies, and a way forward
Resistance to business subsidies and a ratcheting down of the practice does occasionally occur. In the 1994 Common Sense Revolution document of the then Ontario Progressive Conservative party, the party committed to reduce business subsidies. “We will cut business subsidies and reduce government grants,” read the document (Progressive Conservative Party of Ontario, 1994). After winning power in 1995, the Ontario Progressive Conservatives did reduce spending on subsidies. The result was a reduction in overall spend-ing on subsidies to $476 million by 1999 from a decade high of $1.8 billion in 1991 (Statistics Canada, 2014a).
Elsewhere, after the high-profile failures of industrial policy in the late 1980s and early 1990s, Alberta reduced spending on business subsidies for a period between the early 1990s and late 1990s (Statistics Canada, 2014a). In the case of British Columbia, after several high-profile and costly interven-tions in the 1990s, the provincial government refused further subsidies to an ailing pulp mill; the province also refused to engage in preferential treatment on shipbuilding contracts or to subsidize the industry through BC Ferries, and instead allowed an open competition to proceed (Statistics Canada, 2014a; BC Ferries, 2004).
More recently, in another example of how a costly subsidy aroused pub-lic ire and led to subsidies meeting some public approbation, after the then Nova Scotia government awarded a $304 million loan to Irving Shipyards in 2012 (Irving Shipbuilding Inc., 2012), most of it forgivable, the loan became an election issue in 2013. The incumbent party lost; importantly, the then oppos-ition Nova Scotia Liberals opposed the loan, which was only partly repayable (Taber, 2013). The new premier, Stephen McNeil, has not entirely opposed subsidies in office. After Michelin Canada laid off 500 employees in early 2014, the premier said he would discuss subsidies to the company if requested, but ruled out grants. “We’ve sent a message to companies in this province that were not in the business of giving out free money. We have not ruled out the possibility of being in a loan position with companies” (Canadian Press, 2014).

24 / fraserinstitute.org
Conclusion: areas for future study and recommendations
A number of gaps in understanding subsidies in Canada became evident in the course of writing this study. They pertain to gaps in information available from government and Statistics Canada. Civil servants in the Department of Industry and Statistics Canada were as helpful as they could be, but some observations and recommendations arise.
• In past Access to Information requests, the Department of Industry did not release details of how many contracts require interest to be paid on repayable contributions (loans), nor even under which programs interest may or may not be required. Instead, in its letter noting its refusal to provide details, Industry Canada wrote that Section 20(1) (c) of the federal Access to Information Act prohibits release of information that “could reasonably be expected to result in material financial loss or gain to, or could reasonably be expected to prejudice the competitive position of a third party” (Industry Canada, 2012b; Office of the Information Commissioner, 2012). However, with the exception of one program listed in the Access to Information request—that of the $183 million Bombardier C Series program—no other program concerns individual companies. Thus, to provide details of which programs have received interest payments cannot “be expected to result in material financial loss or gain to, or could reasonably be expected to prejudice the competitive position of a third party.” The Department of Industry appears to have arbitrarily stretched the meaning of Section 20(1)(c) beyond a reasonable interpretation. In any event, a change to the federal Access to Information Act to require disclosure (as opposed to preventing it) would resolve this problem, permanently. Insofar as companies seek and receive funding from government, a condition of receiving it could be that repayments (or the lack thereof ) be publicly reported.
• For Statistics Canada, revised approaches and additional distinctions in data would allow researchers, the public, media, and ultimately governments to observe distinctions between taxpayer subsidies directed towards private

Government Subsidies in Canada: A $684 Billion Price Tag / 25
fraserinstitute.org
business and those directed towards government business enterprises. A further distinction between any subsidies to consumers that flow through business is necessary. While such flow-through payments can still be counted as a business subsidy—by so doing, governments reduce the impact of a company’s full pricing—the three different types of subsidy (to private business, GBEs, and consumers) raise diverse public policy issues. It would be helpful for policy makers and others to consider each issue and each type of subsidy separately and on their own merits
With $683.8 billion spent between 1981 and 2009 on private business, government business enterprises, and consumers, the cost of subsidies is sig-nificant in Canada. That opportunity cost, however, creates a policy oppor-tunity. As the cost of subsidies, in 2009 alone, was $1,507 per taxpayer who paid income tax, the potential of trading at least some of those subsidies for general personal tax relief is significant. Thus, some recommendations for governments, pertaining to subsidies to private and government businesses in particular:
• Wind down and end business assistance programs within departments, sub-agencies, other departments, their sub-agencies, and in Crown corporations.
• Require transparency regarding existing subsidy flows, including repayments or the lack thereof, though this may require changes to federal and provincial Access to Information/Freedom of Information laws to lift the veil of secrecy that often shrouds repayment records of individual companies.
• Governments should support international efforts to end subsidies, including bilateral and multilateral free trade agreements, with additional clauses to more clearly prohibit such subsidies. It is in Canada’s interest to reduce rules against our imports and to be able to compete with non-subsidized companies from other jurisdictions.

26 / fraserinstitute.org
References
BC Ferries (2004, September 17). BC Ferries Board Approves $325 Million in Contracts. <https://www.bcferries.com/news_archive/files/04-071-super_c_vessels.pdf>
Bombardier (2014). History. <http://www.bombardier.com/en/about-us/history.html>
Canadian Press (2014). Nova Scotia Premier Says His Government Is Open to Helping Michelin If Asked. News Release. <http://www.680news.com/2014/03/06/nova-scotia-premier-says-his-government-is-open-to-helping-michelin-if-asked/>
General Motors (2014). Company: History & Heritage. <http://www.gm.com/company/historyAndHeritage/creation.html>
Irving Shipbuilding Inc. (2012). Province Invests in Jobs, Infrastructure, and Training Through Shipbuilding Contracts. News Release. <http://www.irvingshipbuilding.com/irving-shipbuilding-news.aspx>
Milke, Mark (2007). Corporate Welfare: A $144 Billion Addiction. Fraser Institute. <http://www.fraserinstitute.org/research-news/display.aspx?id=12944>
Milke, Mark (2008). Corporate Welfare: Now a $182 Billion Addiction. A Fiscal Update on Business Subsidies in Canada. Fraser Institute. <http://www.fraserinstitute.org/research-news/display.aspx?id=12945>
Milke, Mark (2009). Corporate Welfare Breaks the $200 Billion Mark: An Update on 13 Years of Business Subsidies in Canada. Fraser Institute. <http://www.fraserinstitute.org/research-news/display.aspx?id=12943>
All websites retrievable as of April 3, 2014.

Government Subsidies in Canada: A $684 Billion Price Tag / 27
fraserinstitute.org
Milke, Mark (2011). Ontario’s Corporate Welfare Bill: $27.2 Billion. Fraser Institute. <http://http://www.fraserinstitute.org/research-news/display.aspx?id=2147483988>
Milke, Mark (2012). Corporate Welfare Bargains at Industry Canada. Fraser Institute. <http://www.fraserinstitute.org/uploadedFiles/fraser-ca/Content/research-news/research/publications/corporate-welfare-bargains-at-industry-canada.pdf>
Milke, Mark (2013). Corporate Welfare at Industry Canada Since John Diefenbaker. Fraser Institute. <http://www.fraserinstitute.org/uploadedFiles/fraser-ca/Content/research-news/research/publications/corporate-welfare-at-industry-canada-since-john-diefenbaker.pdf>
Mintz, Jack, and Michael Smart (2003). Brooking No Favorites: A New Approach to Regional Development in Atlantic Canada. CD Howe Institute.
Organisation for Economic Co-operation and Development [OECD] (2006). Policy Framework for Investment. OECD. <http://www.oecd.org/daf/inv/36671400.pdf>
Porter, Michael (2003). The Economic Performance of Regions. Regional Studies 37, 6–7 (August–October): 549–578.
Progressive Conservative Party of Ontario (1994). The Common Sense Revolution. <http://www.scribd.com/doc/57099326/Common-Sense-Revolution>
Taber, Jane (2013, October 20). Dexter Doles Out Blame After Stunning N.S. Election Loss. The Globe and Mail. <http://www.theglobeandmail.com/news/politics/dexter-doles-out-blame-after-stunning-ns-election-loss/article14956112/#dashboard/follows/>
United Technology Corp. (2014). UTRC Historical Highlights. <http://www.utrc.utc.com/pages/OurCompany/our_history.html>
World Trade Organization (2006). World Trade Report: Exploring the Links Between Subsidies, Trade and the WTO. World Trade Organization.
28 / Government Subsidies in Canada: A $684 Billion Price Tag
fraserinstitute.org
Government sources
Alberta (1996). Business Financial Assistance Limitation Act 1996. Government of Alberta. <http://www.assembly.ab.ca/ISYS/LADDAR_files/docs/hansards/han/legislature_23/session_4/19960416_2000_01_han.pdf>
Alberta, Ministry of Finance (2001). Budget 2001, Fiscal Plan 2001–04. Government of Alberta. <http://finance.alberta.ca/publications/budget/budget2001/fiscal.pdf>
Alberta, Ministry of Finance (2003). Budget 2003, Fiscal Plan. Government of Alberta. <http://finance.alberta.ca/publications/budget/budget2003/fiscal.pdf>
Alberta, Ministry of Finance (2004). Budget 2004, Fiscal Plan. Government of Alberta. <http://finance.alberta.ca/publications/budget/budget2004/fiscal.pdf>
Alberta (2009). History of the Natural Gas Rebate Program. Government of Alberta. <http://www.energy.alberta.ca/About_Us/1566.asp>
Balancing Pool (2010). 2010 Annual Report. <http://www.balancingpool.ca/wp-content/uploads/2013/05/FinancialReports_2010.pdf>
Bank of Canada (2014). Exchange Rates. 2013, 2012. <http://www.bankofcanada.ca/stats/assets/pdf/nraa-2013.pdf> <http://www.bankofcanada.ca/stats/assets/pdf/nraa-2012.pdf>
British Columbia, Ministry of Finance (2000a). First Quarterly Report 2000/01. Government of British Columbia. <http://www.fin.gov.bc.ca/archive/Q_reports/qr00/Q1_00.pdf>
British Columbia, Office of the Auditor General (2000b). A Review of the Fast Ferry Project: Governance and Risk Management. Government of British Columbia. <http://www.bcauditor.com/files/publications/1999/report5/report/review-fast-ferry-project-governance-and-risk-management.pdf>
British Columbia, Office of the Auditor General. (2003). Report 10: Adopting Best Practices in Government Financial Statements. Government of of British Columbia. <http://ministries.bcauditor.com/files/publications/2003/report10/report/adopting-best-practices-government-financial-statements–20012002.pdf>
Canada Revenue Agency (2014). Historical Table 1 Taxation Years 1962–2008. <http://www.cra-arc.gc.ca/gncy/stts/gb08/pst/fnl/pdf/htbl1-eng.pdf>

Government Subsidies in Canada: A $684 Billion Price Tag / 29
fraserinstitute.org
Federal Court of Canada (2012). Court Number T-380-12, Bombardier Inc. v. Attorney General of Canada. <http://cas-ncr-nter03.cas-satj.gc.ca/IndexingQueries/infp_RE_info_e.php?court_no=T-380-12>
Finance Canada (2013). E-mail to author from federal Department of Finance with data for calculations.
Industry Canada (1998). A Structuralist Assessment of Technology Policies: Taking Schumpeter Seriously on Policy. Working paper No. 25. Industry Canada Research Publication Programs.
Industry Canada (2012a). Access to Information request by author, received September 19, 2012.
Industry Canada (2012b). ). Access to Information request by author, received March 23, 2012.
Industry Canada (2013). Access to Information request 2013-00097, received September 17, 2013.
Industry Canada (2014). Technology Partnerships Canada (TPC) Repayment Status Report, November 1, 2013. <http://ito.ic.gc.ca/eic/site/ito-oti.nsf/eng/00880.html>
Office of the Information Commissioner (2012). Investigators Guide to Interpreting the ATIA. <http://www.oic-ci.gc.ca/eng/inv_inv-gui-ati_gui-inv-ati_section_20(1)(c)(d).aspx>
Ontario Power Generation (2003). OPG 2003 Annual Report. <http://www.opg.com/about/finance/Documents/2003_Annual_Report.pdf>
Statistics Canada (2008). Guide to Income and Expenditure Accounts, Taxes less subsidies: Definitions. <http://www.statcan.gc.ca/pub/13-017-x/2008001/themes/ch06/5213353-eng.htm>
Statistics Canada (2014a). Table 384-0010, Government Subsidies and Capital Transfers, Provincial Economic Accounts. <http://www5.statcan.gc.ca/cansim/pick-choisir?lang=eng&p2=33&id=3840010>
Statistics Canada (2014b). Table 326-0021—Consumer Price Index (CPI), 2009 basket, annual. <http://www5.statcan.gc.ca/cansim/pick-choisir?lang=eng&p2=33&id=3260021>

30 / Government Subsidies in Canada: A $684 Billion Price Tag
fraserinstitute.org
Statistics Canada (2014c). E-mails to author from Mr. Stephen West at Statistics Canada, January 27, 28, February 8 and 10, 2014.
Statistics Canada (2014d). Table 380-0063—Gross domestic product, income-based, annual (dollars).
Treasury Board of Canada Secretariat (2001). Accounting Standard 3.2 - Treasury Board: Transfer Payments. <http://www.tbs-sct.gc.ca/pol/doc-eng.aspx?id=12178§ion=text>
Treasury Board of Canada Secretariat (2009). Directive on Loans and Loan Guarantees: Definitions. <http://www.tbs-sct.gc.ca/pol/doc-eng.aspx?id=17062§ion=text#loans>
Via Rail (1998–2012). Annual Reports. <http://www.viarail.ca/sites/all/files/media/pdfs/About_VIA/our-company/annual-reports/2012/via-annual-report-2012.pdf> (2012) <http://www.viarail.ca/sites/all/files/media/pdfs/About_VIA/our-company/annual-reports/2011/VIA-Rail-Annual-Report-2011.pdf> (2011) <http://www.viarail.ca/sites/all/files/media/pdfs/About_VIA/our-company/annual-reports/2010/via_ar_2010_en.pdf> (2010)
Government Subsidies in Canada: A $684 Billion Price Tag / 45
fraserinstitute.org
About the author
Mark MilkeMark Milke is Senior Fellow at the Fraser Institute. A long-time contributor to the Institute, Mr. Milke is the author of four books on Canadian politics and policy and dozens of studies, on topics such as property rights, public sector pensions, corporate welfare, competition policy, aboriginal matters, and taxes. Mr. Milke is the former research director for the Frontier Centre for Public Policy and former BC and Alberta director with the Canadian Taxpayers’ Federation. His work has been published widely in Canada since 1997 and, in addition to the Fraser Institute, his papers have also been published in the United States by the American Enterprise Institute, the Competitive Enterprise Institute, and the Heritage Foundation, and in Europe by the Brussels-based Centre for European Studies.
Mr. Milke is a Saturday columnist for the Calgary Herald and his columns also appear in the National Post, Globe and Mail, Reader’s Digest, Edmonton Journal, Montreal Gazette, Vancouver Sun, BC’s The Province, Victoria’s Times Colonist, and the Sun newspaper chain. Mr. Milke has a Master’s degree from the University of Alberta, where his M.A. thesis an-alyzed human rights in East Asia; he also has a Ph.D. in Political Science from the University of Calgary, where his doctoral dissertation analyzed the rhetoric of Canadian-American relations. Mr. Milke is chairman of the edi-torial board of Canada’s Journal of Ideas C2C Journal, president of Civitas, and a past lecturer in Political Philosophy and International Relations at the University of Calgary.
Acknowledgments
Thanks are due to Joel Emes, Parker Gallant, Steve West at Statistics Canada, Industry Canada, Alberta Finance, Office of the Information Commissioner, and anonymous peer reviewers. Any remaining errors or omissions are the sole responsibility of the author. As he has worked independently, opinions expressed by him are his own and do not necessarily reflect the opinions of the supporters, trustees, or other staff of the Fraser Institute.

46 / Government Subsidies in Canada: A $684 Billion Price Tag
fraserinstitute.org
Publishing information
DistributionThese publications are available from <http://www.fraserinstitute.org> in Portable Document Format (PDF) and can be read with Adobe Acrobat® or Adobe Reader®, versions 7 or later. Adobe Reader® XI, the most recent ver-sion, is available free of charge from Adobe Systems Inc. at <http://get.adobe.com/reader/>. Readers having trouble viewing or printing our PDF files us-ing applications from other manufacturers (e.g., Apple’s Preview) should use Reader® or Acrobat®.
Ordering publicationsTo order printed publications from the Fraser Institute, please contact the publications coordinator:
• e-mail: [email protected] • telephone: 604.688.0221 ext. 580 or, toll free, 1.800.665.3558 ext. 580 • fax: 604.688.8539.
MediaFor media enquiries, please contact our Communications Department:
• 604.714.4582 • e-mail: [email protected].
CopyrightCopyright © 2014 by the Fraser Institute. All rights reserved. No part of this publication may be reproduced in any manner whatsoever without written permission except in the case of brief passages quoted in critical articles and reviews.
Date of issueJune 2014
ISBN978-0-88975-299-3
CitationMilke, Mark (2014). Government Subsidies in Canada: A $684 Billion Price Tag. Fraser Institute. <http://www.fraserinstitute.org>
Cover designBill Ray
Cover imageWheelbarrow © Coramax, Bigstock; hand of man … © foodbytes, Bigstock.

Government Subsidies in Canada: A $684 Billion Price Tag / 47
fraserinstitute.org
Supporting the Fraser Institute
To learn how to support the Fraser Institute, please contact
• Development Department, Fraser Institute Fourth Floor, 1770 Burrard Street Vancouver, British Columbia, V6J 3G7 Canada
• telephone, toll-free: 1.800.665.3558 ext. 586
• e-mail: [email protected]
Lifetime patronsFor their long-standing and valuable support contributing to the success of the Fraser Institute, the following people have been recognized and inducted as Lifetime Patrons of the Fraser Institute.
Sonja Bata
Charles Barlow
Ev Berg
Art Grunder
Jim Chaplin
Serge Darkazanli
John Dobson
Raymond Heung
Bill Korol
Bill Mackness
Fred Mannix
Jack Pirie
Con Riley
Catherine Windels
48 / Government Subsidies in Canada: A $684 Billion Price Tag
fraserinstitute.org
Purpose, funding, & independence
The Fraser Institute provides a useful public service. We report objective information about the economic and social effects of current public policies, and we offer evidence-based research and education about policy options that can improve the quality of life.
The Institute is a non-profit organization. Our activities are funded by charitable donations, unrestricted grants, ticket sales, and sponsorships from events, the licensing of products for public distribution, and the sale of publications.
All research is subject to rigorous review by external experts, and is conducted and published separately from the Institute’s Board of Trustees and its donors.
The opinions expressed by the authors are those of the individuals themselves, and do not necessarily reflect those of the Institute, its Board of Trustees, its donors and supporters, or its staff. This publication in no way implies that the Fraser Institute, its trustees, or staff are in favour of, or op-pose the passage of, any bill; or that they support or oppose any particular political party or candidate.
As a healthy part of public discussion among fellow citizens who de-sire to improve the lives of people through better public policy, the Institute welcomes evidence-focused scrutiny of the research we publish, including verification of data sources, replication of analytical methods, and intelligent debate about the practical effects of policy recommendations.

Government Subsidies in Canada: A $684 Billion Price Tag / 49
fraserinstitute.org
About the Fraser Institute
Our vision is a free and prosperous world where individuals benefit from greater choice, competitive markets, and personal responsibility. Our mission is to measure, study, and communicate the impact of competitive markets and government interventions on the welfare of individuals.
Founded in 1974, we are an independent Canadian research and edu-cational organization with locations throughout North America and interna-tional partners in over 85 countries. Our work is financed by tax-deductible contributions from thousands of individuals, organizations, and foundations. In order to protect its independence, the Institute does not accept grants from government or contracts for research.
Nous envisageons un monde libre et prospère, où chaque personne bénéfi-cie d’un plus grand choix, de marchés concurrentiels et de responsabilités individuelles. Notre mission consiste à mesurer, à étudier et à communiquer l’effet des marchés concurrentiels et des interventions gouvernementales sur le bien-être des individus.
Peer review —validating the accuracy of our researchThe Fraser Institute maintains a rigorous peer review process for its research. New research, major research projects, and substantively modified research conducted by the Fraser Institute are reviewed by experts with a recognized expertise in the topic area being addressed. Whenever possible, external review is a blind process. Updates to previously reviewed research or new editions of previously reviewed research are not reviewed unless the update includes substantive or material changes in the methodology.
The review process is overseen by the directors of the Institute’s re-search departments who are responsible for ensuring all research published by the Institute passes through the appropriate peer review. If a dispute about the recommendations of the reviewers should arise during the Institute’s peer review process, the Institute has an Editorial Advisory Board, a panel of scholars from Canada, the United States, and Europe to whom it can turn for help in resolving the dispute.
50 / Government Subsidies in Canada: A $684 Billion Price Tag
fraserinstitute.org
Members
Past members
Editorial Advisory Board
* deceased; † Nobel Laureate
Prof. Terry L. Anderson
Prof. Robert Barro
Prof. Michael Bliss
Prof. Jean-Pierre Centi
Prof. John Chant
Prof. Bev Dahlby
Prof. Erwin Diewert
Prof. Stephen Easton
Prof. J.C. Herbert Emery
Prof. Jack L. Granatstein
Prof. Herbert G. Grubel
Prof. James Gwartney
Prof. Ronald W. Jones
Dr. Jerry Jordan
Prof. Ross McKitrick
Prof. Michael Parkin
Prof. Friedrich Schneider
Prof. Lawrence B. Smith
Dr. Vito Tanzi
Prof. Armen Alchian*
Prof. James M. Buchanan* †
Prof. Friedrich A. Hayek* †
Prof. H.G. Johnson*
Prof. F.G. Pennance*
Prof. George Stigler* †
Sir Alan Walters*
Prof. Edwin G. West*
Related Documents