Governing Migration & Urbanisation in South African Municipalities: Developing Approaches to Counter Poverty and Social Fragmentation Written by Loren B. Landau and Aurelia Segatti with Jean Pierre Misago Editorial from Seana Nkhahle, Nomusa Ngwenya, and Tamlyn Monson January 2011

Welcome message from author
This document is posted to help you gain knowledge. Please leave a comment to let me know what you think about it! Share it to your friends and learn new things together.
Transcript
Governing Migration & Urbanisation in South African Municipalities:
Developing Approaches to Counter Poverty and Social Fragmentation
Written by Loren B. Landau and Aurelia Segatti with Jean Pierre Misago
Editorial from Seana Nkhahle, Nomusa Ngwenya, and Tamlyn Monson
January 2011
2
A research report published by the South African Local Government Association (SALGA)
175 Menlyn Corporate Park, Corner Garsfontein & Corrobay Road, Menlyn, 0181, South Africa
PO Box 2094, Pretoria, 0001
Tel: (+27) 12 369 8000
Fax: (+27) 12 369 8100
Email: www.salga.org.za
The Programme to Support Pro-Poor Policy Development (PSPPD) is a programme of the Presidency,
Republic of SA and the Delegation of the European Union. This document has been produced with its support.
The contents of this report are the sole responsibility of ACMS and can in no way be taken to reflect the views
of the Presidency (RSA) and the European Union.
Special thanks go to:
The African Centre for Migration and Society at Wits University for partnering with SALGA and leading
the research towards the production of the report. The following stakeholders are acknowledged for their
contribution: the City of Tshwane, Nelson Mandela Bay Metropolitan, Merafong and Mossel Bay municipalities,
SAPS officials, Community Development Workers, Business Communities, and Civil Society representatives.
Printed and bound by: Shereno Printers - 011 894 4150 / 012 344 2817
3
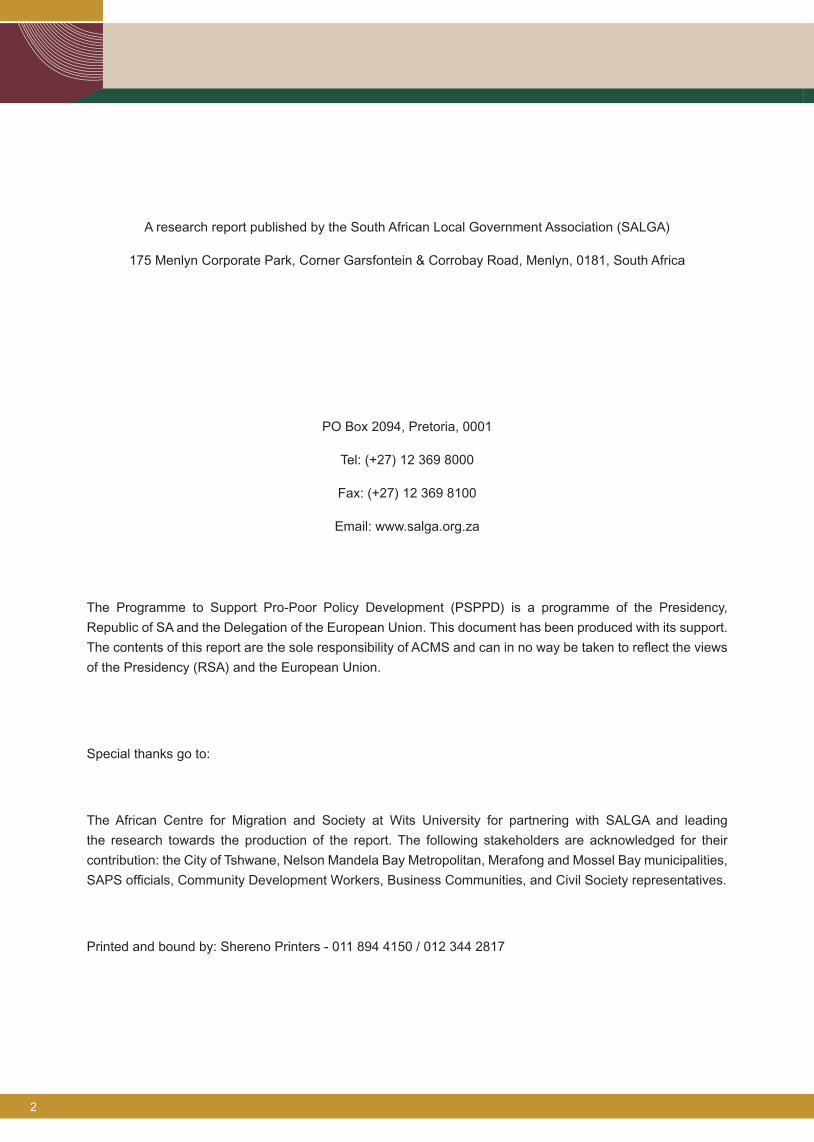
Table of Contents
List of Tables and Figures .................................................................................................................................4
Acronyms..........................................................................................................................................................5
Acknowledgements ..........................................................................................................................................6
Executive Summary..........................................................................................................................................7
Chapter 1: Introduction and Framing ..............................................................................................................12
Chapter 2: Population Data – Collection and Use ..........................................................................................26
Chapter 3: Consultation, Planning and Budgeting .........................................................................................36
Chapter 4: Security, Conflict and Social Cohesion .........................................................................................41
Recommendations..........................................................................................................................................47
References. ....................................................................................................................................................50

4
List of Tables and Figures
Table 1: Percentage Distribution of Non-migrants and Migrants Based on Place of Birth .......................18
Table 2: Matrix of Origin of Migrants between Provinces 2001-2007 .......................................................18
Figure 1: Distribution of Recent International Migrants ..............................................................................17
Figure 2: Percentage of Internal Migrants by District Municipalities ..........................................................19
Figure 3: Migration Patterns and Urban Growth ........................................................................................20
Figure 4: South African Municipalities by Level of Human Development Index .........................................23
Figure 5: South African Municipalities by Percentage of Recent Migrants and Human
Development Index score. ..........................................................................................................24
Figure 6: South African Municipalities by Level of Recent Migrants’ Relative Productivity
and Municipalities Affected by Xenophobic Violence in May 2008 .............................................25

5
Acronyms
ACMS African Centre for Migration and Society, Wits University
ANC African National Congress
ATTP Assistance to the Poor
CDW Community Development Worker
CoGTA Department of Cooperative Governance and Traditional Affairs
DHA Department of Home Affairs
DPLG Department of Provincial and Local Government
DPSA Department of Public Service and Administration
GDP Gross Domestic Product
HDI Human Development Index
HIV/AIDS Human Immunodeficiency Deficiency Virus / Acquired Immune Deficiency Syndrome
HSRC Human Sciences Research Council
IDP Integrated Development Planning
IRD Institute of Research for Development
JMAC Johannesburg Migrants’ Advisory Committee
LGES Local Government Equitable Share
MEC Member of the Executive Committee
MMC Member of the Mayoral Committee
NGO Non-Governmental Organisation
PSPPD Programme to Support Pro-poor Policy Development
SADC Southern African Development Community
SALGA South African Local Government Association
SAPS South African Police Service
SMME Small, Medium and Micro Enterprise
StatsSA Statistics South Africa
UNDP United Nations Development Programme
6
Acknowledgements
Given its geographic scope and thematic focus, the conceptualisation, data collection and drafting of this
report has drawn on a broad network of researchers, collaborators, officials, and residents of communities
across South Africa. Most of the fieldwork for this report was conducted by a team of researchers coordinated
by the African Centre for Migration and Society (formerly the Forced Migration Studies Programme) at the
University of the Witwatersrand, Johannesburg. The team included Kathryn Takabvirwa, Mpapa Kanyane,
Nomusa Ngwenya, and Guguletu Siziba. Jean- Pierre Misago led the team and provided the lead authors with
the synthetic case reports on which much of this report is based. The report also draws on work by Saskia
Greyling, Netsai Matshaka, Ncedo Mngqibisa, and Boipelo Moagaesi. Veronique Gindrey provided invaluable
assistance in conceptualising the research and conducting much of the statistical analysis included here.
The research for this report is a product of a collaborative effort between the South African Local Government
Association (SALGA) and the African Centre for Migration and Society (ACMS). It was generously supported
by:
The Programme to Support Pro-poor Policy Development (PSPPD) based at the Office of the Presidency, •
Republic of South Africa;
The Institute of Research for Development (IRD), France; •
The Migrating Out of Poverty Research Programme Consortium funded by the Department for International •
Development, United Kingdom; and
The Atlantic Philanthropies. •
7
Executive Summary
Developmental local government enshrined in the Constitution of the Republic of South Africa, Act 108 of 1996
and the White Paper on Local Government empower municipalities to be a leading force for development.
Municipal authorities have nevertheless been wary of addressing population movements and acknowledging
human mobility as a fundamental driver of or response to development. Rather than take a proactive approach
that plans for mobility in all of its forms, South African local authorities have typically been unable to address
challenges related to migration, including inter-group conflict, economic marginalisation, and the inability to
access suitable services. Yet failing to meet the very real challenges of domestic and international migration
creates the risk of increasing conflict, violence, poverty and social exclusion in ways that negatively affect
all urban residents. While local authorities and the South African Local Government Association (SALGA)
have begun to recognise the importance of mobility for the rights and welfare of all residents, municipalities
still face numerous obstacles in creating inclusive and equitable communities. Building on almost a year of
original research across South Africa, the following pages outline some of the major issues preventing local
government from promoting the wellbeing of all residents and migrants, regardless of nationality or legal
status, in South African municipalities.
The Scope and Limitations of Municipal Responsibility
Municipalities in South Africa are constitutionally assigned a primary role of providing basic services to
communities, regardless of race, gender, and origin. National or provincial governments are responsible for the
primary needs of migrants, such as access to shelter, health care, education, and economic opportunities; safety
and security – including proper treatment in detention; and administrative justice. Despite this, under Section
153(a) of the Constitution, municipalities have a responsibility to ‘structure and manage its administration,
budgeting and planning processes to give priority to the basic needs of their communities and to promote the
social and economic development of the community.’ In this regard, the ‘integrated development planning’
(IDP) process must be used as a tool to plan future development in a way that integrates the efforts of all
spheres of government as well as other non-state stakeholders.
The success of municipalities depends on authorities’ ability to develop and respond to a nuanced and
dynamic understanding of their constituencies. Due to a range of factors, including poor data collection
and analysis, few municipalities are able to do so. Indeed, one of the most fundamental challenges to
local government in protecting the rights and welfare of migrants and other residents is how little
municipalities know about the people living in their areas of jurisdiction. There is a lack of information
about the urban poor generally, and even less about geographically mobile people. To some extent, larger
municipalities have been able to develop their own research departments and monitoring systems. Smaller
municipalities continue to struggle to make sense of their communities’ population dynamics.
Although high quality data are often absent, there is widespread recognition of the value that improved
data collection, research and analysis could offer to municipal planners and managers. However, one of the
major obstacles to improving data collection and management emerges from a degree of confusion over who
collects and manages data. As such, municipal planning departments typically act as a mere interface with
Statistics South Africa (StatsSA), but often cannot extrapolate from it and have no capacity to conduct research
themselves if there is a need for updated or more localised data. In addition, the current capacities and data
processes in municipalities limit the ability of municipal practitioners and leaders to use the data in planning

8 Executive Summary
and decision making. Without a proactive perspective on what can be done to address human mobility,
the common refrain – ‘We can’t cope with this influx of people!’ – threatens to become a self-fulfilling
prophecy.
Perceptions and Capacity
Across South Africa, officials continue to react to foreign and domestic migrants by implicitly denying
their presence, excluding them from developmental plans, or tacitly condoning discrimination throughout
the government bureaucracy and police. Migrants are members of the community entitled to government
resources, and are potential resources for communities, but in many cases, government officials see them as
an illegitimate drain on public resources. In some municipalities, there is a distinct sense that current residents
or ‘ratepayers’ deserve to be privileged over new arrivals or temporary residents. In others, officials hold fast
to the idea that migration worsens violent crime, disease, and unemployment. Still others insist that matters
related to migration and human mobility are exclusively the responsibility of national government. These
perceptions place migrants outside of the local government constituency, preventing officials from adopting
pragmatic policies to address their developmental impact and provide for their needs.
Staffing, transitions, and coordination within municipalities have also limited local authorities’ ability to
develop appropriate frameworks. In some municipalities, leadership and staff turnovers have resulted in the
redeployment of staff into positions where they do not have adequate technical background or knowledge
to manage migration and urbanisation. The rapid turnover within some municipalities has also resulted in
the loss of institutional knowledge that could provide important insights into municipal population dynamics.
Perhaps most critically, different departments or divisions within local government often disagree over the
validity of data or ongoing population dynamics. Often these disagreements are tied to broader concerns about
performance targets and evaluation. Consequently, even where relatively accurate data exist, they may be
selectively ignored by officials.
Consultation, Planning and Budgeting Processes
Participatory planning emerged in the post-apartheid dispensation as a way of realising democratic
transformation at the local level. It currently constitutes the basis for the preparation of Integrated Development
Plans (IDPs), five-year plans which flag the main directions for municipalities to attain the development goals
they have set for themselves. While laudable on many grounds, the emphasis on participatory planning has
created incentives for excluding the interests of migrants and discouraging officials from considering them
in forward planning. In some instances, these processes have created ‘backward-looking programming,’ a
situation in which planning represents the prior needs of the specific section of the current poor population that
has accessed consultation forums. Communities rarely push for plans that consider demographic trends but
instead ask that existing needs be met. Indeed, few communities ask that municipalities dedicate resources
to future, potential residents over their own acute sense of need. Given negative public attitudes towards
migrants, officials are unlikely to insist that resources be dedicated to unwanted future residents, especially
when they are equipped with only a limited knowledge of migration dynamics.
This bias against planning for migration issues is cemented by the de facto exclusion of migrants, both
domestic and international, from public planning consultations. In the areas visited for this study, outsiders
were generally not invited to participate in Community Policing Forums, Stakeholders’ Forums, Residents’
Associations, or meetings held by local ward councillors. While participation was not necessarily prohibited –
as anecdotal reports have claimed in some municipalities – the vast majority of government and community
respondents reported a glaring absence of foreigners and recent domestic migrants in such fora. That said
some positive steps have been taken to promote migrant participation. The City of Johannesburg, for instance,
9Executive Summary
has launched a number of initiatives to foster and encourage migrants’ participation in dialogue platforms
and other activities at the ward level. These include the Migrant Help Desk, created in April 2007, and the
Johannesburg Migrants’ Advisory Committee (JMAC), created in 2010. However, it is yet unclear how these
initiatives will incorporate migrants into local-level planning given the prevalence of community-level exclusion
mechanisms.
The pitfalls in planning that result from exclusion are perpetuated at the level of budgeting. While both
sending and receiving communities are influenced by the costs and benefits associated with migration,
population dynamics are rarely factored into the distribution of national resources by the National Treasury.
Budgeting processes perpetuate the shortfalls of planning in the following ways:
Backward-looking planning for the needs of permanent residents leads financial planners to generally (1)
overlook population and migration trends, despite the fact that future residents will ultimately demand
resources and interventions.
If significant efforts were made to ‘forward plan’, they would be largely unsupported by the current system (2)
of resource allocation to local government (Local Government Equitable Share – LGES).
The planning and budgeting modalities generally reflect a limited capacity to cater for the poor in general (3)
and, in particular, the most indigent sections of the population.
Intergovernmental Coordination on Planning and Service Delivery
Municipal authorities are often frustrated by the relationships between municipalities and other spheres of
government. At the heart of this discontent we find the issue of mandates and the purported monopolistic
tendencies of other spheres of government. Recent research by the Department of Cooperative Governance
and Traditional Affairs confirms that municipalities often feel – in many cases justifiably – that failures in
national and provincial government policies and processes undermine their credibility and effectiveness. It also
finds that the system of intergovernmental relations is not effective in coordinating planning across the three
spheres of government, or in strengthening accountability towards achieving critical and targeted development
outcomes.
These findings support two challenges that CoGTA has already identified. First, they highlight the problem
of ‘intergovernmental conflict and competition over powers and functions between provinces and their local
governments.’ Second, they confirm that ‘national targets for service delivery that apply uniformly irrespective
of the economic and institutional differences between municipalities simply set municipalities up to fail.’ This
report points in addition to a series of more specific frustrations and tensions regarding:
The absence of consultation of local government structures in national migration policy-making;•The lack of clarity on roles of the different levels of government (provincial and local in particular) across •various sectors;
A perception of exclusion from planning and budgeting processes;•Frustration with shifting priorities and goalposts (in terms of service provision to the poor in particular); •and
In the changing of policies and practices regarding immigrants and asylum seekers • (including relocating
offices, lifting work prohibitions, and formally enabling access to services) without consultation
with or forewarning to local authorities.
Although municipal authorities are often frustrated at not being consulted on issues related to the
populations they are responsible for, this study finds that municipalities were rarely proactive advocates for their
populations. Many blamed the hegemony of party structures for closing avenues for ‘upward’ communication.
Regardless of the reason, there appear to be few leadership initiatives in terms of lobbying for either an

10 Executive Summary
individual or a collective rethink of the LGES or other policy issues directly affecting municipalities’ ability to
address population dynamics.
Recommendations
Failure to manage migration is yielding undesired consequences for all residents of South Africa. However, when
properly managed, domestic migration can bring people closer to services, enrich the labour market, and open
important opportunities for reducing poverty and promoting social cohesion. Similarly, international migration
need not lead to conflict and tensions, but can help to provide much-needed skills and entrepreneurial energy,
at the same time boosting regional trade and integration, and helping to facilitate post-conflict reconstruction in
countries of origin. The following recommendations are intended to help achieve those ends.
Data Collection and Management
There is a need to rethink the data collection system and interface between municipalities, StatsSA and other
data collection agencies, to ensure that:
• The National Statistical Agency collects data which is disaggregated better at the local level. This should
include better coordination with municipalities and other data collection agencies.
• Data collection methods at municipal level are agreed upon, familiar, and considered to be legitimate,
useful and reliable by all stakeholders. A degree of standardisation at national and municipal level may be
required to allow comparability.
• Data builds up into longitudinal databases informing municipalities’ on trends over time to better predict
population changes, dependency ratios, and areas for social and infrastructure investment. This data is
then aggregated at multiple levels and incorporated into municipal, district, provincial and national planning
strategies.
• Those assigned to engage with migrants or plan in areas affected by population mobility should have
training on data management, use of the data, and various migration related issues.
Use of Data in Policy, Planning and Budgeting
Mainstream population (including migration) dynamics into IDPs (social cohesion, economic growth, safety •
and security), and cater for highly mobile populations wherever necessary.
Include spatial planning tools to facilitate the use of population data for policy and planning.•
Review budgeting processes including the Local Government Equitable Share Allocation to include forward-•
looking population dynamics. Ensure that Local Government Equitable Share allows for more regular
population re-assessments (including indigent population) and correct effects on revenue allocation.
Improved Coordination
Improve co-ordination of all relevant partners at national, provincial and local levels towards a more •
effective management of migration. These include all spheres of government, civil society, private sector,
research agencies, and academic institutions. Facilitate the institutionalisation of the local government
response to migration in order to improve communication and coordination between municipalities and
migrant communities. This would need to include the establishment of dedicated capacity to deal with
migration, such as a migrant desk in each municipality.
Establish closer relations with researchers and data analysts to assist in the rethinking of decision making •
and implementation mandates with regard to mobile populations. Such collaboration may take the form of
a migration ‘think tank’.

11Executive Summary
Migration Policy and Border Management
South Africa needs an immigration policy that promotes its goals of regional integration, counter-poverty, •
social justice and human rights. This means developing appropriate means for people to enter the country
legally and with appropriate documentation. Considering that South Africa, like all other migrant receiving
countries, cannot completely seal its borders, it must find ways to manage cross-border mobility in ways
that are humane and promote the legal migration of people who wish to cross.
If improved regulation of the labour market is required, the government should consider sanctions against •
employers who violate immigration and labour laws and more regularly inspection of workplaces to ensure
that the basic conditions of labour are being upheld.
Reforms in migration policy should be carried out in collaboration with municipalities. Municipalities •
should also find ways of formulating and articulating their interests with regard to immigration policy and
practice.
Continuous Research and Development
Support ongoing research to enhance the understanding and management of migration. The following additional
areas of research have been proposed
Migration and access to services in order to better understand how (if at all) long-term vulnerable groups •
move out of poverty.
Qualitative research to determine the relationships between mobility within or between cities and access •
to employment, labour and services;
Qualitative studies on the role played by corporate social responsibility programmes carried out by •
companies relying on migrant labour.

12

13
Chapter One: Introduction and Framing
Constitutionally empowered to be a leading force for development, municipal authorities have nevertheless
been wary of addressing population movements or acknowledging human mobility as a fundamental driver
of or response to development. This reluctance partially stems from a belief among many policy makers
(local and national), that immigration and migration are exclusively matters of national policy concern. Others
have unrealistically hoped that heightened human mobility was merely a temporary outgrowth of the country’s
democratic transition. In many instances, authorities have feared that developing proactive, positive responses
to migration would only encourage more of it. For these and other reasons, budgeting and planning exercises
have been conducted with little reference to extended population projections or other insights into the
relationships among mobility, livelihoods, and community development. As the population continues to move,
the shortcomings of these planning exercises and interventions have become increasingly evident in terms of
limited access to critical services, physical and economic insecurity, marginalisation, and social conflict.
In 2009, the South African Local Government Association’s (SALGA) National Executive Committee
resolved to undertake a study dedicated to understanding the nature, magnitude and implications of migration
for municipal governance and planning. This resolution stemmed from a growing recognition that migration in
all its forms raises significant challenges and opportunities for local government. South Africa is a country on
the move, and as a result, mobility is something local authorities simply cannot ignore.
This report presents the findings of a research project titled ‘Governing Migration and Urbanisation in
South African Municipalities: Developing Approaches to Counter Poverty and Social Fragmentation.’ It was
conducted as a partnership between the South African Local Government Association (SALGA) and the African
Centre for Migration and Society (ACMS) at the University of the Witwatersrand, Johannesburg. The aim of the
study was to identify the role that municipalities can play in managing migration at local government level to
promote social cohesion and counter social exclusion and poverty.
Initial study findings were presented to the Portfolio Committee on Cooperative Governance and Traditional
Affairs (CoGTA) at the National Assembly in October 2009. The committee agreed that it had to do more to
highlight the challenges of migration and urbanisation and to ensure that they remain on the developmental
agenda. The consensus was that this would in turn ensure that the issues were addressed by all relevant
stakeholders.
Additional findings were presented at a SALGA National Members Assembly (NMA) in May 2010. The
assembly resolved that SALGA should facilitate partnerships to enhance data and information relating to
migration. A SALGA National Executive Committee (NEC) Policy Workshop held in August 2010 adopted
the study recommendations as a SALGA position that would be used to lobby and advocate on behalf of
municipalities at various targeted forums. It was also proposed that:
South Africa’s approach to the issue of migration needs to consider the local, national, regional and •
global context of migration (note that there is a discussion addressing the management of community
heterogeneity at the local level further on in this chapter) ;
A migration policy framework should be seen as a tool for strategic development, rather than being viewed •
as a negative issue that needs to be reversed.
Urbanisation is a global phenomenon with specific local effects. As such, it must be factored into policy •
and planning processes at all levels in order for it to be effectively managed. This includes managing the
interface and relationships between urban and rural municipalities.
14 Chapter One: Introduction and Framing
Population data should be used across a range of socio-economic and spatial planning exercises. These •
include, among others; Integrated Development Plans (IDPs), Spatial Development Frameworks (SDFs),
land-use management tools, and infrastructure plans.
An effective response to human mobility and poverty reduction requires the ongoing cooperation of all •
relevant partners, including, among others, civil society, faith-based institutions, the private sector, research
agencies and academic institutions.
Local government responses to migration must be supported by improved communication between •
municipalities and migrant communities (for example, municipalities may consider the establishment of
migrant desks or other inclusive means of engagement).
The country’s migration policies, including border management, should promote the documentation and •
safe movement off all migrants entering South Africa. This would enable municipalities to better account
for migrants, to plan, and to clarify their respective responsibilities. Similarly, public services, including
health, education, and housing, must reform their delivery models to better account for people moving
within the country.
Finally, the study findings were presented at the 15th International Metropolis Conference at The Hague,
Netherlands, in October 2010. Drawing together researchers from over 80 countries, the delegates explored
various means and mechanisms for accommodating diversity and mobility in cities around the world.
Approaching Migration
Overturning the restrictions of the past, South Africa’s approach to internal migration in the post-apartheid
period has guaranteed freedom of movement to all. Domestic migrants are allowed to access economies,
enjoy critical social and financial services, and live anywhere without fear of violence and abuse – although,
of course, such access is not always realised in practice. The country’s approach to international migration is
somewhat more ambiguous. Many international migrants are unable to enter, live, and work in South Africa.
While refugees and asylum seekers are able to claim a limited bouquet of rights, the vast majority of migrants,
almost 85% of whom are from the Southern African Development Community (SADC), are in the country
without valid immigration documents although a small number enter with work, business, and study permits.
The constitution protects many fundamental rights regardless of immigration status. These include rights to
due legal process, life-saving medical care, and basic labour protections. However more still needs to be done
to consolidate and build on these rights. In this light, a pro-active response to migration and human mobility
becomes increasingly significant.
As people move to various destinations within the country, they require services that will enable them to
lead a normal life. Roux (2009) argues that ‘the ability of refugees and asylum seekers to secure such social
and economic rights is particularly complex in countries like South Africa, that face challenges in providing
these rights to their own nationals.’ The same could be said for other categories of domestic and international
migrants. Indeed, both foreign and domestic migration has implications for the host community, and they
require different sets of interventions. The need for improved governance systems is particularly acute in the
country’s major urban centres, which are the focus of both domestic and international migration. As the sphere
of government directly responsible for urban management, local government is mandated to develop specific
interventions to address and manage the associated challenges.
The Local Management of Migration: Policy Frameworks and Effects
Municipalities in South Africa are constitutionally assigned a primary role of providing basic services to their
communities. Many local government competencies relate to services that are vital for day-to-day survival,
such as disaster response, water and sanitation, waste removal, and electricity and gas reticulation. Others
15Chapter One: Introduction and Framing
are crucial for social and economic productivity, including local amenities, parks and sports facilities, municipal
roads and public transport, street lighting, and the regulation of street trading. Municipalities are required to
use ‘integrated development planning’ as a tool to plan future development in their areas.
Local government has a critical role in shaping the developmental impacts of mobility. However, many of the
social and economic challenges associated with human movement are not explicitly within local government’s
constitutional mandate. The primary needs of migrants – such as access to shelter, health care, education, and
economic opportunities; safety and security, including proper treatment in detention; and administrative justice
– are largely the responsibility of national or provincial governments. That said, a local municipality does, under
Section 153(a) of the Constitution, have a responsibility to ‘structure and manage its administration, budgeting
and planning processes to give priority to the basic needs of their communities and to promote the social and
economic development of the community.’
Section 152(1) also outlines local authorities’ ‘developmental duty’ to promote ‘social and economic
development’ and ‘a safe and healthy environment’, as well as fulfilling other responsibilities that clearly suggest
some responsibility regarding human mobility. This comes through more clearly in the 1998 White Paper on
Local Government, which argues that the challenge for local government is not ‘how to run a set of services’,
but how to ‘transform and manage settlements’ that are amongst the most distorted, complex and dynamic in
the world. The White Paper proposes that this bigger challenge can only be grasped if municipalities think of
themselves as ‘developmental local government.’ In this regard, municipal authorities certainly have a role –
albeit ill-defined – in addressing human mobility.
Migration poses a number of challenges and opportunities to municipalities in fulfilling their mandates.
There is, however, limited guidance on how to address these in a progressive and mutually beneficial way.
Most local authorities have thus far not developed empirically informed and proactive policy responses to
domestic and foreign migration. Many officials continue to react to foreign and domestic migrants by implicitly
denying their presence, excluding them from developmental plans, or tacitly condoning discrimination that
exists throughout the government bureaucracy and police. In many cases, migrants continue to be seen
primarily as a drain on public resources, rather than as citizens of the community that local government must
serve – or indeed potential resources. Even for those who yearn for more proactive means of absorbing new,
poor and vulnerable populations, there are considerable challenges in determining how to proceed. This report
is intended to assist local government and its key partners in this regard, providing a step towards a better
understanding and improved management of migration.
Profiling Migration in South African Municipalities
To plan, drive and monitor progress towards the integrated equitable development envisaged by government,
municipalities require readily available, accurate and up-to-date demographic data. One of the most fundamental
challenges to local government is how little municipalities know about the people living in their communities.
While national government is responsible for developing national strategic plans and general policy frameworks,
local government is responsible for more focused and context-specific interventions. Due to poor data,
municipalities are often unable to draw on a nuanced and dynamic understanding of their constituencies. This
is generally true regarding the urban poor, and all the more so with regard to geographically mobile people.
Efforts to map ‘poverty pockets’ (Cross, et al, 2005) and review both foreign and domestic migration data
(Dorrington 2005; Bekker 2002; Kok and Collinson 2006; SACN 2006; Landau and Gindrey 2008), represent
some of the concerted efforts to understand South Africa’s urban population dynamics. However, many of
these studies are based on admittedly incomplete census data. This data is particularly inaccurate regarding
foreign-born populations and is often purely descriptive. Nevertheless, these data are the best available and
must serve as the basis for local and national planning.

16
While the Department of Cooperative Governance and Traditional Affairs (COGTA) recognises that there
is a need to improve cross-border and multi-nodal planning – including a greater consideration of population
mobility, planners are effectively unable to understand the functional economic geography of the city and its
region, and how the different components relate to each other. In this context, local planners continue to be
influenced by stereotypes and misreading of data. These often include the perception that increased population
necessarily translates into competition for existing resources.
The inability to effectively understand and predict urban populations poses significant risks to local
governments’ ability to meet their obligations and developmental objectives. Perhaps most obviously, the
invisibility of large segments of the population, including domestic and international migrants, can result
in much greater demand for services than predicted, reducing service quality and outstripping budgetary
allocations. In many instances, there are hidden costs to public and private infrastructure, water, and other
services that are not accessed individually. The degradation of building stock due to high population densities
– which is a consequence of new migrants minimising costs while maximising centrality also has long-term
cost implications for cities that collect taxes on the basis of building values. In addition, health and safety are
severely compromised in areas where densification is inadequately managed.
As many of South Africa’s internal migrants are young – and therefore likely to remain relatively healthy,
independent and productive – a growing population does not inevitably result in skyrocketing costs to the local
government in an urban receiving community. However, sending communities may lose the benefits of young
people’s labour, while having to bear the costs of educating the children they leave behind, as well as providing
for returning migrants when they become too old or ill to work.
To provide an empirical basis for addressing the real and imagined challenges of human mobility, this
report documents migration into and out of South Africa’s municipalities. Movements at this level are far more
frequent than at the national or provincial levels and directly influence the work of local authorities. Although this
report does include specific discussions of international migration, movement within and between provinces
is numerically more important and raises more fundamental challenges to municipal governance throughout
South Africa.
Urbanisation has become a major challenge over the last century. In the 1950s, 30% of the world population
lived in urban areas. By 2005, this proportion had grown to 49%. As of 2008, more than half of the world’s
population lived in urban areas. By the middle of the current century, most regions of the developing world will
be predominantly urban. This growth, which includes both natural growth and migration, suggests that there
are five million new urban residents every month. Poor cities are growing much faster than rich cities. The
annual rate of urban population change reached 3.4% per year in the less developed regions during the period
1975-2005 – as compared to 0.8% in the more developed regions. In future, the growth rate will continue to be
particularly rapid in the urban areas of the less developed regions, averaging 2.2% per year during the period
2005-2030. In contrast, the urban population in the more developed countries is projected to grow at an annual
rate of only 0.5%.
After the South Africa’s first democratic elections in 1994, the country’s previously ‘forbidden cities’ became
primary destinations for migrants from around the country, across the continent, and beyond. Population
movements – some predictable, some spontaneous; some voluntary, some forced – are now perennial, if not
always welcome, features of South African Cities (SACN 2004:36; Balbo and Marconi 2005; Bekker 2002;
Dorrington 2005). Domestic migration in South Africa has been structured by a history of displacement as well
as more voluntary forms of mobility. The forced removals of people from certain areas, and the establishment
Chapter One: Introduction and Framing

17
of townships such as Soweto in the 1950s and Soshanguve in the 1970s, has structured both the population’s
distribution and many of the migration patterns we see today. To some extent, the growth of informal settlements
and cities is the result of a ‘correction’ in which people moved where they would already have been were it
not for apartheid-era segregation. However, we must recognise that some of the most dominant patterns of
mobility are rural to rural, and movements into small towns. StatsSA maintains that population migration within
South Africa has been reasonably constant at around 12% of the population for each five-year period it has
investigated, namely 1975-1980, 1992-1996, and 1996-2001. We are also likely to see continued movement
(though not necessarily permanent settlement) as people continue to maintain translocal livelihoods or continue
moving in search of opportunities. To make sense of mobility, we need to view its dynamics and impacts at the
national, sub-provincial and household level (StatsSA, 2006).
International and internal Migration
The 2001 census led to initial estimates of around 330,000 foreign nationals living in South Africa. This figure
was later revised up to close to a million after correcting for sampling errors. Despite this increase, the total is
still far below what many presume. Projections from this data (taking into account the increased arrivals from
Zimbabwe in recent years) suggest that the number of foreign nationals is now between 1, 5 and 3, 5 million
(StatsSA, 2007). Of foreign migrants residing in the country, 46, 8% live in Gauteng, followed by 13, 4% in
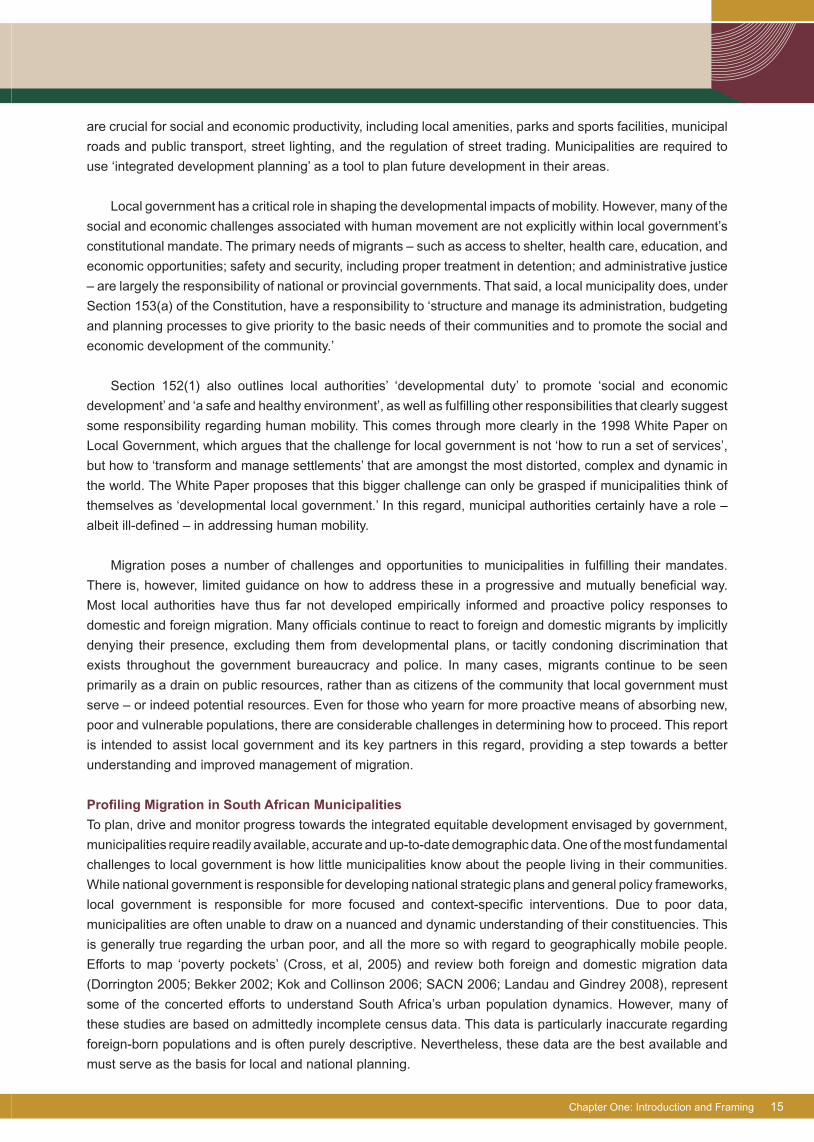
the Western Cape (StatsSA, 2007). Figure 1 illustrates the distribution of recent international migration across
South Africa.
© Skhulu, 2010. Domestic Migrant from Kwazulu Natal settled and trading in Johannesburg
Chapter One: Introduction and Framing
18
Figure 1: Distribution of Recent International Migrants1
Although the numbers of foreign migrants are relatively small (around 3% of the country’s population),
their experiences and activities in South Africa can have a significant impact on the country’s development
trajectory and efforts to counter poverty. On the positive side, they bring much-needed skills (for instance, to
the education, health, and engineering sectors, in addition to entrepreneurial activities). They also provide
a level of flexibility to the labour market. Although there is little evidence of systematic wage suppression or
job replacement, there are indications that international migrants do compete directly with South Africans for
positions in certain sites at particular times (see Misago 2009). The perception of widespread job competition,
together with the erroneous belief that foreigners drain fiscal resources, has contributed to tensions between
citizens and non-nationals, when in fact only an insignificant number of non-nationals are able to access state-
supported grants or social services. The xenophobic attacks that erupted in May 2008 are an extreme example
of migration-related tensions and resultant conflict (See Misago, et al, 2008).
Information about movements into and out of South African municipalities is critical in order to begin
addressing a number of planning and governance challenges presented by migration. The table below
demonstrates movement between provinces. Unfortunately there is not enough data disaggregated to a
municipal level. However, the existing data on proportions of population growth and internal migration per
district municipality are provided further on in this section.
1 This map reflects the most recent national data (2001). While the 2007 community survey provides general trends, the sample is too small to provide a detailed spatial analysis.
Chapter One: Introduction and Framing
19
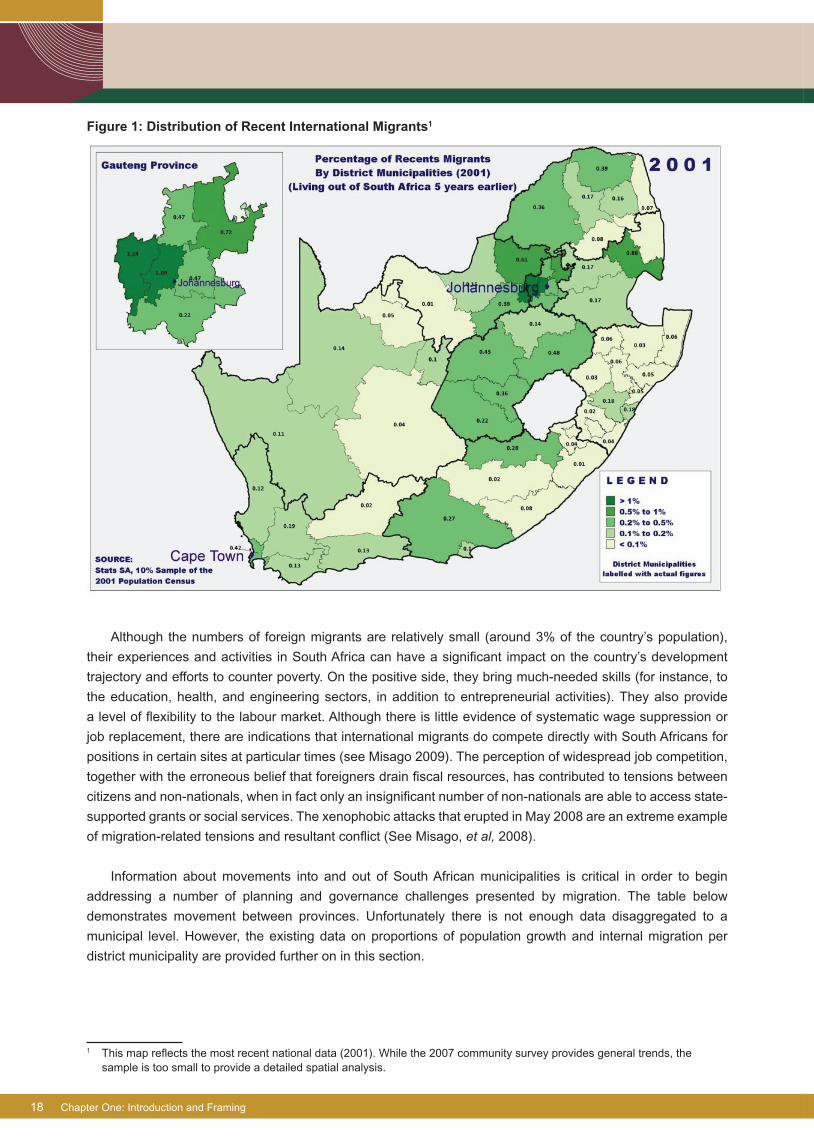
Table 1: Percentage Distribution of Non-migrants and Migrants Based on Place of Birth
Province
% of residents
population born
in the province
% of residents in-
migrants (resident
population not born
in the province)
% of out-migrants
(population born in the
province but residing
elsewhere)
Eastern Cape (EC) 93,4 6,6 23,0
Free State (FS) 85,6 14,4 21,5
Gauteng (GP) 58,1 41,9 15,3
KwaZulu-Natal (KZN) 93,5 6,5 9,4
Limpopo 93,6 6,4 22,9
Mpumalanga (MP) 76,3 23,7 20,0
Northern Cape (NC) 84,4 15,6 29,3
North West (NW) 76,9 23,1 16,6
Western Cape (WC) 71,7 28,3 8,1
Source: Stats SA, Community Survey 2007
Table 2: Matrix of Origin of Migrants between Provinces 2001-2007
Destination ProvincePercent from Province of Origin
All RegionsWC EC NC FS KZN NW GP MP LP
Western Cape (WC) 0 54 5 3 7 1 25 2 3 100 (N=197,212)
Eastern Cape (EC) 29 0 5 8 19 2 31 3 3 100 (N=85,392)
Northern Cape (NC) 20 6 0 10 3 43 17 1 1 100 (N=46,054)
Free State (FS) 6 18 10 0 8 14 34 4 4 100 (N=67,832)
KwaZulu-Natal (KZN) 6 45 2 4 0 3 29 8 3 100 (N=124,276)
Northwest (NW) 3 16 4 15 4 0 40 6 12 100 (N=152,933)
Gauteng (GP) 6 11 2 7 17 16 0 15 27 100 (N=609,169)
Mpumalanga (MP) 2 7 1 6 13 5 27 0 39 100 (N=128,903)
Limpopo (LP) 3 5 1 5 3 11 45 26 0 100 (N=71,269)
Source: StatsSA, Community Survey 2007
Chapter One: Introduction and Framing

20
The tables above show internal migrants based on province of birth and province of usual
residence. Proportionally, Gauteng received the most migrants, followed by the Western Cape. The
provinces that received the lowest proportions of migrants were the Eastern Cape, KwaZulu-Natal
and Limpopo, where between 6% and 7% of the resident population were born in other provinces.
Northern Cape has the highest percentage of out-migrants (29.3%). StatsSA provides no indication
of migrants’ destinations within the provinces as it only considers migration when it crosses provincial
boundaries. This poses a challenge to municipalities, which are required to host and plan for migrant
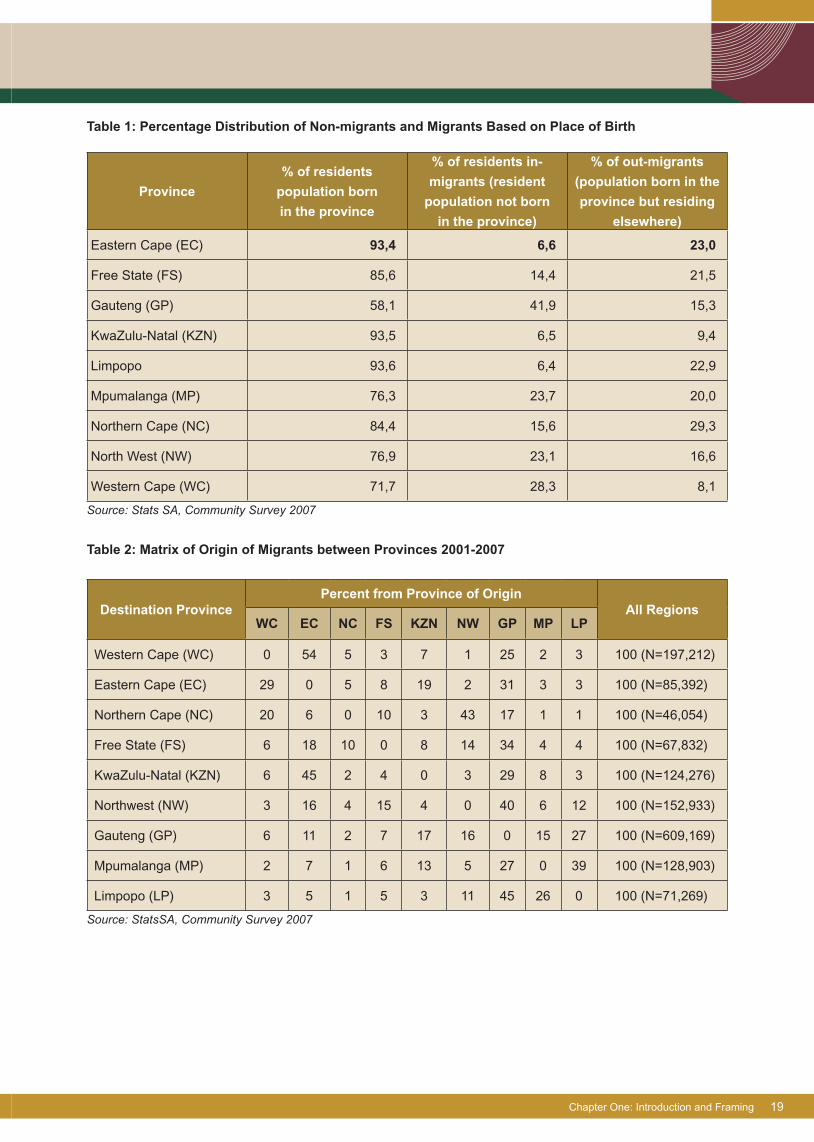
communities. The figures below reflect these migration patterns in visual terms.
The main source of information for the analyses in figure 2 (above) and figure 3 (on the next page) is the
Community Survey conducted in 2007 by Statistics South Africa (StatsSA). Conducted in lieu of a national
census, it contains a representative sample (N=1,047,652) of South Africa’s population. Once weighted
according to StatsSA’s recommendations, a relatively precise analysis of the migration patterns across the
country’s municipalities is made. To heighten accuracy, municipalities where less than 2,000 persons were
interviewed in the Community Survey are excluded. This means that 66 of the country’s less populated
municipalities, and 22 management areas, are not considered. Nonetheless, the data do provide a good
degree of confidence about the municipalities included here.
Figure 2: Percentage of Internal Migrants by District Municipalities
Source: StatsSA 10% sample of 2001 census.
Chapter One: Introduction and Framing
21
Figure 3: Migration Patterns and Urban Growth 2001 - 2006
Source: CSIR from Stats SA projections
At the sub-provincial level, small towns have emerged as key development nodes. Women,
in particular, are on the move, taking families out of the rural villages to small nearby towns. The
pattern of movement of villagers to small towns differs from migration between the rural village and
metropolitan areas. Migration to small towns appears to be more permanent, whereas, at least in
some cases, migration to metropolitan areas is more temporary, with people moving from rural to
urban, and back to rural. Household-level analysis highlights the prevalence of temporary migration
as an individual and household strategy linking rural areas with larger settlements. The Agincourt
study shows remarkably high levels of temporary migration among rural men, with the trend among
rural women rising. Migrants stay in touch with their rural households, usually remitting money or
goods, and are likely to return to rural areas on retirement or retrenchment.
Some officials within local government have seen increasing migration and diversity as a hugely
positive sign of South African cities’ emergence as trading and cultural centres. In response, city
planners in both Johannesburg and Cape Town have begun outlining strategies for recruiting and
incorporating highly skilled migrants and refugees into the city’s socio-economic networks.2 However,
it is also evident that many of the cities’ leaders and citizens feel overwhelmed by migration, both
international and domestic. In other places, the out-migration of the cities’ skilled and affluent is raising
2 In 2005, Cape Town conducted a skills audit of its refugee population so as to better develop policies to capitalise on their presence in the city. Johannesburg has yet to follow suit but has recently officially recognised the potential contributions migrants make to the city.
Chapter One: Introduction and Framing

22
the spectre of economic decline and an ever-expanding underclass (SACN 2006). Many people working within
government believe that migration is linked to the expansion of drug syndicates, prostitution, human trafficking,
and crime more generally. Migration is also imagined to result in rising unemployment and a range of other
social and economic ills. Apart from a few exceptional cases, elected officials sense that urbanisation and
international migration raise the spectre of economic and political fragmentation and urban degeneration (see
Beal, et al, 2003). Some municipalities have taken steps to address these concerns. These are valiant efforts
but often are inadequate, or premised on an incomplete understanding of the problems they seek to address.
Research Methodology
Developing a sound response to human mobility in South African municipalities not only requires an
understanding of migration dynamics, but also a review of current approaches to address them. To that end,
this project conducted intensive, primary research in a sample of four South African municipalities: Nelson
Mandela Bay, Mossel Bay, Tshwane, and Merafong. At each site, a four-person research team conducted
individual and focus group interviews with municipal officials, law enforcement officials, community leaders,
representatives of political parties and labour unions, and representatives of the business sector, NGOs and
community organisations. The primary fieldwork was conducted between March and June 2010. The brevity of
the research period meant that the team spent approximately two weeks in each municipality. Given the limited
time and the focus of this initiative, the emphasis during this period was placed on attitudes and accounts of
practice rather than deep observation of institutional culture, population dynamics, or political configurations. The
current report draws on the original fieldwork, coupled with the findings of long-term research in Johannesburg
and Cape Town, and a review of previously published materials.
Selecting Municipalities for Research
Selection of the four municipalities sampled for primary research was based on a range of indicators. These
indicators are laid out below. We subsequently explain how pairs of municipalities were selected according to
their relation to the indicators.
Percentage of recent migrants
A locality’s population changes due to births, deaths and migration (inward and outward). Spatial changes may
also occur due to movements within a given municipality. Tracking these variables is necessary to understand
the dynamics and ultimately to project the population of a municipality. However, existing data only allows
for a limited understanding of these patterns, making migration at the municipal level particularly difficult
to measure. A few countries, particularly those in Northern Europe, try to maintain population registers to
map their populations’ distribution and mobility. Although providing some useful data, these registers remain
relatively inaccurate; as inhabitants have little incentive to register and do not regularly declare their moves.
In South Africa, the only option is to infer from the 2001 census and the 2007 community survey by StatsSA.
Respondents’ municipality of prior residence was collected but ultimately not encoded by StatsSA. Therefore, it
is impossible to trace municipalities of origin and ascertain whether migrants within a single province relocated
between municipalities or within a single municipality. This gap in the data is likely to be particularly pronounced
where a single primary city tends to attract considerable migration from within the Province (such as Nelspruit
in Mpumalanga, or Durban in KwaZulu-Natal). It is also worth noting that people who have emigrated (i.e. left
the country) are totally omitted by the national surveys and effectively disappear from data on the South African
citizenry. Due to these and other limitations, when measuring the percentage of recent migrants for selection
purposes, we could consider only the percentage of internal or international migrants who were living outside
of their current province or the country five years before the StatsSA research was conducted.
Chapter One: Introduction and Framing
23
Human Development
Building on the United Nations Development Programme’s (UNDP’s) Human Development Index (HDI), we
developed an index combining information on health, education, and income. More specifically, this indicator
included:
Life expectancy at the municipal level was estimated with an arithmetic average of the life expectancy in •
each municipality. Although life expectancy dropped by 10 years on average between 1996 and 2007, the
selection is premised on the assumption that the differentials between the municipalities remain unchanged
on the period.
In the UNDP’s definition, the educational attainment index is based on information on adult literacy and •
the enrolment ratio. As there is no information on adult literacy at the municipal level, the education index
is based on the information on enrolment figures included in the 2007 Community Survey. For each
municipality, the number of students enrolled in primary, secondary and tertiary levels of education were
divided, regardless of age, by the number of persons of theoretical school age for the three levels (ages
between 6 and 24).
The standard of living income is measured in the UNDP index by GDP per capita. At the municipal level, •
the sum of all the income declared by the inhabitants in the 2007 Community Survey, divided by the
population of the municipality, was used as an approximation of the GDP per capita. (Note, though, that
the municipality where the value was created can be different from the municipality where the recipient of
the income lives).
To get an index comprised between 0 and 1, each component of the index, and the index itself, is calculated
using the following formula:
Index = (actual value – minimum value) / (maximum value – minimum value)
Equal weights are allocated to the three components. The final index is an arithmetic average of the three
components turned into an index. Although these are imperfect indicators, they are applied consistently across
the municipalities. As such, they provide a strong tool for ranking the human development levels.
Chapter One: Introduction and Framing
24
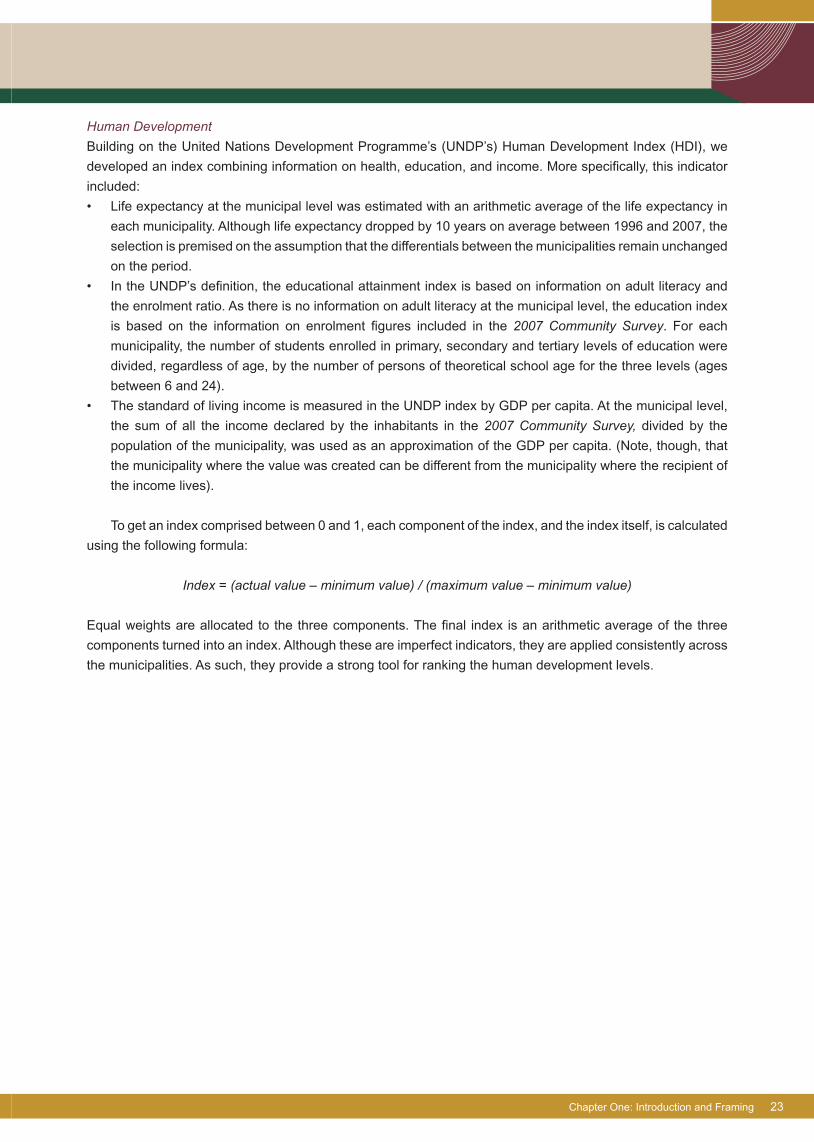
Figure 4: South African Municipalities by Level of Human Development Index
Source: Census 2001; Household survey 2007. Processed by V. Gindrey for ACMS, 2010
The final index was an arithmetic average of the three components, equally weighted, and turned into an index.
Although these are imperfect indicators, they are applied consistently across the municipalities. As such, they
provide a strong tool for ranking the human development levels.
Recent migrants’ relative productivity
To analyse the interaction between migrants and host communities, the median income generated by recent
migrants3 is compared with the median income generated by locals. The calculations are based on the whole
migrant or non-migrant4 populations generating or not generating an income. Local or migrant children are
included in the calculation as they rely on the local or migrant population.
Occurrence of xenophobic violence in and around May 2008
The occurrence of xenophobic violence is based on the Forced Migration Studies Programme’s review of
information collected from media reports and other reporting mechanisms.5 Ideally, this database should be
expanded to include other incidents of violence that may have an outsider/insider dynamic.
3 Internal or international migrants who were living outside of the province in 2001.4 The non-migrant population includes persons who were living in the same province in 2001, even if they moved from another
municipality. 5 Forced Migration Studies Programme Database on Xenophobic Attacks in South Africa, 2006-2009. Ed. Tamlyn Monson. Ver 2: 20
December 2009.
Chapter One: Introduction and Framing
25
The Sampled Municipalities
Two pairs of municipalities were chosen according to the four criteria defined above. The first pair comprising
of Tshwane and Nelson Mandela Bay comprised municipalities with high and very similar proportions of recent
migrants, and different HDI scores (see Figure 4). This selection was made with the aim of exploring the ways
in which municipalities accommodate similar new populations according to their respective capacities and
socio-economic environment. The focus here is on municipalities with a high migration rate, as they have a
higher imperative to plan their growth – to project needs for housing, infrastructure, and service delivery for
example. These needs are immediate when migration occurs, unlike the case of municipalities where growth
is mainly natural, and where population needs are predictable and develop over time. More than 8% of the
population of each of this first pair of municipalities is composed of recent migrants who were living in another
province or country five years earlier.
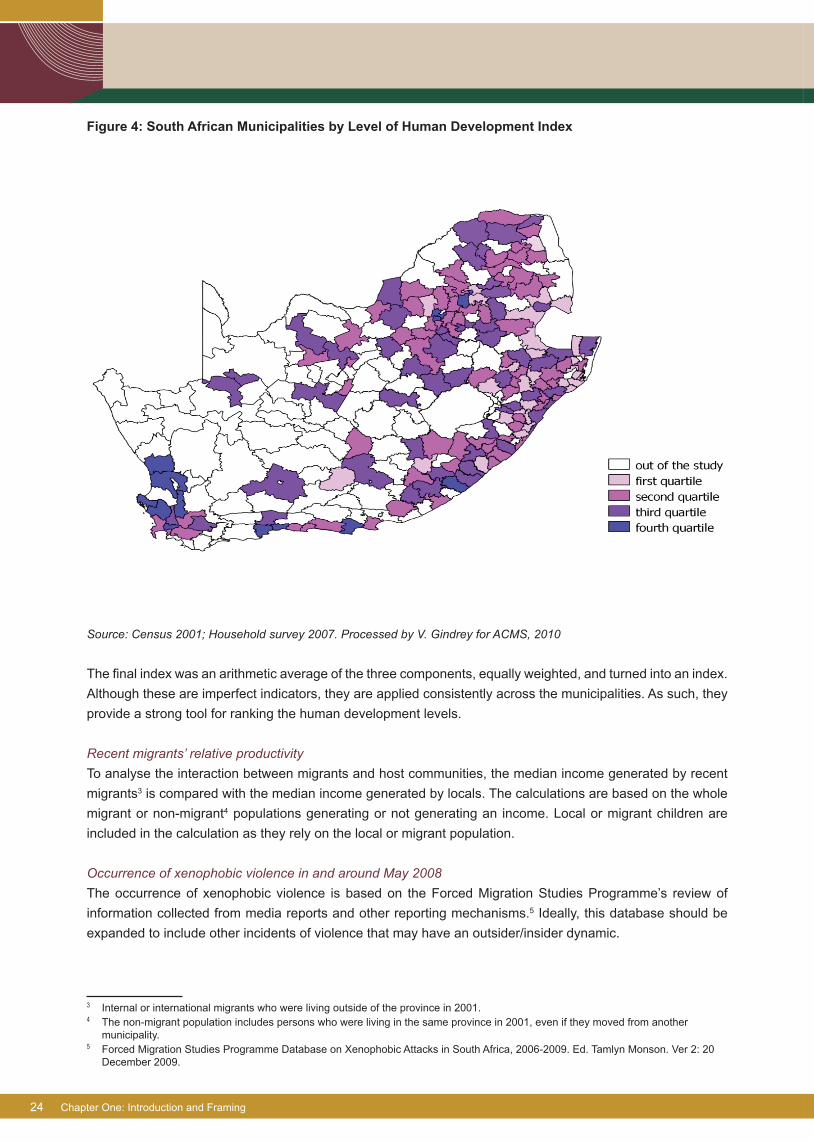
Figure 5: South African Municipalities by Percentage of Recent Migrants and Human Development
Index score
Source: Census 2001; Household survey 2007. Processed by V. Gindrey for ACMS, 2010
The second pair, consisting of Mossel Bay and Merafong, includes two municipalities where recent migrants
are the most or least successful according to the recent migrants’ relative productivity defined above. This
index does not speak to the cause of the success, but nonetheless captures something important about the
migration experience. If one presumes that in many cases migration is part of an economic improvement
strategy this is an important indicator of the degree to which new arrivals are integrated into local economies
and service provision networks6. The municipalities are presented in Figure 5 according to their percentage
6 While most migration theories suggest that economic motivations are the primary driver of movement, it is worth noting that marriage is generally the reason most often cited for domestic migration.
Chapter One: Introduction and Framing
26
of recent migrants and the communities’ position on the human development index. In addition to these two
pairs, the authors draw on prior and secondary work on Cape Town and Johannesburg. The different context
of the attacks should be striking enough to put into light the different dynamics at work behind it. Following this
process, Tshwane and Nelson Mandela municipality were selected.
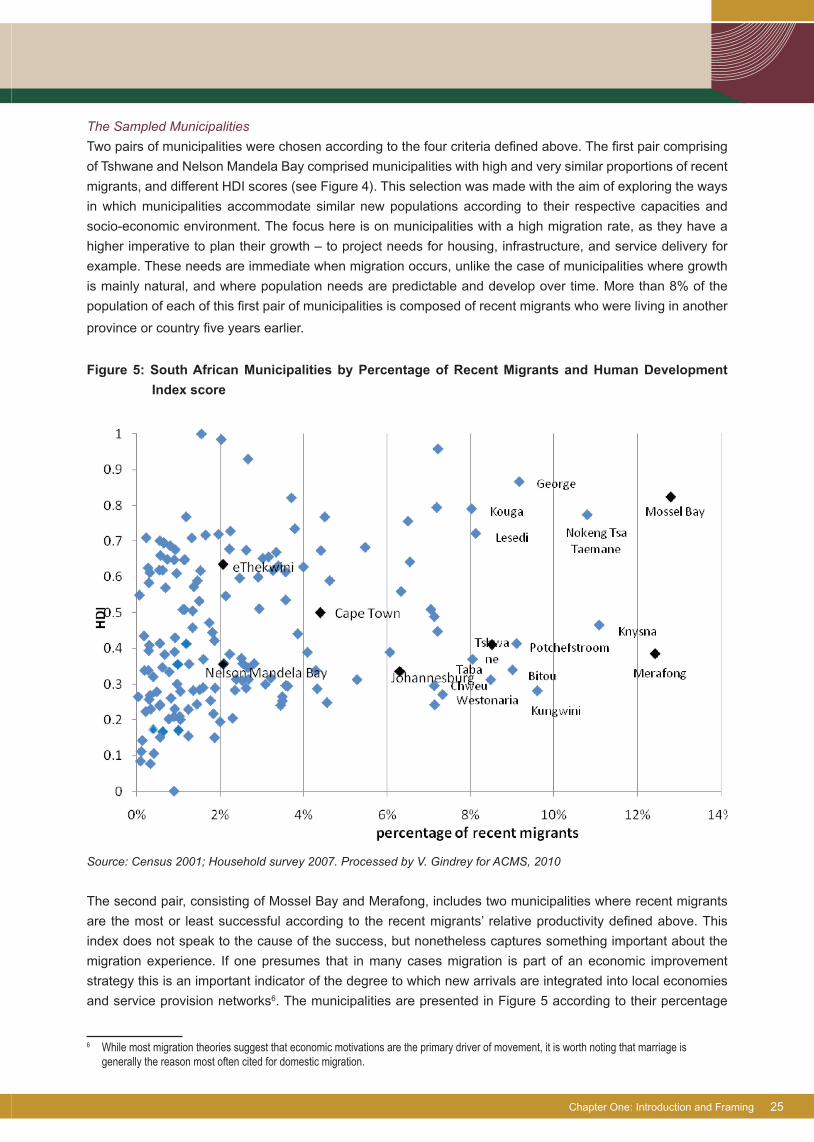
Figure 6: South African Municipalities by Level of Recent Migrants’ Relative Productivity and
Municipalities affected by Xenophobic Violence in May 2008
Source: Census 2001; Household survey 2007. Processed by V. Gindrey for ACMS, 2010
Chapter One: Introduction and Framing
27
Chapter Two: Population Data – Collection and Use
As noted in the introduction, one of the most fundamental challenges to local governments is how little they
know about the populations they are responsible for governing. Local governments are responsible for
focused and context-specific interventions, yet in only very few instances were officials from municipalities
included in this study able to draw on a nuanced and dynamic understanding of their constituencies. This is
not limited to the municipalities studied. Nor is it limited to issues of migration; it extends to local government’s
understanding of the urban poor more generally.
As highlighted earlier, planners recognise the need for improved planning, but due to limited understanding
of the nature and dynamics of the functional economic geography of their municipalities and regions (SACN
2006: Section 2-7), are often influenced by stereotypes or misinterpretations of the data that is available. This
study systematically explored how municipal officials deal with population data collection, and how they use it
in planning, and manage it over time. The findings highlight three central challenges:
There is a tension between the widespread belief that additional population data is needed, and the •
incomplete, inconsistent and irregular use of what data is in fact available, sometimes due to the varied
degree of legitimacy that data is assigned by different departments.
Efforts to improve the capacity to collect, manage, and employ population data are significantly hindered •
by losses of knowledge due to staff turnover among leadership and administrators. In some instances, this
has resulted in the appointment of people to positions for which they do not have the adequate technical
background or knowledge. In others, it has resulted simply in the loss of institutional knowledge that could
have provided important insights into municipal population dynamics.
Municipal planners often have negative perceptions of population and mobility. In the case of domestic •
migration, these are often linked to various arguments around resource allocation and pressure on social
services. With regard to international migrants, such beliefs often extend to include questions of crime,
conflict, and moral degeneration.
More Population Data: But for What Use?
Sources and knowledge of existing data: a problematic interface between data stakeholders
Officials in all four case municipalities considered population data for planning, budgeting, and other
municipal function, but they rarely prioritised its collection or analysis. Moreover, despite the evident desire
for data, authorities widely acknowledged that it was remarkably scarce, incomplete, inaccurate, outdated,
de-contextualised, and difficult to understand. As it now stands, municipalities draw population information
and data from a wide range of sources including Statistics South Africa (StatsSA), independent demographic
studies commissioned through consultants, academic research institutions, the internet, and service accounts.
Municipalities generally do not have units or even staff members dedicated to collecting and managing
population data or making existing data available for the use of their departments. Rather, directorates or
departments use different sources of information, effectively operating in ‘information silos’ when programming
and planning.
Part of the challenge associated with data collection and management emerges from a degree of confusion
over who is mandated to collect and manage data. In one municipality, a senior official in the City Planning
Department claimed his colleagues were in charge of measuring the population. However, the head of the
Governance and Secretariat Unit in the same municipality denied the assertion and stated that the planning
unit ‘has nothing to do with population information’. Such confusion was typical, and it is often unclear who
should determine the statistical basis for assessments, evaluation and planning. Planning departments often

28 Chapter Two: Population Data - Collection and Use
act as a mere interface with StatsSA, but have no capacity to conduct such research themselves and limited
ability to assess or extrapolate from the information they receive. Despite a widespread recognition of the
value improved data collection, research, and analysis could serve for municipal planners, it remains unclear
who would make use of it, or how it would influence current planning within this context.
The current local and national structures for planning and budgeting mean that there are mixed incentives
for collecting and using data in municipal decision making. Currently, StatsSA is the most commonly used source
of data, largely because it is the only official data collection agency and the source used by decision makers
in other spheres of government. The role of StatsSA is particularly important when deciding how financial
support should be allocated to municipalities, particularly through Local Government Equitable Share (LGES).
While the data has great political and financial importance, municipalities recognise that the information they
employ is outdated, often inaccurate and generally misleading. This is one of the reasons why municipalities
often commission their own demographic studies. Three municipalities in the research sample commissioned
demographic studies at more or less the same time that Stats SA was conducting the nation-wide Community
Survey (i.e., 2007).7 Before then, municipalities had relied on data from the 2001 Census. After the 2006 Local
Government elections, with new administrations in place, many felt the need for some new, inter-census data
that could reflect changes over the previous five years. As the 2007 Household Survey results were only
expected to be available in 2008 at the earliest, they decided to commission work from consultants in the
preparation of Integrated Development Plans (IDPs). Changes in data provision and poor intergovernmental
communication also affected the way certain departments collect information and resulted in discontinuities. In
one of the case studies, an official from the National Department of Primary Health reported miscommunication
between this department, the Department of Home Affairs, and StatsSA, which prevented the adjustment of
growth rate calculations from death and birth registration – something that had previously been possible.
While all municipalities had some form of an estimate of the population, only one did its own population
data projections.8 In place of their own analysis, they either relied on updates provided by StatsSA or used
a range of different, and often ad hoc, methods to update their population statistics. For instance, one
municipality updates its population figures using the average national annual population growth; another used
its own calculated average household size. Methodologies are extremely varied and range from satellite /
aerial photographs to qualitative field studies. Although some of this may serve the respective municipalities
well, their disparity precludes any comparative analysis – a serious obstacle to the understanding of trends at
provincial, inter-provincial and inter-municipal levels. These various initiatives emerge from a lack of reliable
data and, in their diversity, produce a range of conflicting information of varying reliability and utility.
The need for micro-local data: Population information at ward level
Although municipalities continue to use StatsSA data, its applicability is limited by issues of scale. Some of these
concerns could be addressed through better engagement with StatsSA and other government departments,
local skills development to analyse existing data, and extrapolation of data from other sources. Municipalities
still need to ascertain spatially localised trends that are neither well captured by national aggregates nor
extractable by officials. One Executive Director for Economic Development expressed his frustration by arguing
that:
StatsSA collects data at ward level, but presents at provincial level, which makes its usage for planning difficult.
We would need to spend a lot of money to get consultants to do additional analyses, to break it down to metro
level.
7 Tshwane, Merafong, Nelson Mandela Metro8 Note that the Nelson Mandela Bay projections are highly contested even internally by municipal departments.
29Chapter Two: Population Data - Collection and Use
Although StatsSA does provide census data, for instance at ward level, upon request, there is a widespread
perception that such data are not available. Perhaps part of this stems from the lack of local level skills or ability
to specify which data would be most useful for planning purposes.
Apart from StatsSA, municipalities can potentially call on local-level data generated by Community
Development Workers (CDWs), who are part of a government programme created in 2004 and coordinated
by all three spheres of government (Department of Public Service and Administration (DPSA); Provincial
Departments Co-operative Governance and Traditional Affairs (CoGTA); and municipalities). Where there is
a good working relationship between the ward leadership and CDWs (for instance in some wards in Nelson
Mandela Bay and Merafong), ward officials obtain population information from ward profiles regularly compiled
by CDWs. Such data are not always available because, 1) not every ward has a CDW and, 2) CDWs (who
are deployed by and report to the provincial government) are not always willing to share their reports with
their respective ward leaderships. This unwillingness stems from an unclear relationship between provinces
and municipalities over the management of these CDWs, who some see as provincials agents ‘spying’ on
local leaders.9 This relationship seemed particularly tense in one of the smaller municipalities where CDWs
who were interviewed acknowledged that a redefinition of their mandate should be planned for after the next
local elections. Ward profiles are therefore very heterogeneous, and information is scarce. In addition, the
methodologies used for ward profiling are unclear.
9 Interview with CDWs in Merafong, 2 June 2010.
30
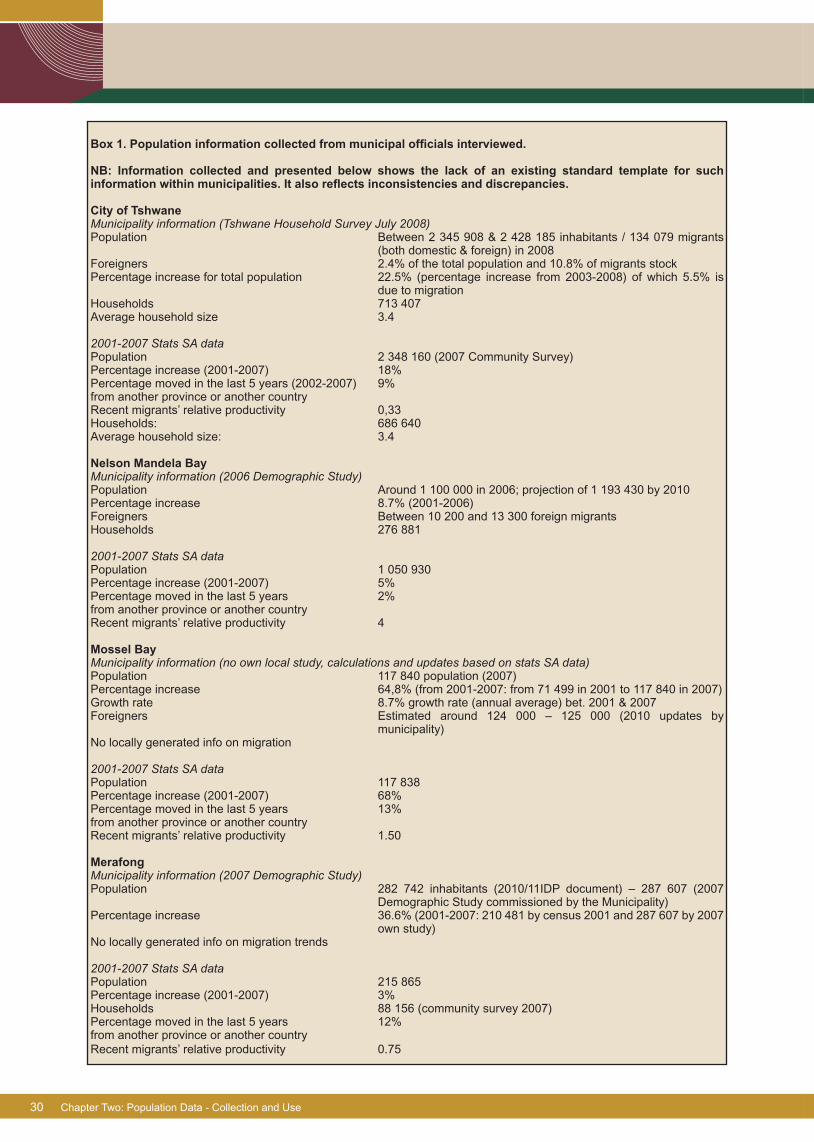
Box 1. Population information collected from municipal officials interviewed.
NB: Information collected and presented below shows the lack of an existing standard template for such information within municipalities. It also reflects inconsistencies and discrepancies.
City of TshwaneMunicipality information (Tshwane Household Survey July 2008)Population Between 2 345 908 & 2 428 185 inhabitants / 134 079 migrants
(both domestic & foreign) in 2008Foreigners 2.4% of the total population and 10.8% of migrants stockPercentage increase for total population 22.5% (percentage increase from 2003-2008) of which 5.5% is
due to migrationHouseholds 713 407 Average household size 3.4
2001-2007 Stats SA dataPopulation 2 348 160 (2007 Community Survey)Percentage increase (2001-2007) 18%Percentage moved in the last 5 years (2002-2007) 9%from another province or another countryRecent migrants’ relative productivity 0,33Households: 686 640Average household size: 3.4
Nelson Mandela BayMunicipality information (2006 Demographic Study)Population Around 1 100 000 in 2006; projection of 1 193 430 by 2010Percentage increase 8.7% (2001-2006)Foreigners Between 10 200 and 13 300 foreign migrantsHouseholds 276 881
2001-2007 Stats SA dataPopulation 1 050 930Percentage increase (2001-2007) 5%Percentage moved in the last 5 years 2%from another province or another countryRecent migrants’ relative productivity 4
Mossel BayMunicipality information (no own local study, calculations and updates based on stats SA data)Population 117 840 population (2007)Percentage increase 64,8% (from 2001-2007: from 71 499 in 2001 to 117 840 in 2007) Growth rate 8.7% growth rate (annual average) bet. 2001 & 2007Foreigners Estimated around 124 000 – 125 000 (2010 updates by
municipality)No locally generated info on migration
2001-2007 Stats SA dataPopulation 117 838Percentage increase (2001-2007) 68%Percentage moved in the last 5 years 13%from another province or another countryRecent migrants’ relative productivity 1.50
MerafongMunicipality information (2007 Demographic Study)Population 282 742 inhabitants (2010/11IDP document) – 287 607 (2007
Demographic Study commissioned by the Municipality)Percentage increase 36.6% (2001-2007: 210 481 by census 2001 and 287 607 by 2007
own study)No locally generated info on migration trends
2001-2007 Stats SA dataPopulation 215 865Percentage increase (2001-2007) 3%Households 88 156 (community survey 2007)Percentage moved in the last 5 years 12%from another province or another countryRecent migrants’ relative productivity 0.75
Chapter Two: Population Data - Collection and Use

31
Producing and Using Population Data: Multiplicity, Heterogeneity and Illegitimacy
In spite of the availability of a range of admittedly imperfect sources, many officials did not seem to be aware
that they could use them. Perhaps more fundamentally, even when data were available, many officials
felt they could not be used to improve governance or reduce poverty and vulnerability. Indeed, there
were widespread institutional blocks to the use of available data for planning purposes. One of the
municipalities conducted a demographic study in 2006, which includes population projections to 2020. Despite
the availability of relatively reliable data, the director of the Integrated Development Plan (IDP) nonetheless
stated that:
If you look at the previous edition of the IDP, one would wonder why we have the population of the metro
being constant, there are no changes at all. It is because we do not have information.
The municipality’s Chief Financial Officer also believed that no one had done population projections.
Either these senior officials were not aware of work their colleagues had done or they had simply ignored the
projections. Whatever the reason, the obvious consequence is that population projections were not considered
in planning and budgeting.
Elsewhere, officials were convinced that information on migration was entirely unavailable. An official from
the Research Unit (City Planning department) in the City of Tshwane even indicated:
There are no mechanisms to know migration in the city. And this is worrying because the natural national
population growth is decreasing. It is currently estimated at 1% in cities. So in cities, without migration
there is practically no population growth; but still cities do not have accurate information on population
movements.
Issues of trust and institutional incentives underlie the reluctance to use locally collected or non-StatsSA
data in planning processes. There is also a fair degree of defiance between departments with regard to data
produced internally. An Executive Director for Public Health stated:
The sources of data are different and there is no one hub where data is being collected and gathered so
that it can be a source for each and everyone. Primary Health goes out and does its own thing. Land does
its own thing. Primary Health sometimes does physical counting and gets figures for specific areas and
population groups. But there are always disagreements with other departments each saying ‘mine is more
accurate’. That’s why we need a single set of figures we can all use.
The Executive Director for Special Programmes in the same municipality agreed:
We need somebody to come up and work through these stats and tell us what we should believe. Otherwise
each department uses whatever they think makes better sense to them. But StatsSA is one source not
trusted by any department.
Even in the case of large studies commissioned by the Municipality, the lack of trust may be significant.
While the Director for Land Use Planning and Management (the home of the study) in one municipality believed
that information showing relative population stability was fairly accurate, other directorates and departments
believed that the Metro population was growing rapidly, particularly due to migration from rural Eastern Cape.
As one official in another municipality reflected, inconsistencies between sources often result in final decisions
being based on municipal officials’ perceptions:
Chapter Two: Population Data - Collection and Use

32
We remember in one year, StatsSA gave us figures. In the following year they did updates; they zoomed
into one area and they gave double the number of the population of that area in one year. We have been
asking how that can be possible. Where did people come from? But with other sources you could see, ok,
there is an increase of 2% but not double in one year. StatsSA, however, keeps saying their stuff is true.
There is a problem with these population figures because another organisation [he could not remember the
name] gave us figures and when we compared the two sets, it wasn’t really a true reflection of the situation
in Mossel Bay. So we were not sure what source to trust. What we do: we take StatsSA information and the
information from that organisation and then we compare and then we see who has the closest reflection
of what we think is happening.
The challenges of collecting, validating and using population statistics are by no means unique or even
specific to South Africa: public decision-making across the world often relies on political calculations and the
relevant stakeholders’ understanding of social reality as much as facts. Nonetheless, in the absence of reliable
and verifiable statistics, the possibility of enormous variation in the assumptions underpinning municipal
planning emerges from the impact of personal perspectives and politics. Across South African municipalities, it
appears that, at best, decisions and planning are being shaped by officials with a limited empirical knowledge of
the population which they serve. At worst, decisions are being made on superficial, impressionistic perceptions
or self-serving interests even when data are available.
The state of data collection at national level, and the lack of financial and human resources at local
government level, call for a rethinking of planning that better incorporates those uncertainties, acts on improving
data collection over the long-term and aims to train staff locally to enable informed projections and trend
monitoring.
Loss of Capacity and Expertise: The Population Research Units
Part of the challenge of creating and using reliable information is linked to loss of capacity and expertise. In
the larger metropolitan areas, this kind of capacity had once been available, but was no longer fully employed.
One official confirmed that:
The decision was made to discontinue most of the research unit programmes which resulted in years of
good work lost. It is difficult to make municipal leadership and top management to understand how critical
research is. The rare reports we compile, such as city profiles, get submitted to and approved by the Council,
but we have no idea how they are used for decision making and planning.
The Deputy Director for Metropolitan Planning in the City Planning, Development and Regional Services
Department of the same municipality confirmed that research capacity had drastically declined: the research
unit went from a peak of 41 researchers in the mid 1990s to only one demographer and one researcher. The
respondent believed that the decline was due to the fact that municipal authorities do not understand the value
of research. In some instances, the stigma associated with the population planning of the past has led to
scepticism over its potential positive, progressive contributions to poverty reduction and social cohesion.
Even where staff turnovers and limited technical expertise were not major problems, interdepartmental
coordination and planning for data collection was poor. This resulted in major disagreements between
departments on the reliability of data and on mandates over projection. In those municipalities with high levels
of staff turnover, or with people serving in ‘acting’ positions, the possibility of accumulating skills and knowledge
was particularly limited.
Chapter Two: Population Data - Collection and Use

33
Officials’ Perspectives on Domestic and International Migration
Despite the absence of strong and widely accepted data, almost all municipalities included in this study
recognise that they attracted significant numbers of domestic and foreign migrants. Only in one municipality
was there disagreement about the importance of migration. Such consensus did not extend to how these flows
influenced urban development or poverty. Instead, views included a diverse range of perspectives: a sense
that the city should do everything it could to limit migration/transience and promote permanent settlement;
fears about the impact of migration for planning and meeting performance targets; concerns over security and
the lack of reliable information and mechanisms to collect records of settlement within municipal boundaries;
and a sense that however much migration might affect municipalities, it was fundamentally an issue for the
Department of Home Affairs or other national bodies to handle. Others explicitly pointed to a (presumed) link
between migration and crime (see the discussion of Security later in this report) while some were concerned
about international migration and unfair trade competition. Each of these perceptions is explored below.
Migration: Not a local government mandate
There was clearly a general sense that migration management was not a local government mandate but that
local government was charged with addressing the results of migration control policies and practices. Although
some felt that local government should be considered more in migration policies, there was an undertone of
reluctance to tread on turf belonging to other spheres of government. A metro official from the Chief Whip’s
Office stated:
At the municipal level, migration is considered a national issue and is not regularly discussed. One or
two departments that feel the impact would raise the issue in meetings or address their concerns to their
respective departments at provincial and national levels.
In a similar vein, the MMC for Sports and Recreation responded that local government does not discuss,
‘the issue of migration per se but the challenges it causes for service delivery. The Department of Home Affairs
is the custodian of the issue of migration.’ Tension between national and local levels was sometimes reported
but there was no clear desire to participate more actively in migration policy-making. One official even blatantly
dismissed the legitimacy of any local government initiative in this area.
While there may be a realisation from certain executive mayors (for instance in Johannesburg) and from
within SALGA10 that a local government perspective is crucial in future migration policy developments, this was
not echoed in most municipalities. It is therefore likely that only proactive municipalities would support such
views and that most would be rather reluctant and perceive it as an additional burden among the wide range
of their responsibilities.
10 As expressed at the SALGA National Executive Committee Policy Workshop held in August 2010.
Chapter Two: Population Data - Collection and Use
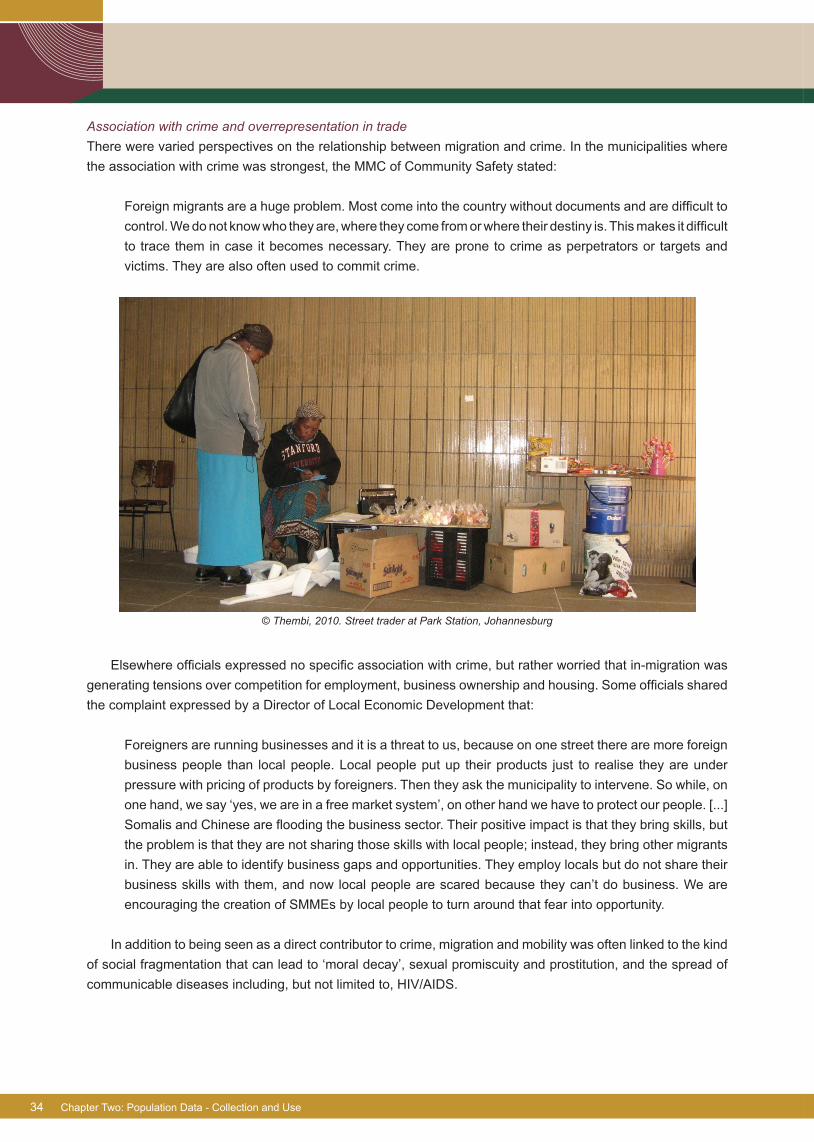
34
Association with crime and overrepresentation in trade
There were varied perspectives on the relationship between migration and crime. In the municipalities where
the association with crime was strongest, the MMC of Community Safety stated:
Foreign migrants are a huge problem. Most come into the country without documents and are difficult to
control. We do not know who they are, where they come from or where their destiny is. This makes it difficult
to trace them in case it becomes necessary. They are prone to crime as perpetrators or targets and
victims. They are also often used to commit crime.
© Thembi, 2010. Street trader at Park Station, Johannesburg
Elsewhere officials expressed no specific association with crime, but rather worried that in-migration was
generating tensions over competition for employment, business ownership and housing. Some officials shared
the complaint expressed by a Director of Local Economic Development that:
Foreigners are running businesses and it is a threat to us, because on one street there are more foreign
business people than local people. Local people put up their products just to realise they are under
pressure with pricing of products by foreigners. Then they ask the municipality to intervene. So while, on
one hand, we say ‘yes, we are in a free market system’, on other hand we have to protect our people. [...]
Somalis and Chinese are flooding the business sector. Their positive impact is that they bring skills, but
the problem is that they are not sharing those skills with local people; instead, they bring other migrants
in. They are able to identify business gaps and opportunities. They employ locals but do not share their
business skills with them, and now local people are scared because they can’t do business. We are
encouraging the creation of SMMEs by local people to turn around that fear into opportunity.
In addition to being seen as a direct contributor to crime, migration and mobility was often linked to the kind
of social fragmentation that can lead to ‘moral decay’, sexual promiscuity and prostitution, and the spread of
communicable diseases including, but not limited to, HIV/AIDS.
Chapter Two: Population Data - Collection and Use
35
The Impacts and Drivers of Mobility
Even where officials were cognizant of migration’s potential impacts on their municipalities, they often
had a limited understanding of mobility’s multiple forms and varied potential impacts. For many, migration
was conceived solely as a once-off move from one place (usually a rural area) to another (typically an urban
one). Understood this way, they quickly distinguish between the positive benefits of affluent pensioners and
the highly skilled, and the negative and costly effects of less affluent migrants. Here the issue was not only
the expanding need for services, but the unpredictability and pace of such movements. In the words of one
metro official, ‘Migration affects the quality of service delivery as the municipality is always caught unaware by
population movements. This creates permanent service delivery backlogs.’ Similarly, Members of the Mayoral
Committees (MMCs) for Housing and Social Development as well as Sports and Recreation complained that
they were unable to ‘cope with the influx of people’; giving the example of one township that had ‘grown so fast
that the municipality is finding it difficult to accommodate this ever-growing population’.
If there is one common refrain among municipal officials with regards to migration, it is the concern that it
will place an undue burden on municipal finances, and undermine their performance targets. There is also a
fear that providing for new arrivals will only beget further migration: ‘The more houses you build, the more the
influx,’ in the words of one executive director for Corporate Services. Others noted the challenges of providing
services for a relatively transient population.
Those who recognise that mobility can mean more than a single, permanent move have additional anxieties
over what such transience means for planning. One councillor captured some of these concerns as follows:
[…] Mobility is a challenge. People for instance register on housing waiting lists. When the house is
complete, the beneficiary is nowhere to be found; he or she has moved. To reallocate them, we have to
go through a lengthy process of deregistration. We cannot plan for this alone as a municipality because
service delivery to our people attracts other people. We hope the rural development will help them stay
there, work and stay there. But at the same time, we need to attract people with skills.
Beyond this, few officials had a clear idea of how they might address migrants’ livelihoods and service
requirements. Without a proactive perspective on what can be done to address human mobility, the
common refrain – ‘We can’t cope with the influx and mobility of people’ – threatens to become a self-
fulfilling prophecy.
Despite the ready and repeated concerns that migration would undermine efforts to counter poverty and
inequality, this study found no municipal initiative to systematically link mobility to urban economic indicators.
Consequently, few officials could speak about what forms of migration (e.g. domestic; foreign; permanent rural-
urban migration; seasonal migration; or ongoing movements within a given municipality) were having what
effects. Similarly, few could substantiate claims that service provision or economic fortunes encouraged or
discouraged movement. Some argued that the fortunes of PetroSA in Mossel Bay or the opening of new mine
activities in Merafong had caused large influxes of population, but none of these movements or their impacts
had been systematically documented. What was overwhelming clear was a preference for a stable, largely
non-mobile population that could be counted, planned for and assisted. The presumed links between mobility
and social fragmentation, crime, and disease – as discussed above – only reinforce this preference.
Chapter Two: Population Data - Collection and Use
36
Conclusion
The level of understanding of migration dynamics among municipal officials is limited by the absence of high-
quality data, ignorance about the data that do exist, a lack of skills in analysing what is actually available
and a range of negative stereotypes attached to transience and international migration. This is unsurprising
given how widespread anti-immigrant sentiment is across the South African population.11 While we have no
quantitative data about how widespread this sentiment exactly is among local government officials, empirical
evidence from interviews conducted in these four municipalities confirms the scope and depth of these
negative sentiments, at all levels of the local government structures, from mayoral offices to street-level
bureaucrats and ward councillors. Despite the fact that these sentiments are not grounded in reliable empirical
evidence (relating to the negative impact of internal and international migrants on existing systems), they may
nevertheless become self-fulfilling prophecies if not addressed. While these sentiments are clearly not shared
by all and are potentially reversible, they call for decisive and urgent action. Beyond this attitudinal issue,
there is clearly a need to base policy on an accurate and relatively unbiased understanding of population
dynamics (including poverty, mobility, and other dimensions). However, as long as popular sentiment remains
so firmly anti-immigrant and anti-migrant, there are strong incentives for municipal officials to avoid appearing
‘pro-migrant.’ This popular pressure combined with the multiple factors (administrative and capacity-related)
identified in this report acts as a strong hindrance for the most enlightened sections of South African local
government to explore policy reform.
This report makes a strong case for initiatives to improve migration planning to go beyond technical measures
related to the collection and analysis of better data. The report points to specific areas for intervention that
range precisely from better data collection and analysis mechanisms, to improvements within municipalities in
terms of population planning coordination, reforms of the resource allocation system and inter-governmental
coordination. As for perceptions expressed by local government officials, they are certainly key to promoting
the kind of constructive, innovative and forward-looking attitude to mobility management that is necessary to
capacitate this corps of municipal officials and modernise their collective data collection and planning skills.
This requires intervention of a different nature but that should be conducted in parallel with the other areas
identified previously.
11 For more information on anti-immigrant sentiment in South Africa and its development over the past decade, see Crush 2008.
Chapter Two: Population Data - Collection and Use
37
Chapter Three: Consultation, Planning and Budgeting
This section explains why – apart from the lack of data – planning processes have rarely included migration
or other population dynamics. It emphasises how the nature of South African planning and budgeting works
against forward-looking planning that considers population dynamics. It shows how migration is viewed in an
ambivalent way: both as a default strategy to channel people into certain areas and as an obstacle to planning
and budgeting, particularly for the poor. It concludes that the fora and incentives for intergovernmental planning
and budgeting are either absent or stifled by institutional configurations and poor communication.
Consultation
Participatory planning emerged in the post-apartheid dispensation as a way of realising democratic
transformation at the local level. In South Africa, this approach to planning was central to the transformation
policy and was highlighted as a principle in the 1994 Reconstruction and Development Programme, in which the
poor and marginalised were involved in the earliest phases of planning processes by directly expressing their
interests and needs. It was subsequently incorporated into the new legislative and policy framework on local
government through the White Paper on Local Government (1998), which recognised participatory governance
and inclusiveness as among the central objectives of municipal institutions. Later, it the approach was reflected
in the Municipal Systems Act (2000), which provides for accommodating the needs of ‘marginalised groups’. It
currently constitutes the basis for the preparation of Integrated Development Plans (IDPs), five-year plans which
flag the main directions for municipalities to attain the development goals they have set for themselves.
One of this study’s most important findings is that the emphasis on participatory planning has
unwittingly created incentives for excluding the interests of migrants, discouraging officials from
including them in forward planning. A number of shortcomings, particularly in terms of communities’ actual
technical empowerment, have been highlighted by others (see, for example, Bremner 1998: 118). Not only do
these shortcomings seem to fuel local power struggles and leadership tensions, but it has resulted in what
might be seen as ‘backward-looking programming’. People’s self-assessments of their public service needs
are rarely balanced by objective empirical evidence, both for the reasons stated in the previous section, and
due to lack of technical knowledge. The needs expressed through consultation are then filtered to select those
that meet political imperatives and capacities. What is ultimately reflected in IDP documents consequently
represents the needs of only those sections of the poor population that accessed consultation forums at one
specific moment in time. In addition, this limited array of needs is articulated in terms of the political interests and
priorities of office bearers. Moreover, communities rarely have the capacity to project demographic trends, and
are unlikely to ask municipalities to dedicate resources to potential future residents over their own acute sense
of immediate need. Given public attitudes towards migrants, and a limited knowledge of migration dynamics,
officials are unlikely to insist that resources be dedicated to an unpopular group of potential residents.
A second limitation of participatory planning lies in the de facto exclusion of migrants (both domestic and
international) and of migration issues from public consultations for planning purposes. In general, outsiders
from the communities studied were not invited to participate in Community Policing Forums (there were
exceptions in parts of Tshwane and Nelson Mandela Bay), Stakeholders’ Forums, Residents’ Associations, or
meetings held by local ward councillors. While there was seldom any overt prohibition on such participation,
almost all of the officials and community members interviewed indicated an almost total absence of foreigners
and recent migrants in these kinds of fora. It must be noted, however, that this is not the case everywhere.
The City of Johannesburg, for instance, has launched a number of initiatives to foster and encourage
migrants’ participation in dialogue platforms (for instance, the Migrant Helpdesk, created in April 2007, and

38
the Johannesburg Migrants’ Advisory Committee (JMAC), launched in 2010). This has been preceded by
initiatives at the ward level, such as a migrant neighbourhood in Yeoville where the Stakeholders’ Forum has
included migrants’ organisations for several years already. While these initiatives are laudable, they are limited
to a few municipalities. Moreover, it is as yet unclear how exactly they will associate migrants with planning at
community level, where exclusion mechanisms are often implicit and pernicious.
Planning
A close examination of municipalities’ IDPs reflected little mainstreaming of population dynamics into planning
processes. In most cases, demographics were simply mentioned as an element of background, not as the
basis for development plans. The lack of reliable information, as described in the previous chapter, is not
the only reason for such bounded planning. Municipal officials have an ambivalent approach to population
information: they consider it useful for the current management of development programmes and for targeting
‘poverty pockets,’ but they are unable to use it to garner the financial support they need for future investment.
In some instances, they expressed concern that too much data might only highlight the shortcomings of what
they knew were inadequate interventions given the scope of demand.
The lack of forward planning affects all municipal residents, yet future arrivals and current migrants
occupied a particularly ambivalent space in officials’ vision.
While officials recognised that not all migration resulted in permanent settlement, they did not seem to have
considered that
the municipality’s services and employment characteristics may not be conducive to 1)
permanent settlement;
temporary migration may be systematic and predictable; or 2)
the municipality might develop differentiated (and not necessarily more costly) approaches 3)
to service delivery that accommodate the different expectations of long- and short-term
residents.
In practice, planning seemed to be oriented towards targets that clearly favoured permanent residents
over temporary ones. In part this was due to negative preconceptions about transient populations, but it was
probably more a consequence of available instruments and bureaucratic rigidity and comfort in planning for
service allocation. A town planner explained:
The reason is not to exclude migrants. It is merely focusing on permanent residents first. It is difficult to
cater for people who are highly mobile while still dealing with permanent residents at the same time, as
they often do not require the same strategies.
Similar preferences to prioritise ‘our own’ long-term residents were expressed elsewhere in other
municipalities. The language of preference was sometimes explicit and sometimes couched beneath the
pretext of assisting ‘registered ratepayers.’ Nonetheless, the priorities were clear.
This widespread preference for long-term residents seemed to be shared across party political divides,
and commonly reflected in approached to informal settlements, which are the most visible manifestation of in-
migration. In Mossel Bay, for instance, the municipality has adopted a proactive line against informal settlements
based on systematic dismantling and eviction in order to discourage newcomers. In another municipality, a
study had been commissioned and a unit created in the Community Safety Department to retard the expansion
of informal settlements, a position which was much criticised by the political opposition. The Strategy Support
Executive explained the municipality’s approach as follows:
Chapter Three: Consultation, Planning and Budget
39
What we are trying to do is to discourage people from coming. As far as squatting is concerned, we
have people who remove those structures. Other than that there is nothing else you can do because
you do not have funds, you do not have land available. You can only try to discourage people as much
as possible”.
At least one other Metro has developed a parallel approach. In two of the municipalities, officials did not
indicate specific services for the removal of squatter camps but expressed the same negative attitude with
regards to their ‘mushrooming’. In Cape Town, there have been similar efforts to manage the city’s growing
population, although the language used reflects a level of political sophistication and nuance not seen in the
smaller municipalities. As in Johannesburg, efforts to maintain the urban edge or protect sensitive environmental
resources often provide the justification for ‘decanting’ recently arrived and mobile populations.
Budgeting
Current mentalities and modalities of planning have at least two significant implications for the budgeting
processes:
Efforts to address the existing needs of permanent residents leads financial planners to generally (1)
overlook population and migration trends, despite the fact that future residents will, ultimately,
demand resources and interventions;
Where there are significant efforts to ‘forward plan’, they are largely unsupported by the current (2)
system of resource allocation to local government through the Local Government Equitable
Share.
Lack of Budgetary Support for Forward-Planning
The strict reliance on 2001 Census data (and subsequent national averages of population growth rates), and
the difficulty of generating universally accepted interim data, has undermined municipalities’ ability to calculate
current demographic realities and trends. This is clearly illustrated in the following statement by a Director of
Town Planning:
We know that we have the highest population in the district; bigger than George, but they are given more
money than us. Everyone is aware that Mossel Bay is the largest town in Eden District Municipality, but
allocations for housing and MIA grant are not related to population figures.
There is therefore no incentive for municipal officials to be forward-looking in their planning and
budgeting, since they are compelled to work from figures that do not correspond with their municipalities’
changing demographic composition. Moreover, municipalities are generally unable to use studies they have
commissioned or other data sources to influence their budget allocation. The Chief Financial Officer in another
municipality thus explains:
I was recently faced with a question of why we can’t put in a proposal to the national treasury to increase
our equitable share to support poor people in the municipality, as things have changed from the baseline
data of 2001. Now the issue is that I can’t put a submission like that because the 2001 census data was
used to calculate the equitable share. Equitable Share allocations for every municipality have been using
the same information. It is therefore difficult to go as an independent municipality and request a review
of individual municipalities. Unless you have information for the entire country, for all municipalities such
reviews will remain difficult.
Chapter Three: Consultation, Planning and Budget
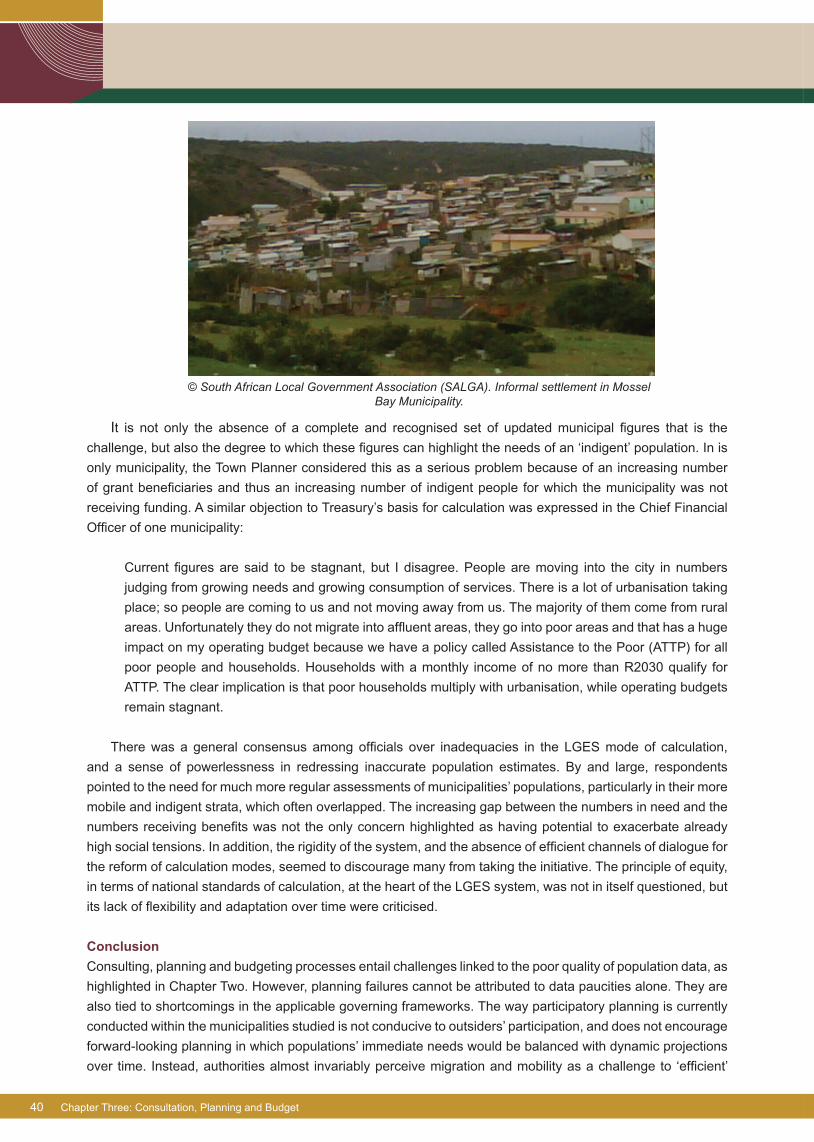
40
© South African Local Government Association (SALGA). Informal settlement in Mossel Bay Municipality.
It is not only the absence of a complete and recognised set of updated municipal figures that is the
challenge, but also the degree to which these figures can highlight the needs of an ‘indigent’ population. In is
only municipality, the Town Planner considered this as a serious problem because of an increasing number
of grant beneficiaries and thus an increasing number of indigent people for which the municipality was not
receiving funding. A similar objection to Treasury’s basis for calculation was expressed in the Chief Financial
Officer of one municipality:
Current figures are said to be stagnant, but I disagree. People are moving into the city in numbers
judging from growing needs and growing consumption of services. There is a lot of urbanisation taking
place; so people are coming to us and not moving away from us. The majority of them come from rural
areas. Unfortunately they do not migrate into affluent areas, they go into poor areas and that has a huge
impact on my operating budget because we have a policy called Assistance to the Poor (ATTP) for all
poor people and households. Households with a monthly income of no more than R2030 qualify for
ATTP. The clear implication is that poor households multiply with urbanisation, while operating budgets
remain stagnant.
There was a general consensus among officials over inadequacies in the LGES mode of calculation,
and a sense of powerlessness in redressing inaccurate population estimates. By and large, respondents
pointed to the need for much more regular assessments of municipalities’ populations, particularly in their more
mobile and indigent strata, which often overlapped. The increasing gap between the numbers in need and the
numbers receiving benefits was not the only concern highlighted as having potential to exacerbate already
high social tensions. In addition, the rigidity of the system, and the absence of efficient channels of dialogue for
the reform of calculation modes, seemed to discourage many from taking the initiative. The principle of equity,
in terms of national standards of calculation, at the heart of the LGES system, was not in itself questioned, but
its lack of flexibility and adaptation over time were criticised.
Conclusion
Consulting, planning and budgeting processes entail challenges linked to the poor quality of population data, as
highlighted in Chapter Two. However, planning failures cannot be attributed to data paucities alone. They are
also tied to shortcomings in the applicable governing frameworks. The way participatory planning is currently
conducted within the municipalities studied is not conducive to outsiders’ participation, and does not encourage
forward-looking planning in which populations’ immediate needs would be balanced with dynamic projections
over time. Instead, authorities almost invariably perceive migration and mobility as a challenge to ‘efficient’
Chapter Three: Consultation, Planning and Budget
41
planning, with a preference for permanent residents expressed across municipalities, sometimes justifying
proactive anti-squatter policies. The whole LGES system similarly serves to discourage the incorporation of
transient communities, as municipalities are not supported if they wish to plan for rapid or highly localised
population changes that have not been captured in a national census. Not only are officials acutely aware
of these inadequacies, but they also expressed a sense of powerlessness in amending the existing system.
Intergovernmental cooperation is lacking in many respects with regards to decisions concerning foreign
migrants and their access to certain rights.
Chapter Three: Consultation, Planning and Budget

42
43
Chapter Four: Security, Conflict and Social Cohesion
Since 2009, the President of South Africa has placed a renewed emphasis on social cohesion, while the
police and others have redoubled their efforts to fight criminality and violence in South African communities.
Although not explicitly about migration, these two imperatives nonetheless bring issues of mobility and security
into sharp relief. A concrete definition of social cohesion is not included in government policy, but most would
agree that it includes overcoming a range of deeply ingrained and emerging forms of intolerance and bias:
managing the tensions of diverse and diversifying communities in systematic and equitable ways (see Cloete
and Kotze 2009). Doing so successfully is expected to produce greater social equity and justice, while limiting
the opportunities for and exercise of criminality and socially destructive behaviours, including ‘xenophobic’
violence. National institutional frameworks, policy priorities, and incentives are important in shaping conflicts
and preventing them, but the majority of tensions manifest themselves and must be addressed within specific
municipalities.
This chapter offer a three-fold approach to dealing with identity- or community-based tensions and
migration-related security in South African municipalities. This approach is based on observations made during
the course of the study, including:
The limited degree to which demands for social cohesion have been translated into particular •
programmes or initiatives to resolve real and potential tensions among the municipalities’ residents;
and
Biased practices by the police, officials, and other leaders (elected and otherwise) in relation to security •
and conflict resolution.
The findings in these respects are discussed below, and the chapter concludes with a recommended approach
to dealing with issues of social cohesion.
Understanding and Reframing Social Cohesion
The first step in addressing migration-related tensions and the possibility of violence is to identify and address
the roots of conflict and discrimination. As noted elsewhere in this report, many officials understand managing
or addressing migration as something primarily associated with movement across South Africa’s international
borders. As such, mobility and its consequences are typically deemed a national competence that affects
municipalities but falls largely outside their mandates. In almost all cases, officials’ focus is more on issues that
current electorates are pressurising them about, such as housing and water. Where population change and
movement within municipalities is seen as posing locally salient challenges, these are typically framed in terms
of conflicts due to race and inequality, not nationality, ethnicity, or mobility. When pushed, authorities recognise
that people’s origins could become a flashpoint for conflict, typically in relation to access to public services,
resources and employment. Local government officials typically downplay the significance of discriminatory
attitudes as enablers for other forms of conflict. Reflecting national political commitment, they often insist that
their constituency is not intolerant or xenophobic, per se, but are rather driven towards xenophobic statements
and acts by material circumstances or criminal manipulation (See Landau 2010). In the words of the Acting
Executive Director for Safety and Security in one Metro, past attacks were ‘never necessarily a xenophobia
thing.’
There has been a gradual recognition at a senior leadership level, in both national and local government, that
xenophobia and other forms of intolerance are potentially explosive and damaging forces within communities.
There has been a proliferation of symbolic and material efforts to address diversity, particularly, xenophobia.

44
In one municipality, this concern has translated into an ad hoc task team of officials and an assertion by the
office of the speaker that xenophobia is ‘continuously being addressed in various arenas.’ Johannesburg’s
Migration Advisory Committee (JMAC), established by the Mayor in the wake of the 2008 xenophobic attacks,
provides an additional example. In Tshwane, a series of committees were also established in the wake of the
2008 violence.
The launching of committees and cultural events are important steps in mainstreaming concerns over
diversity into municipalities’ operations. However, the research found little evidence of substantive engagement
around these issues. Apart from an assortment of visible activities such as soccer tournaments, cultural
events, and speeches, many of the efforts across a range of municipalities have had limited programmatic
impact. In one of the metros, the committee quickly fell apart before launching any substantive programmatic
interventions. In another metro, a Migrant Help Desk, established long before the 2008 attacks, provides some
information and coordination around migration and xenophobia, but has been unable to drive a mainstreamed
approach across the municipality. In one other local municipality, few people apart from those involved in the
task team could identify any programmes that had been undertaken under its authority. Indeed, across the
municipalities, few officials could point to specific initiatives or programmatic changes aimed at addressing
tensions related to migration or diversity. To further illustrate the limited impacts of these initiatives, many police
and local officials continue to deny their responsibility for managing tensions and planning around migration.
Apart from regularly denying responsibility for managing it, part of the challenge municipalities face in
addressing issues of social cohesion and xenophobia is their limited understanding of its roots and impacts.
Many continue to describe xenophobia as something that happened in 2008 and has since subsided, much
like a surprising and particularly fierce thunderstorm. In one of the smaller municipalities, officials reported
that locals were simply ‘caught up in national events...copying what they saw on TV,’ thus denying any local
tensions. Others describe it as opportunism. The only significant exception to this perspective was in Merafong,
where the Chief Whip recognised that ‘Shangaan speakers’ (a category likely to include both Mozambicans
and South Africans) were chased out of Khutsong as early as 2000. But even in Khutsong, authorities felt that
they were relatively helpless in shaping the attitudes behind such violence. Instead they preferred to focus on
the law enforcement issues that stem from these attitudes. While xenophobic violence is now recognised as a
problem (and a potentially recurrent one); the approach to it is still rooted largely in law enforcement and can,
as such, only be reactive.
Given widespread popular sentiments linking migration (including domestic migration, but especially
cross-border movements) with criminality,12 senior police officers and officials have widely divergent views
on the relationship between mobility and insecurity. In one metro there was a widespread perception that (a)
migration was a major force shaping the city and (b) that migrants were implicated in a wide range of criminal
activities. Similarly, in a smaller municipality, the Chairperson of Technical Services – one of the four members
of the Mayoral Committee – argued that, ‘...it’s a known fact: they come and they buy a house for R700, while
original owners go and stay under plastic bags again. Some of these houses have been used for drug retailing’.
Throughout the interviews, Nigerians (a category that indiscriminately includes all Anglophone West Africans)
are particularly demonised, although Zimbabweans and Mozambicans also feature prominently. Elsewhere,
police expressed concern that people who come and go from a given location – usually domestic migrants
in this case – can easily evade police observation and arrest. This was particularly pronounced in Merafong,
where representatives from SAPS and private security both argued that people travelled from Johannesburg
and Soweto to commit crimes.
12 See Crush and Williams 2003; Landau and Monson 2008.
Chapter Four: Security, Conflict and Social Cohesion
45
Others explained that foreign criminals slip through the net because they have not been adequately
fingerprinted or registered. The same can be said for most South Africans, although it is also unclear that such
a register would be particularly useful in fighting crime.
While officials and police officers may vary in the degree to which they explicitly link migration and insecurity,
almost all link unregulated population movement and settlement to the crime within their communities. If it is
not migrants, per se, that are the problem, it is uncontrolled housing and settlement patterns, the inability to
organise and register the population, and the inability of the city to keep up with the infrastructure needed to
reach into townships and informal settlements. Some cite the poor quality of education and limited opportunities
for schooling as an indirect cause of conflict and criminality. As almost all of these factors are linked to population
dynamics, migration remains a spectre hiding just beneath the surface. What few officials seem to explicitly
recognise is that the negative outcomes they observe are by no means predetermined. Rather, the ineffective
management of population growth has helped heighten precisely the tensions over housing and resources that
can lead to intergroup conflict.
Structures and Practices
As noted earlier, officials have done little to explicitly manage the tensions and insecurity associated with
population mobility. However, there are a range of practices by the police and others that suggest a strong bias
against new arrivals. In many municipalities, the South African Police Service (SAPS) has arrested and detained
non-nationals and other suspect outsiders. Under the guise of crime control, the police in Johannesburg,
Cape Town, and a number of other municipalities spend disproportionate amounts of their time tracking
undocumented migrants (see Vigneswaran & Duponchel 2009). Even where SAPS is not directly involved,
someone often steps in to carry out the same function. In Nelson Mandela Bay, this has taken the form of the
Port of Entry police. In Mossel Bay, complaints about drug trading or other illegal activities tended to result in
a strategy of once-off raids rather than ongoing targeting of non-nationals and outsiders. However, even in
these raids, the first ports of call for officers included foreign-owned shops, shacks, and homes. While such
highly visible initiatives surely build the credibility of law enforcers among some residents, it also reinforces the
perception that foreigners are predisposed to criminal behaviours (see Crush and Williams 2002).
While it is easy to condemn the bias and harassment associated with these raids, it is important to
understand the structural and political imperatives that motivate these and other similar behaviours. Across
the municipalities, SAPS officials were aware that they were not satisfying residents’ demands for justice
and security. In almost all the municipalities, citizens expressed frustration that there was little follow-up or
investigation on criminal activity, besides occasional arbitrary raids. One officer noted that community members
in KwaNonqaba (Mossel Bay) now take it upon themselves to go to court when suspects are arrested. Once
there, they warn the judge to keep the suspect in custody, otherwise they will face justice on the street.
Elsewhere, the loss of faith in official systems has encouraged various forms of vigilante activity or mob justice.
This is particularly evident in Walmer Township (Nelson Mandela Bay) and in Soshanguve (Tshwane). Given
that many local residents see South African and foreign migrants as responsible for everything from petty
crime to drug trafficking and murder, these vigilante groups tend to target outsiders.
While policing and vigilantism often target foreigners and other outsiders, there have also been instances
where they have worked to protect foreigners from xenophobic attacks. The Gqebera Trust in Nelson Mandela
Bay is one such initiative. The trust initially emerged, as have many similar efforts, to combat crime. Rather than
simply organise to push out the Zimbabweans who were largely presumed to be behind problems in Walmer
Township, the group organised, under strong and consistent leadership, to investigate criminal acts and to find
out what had happened. Working with police and private security to collect and disseminate information, the
Chapter Four: Security, Conflict and Social Cohesion
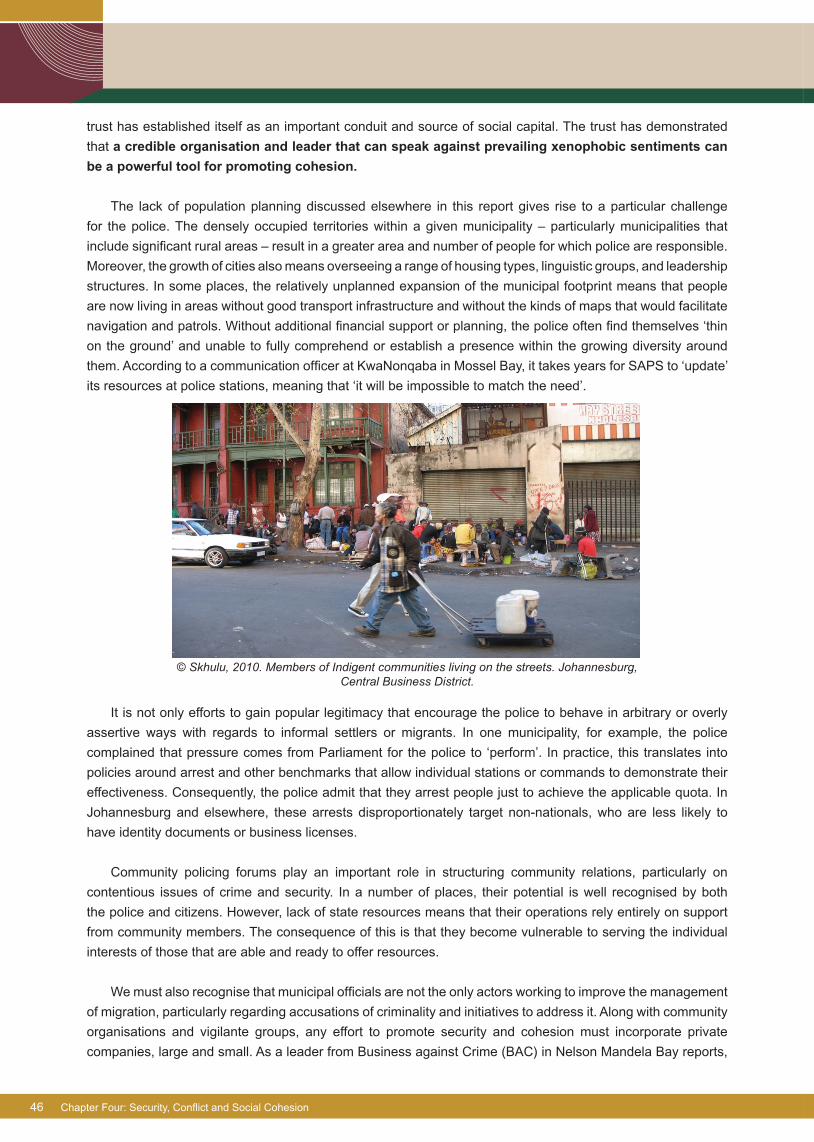
46
trust has established itself as an important conduit and source of social capital. The trust has demonstrated
that a credible organisation and leader that can speak against prevailing xenophobic sentiments can
be a powerful tool for promoting cohesion.
The lack of population planning discussed elsewhere in this report gives rise to a particular challenge
for the police. The densely occupied territories within a given municipality – particularly municipalities that
include significant rural areas – result in a greater area and number of people for which police are responsible.
Moreover, the growth of cities also means overseeing a range of housing types, linguistic groups, and leadership
structures. In some places, the relatively unplanned expansion of the municipal footprint means that people
are now living in areas without good transport infrastructure and without the kinds of maps that would facilitate
navigation and patrols. Without additional financial support or planning, the police often find themselves ‘thin
on the ground’ and unable to fully comprehend or establish a presence within the growing diversity around
them. According to a communication officer at KwaNonqaba in Mossel Bay, it takes years for SAPS to ‘update’
its resources at police stations, meaning that ‘it will be impossible to match the need’.
© Skhulu, 2010. Members of Indigent communities living on the streets. Johannesburg, Central Business District.
It is not only efforts to gain popular legitimacy that encourage the police to behave in arbitrary or overly
assertive ways with regards to informal settlers or migrants. In one municipality, for example, the police
complained that pressure comes from Parliament for the police to ‘perform’. In practice, this translates into
policies around arrest and other benchmarks that allow individual stations or commands to demonstrate their
effectiveness. Consequently, the police admit that they arrest people just to achieve the applicable quota. In
Johannesburg and elsewhere, these arrests disproportionately target non-nationals, who are less likely to
have identity documents or business licenses.
Community policing forums play an important role in structuring community relations, particularly on
contentious issues of crime and security. In a number of places, their potential is well recognised by both
the police and citizens. However, lack of state resources means that their operations rely entirely on support
from community members. The consequence of this is that they become vulnerable to serving the individual
interests of those that are able and ready to offer resources.
We must also recognise that municipal officials are not the only actors working to improve the management
of migration, particularly regarding accusations of criminality and initiatives to address it. Along with community
organisations and vigilante groups, any effort to promote security and cohesion must incorporate private
companies, large and small. As a leader from Business against Crime (BAC) in Nelson Mandela Bay reports,
Chapter Four: Security, Conflict and Social Cohesion
47
‘we’ve got 10,000 armed private security guards in the city . . . and they don’t talk to each other, because
they see each other as competition.’ Similarly, they rarely engage with either metro police or SAPS, often for
precisely the same reasons – or because they do not wish to reveal their quasi-legal strategies to the police.
Obstacles to social cohesion are not limited to the police and security agents. In many instances, new
arrivals are largely excluded from community leadership structures. In some cases, people seem to be
explicitly excluded – told that they are not eligible to attend meetings organised by local CPFs or as part
of the municipality’s integrated development planning. If municipalities are unable to find ways of opening
avenues for new arrivals to actively participate in such meeting, they help reinforce a sense of difference and
boundaries between groups. Moreover, they limit the information they would otherwise be able to collect from
this constituency. Beyond that, the continued exclusion of new arrivals may foster a sense of transience that
limits social and material investment in the areas in which they live. Providing a sense that new arrivals can
influence the future of their residential municipalities can help create incentives for involvement and such
investments.
Conclusions
Tensions related to migration are likely to remain a dangerous trait in municipalities across South Africa (see
Strategy and Tactics 2010). While there is a slow recognition of the need to address these tensions, current
conceptualisation and planning processes are likely to maintain or exacerbate current conditions. As noted
throughout this report, migration is generally not considered in municipal planning processes. Initiatives to
promote social cohesion have been short lived and largely superficial.
To be effective, municipalities must overcome a dual challenge related to limited causal regress in terms
of discrimination and planning. To date, xenophobia and discrimination have usually been considered only
when they manifest themselves in violence, exclusion or criminality. In most instances, authorities deny the
possibility that their communities are generally exclusory. Similarly, they typically deny that their services
and resource allocation systems may unintentionally result in discriminatory allocations. Consequently, the
proposed solutions are typically apolitical: rooted in improved law enforcement practices rather than a broader
shift in political discourse and understandings of urban citizenship. Rather than excluding new arrivals from
broader deliberative structures, there is a need to shift incentives for the police, community policing forums and
other community structures to become more inclusive.
Discussions of crime face a similarly causal shortcoming. Although a few authorities and officers suggest
that controlling migration – particularly of West Africans – would help to address crime, most root insecurity in
economic disparities and a shortage of infrastructure: roads, schools, houses, and the like. As these paucities
are firmly rooted in population dynamics, including natural growth and migration, any effective solution to crime
must consider and plan for such dynamics across local and other government departments.
A Three-Stranded Approach
Addressing issues of identity- or community-based tensions and migration-related security in South African
municipalities will therefore require a three-stranded approach. As there is no ‘third force’ or national syndicate
to be broken, these processes must be managed locally, albeit within national planning and policy frameworks.
The first step in doing so will require a shift in mindset – a change in attitudes towards migration among
civic and community leaders that lends credence and practical political support to broader calls for cohesion
and tolerance. Only by curbing explicit and implicit accusations against migrants will it be possible to create
communities founded on principles of tolerance and inclusion.
Chapter Four: Security, Conflict and Social Cohesion

48 Chapter Four: Security, Conflict and Social Cohesion
The second aspect of a successful solution will be a shift in structural incentives that currently discourage
initiatives that bridge differences among various groups living within a single municipality or within particular
parts of a given municipality. For example, the very legitimacy of police within communities may depend on
their behaving in ways that explicitly discriminate against or neglect the rights and welfare of less popular
sub-groups. As long as biases remain strong, the police will continue to find incentives for treating migration –
international and domestic – as a threat to security even, when they well know that it is not.
Lastly, there is a need to reconsider the role of statutorily mandated bodies like Community Policing
Forums in fostering inclusion and discouraging disunity and conflict. In many instances, these bodies are
effectively ‘captured’ by those within communities who posses exclusionary ambitions. When these conditions
are in place, local-level interventions can be considered. These will include considering the functions of roles
and agencies that are formally or informally charged with managing tensions and promoting cohesion among
diverse and mobile groups.

49
Recommendations
Migration is a global phenomenon and South Africa is not immune to its effects. Failure to proactively address
migration and other forms of human mobility will yield undesired consequences for all: social fragmentation,
economic exclusion, poor planning, and the continued possibility of violence. If properly managed, domestic
migration can bring people closer to services, enrich the labour market, and open important opportunities
for poverty reduction. Similarly, international migration need not lead to conflict and tensions, but can help to
provide needed skills and entrepreneurial energy, while boosting regional trade and integration and helping to
facilitate post-conflict reconstruction in international migrants’ countries of origin.
Migration and other forms of human mobility are by definition deeply spatialised processes. People move
from one specific place to another, either within a municipality or into another municipality. As such, local
government has a significant role to play to effectively manage migration. Initiatives to guide municipalities
on how to proceed in developing and implementing policies and strategies to that effect should therefore be
developed.
Effectively countering poverty in municipalities affected by varied forms of human mobility means
effectively recognising migration dynamics and their effects on poverty and social cohesion. More migration
does not necessarily equal fewer resources for long-term residents. In order to progressively addressing the
relationships among these variables means first understanding the strengths and limitations of existing formal
and informal institutions, and strengthening those capable of fostering participation, conflict resolution, and
service delivery. As such, migration policy must be managed as a strategic planning and development issue,
rather than being viewed negatively as a problem that needs to be reversed. This also includes differentiating
between foreign and domestic migrants, both of which pose significant but different sets of challenges.
South Africa needs an immigration policy that promotes its goals of regional integration, counter poverty,
social justice and human rights. This means developing appropriate means for people to enter the country
legally, supported by appropriate documentation. The country must find ways to manage migrants in ways that
are humane and promote the legal migration of people who wish to cross the border. Rigid border controls and
anti-migration policies do not always protect the labour market. Rather, such efforts often heighten corruption
and human rights abuse, as experienced elsewhere in the world.13 Similarly, ongoing raids and deportations
do little to control absolute numbers. Rather, they inhibit investment while promoting social fragmentation and
stigmatisation. If the goal is to better regulate the labour market, the government must penalise employers
who violate immigration and labour laws. National migration policy should also be drafted in relation to local
government’s mandate, as the spatialised effects of both documented and undocumented migration are
primarily felt by municipalities. Considering the political economy of border towns and urban areas specifically
affected by hyper-mobility, policy-making could avoid reproducing the current over-simplistic approach to
control, documentation and deportation. As they stand, current national migration policy and legal frameworks
offer very little space for engagement with local government. Including organised local government in the
national migration policy reform process and further monitoring and supporting its active input could address
this need.
13 See Wayne Cornelius on the US border (c. 2001), reports of drowning in the Mediterranean.
Chapter Four: Security, Conflict and Social Cohesion

50
The consistent and confusing overlaps and gaps in service delivery mandates related to the management
of mobile populations is one of this study’s key findings. While border control and the provision of documentation
are undeniably national competencies, the nature of their implementation impacts the range of benefits and
rights individuals may enjoy at their place of residence or work. Undocumented migrants or unregistered South
Africans, especially in informal settlements, pose a specific challenge for municipalities. The illegality of their
stay in the country or the informality of their residence in a locality should not deprive them of certain basic
rights.
While there are good reasons for providing investments in rural areas, the structure of the current global
economy privileges life in urban areas. Given the continued movements of people into and through cities, and
the relatively high fertility rates of those already living in South Africa’s urban areas, authorities must begin
planning for rapid growth in many of the country’s cities and larger towns. Elsewhere, the movement of people
is likely to denude the labour force and create a disproportionately high demand for social services. Effective
management of these processes will mean improving the interface and relationships between urban and
rural municipalities. Spatial planning must explicitly include population dynamics and scenarios in determining
targets and monitoring standards.
The following are a few potential areas of intervention towards effectively managing migration and
urbanisation:
Data collection and management;•
Use of Population Data for Policy, Planning and Budgeting;•
Improved Coordination; •
Border management;•
Manage migration and urbanisation as an inevitable global phenomenon;•
Building the capacity for ongoing research, monitoring, and projections.•
Data Collection
There is a need to rethink the data collection system and the interface between municipalities, provinces and
national agencies such as Statistics South Africa (StatsSA), to ensure that:
A degree of standardisation at national, provincial and municipal level is maintained to allow •
comparability of data;
Data collection methods at municipal level are agreed upon, familiar, and considered to be •
legitimate, useful and reliable by all stakeholders;
Data builds up into longitudinal data bases informing municipalities on trends over time; •
Management of migration and migrant communities is led by staff that has been trained in the •
management and use of data, and on related migration issues;
StatsSA collects data which is disaggregated better at the local level. This should include •
better coordination with municipalities and other data collection agencies.
Use of Population Data for Policy, Planning and Budgeting
Population (including migration) dynamics should be mainstreamed into IDPs, with particular •
emphasis on social cohesion, economic growth, safety and security. IDPs should cater for
highly mobile populations wherever necessary, and use evidence in a more balanced way for
policy formation. The use of population data for policy and planning must include participatory
planning processes and spatial planning, and must find expression in both Spatial Development
Frameworks and IDPs;
Chapter Four: Security, Conflict and Social Cohesion

51
Review budgeting processes, including the Local Government Equitable Share (LGES) •
Allocation to include forward-looking population dynamics. Ensure that LGES allows for
more regular population re-assessments, including assessments of changes in the indigent
population and amendments of revenue allocations.
Improved Co-ordination
Improve coordination of all relevant partners at national, provincial and local levels, towards •
a more effective management of migration. These include all spheres of government, civil
society, private sector, research agencies, and academic institutions;
Facilitate the institutionalisation of a local government response to migration in order to •
improve communication and coordination between municipalities and migrant communities.
This includes the establishment of dedicated capacity to deal with migration, such as Migrant
Desks;
Establish a migration policy think tank to aid in re-thinking decision-making and implementation •
mandates with regard to mobile populations. The City of Johannesburg and City of Cape
Town are currently experimenting with ‘City Labs’ that bring together academics, civil society,
and municipal officials in ongoing thematic discussions.
Migration Policy and Border Management
South Africa needs an immigration policy that promotes its goals of regional integration, •
counter-poverty, social justice and human rights. This means developing appropriate means
for people to enter the country legally and with appropriate documentation. Considering that
South Africa, like all other migrant receiving countries, cannot completely seal its borders, it
must find ways to manage cross-border mobility in ways that are humane and promote the
legal migration of people who wish to cross;
If improved regulation of the labour market is required, the government should consider •
sanctions against employers who violate immigration and labour laws and more regularly
inspection of workplaces to ensure that the basic conditions of labour are being upheld;
Reforms in migration policy should be carried out in collaboration with municipalities. •
Municipalities should also find ways of formulating and articulating their interests with regard
to immigration policy and practice.
Continuous Research and Development
Support ongoing research to enhance the understanding and management of migration. The following additional
areas of research have been proposed:
Migration and access to services in order to better understand how (if at all) long-term •
vulnerable groups move out of poverty;
Qualitative research to determine the relationships between mobility within or between cities •
and access to employment, labour and services;
Qualitative studies on the role played by corporate social responsibility programmes carried •
out by companies relying on migrant labour.
Chapter Four: Security, Conflict and Social Cohesion

52
53
References
Balbo, M. and Marconi, G., ‘Governing international migration in the city of the south’, (Global Migration
Perspectives No. 38, Global Commission for International Migration, Geneva, 2005).
Beal, J. Crankshaw, O and Parnell S., Uniting a Divided City: Governance and Social Exclusion in Johannesburg
(Earthscan, London, 2003).
Bremner, L., “Participatory planning: models of urban governance: Porto Alegre and Greater Johannesburg”,
Urban Forum, 9,1 (1998), pp.111-119.
Bekker 2002 – Is this Bekker, S.B., ‘Main Report. Migration Study in the Western Cape 2001’ (Department of
Planning, Local Government and Housing of the Provincial Administration of the Western Cape, 2002).
Chauke, H., ‘Speech by the Chairperson of PC on Home Affairs during debate on ‘Migrants Workers in South
Africa’, 2007. Available at <http:// www.anc.org.za/caucus/docs/sp/2007/sp0911a.html> (6 December
2010).
Cloete, P. and Kotze, F., ‘Concept Paper on Social Cohesion/Inclusion in Local Integrated Development Plans’
(Final Draft, 2009).
Collinson, M., Kok, P. and Garenne, M., ‘Migration and Changing Settlement Patterns: Multilevel Data for
Policy’ (Report 03-04-01, Statistics South Africa, Pretoria, 2006).
Cooke, B. and Kothari,U., ‘The case for participation as tyranny, in Bill Cooke and Uma Kothari (eds),
Participation: The New Tyranny? (London, Zed Books, 2001), pp. 1-14.
Cross, C., Kok, P., Wentzel, M., Tlabela, K., Weir-Smith, G., and Mafukidze, J. , ‘Poverty pockets in Gauteng:
how migration impacts poverty’ (Report to the Gauteng Intersectoral Development Unit, Human Sciences
Research Council, Pretoria, 2005).
Crush, J. (ed.), ‘The perfect storm: the realities of xenophobia in contemporary South Africa’ (Migration Policy
Series No. 50, Southern African Migration Project, Cape Town, 2008).
Crush, J. and Williams, V., ‘Criminal tendencies: immigrants and illegality in South Africa’ (Migration Policy
Brief No. 10, Southern Africa Migration Project, Cape Town, 2003).
Casale, D. and Posel ,D., ‘Migration and remittances in South Africa. Background document on migration and
first set of draft questions for inclusion in the National Income Dynamics Study’, University of KwaZulu-
Natal, Department of Economics, 2006. Available at < http://www.nids.uct.ac.za/papers/migration.pdf>
(6 December 2010).
Cornelius, W. ‘Death at the Border: Efficacy and Unintended Consequences of U.S. Immigration Control Policy,’
Population and Development Review Vol. 27(4)(2001): 661-685.

54
Dorrington, R., ‘Projection of the population of the city of Cape Town 2001-2021’, (Report prepared for the City
of Cape Town, Centre for Actuarial Research, University of Cape Town, Cape Town, 2005).
Department of Cooperative Governance & Traditional Affairs (CoGTA), ‘State of Local Government in South
Africa’ (Overview Report, CoGTA, November 2009).
Department of Provincial and Local Government (DPLG) ‘The White Paper on Local Government’, 1998.
Available at http://www.treasury.gov.za/legislation/mfma/guidelines/whitepaper.pdf> (6 December
2010).
Hornberger, J., ‘Policing Xenophobia – Xenophobic Policing: A Clash of Legitimacy’ in Shireen Hassim et al.
(eds), Go Home or Die Here: Violence, Xenophobia and the Reinvention of Difference in South Africa
(Wits University Press, Johannesburg, 2008), pp. 132-143.
International Organisation for Migration, ‘World Migration Report 2010. The Future of Migration: Building
Capacities for Change’ (International Organisation for Migration, Geneva, 2010).
Kok, P. and Collinson, M. , ‘Migration and Urbanisation in South Africa. Report No: 03-04-02 (2006)’ (Statistics
South Africa, Pretoria, 2006).
Landau, L.B. and Gindrey, V., ‘Migration and Population Trends in Gauteng Province 1996-2055’ (Working
Paper Nr. 42, Forced Migration Studies Programme, University of the Witwatersrand, Johannesburg,
2008). Available at
<http://www.migration.org.za/sites/default/files/working_papers/2009/Gauteng_working_paper_
MSWPS42_0.pdf> (7 December 2010).
Landau, L.B. and Monson, T., “Displacement, estrangement, and sovereignty: reconfiguring state power in
urban South Africa”, Government and Opposition, 43, 2 (2008), pp. 315-336.
Landau, L.B., “The mysterious incompatibility of bias and brigandry”, SA Reconciliation Barometer: Tracking
Socio-Political Trends, 8, 2 (2010), pp. 2-13.
Landau, L.B., Wa Kabwe Segatti, A., Misago, J.P. and Gindrey, V., ‘Migration Patterns and their impact on
Municipalities’ Development in South Africa’ (African Centre for Migration and Society, University of the
Witwatersrand, Johannesburg, 2010).
Misago, J.P. , ‘Violence, Labour and the Displacement of Zimbabweans in De Doorns, Western Cape’ (Migration
Policy Brief 2, Forced Migration Studies Programme, University of the Witwatersrand, Johannesburg,
2009). Available at <http://www.migration.org.za/sites/default/files/reports/2009/FMSP_Policy_Brief_2_
De_Doorns_Dec09_FINAL_2_0.pdf> (7 December 2010).
Misago, J,P., Landau, L.B. , and Monson, T., ‘Towards Tolerance, Law and Dignity: Addressing Violence against
Foreign Nationals in South Africa’ (International Organisation of Migration, Pretoria, 2008).
National Urban Development Framework Steering Committee, ‘Harnessing a Common Vision for Growth and
Development of South Africa’s Towns, Cities and City-Regions’ (Draft 1.2, National Urban Development
Framework Steering Committee, May 2009).
References
55References
MRC/Wits Rural Public Health and Health Transitions Research Unit (Agincourt), School of Public Health,
University of the Witwatersrand, South Africa.
Roux, N., ‘Towards a 10 Year Review of the Population Policy Implementation in South Africa (1998-2008):
Migration and Urbanisation’ (Department of Social Development, Republic of South Africa, 2009).
Skulu. (2010) Working the City: Experiences of Migrant Women working in Inner-City Johannesburg.
Johannesburg, South Africa. Photo Workshop Gallery. African Centre for Migration & Society (ACMS).
6 October 2010
South African Cities Network (SACN), ‘State of the Cities Report 2006’ (South African Cities Network,
Johannesburg, 2006).
State of the cities report 2004’ (South African Cities Network, Johannesburg, 2004).
Statistics South Africa (StatsSA), ‘Community Survey: Revised Version’ (Statistics South Africa, Pretoria,
2007).
Strategy and Tactics, ‘South African Civil Society and Xenophobia’ (Strategy and Tactics and the Gauteng
City Region Observatory, Johannesburg, 2010). Available at <http://www.gcro.ac.za/news/xenophobia-
reports-released> (7 December 2010).
Thembi. (2010) Working the City: Experiences of Migrant Women working in Inner-City Johannesburg.
Johannesburg, South Africa. Photo Workshop Gallery. African Centre for Migration & Society (ACMS).
6 October 2010
United Nations, ‘International Migration and Development: Patterns, Problems, and Policy Directions’ (United
Nations, New York, 2006). Available at <http://www.un.org/esa/population/migration/hld/Text/UNU-
WIDERr.pdf> (7 December 2010).
Vigneswaran, D. and Duponchel, M., ‘One Burden Too Many? A Cost-Benefit Analysis of Immigration Policing
in Gauteng’ (Forced Migration Studies Programme, University of the Witwatersrand, Johannesburg,
2009). Available at <http://www.migration.org.za/sites/default/files/reports/2009/One_Burden_Too_
Many_FMSP_09_2.pdf > (7 December 2010).

Governing Migration & Urbanisation in South African Municipalities 56
Related Documents