researchfirst.co.nz Gore District Council Annual Residents’ Survey April 2021

Welcome message from author
This document is posted to help you gain knowledge. Please leave a comment to let me know what you think about it! Share it to your friends and learn new things together.
Transcript
researchfirst.co.nz
Gore District Council
Annual Residents’ Survey April 2021
2Commercial In Confidence
Annual Residents’ Survey 2021 researchfirst.co.nz
Disclaimer: Research First notes that the views presented in the report do not necessarily represent the views of Gore District Council. In addition, the information in this report is accurate to the best of the knowledge and belief of Research First Ltd. While Research First Ltd has exercised all reasonable skill and care in the preparation of information in this report, Research First Ltd accepts no liability in contract, tort, or otherwise for any loss, damage, injury or expense, whether direct, indirect, or consequential, arising out of the provision of information in this report.
1 Infographic Summary 32 Research Design 62.1 Context 72.2 Method 82.3 Sampling 92.4 Performance Targets and Satisfaction Measures 93 Wastewater and Stormwater 103.1 Wastewater and Stormwater 114 Water Services 134.1 Quality and Reliability 144.2 Water Restrictions 164.3 Comments about Water Services 185 Local Roads and Footpaths 195.1 Local Roads and Footpaths 206 Waste 236.1 Use of Waste Services 246.2 Satisfaction with Waste Services 257 Council Facilities 277.1 Use of Council Facilities 287.2 Satisfaction with Council Facilities 307.3 Satisfaction with Council Facilities – Trend Analysis 327.4 Resident Feedback 338 Council Planning 348.1 Council Planning 358.2 Post COVID-19 379 Contacting the Council 389.1 Methods of communication 399.2 Satisfaction with Communication 4010 Council Communications 4110.1 Methods of Obtaining Information 4210.2 Usage of Online Channels 4410.3 Satisfaction with Online Channels 4611 Elected Members and Organisational Performance 4711.1 Representation 4811.2 Overall Satisfaction with Performance 4911.3 Priority Issues 5111.4 Local Leadership 5212 Perceptions of the Gore District 5412.1 Perceptions of the Gore District 5512.2 Perceptions of the Gore District Trend Analysis 5612.3 Promoting the District 5713 Appendix One: Sample Composition 58

3
Annual Residents’ Survey 2021 researchfirst.co.nz
Infographic Summary
1
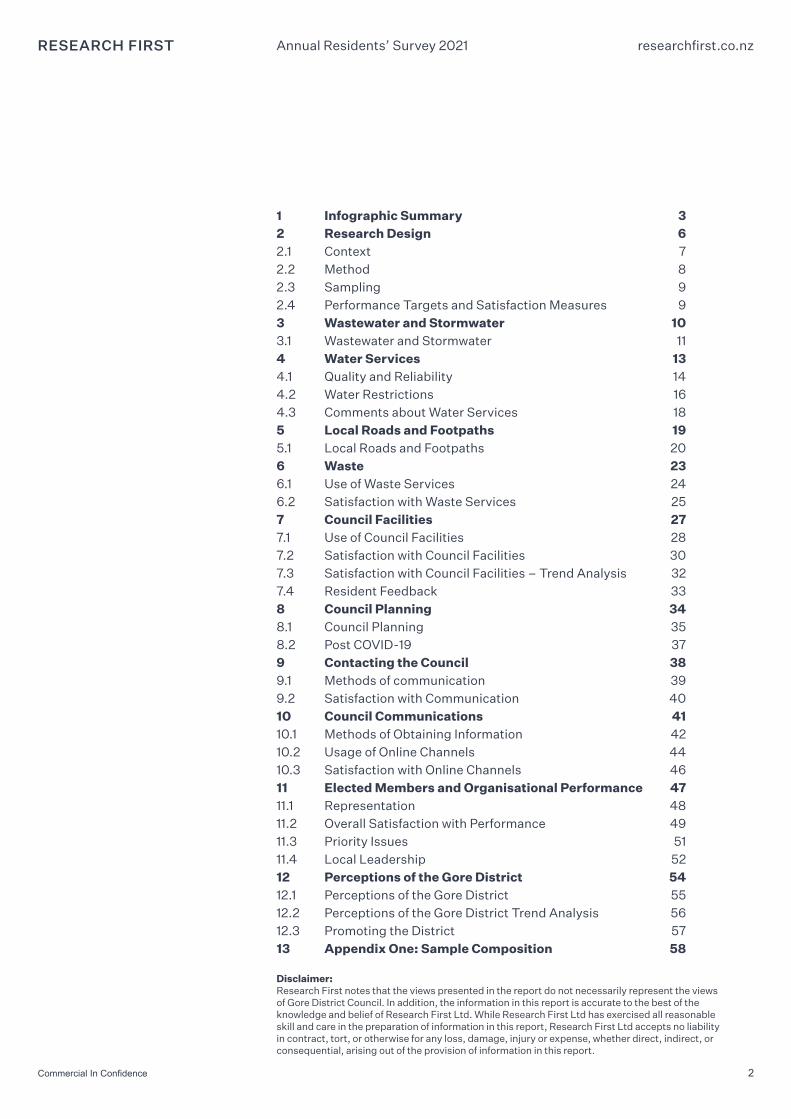
INFOGRAPHIC SUMMARY
4Commercial In Confidence
Annual Residents’ Survey 2021 researchfirst.co.nz
Satisfied with the wastewater service
Satisfied with the stormwater system
Satisfied with the reliability of
town water supplies
Satisfied with the quality of town water supplies
85%
Satisfied with local sealed
roads
67%
Satisfied with local gravel
roads
63%
Satisfied with local footpaths
69%75%
Satisfied with Gore Transfer Station
89%
Satisfied with Kerbside Recycling Service
49%92% 82%
98%
98%
98%
98%
97%
96%
95%
94%
92%
89%
87%
Hokonui Moonshine Museum, Eastern Southland Gallery or the heritage centre
MLT Event Centre
District Parks and Reserves
Sportsgrounds
Gore Aquatic Centre
Gore Visitor Centre
Playgrounds
Library service
Cemeteries
James Cumming Wing or community halls
Public Toilets
COUNCIL SERVICES
COUNCIL FACILITIES
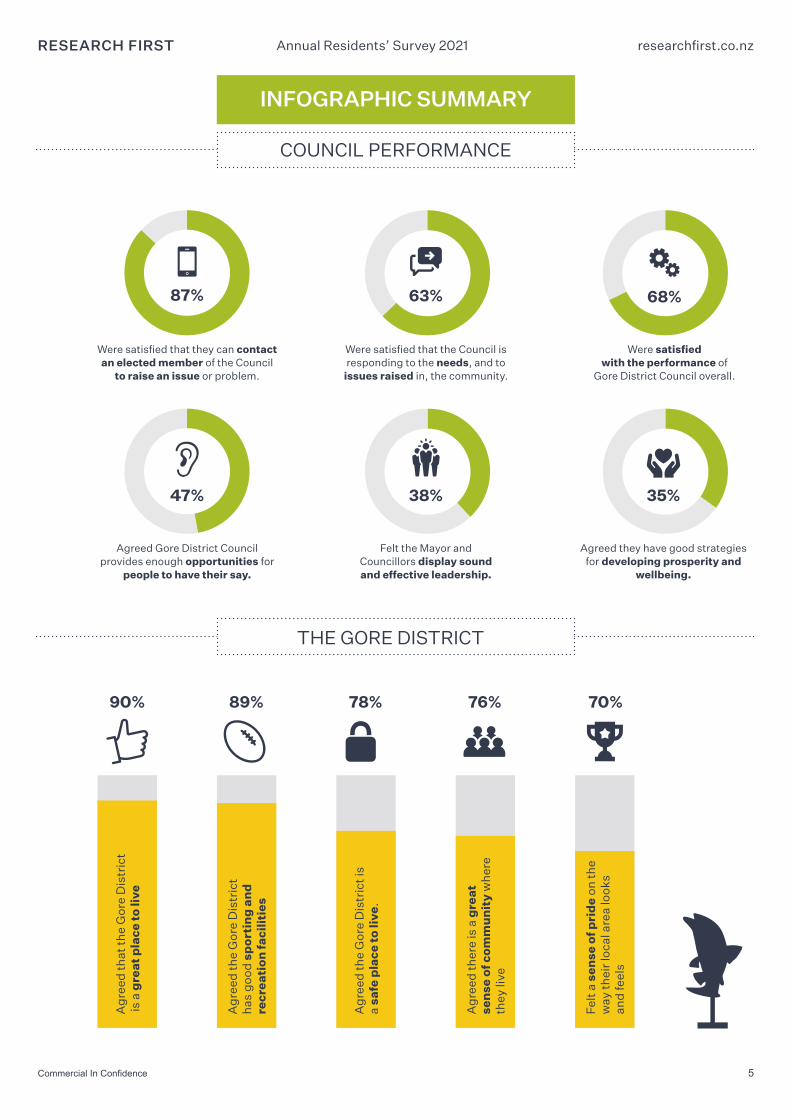
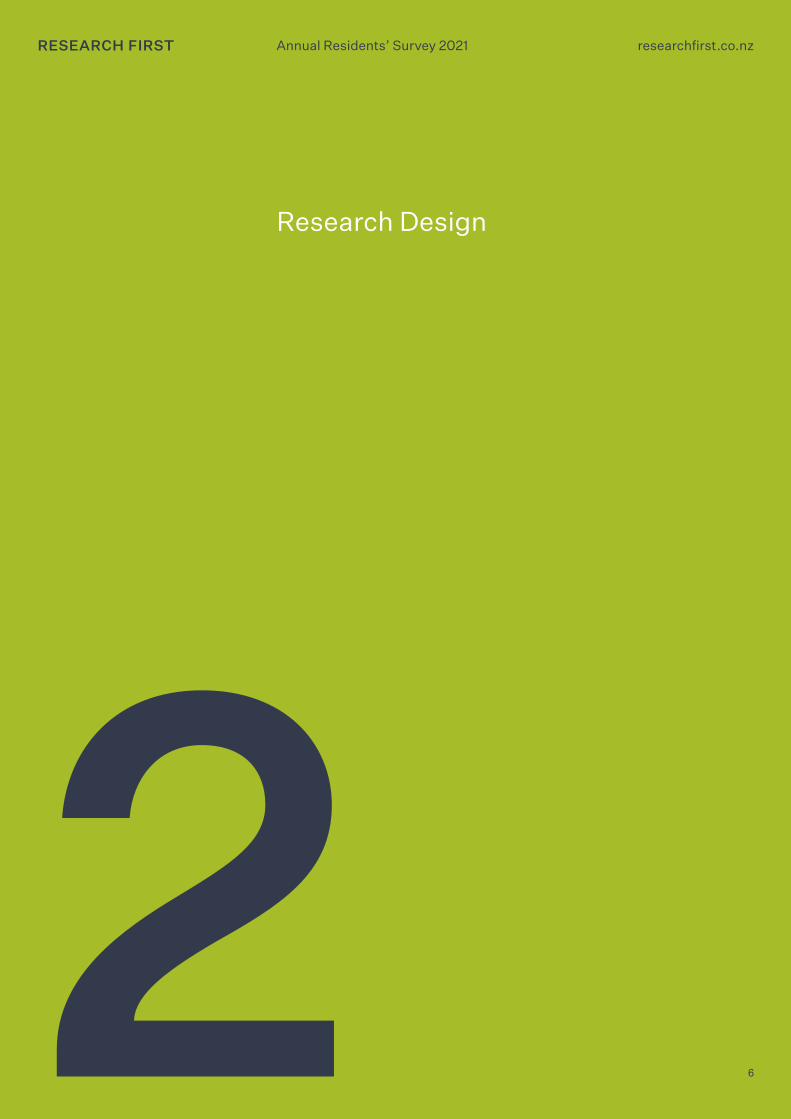
INFOGRAPHIC SUMMARY
5Commercial In Confidence
Annual Residents’ Survey 2021 researchfirst.co.nz
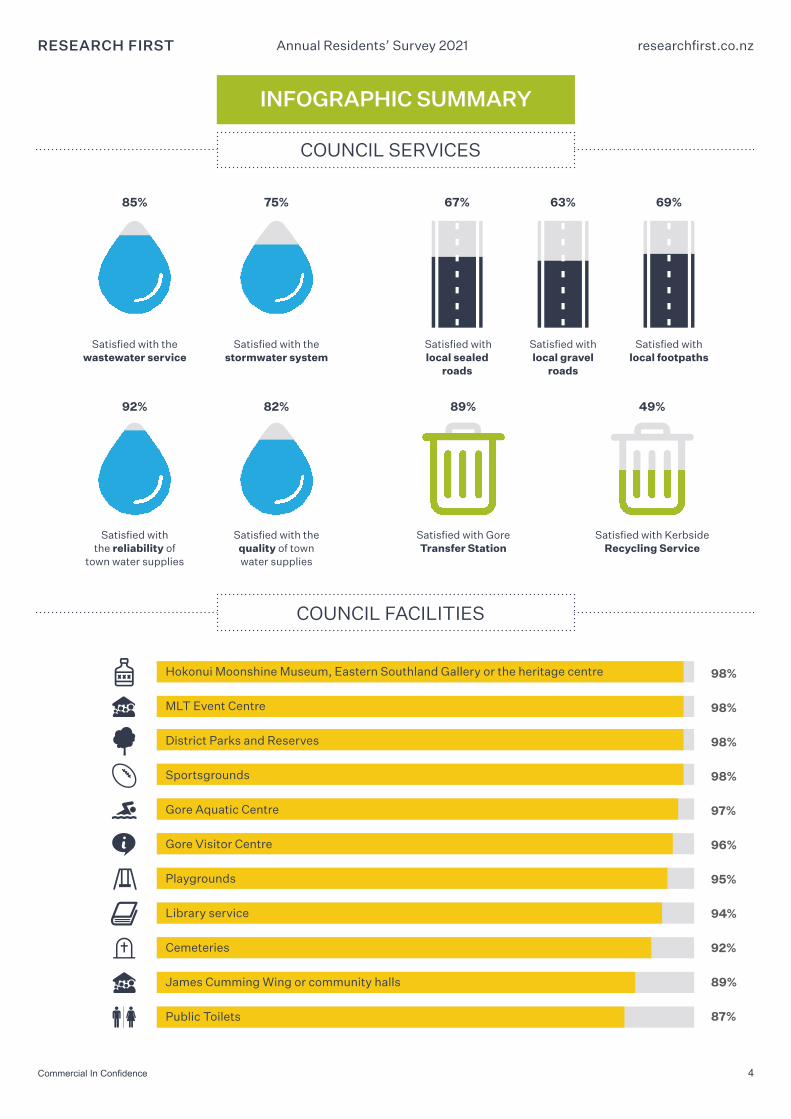
Were satisfied that the Council is responding to the needs, and to
issues raised in, the community.
63%
Agreed they have good strategies for developing prosperity and
wellbeing.
35%
Were satisfied with the performance of
Gore District Council overall.
68%
Agreed Gore District Council provides enough opportunities for
people to have their say.
47%
Felt the Mayor and Councillors display sound and effective leadership.
38%
THE GORE DISTRICT
COUNCIL PERFORMANCE
90% 89% 78% 76% 70%
Felt
a s
ense
of p
rid
e on
the
way
thei
r lo
cal a
rea
look
s
and
feel
s
Ag
reed
ther
e is
a g
reat
se
nse
of c
om
mu
nit
y w
her
e th
ey li
ve
Ag
reed
the
Gor
e D
istr
ict i
s
a sa
fe p
lace
to li
ve.
Ag
reed
the
Gor
e D
istr
ict
has
goo
d s
po
rtin
g a
nd
re
crea
tio
n fa
cilit
ies
Ag
reed
that
the
Gor
e D
istr
ict
is a
gre
at p
lace
to li
ve
Were satisfied that they can contact an elected member of the Council
to raise an issue or problem.
87%
6
Annual Residents’ Survey 2021 researchfirst.co.nz
2
Research Design
7Commercial In Confidence
Annual Residents’ Survey 2021 researchfirst.co.nz
2.1 ContextThe Gore District:
● Was formed in 1989, incorporating the former Gore and Mataura borough councils and part of the former Southland County Council.
● Has five electoral wards for the 11-member council, plus the mayor, who is elected at large.
● Covers 1,251 km².
● Has a capital value of over $2.6 billion with a strong agricultural-led economy.
● Has a population of 12,396 (2018 Census). Gore is the largest urban area, with a population of 7,518. Mataura has a population of 1,629.
Gore District Council commissions an annual survey of residents to find out what they think about specific services and facilities and how they feel about the District and Council’s performance.
The key service areas tested in the 2021 residents’ survey were:
● Wastewater and Stormwater Services
● Water Services
● Roading Services
● Waste Services
● Council Services
● Council Facilities
● Contacting the Council
● Council Communications
● Council Planning
● Elected Members and Organisational Performance
● Perceptions of the Gore District
8Commercial In Confidence
Annual Residents’ Survey 2021 researchfirst.co.nz
2.2 MethodIn line with the 2014 – 2020 surveys, the 2021 research was conducted both by phone and online.
Phone survey with online completion optionTelephone surveys are ideally suited to surveying large, geographically dispersed populations exactly like Gore’s. The data produced is the result of random sampling and is therefore free from self-selection bias; it can be considered statistically robust and levels of statistical confidence can be applied to the data.
An online channel for the survey was included to make the survey more inclusive. Residents contacted by phone who were unwilling or unable to complete the survey were offered to be sent an email containing a link to the online survey. This provided an alternative an option to participate for those with a preference for online completion.
Standalone online surveyThe research was also promoted across the district as an online survey that anyone could complete, including those without landlines or those who were not invited to take part in the random telephone sample. Communications to promote the online survey to a wider audience included:
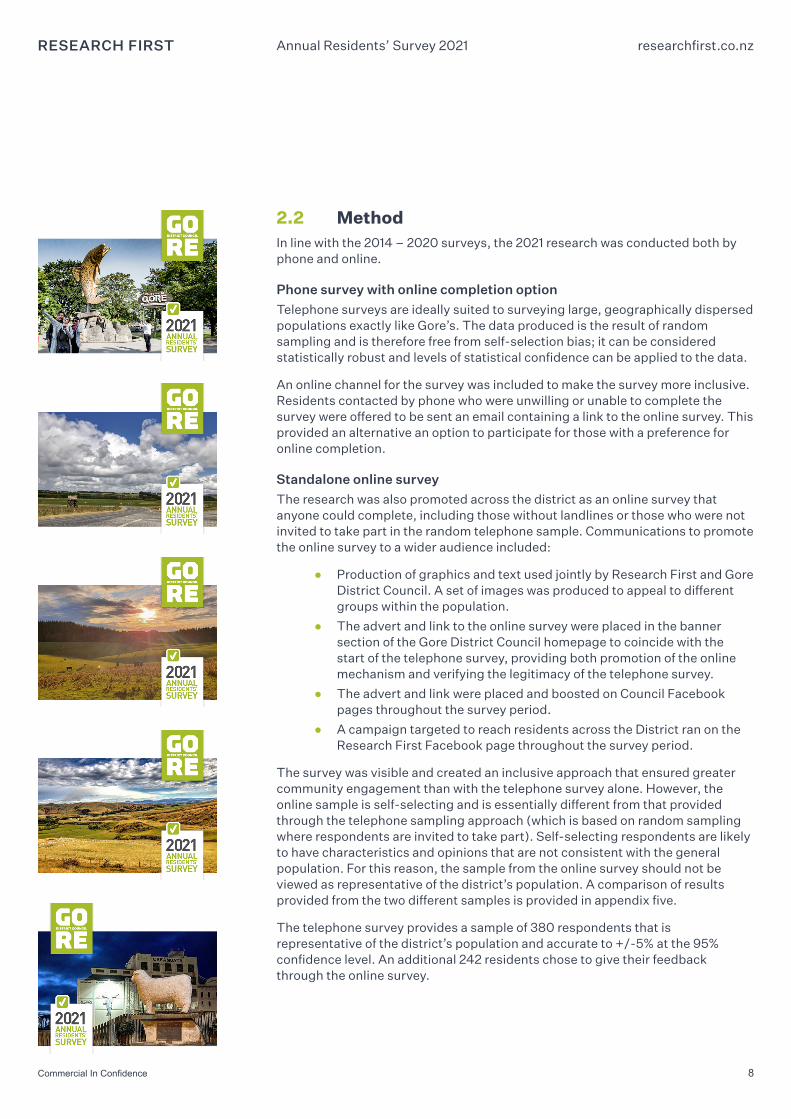
● Production of graphics and text used jointly by Research First and Gore District Council. A set of images was produced to appeal to different groups within the population.
● The advert and link to the online survey were placed in the banner section of the Gore District Council homepage to coincide with the start of the telephone survey, providing both promotion of the online mechanism and verifying the legitimacy of the telephone survey.
● The advert and link were placed and boosted on Council Facebook pages throughout the survey period.
● A campaign targeted to reach residents across the District ran on the Research First Facebook page throughout the survey period.
The survey was visible and created an inclusive approach that ensured greater community engagement than with the telephone survey alone. However, the online sample is self-selecting and is essentially different from that provided through the telephone sampling approach (which is based on random sampling where respondents are invited to take part). Self-selecting respondents are likely to have characteristics and opinions that are not consistent with the general population. For this reason, the sample from the online survey should not be viewed as representative of the district’s population. A comparison of results provided from the two different samples is provided in appendix five.
The telephone survey provides a sample of 380 respondents that is representative of the district’s population and accurate to +/-5% at the 95% confidence level. An additional 242 residents chose to give their feedback through the online survey.
9Commercial In Confidence
Annual Residents’ Survey 2021 researchfirst.co.nz
2.3 SamplingThe questionnaire was mostly consistent with the 2019 and 2020 surveys but included a new ‘hot topic section’ asking residents about what Council should do in response to Covid-19.
Data collection took place between February 24th and March 21st, 2021.
Data collection for the telephone survey was randomised within each household to ensure the sample included a range of respondents based on age, location and gender, with a quota system being used to ensure the sample was representative of the population, as per Census 2018 statistics.
2.4 Performance Targets and Satisfaction MeasuresLevels of resident satisfaction with services are measured in this report by first removing all respondents who answered, ‘don’t know’, ‘not applicable’ or similar.
Across all KPIs, the KPI measure of satisfaction is reported as the proportion answering neutral, satisfied or very satisfied.
To ensure consistency, where the total satisfied is reported for any service area, this is the proportion of residents that answered neutral, satisfied or very satisfied.
Where levels of agreement are reported, the total agreeing is the proportion that answered that they agreed or strongly agreed. In these cases, stating ‘neither agree nor disagree’ cannot be deemed as agreement.
In this report numbers presented have been rounded into whole numbers. Due to this rounding, individual figures may not add up precisely to the totals provided or to 100%.
10
Annual Residents’ Survey 2021 researchfirst.co.nz
3
Wastewater and Stormwater
11Commercial In Confidence
Annual Residents’ Survey 2021 researchfirst.co.nz
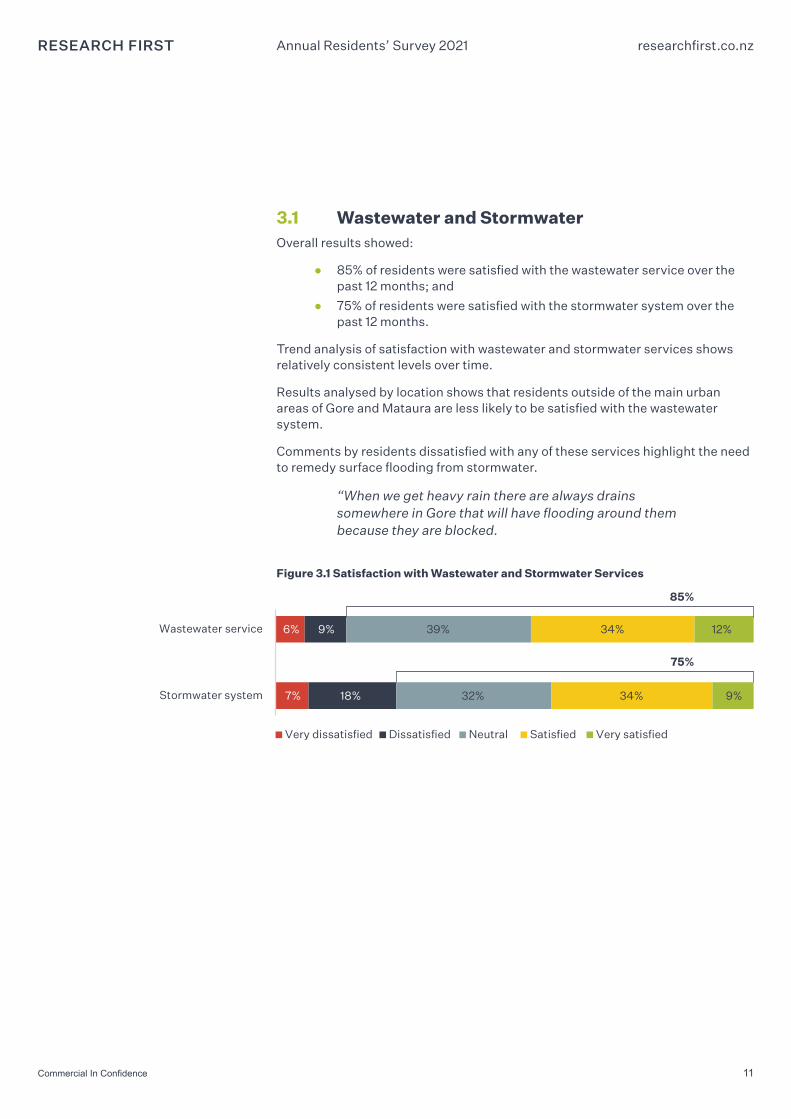
3.1 Wastewater and StormwaterOverall results showed:
● 85% of residents were satisfied with the wastewater service over the past 12 months; and
● 75% of residents were satisfied with the stormwater system over the past 12 months.
Trend analysis of satisfaction with wastewater and stormwater services shows relatively consistent levels over time.
Results analysed by location shows that residents outside of the main urban areas of Gore and Mataura are less likely to be satisfied with the wastewater system.
Comments by residents dissatisfied with any of these services highlight the need to remedy surface flooding from stormwater.
“When we get heavy rain there are always drains somewhere in Gore that will have flooding around them because they are blocked.
Figure 3.1 Satisfaction with Wastewater and Stormwater Services
7%
6%
18%
9%
32%
39%
34%
34%
9%
12%
Stormwater system
Wastewater service
Very dissatisfied Dissatisfied Neutral Satisfied Very satisfied
85%
75%
12Commercial In Confidence
Annual Residents’ Survey 2021 researchfirst.co.nz
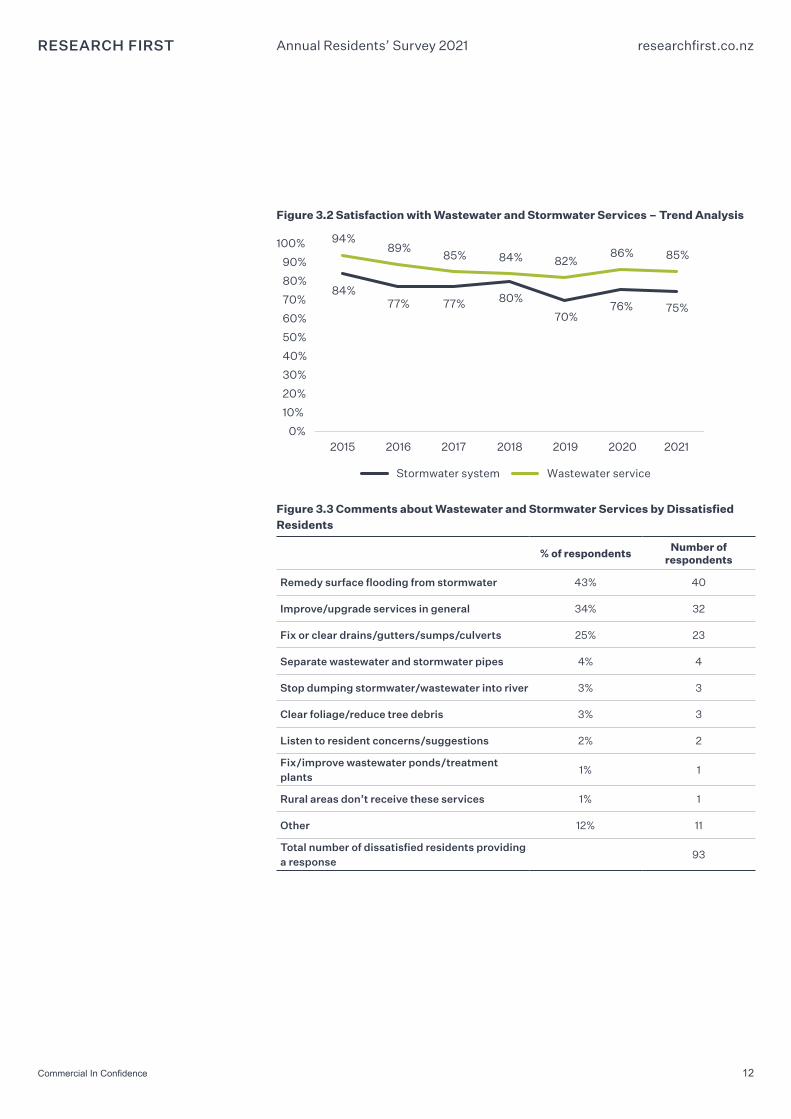
Figure 3.2 Satisfaction with Wastewater and Stormwater Services – Trend Analysis
84%77% 77% 80%
70%76% 75%
94%89%
85% 84% 82%86% 85%
0%
10%
20%
30%
40%
50%
60%
70%
80%
90%
100%
2015 2016 2017 2018 2019 2020 2021
Stormwater system Wastewater service
Figure 3.3 Comments about Wastewater and Stormwater Services by Dissatisfied Residents
% of respondents Number of respondents
Remedy surface flooding from stormwater 43% 40
Improve/upgrade services in general 34% 32
Fix or clear drains/gutters/sumps/culverts 25% 23
Separate wastewater and stormwater pipes 4% 4
Stop dumping stormwater/wastewater into river 3% 3
Clear foliage/reduce tree debris 3% 3
Listen to resident concerns/suggestions 2% 2
Fix/improve wastewater ponds/treatment plants
1% 1
Rural areas don’t receive these services 1% 1
Other 12% 11
Total number of dissatisfied residents providing a response
93
13
Annual Residents’ Survey 2021 researchfirst.co.nz
4
Water Services
14Commercial In Confidence
Annual Residents’ Survey 2021 researchfirst.co.nz
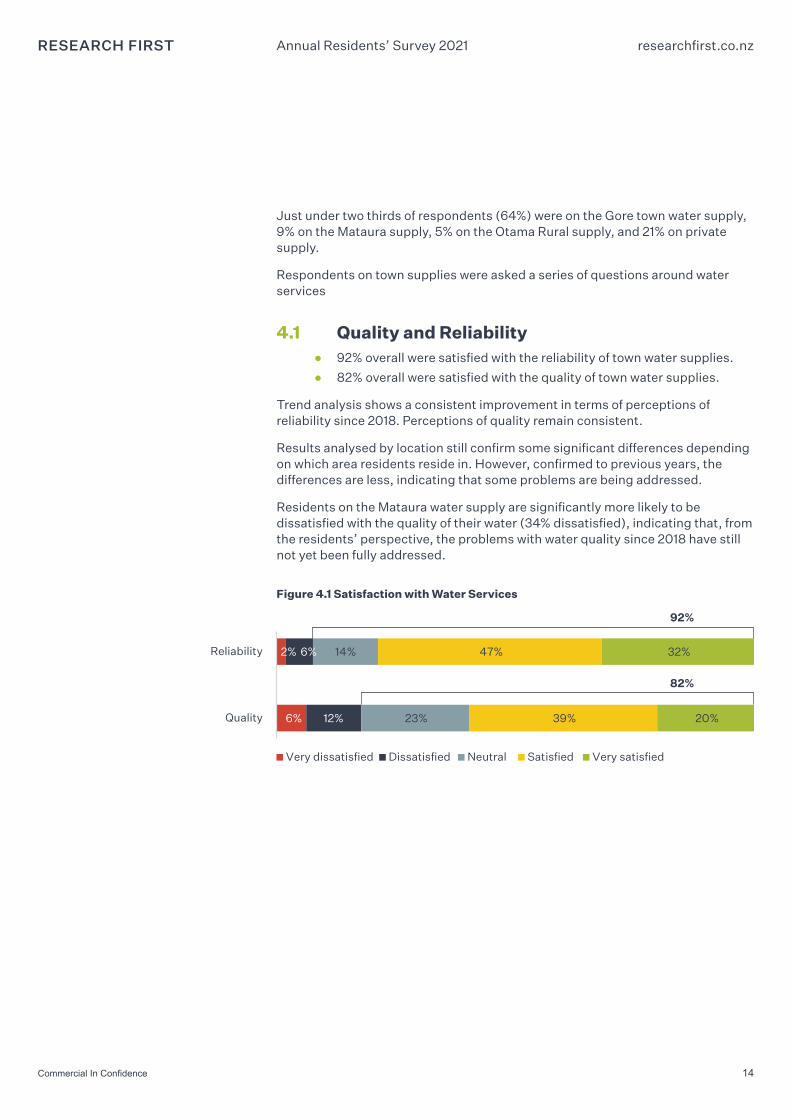
Just under two thirds of respondents (64%) were on the Gore town water supply, 9% on the Mataura supply, 5% on the Otama Rural supply, and 21% on private supply.
Respondents on town supplies were asked a series of questions around water services
4.1 Quality and Reliability ● 92% overall were satisfied with the reliability of town water supplies.
● 82% overall were satisfied with the quality of town water supplies.
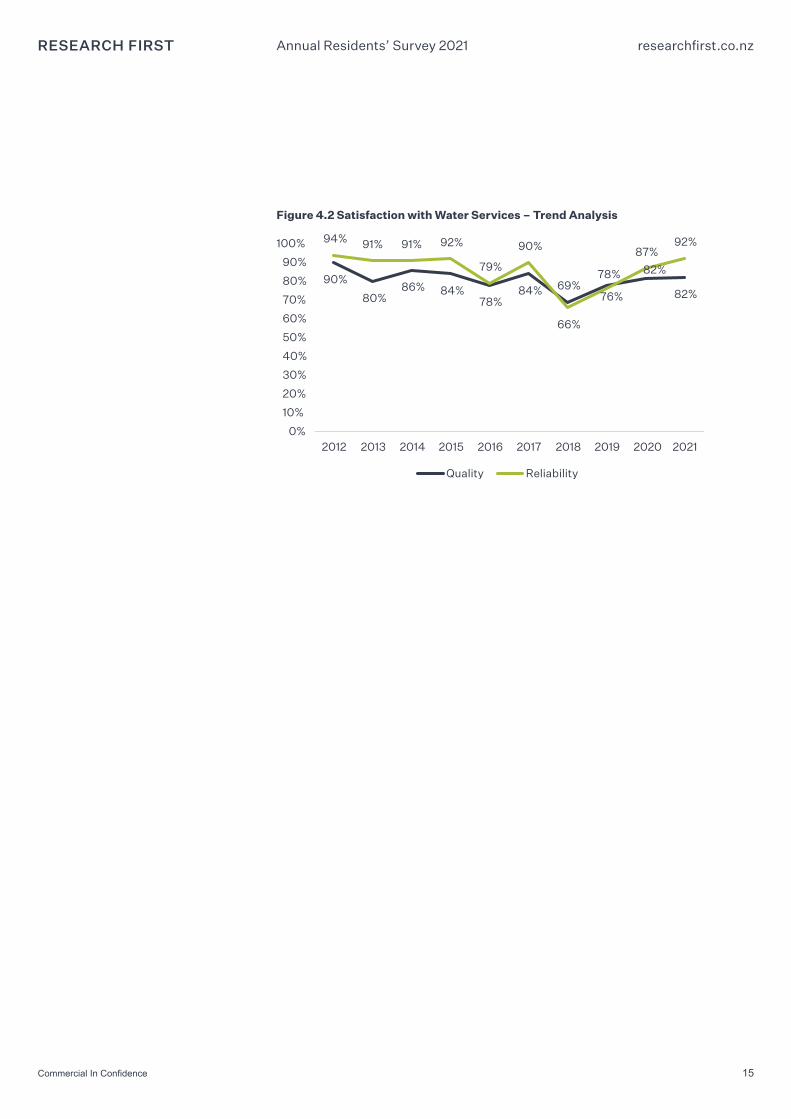
Trend analysis shows a consistent improvement in terms of perceptions of reliability since 2018. Perceptions of quality remain consistent.
Results analysed by location still confirm some significant differences depending on which area residents reside in. However, confirmed to previous years, the differences are less, indicating that some problems are being addressed.
Residents on the Mataura water supply are significantly more likely to be dissatisfied with the quality of their water (34% dissatisfied), indicating that, from the residents’ perspective, the problems with water quality since 2018 have still not yet been fully addressed.
Figure 4.1 Satisfaction with Water Services
6%
2%
12%
6%
23%
14%
39%
47%
20%
32%
Quality
Reliability
Very dissatisfied Dissatisfied Neutral Satisfied Very satisfied
92%
82%
15Commercial In Confidence
Annual Residents’ Survey 2021 researchfirst.co.nz
Figure 4.2 Satisfaction with Water Services – Trend Analysis
90%
80%86% 84%
78%84% 69%
78% 82%
82%
94% 91% 91% 92%
79%
90%
66%
76%
87%92%
0%
10%
20%
30%
40%
50%
60%
70%
80%
90%
100%
2012 2013 2014 2015 2016 2017 2018 2019 2020 2021
Quality Reliability
16Commercial In Confidence
Annual Residents’ Survey 2021 researchfirst.co.nz
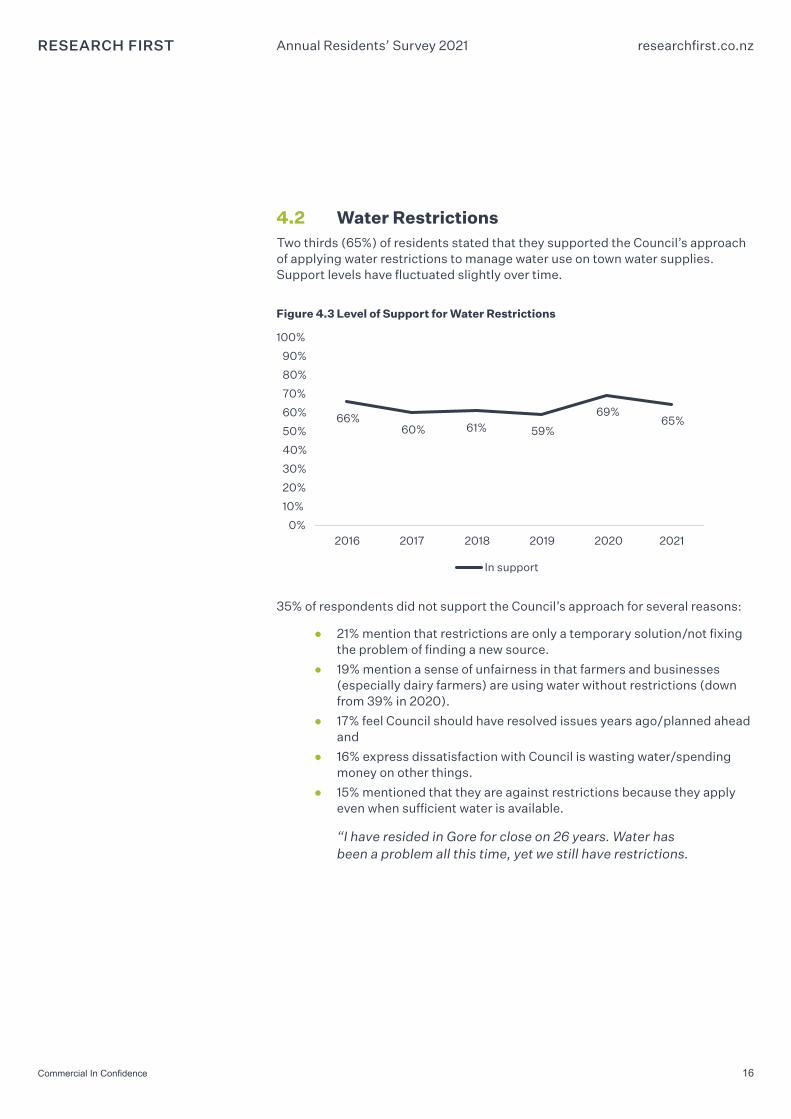
4.2 Water RestrictionsTwo thirds (65%) of residents stated that they supported the Council’s approach of applying water restrictions to manage water use on town water supplies. Support levels have fluctuated slightly over time.
Figure 4.3 Level of Support for Water Restrictions
66%60% 61% 59%
69%65%
0%
10%
20%
30%
40%
50%
60%
70%
80%
90%
100%
2016 2017 2018 2019 2020 2021
In support
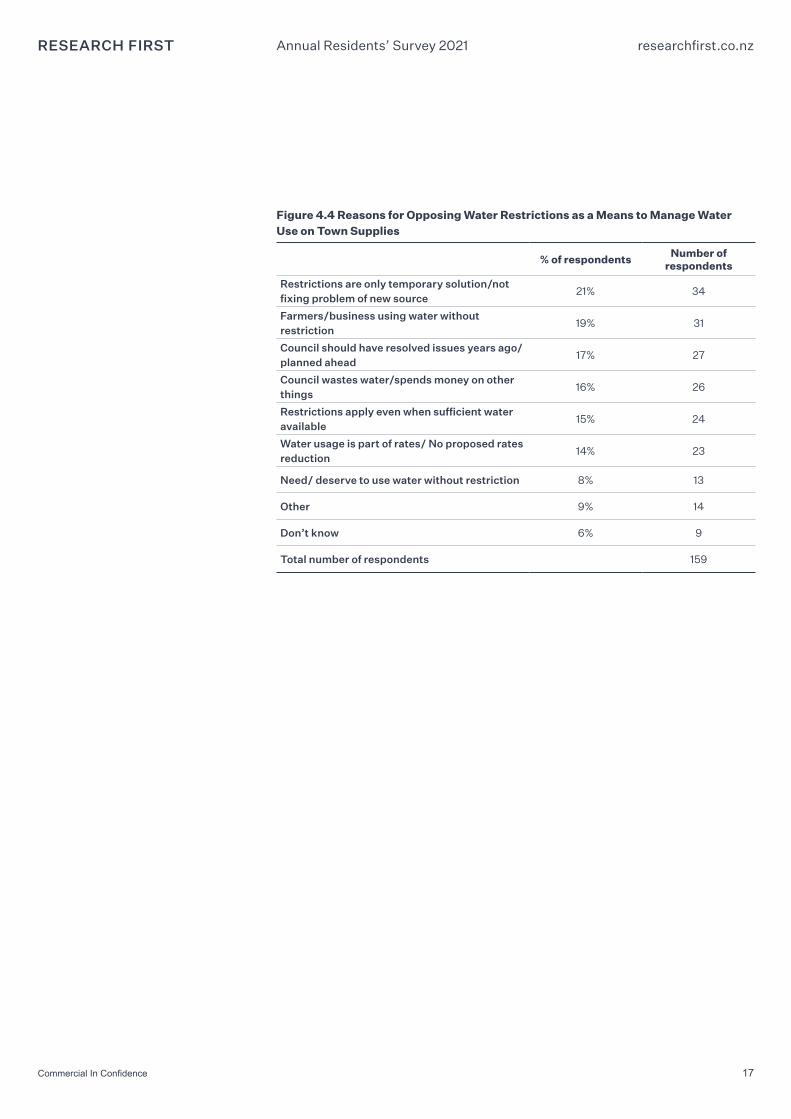
35% of respondents did not support the Council’s approach for several reasons:
● 21% mention that restrictions are only a temporary solution/not fixing the problem of finding a new source.
● 19% mention a sense of unfairness in that farmers and businesses (especially dairy farmers) are using water without restrictions (down from 39% in 2020).
● 17% feel Council should have resolved issues years ago/planned ahead and
● 16% express dissatisfaction with Council is wasting water/spending money on other things.
● 15% mentioned that they are against restrictions because they apply even when sufficient water is available.
“I have resided in Gore for close on 26 years. Water has been a problem all this time, yet we still have restrictions.
17Commercial In Confidence
Annual Residents’ Survey 2021 researchfirst.co.nz
Figure 4.4 Reasons for Opposing Water Restrictions as a Means to Manage Water Use on Town Supplies
% of respondents Number of respondents
Restrictions are only temporary solution/not fixing problem of new source
21% 34
Farmers/business using water without restriction
19% 31
Council should have resolved issues years ago/planned ahead
17% 27
Council wastes water/spends money on other things
16% 26
Restrictions apply even when sufficient water available
15% 24
Water usage is part of rates/ No proposed rates reduction
14% 23
Need/ deserve to use water without restriction 8% 13
Other 9% 14
Don’t know 6% 9
Total number of respondents 159
18Commercial In Confidence
Annual Residents’ Survey 2021 researchfirst.co.nz
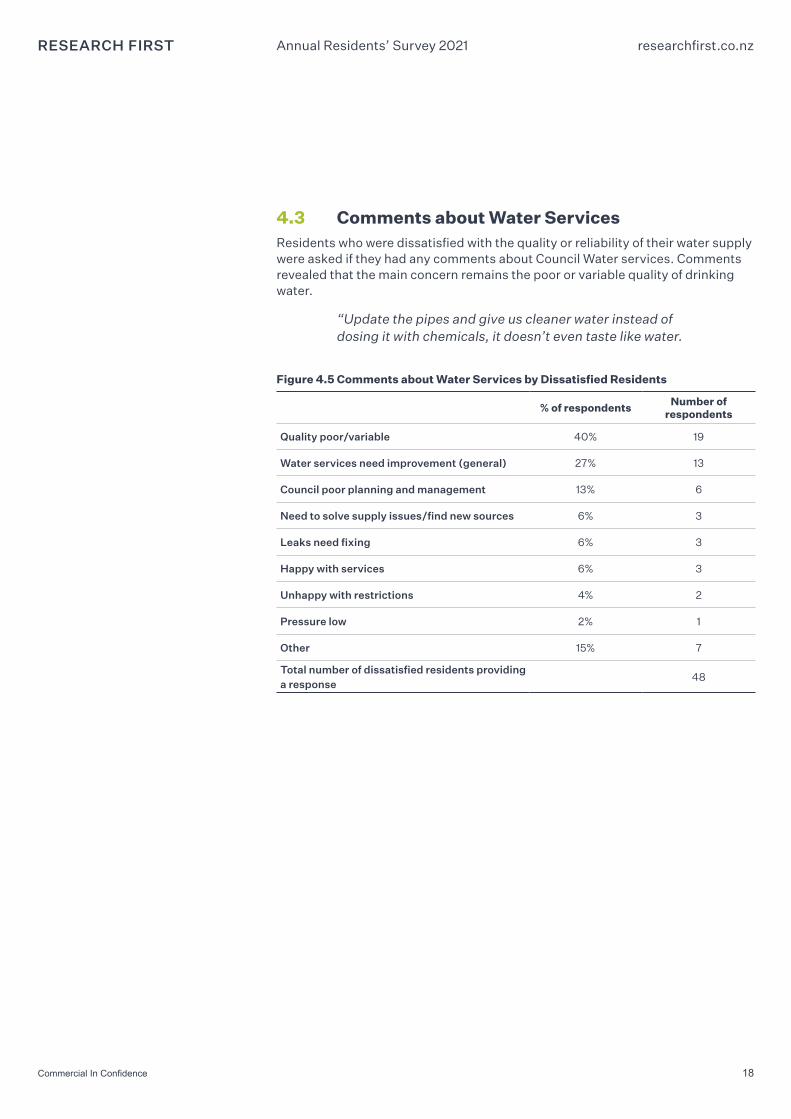
4.3 Comments about Water ServicesResidents who were dissatisfied with the quality or reliability of their water supply were asked if they had any comments about Council Water services. Comments revealed that the main concern remains the poor or variable quality of drinking water.
“Update the pipes and give us cleaner water instead of dosing it with chemicals, it doesn’t even taste like water.
Figure 4.5 Comments about Water Services by Dissatisfied Residents
% of respondents Number of respondents
Quality poor/variable 40% 19
Water services need improvement (general) 27% 13
Council poor planning and management 13% 6
Need to solve supply issues/find new sources 6% 3
Leaks need fixing 6% 3
Happy with services 6% 3
Unhappy with restrictions 4% 2
Pressure low 2% 1
Other 15% 7
Total number of dissatisfied residents providing a response
48
19
Annual Residents’ Survey 2021 researchfirst.co.nz
5
Local Roads and Footpaths
20Commercial In Confidence
Annual Residents’ Survey 2021 researchfirst.co.nz
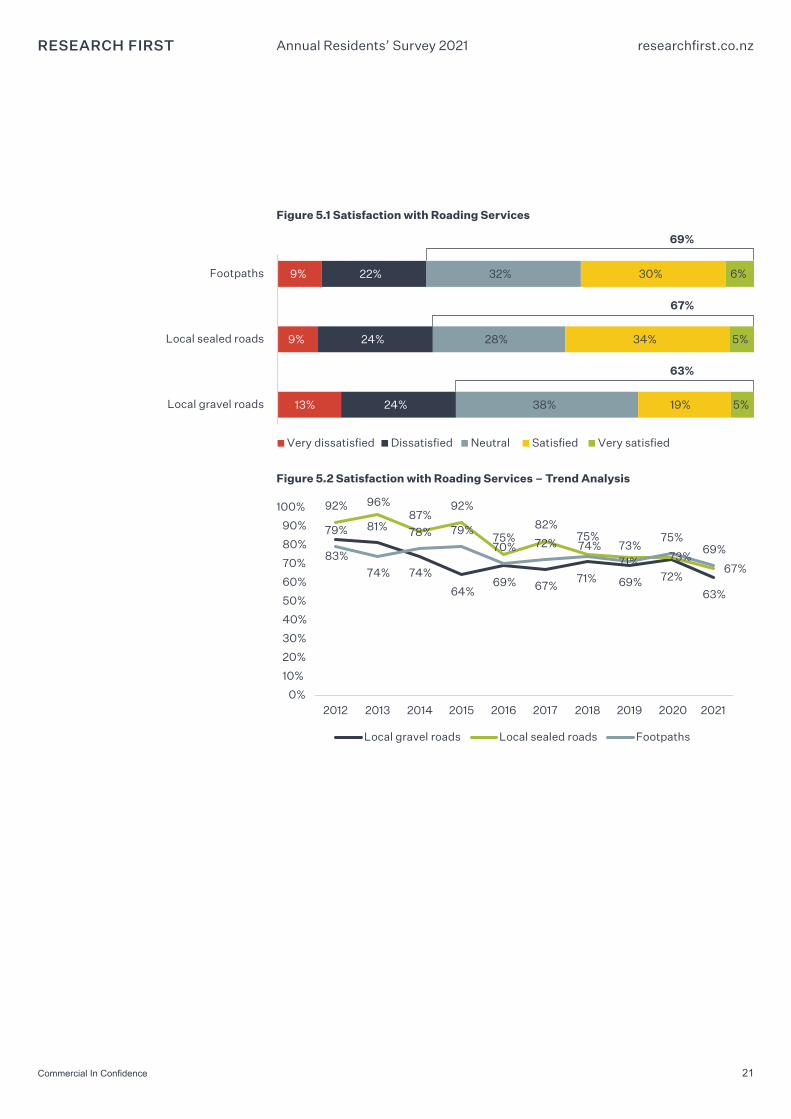
5.1 Local Roads and Footpaths ● 69% were satisfied with footpaths;
● 67% were satisfied with local sealed roads (11% below the 2020 performance target of 78% – performance target not met); and
● 63% were satisfied with local gravel roads.
Much like previous years, results also show that residents from different areas have slightly differing satisfaction levels.
● Residents outside of the main urban areas of Gore and Mataura were significantly less likely to be satisfied with local gravel roads (40% satisfied). This may be due to higher frequency of use.
● Residents in Gore and Mataura were significantly less likely to be satisfied with footpaths (65% satisfied).
Trend analysis shows a significant decrease in satisfaction levels since 2020 for all roading aspects.
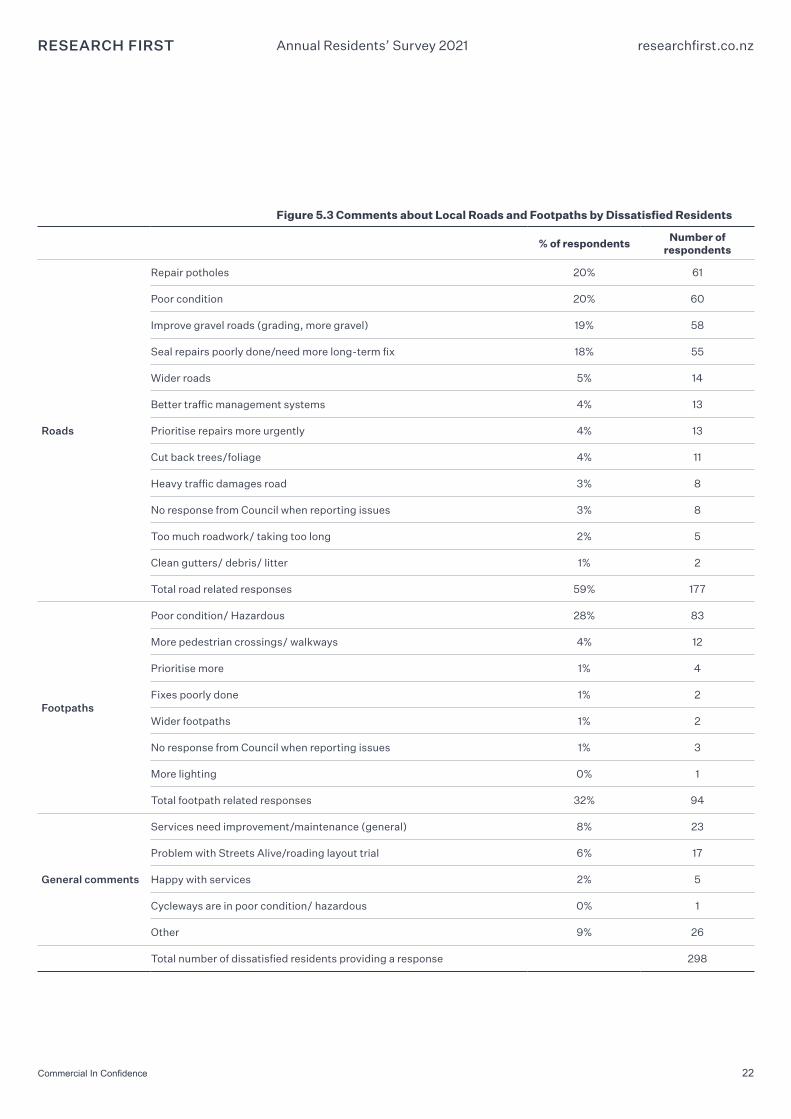
Reasons for dissatisfaction with roading mainly focused on the poor condition of sealed roads and potholes. Improving gravel roads was also highlighted as a priority.
“The amount of potholes in our sealed roads is ridiculous. There are constant holes no matter what part of town you’re in. It takes way too long to get fixed, just chuck up a few cones and leave it for another two weeks!.
Relatively high proportions of residents in the 2017 to 2021 surveys also mentioned the poor or hazardous conditions of footpaths in the open comments; this is an area of concern for residents.
“A lot of footpaths are hazardous, with bumps and cracks that people could trip on.
21Commercial In Confidence
Annual Residents’ Survey 2021 researchfirst.co.nz
Figure 5.1 Satisfaction with Roading Services
13%
9%
9%
24%
24%
22%
38%
28%
32%
19%
34%
30%
5%
5%
6%
Local gravel roads
Local sealed roads
Footpaths
Very dissatisfied Dissatisfied Neutral Satisfied Very satisfied
69%
67%
63%
Figure 5.2 Satisfaction with Roading Services – Trend Analysis
83%
81%
74%
64%69% 67%
71% 69% 72%
63%
92% 96%87%
92%
75%82%
75%73%
73%67%
79%
74%
78% 79%
70% 72% 74%71%
75%69%
0%
10%
20%
30%
40%
50%
60%
70%
80%
90%
100%
2012 2013 2014 2015 2016 2017 2018 2019 2020 2021
Local gravel roads Local sealed roads Footpaths
22Commercial In Confidence
Annual Residents’ Survey 2021 researchfirst.co.nz
Figure 5.3 Comments about Local Roads and Footpaths by Dissatisfied Residents
% of respondents Number of respondents
Roads
Repair potholes 20% 61
Poor condition 20% 60
Improve gravel roads (grading, more gravel) 19% 58
Seal repairs poorly done/need more long-term fix 18% 55
Wider roads 5% 14
Better traffic management systems 4% 13
Prioritise repairs more urgently 4% 13
Cut back trees/foliage 4% 11
Heavy traffic damages road 3% 8
No response from Council when reporting issues 3% 8
Too much roadwork/ taking too long 2% 5
Clean gutters/ debris/ litter 1% 2
Total road related responses 59% 177
Footpaths
Poor condition/ Hazardous 28% 83
More pedestrian crossings/ walkways 4% 12
Prioritise more 1% 4
Fixes poorly done 1% 2
Wider footpaths 1% 2
No response from Council when reporting issues 1% 3
More lighting 0% 1
Total footpath related responses 32% 94
General comments
Services need improvement/maintenance (general) 8% 23
Problem with Streets Alive/roading layout trial 6% 17
Happy with services 2% 5
Cycleways are in poor condition/ hazardous 0% 1
Other 9% 26
Total number of dissatisfied residents providing a response 298
23
Annual Residents’ Survey 2021 researchfirst.co.nz
6
Waste
24Commercial In Confidence
Annual Residents’ Survey 2021 researchfirst.co.nz
Respondents were asked a series of questions around waste services.
6.1 Use of Waste Services ● Half of respondents (53%) had visited Gore Transfer Station in the
previous 12 months.
● 60% of respondents used the kerbside recycling service.
All respondents were also asked whether they would like to see the introduction of a kerbside service into rural areas of the Gore District:
● Two-fifths of respondents (43%) would like to see the kerbside service in rural areas. This is the lowest it has been since 2016 (45% in 2020, 48% in 2019, 49% in 2018, 52% in 2017 and 47% in 2016);
● 33% stated that it was not their concern;
● 16% did not want the service expanded; and
● 8% did not know.
Residents in rural areas were significantly less likely to have used any of the services (27% had used the Gore Transfer Station, and 8% used the recycling service). They were also more likely to have an opinion on the introduction of a rural kerbside service (90%) than residents in Gore or Mataura.
25Commercial In Confidence
Annual Residents’ Survey 2021 researchfirst.co.nz
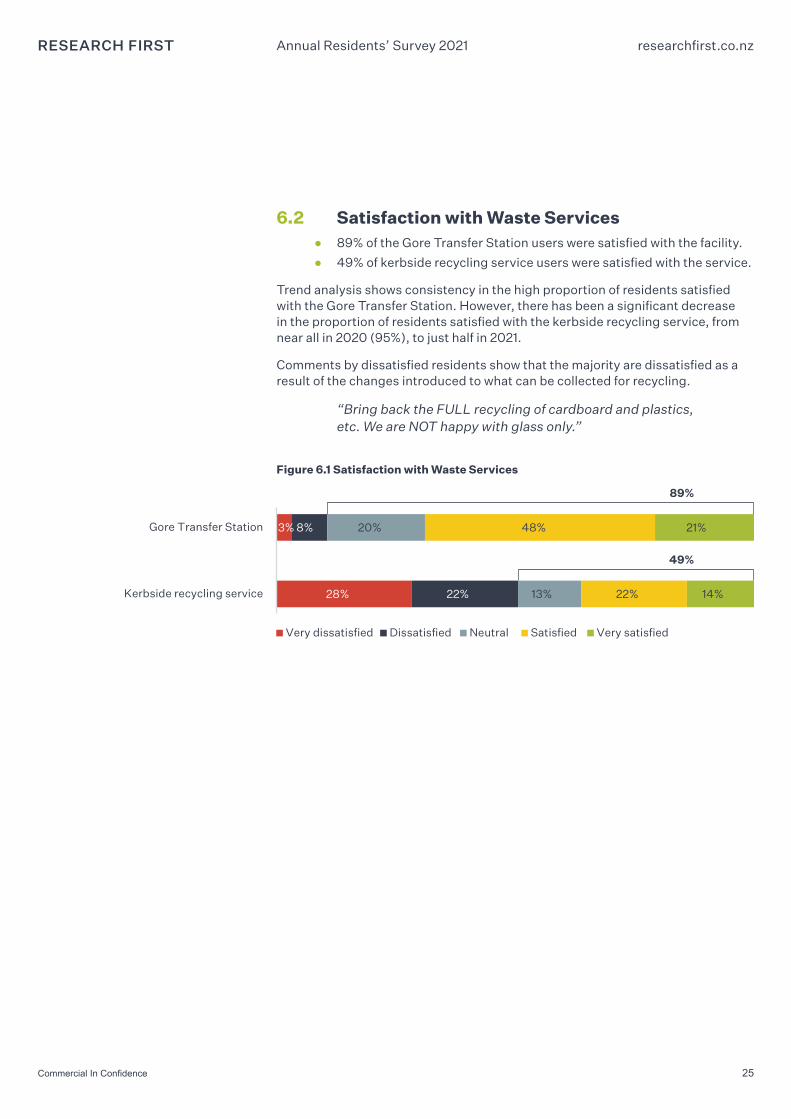
6.2 Satisfaction with Waste Services ● 89% of the Gore Transfer Station users were satisfied with the facility.
● 49% of kerbside recycling service users were satisfied with the service.
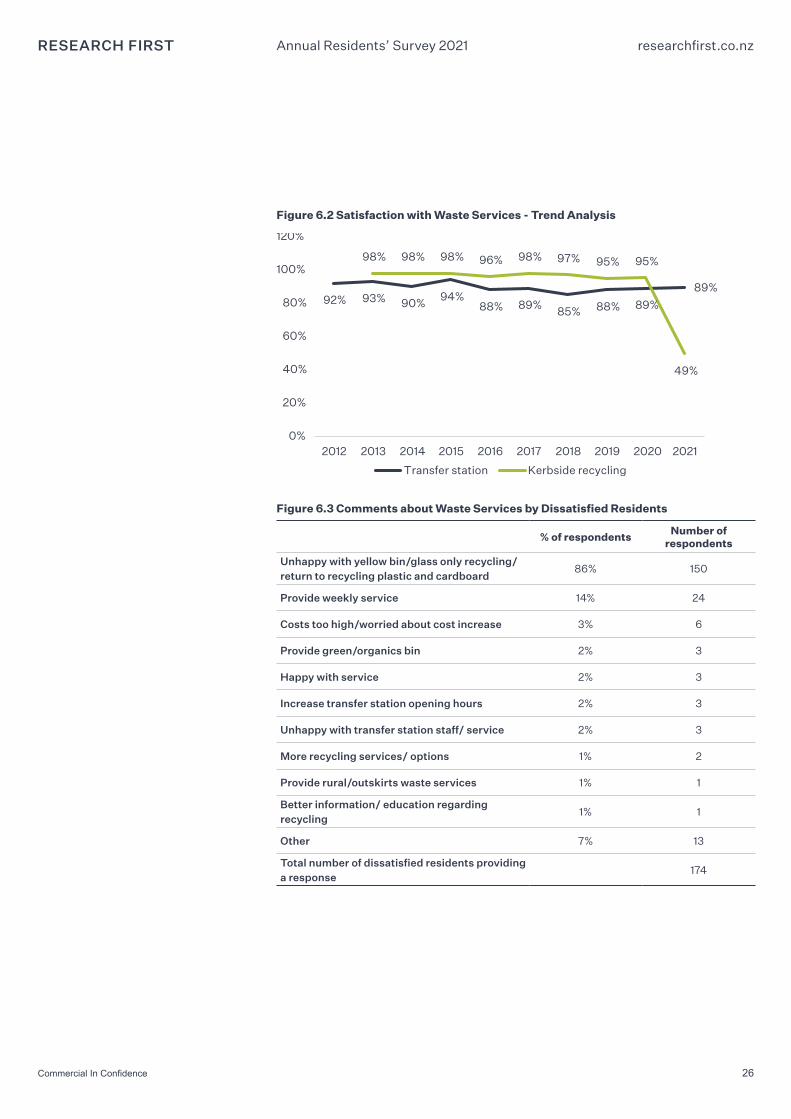
Trend analysis shows consistency in the high proportion of residents satisfied with the Gore Transfer Station. However, there has been a significant decrease in the proportion of residents satisfied with the kerbside recycling service, from near all in 2020 (95%), to just half in 2021.
Comments by dissatisfied residents show that the majority are dissatisfied as a result of the changes introduced to what can be collected for recycling.
“Bring back the FULL recycling of cardboard and plastics, etc. We are NOT happy with glass only.”
Figure 6.1 Satisfaction with Waste Services
3%
28%
8%
22%
20%
13%
48%
22%
21%
14%
Gore Transfer Station
Kerbside recycling service
Very dissatisfied Dissatisfied Neutral Satisfied Very satisfied
89%
49%
26Commercial In Confidence
Annual Residents’ Survey 2021 researchfirst.co.nz
Figure 6.2 Satisfaction with Waste Services - Trend Analysis
92% 93% 90% 94%88% 89% 85% 88% 89%
89%
98% 98% 98% 96% 98% 97% 95% 95%
49%
0%
20%
40%
60%
80%
100%
120%
2012 2013 2014 2015 2016 2017 2018 2019 2020 2021
Transfer station Kerbside recycling
Figure 6.3 Comments about Waste Services by Dissatisfied Residents
% of respondents Number of respondents
Unhappy with yellow bin/glass only recycling/return to recycling plastic and cardboard
86% 150
Provide weekly service 14% 24
Costs too high/worried about cost increase 3% 6
Provide green/organics bin 2% 3
Happy with service 2% 3
Increase transfer station opening hours 2% 3
Unhappy with transfer station staff/ service 2% 3
More recycling services/ options 1% 2
Provide rural/outskirts waste services 1% 1
Better information/ education regarding recycling
1% 1
Other 7% 13
Total number of dissatisfied residents providing a response
174
27
Annual Residents’ Survey 2021 researchfirst.co.nz
7
Council Facilities
28Commercial In Confidence
Annual Residents’ Survey 2021 researchfirst.co.nz
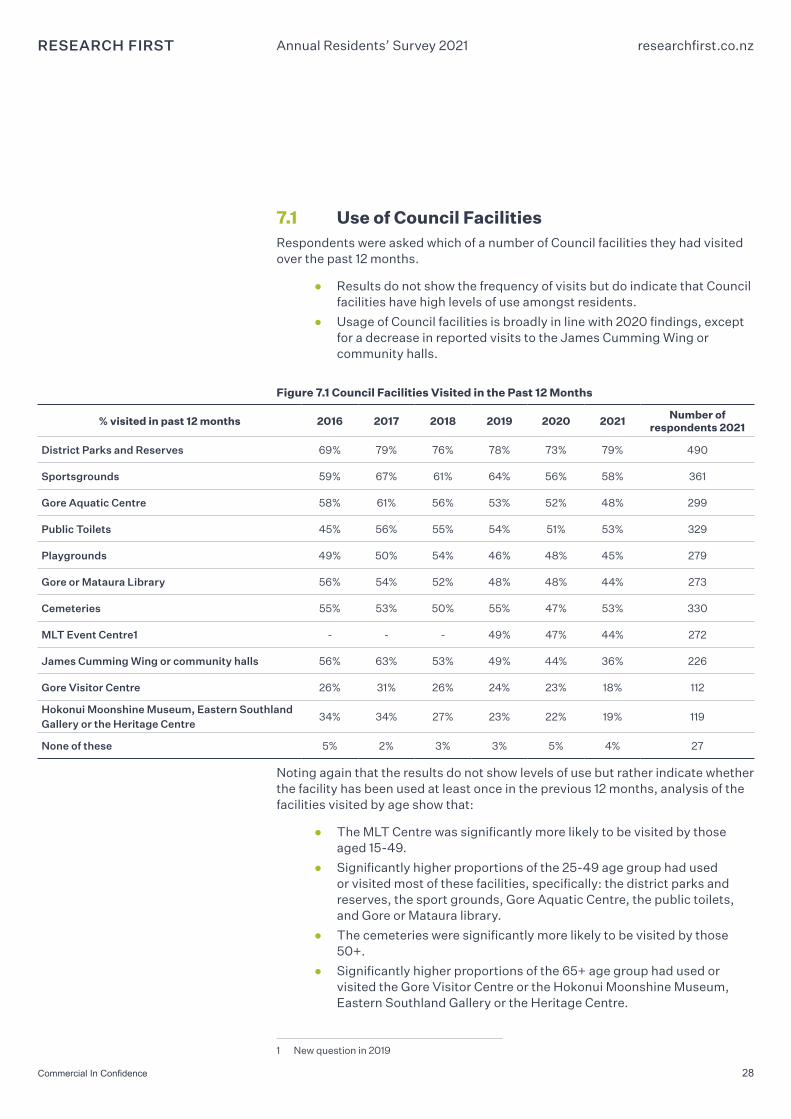
7.1 Use of Council FacilitiesRespondents were asked which of a number of Council facilities they had visited over the past 12 months.
● Results do not show the frequency of visits but do indicate that Council facilities have high levels of use amongst residents.
● Usage of Council facilities is broadly in line with 2020 findings, except for a decrease in reported visits to the James Cumming Wing or community halls.
Figure 7.1 Council Facilities Visited in the Past 12 Months
% visited in past 12 months 2016 2017 2018 2019 2020 2021 Number of respondents 2021
District Parks and Reserves 69% 79% 76% 78% 73% 79% 490
Sportsgrounds 59% 67% 61% 64% 56% 58% 361
Gore Aquatic Centre 58% 61% 56% 53% 52% 48% 299
Public Toilets 45% 56% 55% 54% 51% 53% 329
Playgrounds 49% 50% 54% 46% 48% 45% 279
Gore or Mataura Library 56% 54% 52% 48% 48% 44% 273
Cemeteries 55% 53% 50% 55% 47% 53% 330
MLT Event Centre1 - - - 49% 47% 44% 272
James Cumming Wing or community halls 56% 63% 53% 49% 44% 36% 226
Gore Visitor Centre 26% 31% 26% 24% 23% 18% 112
Hokonui Moonshine Museum, Eastern Southland Gallery or the Heritage Centre
34% 34% 27% 23% 22% 19% 119
None of these 5% 2% 3% 3% 5% 4% 27
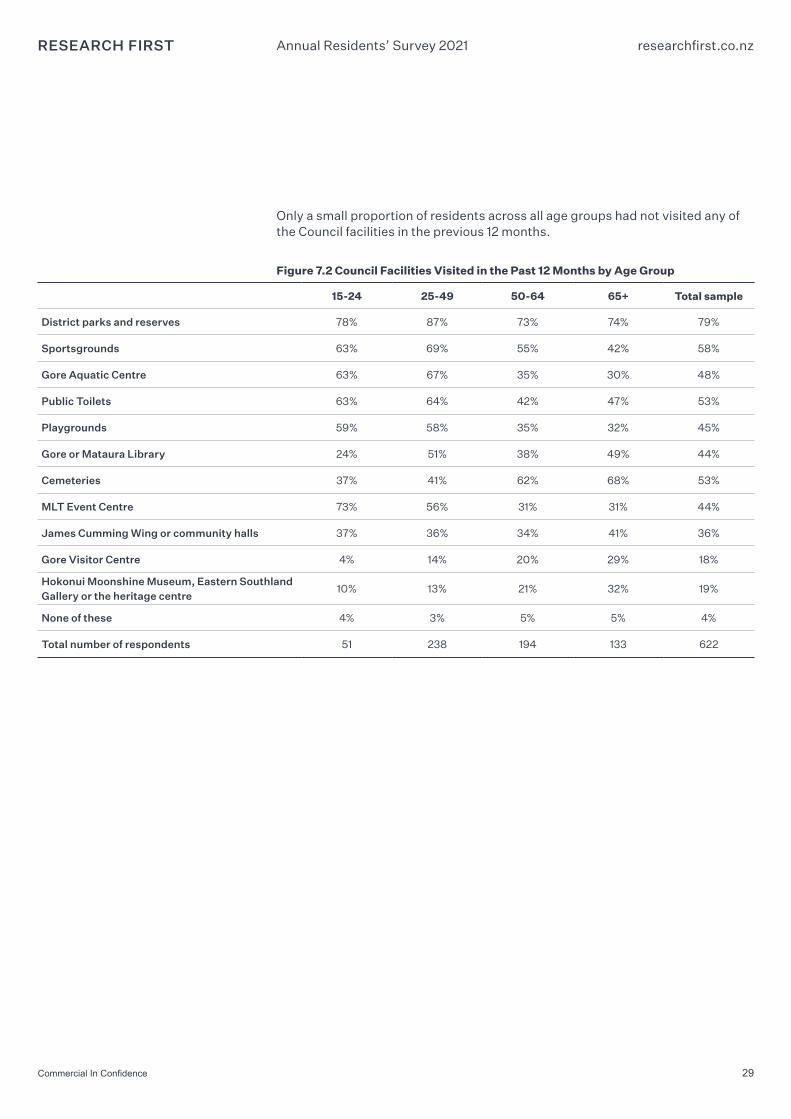
Noting again that the results do not show levels of use but rather indicate whether the facility has been used at least once in the previous 12 months, analysis of the facilities visited by age show that:
● The MLT Centre was significantly more likely to be visited by those aged 15-49.
● Significantly higher proportions of the 25-49 age group had used or visited most of these facilities, specifically: the district parks and reserves, the sport grounds, Gore Aquatic Centre, the public toilets, and Gore or Mataura library.
● The cemeteries were significantly more likely to be visited by those 50+.
● Significantly higher proportions of the 65+ age group had used or visited the Gore Visitor Centre or the Hokonui Moonshine Museum, Eastern Southland Gallery or the Heritage Centre.
1 New question in 2019
29Commercial In Confidence
Annual Residents’ Survey 2021 researchfirst.co.nz
Only a small proportion of residents across all age groups had not visited any of the Council facilities in the previous 12 months.
Figure 7.2 Council Facilities Visited in the Past 12 Months by Age Group
15-24 25-49 50-64 65+ Total sample
District parks and reserves 78% 87% 73% 74% 79%
Sportsgrounds 63% 69% 55% 42% 58%
Gore Aquatic Centre 63% 67% 35% 30% 48%
Public Toilets 63% 64% 42% 47% 53%
Playgrounds 59% 58% 35% 32% 45%
Gore or Mataura Library 24% 51% 38% 49% 44%
Cemeteries 37% 41% 62% 68% 53%
MLT Event Centre 73% 56% 31% 31% 44%
James Cumming Wing or community halls 37% 36% 34% 41% 36%
Gore Visitor Centre 4% 14% 20% 29% 18%
Hokonui Moonshine Museum, Eastern Southland Gallery or the heritage centre
10% 13% 21% 32% 19%
None of these 4% 3% 5% 5% 4%
Total number of respondents 51 238 194 133 622
30Commercial In Confidence
Annual Residents’ Survey 2021 researchfirst.co.nz
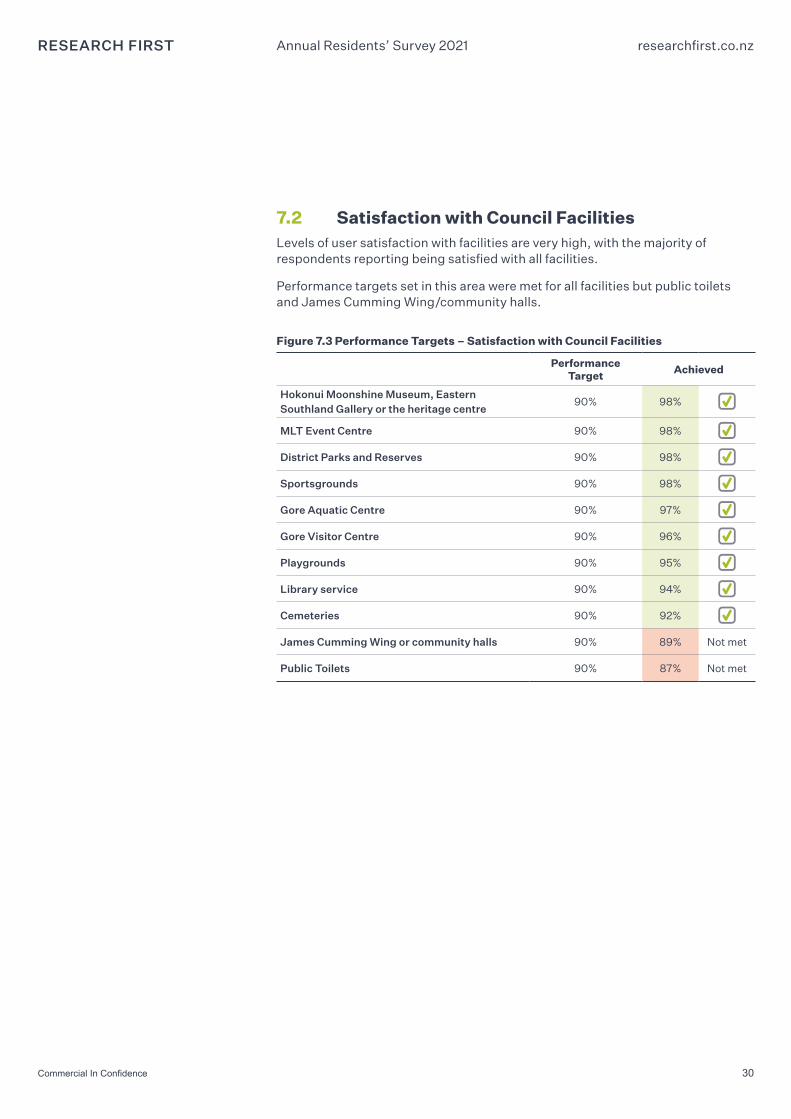
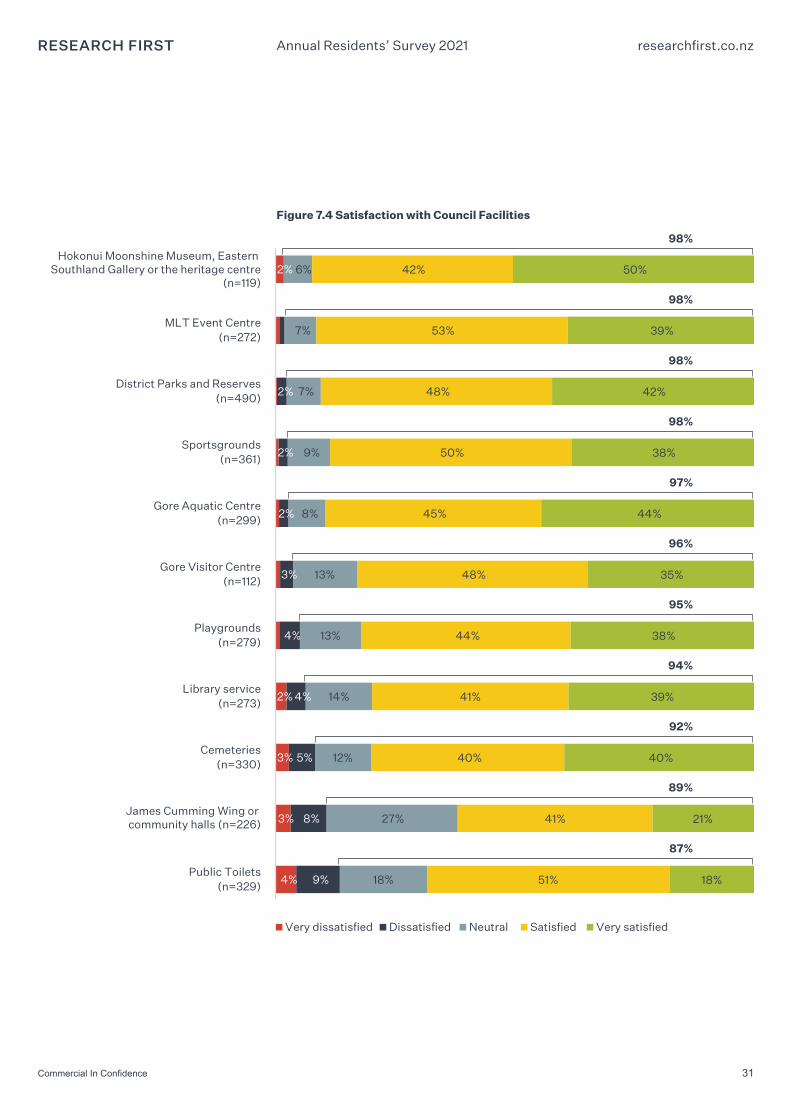
7.2 Satisfaction with Council FacilitiesLevels of user satisfaction with facilities are very high, with the majority of respondents reporting being satisfied with all facilities.
Performance targets set in this area were met for all facilities but public toilets and James Cumming Wing/community halls.
Figure 7.3 Performance Targets – Satisfaction with Council Facilities
Performance Target Achieved
Hokonui Moonshine Museum, Eastern Southland Gallery or the heritage centre
90% 98%
MLT Event Centre 90% 98%
District Parks and Reserves 90% 98%
Sportsgrounds 90% 98%
Gore Aquatic Centre 90% 97%
Gore Visitor Centre 90% 96%
Playgrounds 90% 95%
Library service 90% 94%
Cemeteries 90% 92%
James Cumming Wing or community halls 90% 89% Not met
Public Toilets 90% 87% Not met
31Commercial In Confidence
Annual Residents’ Survey 2021 researchfirst.co.nz
Figure 7.4 Satisfaction with Council Facilities
2%
2%
3%
3%
4%
2%
2%
2%
3%
4%
4%
5%
8%
9%
6%
7%
7%
9%
8%
13%
13%
14%
12%
27%
18%
42%
53%
48%
50%
45%
48%
44%
41%
40%
41%
51%
50%
39%
42%
38%
44%
35%
38%
39%
40%
21%
18%
Hokonui Moonshine Museum, Eastern Southland Gallery or the heritage centre
(n=119)
MLT Event Centre(n=272)
District Parks and Reserves(n=490)
Sportsgrounds(n=361)
Gore Aquatic Centre(n=299)
Gore Visitor Centre(n=112)
Playgrounds(n=279)
Library service(n=273)
Cemeteries(n=330)
James Cumming Wing or community halls (n=226)
Public Toilets(n=329)
Very dissatisfied Dissatisfied Neutral Satisfied Very satisfied
98%
98%
98%
98%
97%
96%
95%
94%
92%
89%
87%
32Commercial In Confidence
Annual Residents’ Survey 2021 researchfirst.co.nz
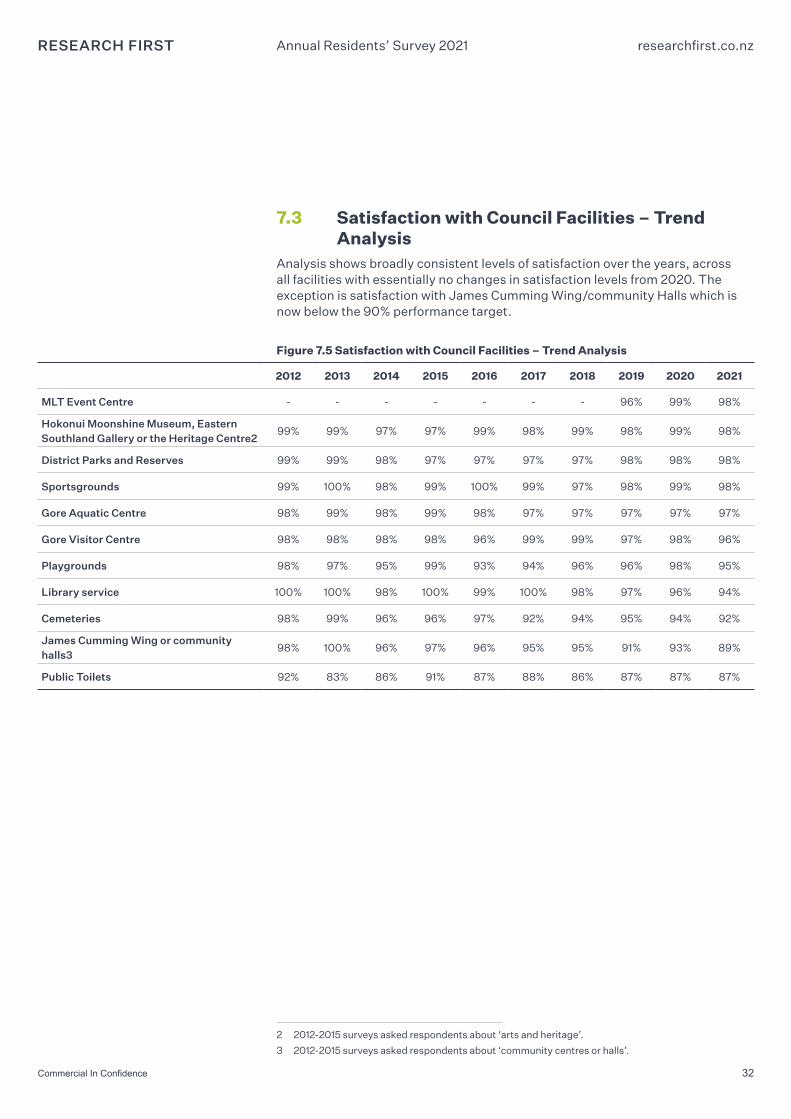
7.3 Satisfaction with Council Facilities – Trend Analysis
Analysis shows broadly consistent levels of satisfaction over the years, across all facilities with essentially no changes in satisfaction levels from 2020. The exception is satisfaction with James Cumming Wing/community Halls which is now below the 90% performance target.
Figure 7.5 Satisfaction with Council Facilities – Trend Analysis
2012 2013 2014 2015 2016 2017 2018 2019 2020 2021
MLT Event Centre - - - - - - - 96% 99% 98%
Hokonui Moonshine Museum, Eastern Southland Gallery or the Heritage Centre2
99% 99% 97% 97% 99% 98% 99% 98% 99% 98%
District Parks and Reserves 99% 99% 98% 97% 97% 97% 97% 98% 98% 98%
Sportsgrounds 99% 100% 98% 99% 100% 99% 97% 98% 99% 98%
Gore Aquatic Centre 98% 99% 98% 99% 98% 97% 97% 97% 97% 97%
Gore Visitor Centre 98% 98% 98% 98% 96% 99% 99% 97% 98% 96%
Playgrounds 98% 97% 95% 99% 93% 94% 96% 96% 98% 95%
Library service 100% 100% 98% 100% 99% 100% 98% 97% 96% 94%
Cemeteries 98% 99% 96% 96% 97% 92% 94% 95% 94% 92%
James Cumming Wing or community halls3
98% 100% 96% 97% 96% 95% 95% 91% 93% 89%
Public Toilets 92% 83% 86% 91% 87% 88% 86% 87% 87% 87%
2 2012-2015 surveys asked respondents about ‘arts and heritage’.
3 2012-2015 surveys asked respondents about ‘community centres or halls’.
33Commercial In Confidence
Annual Residents’ Survey 2021 researchfirst.co.nz
7.4 Resident FeedbackResidents who were dissatisfied with any of these services were invited to comment on these individual facilities or the facilities in general. 71 residents chose to give a comment across the various services which generally focused on the need for better maintenance. A minority also expressed dissatisfaction about the new location of the library being permanently in James Cumming Wing.
“The public toilets are a bit dingy.
“The cemetery could do with better maintenance, last time I was there the grass hadn’t been cut in weeks.
“Put the library back where it was and use the James Cumming Wing as the hall it was designed for.
See Appendix Two for more details.
34
Annual Residents’ Survey 2021 researchfirst.co.nz
8
Council Planning
35Commercial In Confidence
Annual Residents’ Survey 2021 researchfirst.co.nz
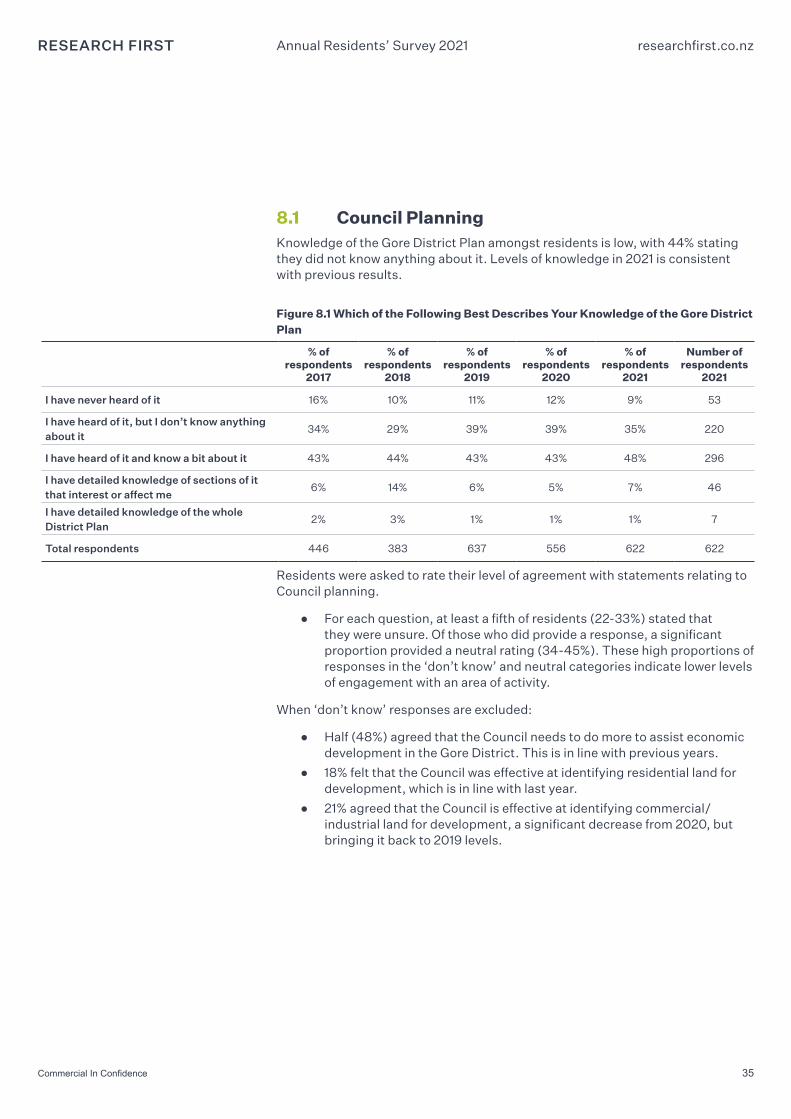
8.1 Council PlanningKnowledge of the Gore District Plan amongst residents is low, with 44% stating they did not know anything about it. Levels of knowledge in 2021 is consistent with previous results.
Figure 8.1 Which of the Following Best Describes Your Knowledge of the Gore District Plan
% of respondents
2017
% of respondents
2018
% of respondents
2019
% of respondents
2020
% of respondents
2021
Number of respondents
2021
I have never heard of it 16% 10% 11% 12% 9% 53
I have heard of it, but I don’t know anything about it
34% 29% 39% 39% 35% 220
I have heard of it and know a bit about it 43% 44% 43% 43% 48% 296
I have detailed knowledge of sections of it that interest or affect me
6% 14% 6% 5% 7% 46
I have detailed knowledge of the whole District Plan
2% 3% 1% 1% 1% 7
Total respondents 446 383 637 556 622 622
Residents were asked to rate their level of agreement with statements relating to Council planning.
● For each question, at least a fifth of residents (22-33%) stated that they were unsure. Of those who did provide a response, a significant proportion provided a neutral rating (34-45%). These high proportions of responses in the ‘don’t know’ and neutral categories indicate lower levels of engagement with an area of activity.
When ‘don’t know’ responses are excluded:
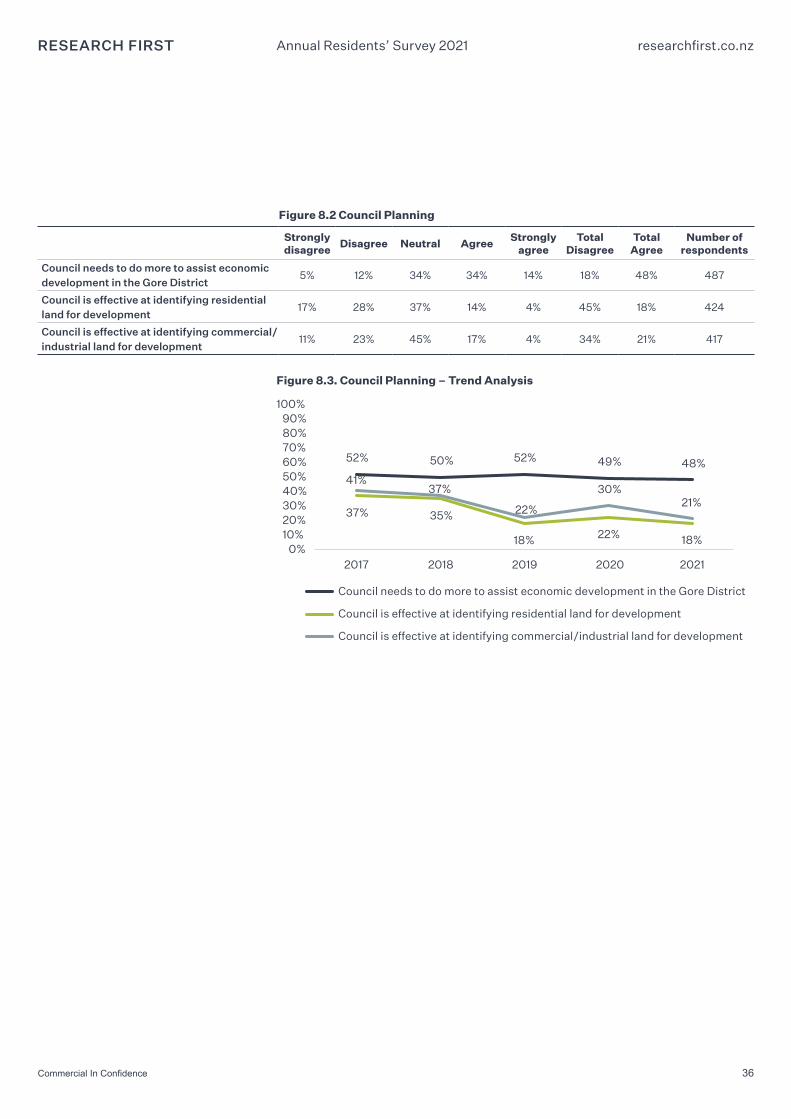
● Half (48%) agreed that the Council needs to do more to assist economic development in the Gore District. This is in line with previous years.
● 18% felt that the Council was effective at identifying residential land for development, which is in line with last year.
● 21% agreed that the Council is effective at identifying commercial/industrial land for development, a significant decrease from 2020, but bringing it back to 2019 levels.
36Commercial In Confidence
Annual Residents’ Survey 2021 researchfirst.co.nz
Figure 8.2 Council Planning
Strongly disagree Disagree Neutral Agree Strongly
agreeTotal
DisagreeTotal
AgreeNumber of
respondents
Council needs to do more to assist economic development in the Gore District
5% 12% 34% 34% 14% 18% 48% 487
Council is effective at identifying residential land for development
17% 28% 37% 14% 4% 45% 18% 424
Council is effective at identifying commercial/industrial land for development
11% 23% 45% 17% 4% 34% 21% 417
Figure 8.3. Council Planning – Trend Analysis
52% 50% 52% 49% 48%
37% 35%
18% 22% 18%
41%37%
22%
30%21%
0%10%20%30%40%50%60%70%80%90%
100%
2017 2018 2019 2020 2021
Council needs to do more to assist economic development in the Gore District
Council is effective at identifying residential land for development
Council is effective at identifying commercial/industrial land for development
37Commercial In Confidence
Annual Residents’ Survey 2021 researchfirst.co.nz
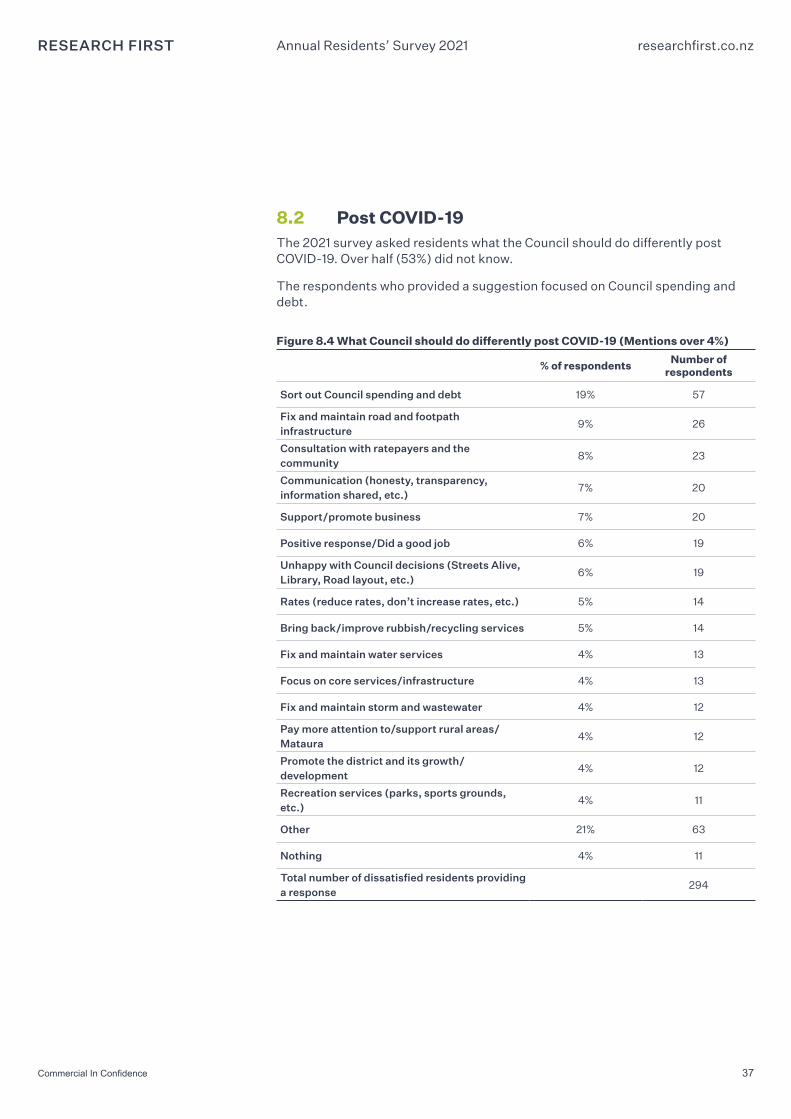
8.2 Post COVID-19The 2021 survey asked residents what the Council should do differently post COVID-19. Over half (53%) did not know.
The respondents who provided a suggestion focused on Council spending and debt.
Figure 8.4 What Council should do differently post COVID-19 (Mentions over 4%)
% of respondents Number of respondents
Sort out Council spending and debt 19% 57
Fix and maintain road and footpath infrastructure
9% 26
Consultation with ratepayers and the community
8% 23
Communication (honesty, transparency, information shared, etc.)
7% 20
Support/promote business 7% 20
Positive response/Did a good job 6% 19
Unhappy with Council decisions (Streets Alive, Library, Road layout, etc.)
6% 19
Rates (reduce rates, don’t increase rates, etc.) 5% 14
Bring back/improve rubbish/recycling services 5% 14
Fix and maintain water services 4% 13
Focus on core services/infrastructure 4% 13
Fix and maintain storm and wastewater 4% 12
Pay more attention to/support rural areas/Mataura
4% 12
Promote the district and its growth/development
4% 12
Recreation services (parks, sports grounds, etc.)
4% 11
Other 21% 63
Nothing 4% 11
Total number of dissatisfied residents providing a response
294
38
Annual Residents’ Survey 2021 researchfirst.co.nz
9
Contacting the Council
39Commercial In Confidence
Annual Residents’ Survey 2021 researchfirst.co.nz
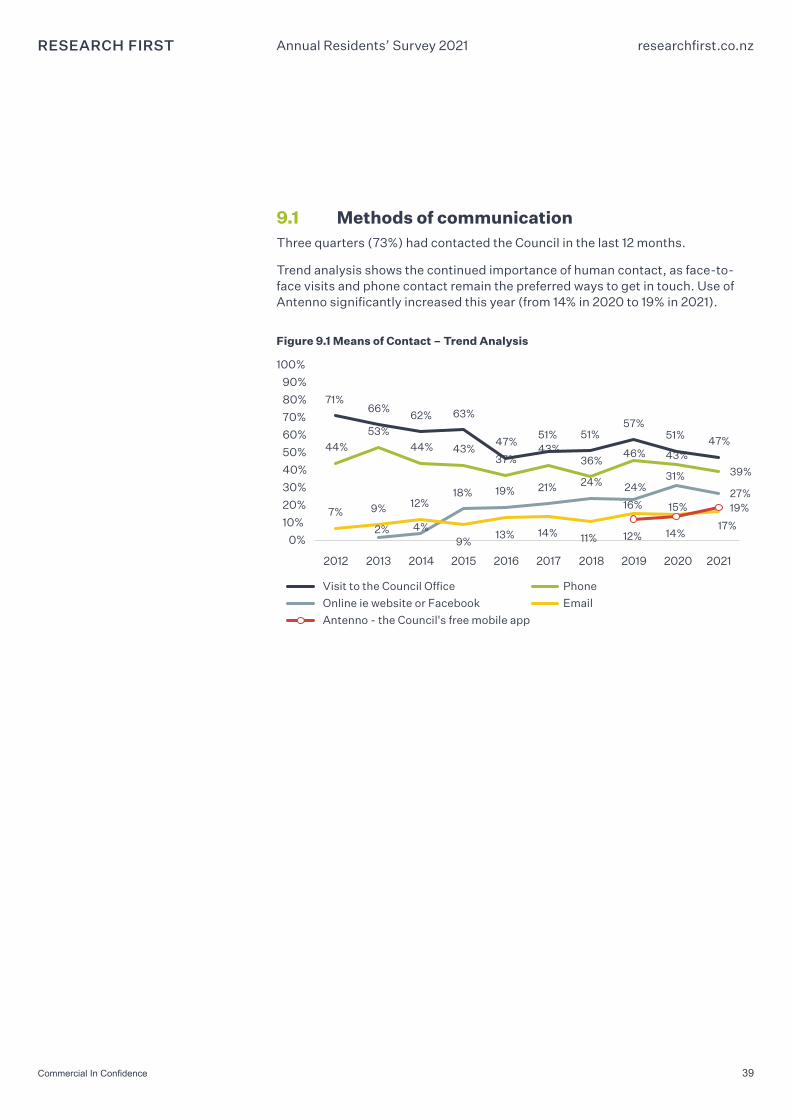
9.1 Methods of communicationThree quarters (73%) had contacted the Council in the last 12 months.
Trend analysis shows the continued importance of human contact, as face-to-face visits and phone contact remain the preferred ways to get in touch. Use of Antenno significantly increased this year (from 14% in 2020 to 19% in 2021).
Figure 9.1 Means of Contact – Trend Analysis
71%66%
62% 63%
47%51% 51%
57%51% 47%44%
53%
44% 43%37%
43%36%
46% 43%
39%
2% 4%
18% 19% 21% 24% 24%31%
27%
7% 9% 12%
9%13% 14% 11%
16% 15%
17%12% 14%
19%
0%
10%
20%
30%
40%
50%
60%
70%
80%
90%
100%
2012 2013 2014 2015 2016 2017 2018 2019 2020 2021
Visit to the Council Office Phone
Online ie website or Facebook Email
Antenno - the Council's free mobile app
40Commercial In Confidence
Annual Residents’ Survey 2021 researchfirst.co.nz
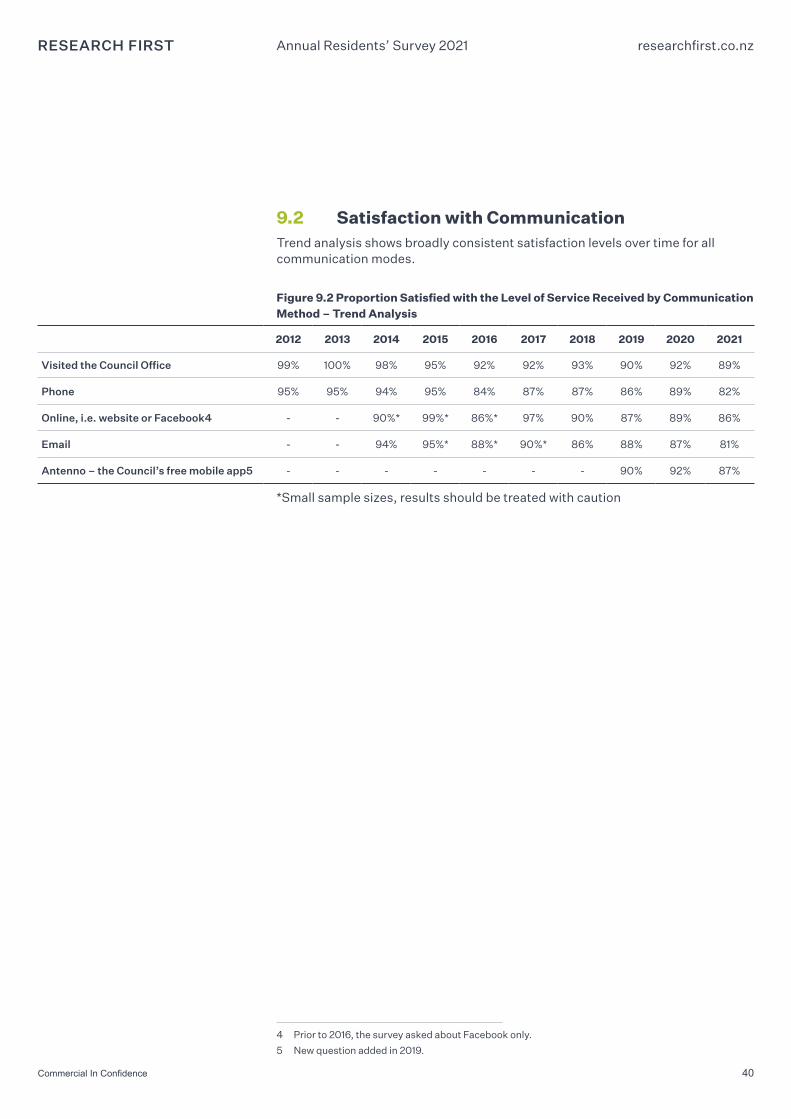
9.2 Satisfaction with CommunicationTrend analysis shows broadly consistent satisfaction levels over time for all communication modes.
Figure 9.2 Proportion Satisfied with the Level of Service Received by Communication Method – Trend Analysis
2012 2013 2014 2015 2016 2017 2018 2019 2020 2021
Visited the Council Office 99% 100% 98% 95% 92% 92% 93% 90% 92% 89%
Phone 95% 95% 94% 95% 84% 87% 87% 86% 89% 82%
Online, i.e. website or Facebook4 - - 90%* 99%* 86%* 97% 90% 87% 89% 86%
Email - - 94% 95%* 88%* 90%* 86% 88% 87% 81%
Antenno – the Council’s free mobile app5 - - - - - - - 90% 92% 87%
*Small sample sizes, results should be treated with caution
4 Prior to 2016, the survey asked about Facebook only.
5 New question added in 2019.
41
Annual Residents’ Survey 2021 researchfirst.co.nz
Council Communications
10
42Commercial In Confidence
Annual Residents’ Survey 2021 researchfirst.co.nz
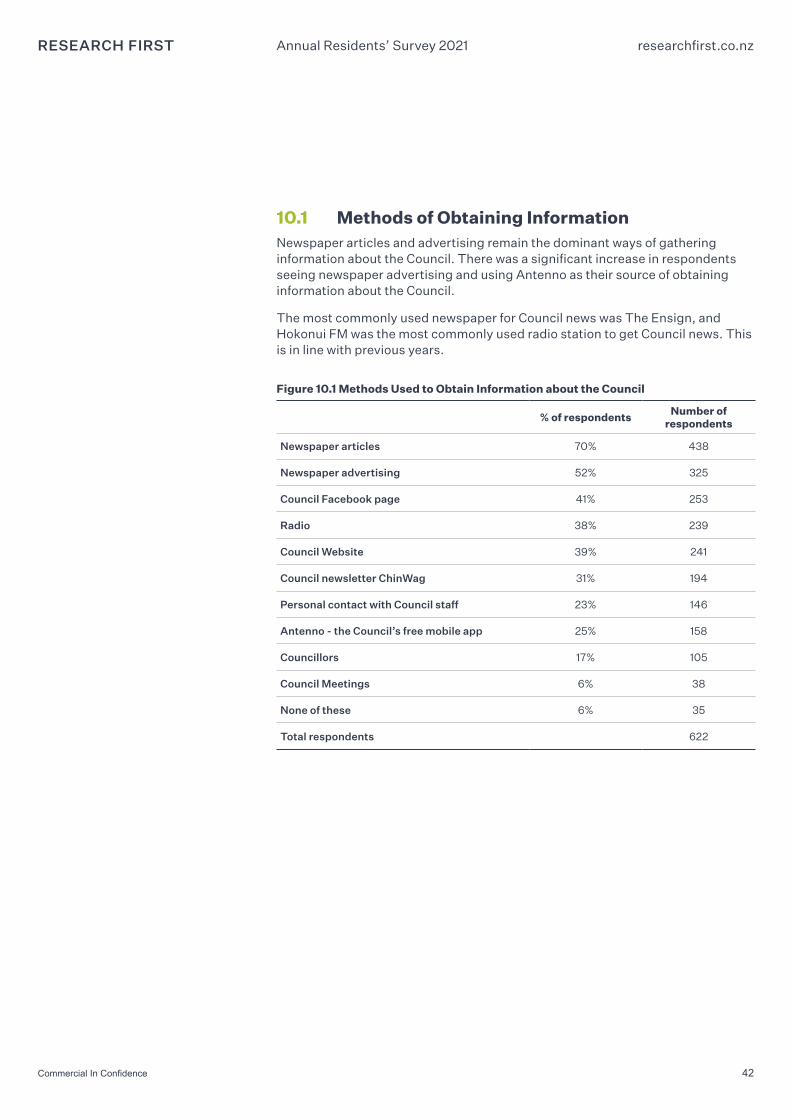
10.1 Methods of Obtaining InformationNewspaper articles and advertising remain the dominant ways of gathering information about the Council. There was a significant increase in respondents seeing newspaper advertising and using Antenno as their source of obtaining information about the Council.
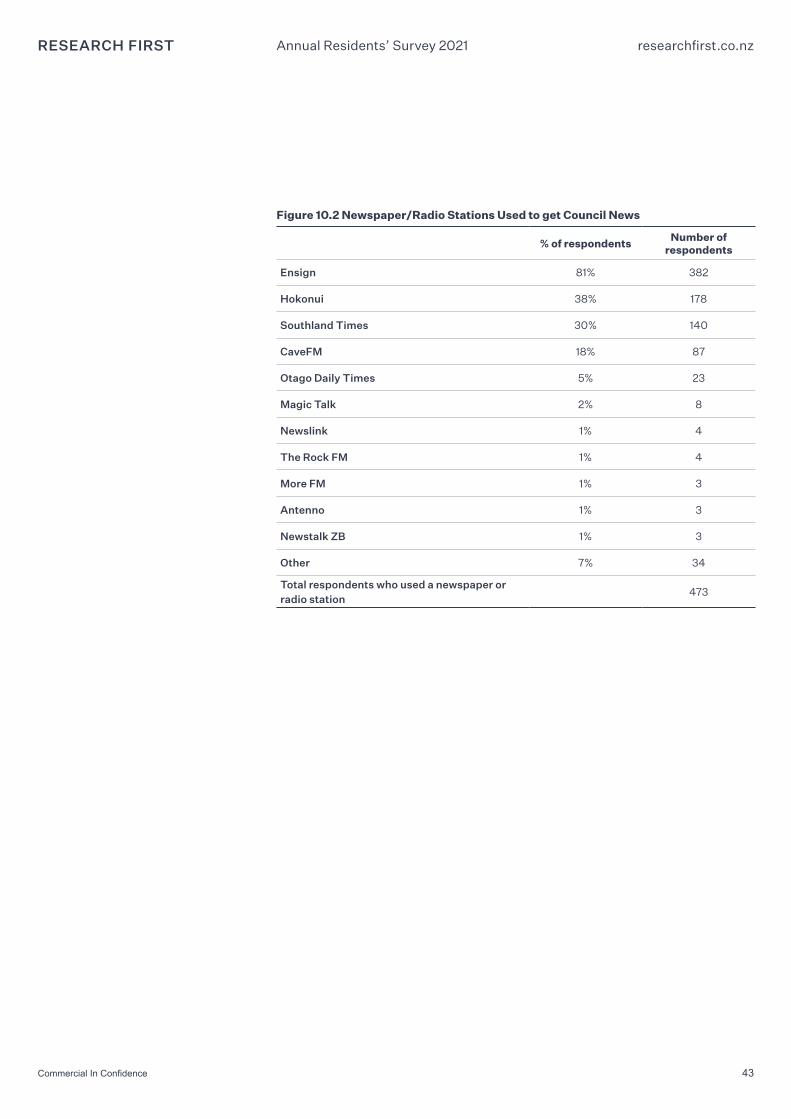
The most commonly used newspaper for Council news was The Ensign, and Hokonui FM was the most commonly used radio station to get Council news. This is in line with previous years.
Figure 10.1 Methods Used to Obtain Information about the Council
% of respondents Number of respondents
Newspaper articles 70% 438
Newspaper advertising 52% 325
Council Facebook page 41% 253
Radio 38% 239
Council Website 39% 241
Council newsletter ChinWag 31% 194
Personal contact with Council staff 23% 146
Antenno - the Council’s free mobile app 25% 158
Councillors 17% 105
Council Meetings 6% 38
None of these 6% 35
Total respondents 622
43Commercial In Confidence
Annual Residents’ Survey 2021 researchfirst.co.nz
Figure 10.2 Newspaper/Radio Stations Used to get Council News
% of respondents Number of respondents
Ensign 81% 382
Hokonui 38% 178
Southland Times 30% 140
CaveFM 18% 87
Otago Daily Times 5% 23
Magic Talk 2% 8
Newslink 1% 4
The Rock FM 1% 4
More FM 1% 3
Antenno 1% 3
Newstalk ZB 1% 3
Other 7% 34
Total respondents who used a newspaper or radio station
473
44Commercial In Confidence
Annual Residents’ Survey 2021 researchfirst.co.nz
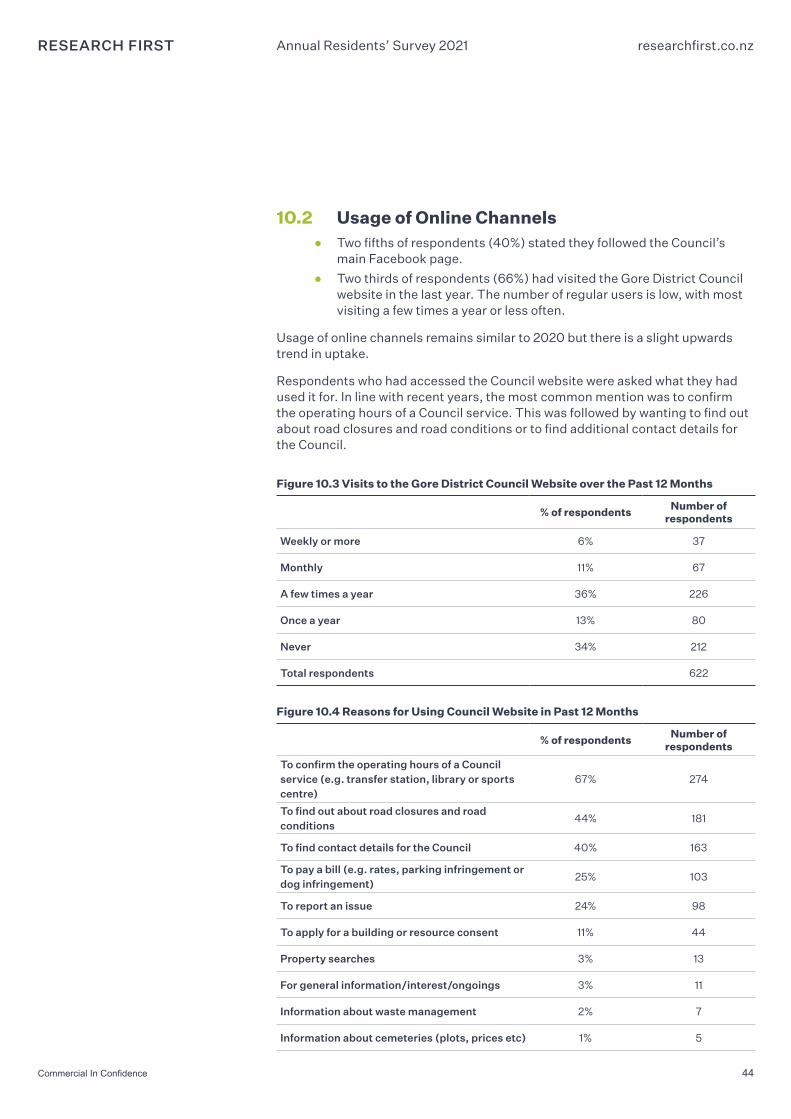
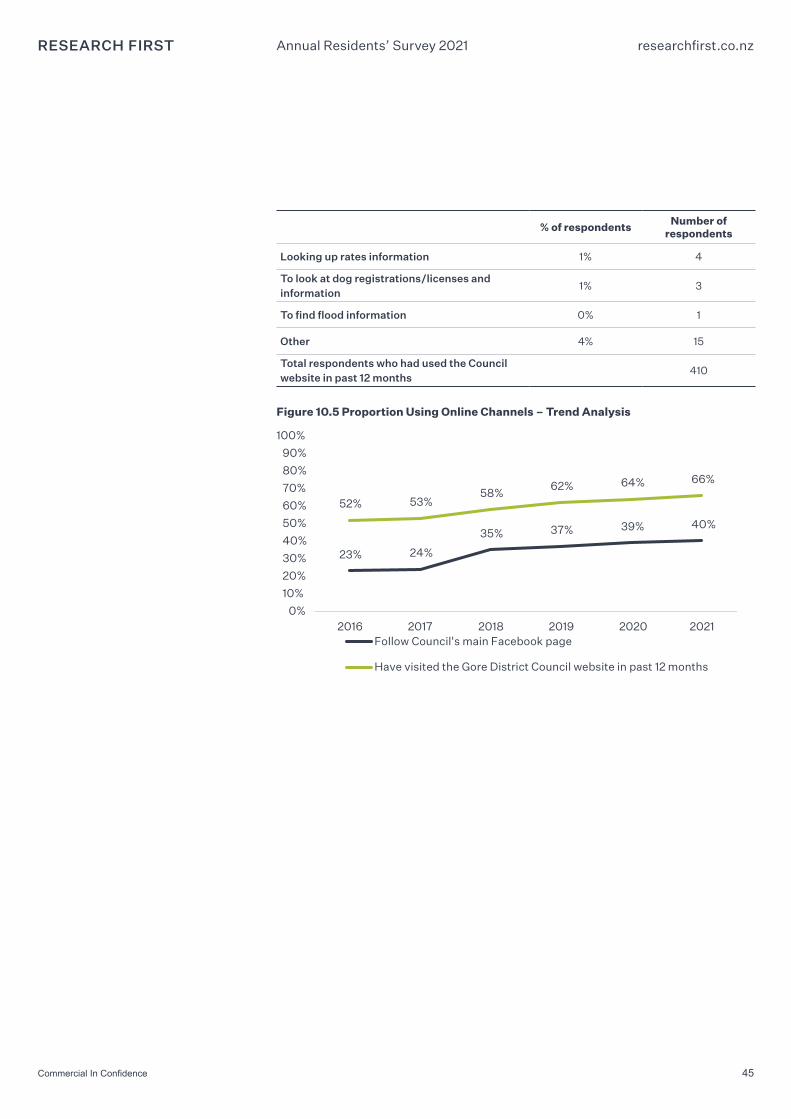
10.2 Usage of Online Channels ● Two fifths of respondents (40%) stated they followed the Council’s
main Facebook page.
● Two thirds of respondents (66%) had visited the Gore District Council website in the last year. The number of regular users is low, with most visiting a few times a year or less often.
Usage of online channels remains similar to 2020 but there is a slight upwards trend in uptake.
Respondents who had accessed the Council website were asked what they had used it for. In line with recent years, the most common mention was to confirm the operating hours of a Council service. This was followed by wanting to find out about road closures and road conditions or to find additional contact details for the Council.
Figure 10.3 Visits to the Gore District Council Website over the Past 12 Months
% of respondents Number of respondents
Weekly or more 6% 37
Monthly 11% 67
A few times a year 36% 226
Once a year 13% 80
Never 34% 212
Total respondents 622
Figure 10.4 Reasons for Using Council Website in Past 12 Months
% of respondents Number of respondents
To confirm the operating hours of a Council service (e.g. transfer station, library or sports centre)
67% 274
To find out about road closures and road conditions
44% 181
To find contact details for the Council 40% 163
To pay a bill (e.g. rates, parking infringement or dog infringement)
25% 103
To report an issue 24% 98
To apply for a building or resource consent 11% 44
Property searches 3% 13
For general information/interest/ongoings 3% 11
Information about waste management 2% 7
Information about cemeteries (plots, prices etc) 1% 5
45Commercial In Confidence
Annual Residents’ Survey 2021 researchfirst.co.nz
% of respondents Number of respondents
Looking up rates information 1% 4
To look at dog registrations/licenses and information
1% 3
To find flood information 0% 1
Other 4% 15
Total respondents who had used the Council website in past 12 months
410
Figure 10.5 Proportion Using Online Channels – Trend Analysis
23% 24%
35% 37% 39% 40%
52% 53%58%
62% 64% 66%
0%
10%
20%
30%
40%
50%
60%
70%
80%
90%
100%
2016 2017 2018 2019 2020 2021Follow Council's main Facebook page
Have visited the Gore District Council website in past 12 months
46Commercial In Confidence
Annual Residents’ Survey 2021 researchfirst.co.nz
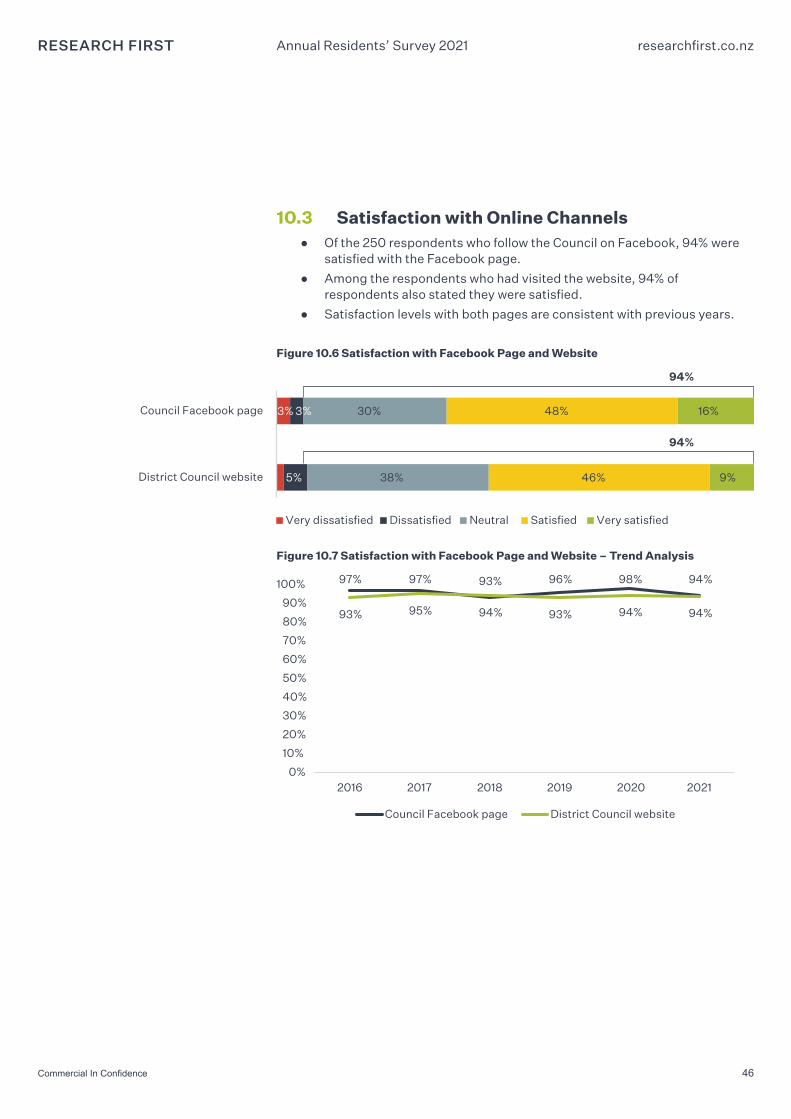
10.3 Satisfaction with Online Channels● Of the 250 respondents who follow the Council on Facebook, 94% were
satisfied with the Facebook page.
● Among the respondents who had visited the website, 94% of respondents also stated they were satisfied.
● Satisfaction levels with both pages are consistent with previous years.
Figure 10.6 Satisfaction with Facebook Page and Website
3% 3%
5%
30%
38%
48%
46%
16%
9%
Council Facebook page
District Council website
Very dissatisfied Dissatisfied Neutral Satisfied Very satisfied
94%
94%
Figure 10.7 Satisfaction with Facebook Page and Website – Trend Analysis
97% 97% 93% 96% 98% 94%
93% 95% 94% 93% 94% 94%
0%
10%
20%
30%
40%
50%
60%
70%
80%
90%
100%
2016 2017 2018 2019 2020 2021
Council Facebook page District Council website
47
Annual Residents’ Survey 2021 researchfirst.co.nz
Elected Members and Organisational Performance
11
48Commercial In Confidence
Annual Residents’ Survey 2021 researchfirst.co.nz
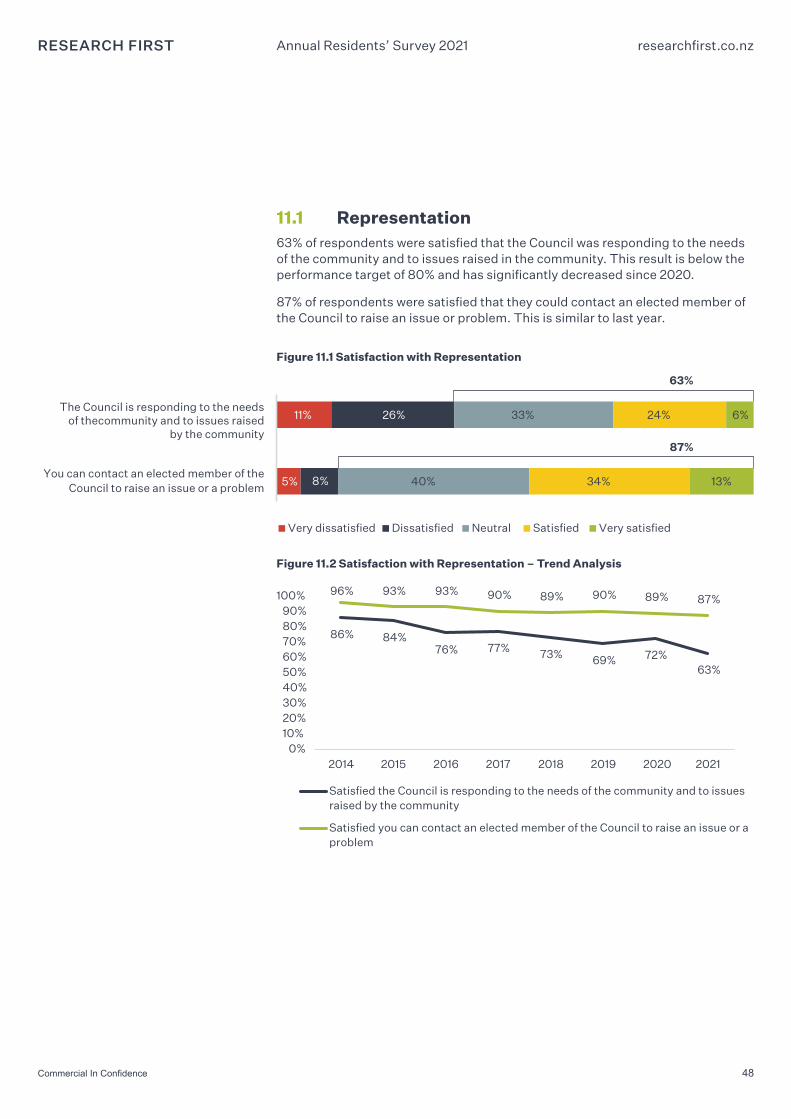
11.1 Representation63% of respondents were satisfied that the Council was responding to the needs of the community and to issues raised in the community. This result is below the performance target of 80% and has significantly decreased since 2020.
87% of respondents were satisfied that they could contact an elected member of the Council to raise an issue or problem. This is similar to last year.
Figure 11.1 Satisfaction with Representation
5%
11%
8%
26%
40%
33%
34%
24%
13%
6%
You can contact an elected member of theCouncil to raise an issue or a problem
The Council is responding to the needsof thecommunity and to issues raised
by the community
Very dissatisfied Dissatisfied Neutral Satisfied Very satisfied
63%
87%
Figure 11.2 Satisfaction with Representation – Trend Analysis
86% 84%76% 77% 73% 69% 72%
63%
96% 93% 93% 90% 89% 90% 89% 87%
0%10%20%30%40%50%60%70%80%90%
100%
2014 2015 2016 2017 2018 2019 2020 2021
Satisfied the Council is responding to the needs of the community and to issuesraised by the community
Satisfied you can contact an elected member of the Council to raise an issue or aproblem
49Commercial In Confidence
Annual Residents’ Survey 2021 researchfirst.co.nz
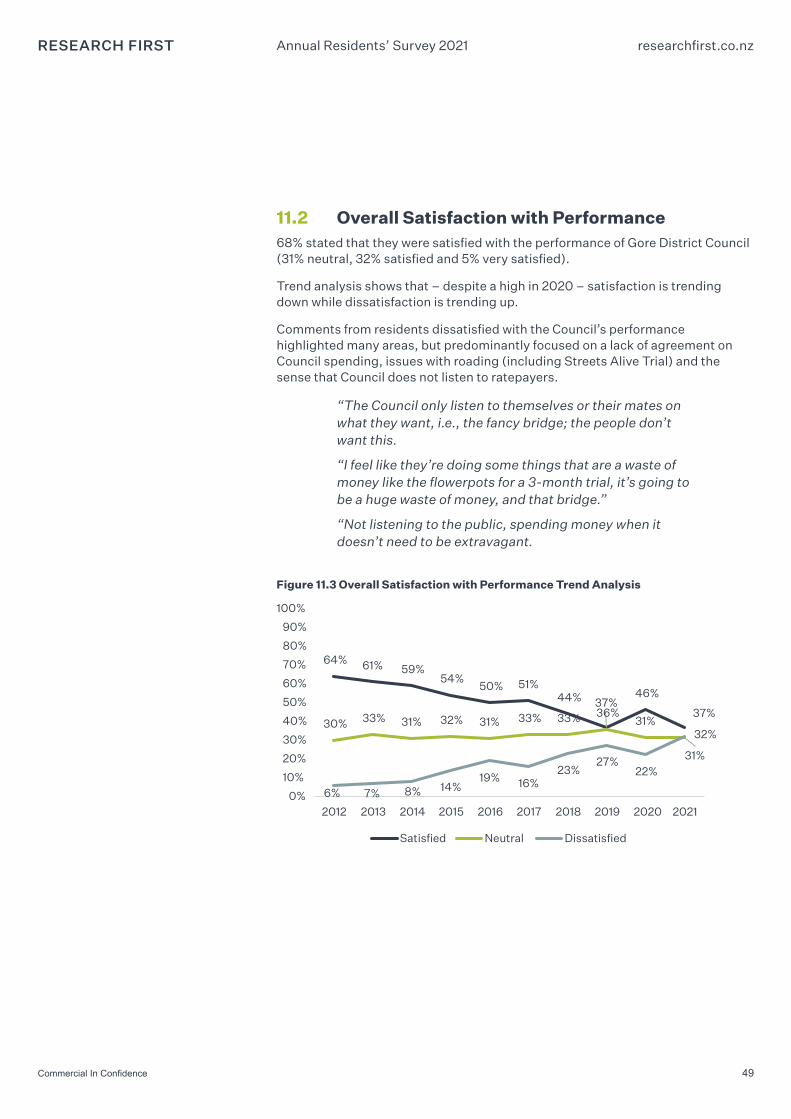
11.2 Overall Satisfaction with Performance68% stated that they were satisfied with the performance of Gore District Council (31% neutral, 32% satisfied and 5% very satisfied).
Trend analysis shows that – despite a high in 2020 – satisfaction is trending down while dissatisfaction is trending up.
Comments from residents dissatisfied with the Council’s performance highlighted many areas, but predominantly focused on a lack of agreement on Council spending, issues with roading (including Streets Alive Trial) and the sense that Council does not listen to ratepayers.
“The Council only listen to themselves or their mates on what they want, i.e., the fancy bridge; the people don’t want this.
“I feel like they’re doing some things that are a waste of money like the flowerpots for a 3-month trial, it’s going to be a huge waste of money, and that bridge.”
“Not listening to the public, spending money when it doesn’t need to be extravagant.
Figure 11.3 Overall Satisfaction with Performance Trend Analysis
64% 61% 59%54%
50% 51%44% 37%
46%
37%30% 33% 31% 32% 31% 33% 33% 36%
31%
31%
6% 7% 8% 14%19% 16%
23%27%
22%
32%
0%
10%
20%
30%
40%
50%
60%
70%
80%
90%
100%
2012 2013 2014 2015 2016 2017 2018 2019 2020 2021
Satisfied Neutral Dissatisfied
50Commercial In Confidence
Annual Residents’ Survey 2021 researchfirst.co.nz
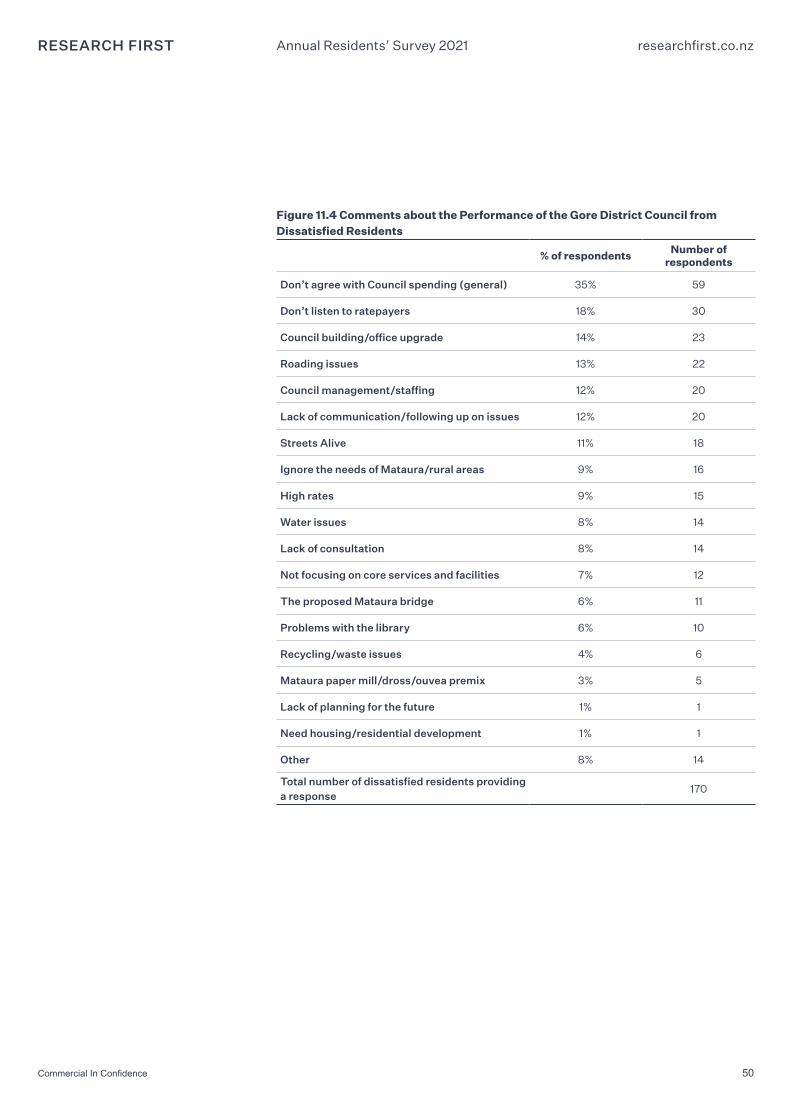
Figure 11.4 Comments about the Performance of the Gore District Council from Dissatisfied Residents
% of respondents Number of respondents
Don’t agree with Council spending (general) 35% 59
Don’t listen to ratepayers 18% 30
Council building/office upgrade 14% 23
Roading issues 13% 22
Council management/staffing 12% 20
Lack of communication/following up on issues 12% 20
Streets Alive 11% 18
Ignore the needs of Mataura/rural areas 9% 16
High rates 9% 15
Water issues 8% 14
Lack of consultation 8% 14
Not focusing on core services and facilities 7% 12
The proposed Mataura bridge 6% 11
Problems with the library 6% 10
Recycling/waste issues 4% 6
Mataura paper mill/dross/ouvea premix 3% 5
Lack of planning for the future 1% 1
Need housing/residential development 1% 1
Other 8% 14
Total number of dissatisfied residents providing a response
170
51Commercial In Confidence
Annual Residents’ Survey 2021 researchfirst.co.nz
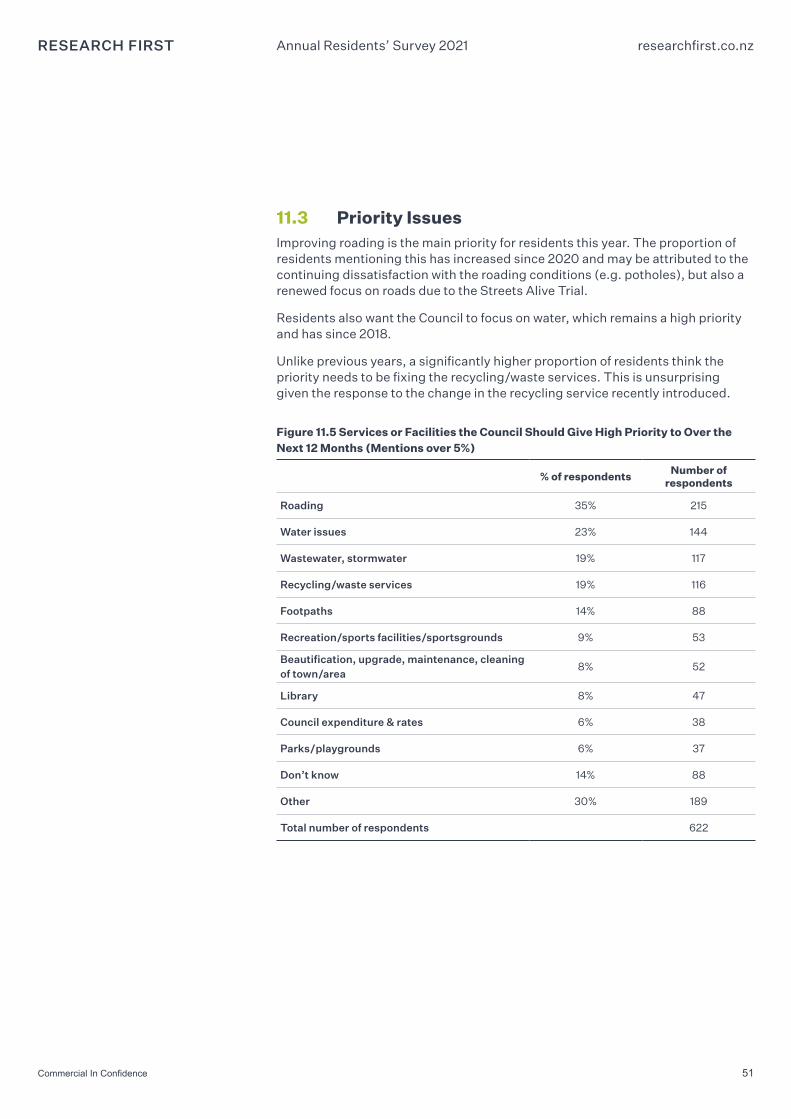
11.3 Priority IssuesImproving roading is the main priority for residents this year. The proportion of residents mentioning this has increased since 2020 and may be attributed to the continuing dissatisfaction with the roading conditions (e.g. potholes), but also a renewed focus on roads due to the Streets Alive Trial.
Residents also want the Council to focus on water, which remains a high priority and has since 2018.
Unlike previous years, a significantly higher proportion of residents think the priority needs to be fixing the recycling/waste services. This is unsurprising given the response to the change in the recycling service recently introduced.
Figure 11.5 Services or Facilities the Council Should Give High Priority to Over the Next 12 Months (Mentions over 5%)
% of respondents Number of respondents
Roading 35% 215
Water issues 23% 144
Wastewater, stormwater 19% 117
Recycling/waste services 19% 116
Footpaths 14% 88
Recreation/sports facilities/sportsgrounds 9% 53
Beautification, upgrade, maintenance, cleaning of town/area
8% 52
Library 8% 47
Council expenditure & rates 6% 38
Parks/playgrounds 6% 37
Don’t know 14% 88
Other 30% 189
Total number of respondents 622
52Commercial In Confidence
Annual Residents’ Survey 2021 researchfirst.co.nz
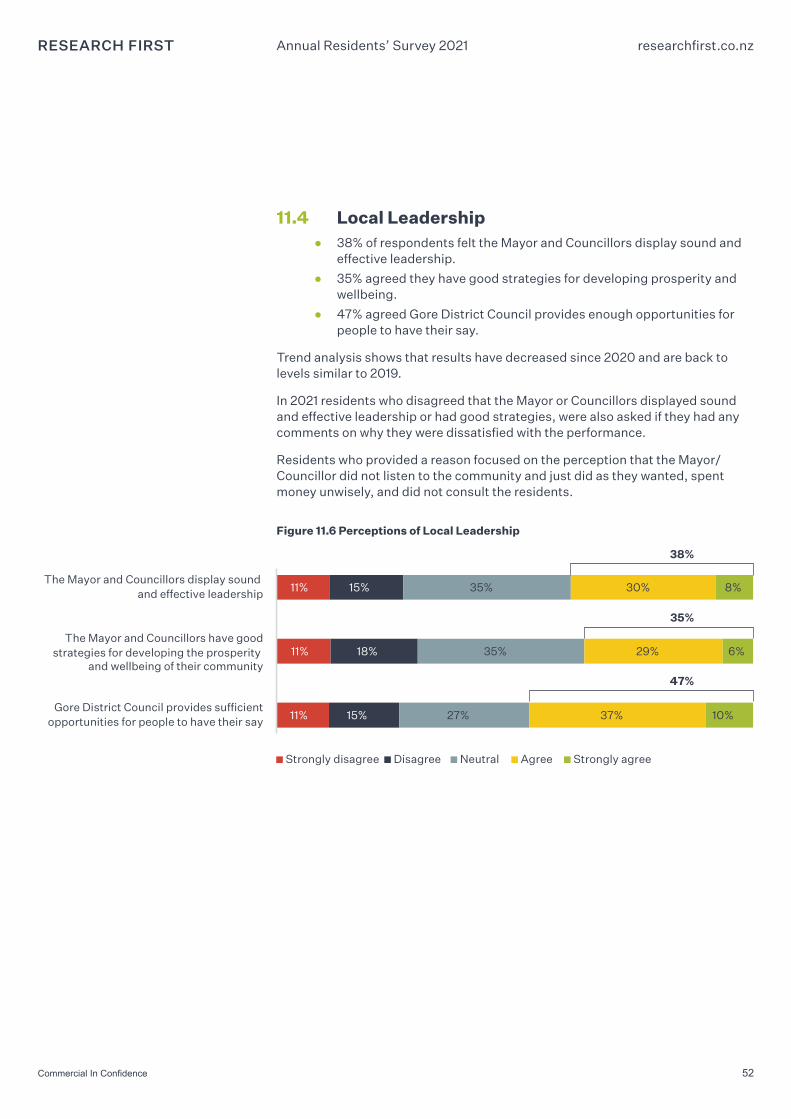
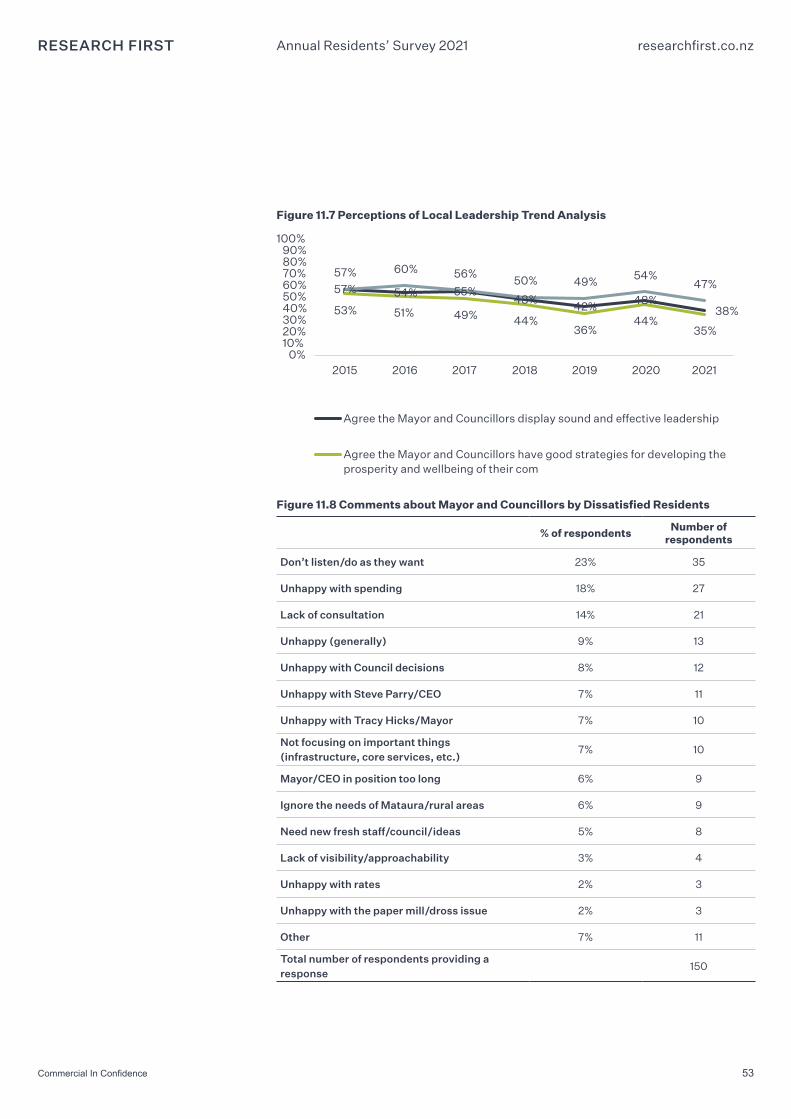
11.4 Local Leadership ● 38% of respondents felt the Mayor and Councillors display sound and
effective leadership.
● 35% agreed they have good strategies for developing prosperity and wellbeing.
● 47% agreed Gore District Council provides enough opportunities for people to have their say.
Trend analysis shows that results have decreased since 2020 and are back to levels similar to 2019.
In 2021 residents who disagreed that the Mayor or Councillors displayed sound and effective leadership or had good strategies, were also asked if they had any comments on why they were dissatisfied with the performance.
Residents who provided a reason focused on the perception that the Mayor/Councillor did not listen to the community and just did as they wanted, spent money unwisely, and did not consult the residents.
Figure 11.6 Perceptions of Local Leadership
11%
11%
11%
15%
18%
15%
35%
35%
27%
30%
29%
37%
8%
6%
10%
The Mayor and Councillors display sound and effective leadership
The Mayor and Councillors have goodstrategies for developing the prosperity
and wellbeing of their community
Gore District Council provides sufficientopportunities for people to have their say
Strongly disagree Disagree Neutral Agree Strongly agree
38%
35%
47%
53Commercial In Confidence
Annual Residents’ Survey 2021 researchfirst.co.nz
Figure 11.7 Perceptions of Local Leadership Trend Analysis
57% 54% 55%48%
42% 48%38%53% 51% 49% 44%
36%44%
35%
57% 60% 56%50% 49% 54%
47%
0%10%20%30%40%50%60%70%80%90%
100%
2015 2016 2017 2018 2019 2020 2021
Agree the Mayor and Councillors display sound and effective leadership
Agree the Mayor and Councillors have good strategies for developing theprosperity and wellbeing of their com
Figure 11.8 Comments about Mayor and Councillors by Dissatisfied Residents
% of respondents Number of respondents
Don’t listen/do as they want 23% 35
Unhappy with spending 18% 27
Lack of consultation 14% 21
Unhappy (generally) 9% 13
Unhappy with Council decisions 8% 12
Unhappy with Steve Parry/CEO 7% 11
Unhappy with Tracy Hicks/Mayor 7% 10
Not focusing on important things (infrastructure, core services, etc.)
7% 10
Mayor/CEO in position too long 6% 9
Ignore the needs of Mataura/rural areas 6% 9
Need new fresh staff/council/ideas 5% 8
Lack of visibility/approachability 3% 4
Unhappy with rates 2% 3
Unhappy with the paper mill/dross issue 2% 3
Other 7% 11
Total number of respondents providing a response
150
54
Annual Residents’ Survey 2021 researchfirst.co.nz
Perceptions of the Gore District
12
55Commercial In Confidence
Annual Residents’ Survey 2021 researchfirst.co.nz
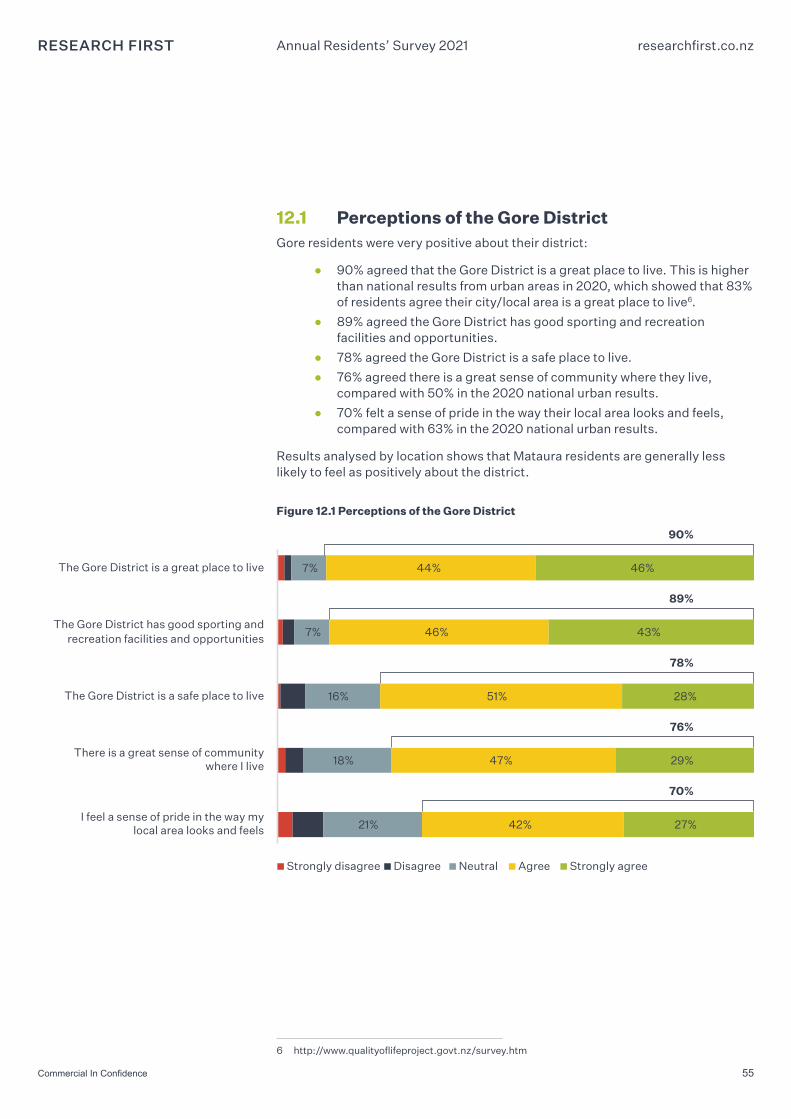
12.1 Perceptions of the Gore DistrictGore residents were very positive about their district:
● 90% agreed that the Gore District is a great place to live. This is higher than national results from urban areas in 2020, which showed that 83% of residents agree their city/local area is a great place to live6.
● 89% agreed the Gore District has good sporting and recreation facilities and opportunities.
● 78% agreed the Gore District is a safe place to live.
● 76% agreed there is a great sense of community where they live, compared with 50% in the 2020 national urban results.
● 70% felt a sense of pride in the way their local area looks and feels, compared with 63% in the 2020 national urban results.
Results analysed by location shows that Mataura residents are generally less likely to feel as positively about the district.
Figure 12.1 Perceptions of the Gore District
7%
7%
16%
18%
21%
44%
46%
51%
47%
42%
46%
43%
28%
29%
27%
The Gore District is a great place to live
The Gore District has good sporting andrecreation facilities and opportunities
The Gore District is a safe place to live
There is a great sense of communitywhere I live
I feel a sense of pride in the way mylocal area looks and feels
Strongly disagree Disagree Neutral Agree Strongly agree
90%
89%
78%
76%
70%
6 http://www.qualityoflifeproject.govt.nz/survey.htm
56Commercial In Confidence
Annual Residents’ Survey 2021 researchfirst.co.nz
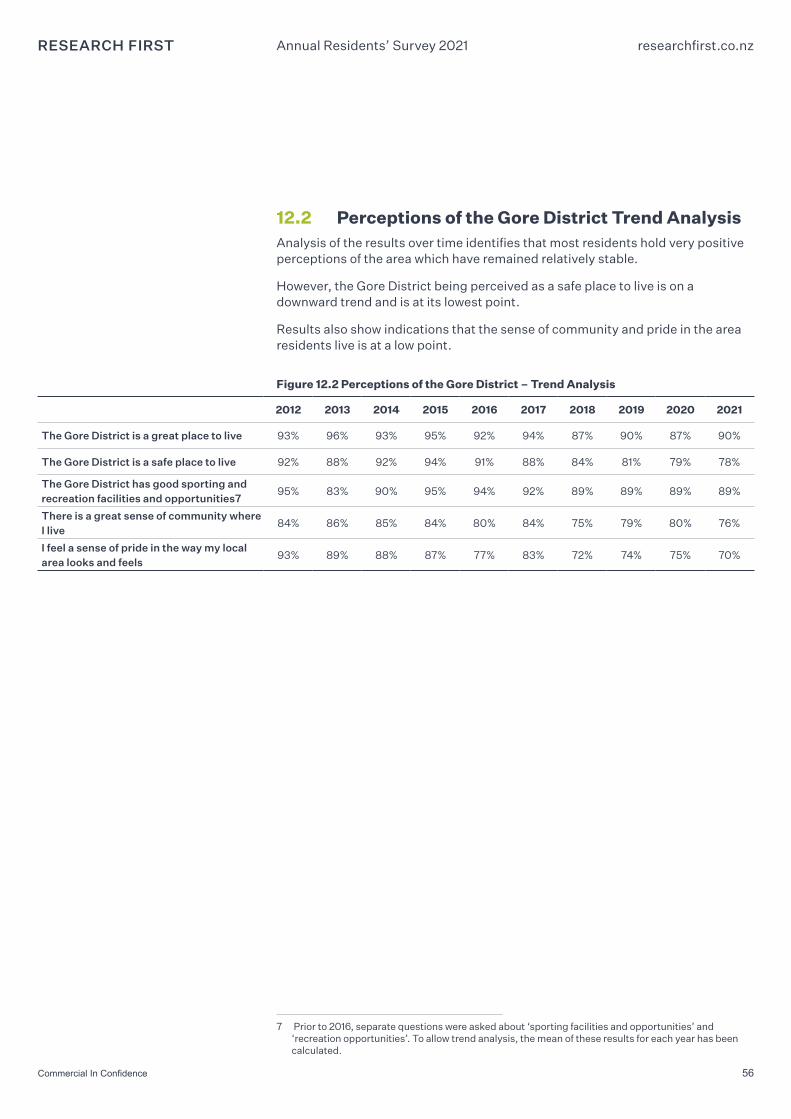
12.2 Perceptions of the Gore District Trend AnalysisAnalysis of the results over time identifies that most residents hold very positive perceptions of the area which have remained relatively stable.
However, the Gore District being perceived as a safe place to live is on a downward trend and is at its lowest point.
Results also show indications that the sense of community and pride in the area residents live is at a low point.
Figure 12.2 Perceptions of the Gore District – Trend Analysis
2012 2013 2014 2015 2016 2017 2018 2019 2020 2021
The Gore District is a great place to live 93% 96% 93% 95% 92% 94% 87% 90% 87% 90%
The Gore District is a safe place to live 92% 88% 92% 94% 91% 88% 84% 81% 79% 78%
The Gore District has good sporting and recreation facilities and opportunities7
95% 83% 90% 95% 94% 92% 89% 89% 89% 89%
There is a great sense of community where I live
84% 86% 85% 84% 80% 84% 75% 79% 80% 76%
I feel a sense of pride in the way my local area looks and feels
93% 89% 88% 87% 77% 83% 72% 74% 75% 70%
7 Prior to 2016, separate questions were asked about ‘sporting facilities and opportunities’ and ‘recreation opportunities’. To allow trend analysis, the mean of these results for each year has been calculated.
57Commercial In Confidence
Annual Residents’ Survey 2021 researchfirst.co.nz
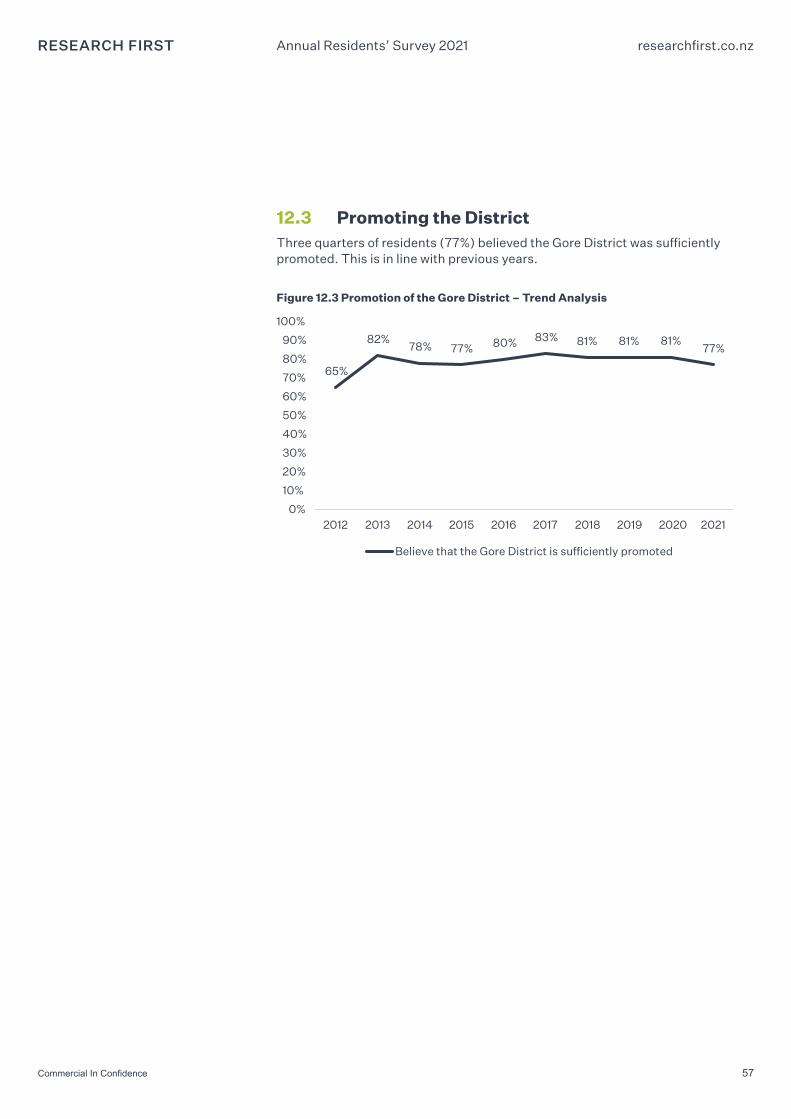
12.3 Promoting the DistrictThree quarters of residents (77%) believed the Gore District was sufficiently promoted. This is in line with previous years.
Figure 12.3 Promotion of the Gore District – Trend Analysis
65%
82%78% 77% 80% 83% 81% 81% 81%
77%
0%
10%
20%
30%
40%
50%
60%
70%
80%
90%
100%
2012 2013 2014 2015 2016 2017 2018 2019 2020 2021
Believe that the Gore District is sufficiently promoted
58
Annual Residents’ Survey 2021 researchfirst.co.nz
Appendix One: Sample Composition
13
59Commercial In Confidence
Annual Residents’ Survey 2021 researchfirst.co.nz
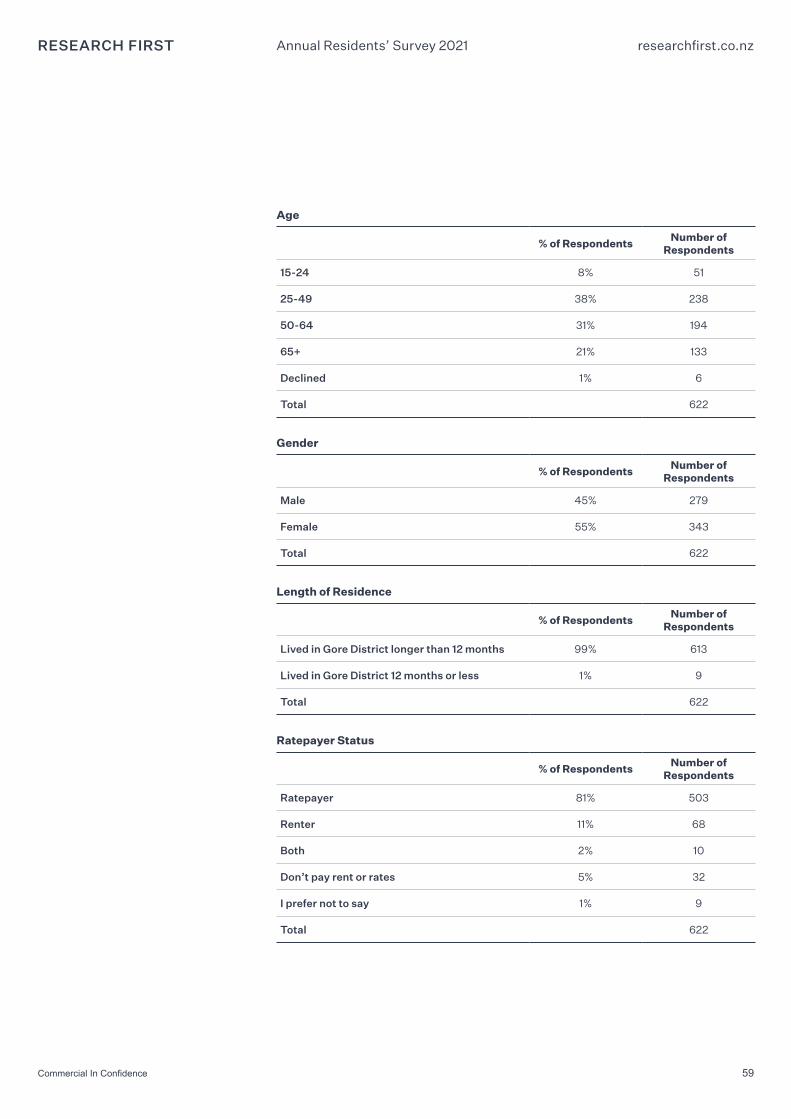
Age
% of Respondents Number of Respondents
15-24 8% 51
25-49 38% 238
50-64 31% 194
65+ 21% 133
Declined 1% 6
Total 622
Gender
% of Respondents Number of Respondents
Male 45% 279
Female 55% 343
Total 622
Length of Residence
% of Respondents Number of Respondents
Lived in Gore District longer than 12 months 99% 613
Lived in Gore District 12 months or less 1% 9
Total 622
Ratepayer Status
% of Respondents Number of Respondents
Ratepayer 81% 503
Renter 11% 68
Both 2% 10
Don’t pay rent or rates 5% 32
I prefer not to say 1% 9
Total 622
60Commercial In Confidence
Annual Residents’ Survey 2021 researchfirst.co.nz
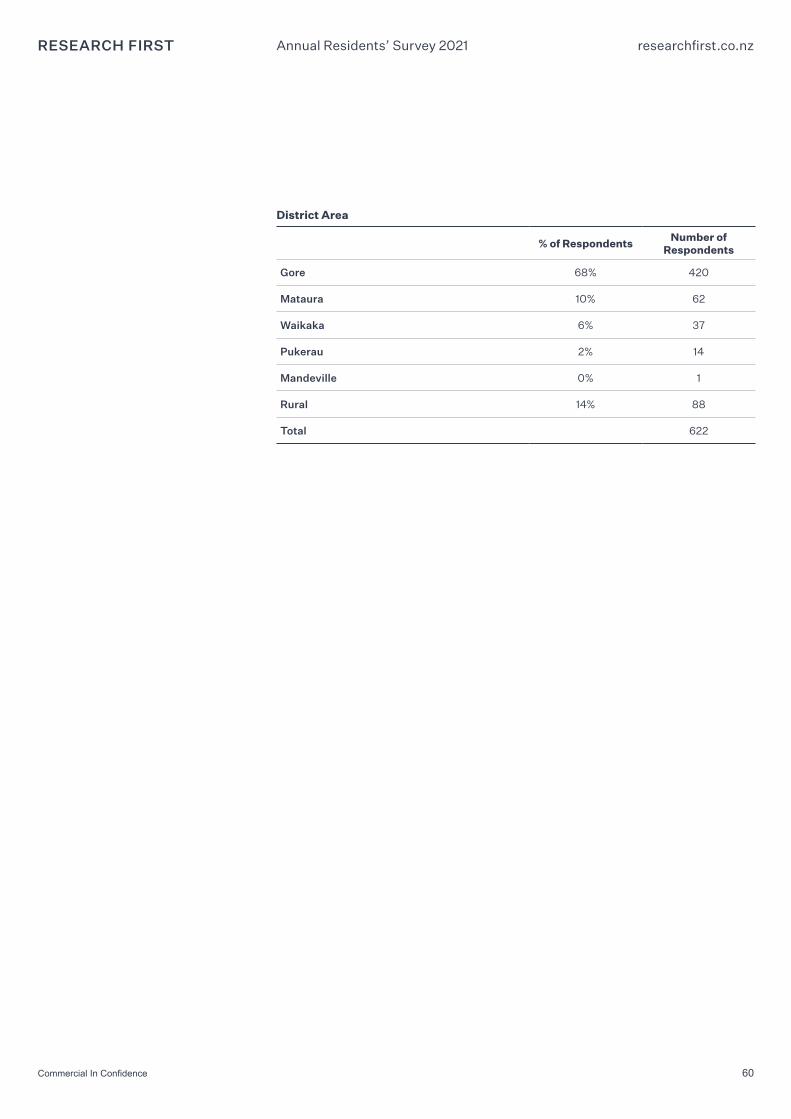
District Area
% of Respondents Number of Respondents
Gore 68% 420
Mataura 10% 62
Waikaka 6% 37
Pukerau 2% 14
Mandeville 0% 1
Rural 14% 88
Total 622

Research First LtdLevel 1, 23 Carlyle StreetSydenham, Christchurch 8023New Zealand
0800 101 275www.researchfirst.co.nz
Related Documents