Google Analytics Google Analytics Report

Welcome message from author
This document is posted to help you gain knowledge. Please leave a comment to let me know what you think about it! Share it to your friends and learn new things together.
Transcript
Google Analytics
Google Analytics Report

Table of Content
Audience: Overview …………………………………………………………..1
Demographics: Overview …………………………………………………….2
Interests: Overview …………………………………………………………...3
Audience Report – Geo & Technology ……………………………………....4
Audience: Behavior (New vs. Returning) ……………………………………5
Audience: User Flow ………………………………………………………….6
Acquisition Report ………………………………………................................7
Acquisition: Channels ………………………………………………………...8
Acquisition: Source/Medium ………………………………………...............9
Acquisition: Referral Traffic ………………………………………………..10
Acquisition: Search Console ………………………………………...............11
Acquisition: Landing Pages …………………………………………………12
Acquisition: Countries ………………………………………........................13
Acquisition: Queries ………………………………………………………....14
Acquisition: Social ………………………………………...............................15
Acquisition: Users Flow ……………………………………………………..16
Behavior: Overview ………………………………………............................17
Behavior: Behavior Flow ………………………………………………........18
Behavior: Site Content ………………………………………………............19
1
Audience: Overview
The Audience reports provide insight into the visitors to your ecommerce store. The various
reports under Audience will provide you with in-depth insights into the demographics (age,
gender), geography (language, location) as well as the technology they're using to access your
site (Mac vs. PC, desktop vs. mobile).
In the Audience Overview report you can see the total number of visitors (referred to as
sessions), new vs. returning users (pie chart), and information for each of the following metrics:
Sessions - The total number of visitor “sessions” to your site
Users - The total number of unique visitors to your site
Pageviews - The total number of pages viewed on your site
Pages per Session - The average number of pages viewed per session (visit)
Average Session Duration - The average amount of time visitors stay on your
Bounce Rate - Percent of visitors that leave your site after viewing only one page
New Users - Percent of total visitors who arrived at your site for the first time
At the bottom of the Audience Overview report, you'll also see additional information on the
following visitor metrics:
Language
Country/Territory
City
Browser
Operating System
Service Provider
Mobile Operating System
Mobile Service Provider
Mobile Screen Resolution

Sep 1, 2016 - Oct 30, 2016Audience Overview
Language Sessions % Sessions
1. en-us 398 71.71%
2. c 70 12.61%
3. (not set) 42 7.57%
4. en-ca 31 5.59%
5. en-gb 9 1.62%
6. zh-tw 3 0.54%
7. fr-fr 1 0.18%
8. th-th 1 0.18%
Overview
Sessions Pageviews
Sep 8 Sep 15 Sep 22 Sep 29 Oct 6 Oct 13 Oct 20 Oct 27
252525
505050
200200200
400400400
Sessions
555Users
250Pageviews
2,905
Pages / Session
5.23Avg. Session Duration
00:08:37Bounce Rate
41.98%
% New Sessions
45.05%
Returning Visitor New Visitor
45.2%
54.8%
© 2016 Google
All Users100.00% Sessions
Linara Jewellery
All Web Site Data GO TO REPORT

Sep 1, 2016 - Oct 30, 2016Audience Overview
Language Sessions % Sessions
1. en-us 398 71.71%
2. c 70 12.61%
3. (not set) 42 7.57%
4. en-ca 31 5.59%
5. en-gb 9 1.62%
6. zh-tw 3 0.54%
7. fr-fr 1 0.18%
8. th-th 1 0.18%
Overview
% New Sessions Bounce Rate
Sep 8 Sep 15 Sep 22 Sep 29 Oct 6 Oct 13 Oct 20 Oct 27
50.00%50.00%50.00%
100.00%100.00%100.00%
50.00%50.00%50.00%
100.00%100.00%100.00%
Sessions
555Users
250Pageviews
2,905
Pages / Session
5.23Avg. Session Duration
00:08:37Bounce Rate
41.98%
% New Sessions
45.05%
Returning Visitor New Visitor
45.2%
54.8%
© 2016 Google
All Users100.00% Sessions
Linara Jewellery
All Web Site Data GO TO REPORT
2
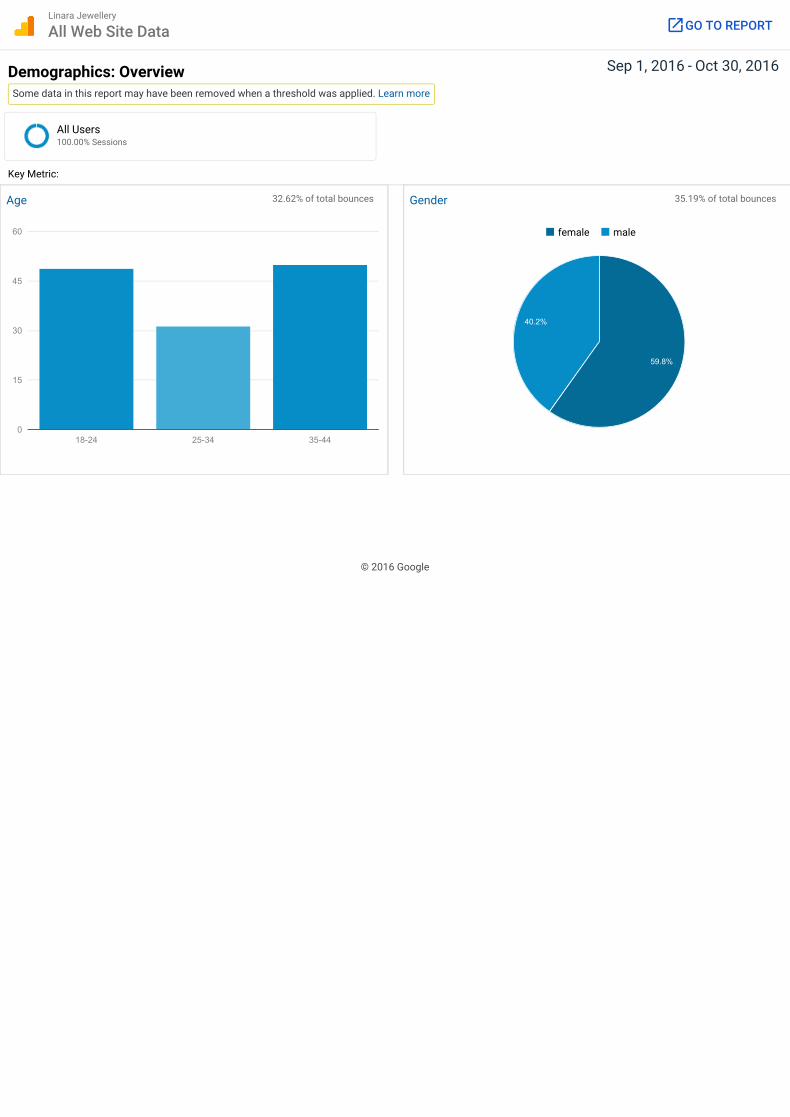
Demographics: Overview The overview gives you a great snapshot of the people coming to your website, with Age in a column chart on the left and a pie chart showing gender on the right.
The yellow warning that says: “Some data in this report may have been removed when a
threshold was applied” is a sign that you have reached a level of granularity in which individuals
may be easier to identify, therefore Google Analytics has removed some of the data to ensure it is high-level and cannot be used to identify an individual.
The percentage of data used is shown in each box in the top corner to help you understand the size of your dataset. This can happen for Age, Gender, and Interest Reports and any report or segment that uses these.
Additionally, keep an eye out for the sampling warning in the top right. The data above shows 100 percent but sometimes you will reach sampling limits so the data will be slightly less accurate.
From the Overview page, you can change the little drop-down from Sessions to four additional on page metrics:
% New Sessions to help you see if you’re attracting the new audience you think you are. Avg. Session Duration to find out if some types of people spend longer on your website. Bounce Rate to see whether some visitors are more engaged than others. Pages / Session, again helps you see whether some ages or genders engage more with
your site that others.

Sep 1, 2016 - Oct 30, 2016
Some data in this report may have been removed when a threshold was applied. Learn more
Demographics: Overview
37.84% of total sessions 41.98% of total sessions
Key Metric:
Age Gender
18-24 25-34 35-440%
20%
40%
60%
80% male female
48.5%51.5%
© 2016 Google
All Users100.00% Sessions
Linara Jewellery
All Web Site Data GO TO REPORT
Sep 1, 2016 - Oct 30, 2016
Some data in this report may have been removed when a threshold was applied. Learn more
Demographics: Overview
32.62% of total bounces 35.19% of total bounces
Key Metric:
Age Gender
18-24 25-34 35-440
15
30
45
60 female male
40.2%
59.8%
© 2016 Google
All Users100.00% Sessions
Linara Jewellery
All Web Site Data GO TO REPORT
3
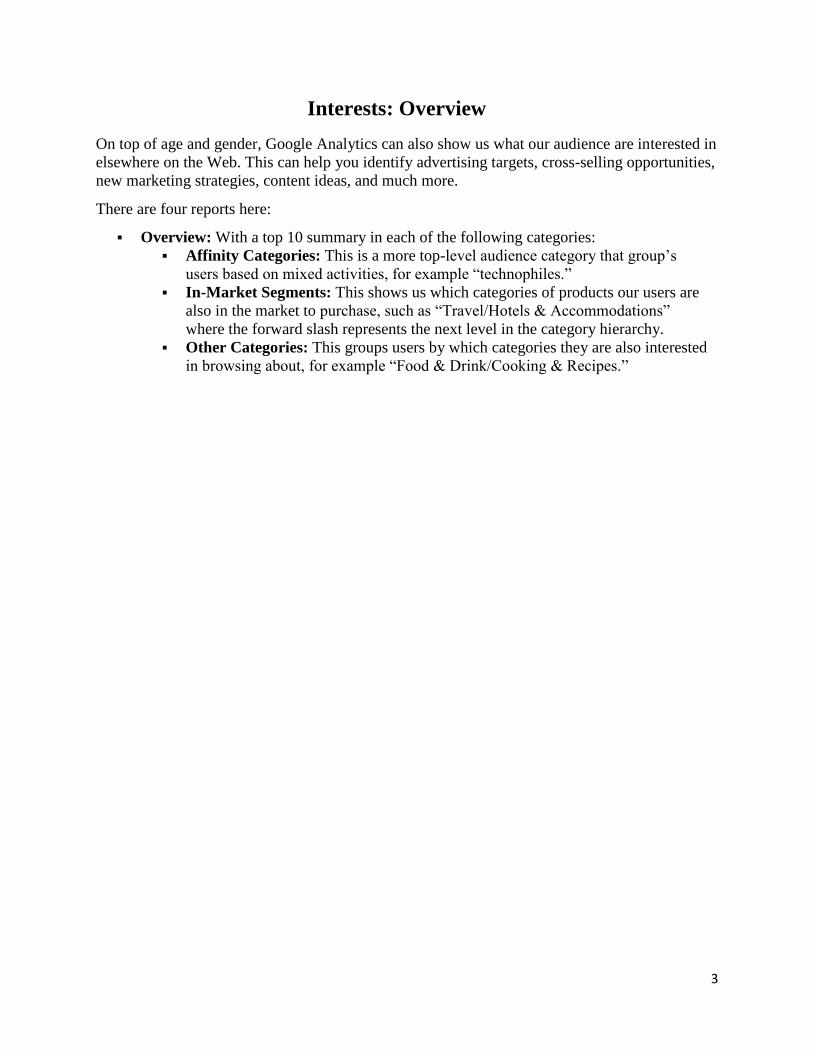
Interests: Overview
On top of age and gender, Google Analytics can also show us what our audience are interested in elsewhere on the Web. This can help you identify advertising targets, cross-selling opportunities, new marketing strategies, content ideas, and much more.
There are four reports here:
Overview: With a top 10 summary in each of the following categories: Affinity Categories: This is a more top-level audience category that group’s
users based on mixed activities, for example “technophiles.” In-Market Segments: This shows us which categories of products our users are
also in the market to purchase, such as “Travel/Hotels & Accommodations”
where the forward slash represents the next level in the category hierarchy. Other Categories: This groups users by which categories they are also interested
in browsing about, for example “Food & Drink/Cooking & Recipes.”

Sep 1, 2016 - Oct 30, 2016
Some data in this report may have been removed when a threshold was applied. Learn more
Interests: Overview
39.46% of total sessions 32.43% of total sessions
39.82% of total sessions
Key Metric:
Affinity Category (reach) In-Market Segment
6.42% Technophiles
5.97% Shutterbugs
5.39% TV Lovers
5.02% Social Media Enthusiasts
4.78% Movie Lovers
4.08% Business Professionals
4.08% Mobile Enthusiasts
4.08% News Junkies
3.91% News Junkies/Entertainment & Celebrity NewsJunkies
3.83% Travel Buffs
31.01% Employment
17.07% Business Services/Business Technology/WebServices/Web Design & Development
11.30% Employment/Career Consulting Services
11.30% Travel/Hotels & Accommodations
6.01% Apparel & Accessories/Women's Apparel
5.29% Consumer Electronics/Mobile Phones
4.57% Software/Business & Productivity Software
2.88% Financial Services/Investment Services
2.88% Gifts & Occasions/Wedding Planning
2.88% Home & Garden/Home Furnishings
Other Category
22.65% Online Communities/Social Networks
21.68% Arts & Entertainment/TV & Video/Online Video
19.09% Reference/General Reference/Dictionaries &Encyclopedias
16.18% Arts & Entertainment/Celebrities & EntertainmentNews
12.62% Arts & Entertainment/Movies/Bollywood & SouthAsian Film
7.77% Internet & Telecom/Mobile & Wireless/MobilePhones/Smart Phones
© 2016 Google
All Users100.00% Sessions
Linara Jewellery
All Web Site Data GO TO REPORT

Sep 1, 2016 - Oct 30, 2016
Some data in this report may have been removed when a threshold was applied. Learn more
Interests: Overview
35.19% of total bounces 30.47% of total bounces
35.62% of total bounces
Key Metric:
Affinity Category (reach) In-Market Segment
5.87% Technophiles
5.55% Shutterbugs
4.91% Social Media Enthusiasts
4.91% TV Lovers
4.06% Mobile Enthusiasts
3.95% Movie Lovers
3.74% Business Professionals
3.74% Cooking Enthusiasts/Aspiring Chefs
3.74% News Junkies/Entertainment & Celebrity NewsJunkies
3.63% Travel Buffs
30.25% Employment
16.67% Business Services/Business Technology/WebServices/Web Design & Development
9.26% Apparel & Accessories/Women's Apparel
8.64% Employment/Career Consulting Services
8.02% Travel/Hotels & Accommodations
6.79% Software/Business & Productivity Software
4.94% Consumer Electronics/Mobile Phones
3.70% Apparel & Accessories/Jewelry & Watches/FineJewelry
3.70% Financial Services/Investment Services
3.09% Gifts & Occasions/Wedding Planning
Other Category
24.03% Arts & Entertainment/TV & Video/Online Video
22.48% Online Communities/Social Networks
20.93% Arts & Entertainment/Celebrities & EntertainmentNews
17.05% Arts & Entertainment/Movies/Bollywood & SouthAsian Film
9.30% Reference/General Reference/Dictionaries &Encyclopedias
6.20% Internet & Telecom/Mobile & Wireless/MobilePhones/Smart Phones
© 2016 Google
All Users100.00% Sessions
Linara Jewellery
All Web Site Data GO TO REPORT
4
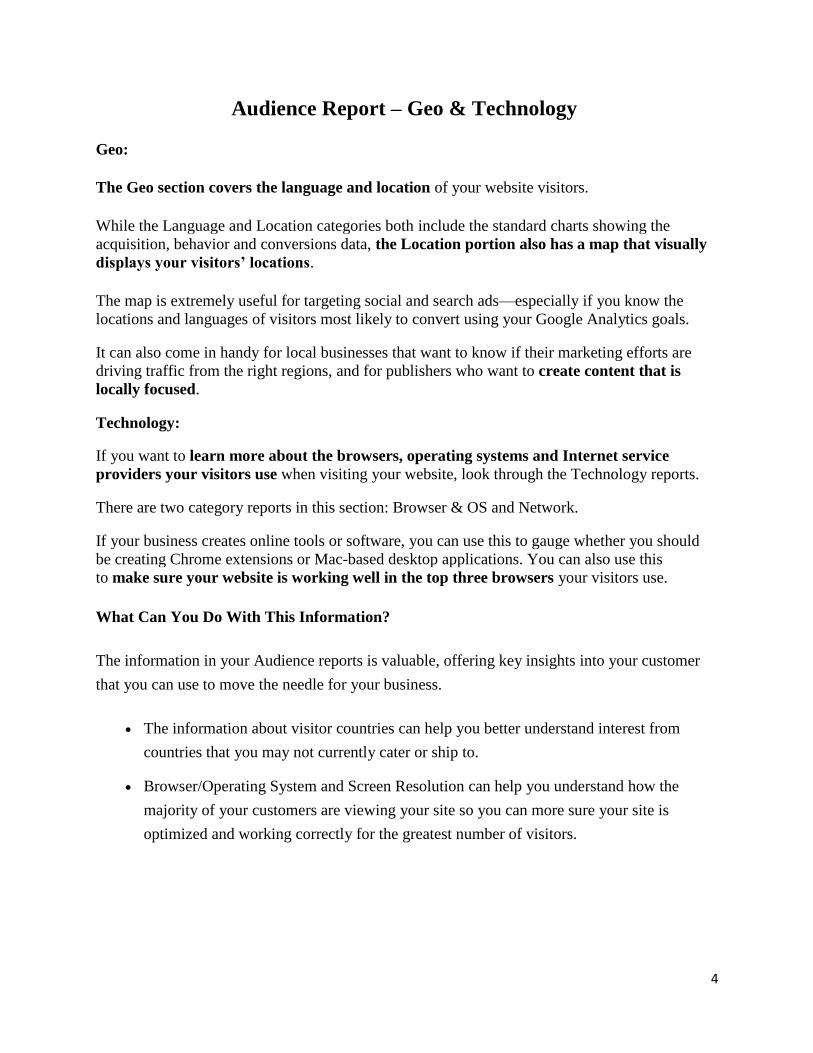
Audience Report – Geo & Technology
Geo:
The Geo section covers the language and location of your website visitors.
While the Language and Location categories both include the standard charts showing the acquisition, behavior and conversions data, the Location portion also has a map that visually displays your visitors’ locations.
The map is extremely useful for targeting social and search ads—especially if you know the locations and languages of visitors most likely to convert using your Google Analytics goals.
It can also come in handy for local businesses that want to know if their marketing efforts are driving traffic from the right regions, and for publishers who want to create content that is locally focused.
Technology:
If you want to learn more about the browsers, operating systems and Internet service providers your visitors use when visiting your website, look through the Technology reports.
There are two category reports in this section: Browser & OS and Network.
If your business creates online tools or software, you can use this to gauge whether you should be creating Chrome extensions or Mac-based desktop applications. You can also use this to make sure your website is working well in the top three browsers your visitors use.
What Can You Do With This Information?
The information in your Audience reports is valuable, offering key insights into your customer
that you can use to move the needle for your business.
The information about visitor countries can help you better understand interest from
countries that you may not currently cater or ship to.
Browser/Operating System and Screen Resolution can help you understand how the
majority of your customers are viewing your site so you can more sure your site is
optimized and working correctly for the greatest number of visitors.

Sep 1, 2016 - Oct 30, 2016Location
Country
Conversions
Rows 1 - 10 of 12
Map Overlay
Summary
Acquisition Behavior
Sessions % NewSessions
NewUsers
BounceRate
Pages /Session
Avg. SessionDuration Transactions Revenue Ecommerce Conversion
Rate
555% of Total:
100.00%(555)
45.23%Avg for View:
45.05%(0.40%)
251% of
Total:100.40%
(250)
41.98%Avg for
View:41.98%
(0.00%)
5.23Avg for View:
5.23(0.00%)
00:08:37Avg for View:
00:08:37(0.00%)
0% of Total:
0.00%(0)
CA$0.00% of
Total:0.00%
(CA$0.00)
0.00%Avg for View:
0.00%(0.00%)
1. Canada 386(69.55%)
22.54% 87(34.66%)
35.49% 6.67 00:12:12 0(0.00%)
CA$0.00(0.00%)
0.00%
2. (not set) 69(12.43%)
100.00% 69(27.49%)
88.41% 1.22 00:00:00 0(0.00%)
CA$0.00(0.00%)
0.00%
3. United States 33(5.95%)
100.00% 33(13.15%)
72.73% 1.55 00:00:12 0(0.00%)
CA$0.00(0.00%)
0.00%
4. India 22(3.96%)
81.82% 18(7.17%)
18.18% 3.45 00:03:07 0(0.00%)
CA$0.00(0.00%)
0.00%
5. United Kingdom 21(3.78%)
100.00% 21(8.37%)
4.76% 2.90 00:00:05 0(0.00%)
CA$0.00(0.00%)
0.00%
6. Austria 16(2.88%)
100.00% 16(6.37%)
12.50% 2.75 00:00:00 0(0.00%)
CA$0.00(0.00%)
0.00%
7. Hong Kong 2(0.36%)
50.00% 1(0.40%)
0.00% 2.00 00:00:04 0(0.00%)
CA$0.00(0.00%)
0.00%
8. Vietnam 2(0.36%)
100.00% 2(0.80%)
100.00% 1.00 00:00:00 0(0.00%)
CA$0.00(0.00%)
0.00%
9. China 1(0.18%)
100.00% 1(0.40%)
100.00% 1.00 00:00:00 0(0.00%)
CA$0.00(0.00%)
0.00%
10. Malaysia 1(0.18%)
100.00% 1(0.40%)
0.00% 2.00 00:00:15 0(0.00%)
CA$0.00(0.00%)
0.00%
111 386386386
eCommerce
All Users100.00% Sessions
Linara Jewellery
All Web Site Data GO TO REPORT

Sep 1, 2016 - Oct 30, 2016Browser & OS
Browser
Conversions
Rows 1 - 10 of 10
Explorer
Summary
Acquisition Behavior
Sessions % NewSessions
NewUsers
BounceRate
Pages /Session
Avg. SessionDuration Transactions Revenue Ecommerce Conversion
Rate
555% of Total:
100.00%(555)
45.23%Avg for View:
45.05%(0.40%)
251% of
Total:100.40%
(250)
41.98%Avg for
View:41.98%
(0.00%)
5.23Avg for View:
5.23(0.00%)
00:08:37Avg for View:
00:08:37(0.00%)
0% of Total:
0.00%(0)
CA$0.00% of
Total:0.00%
(CA$0.00)
0.00%Avg for View:
0.00%(0.00%)
1. Chrome 419(75.50%)
33.41% 140(55.78%)
29.59% 6.37 00:11:00 0(0.00%)
CA$0.00(0.00%)
0.00%
2. Shopify-Charlotte 61(10.99%)
100.00% 61(24.30%)
100.00% 1.00 00:00:00 0(0.00%)
CA$0.00(0.00%)
0.00%
3. Safari 39(7.03%)
51.28% 20(7.97%)
69.23% 2.15 00:02:50 0(0.00%)
CA$0.00(0.00%)
0.00%
4. Internet Explorer 12(2.16%)
66.67% 8(3.19%)
33.33% 2.50 00:01:14 0(0.00%)
CA$0.00(0.00%)
0.00%
5. Firefox 11(1.98%)
100.00% 11(4.38%)
81.82% 3.36 00:04:17 0(0.00%)
CA$0.00(0.00%)
0.00%
6. Edge 5(0.90%)
60.00% 3(1.20%)
20.00% 3.00 00:00:26 0(0.00%)
CA$0.00(0.00%)
0.00%
7. Safari (in-app) 5(0.90%)
100.00% 5(1.99%)
80.00% 1.20 00:00:03 0(0.00%)
CA$0.00(0.00%)
0.00%
8. (not set) 1(0.18%)
100.00% 1(0.40%)
100.00% 1.00 00:00:00 0(0.00%)
CA$0.00(0.00%)
0.00%
9. Mozilla 1(0.18%)
100.00% 1(0.40%)
100.00% 1.00 00:00:00 0(0.00%)
CA$0.00(0.00%)
0.00%
10. Mozilla Compatible Agent 1(0.18%)
100.00% 1(0.40%)
100.00% 1.00 00:00:00 0(0.00%)
CA$0.00(0.00%)
0.00%
Sessions Bounce Rate
Sep 8 Sep 15 Sep 22 Sep 29 Oct 6 Oct 13 Oct 20 Oct 27
252525
505050
50.00%50.00%50.00%
100.00%100.00%100.00%
eCommerce
© 2016 Google
All Users100.00% Sessions
Linara Jewellery
All Web Site Data GO TO REPORT

5
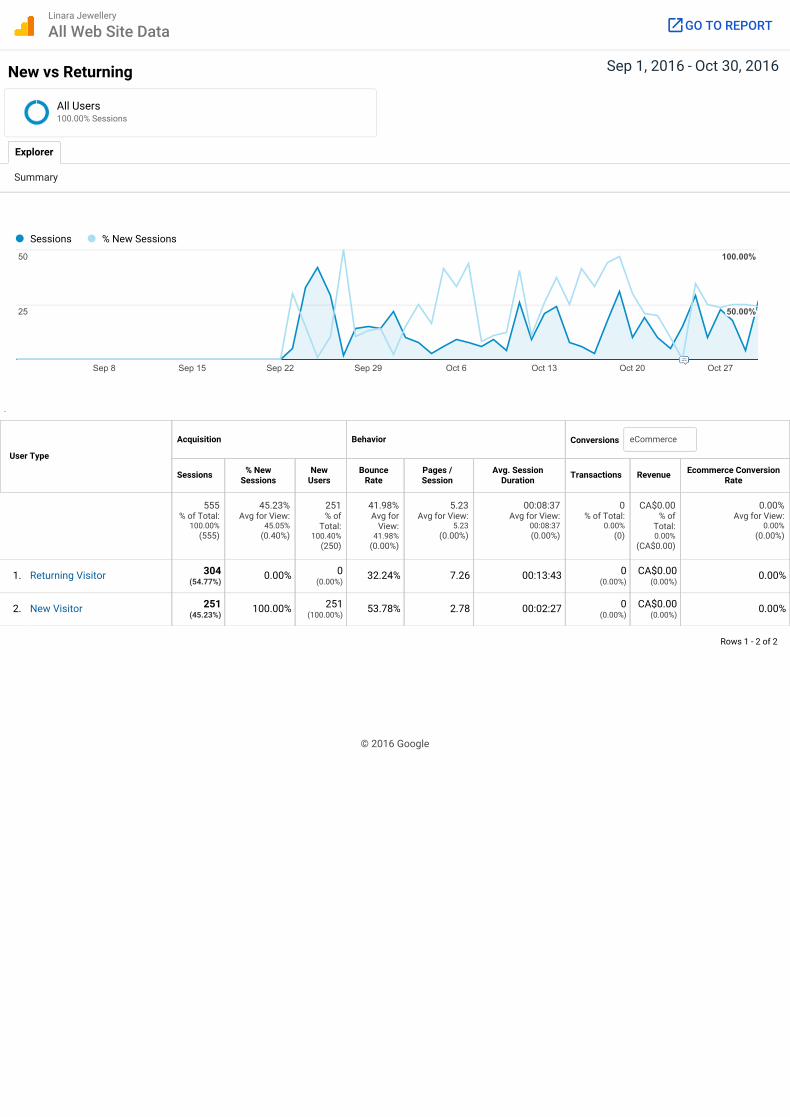
Audience: Behavior (New vs. Returning)
Measure the gravitational pull of your site, and the extent to which you’re encouraging first-time
users to return. You can also see the economic impact of new vs. returning users (e.g., the 30%
of users who are returning account for 45% of total transactions).
The report has two rows of data: New Visitor and Returning Visitor.
By default you see the site usage data which includes Visits, Pages per Visit, Average Visit Duration and Bounce Rate for each row. Immediately you can use this to see which one has a better interaction with the site and which you see more of.
Sep 1, 2016 - Oct 30, 2016New vs Returning
User Type
Conversions
Rows 1 - 2 of 2
Explorer
Summary
Acquisition Behavior
Sessions % NewSessions
NewUsers
BounceRate
Pages /Session
Avg. SessionDuration Transactions Revenue Ecommerce Conversion
Rate
555% of Total:
100.00%(555)
45.23%Avg for View:
45.05%(0.40%)
251% of
Total:100.40%
(250)
41.98%Avg for
View:41.98%
(0.00%)
5.23Avg for View:
5.23(0.00%)
00:08:37Avg for View:
00:08:37(0.00%)
0% of Total:
0.00%(0)
CA$0.00% of
Total:0.00%
(CA$0.00)
0.00%Avg for View:
0.00%(0.00%)
1. Returning Visitor 304(54.77%)
0.00% 0(0.00%)
32.24% 7.26 00:13:43 0(0.00%)
CA$0.00(0.00%)
0.00%
2. New Visitor 251(45.23%)
100.00% 251(100.00%)
53.78% 2.78 00:02:27 0(0.00%)
CA$0.00(0.00%)
0.00%
Sessions % New Sessions
Sep 8 Sep 15 Sep 22 Sep 29 Oct 6 Oct 13 Oct 20 Oct 27
252525
505050
50.00%50.00%50.00%
100.00%100.00%100.00%
eCommerce
© 2016 Google
All Users100.00% Sessions
Linara Jewellery
All Web Site Data GO TO REPORT
6
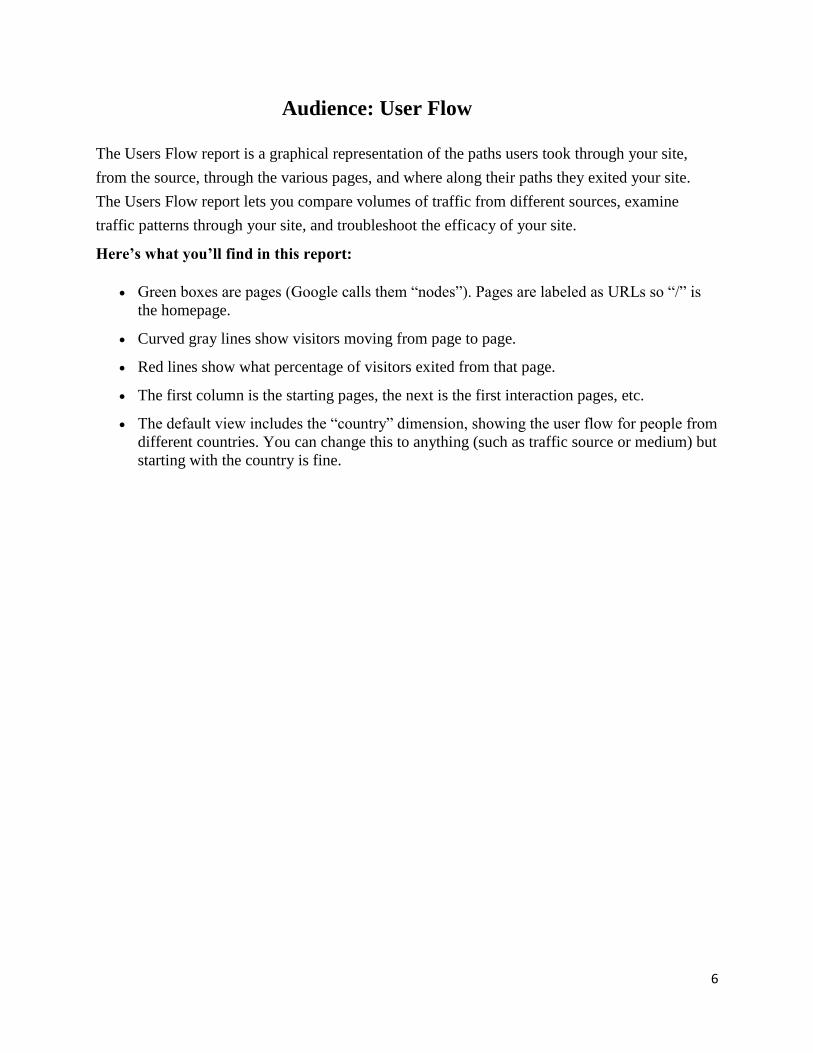
Audience: User Flow
The Users Flow report is a graphical representation of the paths users took through your site,
from the source, through the various pages, and where along their paths they exited your site.
The Users Flow report lets you compare volumes of traffic from different sources, examine
traffic patterns through your site, and troubleshoot the efficacy of your site.
Here’s what you’ll find in this report:
Green boxes are pages (Google calls them “nodes”). Pages are labeled as URLs so “/” is
the homepage.
Curved gray lines show visitors moving from page to page.
Red lines show what percentage of visitors exited from that page.
The first column is the starting pages, the next is the first interaction pages, etc.
The default view includes the “country” dimension, showing the user flow for people from
different countries. You can change this to anything (such as traffic source or medium) but starting with the country is fine.

Sep 1, 2016 - Oct 30, 2016Users Flow
Country555 sessions, 327 drop-offs 228 sessions, 76 drop-offs 152 sessions, 37 drop-offs 115 sessions, 21 drop-offsStarting pages 1st Interaction 2nd Interaction 3rd Interaction
Canada386
India22
United States33
United Kingdom21
...24
(not set)69
(57 more pages)172
/280
/channel/uc...jrhm0-mbfg41
/pages/bridal20
/sharebutton.to24
/www1.free-...uttons.top18
/pages/contact-us41
(35 more pages)94
/collections17
/blogs/gems...or-october16
/pages/bridal43
/pages/jewellery17
(39 more pages)77
/25
/pages/diamonds9
/pages/bridal19
/collection.../solitaire10
/pages/jewellery12
/14
/collections8
/pages/contact-us10
(35 more pages)61
/collection.../solitaire8
/pages/bridal14
⇩
⇩
© 2016 Google
All Users100.00% Sessions
Linara Jewellery
All Web Site Data GO TO REPORT

7
Acquisition Report
The Acquisition reports is really important because it provides information about how your
visitors found you and how they arrived at your site. Understanding what's working (and not
working) to drive visitors and customers can help you identify how to drive even more.
By default, the Acquisition Overview report will help you understand:
Which channels drive the most visitors?
Which channels drive the visitors who engage most with your site the most?
Which channels drive the visitors who result in the most sales?
Besides the Acquisition Overview report, you should also check out the All Referrals report on
a regular basis. This report will show you pages and domains that are linking to your store and
driving traffic.
What Can You Do With This Information?
Acquisition reports can provide some key understandings into how people are finding your site.
In turn, this helps you figure out how to reach even more people.
Knowing which channels are driving traffic and sales means you can focus on the
channels that are most effective for you.
Understanding what other websites are linking to you and the volume of traffic they're
driving helps you to understand where other opportunities may exist.

8
Acquisition: Channels
The Channels section is similar to the Acquisition Overview, except it gives you a graph to go
along with the acquisition, behavior and conversions details.
You can click any of the channel links to see related standard reports with more details.
Organic Search takes you to the Keywords report; Direct takes you to the top landing pages for direct visitors; Referral takes you to your top referring websites and Social takes you to your top-referring social networks.

Sep 1, 2016 - Oct 30, 2016Channels
Default Channel Grouping
Conversions
Rows 1 - 4 of 4
Explorer
Summary
Acquisition Behavior
Sessions % NewSessions
NewUsers
BounceRate
Pages /Session
Avg. SessionDuration
Ecommerce ConversionRate Transactions Revenue
555% of Total:
100.00%(555)
45.23%Avg for View:
45.05%(0.40%)
251% of
Total:100.40%
(250)
41.98%Avg for
View:41.98%
(0.00%)
5.23Avg for View:
5.23(0.00%)
00:08:37Avg for View:
00:08:37(0.00%)
0.00%Avg for View:
0.00%(0.00%)
0% of Total:
0.00%(0)
CA$0.00% of
Total:0.00%
(CA$0.00)
1. Direct 232(41.80%)
65.52% 152(60.56%)
55.60% 4.00 00:06:16 0.00% 0(0.00%)
CA$0.00(0.00%)
2. Organic Search 163(29.37%)
36.81% 60(23.90%)
30.06% 4.10 00:06:43 0.00% 0(0.00%)
CA$0.00(0.00%)
3. Referral 106(19.10%)
32.08% 34(13.55%)
35.85% 7.75 00:11:14 0.00% 0(0.00%)
CA$0.00(0.00%)
4. Social 54(9.73%)
9.26% 5(1.99%)
31.48% 9.04 00:19:26 0.00% 0(0.00%)
CA$0.00(0.00%)
Sessions Bounce Rate
Sep 8 Sep 15 Sep 22 Sep 29 Oct 6 Oct 13 Oct 20 Oct 27
252525
505050
50.00%50.00%50.00%
100.00%100.00%100.00%
eCommerce
© 2016 Google
All Users100.00% Sessions
Linara Jewellery
All Web Site Data GO TO REPORT
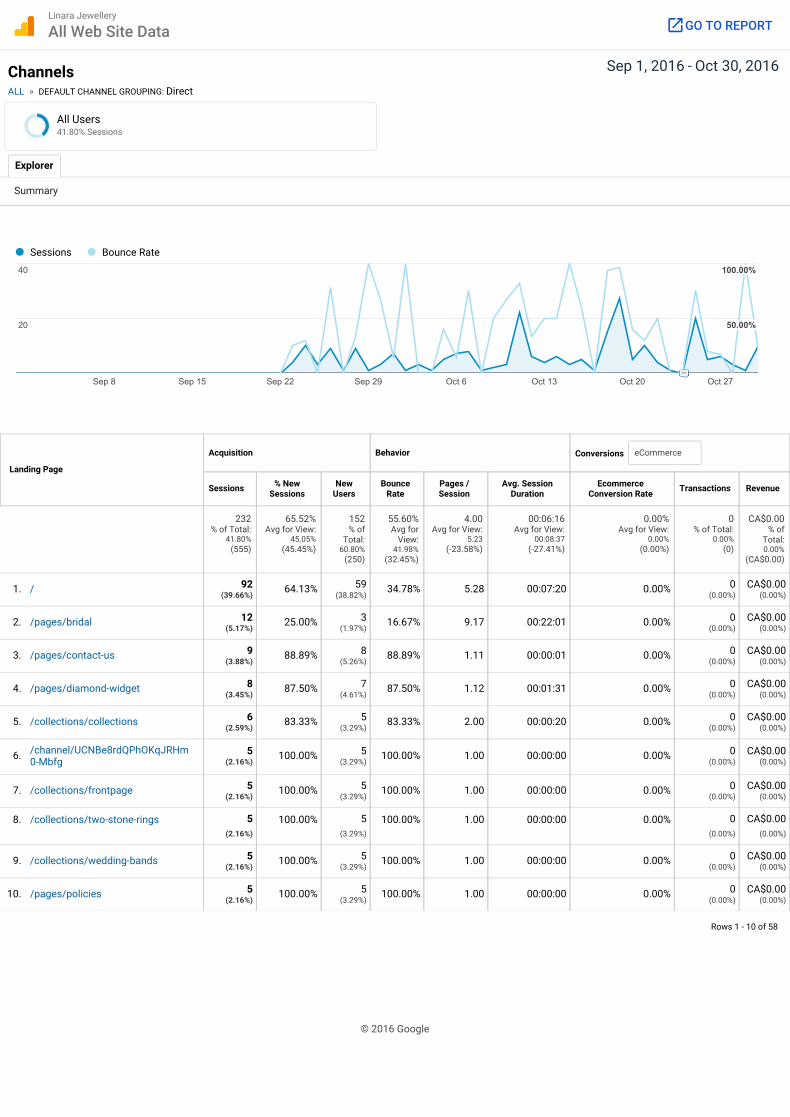
Sep 1, 2016 - Oct 30, 2016ChannelsALL » DEFAULT CHANNEL GROUPING: Direct
Landing Page
Conversions
Rows 1 - 10 of 58
Explorer
Summary
Acquisition Behavior
Sessions % NewSessions
NewUsers
BounceRate
Pages /Session
Avg. SessionDuration
EcommerceConversion Rate Transactions Revenue
232% of Total:
41.80%(555)
65.52%Avg for View:
45.05%(45.45%)
152% of
Total:60.80%
(250)
55.60%Avg for
View:41.98%
(32.45%)
4.00Avg for View:
5.23(-23.58%)
00:06:16Avg for View:
00:08:37(-27.41%)
0.00%Avg for View:
0.00%(0.00%)
0% of Total:
0.00%(0)
CA$0.00% of
Total:0.00%
(CA$0.00)
1. 92(39.66%)
64.13% 59(38.82%)
34.78% 5.28 00:07:20 0.00% 0(0.00%)
CA$0.00(0.00%)
2. 12(5.17%)
25.00% 3(1.97%)
16.67% 9.17 00:22:01 0.00% 0(0.00%)
CA$0.00(0.00%)
3. 9(3.88%)
88.89% 8(5.26%)
88.89% 1.11 00:00:01 0.00% 0(0.00%)
CA$0.00(0.00%)
4. 8(3.45%)
87.50% 7(4.61%)
87.50% 1.12 00:01:31 0.00% 0(0.00%)
CA$0.00(0.00%)
5. 6(2.59%)
83.33% 5(3.29%)
83.33% 2.00 00:00:20 0.00% 0(0.00%)
CA$0.00(0.00%)
6. 5(2.16%)
100.00% 5(3.29%)
100.00% 1.00 00:00:00 0.00% 0(0.00%)
CA$0.00(0.00%)
7. 5(2.16%)
100.00% 5(3.29%)
100.00% 1.00 00:00:00 0.00% 0(0.00%)
CA$0.00(0.00%)
8. 5(2.16%)
100.00% 5(3.29%)
100.00% 1.00 00:00:00 0.00% 0(0.00%)
CA$0.00(0.00%)
9. 5(2.16%)
100.00% 5(3.29%)
100.00% 1.00 00:00:00 0.00% 0(0.00%)
CA$0.00(0.00%)
10. 5(2.16%)
100.00% 5(3.29%)
100.00% 1.00 00:00:00 0.00% 0(0.00%)
CA$0.00(0.00%)
Sessions Bounce Rate
Sep 8 Sep 15 Sep 22 Sep 29 Oct 6 Oct 13 Oct 20 Oct 27
202020
404040
50.00%50.00%50.00%
100.00%100.00%100.00%
eCommerce
/
/pages/bridal
/pages/contact-us
/pages/diamond-widget
/collections/collections
/channel/UCNBe8rdQPhOKqJRHm0-Mbfg
/collections/frontpage
/collections/two-stone-rings
/collections/wedding-bands
/pages/policies
© 2016 Google
All Users41.80% Sessions
Linara Jewellery
All Web Site Data GO TO REPORT
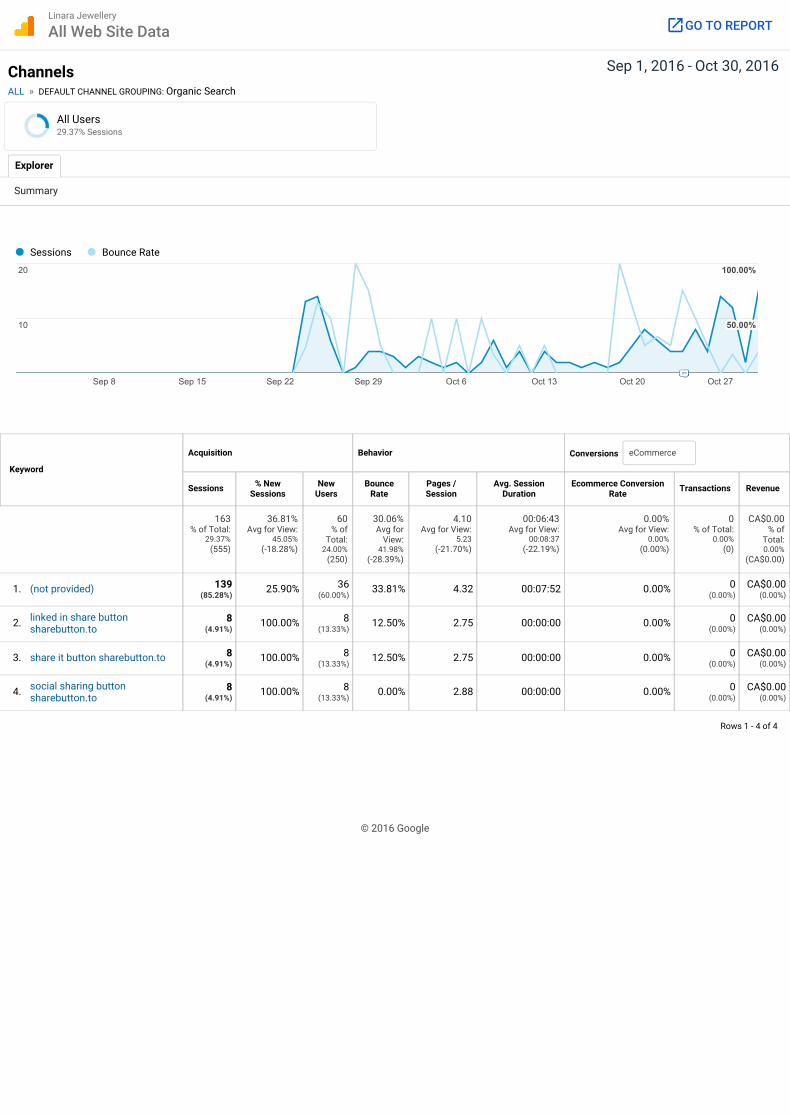
Sep 1, 2016 - Oct 30, 2016ChannelsALL » DEFAULT CHANNEL GROUPING: Organic Search
Keyword
Conversions
Rows 1 - 4 of 4
Explorer
Summary
Acquisition Behavior
Sessions % NewSessions
NewUsers
BounceRate
Pages /Session
Avg. SessionDuration
Ecommerce ConversionRate Transactions Revenue
163% of Total:
29.37%(555)
36.81%Avg for View:
45.05%(-18.28%)
60% of
Total:24.00%
(250)
30.06%Avg for
View:41.98%
(-28.39%)
4.10Avg for View:
5.23(-21.70%)
00:06:43Avg for View:
00:08:37(-22.19%)
0.00%Avg for View:
0.00%(0.00%)
0% of Total:
0.00%(0)
CA$0.00% of
Total:0.00%
(CA$0.00)
1. (not provided) 139(85.28%)
25.90% 36(60.00%)
33.81% 4.32 00:07:52 0.00% 0(0.00%)
CA$0.00(0.00%)
2. linked in share buttonsharebutton.to
8(4.91%)
100.00% 8(13.33%)
12.50% 2.75 00:00:00 0.00% 0(0.00%)
CA$0.00(0.00%)
3. share it button sharebutton.to 8(4.91%)
100.00% 8(13.33%)
12.50% 2.75 00:00:00 0.00% 0(0.00%)
CA$0.00(0.00%)
4. social sharing buttonsharebutton.to
8(4.91%)
100.00% 8(13.33%)
0.00% 2.88 00:00:00 0.00% 0(0.00%)
CA$0.00(0.00%)
Sessions Bounce Rate
Sep 8 Sep 15 Sep 22 Sep 29 Oct 6 Oct 13 Oct 20 Oct 27
101010
202020
50.00%50.00%50.00%
100.00%100.00%100.00%
eCommerce
© 2016 Google
All Users29.37% Sessions
Linara Jewellery
All Web Site Data GO TO REPORT

Sep 1, 2016 - Oct 30, 2016ChannelsALL » DEFAULT CHANNEL GROUPING: Referral
Source
Conversions
Rows 1 - 9 of 9
Explorer
Summary
Acquisition Behavior
Sessions % NewSessions
NewUsers
BounceRate
Pages /Session
Avg. SessionDuration
Ecommerce ConversionRate Transactions Revenue
106% of Total:
19.10%(555)
32.08%Avg for View:
45.05%(-28.79%)
34% of
Total:13.60%
(250)
35.85%Avg for
View:41.98%
(-14.61%)
7.75Avg for View:
5.23(47.97%)
00:11:14Avg for View:
00:08:37(30.20%)
0.00%Avg for View:
0.00%(0.00%)
0% of Total:
0.00%(0)
CA$0.00% of
Total:0.00%
(CA$0.00)
1. linara.myshopify.com 45(42.45%)
0.00% 0(0.00%)
40.00% 13.56 00:25:01 0.00% 0(0.00%)
CA$0.00(0.00%)
2. linara.us14.list-manage.com 16(15.09%)
0.00% 0(0.00%)
43.75% 5.94 00:01:58 0.00% 0(0.00%)
CA$0.00(0.00%)
3. member.rapnet.com 14(13.21%)
85.71% 12(35.29%)
14.29% 2.86 00:01:29 0.00% 0(0.00%)
CA$0.00(0.00%)
4. linara.ca 10(9.43%)
30.00% 3(8.82%)
90.00% 1.10 00:00:48 0.00% 0(0.00%)
CA$0.00(0.00%)
5. 84659758-1.site-speed-check.online
9(8.49%)
100.00% 9(26.47%)
0.00% 3.00 00:00:00 0.00% 0(0.00%)
CA$0.00(0.00%)
6. 84659758-1.site-speed-up.site 9(8.49%)
100.00% 9(26.47%)
0.00% 3.00 00:00:00 0.00% 0(0.00%)
CA$0.00(0.00%)
7. ghadadesign.ca 1(0.94%)
100.00% 1(2.94%)
100.00% 1.00 00:00:00 0.00% 0(0.00%)
CA$0.00(0.00%)
8. outlook.live.com 1(0.94%)
0.00% 0(0.00%)
0.00% 9.00 00:03:55 0.00% 0(0.00%)
CA$0.00(0.00%)
9. us14.admin.mailchimp.com 1(0.94%)
0.00% 0(0.00%)
100.00% 1.00 00:00:00 0.00% 0(0.00%)
CA$0.00(0.00%)
Sessions Bounce Rate
Sep 8 Sep 15 Sep 22 Sep 29 Oct 6 Oct 13 Oct 20 Oct 27
101010
202020
50.00%50.00%50.00%
100.00%100.00%100.00%
eCommerce
© 2016 Google
All Users19.10% Sessions
Linara Jewellery
All Web Site Data GO TO REPORT

Sep 1, 2016 - Oct 30, 2016ChannelsALL » DEFAULT CHANNEL GROUPING: Social
Social Network
Conversions
Rows 1 - 6 of 6
Explorer
Summary
Acquisition Behavior
Sessions % NewSessions
NewUsers
BounceRate
Pages /Session
Avg. SessionDuration
Ecommerce ConversionRate Transactions Revenue
54% of Total:
9.73%(555)
9.26%Avg for View:
45.05%(-79.44%)
5% of
Total:2.00%(250)
31.48%Avg for
View:41.98%
(-25.01%)
9.04Avg for View:
5.23(72.65%)
00:19:26Avg for View:
00:08:37(125.45%)
0.00%Avg for View:
0.00%(0.00%)
0% of Total:
0.00%(0)
CA$0.00% of
Total:0.00%
(CA$0.00)
1. LinkedIn 22(40.74%)
9.09% 2(40.00%)
31.82% 15.73 00:30:07 0.00% 0(0.00%)
CA$0.00(0.00%)
2. Facebook 12(22.22%)
25.00% 3(60.00%)
16.67% 7.25 00:16:43 0.00% 0(0.00%)
CA$0.00(0.00%)
3. Pinterest 9(16.67%)
0.00% 0(0.00%)
44.44% 2.22 00:08:35 0.00% 0(0.00%)
CA$0.00(0.00%)
4. Twitter 8(14.81%)
0.00% 0(0.00%)
25.00% 3.75 00:13:35 0.00% 0(0.00%)
CA$0.00(0.00%)
5. Instagram 2(3.70%)
0.00% 0(0.00%)
100.00% 1.00 00:00:00 0.00% 0(0.00%)
CA$0.00(0.00%)
6. Google+ 1(1.85%)
0.00% 0(0.00%)
0.00% 3.00 00:00:26 0.00% 0(0.00%)
CA$0.00(0.00%)
Sessions Bounce Rate
Sep 8 Sep 15 Sep 22 Sep 29 Oct 6 Oct 13 Oct 20 Oct 27
555
101010
50.00%50.00%50.00%
100.00%100.00%100.00%
eCommerce
© 2016 Google
All Users9.73% Sessions
Linara Jewellery
All Web Site Data GO TO REPORT

9
Acquisition: Source/Medium
All Traffic lists your top traffic sources from all channels combined. Instead of separating search engines from social networks from referral websites, they are all listed based on the number of visitors they sent to your website.
The All Traffic section lets you quickly analyze where most of your traffic comes from—it may be a particular search engine, a publication you contribute to or even a directory you advertise with.

Sep 1, 2016 - Oct 30, 2016All Traffic
Source / Medium
Conversions
Rows 1 - 10 of 21
Explorer
Summary
Acquisition Behavior
Sessions % NewSessions
NewUsers
BounceRate
Pages /Session
Avg. SessionDuration
EcommerceConversion Rate Transactions Revenue
555% of Total:
100.00%(555)
45.23%Avg for View:
45.05%(0.40%)
251% of
Total:100.40%
(250)
41.98%Avg for
View:41.98%
(0.00%)
5.23Avg for View:
5.23(0.00%)
00:08:37Avg for View:
00:08:37(0.00%)
0.00%Avg for View:
0.00%(0.00%)
0% of Total:
0.00%(0)
CA$0.00% of
Total:0.00%
(CA$0.00)
1. (direct) / (none) 232(41.80%)
65.52% 152(60.56%)
55.60% 4.00 00:06:16 0.00% 0(0.00%)
CA$0.00(0.00%)
2. google / organic 160(28.83%)
36.88% 59(23.51%)
30.00% 4.12 00:06:50 0.00% 0(0.00%)
CA$0.00(0.00%)
3. linara.myshopify.com / referral 45(8.11%)
0.00% 0(0.00%)
40.00% 13.56 00:25:01 0.00% 0(0.00%)
CA$0.00(0.00%)
4. linkedin.com / referral 21(3.78%)
4.76% 1(0.40%)
28.57% 16.43 00:31:34 0.00% 0(0.00%)
CA$0.00(0.00%)
5. linara.us14.list-manage.com / referral 16(2.88%)
0.00% 0(0.00%)
43.75% 5.94 00:01:58 0.00% 0(0.00%)
CA$0.00(0.00%)
6. member.rapnet.com / referral 14(2.52%)
85.71% 12(4.78%)
14.29% 2.86 00:01:29 0.00% 0(0.00%)
CA$0.00(0.00%)
7. linara.ca / referral 10(1.80%)
30.00% 3(1.20%)
90.00% 1.10 00:00:48 0.00% 0(0.00%)
CA$0.00(0.00%)
8. 84659758-1.site-speed-check.online /referral
9(1.62%)
100.00% 9(3.59%)
0.00% 3.00 00:00:00 0.00% 0(0.00%)
CA$0.00(0.00%)
9. 84659758-1.site-speed-up.site /referral
9(1.62%)
100.00% 9(3.59%)
0.00% 3.00 00:00:00 0.00% 0(0.00%)
CA$0.00(0.00%)
10. facebook.com / referral 9(1.62%)
11.11% 1(0.40%)
11.11% 9.11 00:22:14 0.00% 0(0.00%)
CA$0.00(0.00%)
Sessions Bounce Rate
Sep 8 Sep 15 Sep 22 Sep 29 Oct 6 Oct 13 Oct 20 Oct 27
252525
505050
50.00%50.00%50.00%
100.00%100.00%100.00%
eCommerce
© 2016 Google
All Users100.00% Sessions
Linara Jewellery
All Web Site Data GO TO REPORT

10
Acquisition: Referral Traffic
All Referrals leaves out search engines and direct traffic, and only shows website domains (including social networks) that have referred traffic to your website.
You can click on any of the domains—some let you see the specific pages that referred traffic. This is helpful if the referral source is a blog, for example. By clicking on the domain, you can see the specific posts that are sending visitors to your website.
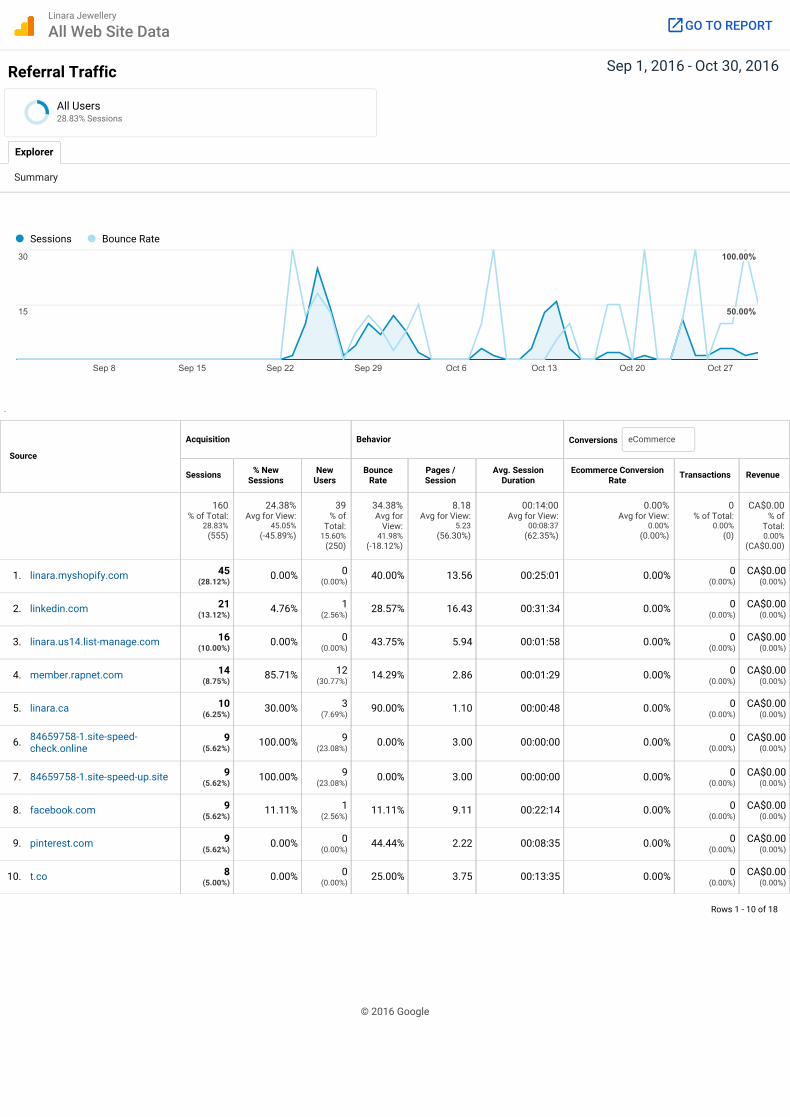
Sep 1, 2016 - Oct 30, 2016Referral Traffic
Source
Conversions
Rows 1 - 10 of 18
Explorer
Summary
Acquisition Behavior
Sessions % NewSessions
NewUsers
BounceRate
Pages /Session
Avg. SessionDuration
Ecommerce ConversionRate Transactions Revenue
160% of Total:
28.83%(555)
24.38%Avg for View:
45.05%(-45.89%)
39% of
Total:15.60%
(250)
34.38%Avg for
View:41.98%
(-18.12%)
8.18Avg for View:
5.23(56.30%)
00:14:00Avg for View:
00:08:37(62.35%)
0.00%Avg for View:
0.00%(0.00%)
0% of Total:
0.00%(0)
CA$0.00% of
Total:0.00%
(CA$0.00)
1. linara.myshopify.com 45(28.12%)
0.00% 0(0.00%)
40.00% 13.56 00:25:01 0.00% 0(0.00%)
CA$0.00(0.00%)
2. linkedin.com 21(13.12%)
4.76% 1(2.56%)
28.57% 16.43 00:31:34 0.00% 0(0.00%)
CA$0.00(0.00%)
3. linara.us14.list-manage.com 16(10.00%)
0.00% 0(0.00%)
43.75% 5.94 00:01:58 0.00% 0(0.00%)
CA$0.00(0.00%)
4. member.rapnet.com 14(8.75%)
85.71% 12(30.77%)
14.29% 2.86 00:01:29 0.00% 0(0.00%)
CA$0.00(0.00%)
5. linara.ca 10(6.25%)
30.00% 3(7.69%)
90.00% 1.10 00:00:48 0.00% 0(0.00%)
CA$0.00(0.00%)
6. 84659758-1.site-speed-check.online
9(5.62%)
100.00% 9(23.08%)
0.00% 3.00 00:00:00 0.00% 0(0.00%)
CA$0.00(0.00%)
7. 84659758-1.site-speed-up.site 9(5.62%)
100.00% 9(23.08%)
0.00% 3.00 00:00:00 0.00% 0(0.00%)
CA$0.00(0.00%)
8. facebook.com 9(5.62%)
11.11% 1(2.56%)
11.11% 9.11 00:22:14 0.00% 0(0.00%)
CA$0.00(0.00%)
9. pinterest.com 9(5.62%)
0.00% 0(0.00%)
44.44% 2.22 00:08:35 0.00% 0(0.00%)
CA$0.00(0.00%)
10. t.co 8(5.00%)
0.00% 0(0.00%)
25.00% 3.75 00:13:35 0.00% 0(0.00%)
CA$0.00(0.00%)
Sessions Bounce Rate
Sep 8 Sep 15 Sep 22 Sep 29 Oct 6 Oct 13 Oct 20 Oct 27
151515
303030
50.00%50.00%50.00%
100.00%100.00%100.00%
eCommerce
© 2016 Google
All Users28.83% Sessions
Linara Jewellery
All Web Site Data GO TO REPORT
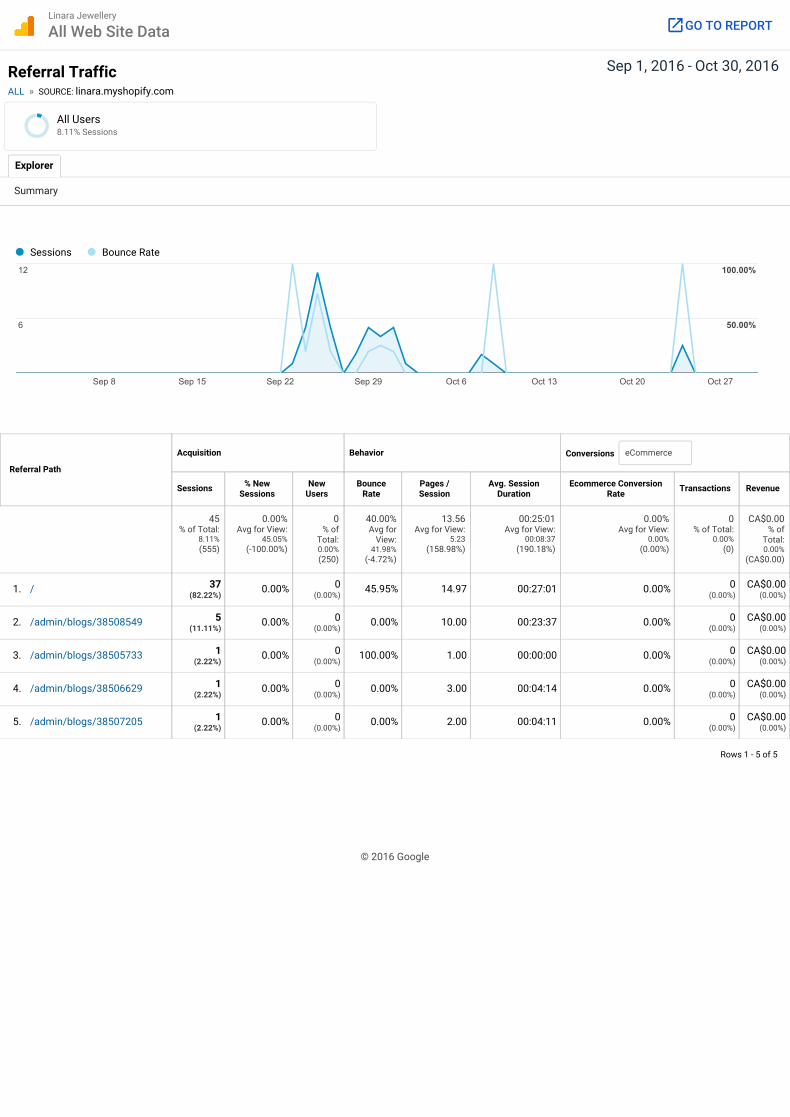
Sep 1, 2016 - Oct 30, 2016Referral TrafficALL » SOURCE: linara.myshopify.com
Referral Path
Conversions
Rows 1 - 5 of 5
Explorer
Summary
Acquisition Behavior
Sessions % NewSessions
NewUsers
BounceRate
Pages /Session
Avg. SessionDuration
Ecommerce ConversionRate Transactions Revenue
45% of Total:
8.11%(555)
0.00%Avg for View:
45.05%(-100.00%)
0% of
Total:0.00%(250)
40.00%Avg for
View:41.98%
(-4.72%)
13.56Avg for View:
5.23(158.98%)
00:25:01Avg for View:
00:08:37(190.18%)
0.00%Avg for View:
0.00%(0.00%)
0% of Total:
0.00%(0)
CA$0.00% of
Total:0.00%
(CA$0.00)
1. 37(82.22%)
0.00% 0(0.00%)
45.95% 14.97 00:27:01 0.00% 0(0.00%)
CA$0.00(0.00%)
2. 5(11.11%)
0.00% 0(0.00%)
0.00% 10.00 00:23:37 0.00% 0(0.00%)
CA$0.00(0.00%)
3. 1(2.22%)
0.00% 0(0.00%)
100.00% 1.00 00:00:00 0.00% 0(0.00%)
CA$0.00(0.00%)
4. 1(2.22%)
0.00% 0(0.00%)
0.00% 3.00 00:04:14 0.00% 0(0.00%)
CA$0.00(0.00%)
5. 1(2.22%)
0.00% 0(0.00%)
0.00% 2.00 00:04:11 0.00% 0(0.00%)
CA$0.00(0.00%)
Sessions Bounce Rate
Sep 8 Sep 15 Sep 22 Sep 29 Oct 6 Oct 13 Oct 20 Oct 27
666
121212
50.00%50.00%50.00%
100.00%100.00%100.00%
eCommerce
/
/admin/blogs/38508549
/admin/blogs/38505733
/admin/blogs/38506629
/admin/blogs/38507205
© 2016 Google
All Users8.11% Sessions
Linara Jewellery
All Web Site Data GO TO REPORT

Sep 1, 2016 - Oct 30, 2016Referral TrafficALL » SOURCE: linkedin.com
Referral Path
Conversions
Rows 1 - 1 of 1
Explorer
Summary
Acquisition Behavior
Sessions % NewSessions
NewUsers
BounceRate
Pages /Session
Avg. SessionDuration
Ecommerce ConversionRate Transactions Revenue
21% of Total:
3.78%(555)
4.76%Avg for View:
45.05%(-89.43%)
1% of
Total:0.40%(250)
28.57%Avg for
View:41.98%
(-31.94%)
16.43Avg for View:
5.23(213.87%)
00:31:34Avg for View:
00:08:37(266.00%)
0.00%Avg for View:
0.00%(0.00%)
0% of Total:
0.00%(0)
CA$0.00% of
Total:0.00%
(CA$0.00)
1. 21(100.00%)
4.76% 1(100.00%)
28.57% 16.43 00:31:34 0.00% 0(0.00%)
CA$0.00(0.00%)
Sessions Bounce Rate
Sep 8 Sep 15 Sep 22 Sep 29 Oct 6 Oct 13 Oct 20 Oct 27
444
888
50.00%50.00%50.00%
100.00%100.00%100.00%
eCommerce
/
© 2016 Google
All Users3.78% Sessions
Linara Jewellery
All Web Site Data GO TO REPORT
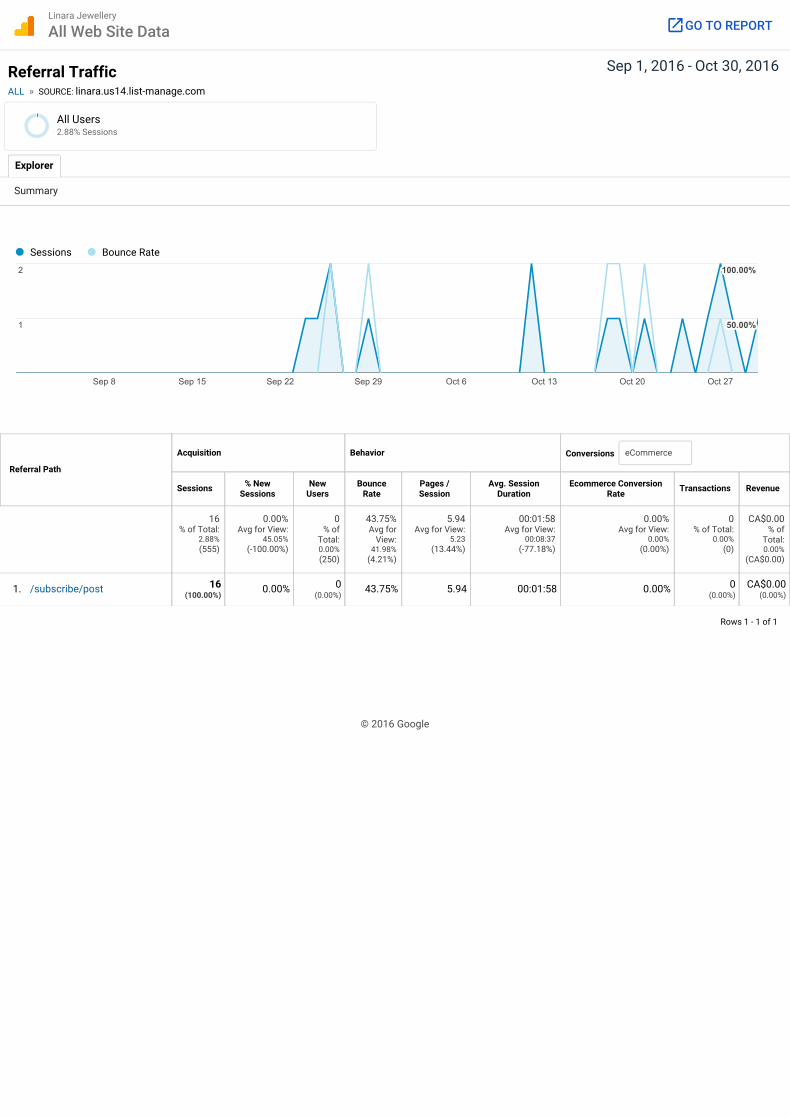
Sep 1, 2016 - Oct 30, 2016Referral TrafficALL » SOURCE: linara.us14.list-manage.com
Referral Path
Conversions
Rows 1 - 1 of 1
Explorer
Summary
Acquisition Behavior
Sessions % NewSessions
NewUsers
BounceRate
Pages /Session
Avg. SessionDuration
Ecommerce ConversionRate Transactions Revenue
16% of Total:
2.88%(555)
0.00%Avg for View:
45.05%(-100.00%)
0% of
Total:0.00%(250)
43.75%Avg for
View:41.98%
(4.21%)
5.94Avg for View:
5.23(13.44%)
00:01:58Avg for View:
00:08:37(-77.18%)
0.00%Avg for View:
0.00%(0.00%)
0% of Total:
0.00%(0)
CA$0.00% of
Total:0.00%
(CA$0.00)
1. 16(100.00%)
0.00% 0(0.00%)
43.75% 5.94 00:01:58 0.00% 0(0.00%)
CA$0.00(0.00%)
Sessions Bounce Rate
Sep 8 Sep 15 Sep 22 Sep 29 Oct 6 Oct 13 Oct 20 Oct 27
111
222
50.00%50.00%50.00%
100.00%100.00%100.00%
eCommerce
/subscribe/post
© 2016 Google
All Users2.88% Sessions
Linara Jewellery
All Web Site Data GO TO REPORT

Sep 1, 2016 - Oct 30, 2016Referral TrafficALL » SOURCE: member.rapnet.com
Referral Path
Conversions
Rows 1 - 3 of 3
Explorer
Summary
Acquisition Behavior
Sessions % NewSessions
NewUsers
BounceRate
Pages /Session
Avg. SessionDuration
EcommerceConversion Rate Transactions Revenue
14% of Total:
2.52%(555)
85.71%Avg for
View:45.05%
(90.29%)
12% of
Total:4.80%(250)
14.29%Avg for
View:41.98%
(-65.97%)
2.86Avg for
View:5.23
(-45.41%)
00:01:29Avg for View:
00:08:37(-82.87%)
0.00%Avg for View:
0.00%(0.00%)
0% of Total:
0.00%(0)
CA$0.00% of
Total:0.00%
(CA$0.00)
1. 7(50.00%)
100.00% 7(58.33%)
14.29% 2.71 00:01:05 0.00% 0(0.00%)
CA$0.00(0.00%)
2. 5(35.71%)
80.00% 4(33.33%)
0.00% 2.60 00:01:49 0.00% 0(0.00%)
CA$0.00(0.00%)
3. 2(14.29%)
50.00% 1(8.33%)
50.00% 4.00 00:02:02 0.00% 0(0.00%)
CA$0.00(0.00%)
Sessions Bounce Rate
Sep 8 Sep 15 Sep 22 Sep 29 Oct 6 Oct 13 Oct 20 Oct 27
2.52.52.5
555
20.00%20.00%20.00%
40.00%40.00%40.00%
eCommerce
/Rapnet/Members/Profile/Default.aspx
/RapNet/Members/Profile/Default.aspx
/InlineModalWindows/MemberProfile/ViewContactDetails.aspx
© 2016 Google
All Users2.52% Sessions
Linara Jewellery
All Web Site Data GO TO REPORT
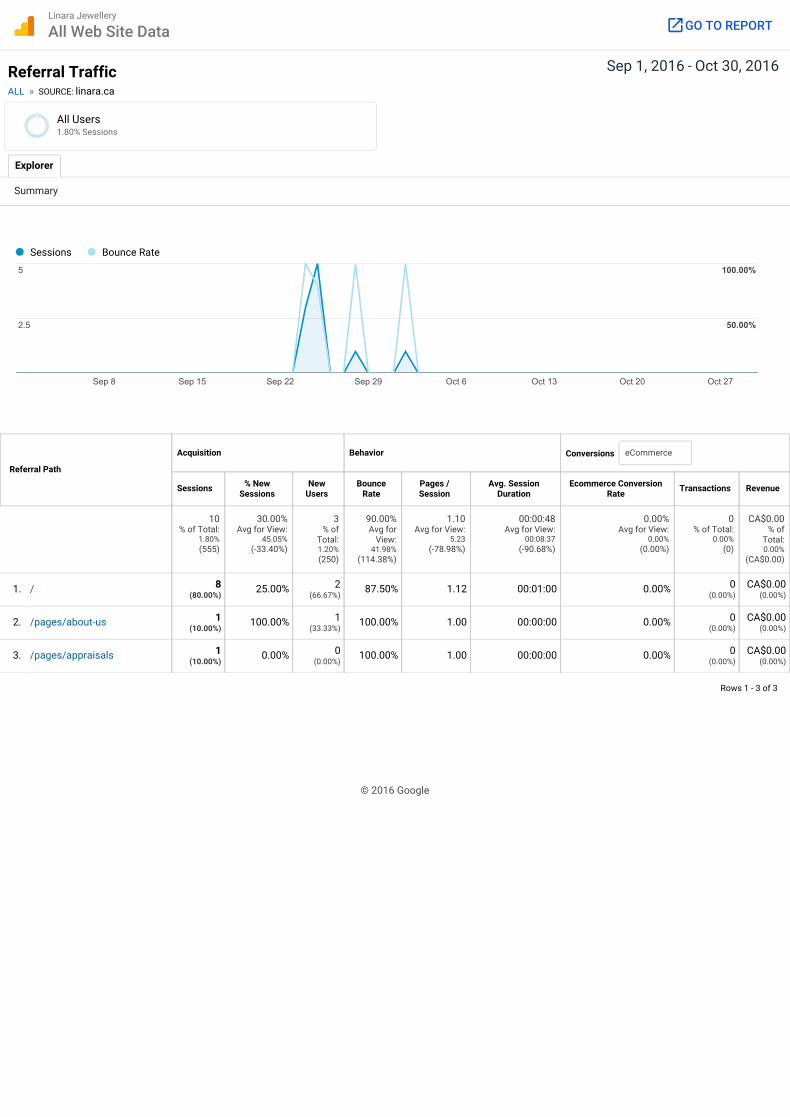
Sep 1, 2016 - Oct 30, 2016Referral TrafficALL » SOURCE: linara.ca
Referral Path
Conversions
Rows 1 - 3 of 3
Explorer
Summary
Acquisition Behavior
Sessions % NewSessions
NewUsers
BounceRate
Pages /Session
Avg. SessionDuration
Ecommerce ConversionRate Transactions Revenue
10% of Total:
1.80%(555)
30.00%Avg for View:
45.05%(-33.40%)
3% of
Total:1.20%(250)
90.00%Avg for
View:41.98%
(114.38%)
1.10Avg for View:
5.23(-78.98%)
00:00:48Avg for View:
00:08:37(-90.68%)
0.00%Avg for View:
0.00%(0.00%)
0% of Total:
0.00%(0)
CA$0.00% of
Total:0.00%
(CA$0.00)
1. 8(80.00%)
25.00% 2(66.67%)
87.50% 1.12 00:01:00 0.00% 0(0.00%)
CA$0.00(0.00%)
2. 1(10.00%)
100.00% 1(33.33%)
100.00% 1.00 00:00:00 0.00% 0(0.00%)
CA$0.00(0.00%)
3. 1(10.00%)
0.00% 0(0.00%)
100.00% 1.00 00:00:00 0.00% 0(0.00%)
CA$0.00(0.00%)
Sessions Bounce Rate
Sep 8 Sep 15 Sep 22 Sep 29 Oct 6 Oct 13 Oct 20 Oct 27
2.52.52.5
555
50.00%50.00%50.00%
100.00%100.00%100.00%
eCommerce
/
/pages/about-us
/pages/appraisals
© 2016 Google
All Users1.80% Sessions
Linara Jewellery
All Web Site Data GO TO REPORT

Sep 1, 2016 - Oct 30, 2016Referral TrafficALL » SOURCE: 84659758-1.site-speed-check.online
Referral Path
Conversions
Rows 1 - 1 of 1
Explorer
Summary
Acquisition Behavior
Sessions % NewSessions
NewUsers
BounceRate
Pages /Session
Avg. SessionDuration
Ecommerce ConversionRate Transactions Revenue
9% of Total:
1.62%(555)
100.00%Avg for View:
45.05%(122.00%)
9% of
Total:3.60%(250)
0.00%Avg for
View:41.98%
(-100.00%)
3.00Avg for View:
5.23(-42.69%)
00:00:00Avg for View:
00:08:37(-100.00%)
0.00%Avg for View:
0.00%(0.00%)
0% of Total:
0.00%(0)
CA$0.00% of
Total:0.00%
(CA$0.00)
1. 9(100.00%)
100.00% 9(100.00%)
0.00% 3.00 00:00:00 0.00% 0(0.00%)
CA$0.00(0.00%)
Sessions Bounce Rate
Sep 8 Sep 15 Sep 22 Sep 29 Oct 6 Oct 13 Oct 20 Oct 27
555
101010
0.00%0.00%0.00%
100.00%100.00%100.00%
eCommerce
/
© 2016 Google
All Users1.62% Sessions
Linara Jewellery
All Web Site Data GO TO REPORT
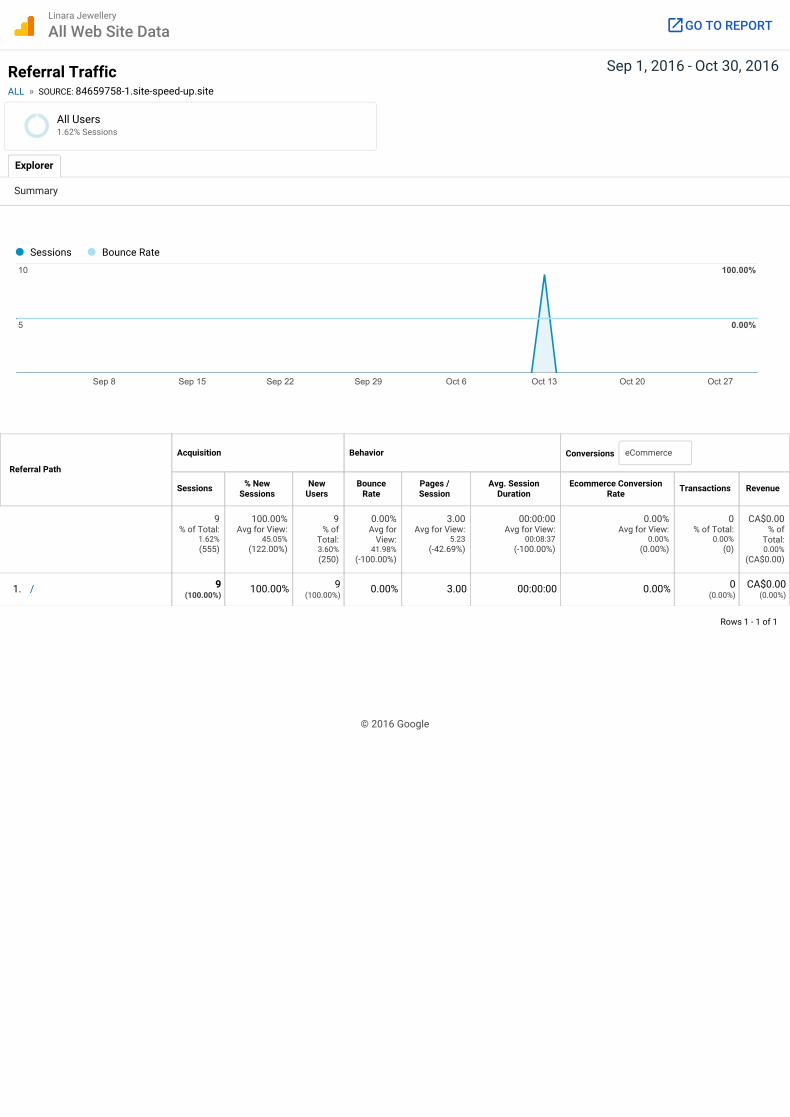
Sep 1, 2016 - Oct 30, 2016Referral TrafficALL » SOURCE: 84659758-1.site-speed-up.site
Referral Path
Conversions
Rows 1 - 1 of 1
Explorer
Summary
Acquisition Behavior
Sessions % NewSessions
NewUsers
BounceRate
Pages /Session
Avg. SessionDuration
Ecommerce ConversionRate Transactions Revenue
9% of Total:
1.62%(555)
100.00%Avg for View:
45.05%(122.00%)
9% of
Total:3.60%(250)
0.00%Avg for
View:41.98%
(-100.00%)
3.00Avg for View:
5.23(-42.69%)
00:00:00Avg for View:
00:08:37(-100.00%)
0.00%Avg for View:
0.00%(0.00%)
0% of Total:
0.00%(0)
CA$0.00% of
Total:0.00%
(CA$0.00)
1. 9(100.00%)
100.00% 9(100.00%)
0.00% 3.00 00:00:00 0.00% 0(0.00%)
CA$0.00(0.00%)
Sessions Bounce Rate
Sep 8 Sep 15 Sep 22 Sep 29 Oct 6 Oct 13 Oct 20 Oct 27
555
101010
0.00%0.00%0.00%
100.00%100.00%100.00%
eCommerce
/
© 2016 Google
All Users1.62% Sessions
Linara Jewellery
All Web Site Data GO TO REPORT
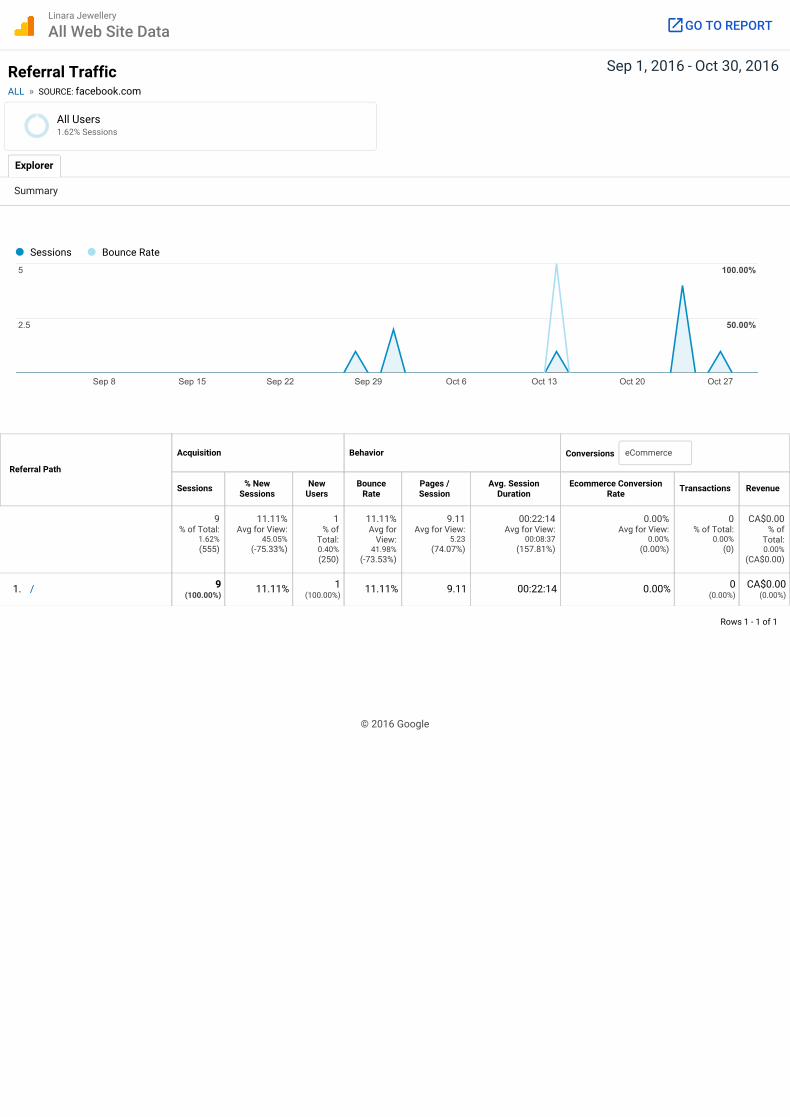
Sep 1, 2016 - Oct 30, 2016Referral TrafficALL » SOURCE: facebook.com
Referral Path
Conversions
Rows 1 - 1 of 1
Explorer
Summary
Acquisition Behavior
Sessions % NewSessions
NewUsers
BounceRate
Pages /Session
Avg. SessionDuration
Ecommerce ConversionRate Transactions Revenue
9% of Total:
1.62%(555)
11.11%Avg for View:
45.05%(-75.33%)
1% of
Total:0.40%(250)
11.11%Avg for
View:41.98%
(-73.53%)
9.11Avg for View:
5.23(74.07%)
00:22:14Avg for View:
00:08:37(157.81%)
0.00%Avg for View:
0.00%(0.00%)
0% of Total:
0.00%(0)
CA$0.00% of
Total:0.00%
(CA$0.00)
1. 9(100.00%)
11.11% 1(100.00%)
11.11% 9.11 00:22:14 0.00% 0(0.00%)
CA$0.00(0.00%)
Sessions Bounce Rate
Sep 8 Sep 15 Sep 22 Sep 29 Oct 6 Oct 13 Oct 20 Oct 27
2.52.52.5
555
50.00%50.00%50.00%
100.00%100.00%100.00%
eCommerce
/
© 2016 Google
All Users1.62% Sessions
Linara Jewellery
All Web Site Data GO TO REPORT
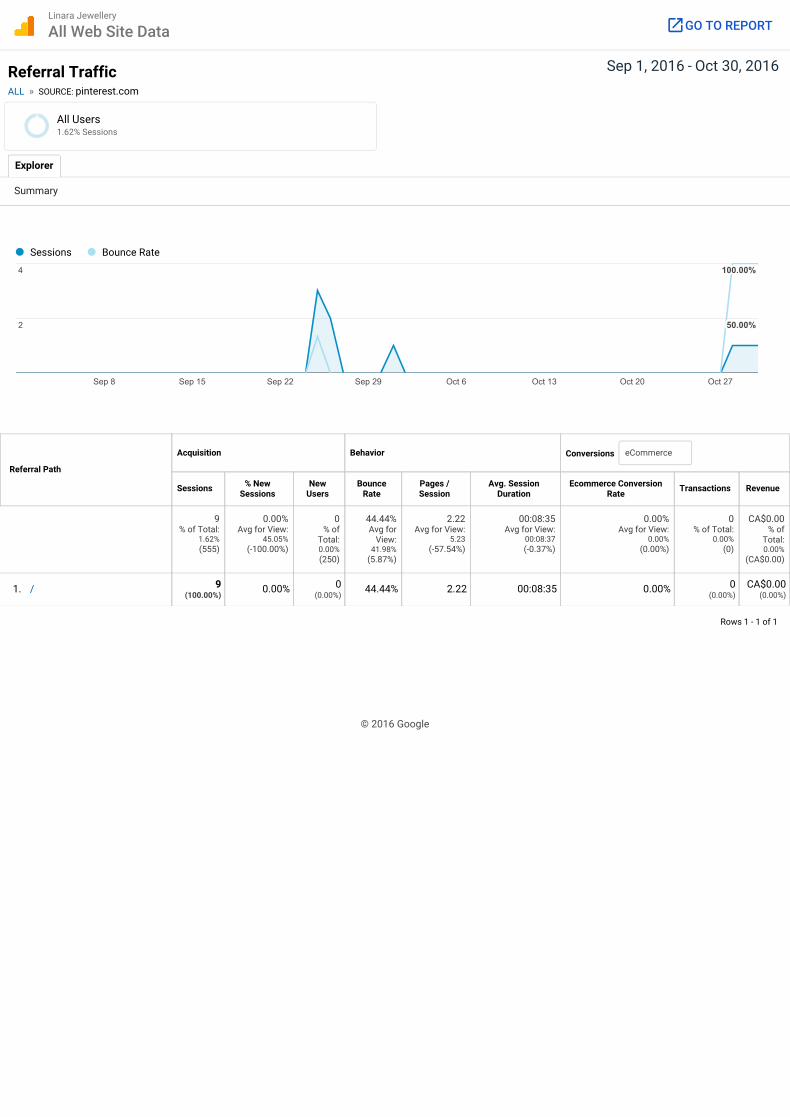
Sep 1, 2016 - Oct 30, 2016Referral TrafficALL » SOURCE: pinterest.com
Referral Path
Conversions
Rows 1 - 1 of 1
Explorer
Summary
Acquisition Behavior
Sessions % NewSessions
NewUsers
BounceRate
Pages /Session
Avg. SessionDuration
Ecommerce ConversionRate Transactions Revenue
9% of Total:
1.62%(555)
0.00%Avg for View:
45.05%(-100.00%)
0% of
Total:0.00%(250)
44.44%Avg for
View:41.98%
(5.87%)
2.22Avg for View:
5.23(-57.54%)
00:08:35Avg for View:
00:08:37(-0.37%)
0.00%Avg for View:
0.00%(0.00%)
0% of Total:
0.00%(0)
CA$0.00% of
Total:0.00%
(CA$0.00)
1. 9(100.00%)
0.00% 0(0.00%)
44.44% 2.22 00:08:35 0.00% 0(0.00%)
CA$0.00(0.00%)
Sessions Bounce Rate
Sep 8 Sep 15 Sep 22 Sep 29 Oct 6 Oct 13 Oct 20 Oct 27
222
444
50.00%50.00%50.00%
100.00%100.00%100.00%
eCommerce
/
© 2016 Google
All Users1.62% Sessions
Linara Jewellery
All Web Site Data GO TO REPORT

Sep 1, 2016 - Oct 30, 2016Referral TrafficALL » SOURCE: t.co
Referral Path
Conversions
Rows 1 - 3 of 3
Explorer
Summary
Acquisition Behavior
Sessions % NewSessions
NewUsers
BounceRate
Pages /Session
Avg. SessionDuration
Ecommerce ConversionRate Transactions Revenue
8% of Total:
1.44%(555)
0.00%Avg for View:
45.05%(-100.00%)
0% of
Total:0.00%(250)
25.00%Avg for
View:41.98%
(-40.45%)
3.75Avg for View:
5.23(-28.36%)
00:13:35Avg for View:
00:08:37(57.51%)
0.00%Avg for View:
0.00%(0.00%)
0% of Total:
0.00%(0)
CA$0.00% of
Total:0.00%
(CA$0.00)
1. 3(37.50%)
0.00% 0(0.00%)
66.67% 2.67 00:01:39 0.00% 0(0.00%)
CA$0.00(0.00%)
2. 3(37.50%)
0.00% 0(0.00%)
0.00% 4.00 00:21:07 0.00% 0(0.00%)
CA$0.00(0.00%)
3. 2(25.00%)
0.00% 0(0.00%)
0.00% 5.00 00:20:10 0.00% 0(0.00%)
CA$0.00(0.00%)
Sessions Bounce Rate
Sep 8 Sep 15 Sep 22 Sep 29 Oct 6 Oct 13 Oct 20 Oct 27
222
444
50.00%50.00%50.00%
100.00%100.00%100.00%
eCommerce
/CL21eF1QgE
/iK7JHKzM1k
/PoooAeabiX
© 2016 Google
All Users1.44% Sessions
Linara Jewellery
All Web Site Data GO TO REPORT

11
Acquisition: Search Console
Google Search Console is a free service that lets you learn a great deal of information about your website and the people who visit it. You can use it to find out things like how many people are visiting your site and how they are finding it, whether more people are visiting your site on a mobile device or desktop computer, and which pages on your site are the most popular. It can also help you find and fix website errors, submit a sitemap, and create and check a robots.txt file.
Google Search Console offers insight into how Googlebots view your site, how it appears in search results, and how your audience interacts with those search results.
It’s a looking glass into your search efforts and helps you monitor, optimize, and maintain your website.

12
Acquisition: Landing Pages
The Landing Pages report shows you the pages that receive the most impressions and clicks from search, along with their click-through rate and average position in search.
If you want more details about visitor behavior based on landing pages, look under Behavior (left sidebar) > Site Content > Landing Pages.
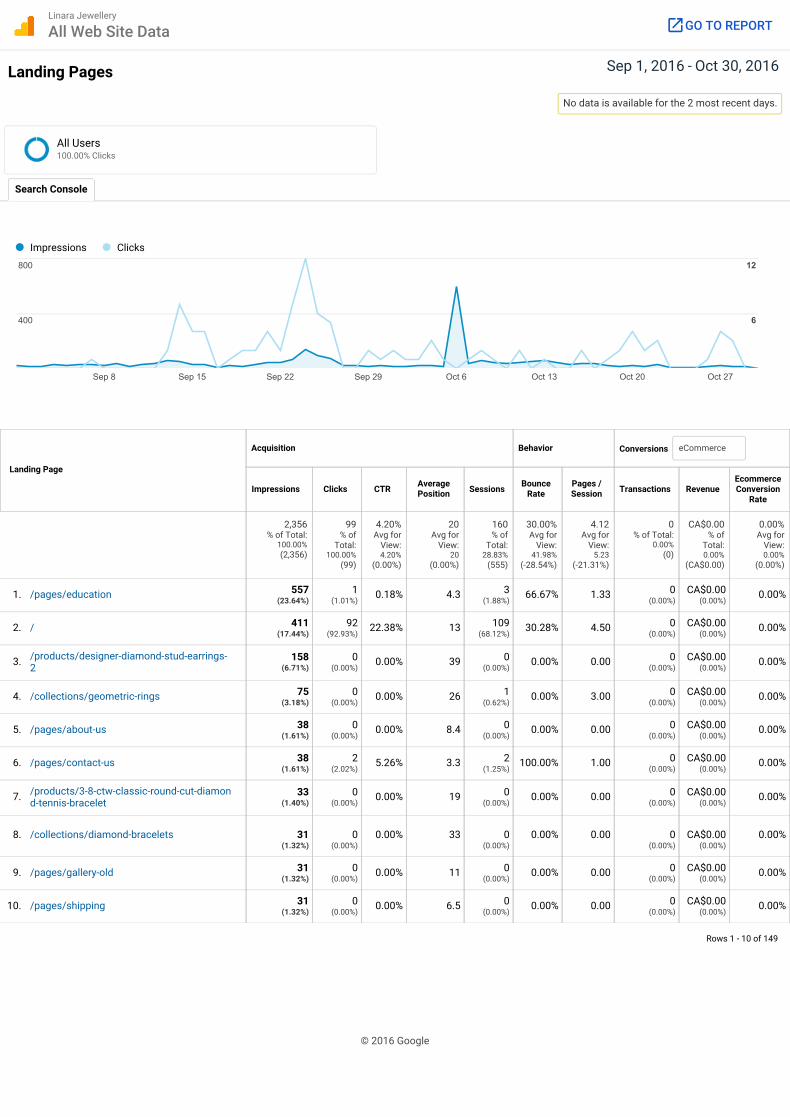
Sep 1, 2016 - Oct 30, 2016Landing Pages
No data is available for the 2 most recent days.
Landing Page
Conversions
Rows 1 - 10 of 149
Search Console
Acquisition Behavior
Impressions Clicks CTR AveragePosition Sessions Bounce
RatePages /Session Transactions Revenue
EcommerceConversion
Rate
2,356% of Total:
100.00%(2,356)
99% of
Total:100.00%
(99)
4.20%Avg for
View:4.20%
(0.00%)
20Avg for
View:20
(0.00%)
160% of
Total:28.83%
(555)
30.00%Avg for
View:41.98%
(-28.54%)
4.12Avg for
View:5.23
(-21.31%)
0% of Total:
0.00%(0)
CA$0.00% of
Total:0.00%
(CA$0.00)
0.00%Avg for
View:0.00%
(0.00%)
1. 557(23.64%)
1(1.01%)
0.18% 4.3 3(1.88%)
66.67% 1.33 0(0.00%)
CA$0.00(0.00%)
0.00%
2. 411(17.44%)
92(92.93%)
22.38% 13 109(68.12%)
30.28% 4.50 0(0.00%)
CA$0.00(0.00%)
0.00%
3. 158(6.71%)
0(0.00%)
0.00% 39 0(0.00%)
0.00% 0.00 0(0.00%)
CA$0.00(0.00%)
0.00%
4. 75(3.18%)
0(0.00%)
0.00% 26 1(0.62%)
0.00% 3.00 0(0.00%)
CA$0.00(0.00%)
0.00%
5. 38(1.61%)
0(0.00%)
0.00% 8.4 0(0.00%)
0.00% 0.00 0(0.00%)
CA$0.00(0.00%)
0.00%
6. 38(1.61%)
2(2.02%)
5.26% 3.3 2(1.25%)
100.00% 1.00 0(0.00%)
CA$0.00(0.00%)
0.00%
7. 33(1.40%)
0(0.00%)
0.00% 19 0(0.00%)
0.00% 0.00 0(0.00%)
CA$0.00(0.00%)
0.00%
8. 31(1.32%)
0(0.00%)
0.00% 33 0(0.00%)
0.00% 0.00 0(0.00%)
CA$0.00(0.00%)
0.00%
9. 31(1.32%)
0(0.00%)
0.00% 11 0(0.00%)
0.00% 0.00 0(0.00%)
CA$0.00(0.00%)
0.00%
10. 31(1.32%)
0(0.00%)
0.00% 6.5 0(0.00%)
0.00% 0.00 0(0.00%)
CA$0.00(0.00%)
0.00%
Impressions Clicks
Sep 8 Sep 15 Sep 22 Sep 29 Oct 6 Oct 13 Oct 20 Oct 27
400400400
800800800
666
121212
eCommerce
/pages/education
/
/products/designer-diamond-stud-earrings-2
/collections/geometric-rings
/pages/about-us
/pages/contact-us
/products/3-8-ctw-classic-round-cut-diamond-tennis-bracelet
/collections/diamond-bracelets
/pages/gallery-old
/pages/shipping
© 2016 Google
All Users100.00% Clicks
Linara Jewellery
All Web Site Data GO TO REPORT

Sep 1, 2016 - Oct 30, 2016Landing PagesALL » LANDING PAGE: /pages/education
No data is available for the 2 most recent days.
To protect user privacy, queries made a very small number of times or containing personal or sensitive information are grouped as "(not set)". Learn more
Search Query
Conversions
Rows 1 - 10 of 49
Search Console
Acquisition Behavior
Impressions Clicks CTR AveragePosition Sessions Bounce
RatePages /Session Transactions Revenue Ecommerce
Conversion Rate
557% of Total:
23.64%(2,356)
1% of
Total:1.01%
(99)
0.18%Avg for
View:4.20%
(-95.73%)
4.3Avg for View:
20(-78.71%)
3% of
Total:0.54%(555)
66.67%Avg for
View:41.98%
(58.80%)
1.33Avg for View:
5.23(-74.53%)
0% of Total:
0.00%(0)
CA$0.00% of
Total:0.00%
(CA$0.00)
0.00%Avg for View:
0.00%(0.00%)
1. (not set) 182(32.68%)
1(100.00%)
0.55% 4.9
2. diamond diameter 97(17.41%)
0(0.00%)
0.00% 1.7
3. diamond mm to carat 71(12.75%)
0(0.00%)
0.00% 9.0
4. diamond size chart mm 28(5.03%)
0(0.00%)
0.00% 1.1
5. diameter of diamond 15(2.69%)
0(0.00%)
0.00% 6.9
6. diamond carat to mm 13(2.33%)
0(0.00%)
0.00% 4.9
7. diamond mm size chart 12(2.15%)
0(0.00%)
0.00% 1.5
8. straight baguette diamond sizechart
12(2.15%)
0(0.00%)
0.00% 1.0
9. diamond mm chart 11(1.97%)
0(0.00%)
0.00% 1.4
10. diamond carat mm 10(1.80%)
0(0.00%)
0.00% 2.3
Impressions Clicks
Sep 8 Sep 15 Sep 22 Sep 29 Oct 6 Oct 13 Oct 20 Oct 27
252525
505050
0.50.50.5
111
eCommerce
© 2016 Google
All Users1.01% Clicks
Linara Jewellery
All Web Site Data GO TO REPORT

Sep 1, 2016 - Oct 30, 2016Landing PagesALL » LANDING PAGE: /
No data is available for the 2 most recent days.
To protect user privacy, queries made a very small number of times or containing personal or sensitive information are grouped as "(not set)". Learn more
Search Query
Conversions
Rows 1 - 8 of 8
Search Console
Acquisition Behavior
Impressions Clicks CTR AveragePosition Sessions Bounce
RatePages /Session Transactions Revenue Ecommerce
Conversion Rate
411% of Total:
17.44%(2,356)
92% of
Total:92.93%
(99)
22.38%Avg for
View:4.20%
(432.70%)
13Avg for View:
20(-34.43%)
109% of
Total:19.64%
(555)
30.28%Avg for
View:41.98%
(-27.89%)
4.50Avg for View:
5.23(-13.94%)
0% of Total:
0.00%(0)
CA$0.00% of
Total:0.00%
(CA$0.00)
0.00%Avg for View:
0.00%(0.00%)
1. linara 216(52.55%)
3(3.26%)
1.39% 14
2. (not set) 164(39.90%)
77(83.70%)
46.95% 7.8
3. linara jewellery 19(4.62%)
12(13.04%)
63.16% 1.0
4. canadian diamonds toronto 5(1.22%)
0(0.00%)
0.00% 91
5. diamond earrings toronto 4(0.97%)
0(0.00%)
0.00% 110
6. lina ra 1(0.24%)
0(0.00%)
0.00% 10
7. linara's 1(0.24%)
0(0.00%)
0.00% 10
8. линара 1(0.24%)
0(0.00%)
0.00% 83
Impressions Clicks
Sep 8 Sep 15 Sep 22 Sep 29 Oct 6 Oct 13 Oct 20 Oct 27
101010
202020
666
121212
eCommerce
© 2016 Google
All Users92.93% Clicks
Linara Jewellery
All Web Site Data GO TO REPORT
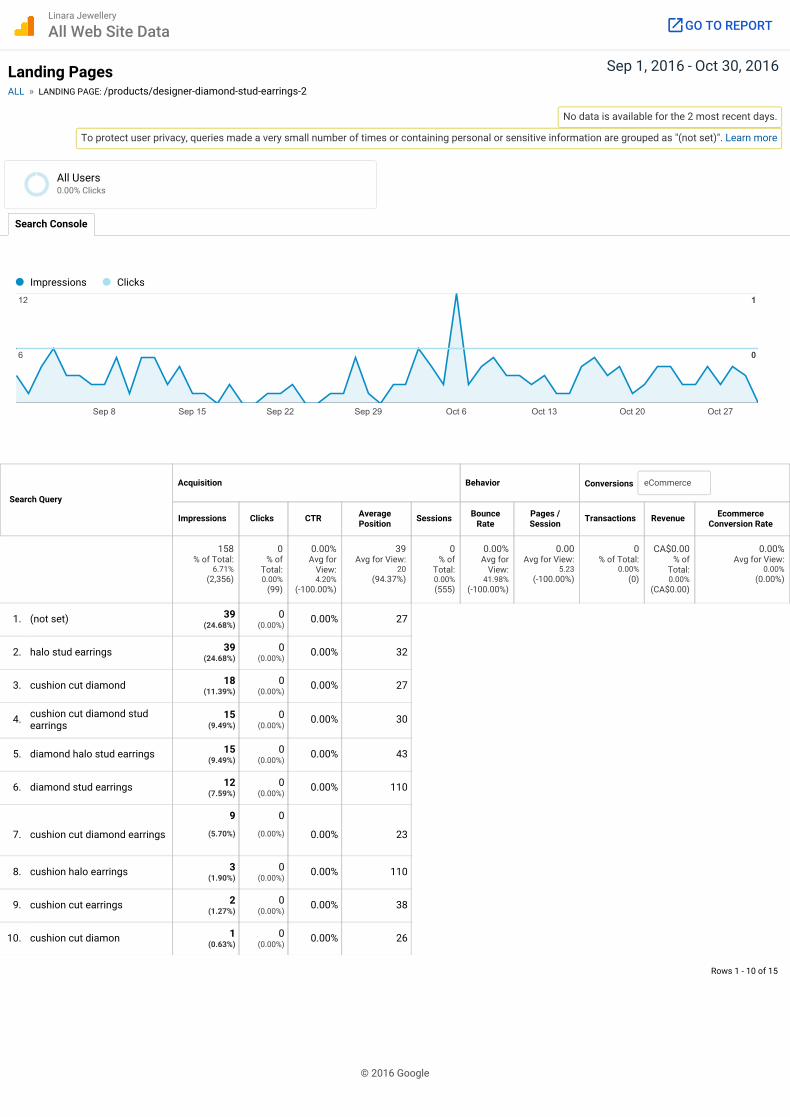
Sep 1, 2016 - Oct 30, 2016Landing PagesALL » LANDING PAGE: /products/designer-diamond-stud-earrings-2
No data is available for the 2 most recent days.
To protect user privacy, queries made a very small number of times or containing personal or sensitive information are grouped as "(not set)". Learn more
Search Query
Conversions
Rows 1 - 10 of 15
Search Console
Acquisition Behavior
Impressions Clicks CTR AveragePosition Sessions Bounce
RatePages /Session Transactions Revenue Ecommerce
Conversion Rate
158% of Total:
6.71%(2,356)
0% of
Total:0.00%
(99)
0.00%Avg for
View:4.20%
(-100.00%)
39Avg for View:
20(94.37%)
0% of
Total:0.00%(555)
0.00%Avg for
View:41.98%
(-100.00%)
0.00Avg for View:
5.23(-100.00%)
0% of Total:
0.00%(0)
CA$0.00% of
Total:0.00%
(CA$0.00)
0.00%Avg for View:
0.00%(0.00%)
1. (not set) 39(24.68%)
0(0.00%)
0.00% 27
2. halo stud earrings 39(24.68%)
0(0.00%)
0.00% 32
3. cushion cut diamond 18(11.39%)
0(0.00%)
0.00% 27
4. cushion cut diamond studearrings
15(9.49%)
0(0.00%)
0.00% 30
5. diamond halo stud earrings 15(9.49%)
0(0.00%)
0.00% 43
6. diamond stud earrings 12(7.59%)
0(0.00%)
0.00% 110
7. cushion cut diamond earrings
9
(5.70%)
0
(0.00%) 0.00% 23
8. cushion halo earrings 3(1.90%)
0(0.00%)
0.00% 110
9. cushion cut earrings 2(1.27%)
0(0.00%)
0.00% 38
10. cushion cut diamon 1(0.63%)
0(0.00%)
0.00% 26
Impressions Clicks
Sep 8 Sep 15 Sep 22 Sep 29 Oct 6 Oct 13 Oct 20 Oct 27
666
121212
000
111
eCommerce
© 2016 Google
All Users0.00% Clicks
Linara Jewellery
All Web Site Data GO TO REPORT
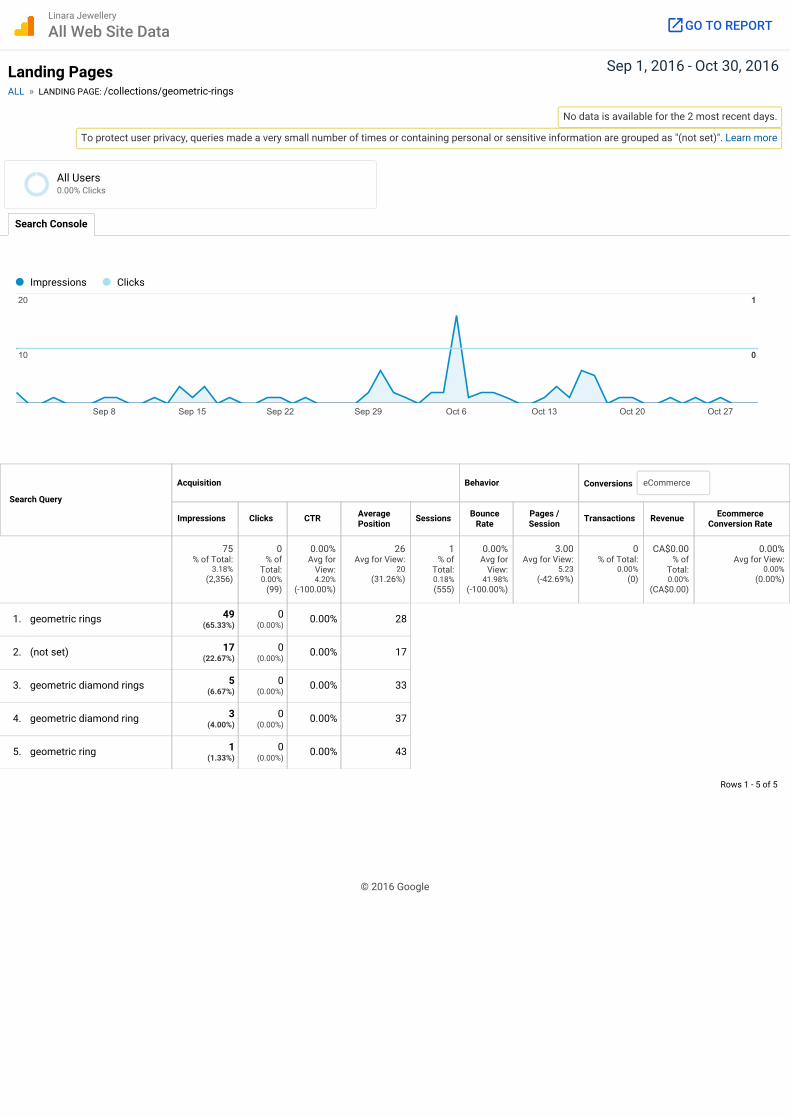
Sep 1, 2016 - Oct 30, 2016Landing PagesALL » LANDING PAGE: /collections/geometric-rings
No data is available for the 2 most recent days.
To protect user privacy, queries made a very small number of times or containing personal or sensitive information are grouped as "(not set)". Learn more
Search Query
Conversions
Rows 1 - 5 of 5
Search Console
Acquisition Behavior
Impressions Clicks CTR AveragePosition Sessions Bounce
RatePages /Session Transactions Revenue Ecommerce
Conversion Rate
75% of Total:
3.18%(2,356)
0% of
Total:0.00%
(99)
0.00%Avg for
View:4.20%
(-100.00%)
26Avg for View:
20(31.26%)
1% of
Total:0.18%(555)
0.00%Avg for
View:41.98%
(-100.00%)
3.00Avg for View:
5.23(-42.69%)
0% of Total:
0.00%(0)
CA$0.00% of
Total:0.00%
(CA$0.00)
0.00%Avg for View:
0.00%(0.00%)
1. geometric rings 49(65.33%)
0(0.00%)
0.00% 28
2. (not set) 17(22.67%)
0(0.00%)
0.00% 17
3. geometric diamond rings 5(6.67%)
0(0.00%)
0.00% 33
4. geometric diamond ring 3(4.00%)
0(0.00%)
0.00% 37
5. geometric ring 1(1.33%)
0(0.00%)
0.00% 43
Impressions Clicks
Sep 8 Sep 15 Sep 22 Sep 29 Oct 6 Oct 13 Oct 20 Oct 27
101010
202020
000
111
eCommerce
© 2016 Google
All Users0.00% Clicks
Linara Jewellery
All Web Site Data GO TO REPORT

Sep 1, 2016 - Oct 30, 2016Landing PagesALL » LANDING PAGE: /pages/about-us
No data is available for the 2 most recent days.
To protect user privacy, queries made a very small number of times or containing personal or sensitive information are grouped as "(not set)". Learn more
Search Query
Conversions
Rows 1 - 2 of 2
Search Console
Acquisition Behavior
Impressions Clicks CTR AveragePosition Sessions Bounce
RatePages /Session Transactions Revenue Ecommerce
Conversion Rate
38% of Total:
1.61%(2,356)
0% of
Total:0.00%
(99)
0.00%Avg for
View:4.20%
(-100.00%)
8.4Avg for View:
20(-58.04%)
0% of
Total:0.00%(555)
0.00%Avg for
View:41.98%
(-100.00%)
0.00Avg for View:
5.23(-100.00%)
0% of Total:
0.00%(0)
CA$0.00% of
Total:0.00%
(CA$0.00)
0.00%Avg for View:
0.00%(0.00%)
1. (not set) 37(97.37%)
0(0.00%)
0.00% 3.2
2. custom jewellers toronto 1(2.63%)
0(0.00%)
0.00% 200
Impressions Clicks
Sep 8 Sep 15 Sep 22 Sep 29 Oct 6 Oct 13 Oct 20 Oct 27
555
101010
000
111
eCommerce
© 2016 Google
All Users0.00% Clicks
Linara Jewellery
All Web Site Data GO TO REPORT

Sep 1, 2016 - Oct 30, 2016Landing PagesALL » LANDING PAGE: /products/3-8-ctw-classic-round-cut-diamond-tennis-bracelet
No data is available for the 2 most recent days.
To protect user privacy, queries made a very small number of times or containing personal or sensitive information are grouped as "(not set)". Learn more
Search Query
Conversions
Rows 1 - 3 of 3
Search Console
Acquisition Behavior
Impressions Clicks CTR AveragePosition Sessions Bounce
RatePages /Session Transactions Revenue Ecommerce
Conversion Rate
33% of Total:
1.40%(2,356)
0% of
Total:0.00%
(99)
0.00%Avg for
View:4.20%
(-100.00%)
19Avg for View:
20(-4.73%)
0% of
Total:0.00%(555)
0.00%Avg for
View:41.98%
(-100.00%)
0.00Avg for View:
5.23(-100.00%)
0% of Total:
0.00%(0)
CA$0.00% of
Total:0.00%
(CA$0.00)
0.00%Avg for View:
0.00%(0.00%)
1. (not set) 30(90.91%)
0(0.00%)
0.00% 17
2. round diamond tennisbracelet
2(6.06%)
0(0.00%)
0.00% 40
3. tennis bracelet canada 1(3.03%)
0(0.00%)
0.00% 50
Impressions Clicks
Sep 8 Sep 15 Sep 22 Sep 29 Oct 6 Oct 13 Oct 20 Oct 27
555
101010
000
111
eCommerce
© 2016 Google
All Users0.00% Clicks
Linara Jewellery
All Web Site Data GO TO REPORT
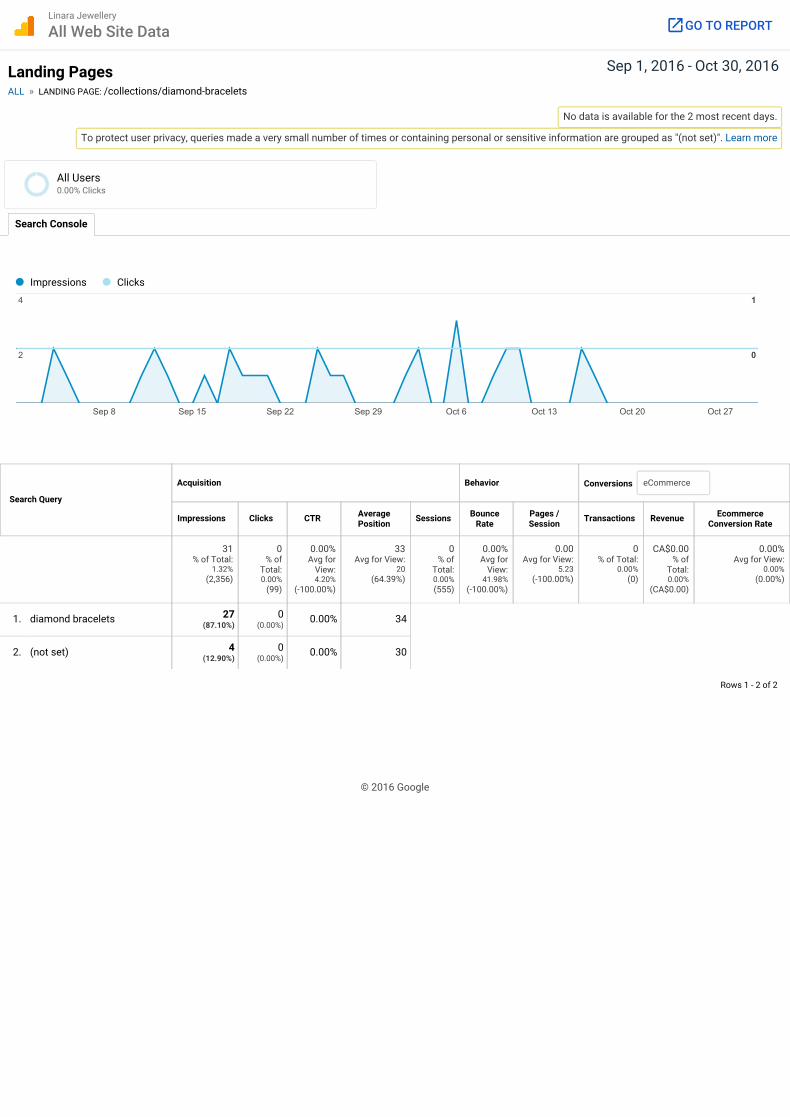
Sep 1, 2016 - Oct 30, 2016Landing PagesALL » LANDING PAGE: /collections/diamond-bracelets
No data is available for the 2 most recent days.
To protect user privacy, queries made a very small number of times or containing personal or sensitive information are grouped as "(not set)". Learn more
Search Query
Conversions
Rows 1 - 2 of 2
Search Console
Acquisition Behavior
Impressions Clicks CTR AveragePosition Sessions Bounce
RatePages /Session Transactions Revenue Ecommerce
Conversion Rate
31% of Total:
1.32%(2,356)
0% of
Total:0.00%
(99)
0.00%Avg for
View:4.20%
(-100.00%)
33Avg for View:
20(64.39%)
0% of
Total:0.00%(555)
0.00%Avg for
View:41.98%
(-100.00%)
0.00Avg for View:
5.23(-100.00%)
0% of Total:
0.00%(0)
CA$0.00% of
Total:0.00%
(CA$0.00)
0.00%Avg for View:
0.00%(0.00%)
1. diamond bracelets 27(87.10%)
0(0.00%)
0.00% 34
2. (not set) 4(12.90%)
0(0.00%)
0.00% 30
Impressions Clicks
Sep 8 Sep 15 Sep 22 Sep 29 Oct 6 Oct 13 Oct 20 Oct 27
222
444
000
111
eCommerce
© 2016 Google
All Users0.00% Clicks
Linara Jewellery
All Web Site Data GO TO REPORT

13
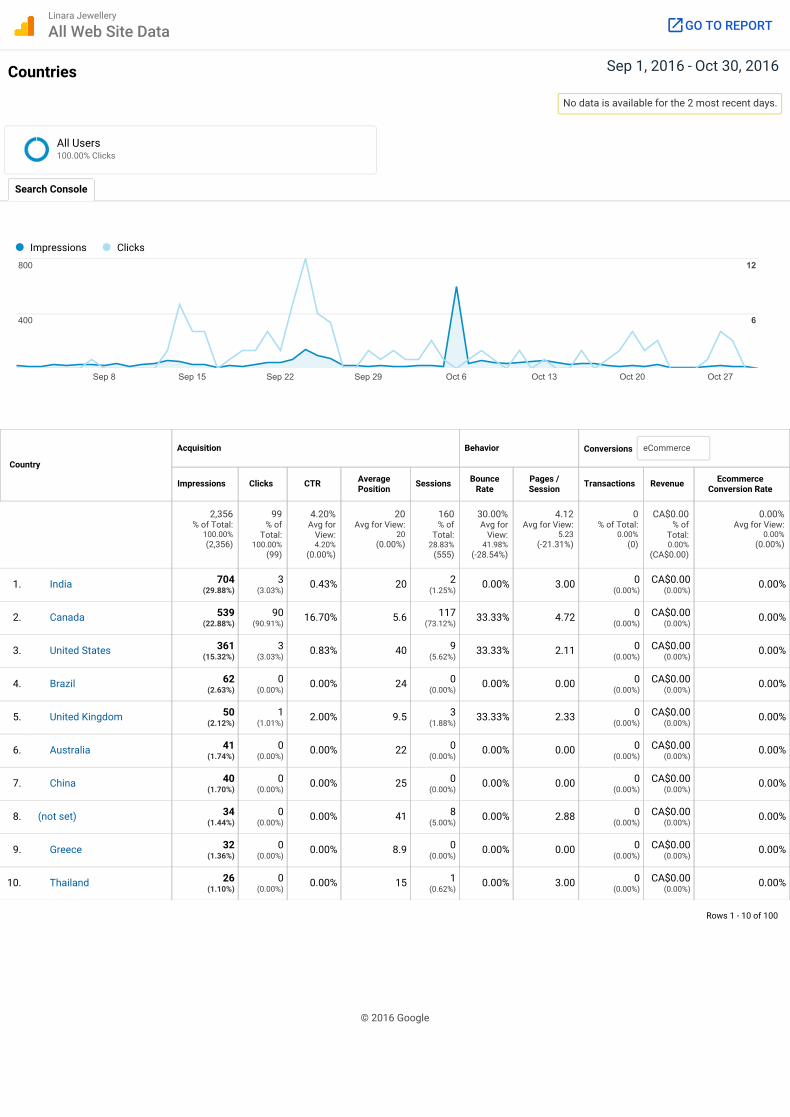
Acquisition: Countries
The Geographical Summary report shows you insights into where search engine users are located and which ones are most likely to click on the links they see.
If you want more details about visitor behavior based on location, look under Audience (left sidebar) > Geo > Location.
Sep 1, 2016 - Oct 30, 2016Countries
No data is available for the 2 most recent days.
Country
Conversions
Rows 1 - 10 of 100
Search Console
Acquisition Behavior
Impressions Clicks CTR AveragePosition Sessions Bounce
RatePages /Session Transactions Revenue Ecommerce
Conversion Rate
2,356% of Total:
100.00%(2,356)
99% of
Total:100.00%
(99)
4.20%Avg for
View:4.20%
(0.00%)
20Avg for View:
20(0.00%)
160% of
Total:28.83%
(555)
30.00%Avg for
View:41.98%
(-28.54%)
4.12Avg for View:
5.23(-21.31%)
0% of Total:
0.00%(0)
CA$0.00% of
Total:0.00%
(CA$0.00)
0.00%Avg for View:
0.00%(0.00%)
1. India 704(29.88%)
3(3.03%)
0.43% 20 2(1.25%)
0.00% 3.00 0(0.00%)
CA$0.00(0.00%)
0.00%
2. Canada 539(22.88%)
90(90.91%)
16.70% 5.6 117(73.12%)
33.33% 4.72 0(0.00%)
CA$0.00(0.00%)
0.00%
3. United States 361(15.32%)
3(3.03%)
0.83% 40 9(5.62%)
33.33% 2.11 0(0.00%)
CA$0.00(0.00%)
0.00%
4. Brazil 62(2.63%)
0(0.00%)
0.00% 24 0(0.00%)
0.00% 0.00 0(0.00%)
CA$0.00(0.00%)
0.00%
5. United Kingdom 50(2.12%)
1(1.01%)
2.00% 9.5 3(1.88%)
33.33% 2.33 0(0.00%)
CA$0.00(0.00%)
0.00%
6. Australia 41(1.74%)
0(0.00%)
0.00% 22 0(0.00%)
0.00% 0.00 0(0.00%)
CA$0.00(0.00%)
0.00%
7. China 40(1.70%)
0(0.00%)
0.00% 25 0(0.00%)
0.00% 0.00 0(0.00%)
CA$0.00(0.00%)
0.00%
8. (not set) 34(1.44%)
0(0.00%)
0.00% 41 8(5.00%)
0.00% 2.88 0(0.00%)
CA$0.00(0.00%)
0.00%
9. Greece 32(1.36%)
0(0.00%)
0.00% 8.9 0(0.00%)
0.00% 0.00 0(0.00%)
CA$0.00(0.00%)
0.00%
10. Thailand 26(1.10%)
0(0.00%)
0.00% 15 1(0.62%)
0.00% 3.00 0(0.00%)
CA$0.00(0.00%)
0.00%
Impressions Clicks
Sep 8 Sep 15 Sep 22 Sep 29 Oct 6 Oct 13 Oct 20 Oct 27
400400400
800800800
666
121212
eCommerce
© 2016 Google
All Users100.00% Clicks
Linara Jewellery
All Web Site Data GO TO REPORT

Sep 1, 2016 - Oct 30, 2016CountriesALL » COUNTRY: India
No data is available for the 2 most recent days.
Landing Page
Conversions
Rows 1 - 10 of 116
Search Console
Acquisition Behavior
Impressions Clicks CTR AveragePosition Sessions Bounce
RatePages /Session Transactions Revenue
EcommerceConversion
Rate
704% of Total:
29.88%(2,356)
3% of
Total:3.03%
(99)
0.43%Avg for
View:4.20%
(-89.86%)
20Avg for View:
20(-2.33%)
2% of
Total:0.36%(555)
0.00%Avg for
View:41.98%
(-100.00%)
3.00Avg for
View:5.23
(-42.69%)
0% of Total:
0.00%(0)
CA$0.00% of
Total:0.00%
(CA$0.00)
0.00%Avg for View:
0.00%(0.00%)
1. 88(12.50%)
0(0.00%)
0.00% 3.6 0(0.00%)
0.00% 0.00 0(0.00%)
CA$0.00(0.00%)
0.00%
2. 25(3.55%)
1(33.33%)
4.00% 34 1(50.00%)
0.00% 4.00 0(0.00%)
CA$0.00(0.00%)
0.00%
3. 19(2.70%)
0(0.00%)
0.00% 32 0(0.00%)
0.00% 0.00 0(0.00%)
CA$0.00(0.00%)
0.00%
4. 18(2.56%)
0(0.00%)
0.00% 28 0(0.00%)
0.00% 0.00 0(0.00%)
CA$0.00(0.00%)
0.00%
5. 15(2.13%)
0(0.00%)
0.00% 16 0(0.00%)
0.00% 0.00 0(0.00%)
CA$0.00(0.00%)
0.00%
6. 15(2.13%)
0(0.00%)
0.00% 22 0(0.00%)
0.00% 0.00 0(0.00%)
CA$0.00(0.00%)
0.00%
7. 15(2.13%)
0(0.00%)
0.00% 28 0(0.00%)
0.00% 0.00 0(0.00%)
CA$0.00(0.00%)
0.00%
8. 14(1.99%)
0(0.00%)
0.00% 21 0(0.00%)
0.00% 0.00 0(0.00%)
CA$0.00(0.00%)
0.00%
9. 14(1.99%)
0(0.00%)
0.00% 30 0(0.00%)
0.00% 0.00 0(0.00%)
CA$0.00(0.00%)
0.00%
10. 12(1.70%)
0(0.00%)
0.00% 35 0(0.00%)
0.00% 0.00 0(0.00%)
CA$0.00(0.00%)
0.00%
Impressions Clicks
Sep 8 Sep 15 Sep 22 Sep 29 Oct 6 Oct 13 Oct 20 Oct 27
400400400
800800800
0.50.50.5
111
eCommerce
/pages/education
/
/products/designer-diamond-stud-earrings-2
/collections/geometric-rings
/collections/all
/collections/diamond-earrings
/collections/halo-style
/collections/collections
/collections/three-stone
/collections/halo-style-pendants
© 2016 Google
All Users3.03% Clicks
Linara Jewellery
All Web Site Data GO TO REPORT

Sep 1, 2016 - Oct 30, 2016CountriesALL » COUNTRY: India » LANDING PAGE: /pages/education
No data is available for the 2 most recent days.
To protect user privacy, queries made a very small number of times or containing personal or sensitive information are grouped as "(not set)". Learn more
Search Query
Conversions
Rows 1 - 10 of 19
Search Console
Acquisition Behavior
Impressions Clicks CTR AveragePosition Sessions Bounce
RatePages /Session Transactions Revenue Ecommerce
Conversion Rate
88% of Total:
3.74%(2,356)
0% of
Total:0.00%
(99)
0.00%Avg for
View:4.20%
(-100.00%)
3.6Avg for View:
20(-82.22%)
0% of
Total:0.00%(555)
0.00%Avg for
View:41.98%
(-100.00%)
0.00Avg for View:
5.23(-100.00%)
0% of Total:
0.00%(0)
CA$0.00% of
Total:0.00%
(CA$0.00)
0.00%Avg for View:
0.00%(0.00%)
1. (not set) 34(38.64%)
0(0.00%)
0.00% 5.7
2. diamond size chart mm 14(15.91%)
0(0.00%)
0.00% 1.1
3. diamond diameter 5(5.68%)
0(0.00%)
0.00% 1.6
4. marquise size chart 5(5.68%)
0(0.00%)
0.00% 1.0
5. straight baguette diamond sizechart
5(5.68%)
0(0.00%)
0.00% 1.0
6. diameter of diamond 4(4.55%)
0(0.00%)
0.00% 6.3
7. diamond mm size chart
4
(4.55%)
0
(0.00%) 0.00% 1.0
8. tapered baguette size chart 3(3.41%)
0(0.00%)
0.00% 1.0
9. 1 carat = mm 2(2.27%)
0(0.00%)
0.00% 4.0
10. 1 carat in mm 2(2.27%)
0(0.00%)
0.00% 8.0
Impressions Clicks
Sep 8 Sep 15 Sep 22 Sep 29 Oct 6 Oct 13 Oct 20 Oct 27
555
101010
000
111
eCommerce
© 2016 Google
All Users0.00% Clicks
Linara Jewellery
All Web Site Data GO TO REPORT

Sep 1, 2016 - Oct 30, 2016CountriesALL » COUNTRY: India » LANDING PAGE: /
No data is available for the 2 most recent days.
To protect user privacy, queries made a very small number of times or containing personal or sensitive information are grouped as "(not set)". Learn more
Search Query
Conversions
Rows 1 - 4 of 4
Search Console
Acquisition Behavior
Impressions Clicks CTR AveragePosition Sessions Bounce
RatePages /Session Transactions Revenue Ecommerce
Conversion Rate
25% of Total:
1.06%(2,356)
1% of
Total:1.01%
(99)
4.00%Avg for
View:4.20%
(-4.81%)
34Avg for View:
20(67.29%)
1% of
Total:0.18%(555)
0.00%Avg for
View:41.98%
(-100.00%)
4.00Avg for View:
5.23(-23.58%)
0% of Total:
0.00%(0)
CA$0.00% of
Total:0.00%
(CA$0.00)
0.00%Avg for View:
0.00%(0.00%)
1. (not set) 19(76.00%)
1(100.00%)
5.26% 35
2. linara 4(16.00%)
0(0.00%)
0.00% 12
3. canadian diamonds toronto 1(4.00%)
0(0.00%)
0.00% 120
4. lina ra 1(4.00%)
0(0.00%)
0.00% 10
Impressions Clicks
Sep 8 Sep 15 Sep 22 Sep 29 Oct 6 Oct 13 Oct 20 Oct 27
666
121212
0.50.50.5
111
eCommerce
© 2016 Google
All Users1.01% Clicks
Linara Jewellery
All Web Site Data GO TO REPORT
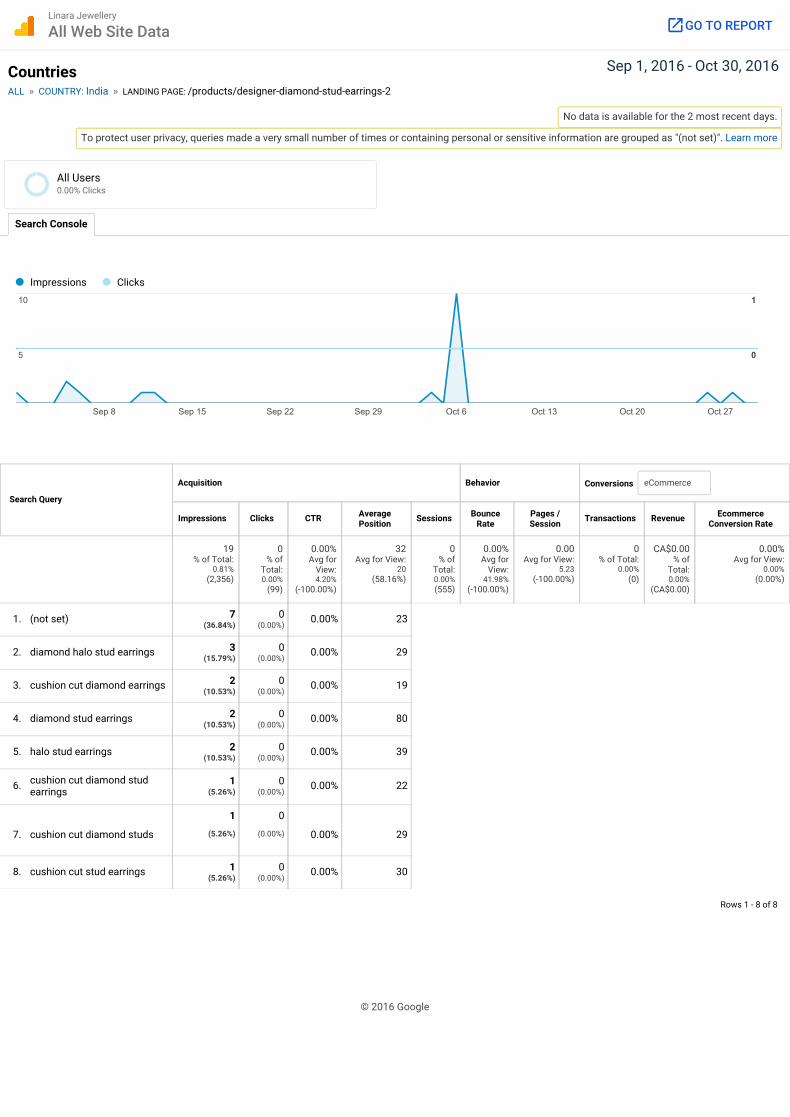
Sep 1, 2016 - Oct 30, 2016CountriesALL » COUNTRY: India » LANDING PAGE: /products/designer-diamond-stud-earrings-2
No data is available for the 2 most recent days.
To protect user privacy, queries made a very small number of times or containing personal or sensitive information are grouped as "(not set)". Learn more
Search Query
Conversions
Rows 1 - 8 of 8
Search Console
Acquisition Behavior
Impressions Clicks CTR AveragePosition Sessions Bounce
RatePages /Session Transactions Revenue Ecommerce
Conversion Rate
19% of Total:
0.81%(2,356)
0% of
Total:0.00%
(99)
0.00%Avg for
View:4.20%
(-100.00%)
32Avg for View:
20(58.16%)
0% of
Total:0.00%(555)
0.00%Avg for
View:41.98%
(-100.00%)
0.00Avg for View:
5.23(-100.00%)
0% of Total:
0.00%(0)
CA$0.00% of
Total:0.00%
(CA$0.00)
0.00%Avg for View:
0.00%(0.00%)
1. (not set) 7(36.84%)
0(0.00%)
0.00% 23
2. diamond halo stud earrings 3(15.79%)
0(0.00%)
0.00% 29
3. cushion cut diamond earrings 2(10.53%)
0(0.00%)
0.00% 19
4. diamond stud earrings 2(10.53%)
0(0.00%)
0.00% 80
5. halo stud earrings 2(10.53%)
0(0.00%)
0.00% 39
6. cushion cut diamond studearrings
1(5.26%)
0(0.00%)
0.00% 22
7. cushion cut diamond studs
1
(5.26%)
0
(0.00%) 0.00% 29
8. cushion cut stud earrings 1(5.26%)
0(0.00%)
0.00% 30
Impressions Clicks
Sep 8 Sep 15 Sep 22 Sep 29 Oct 6 Oct 13 Oct 20 Oct 27
555
101010
000
111
eCommerce
© 2016 Google
All Users0.00% Clicks
Linara Jewellery
All Web Site Data GO TO REPORT
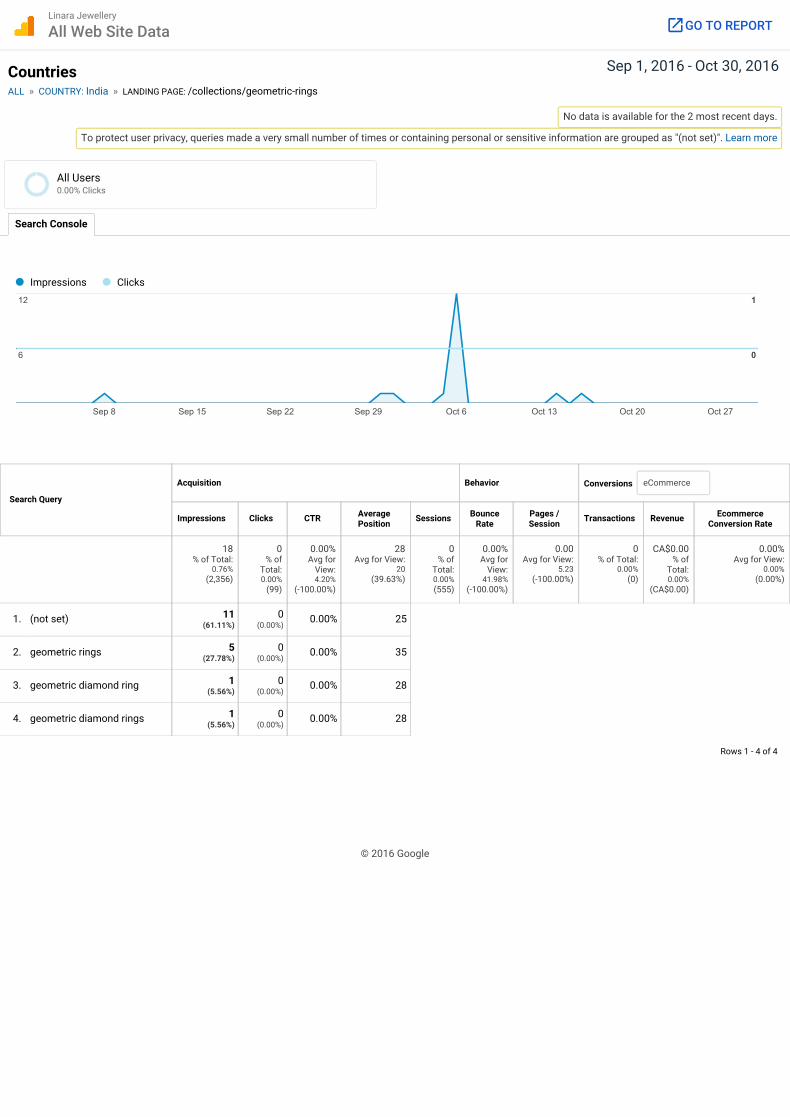
Sep 1, 2016 - Oct 30, 2016CountriesALL » COUNTRY: India » LANDING PAGE: /collections/geometric-rings
No data is available for the 2 most recent days.
To protect user privacy, queries made a very small number of times or containing personal or sensitive information are grouped as "(not set)". Learn more
Search Query
Conversions
Rows 1 - 4 of 4
Search Console
Acquisition Behavior
Impressions Clicks CTR AveragePosition Sessions Bounce
RatePages /Session Transactions Revenue Ecommerce
Conversion Rate
18% of Total:
0.76%(2,356)
0% of
Total:0.00%
(99)
0.00%Avg for
View:4.20%
(-100.00%)
28Avg for View:
20(39.63%)
0% of
Total:0.00%(555)
0.00%Avg for
View:41.98%
(-100.00%)
0.00Avg for View:
5.23(-100.00%)
0% of Total:
0.00%(0)
CA$0.00% of
Total:0.00%
(CA$0.00)
0.00%Avg for View:
0.00%(0.00%)
1. (not set) 11(61.11%)
0(0.00%)
0.00% 25
2. geometric rings 5(27.78%)
0(0.00%)
0.00% 35
3. geometric diamond ring 1(5.56%)
0(0.00%)
0.00% 28
4. geometric diamond rings 1(5.56%)
0(0.00%)
0.00% 28
Impressions Clicks
Sep 8 Sep 15 Sep 22 Sep 29 Oct 6 Oct 13 Oct 20 Oct 27
666
121212
000
111
eCommerce
© 2016 Google
All Users0.00% Clicks
Linara Jewellery
All Web Site Data GO TO REPORT
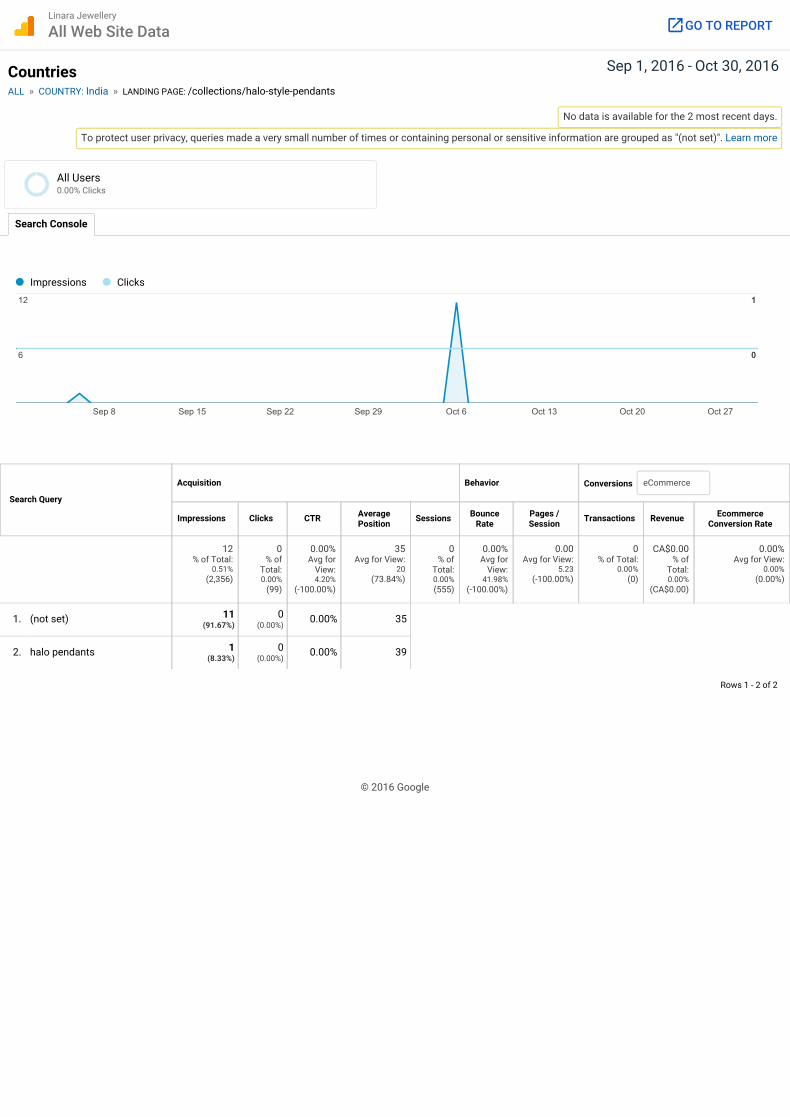
Sep 1, 2016 - Oct 30, 2016CountriesALL » COUNTRY: India » LANDING PAGE: /collections/halo-style-pendants
No data is available for the 2 most recent days.
To protect user privacy, queries made a very small number of times or containing personal or sensitive information are grouped as "(not set)". Learn more
Search Query
Conversions
Rows 1 - 2 of 2
Search Console
Acquisition Behavior
Impressions Clicks CTR AveragePosition Sessions Bounce
RatePages /Session Transactions Revenue Ecommerce
Conversion Rate
12% of Total:
0.51%(2,356)
0% of
Total:0.00%
(99)
0.00%Avg for
View:4.20%
(-100.00%)
35Avg for View:
20(73.84%)
0% of
Total:0.00%(555)
0.00%Avg for
View:41.98%
(-100.00%)
0.00Avg for View:
5.23(-100.00%)
0% of Total:
0.00%(0)
CA$0.00% of
Total:0.00%
(CA$0.00)
0.00%Avg for View:
0.00%(0.00%)
1. (not set) 11(91.67%)
0(0.00%)
0.00% 35
2. halo pendants 1(8.33%)
0(0.00%)
0.00% 39
Impressions Clicks
Sep 8 Sep 15 Sep 22 Sep 29 Oct 6 Oct 13 Oct 20 Oct 27
666
121212
000
111
eCommerce
© 2016 Google
All Users0.00% Clicks
Linara Jewellery
All Web Site Data GO TO REPORT
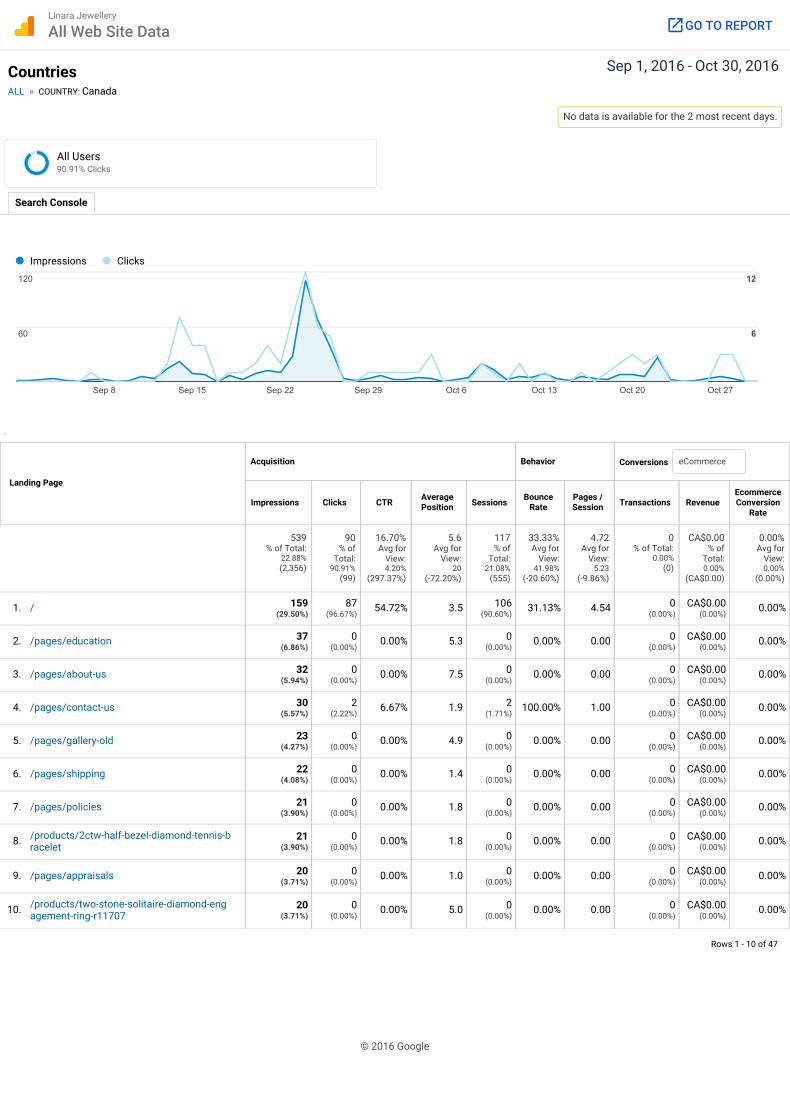
Sep 1, 2016 - Oct 30, 2016CountriesALL » COUNTRY: Canada
No data is available for the 2 most recent days.
Landing Page
Conversions
Rows 1 - 10 of 47
Search Console
Acquisition Behavior
Impressions Clicks CTR AveragePosition Sessions Bounce
RatePages /Session Transactions Revenue
EcommerceConversion
Rate
539% of Total:
22.88%(2,356)
90% of
Total:90.91%
(99)
16.70%Avg for
View:4.20%
(297.37%)
5.6Avg for
View:20
(-72.20%)
117% of
Total:21.08%
(555)
33.33%Avg for
View:41.98%
(-20.60%)
4.72Avg for
View:5.23
(-9.86%)
0% of Total:
0.00%(0)
CA$0.00% of
Total:0.00%
(CA$0.00)
0.00%Avg for
View:0.00%
(0.00%)
1. 159(29.50%)
87(96.67%)
54.72% 3.5 106(90.60%)
31.13% 4.54 0(0.00%)
CA$0.00(0.00%)
0.00%
2. 37(6.86%)
0(0.00%)
0.00% 5.3 0(0.00%)
0.00% 0.00 0(0.00%)
CA$0.00(0.00%)
0.00%
3. 32(5.94%)
0(0.00%)
0.00% 7.5 0(0.00%)
0.00% 0.00 0(0.00%)
CA$0.00(0.00%)
0.00%
4. 30(5.57%)
2(2.22%)
6.67% 1.9 2(1.71%)
100.00% 1.00 0(0.00%)
CA$0.00(0.00%)
0.00%
5. 23(4.27%)
0(0.00%)
0.00% 4.9 0(0.00%)
0.00% 0.00 0(0.00%)
CA$0.00(0.00%)
0.00%
6. 22(4.08%)
0(0.00%)
0.00% 1.4 0(0.00%)
0.00% 0.00 0(0.00%)
CA$0.00(0.00%)
0.00%
7. 21(3.90%)
0(0.00%)
0.00% 1.8 0(0.00%)
0.00% 0.00 0(0.00%)
CA$0.00(0.00%)
0.00%
8. 21(3.90%)
0(0.00%)
0.00% 1.8 0(0.00%)
0.00% 0.00 0(0.00%)
CA$0.00(0.00%)
0.00%
9. 20(3.71%)
0(0.00%)
0.00% 1.0 0(0.00%)
0.00% 0.00 0(0.00%)
CA$0.00(0.00%)
0.00%
10. 20(3.71%)
0(0.00%)
0.00% 5.0 0(0.00%)
0.00% 0.00 0(0.00%)
CA$0.00(0.00%)
0.00%
Impressions Clicks
Sep 8 Sep 15 Sep 22 Sep 29 Oct 6 Oct 13 Oct 20 Oct 27
606060
120120120
666
121212
eCommerce
/
/pages/education
/pages/about-us
/pages/contact-us
/pages/gallery-old
/pages/shipping
/pages/policies
/products/2ctw-half-bezel-diamond-tennis-bracelet
/pages/appraisals
/products/two-stone-solitaire-diamond-engagement-ring-r11707
© 2016 Google
All Users90.91% Clicks
Linara Jewellery
All Web Site Data GO TO REPORT

Sep 1, 2016 - Oct 30, 2016CountriesALL » COUNTRY: Canada » LANDING PAGE: /
No data is available for the 2 most recent days.
To protect user privacy, queries made a very small number of times or containing personal or sensitive information are grouped as "(not set)". Learn more
Search Query
Conversions
Rows 1 - 4 of 4
Search Console
Acquisition Behavior
Impressions Clicks CTR AveragePosition Sessions Bounce
RatePages /Session Transactions Revenue Ecommerce
Conversion Rate
159% of Total:
6.75%(2,356)
87% of
Total:87.88%
(99)
54.72%Avg for
View:4.20%
(1,202.15%)
3.5Avg for View:
20(-82.54%)
106% of
Total:19.10%
(555)
31.13%Avg for
View:41.98%
(-25.84%)
4.54Avg for View:
5.23(-13.31%)
0% of Total:
0.00%(0)
CA$0.00% of
Total:0.00%
(CA$0.00)
0.00%Avg for View:
0.00%(0.00%)
1. (not set) 124(77.99%)
74(85.06%)
59.68% 2.2
2. linara jewellery 17(10.69%)
11(12.64%)
64.71% 1.0
3. linara 16(10.06%)
2(2.30%)
12.50% 6.6
4. canadian diamonds toronto 2(1.26%)
0(0.00%)
0.00% 84
Impressions Clicks
Sep 8 Sep 15 Sep 22 Sep 29 Oct 6 Oct 13 Oct 20 Oct 27
101010
202020
666
121212
eCommerce
© 2016 Google
All Users87.88% Clicks
Linara Jewellery
All Web Site Data GO TO REPORT
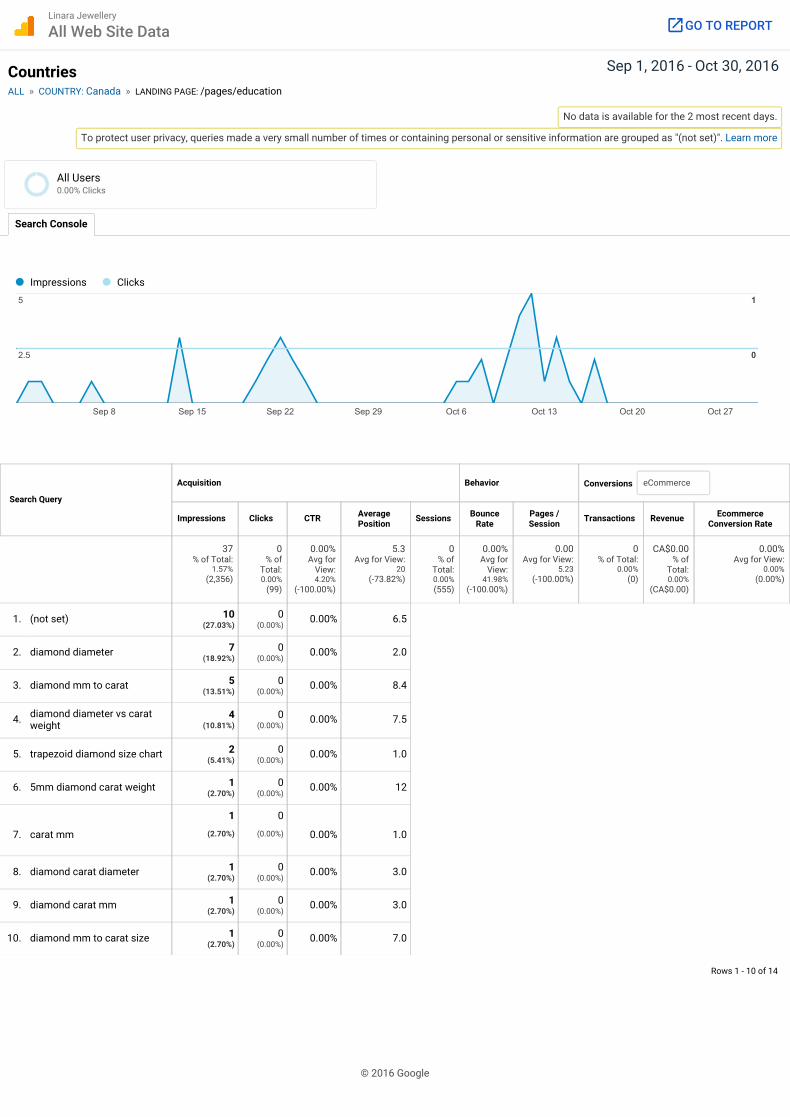
Sep 1, 2016 - Oct 30, 2016CountriesALL » COUNTRY: Canada » LANDING PAGE: /pages/education
No data is available for the 2 most recent days.
To protect user privacy, queries made a very small number of times or containing personal or sensitive information are grouped as "(not set)". Learn more
Search Query
Conversions
Rows 1 - 10 of 14
Search Console
Acquisition Behavior
Impressions Clicks CTR AveragePosition Sessions Bounce
RatePages /Session Transactions Revenue Ecommerce
Conversion Rate
37% of Total:
1.57%(2,356)
0% of
Total:0.00%
(99)
0.00%Avg for
View:4.20%
(-100.00%)
5.3Avg for View:
20(-73.82%)
0% of
Total:0.00%(555)
0.00%Avg for
View:41.98%
(-100.00%)
0.00Avg for View:
5.23(-100.00%)
0% of Total:
0.00%(0)
CA$0.00% of
Total:0.00%
(CA$0.00)
0.00%Avg for View:
0.00%(0.00%)
1. (not set) 10(27.03%)
0(0.00%)
0.00% 6.5
2. diamond diameter 7(18.92%)
0(0.00%)
0.00% 2.0
3. diamond mm to carat 5(13.51%)
0(0.00%)
0.00% 8.4
4. diamond diameter vs caratweight
4(10.81%)
0(0.00%)
0.00% 7.5
5. trapezoid diamond size chart 2(5.41%)
0(0.00%)
0.00% 1.0
6. 5mm diamond carat weight 1(2.70%)
0(0.00%)
0.00% 12
7. carat mm
1
(2.70%)
0
(0.00%) 0.00% 1.0
8. diamond carat diameter 1(2.70%)
0(0.00%)
0.00% 3.0
9. diamond carat mm 1(2.70%)
0(0.00%)
0.00% 3.0
10. diamond mm to carat size 1(2.70%)
0(0.00%)
0.00% 7.0
Impressions Clicks
Sep 8 Sep 15 Sep 22 Sep 29 Oct 6 Oct 13 Oct 20 Oct 27
2.52.52.5
555
000
111
eCommerce
© 2016 Google
All Users0.00% Clicks
Linara Jewellery
All Web Site Data GO TO REPORT

Sep 1, 2016 - Oct 30, 2016CountriesALL » COUNTRY: Canada » LANDING PAGE: /pages/about-us
No data is available for the 2 most recent days.
To protect user privacy, queries made a very small number of times or containing personal or sensitive information are grouped as "(not set)". Learn more
Search Query
Conversions
Rows 1 - 2 of 2
Search Console
Acquisition Behavior
Impressions Clicks CTR AveragePosition Sessions Bounce
RatePages /Session Transactions Revenue Ecommerce
Conversion Rate
32% of Total:
1.36%(2,356)
0% of
Total:0.00%
(99)
0.00%Avg for
View:4.20%
(-100.00%)
7.5Avg for View:
20(-62.90%)
0% of
Total:0.00%(555)
0.00%Avg for
View:41.98%
(-100.00%)
0.00Avg for View:
5.23(-100.00%)
0% of Total:
0.00%(0)
CA$0.00% of
Total:0.00%
(CA$0.00)
0.00%Avg for View:
0.00%(0.00%)
1. (not set) 31(96.88%)
0(0.00%)
0.00% 1.2
2. custom jewellers toronto 1(3.12%)
0(0.00%)
0.00% 200
Impressions Clicks
Sep 8 Sep 15 Sep 22 Sep 29 Oct 6 Oct 13 Oct 20 Oct 27
555
101010
000
111
eCommerce
© 2016 Google
All Users0.00% Clicks
Linara Jewellery
All Web Site Data GO TO REPORT

Sep 1, 2016 - Oct 30, 2016CountriesALL » COUNTRY: United States
No data is available for the 2 most recent days.
Landing Page
Conversions
Rows 1 - 10 of 48
Search Console
Acquisition Behavior
Impressions Clicks CTR AveragePosition Sessions Bounce
RatePages /Session Transactions Revenue
EcommerceConversion
Rate
361% of Total:
15.32%(2,356)
3% of
Total:3.03%
(99)
0.83%Avg for
View:4.20%
(-80.22%)
40Avg for View:
20(97.55%)
9% of
Total:1.62%(555)
33.33%Avg for
View:41.98%
(-20.60%)
2.11Avg for
View:5.23
(-59.67%)
0% of Total:
0.00%(0)
CA$0.00% of
Total:0.00%
(CA$0.00)
0.00%Avg for View:
0.00%(0.00%)
1. 188(52.08%)
0(0.00%)
0.00% 5.7 2(22.22%)
50.00% 1.50 0(0.00%)
CA$0.00(0.00%)
0.00%
2. 32(8.86%)
0(0.00%)
0.00% 40 0(0.00%)
0.00% 0.00 0(0.00%)
CA$0.00(0.00%)
0.00%
3. 22(6.09%)
0(0.00%)
0.00% 220 0(0.00%)
0.00% 0.00 0(0.00%)
CA$0.00(0.00%)
0.00%
4. 17(4.71%)
3(100.00%)
17.65% 40 2(22.22%)
0.00% 3.00 0(0.00%)
CA$0.00(0.00%)
0.00%
5. 9(2.49%)
0(0.00%)
0.00% 19 0(0.00%)
0.00% 0.00 0(0.00%)
CA$0.00(0.00%)
0.00%
6. 9(2.49%)
0(0.00%)
0.00% 22 1(11.11%)
0.00% 2.00 0(0.00%)
CA$0.00(0.00%)
0.00%
7. 8(2.22%)
0(0.00%)
0.00% 150 0(0.00%)
0.00% 0.00 0(0.00%)
CA$0.00(0.00%)
0.00%
8. 8(2.22%)
0(0.00%)
0.00% 23 1(11.11%)
100.00% 1.00 0(0.00%)
CA$0.00(0.00%)
0.00%
9. 7(1.94%)
0(0.00%)
0.00% 32 0(0.00%)
0.00% 0.00 0(0.00%)
CA$0.00(0.00%)
0.00%
10. 7(1.94%)
0(0.00%)
0.00% 220 0(0.00%)
0.00% 0.00 0(0.00%)
CA$0.00(0.00%)
0.00%
Impressions Clicks
Sep 8 Sep 15 Sep 22 Sep 29 Oct 6 Oct 13 Oct 20 Oct 27
151515
303030
0.50.50.5
111
eCommerce
/pages/education
/products/designer-diamond-stud-earrings-2
/pages/custom-design-and-manufacturing
/
/collections/geometric-rings
/collections/two-stone-rings
/collections/diamond-rings-1
/pages/metals
/collections/diamond-bracelets
/pages/custom-designs
© 2016 Google
All Users3.03% Clicks
Linara Jewellery
All Web Site Data GO TO REPORT
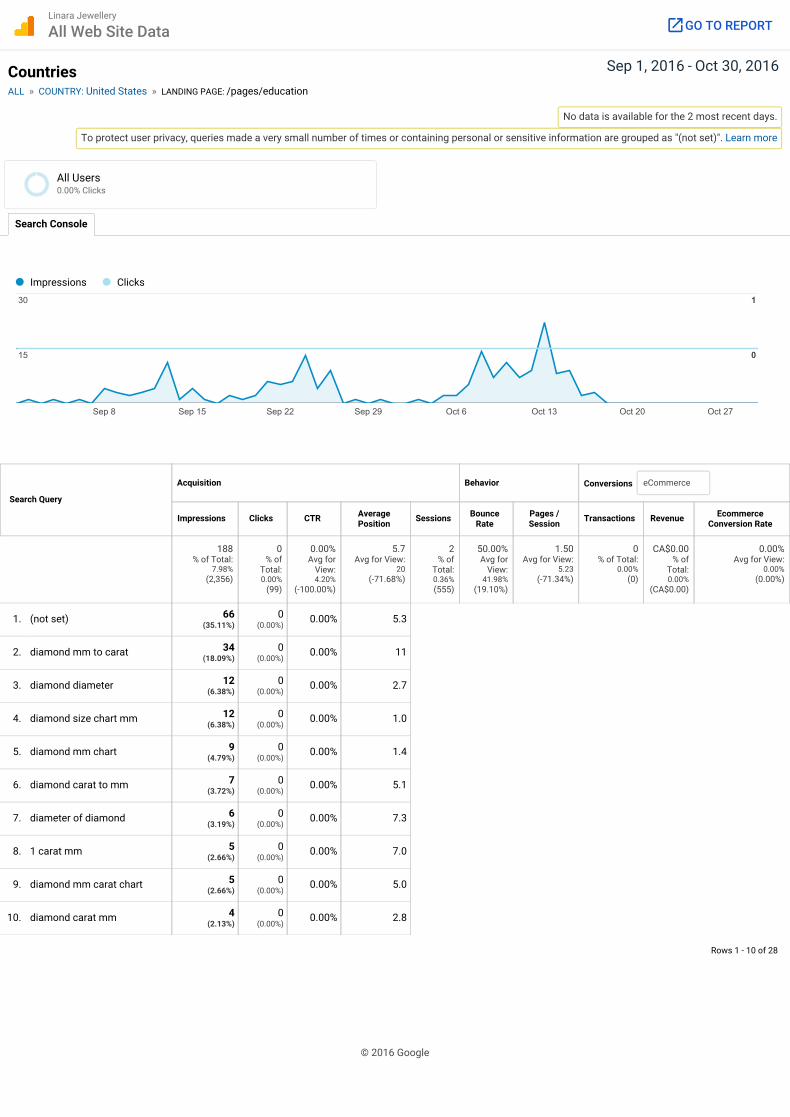
Sep 1, 2016 - Oct 30, 2016CountriesALL » COUNTRY: United States » LANDING PAGE: /pages/education
No data is available for the 2 most recent days.
To protect user privacy, queries made a very small number of times or containing personal or sensitive information are grouped as "(not set)". Learn more
Search Query
Conversions
Rows 1 - 10 of 28
Search Console
Acquisition Behavior
Impressions Clicks CTR AveragePosition Sessions Bounce
RatePages /Session Transactions Revenue Ecommerce
Conversion Rate
188% of Total:
7.98%(2,356)
0% of
Total:0.00%
(99)
0.00%Avg for
View:4.20%
(-100.00%)
5.7Avg for View:
20(-71.68%)
2% of
Total:0.36%(555)
50.00%Avg for
View:41.98%
(19.10%)
1.50Avg for View:
5.23(-71.34%)
0% of Total:
0.00%(0)
CA$0.00% of
Total:0.00%
(CA$0.00)
0.00%Avg for View:
0.00%(0.00%)
1. (not set) 66(35.11%)
0(0.00%)
0.00% 5.3
2. diamond mm to carat 34(18.09%)
0(0.00%)
0.00% 11
3. diamond diameter 12(6.38%)
0(0.00%)
0.00% 2.7
4. diamond size chart mm 12(6.38%)
0(0.00%)
0.00% 1.0
5. diamond mm chart 9(4.79%)
0(0.00%)
0.00% 1.4
6. diamond carat to mm 7(3.72%)
0(0.00%)
0.00% 5.1
7. diameter of diamond 6(3.19%)
0(0.00%)
0.00% 7.3
8. 1 carat mm 5(2.66%)
0(0.00%)
0.00% 7.0
9. diamond mm carat chart 5(2.66%)
0(0.00%)
0.00% 5.0
10. diamond carat mm 4(2.13%)
0(0.00%)
0.00% 2.8
Impressions Clicks
Sep 8 Sep 15 Sep 22 Sep 29 Oct 6 Oct 13 Oct 20 Oct 27
151515
303030
000
111
eCommerce
© 2016 Google
All Users0.00% Clicks
Linara Jewellery
All Web Site Data GO TO REPORT
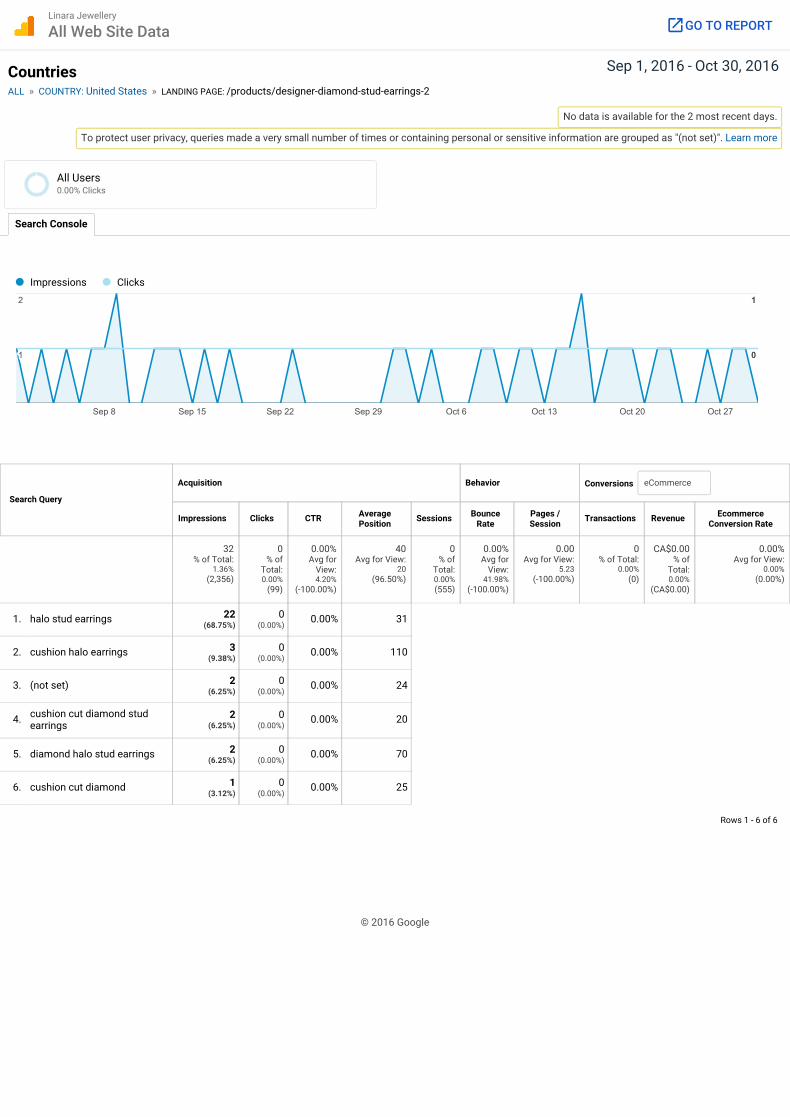
Sep 1, 2016 - Oct 30, 2016CountriesALL » COUNTRY: United States » LANDING PAGE: /products/designer-diamond-stud-earrings-2
No data is available for the 2 most recent days.
To protect user privacy, queries made a very small number of times or containing personal or sensitive information are grouped as "(not set)". Learn more
Search Query
Conversions
Rows 1 - 6 of 6
Search Console
Acquisition Behavior
Impressions Clicks CTR AveragePosition Sessions Bounce
RatePages /Session Transactions Revenue Ecommerce
Conversion Rate
32% of Total:
1.36%(2,356)
0% of
Total:0.00%
(99)
0.00%Avg for
View:4.20%
(-100.00%)
40Avg for View:
20(96.50%)
0% of
Total:0.00%(555)
0.00%Avg for
View:41.98%
(-100.00%)
0.00Avg for View:
5.23(-100.00%)
0% of Total:
0.00%(0)
CA$0.00% of
Total:0.00%
(CA$0.00)
0.00%Avg for View:
0.00%(0.00%)
1. halo stud earrings 22(68.75%)
0(0.00%)
0.00% 31
2. cushion halo earrings 3(9.38%)
0(0.00%)
0.00% 110
3. (not set) 2(6.25%)
0(0.00%)
0.00% 24
4. cushion cut diamond studearrings
2(6.25%)
0(0.00%)
0.00% 20
5. diamond halo stud earrings 2(6.25%)
0(0.00%)
0.00% 70
6. cushion cut diamond 1(3.12%)
0(0.00%)
0.00% 25
Impressions Clicks
Sep 8 Sep 15 Sep 22 Sep 29 Oct 6 Oct 13 Oct 20 Oct 27
111
222
000
111
eCommerce
© 2016 Google
All Users0.00% Clicks
Linara Jewellery
All Web Site Data GO TO REPORT
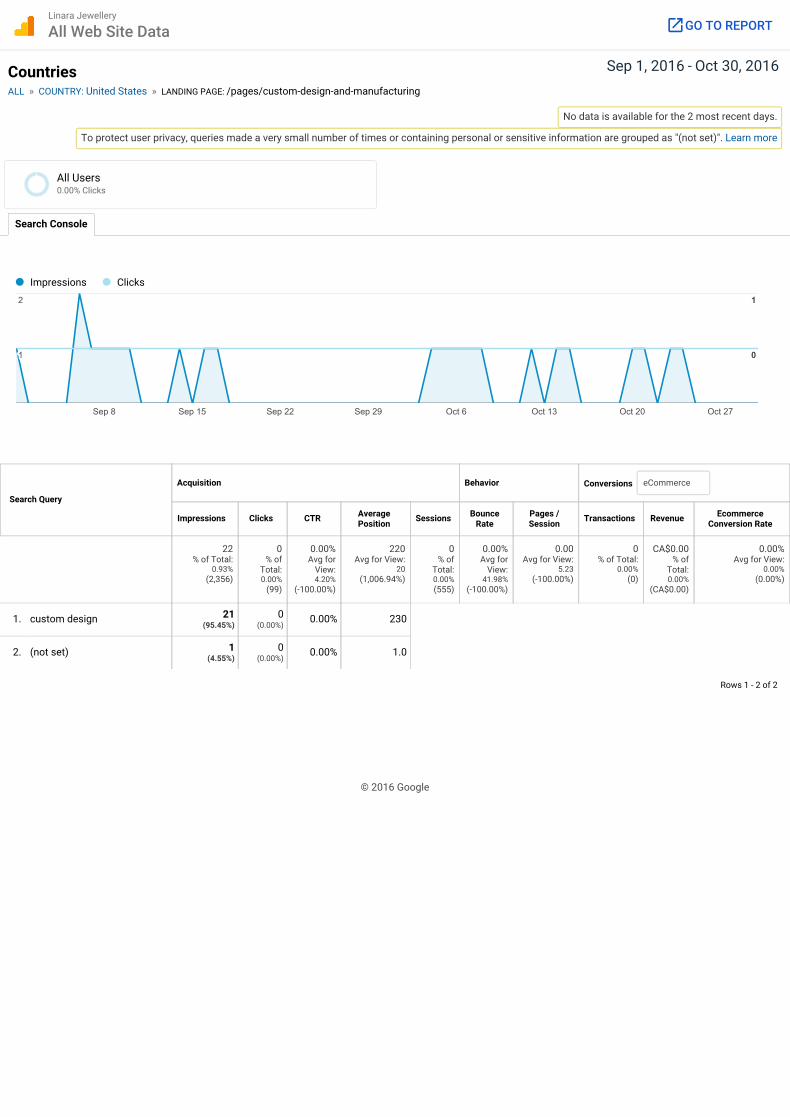
Sep 1, 2016 - Oct 30, 2016CountriesALL » COUNTRY: United States » LANDING PAGE: /pages/custom-design-and-manufacturing
No data is available for the 2 most recent days.
To protect user privacy, queries made a very small number of times or containing personal or sensitive information are grouped as "(not set)". Learn more
Search Query
Conversions
Rows 1 - 2 of 2
Search Console
Acquisition Behavior
Impressions Clicks CTR AveragePosition Sessions Bounce
RatePages /Session Transactions Revenue Ecommerce
Conversion Rate
22% of Total:
0.93%(2,356)
0% of
Total:0.00%
(99)
0.00%Avg for
View:4.20%
(-100.00%)
220Avg for View:
20(1,006.94%)
0% of
Total:0.00%(555)
0.00%Avg for
View:41.98%
(-100.00%)
0.00Avg for View:
5.23(-100.00%)
0% of Total:
0.00%(0)
CA$0.00% of
Total:0.00%
(CA$0.00)
0.00%Avg for View:
0.00%(0.00%)
1. custom design 21(95.45%)
0(0.00%)
0.00% 230
2. (not set) 1(4.55%)
0(0.00%)
0.00% 1.0
Impressions Clicks
Sep 8 Sep 15 Sep 22 Sep 29 Oct 6 Oct 13 Oct 20 Oct 27
111
222
000
111
eCommerce
© 2016 Google
All Users0.00% Clicks
Linara Jewellery
All Web Site Data GO TO REPORT
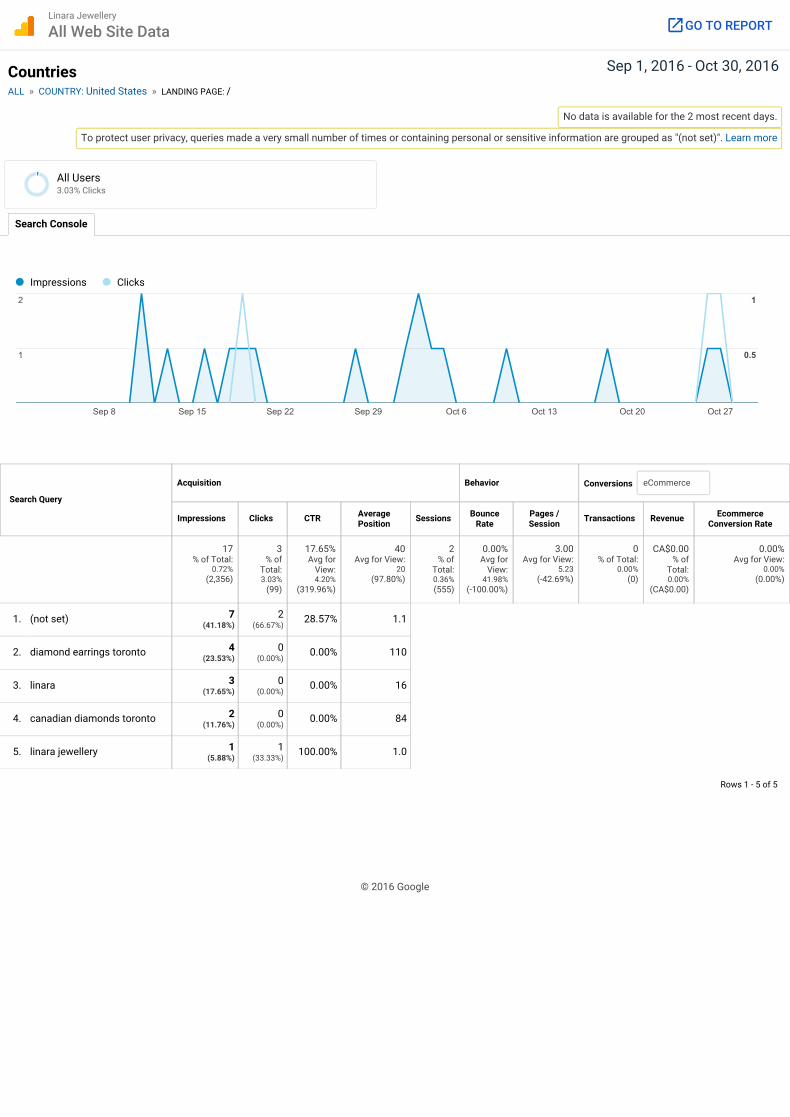
Sep 1, 2016 - Oct 30, 2016CountriesALL » COUNTRY: United States » LANDING PAGE: /
No data is available for the 2 most recent days.
To protect user privacy, queries made a very small number of times or containing personal or sensitive information are grouped as "(not set)". Learn more
Search Query
Conversions
Rows 1 - 5 of 5
Search Console
Acquisition Behavior
Impressions Clicks CTR AveragePosition Sessions Bounce
RatePages /Session Transactions Revenue Ecommerce
Conversion Rate
17% of Total:
0.72%(2,356)
3% of
Total:3.03%
(99)
17.65%Avg for
View:4.20%
(319.96%)
40Avg for View:
20(97.80%)
2% of
Total:0.36%(555)
0.00%Avg for
View:41.98%
(-100.00%)
3.00Avg for View:
5.23(-42.69%)
0% of Total:
0.00%(0)
CA$0.00% of
Total:0.00%
(CA$0.00)
0.00%Avg for View:
0.00%(0.00%)
1. (not set) 7(41.18%)
2(66.67%)
28.57% 1.1
2. diamond earrings toronto 4(23.53%)
0(0.00%)
0.00% 110
3. linara 3(17.65%)
0(0.00%)
0.00% 16
4. canadian diamonds toronto 2(11.76%)
0(0.00%)
0.00% 84
5. linara jewellery 1(5.88%)
1(33.33%)
100.00% 1.0
Impressions Clicks
Sep 8 Sep 15 Sep 22 Sep 29 Oct 6 Oct 13 Oct 20 Oct 27
111
222
0.50.50.5
111
eCommerce
© 2016 Google
All Users3.03% Clicks
Linara Jewellery
All Web Site Data GO TO REPORT

Sep 1, 2016 - Oct 30, 2016CountriesALL » COUNTRY: United States » LANDING PAGE: /collections/geometric-rings
No data is available for the 2 most recent days.
To protect user privacy, queries made a very small number of times or containing personal or sensitive information are grouped as "(not set)". Learn more
Search Query
Conversions
Rows 1 - 3 of 3
Search Console
Acquisition Behavior
Impressions Clicks CTR AveragePosition Sessions Bounce
RatePages /Session Transactions Revenue Ecommerce
Conversion Rate
9% of Total:
0.38%(2,356)
0% of
Total:0.00%
(99)
0.00%Avg for
View:4.20%
(-100.00%)
19Avg for View:
20(-5.08%)
0% of
Total:0.00%(555)
0.00%Avg for
View:41.98%
(-100.00%)
0.00Avg for View:
5.23(-100.00%)
0% of Total:
0.00%(0)
CA$0.00% of
Total:0.00%
(CA$0.00)
0.00%Avg for View:
0.00%(0.00%)
1. geometric rings 4(44.44%)
0(0.00%)
0.00% 25
2. (not set) 3(33.33%)
0(0.00%)
0.00% 1.0
3. geometric diamond rings 2(22.22%)
0(0.00%)
0.00% 36
Impressions Clicks
Sep 8 Sep 15 Sep 22 Sep 29 Oct 6 Oct 13 Oct 20 Oct 27
111
222
000
111
eCommerce
© 2016 Google
All Users0.00% Clicks
Linara Jewellery
All Web Site Data GO TO REPORT

Sep 1, 2016 - Oct 30, 2016CountriesALL » COUNTRY: United States » LANDING PAGE: /collections/two-stone-rings
No data is available for the 2 most recent days.
To protect user privacy, queries made a very small number of times or containing personal or sensitive information are grouped as "(not set)". Learn more
Search Query
Conversions
Rows 1 - 3 of 3
Search Console
Acquisition Behavior
Impressions Clicks CTR AveragePosition Sessions Bounce
RatePages /Session Transactions Revenue Ecommerce
Conversion Rate
9% of Total:
0.38%(2,356)
0% of
Total:0.00%
(99)
0.00%Avg for
View:4.20%
(-100.00%)
22Avg for View:
20(8.17%)
1% of
Total:0.18%(555)
0.00%Avg for
View:41.98%
(-100.00%)
2.00Avg for View:
5.23(-61.79%)
0% of Total:
0.00%(0)
CA$0.00% of
Total:0.00%
(CA$0.00)
0.00%Avg for View:
0.00%(0.00%)
1. two stone rings 5(55.56%)
0(0.00%)
0.00% 30
2. (not set) 3(33.33%)
0(0.00%)
0.00% 1.7
3. double stone ring 1(11.11%)
0(0.00%)
0.00% 39
Impressions Clicks
Sep 8 Sep 15 Sep 22 Sep 29 Oct 6 Oct 13 Oct 20 Oct 27
0.50.50.5
111
000
111
eCommerce
© 2016 Google
All Users0.00% Clicks
Linara Jewellery
All Web Site Data GO TO REPORT

Sep 1, 2016 - Oct 30, 2016CountriesALL » COUNTRY: United States » LANDING PAGE: /collections/diamond-rings-1
No data is available for the 2 most recent days.
To protect user privacy, queries made a very small number of times or containing personal or sensitive information are grouped as "(not set)". Learn more
Search Query
Conversions
Rows 1 - 1 of 1
Search Console
Acquisition Behavior
Impressions Clicks CTR AveragePosition Sessions Bounce
RatePages /Session Transactions Revenue Ecommerce
Conversion Rate
8% of Total:
0.34%(2,356)
0% of
Total:0.00%
(99)
0.00%Avg for
View:4.20%
(-100.00%)
150Avg for View:
20(622.06%)
0% of
Total:0.00%(555)
0.00%Avg for
View:41.98%
(-100.00%)
0.00Avg for View:
5.23(-100.00%)
0% of Total:
0.00%(0)
CA$0.00% of
Total:0.00%
(CA$0.00)
0.00%Avg for View:
0.00%(0.00%)
1. diamond rings 8(100.00%)
0(0.00%)
0.00% 150
Impressions Clicks
Sep 8 Sep 15 Sep 22 Sep 29 Oct 6 Oct 13 Oct 20 Oct 27
111
222
000
111
eCommerce
© 2016 Google
All Users0.00% Clicks
Linara Jewellery
All Web Site Data GO TO REPORT

Sep 1, 2016 - Oct 30, 2016CountriesALL » COUNTRY: United States » LANDING PAGE: /collections/diamond-bracelets
No data is available for the 2 most recent days.
To protect user privacy, queries made a very small number of times or containing personal or sensitive information are grouped as "(not set)". Learn more
Search Query
Conversions
Rows 1 - 2 of 2
Search Console
Acquisition Behavior
Impressions Clicks CTR AveragePosition Sessions Bounce
RatePages /Session Transactions Revenue Ecommerce
Conversion Rate
7% of Total:
0.30%(2,356)
0% of
Total:0.00%
(99)
0.00%Avg for
View:4.20%
(-100.00%)
32Avg for View:
20(59.65%)
0% of
Total:0.00%(555)
0.00%Avg for
View:41.98%
(-100.00%)
0.00Avg for View:
5.23(-100.00%)
0% of Total:
0.00%(0)
CA$0.00% of
Total:0.00%
(CA$0.00)
0.00%Avg for View:
0.00%(0.00%)
1. diamond bracelets 6(85.71%)
0(0.00%)
0.00% 37
2. (not set) 1(14.29%)
0(0.00%)
0.00% 1.0
Impressions Clicks
Sep 8 Sep 15 Sep 22 Sep 29 Oct 6 Oct 13 Oct 20 Oct 27
0.50.50.5
111
000
111
eCommerce
© 2016 Google
All Users0.00% Clicks
Linara Jewellery
All Web Site Data GO TO REPORT
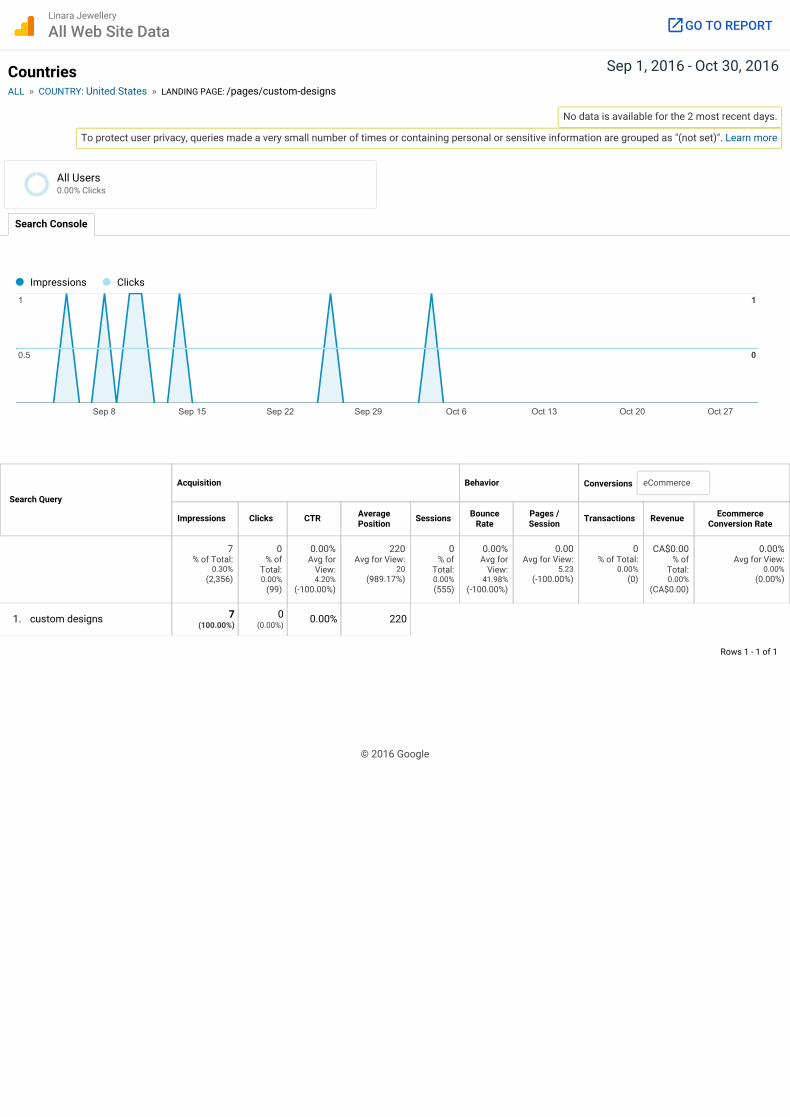
Sep 1, 2016 - Oct 30, 2016CountriesALL » COUNTRY: United States » LANDING PAGE: /pages/custom-designs
No data is available for the 2 most recent days.
To protect user privacy, queries made a very small number of times or containing personal or sensitive information are grouped as "(not set)". Learn more
Search Query
Conversions
Rows 1 - 1 of 1
Search Console
Acquisition Behavior
Impressions Clicks CTR AveragePosition Sessions Bounce
RatePages /Session Transactions Revenue Ecommerce
Conversion Rate
7% of Total:
0.30%(2,356)
0% of
Total:0.00%
(99)
0.00%Avg for
View:4.20%
(-100.00%)
220Avg for View:
20(989.17%)
0% of
Total:0.00%(555)
0.00%Avg for
View:41.98%
(-100.00%)
0.00Avg for View:
5.23(-100.00%)
0% of Total:
0.00%(0)
CA$0.00% of
Total:0.00%
(CA$0.00)
0.00%Avg for View:
0.00%(0.00%)
1. custom designs 7(100.00%)
0(0.00%)
0.00% 220
Impressions Clicks
Sep 8 Sep 15 Sep 22 Sep 29 Oct 6 Oct 13 Oct 20 Oct 27
0.50.50.5
111
000
111
eCommerce
© 2016 Google
All Users0.00% Clicks
Linara Jewellery
All Web Site Data GO TO REPORT

14
Acquisition: Queries
Google Search Console can uncover some of the keywords that people use to find your website in Google search. The Queries report brings that information into Google Analytics for you, along with the number of impressions, clicks and click-through rates for each keyword.
Unfortunately, you can’t tell which keyword queries led to conversions. But there is a workaround.
If you see that a visitor from Google search made a conversion on your website and you want to know which keyword led the person to complete that goal, look at the keywords that received clicks on that particular day—you may be able to link them together (depending on the number of clicks/queries you have per day).
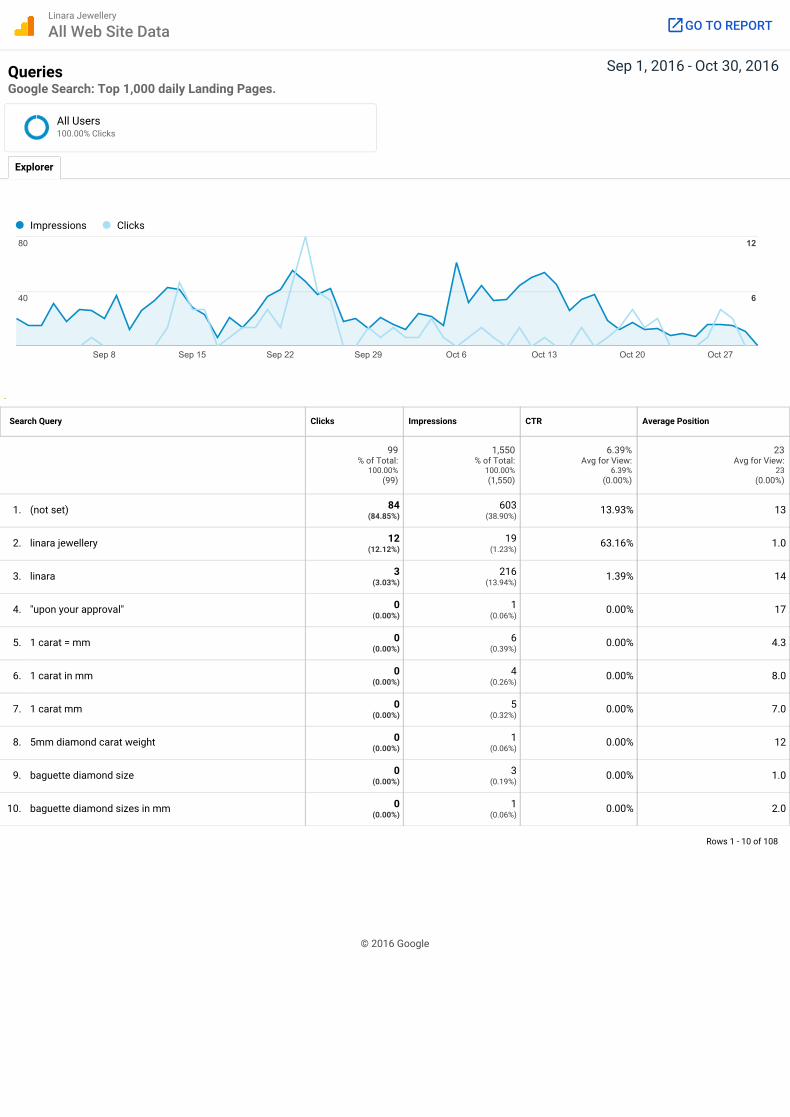
Sep 1, 2016 - Oct 30, 2016QueriesGoogle Search: Top 1,000 daily Landing Pages.
Search Query
Rows 1 - 10 of 108
Explorer
Clicks Impressions CTR Average Position
99% of Total:
100.00%(99)
1,550% of Total:
100.00%(1,550)
6.39%Avg for View:
6.39%(0.00%)
23Avg for View:
23(0.00%)
1. (not set) 84(84.85%)
603(38.90%)
13.93% 13
2. linara jewellery 12(12.12%)
19(1.23%)
63.16% 1.0
3. linara 3(3.03%)
216(13.94%)
1.39% 14
4. "upon your approval" 0(0.00%)
1(0.06%)
0.00% 17
5. 1 carat = mm 0(0.00%)
6(0.39%)
0.00% 4.3
6. 1 carat in mm 0(0.00%)
4(0.26%)
0.00% 8.0
7. 1 carat mm 0(0.00%)
5(0.32%)
0.00% 7.0
8. 5mm diamond carat weight 0(0.00%)
1(0.06%)
0.00% 12
9. baguette diamond size 0(0.00%)
3(0.19%)
0.00% 1.0
10. baguette diamond sizes in mm 0(0.00%)
1(0.06%)
0.00% 2.0
Impressions Clicks
Sep 8 Sep 15 Sep 22 Sep 29 Oct 6 Oct 13 Oct 20 Oct 27
404040
808080
666
121212
© 2016 Google
All Users100.00% Clicks
Linara Jewellery
All Web Site Data GO TO REPORT
15
Acquisition: Social
The Social section gives you more in-depth details about social activity related to your website.
The Social Overview starts by giving you a summary of conversions linked to social networks
and traffic from specific networks.
This section offers seven additional reports so you can drill down to find more specific data.
Network Referrals:
The Network Referrals report shows you the top social networks driving visitors to your website. This report doesn’t focus on conversions so much as visitors’ behavior on your website. This
can show you whether visitors from one network are more involved with your website than visitors from another.
You can click on any of the networks listed to find out which website pages they are sending traffic to—and how long people are staying.
Landing Pages:
Want to know which pages on your website receive the most traffic from social networks?
You can find that in the Landing Pages report.
When you click on the pages from your website, you’ll see a breakdown of which social
networks sent the most traffic to that specific page.
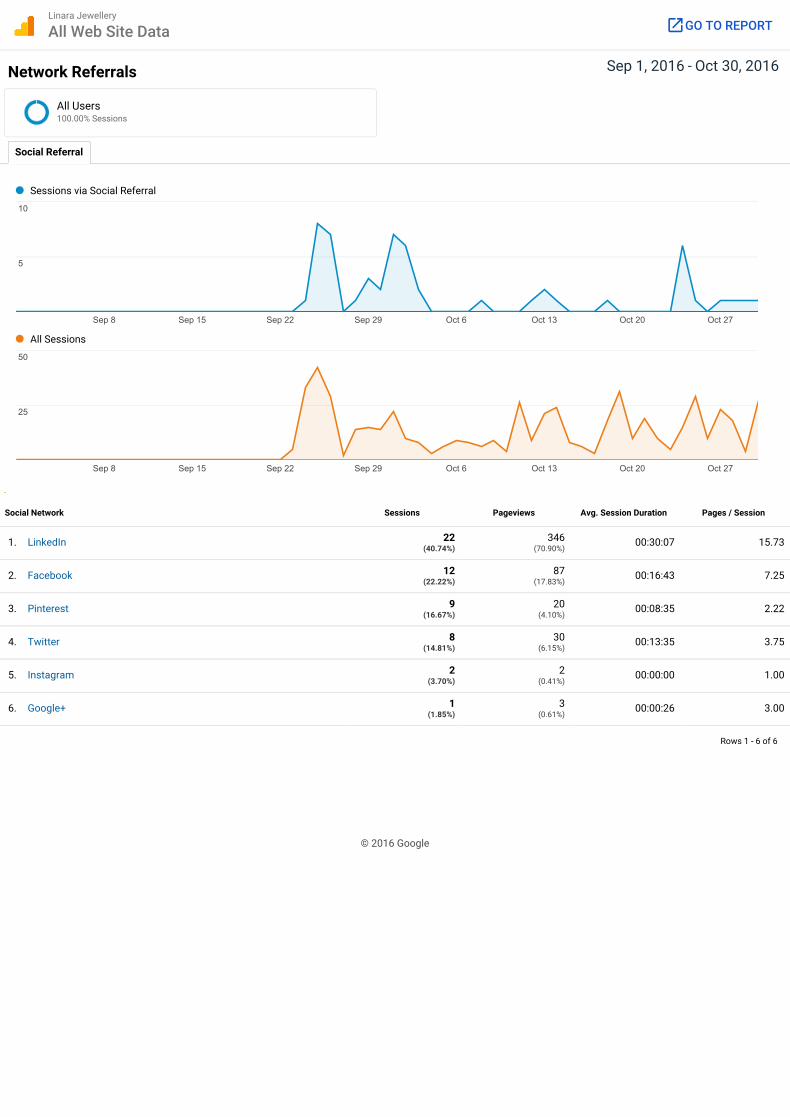
Sep 1, 2016 - Oct 30, 2016Network Referrals
Rows 1 - 6 of 6
Social Referral
1. LinkedIn 22(40.74%)
346(70.90%)
00:30:07 15.73
2. Facebook 12(22.22%)
87(17.83%)
00:16:43 7.25
3. Pinterest 9(16.67%)
20(4.10%)
00:08:35 2.22
4. Twitter 8(14.81%)
30(6.15%)
00:13:35 3.75
5. Instagram 2(3.70%)
2(0.41%)
00:00:00 1.00
6. Google+ 1(1.85%)
3(0.61%)
00:00:26 3.00
Sessions via Social Referral
Sep 8 Sep 15 Sep 22 Sep 29 Oct 6 Oct 13 Oct 20 Oct 27
555
101010
All Sessions
Sep 8 Sep 15 Sep 22 Sep 29 Oct 6 Oct 13 Oct 20 Oct 27
252525
505050
Social Network Sessions Pageviews Avg. Session Duration Pages / Session
© 2016 Google
All Users100.00% Sessions
Linara Jewellery
All Web Site Data GO TO REPORT

Sep 1, 2016 - Oct 30, 2016Network ReferralsALL » SOCIAL NETWORK: LinkedIn
Rows 1 - 9 of 9
Social Referral
1. linara.ca/ 11(50.00%)
181(52.31%)
00:28:25 16.45
2. linara.ca/collections/collections 3(13.64%)
3(0.87%)
00:00:00 1.00
3. linara.ca/blogs/gemstone-of-the-month-opals-for-october 2(9.09%)
4(1.16%)
00:00:59 2.00
4. linara.ca/pages?cache=false&preview_key=0d93fb38666cfbda21cc586a6a15b937
1(4.55%)
85(24.57%)
01:18:19 85.00
5. linara.ca/pages?cache=false&preview_key=725e193070367663e246114119d98bd4
1(4.55%)
23(6.65%)
01:47:34 23.00
6. linara.ca/pages/contact-us 1(4.55%)
7(2.02%)
00:54:24 7.00
7. linara.ca/pages/diamonds 1(4.55%)
1(0.29%)
00:00:00 1.00
8. linara.ca/pages/gallery 1(4.55%)
2(0.58%)
00:27:04 2.00
9. linara.ca/pages/world-market 1(4.55%)
40(11.56%)
01:20:49 40.00
Sessions via Social Referral
Sep 8 Sep 15 Sep 22 Sep 29 Oct 6 Oct 13 Oct 20 Oct 27
444
888
All Sessions
Sep 8 Sep 15 Sep 22 Sep 29 Oct 6 Oct 13 Oct 20 Oct 27
252525
505050
Shared URL Sessions Pageviews Avg. SessionDuration Pages / Session
© 2016 Google
All Users3.96% Sessions
Linara Jewellery
All Web Site Data GO TO REPORT

Sep 1, 2016 - Oct 30, 2016Network ReferralsALL » SOCIAL NETWORK: Facebook
Rows 1 - 7 of 7
Social Referral
1. linara.ca/blogs/where-do-semi-precious-stones-come-from 3(25.00%)
19(21.84%)
00:21:29 6.33
2. linara.ca/ 2(16.67%)
7(8.05%)
00:03:31 3.50
3. linara.ca/blogs/gemstone-of-the-month-opals-for-october 2(16.67%)
3(3.45%)
00:13:48 1.50
4. linara.ca/collections/two-stone-rings 2(16.67%)
3(3.45%)
00:00:10 1.50
5. linara.ca/collections/diamond-bracelets 1(8.33%)
2(2.30%)
00:00:14 2.00
6. linara.ca/pages/bridal 1(8.33%)
5(5.75%)
00:09:10 5.00
7. linara.ca/pages/canadian-diamonds 1(8.33%)
48(55.17%)
01:31:49 48.00
Sessions via Social Referral
Sep 8 Sep 15 Sep 22 Sep 29 Oct 6 Oct 13 Oct 20 Oct 27
2.52.52.5
555
All Sessions
Sep 8 Sep 15 Sep 22 Sep 29 Oct 6 Oct 13 Oct 20 Oct 27
252525
505050
Shared URL Sessions Pageviews Avg. Session Duration Pages / Session
© 2016 Google
All Users2.16% Sessions
Linara Jewellery
All Web Site Data GO TO REPORT
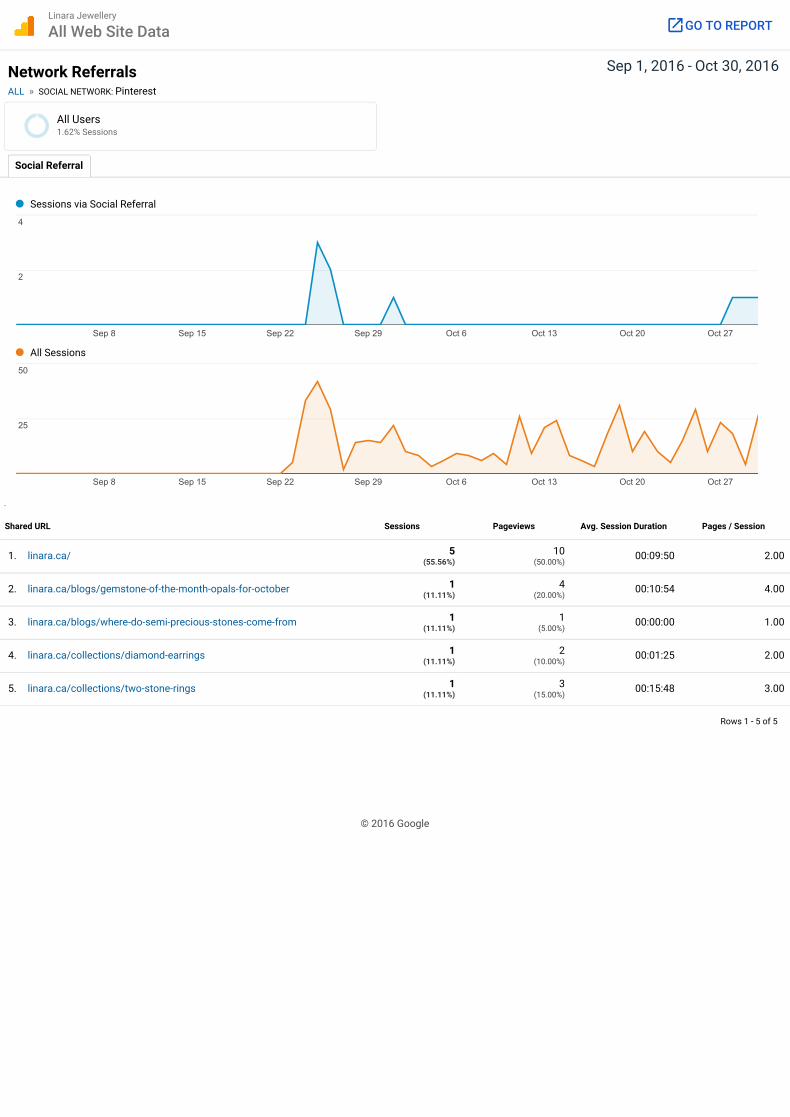
Sep 1, 2016 - Oct 30, 2016Network ReferralsALL » SOCIAL NETWORK: Pinterest
Rows 1 - 5 of 5
Social Referral
1. linara.ca/ 5(55.56%)
10(50.00%)
00:09:50 2.00
2. linara.ca/blogs/gemstone-of-the-month-opals-for-october 1(11.11%)
4(20.00%)
00:10:54 4.00
3. linara.ca/blogs/where-do-semi-precious-stones-come-from 1(11.11%)
1(5.00%)
00:00:00 1.00
4. linara.ca/collections/diamond-earrings 1(11.11%)
2(10.00%)
00:01:25 2.00
5. linara.ca/collections/two-stone-rings 1(11.11%)
3(15.00%)
00:15:48 3.00
Sessions via Social Referral
Sep 8 Sep 15 Sep 22 Sep 29 Oct 6 Oct 13 Oct 20 Oct 27
222
444
All Sessions
Sep 8 Sep 15 Sep 22 Sep 29 Oct 6 Oct 13 Oct 20 Oct 27
252525
505050
Shared URL Sessions Pageviews Avg. Session Duration Pages / Session
© 2016 Google
All Users1.62% Sessions
Linara Jewellery
All Web Site Data GO TO REPORT
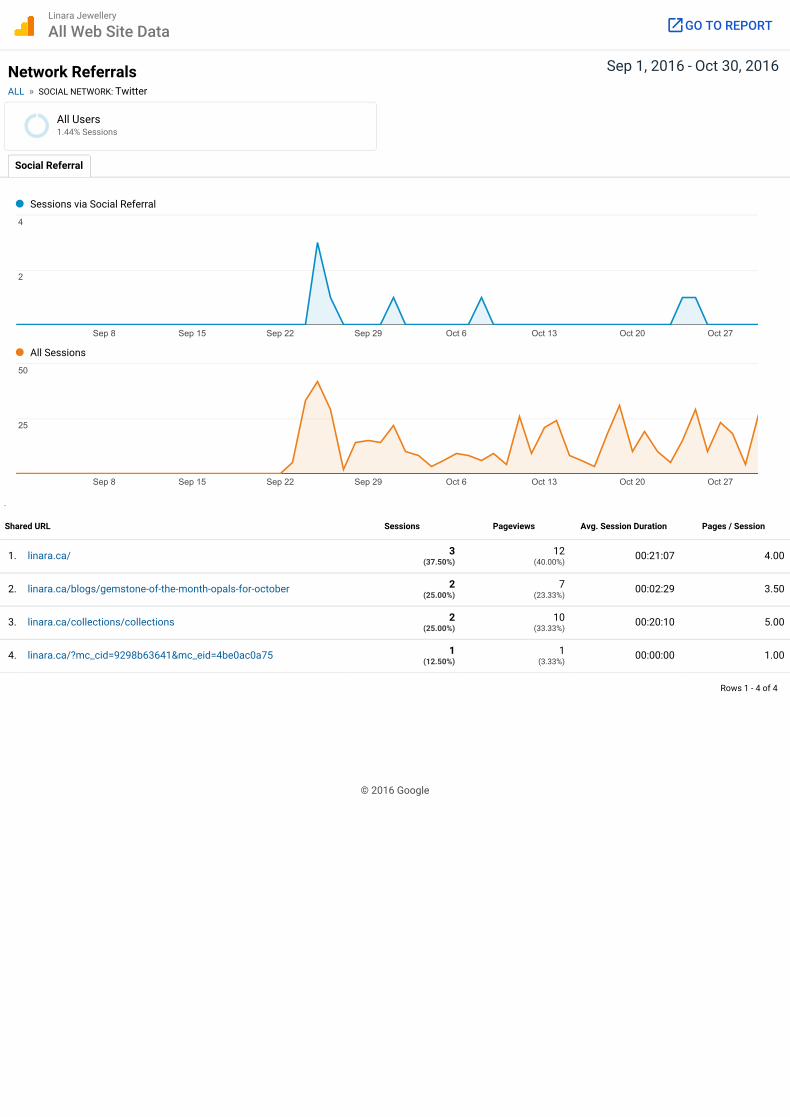
Sep 1, 2016 - Oct 30, 2016Network ReferralsALL » SOCIAL NETWORK: Twitter
Rows 1 - 4 of 4
Social Referral
1. linara.ca/ 3(37.50%)
12(40.00%)
00:21:07 4.00
2. linara.ca/blogs/gemstone-of-the-month-opals-for-october 2(25.00%)
7(23.33%)
00:02:29 3.50
3. linara.ca/collections/collections 2(25.00%)
10(33.33%)
00:20:10 5.00
4. linara.ca/?mc_cid=9298b63641&mc_eid=4be0ac0a75 1(12.50%)
1(3.33%)
00:00:00 1.00
Sessions via Social Referral
Sep 8 Sep 15 Sep 22 Sep 29 Oct 6 Oct 13 Oct 20 Oct 27
222
444
All Sessions
Sep 8 Sep 15 Sep 22 Sep 29 Oct 6 Oct 13 Oct 20 Oct 27
252525
505050
Shared URL Sessions Pageviews Avg. Session Duration Pages / Session
© 2016 Google
All Users1.44% Sessions
Linara Jewellery
All Web Site Data GO TO REPORT
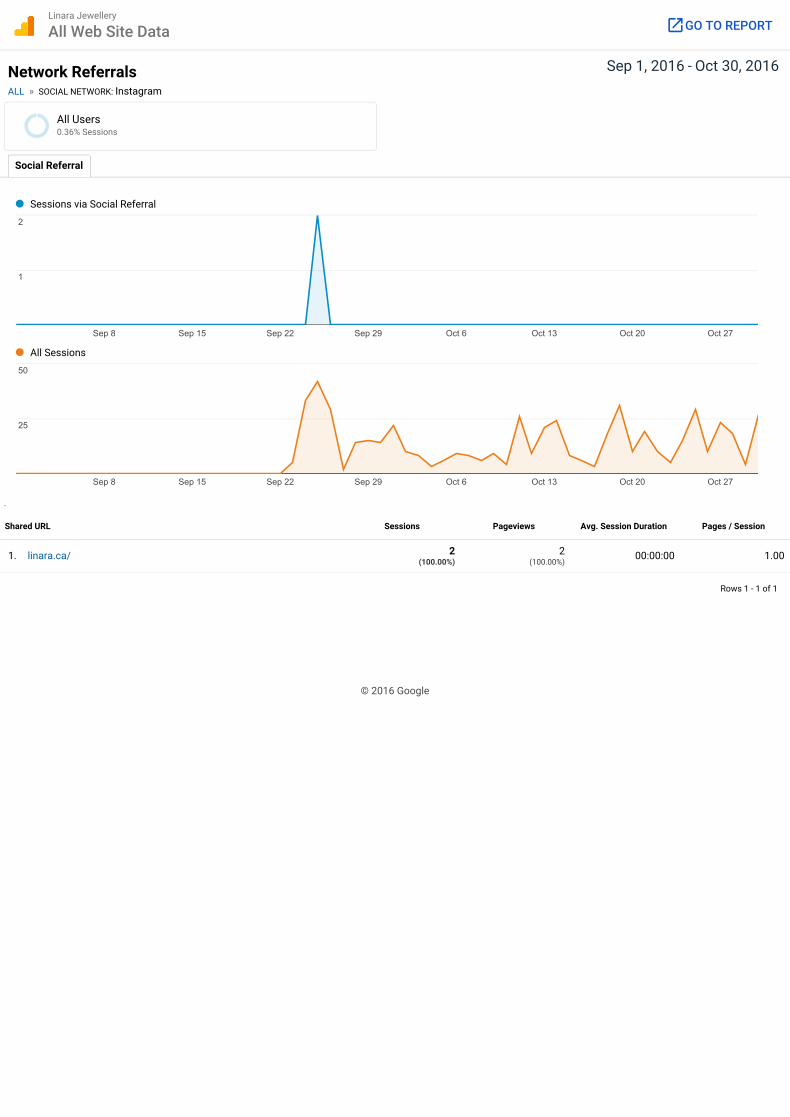
Sep 1, 2016 - Oct 30, 2016Network ReferralsALL » SOCIAL NETWORK: Instagram
Rows 1 - 1 of 1
Social Referral
1. linara.ca/ 2(100.00%)
2(100.00%)
00:00:00 1.00
Sessions via Social Referral
Sep 8 Sep 15 Sep 22 Sep 29 Oct 6 Oct 13 Oct 20 Oct 27
111
222
All Sessions
Sep 8 Sep 15 Sep 22 Sep 29 Oct 6 Oct 13 Oct 20 Oct 27
252525
505050
Shared URL Sessions Pageviews Avg. Session Duration Pages / Session
© 2016 Google
All Users0.36% Sessions
Linara Jewellery
All Web Site Data GO TO REPORT
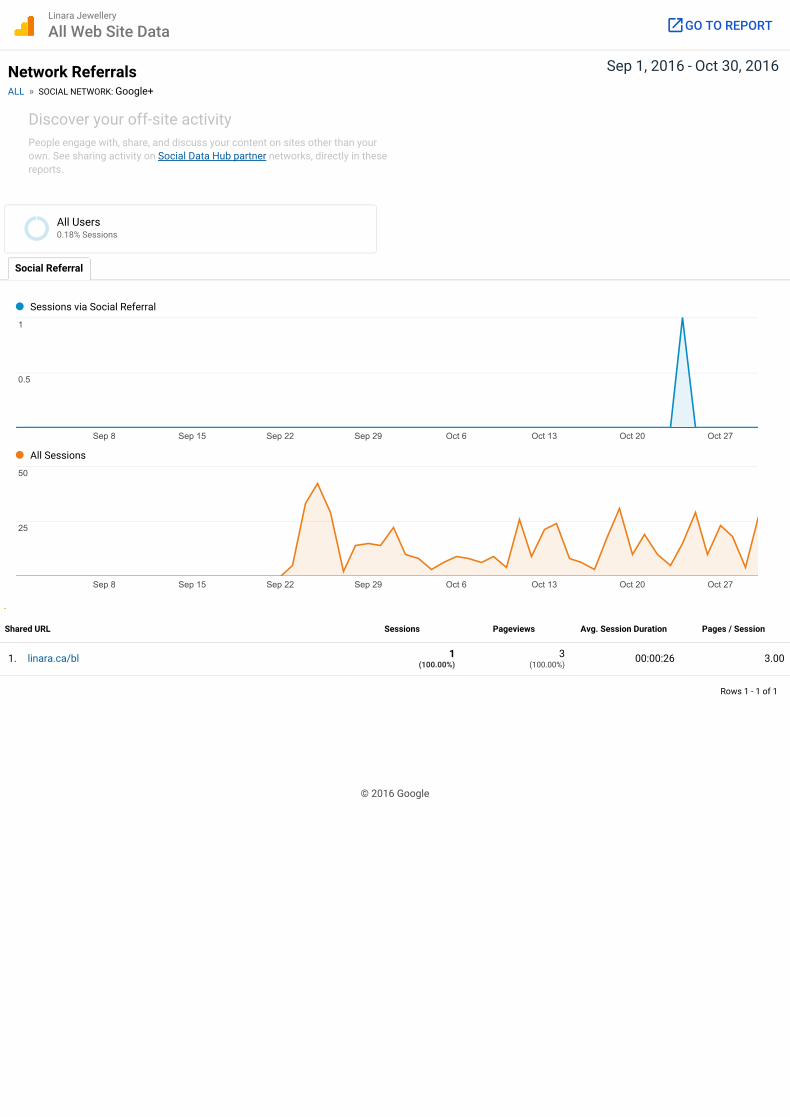
Sep 1, 2016 - Oct 30, 2016Network ReferralsALL » SOCIAL NETWORK: Google+
Rows 1 - 1 of 1
Discover your off-site activityPeople engage with, share, and discuss your content on sites other than yourown. See sharing activity on Social Data Hub partner networks, directly in thesereports.
Social Referral
1. linara.ca/bl 1(100.00%)
3(100.00%)
00:00:26 3.00
Sessions via Social Referral
Sep 8 Sep 15 Sep 22 Sep 29 Oct 6 Oct 13 Oct 20 Oct 27
0.50.50.5
111
All Sessions
Sep 8 Sep 15 Sep 22 Sep 29 Oct 6 Oct 13 Oct 20 Oct 27
252525
505050
Shared URL Sessions Pageviews Avg. Session Duration Pages / Session
© 2016 Google
All Users0.18% Sessions
Linara Jewellery
All Web Site Data GO TO REPORT

16
Acquisition: Users Flow
In the Social section is the Users Flow report, this is where you’ll find the path visitors take
after coming to your website from a social network.
This report goes as far as 10 interactions and beyond, depending on how many pages your
visitors visit after arriving from a particular social network. It’s a great way to visualize how
people navigate your website.

Sep 1, 2016 - Oct 30, 2016Social Users Flow
Social Network54 sessions, 19 drop-offs 35 sessions, 13 drop-offs 22 sessions, 8 drop-offs 14 sessions, 5 drop-offsStarting pages 1st Interaction 2nd Interaction 3rd Interaction
LinkedIn22
Facebook12
Twitter8
Pinterest9
Instagram2
...1
/24
/collection...tone-rings3
/collection...ollections5
(11 more pages)11
/blogs/gems...or-october7
/blogs/wher...-come-from4
/blogs/gems...or-october7
/pages/contact-us7
/collection...d-earrings3
(11 more pages)11
/4
/pages/diamonds3
/4
/pages/contact-us2
(11 more pages)11
/pages/bridal2
/pages/world-market1
/blogs/gems...or-october2
/pages/contact-us2
/pages/diamonds3
(6 more pages)6
/pages/test...responsive1
/pages/cust...ufacturing1
/pages/world-market1
⇩
© 2016 Google
All Users100.00% Sessions
Linara Jewellery
All Web Site Data GO TO REPORT

17
Behavior: Overview
The Behavior reports section contains reports designed to help you improve the content on your
site and how visitors are reacting to it. This includes information on the speed and load time of
your pages, which can have an effect on your SEO.
Behavior reports can also help you identify the bounce rate of each page. Bounce rate, expressed
as a percentage, refers to the amount of people that leave your site having only viewed one single
page. This is usually an indication that they were confused or that they didn't find what they were
looking for. Understanding which pages have the highest bounce rate can help you understand
the pages that need to be looked at more closely.
Look below for a brief description of the data you’ll find in the Behavior Overview report.
Pageviews—The total number of pages viewed. This number includes repeated views of a single page. In other words, a single person may view the same page several times and each view is counted as a pageview.
Unique Pageviews—The number of individual people who have viewed a specific page at least once during a visit. For example, if a single user views a page more than once during the same visit, only the original view is counted (whereas general Pageviews count each visit). The Unique Pageviews metric counts each page URL + Page Title combination.
Avg. Time on Page—The average amount of time users spend viewing a specific page or screen, or set of pages or screens.
Bounce Rate—The percentage of single-page visits or the number of visits in which people left your website from the same page they entered on. For example, if you visit a single article or page on a website and then leave, that’s counted as a bounce and is factored into the Bounce
Rate.
% Exit—The percentage of users who exit from a page or set of pages.
What Can You Do With This Information?
Behavior reports can help you better understand areas of your site that need improvements.
Understanding the information in these reports are key to creating a better experience for your
visitors, thus increasing conversions.

Sep 1, 2016 - Oct 30, 2016Overview
Page Pageviews % Pageviews
1. 520 17.90%
2. 405 13.94%
3. 151 5.20%
4. 124 4.27%
5. 115 3.96%
6. 95 3.27%
7. 94 3.24%
8. 84 2.89%
9. 79 2.72%
10. 76 2.62%
Overview
Pageviews % Exit
Sep 8 Sep 15 Sep 22 Sep 29 Oct 6 Oct 13 Oct 20 Oct 27
200200200
400400400
50.00%50.00%50.00%
100.00%100.00%100.00%
Pageviews
2,905Unique Pageviews
1,369Avg. Time on Page
00:02:02Bounce Rate
41.98%% Exit
19.10%
/
/pages/bridal
/pages/jewellery
/pages/custom-design-and-manufacturing
/collections
/pages/contact-us
/collections/solitaire
/pages/test-for-responsive
/pages/diamonds
/collections/bridal
© 2016 Google
All Users100.00% Pageviews
Linara Jewellery
All Web Site Data GO TO REPORT
18
Behavior: Behavior Flow
The Behavior Flow report lets you see the path visitors commonly take on your website—
from the first page they view to the last page they visit before leaving your site.
This report gives you a visual guide to how long visitors stay on your website and where those
visitors end up leaving.
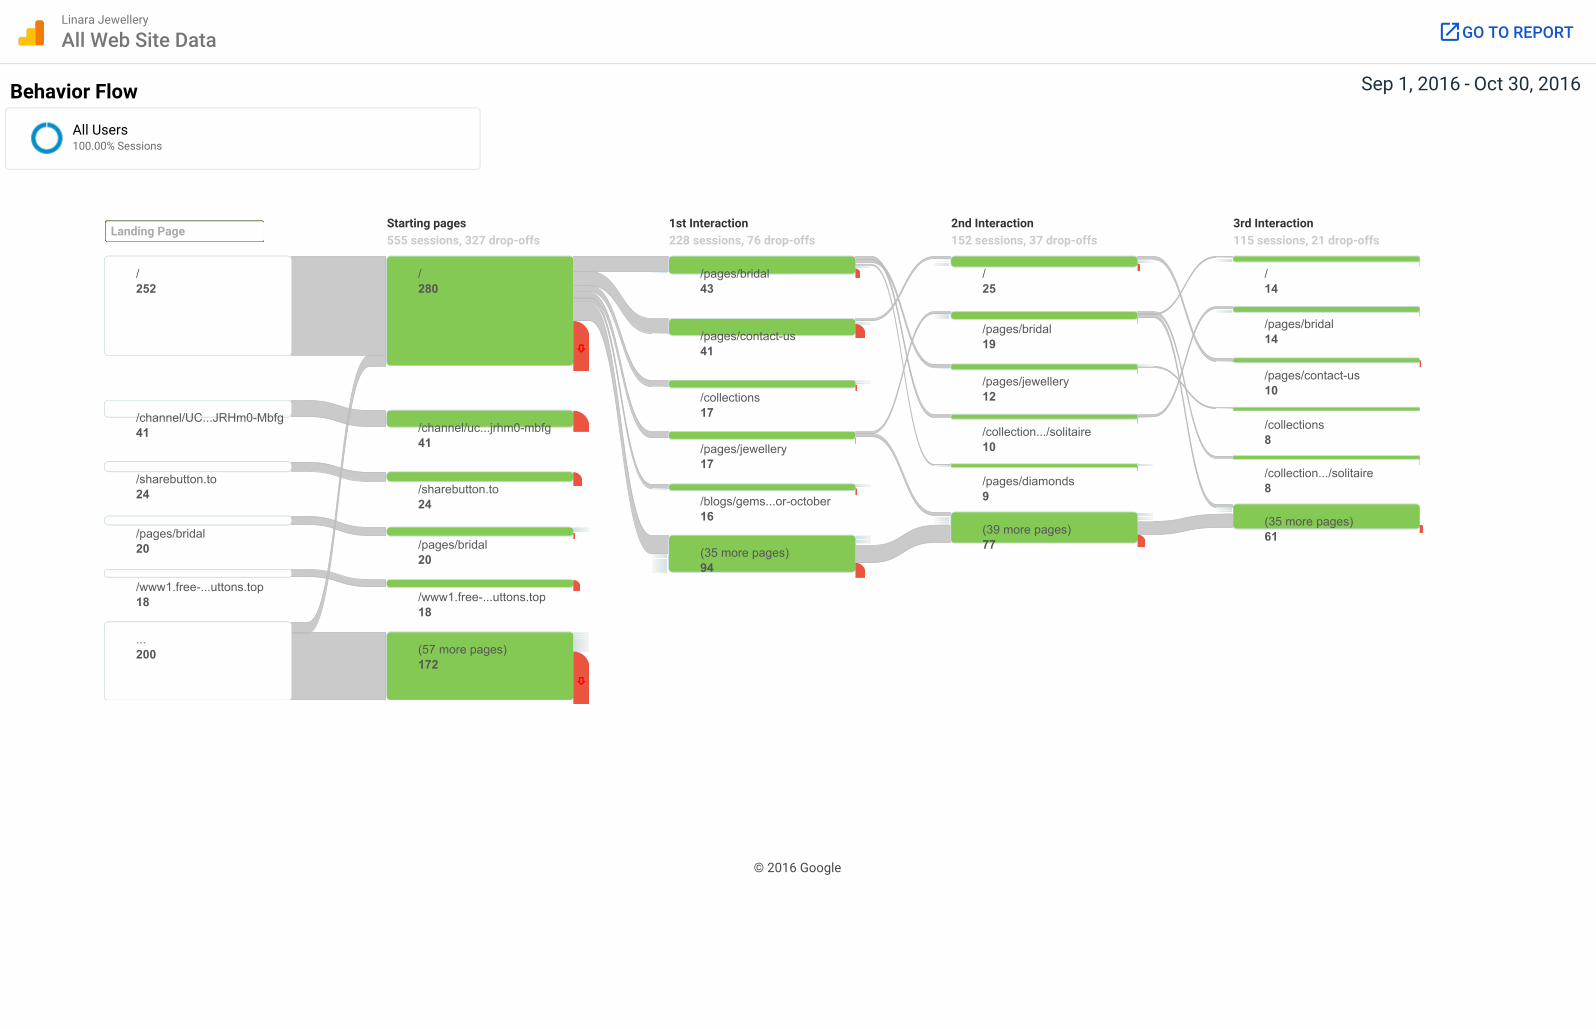
Sep 1, 2016 - Oct 30, 2016Behavior Flow
Landing Page555 sessions, 327 drop-offs 228 sessions, 76 drop-offs 152 sessions, 37 drop-offs 115 sessions, 21 drop-offsStarting pages 1st Interaction 2nd Interaction 3rd Interaction
...200
/channel/UC...JRHm0-Mbfg41
/252
/pages/bridal20
/www1.free-...uttons.top18
/sharebutton.to24
/280
/channel/uc...jrhm0-mbfg41
(57 more pages)172
/pages/bridal20
/www1.free-...uttons.top18
/sharebutton.to24
(35 more pages)94
/collections17
/pages/contact-us41
/blogs/gems...or-october16
/pages/bridal43
/pages/jewellery17
(39 more pages)77
/25
/collection.../solitaire10
/pages/bridal19
/pages/jewellery12
/pages/diamonds9
/14
/pages/contact-us10
(35 more pages)61
/collections8
/collection.../solitaire8
/pages/bridal14
⇩
⇩
© 2016 Google
All Users100.00% Sessions
Linara Jewellery
All Web Site Data GO TO REPORT

19
Behavior: Site Content
The Site Content section contains the following reports about how visitors engage with pages on
your website.
All Pages:
You can use the All Pages report to quickly see your top content along with the average amount of revenue each page generates. This report helps you determine what content performs best on your website.
The All Pages report displays the top pages on your website based on traffic, as well as each page’s pageviews, unique pageviews, average time on page, entrances, bounce rate, % exit and page value.
Page value is the Transaction Revenue + Total Goal Value divided by Unique Pageviews for the page or set of pages.
Landing Pages:
The Landing Pages report lets you see the top pages on your website where visitors enter.
Metrics for landing pages include Acquisition (sessions, % new sessions and new users), Behavior (bounce rate, pages per session and average session duration) and Conversions based on your website goals.
With this data you can determine which pages on your website are most likely to convert visitors into leads or sales.
Exit Pages:
The Exit Pages report shows the last pages people visit before exiting your website. These are the pages you want to look at to see what you can do to keep visitors on your website longer.
The best way to keep visitors on your site is to add more links to other pages on your website.
And be sure the listed exit pages have clear subscription options so visitors can receive emails or
easily follow your business on social media.
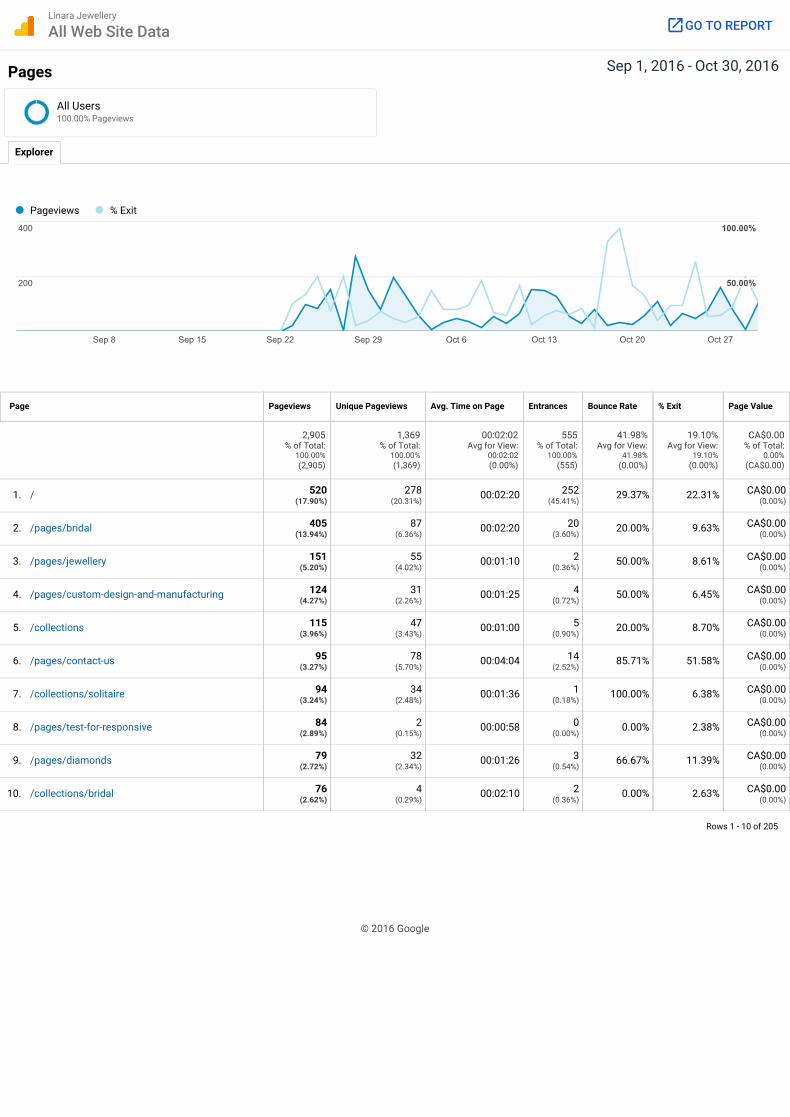
Sep 1, 2016 - Oct 30, 2016Pages
Page
Rows 1 - 10 of 205
Explorer
Pageviews Unique Pageviews Avg. Time on Page Entrances Bounce Rate % Exit Page Value
2,905% of Total:
100.00%(2,905)
1,369% of Total:
100.00%(1,369)
00:02:02Avg for View:
00:02:02(0.00%)
555% of Total:
100.00%(555)
41.98%Avg for View:
41.98%(0.00%)
19.10%Avg for View:
19.10%(0.00%)
CA$0.00% of Total:
0.00%(CA$0.00)
1. 520(17.90%)
278(20.31%)
00:02:20 252(45.41%)
29.37% 22.31% CA$0.00(0.00%)
2. 405(13.94%)
87(6.36%)
00:02:20 20(3.60%)
20.00% 9.63% CA$0.00(0.00%)
3. 151(5.20%)
55(4.02%)
00:01:10 2(0.36%)
50.00% 8.61% CA$0.00(0.00%)
4. 124(4.27%)
31(2.26%)
00:01:25 4(0.72%)
50.00% 6.45% CA$0.00(0.00%)
5. 115(3.96%)
47(3.43%)
00:01:00 5(0.90%)
20.00% 8.70% CA$0.00(0.00%)
6. 95(3.27%)
78(5.70%)
00:04:04 14(2.52%)
85.71% 51.58% CA$0.00(0.00%)
7. 94(3.24%)
34(2.48%)
00:01:36 1(0.18%)
100.00% 6.38% CA$0.00(0.00%)
8. 84(2.89%)
2(0.15%)
00:00:58 0(0.00%)
0.00% 2.38% CA$0.00(0.00%)
9. 79(2.72%)
32(2.34%)
00:01:26 3(0.54%)
66.67% 11.39% CA$0.00(0.00%)
10. 76(2.62%)
4(0.29%)
00:02:10 2(0.36%)
0.00% 2.63% CA$0.00(0.00%)
Pageviews % Exit
Sep 8 Sep 15 Sep 22 Sep 29 Oct 6 Oct 13 Oct 20 Oct 27
200200200
400400400
50.00%50.00%50.00%
100.00%100.00%100.00%
/
/pages/bridal
/pages/jewellery
/pages/custom-design-and-manufacturing
/collections
/pages/contact-us
/collections/solitaire
/pages/test-for-responsive
/pages/diamonds
/collections/bridal
© 2016 Google
All Users100.00% Pageviews
Linara Jewellery
All Web Site Data GO TO REPORT

Sep 1, 2016 - Oct 30, 2016Landing Pages
Landing Page
Conversions
Rows 1 - 10 of 83
Explorer
Summary
Acquisition Behavior
Sessions % NewSessions
NewUsers
BounceRate
Pages /Session
Avg. SessionDuration Transactions Revenue Ecommerce
Conversion Rate
555% of Total:
100.00%(555)
45.23%Avg for View:
45.05%(0.40%)
251% of
Total:100.40%
(250)
41.98%Avg for
View:41.98%
(0.00%)
5.23Avg for View:
5.23(0.00%)
00:08:37Avg for View:
00:08:37(0.00%)
0% of Total:
0.00%(0)
CA$0.00% of
Total:0.00%
(CA$0.00)
0.00%Avg for View:
0.00%(0.00%)
1. 252(45.41%)
35.71% 90(35.86%)
29.37% 5.65 00:09:16 0(0.00%)
CA$0.00(0.00%)
0.00%
2. 41(7.39%)
21.95% 9(3.59%)
78.05% 1.32 00:01:57 0(0.00%)
CA$0.00(0.00%)
0.00%
3. 24(4.32%)
100.00% 24(9.56%)
8.33% 2.79 00:00:00 0(0.00%)
CA$0.00(0.00%)
0.00%
4. 20(3.60%)
15.00% 3(1.20%)
20.00% 12.40 00:29:15 0(0.00%)
CA$0.00(0.00%)
0.00%
5. 18(3.24%)
100.00% 18(7.17%)
0.00% 3.00 00:00:00 0(0.00%)
CA$0.00(0.00%)
0.00%
6. 14(2.52%)
57.14% 8(3.19%)
85.71% 1.50 00:03:54 0(0.00%)
CA$0.00(0.00%)
0.00%
7. 11(1.98%)
45.45% 5(1.99%)
72.73% 2.27 00:03:51 0(0.00%)
CA$0.00(0.00%)
0.00%
8. 11(1.98%)
72.73% 8(3.19%)
63.64% 1.64 00:01:42 0(0.00%)
CA$0.00(0.00%)
0.00%
9. 11(1.98%)
63.64% 7(2.79%)
81.82% 1.18 00:01:16 0(0.00%)
CA$0.00(0.00%)
0.00%
10. 8(1.44%)
12.50% 1(0.40%)
37.50% 2.50 00:06:12 0(0.00%)
CA$0.00(0.00%)
0.00%
Sessions Bounce Rate
Sep 8 Sep 15 Sep 22 Sep 29 Oct 6 Oct 13 Oct 20 Oct 27
252525
505050
50.00%50.00%50.00%
100.00%100.00%100.00%
eCommerce
/
/channel/UCNBe8rdQPhOKqJRHm0-Mbfg
/sharebutton.to
/pages/bridal
/www1.free-share-buttons.top
/pages/contact-us
/collections/collections
/collections/two-stone-rings
/pages/diamond-widget
/blogs/gemstone-of-the-month-opals-for-october
© 2016 Google
All Users100.00% Entrances
Linara Jewellery
All Web Site Data GO TO REPORT
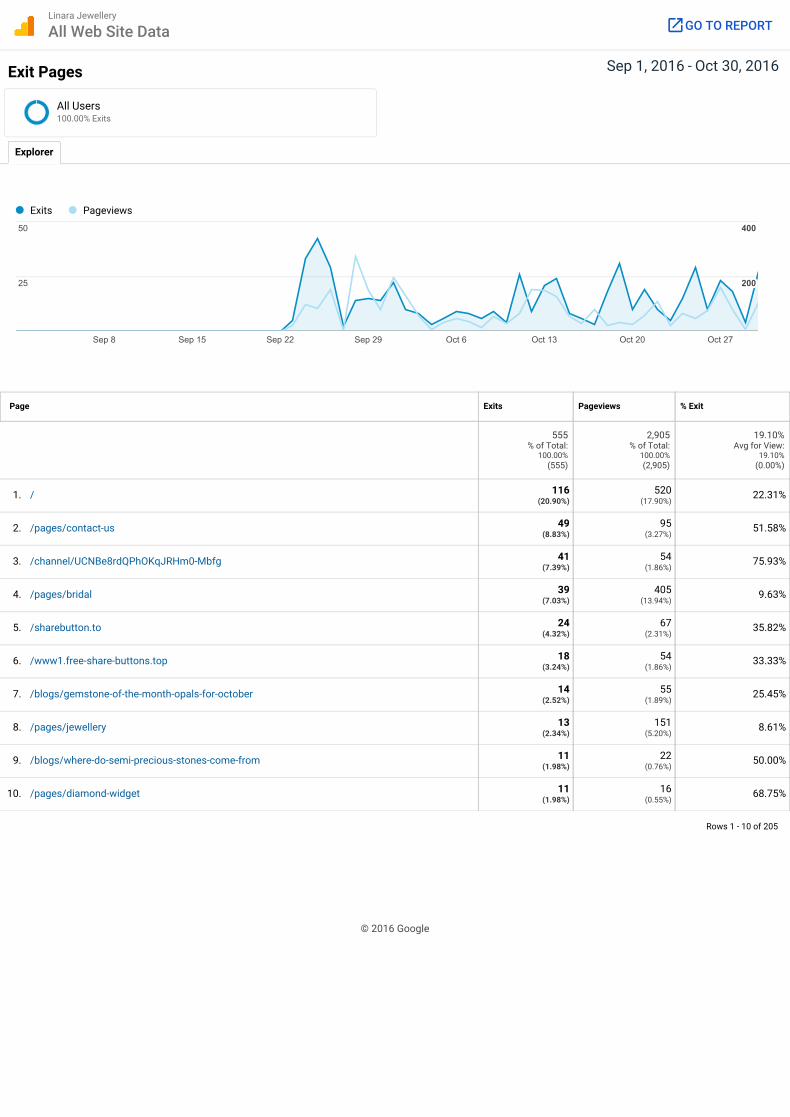
Sep 1, 2016 - Oct 30, 2016Exit Pages
Page
Rows 1 - 10 of 205
Explorer
Exits Pageviews % Exit
555% of Total:
100.00%(555)
2,905% of Total:
100.00%(2,905)
19.10%Avg for View:
19.10%(0.00%)
1. 116(20.90%)
520(17.90%)
22.31%
2. 49(8.83%)
95(3.27%)
51.58%
3. 41(7.39%)
54(1.86%)
75.93%
4. 39(7.03%)
405(13.94%)
9.63%
5. 24(4.32%)
67(2.31%)
35.82%
6. 18(3.24%)
54(1.86%)
33.33%
7. 14(2.52%)
55(1.89%)
25.45%
8. 13(2.34%)
151(5.20%)
8.61%
9. 11(1.98%)
22(0.76%)
50.00%
10. 11(1.98%)
16(0.55%)
68.75%
Exits Pageviews
Sep 8 Sep 15 Sep 22 Sep 29 Oct 6 Oct 13 Oct 20 Oct 27
252525
505050
200200200
400400400
/
/pages/contact-us
/channel/UCNBe8rdQPhOKqJRHm0-Mbfg
/pages/bridal
/sharebutton.to
/www1.free-share-buttons.top
/blogs/gemstone-of-the-month-opals-for-october
/pages/jewellery
/blogs/where-do-semi-precious-stones-come-from
/pages/diamond-widget
© 2016 Google
All Users100.00% Exits
Linara Jewellery
All Web Site Data GO TO REPORT
Related Documents