Methods Goal programming synthetic indicators: An application for sustainable tourism in Andalusian coastal counties Francisco J. Blancas a, ⁎, Rafael Caballero b , Mercedes González b , Macarena Lozano-Oyola a , Fátima Pérez b a Department of Economics, Quantitative Methods and Economic History, Pablo de Olavide University, Carretera de Utrera Km 1 41013, Seville, Spain b Department of Applied Economics (Mathematics), Malaga University, Campus El Ejido s/n 29071, Malaga, Spain abstract article info Article history: Received 28 September 2009 Received in revised form 14 April 2010 Accepted 17 June 2010 Keywords: Synthetic indicators Goal programming Sustainable tourism This paper proposes a methodology for obtaining a synthetic indicator to facilitate decision making in practical situations. It is based on goals provided by the users, which will be included in a synthetic indicator by a goal-programming approach. This methodology facilitates interpreting the values of the synthetic indicator, and thus helps in the decision-making process. We not only formulate these indicators, but also analyze their properties and apply them to the analysis of a complex concept, sustainable tourism. We use this methodology to study the case of coastal areas of Andalusia (Spain), attempting to identify the main characteristics of the different elements, their weakness and strengths. © 2010 Elsevier B.V. All rights reserved. 1. Introduction The Spanish coast consists of areas of great ecological, cultural, and economic value, and are thus are highly attractive. Nevertheless, in recent decades, the human impact on these areas has been striking. The enormous concentration of people (approximately 40% of the Spanish population; Spanish Ministry of Environment, 2007), massive influx of tourists, and associated economic activities in this area have led to the rapid degradation of ecosystems and natural habitats. Thus, Spanish coasts require new policies to prevent their loading capacity from being exceeded and their management models from becoming outdated, and to combat the degradation of natural setting. The coastal management model (Spanish Ministry of Environ- ment, 2007) needs to change to one which allows the administrative and governmental bodies to integrate their policies, and to promote greater cooperation and coordination between the different bodies, as well as encourage greater coherence among sector policies. Further- more, intervention programs should take into account the particular characteristics of each region and incorporate the territorial dimen- sion, such that initiatives and policies are defined in the actual area to which they will be applied. Thus, our study requires a territorial context. Taking into account that tourism is the main economic activity involved in the transformation of the coastal areas, this study focus on the coasts of Andalusia. This region is one of the main tourist desti- nations in Spain, at the both the national (17.8% of visits) and inter- national levels (14.6% of visits) (Spanish Institute of Tourism Studies, 2008). Tourism is therefore a well-established activity and of great importance to the economy of the region, accounting for approxi- mately 11% of the Andalusian GDP (Spanish Ministry of Tourism, Trade and Sports, 2007). However, as in the rest of Spain, the spatial distribution of tourism activity is very uneven, and this has important consequences due to the intensive use of resources and deterioration of the environment. For example, the coastal tourism areas, which account for 7.14% of the entire Andalusian territory, host 37.4% of the tourism demand in the region. The regional government has been aware of the relevance of this activity and, in the light of the changes that are taking place within the tourism sector, developed a program from the mid-1990s onward to define a new tourism model. The aim of the new program is to mitigate the effects of the traditional tourism model by increasing the quality and diversity of tourism supply and the competitiveness of destinations in Andalusia, as well as to improve the sustainability of tourism. Despite great efforts, no significant changes have taken place in the production and consumption patterns that were typical of the traditional tourism model (European Commission, 2003, 2007). In practice, local agents do not have enough information or incentives to implement more sustainable practices in the sector. Given this situation, local agents need to be more involved in designing and developing the steps required to implement the new model. This requires improving local agents' knowledge of the sustainability of tourism activities on the coast, such that they can define a compre- hensive strategy that takes into account the needs and limitations of each destination. Ecological Economics 69 (2010) 2158–2172 ⁎ Corresponding author. Tel.: + 34 954349279; fax: + 34 954349339. E-mail addresses: [email protected] (F.J. Blancas), [email protected] (R. Caballero), [email protected] (M. González), [email protected] (M. Lozano-Oyola), [email protected] (F. Pérez). 0921-8009/$ – see front matter © 2010 Elsevier B.V. All rights reserved. doi:10.1016/j.ecolecon.2010.06.016 Contents lists available at ScienceDirect Ecological Economics journal homepage: www.elsevier.com/locate/ecolecon

Welcome message from author
This document is posted to help you gain knowledge. Please leave a comment to let me know what you think about it! Share it to your friends and learn new things together.
Transcript
Ecological Economics 69 (2010) 2158–2172
Contents lists available at ScienceDirect
Ecological Economics
j ourna l homepage: www.e lsev ie r.com/ locate /eco lecon
Methods
Goal programming synthetic indicators: An application for sustainable tourism inAndalusian coastal counties
Francisco J. Blancas a,⁎, Rafael Caballero b, Mercedes González b, Macarena Lozano-Oyola a, Fátima Pérez b
a Department of Economics, Quantitative Methods and Economic History, Pablo de Olavide University, Carretera de Utrera Km 1 41013, Seville, Spainb Department of Applied Economics (Mathematics), Malaga University, Campus El Ejido s/n 29071, Malaga, Spain
⁎ Corresponding author. Tel.: +34 954349279; fax: +E-mail addresses: [email protected] (F.J. Blancas), r_ca
[email protected] (M. González), [email protected] ([email protected] (F. Pérez).
0921-8009/$ – see front matter © 2010 Elsevier B.V. Adoi:10.1016/j.ecolecon.2010.06.016
a b s t r a c t
a r t i c l e i n f oArticle history:Received 28 September 2009Received in revised form 14 April 2010Accepted 17 June 2010
Keywords:Synthetic indicatorsGoal programmingSustainable tourism
This paper proposes a methodology for obtaining a synthetic indicator to facilitate decision making inpractical situations. It is based on goals provided by the users, which will be included in a synthetic indicatorby a goal-programming approach. This methodology facilitates interpreting the values of the syntheticindicator, and thus helps in the decision-making process. We not only formulate these indicators, but alsoanalyze their properties and apply them to the analysis of a complex concept, sustainable tourism. We usethis methodology to study the case of coastal areas of Andalusia (Spain), attempting to identify the maincharacteristics of the different elements, their weakness and strengths.
34 [email protected] (R. Caballero),. Lozano-Oyola),
ll rights reserved.
© 2010 Elsevier B.V. All rights reserved.
1. Introduction
The Spanish coast consists of areas of great ecological, cultural, andeconomic value, and are thus are highly attractive. Nevertheless, inrecent decades, the human impact on these areas has been striking.The enormous concentration of people (approximately 40% of theSpanish population; Spanish Ministry of Environment, 2007), massiveinflux of tourists, and associated economic activities in this area haveled to the rapid degradation of ecosystems and natural habitats. Thus,Spanish coasts require new policies to prevent their loading capacityfrom being exceeded and their management models from becomingoutdated, and to combat the degradation of natural setting.
The coastal management model (Spanish Ministry of Environ-ment, 2007) needs to change to one which allows the administrativeand governmental bodies to integrate their policies, and to promotegreater cooperation and coordination between the different bodies, aswell as encourage greater coherence among sector policies. Further-more, intervention programs should take into account the particularcharacteristics of each region and incorporate the territorial dimen-sion, such that initiatives and policies are defined in the actual areato which they will be applied. Thus, our study requires a territorialcontext.
Taking into account that tourism is the main economic activityinvolved in the transformation of the coastal areas, this study focus onthe coasts of Andalusia. This region is one of the main tourist desti-
nations in Spain, at the both the national (17.8% of visits) and inter-national levels (14.6% of visits) (Spanish Institute of Tourism Studies,2008). Tourism is therefore a well-established activity and of greatimportance to the economy of the region, accounting for approxi-mately 11% of the Andalusian GDP (Spanish Ministry of Tourism,Trade and Sports, 2007). However, as in the rest of Spain, the spatialdistribution of tourism activity is very uneven, and this has importantconsequences due to the intensive use of resources and deteriorationof the environment. For example, the coastal tourism areas, whichaccount for 7.14% of the entire Andalusian territory, host 37.4% of thetourism demand in the region.
The regional government has been aware of the relevance of thisactivity and, in the light of the changes that are taking placewithin thetourism sector, developed a program from the mid-1990s onward todefine a new tourism model. The aim of the new program is tomitigate the effects of the traditional tourismmodel by increasing thequality and diversity of tourism supply and the competitiveness ofdestinations in Andalusia, as well as to improve the sustainability oftourism.
Despite great efforts, no significant changes have taken place in theproduction and consumption patterns that were typical of thetraditional tourism model (European Commission, 2003, 2007). Inpractice, local agents do not have enough information or incentives toimplement more sustainable practices in the sector. Given thissituation, local agents need to be more involved in designing anddeveloping the steps required to implement the new model. Thisrequires improving local agents' knowledge of the sustainability oftourism activities on the coast, such that they can define a compre-hensive strategy that takes into account the needs and limitations ofeach destination.

2159F.J. Blancas et al. / Ecological Economics 69 (2010) 2158–2172
To fulfil this task, local agents need suitable tools to measure thelevel of sustainability of tourism in their coastal space. Defining thiskind of tool has become one the main subjects in the literature(Mitchell, 1996). In the tourism sector, measurement tools have beendefined by adapting existing tools to the evaluation of a globalsustainable development objective (Hunter and Shaw, 2007). In thisregard, there are two major frameworks (Organization for EconomicCo-operation and Development, 2000): the accounting frameworkand the analytical framework.
The accounting framework uses the set of accounts based on theSystem of National Accounts of the United Nations and the mainaggregates obtained from them. The most significant accounting toolin the tourism sector is the Tourism Satellite Account (Patterson andMc Donald, 2004) and regarding aggregates, the Ecological Footprintof Tourism (Hunter, 2002; Patterson and Mc Donald, 2004; Hunterand Shaw, 2007). Despite the advantages, this framework is notsuitable to define a tool that meets the needs of local tourismmanagers. By definition, the accounting tools included are biasedtoward the environmental or economic dimension of sustainabledevelopment, and thus do not provide a multidimensional evaluationof the issue. Similarly, the lack of consensus regarding how thecomponents are estimated hinders the interterritorial analysis ofsustainability, which is essential to formulating and implementingmore sustainable practices. Finally, on the one hand, the theoreticalcomplexity of these tools makes them hard to understand by non-expert agents, and on the other hand, there is a lack of statisticaldisaggregated data to perform the local quantification required.
Thus, localmanagers have to use ananalytical framework to quantifythe level of tourism sustainability in the present context. Following thisframework, this paper proposes the definition of a systemof sustainabletourism indicators as ameasurement tool. They are defined as “the set ofmeasures that provide the necessary information to better understandthe links and the impact of tourism on the cultural and natural setting inwhich this takes place and on which it is strongly dependent” (WorldTourism Organization, 1995). The analysis of international experienceon this issue (United Nations, 2001; Aguirre and Requero, 2002; BancoMundial, 2002), establishes that the definition of an analytical tool ofmeasurement of sustainability consists in two basic steps: disaggregat-ing the sustainability goal into its conceptual dimensions (social,economic and environmental), identifying the factors that need to beevaluated in each one and, subsequently, to identify those indicatorsthat allow the assessment of each factor, which lead to the creation of abattery of indicators that make up the system.
A tool defined in this way is very useful in our context. Forexample, it provides a multidimensional measure of sustainabilitythat matches the territorial level of the analysis and it is made up ofitems which are easy to understand by the end user. If transparencycan be guaranteed during data collection and processing, theinfluence of the decisions taken during this process can be takeninto account when interpreting results. In addition, this measure canbe used to assess the sustainability objectives at disaggregated gov-ernmental levels, interterritorial comparative analyses can be per-formed and the evolution of the prevailing situation assessed.
Despite the advantages, this framework to measure has somelimitations. For example, the disaggregated character of the system isa disadvantage. Each indicator separately shows the situation for eachsustainability factor, and thus changes in their values reflect thechanges in each dimension, but the changes do not always occur in thesame direction or at the same time. However, it is sometimesnecessary to have a measure of global sustainability that can indicatethe overall state of all the factors without having to analyze each oneseparately. In order to overcome this limitation, data aggregationshave to be created and this leads to synthetic measures to calculatethe target sustainability from the data provided by the system.
Thus, two methodological approaches are used to define analyticalsustainability measures (Nardo et al., 2005a; Sharpe, 2004). On the
one hand, there is the non-aggregative approach, which includesstudies whose final aim is to develop an indicator system as ameasurement tool. On the other hand, there is the aggregativeapproach, which proposes the construction of a global syntheticindicator based on a set of initial indicators as an assessment tool.
The first approach measures the sustainability concept withoutaggregating the information provided by the battery of indicators,thus avoiding potential problems arising from the analysts' subjectivedecisions made during the aggregation process. However, in practice,it is necessary to have a measure that reflects the joint statementdelivered by each unit evaluated without the need to analyze theinitial indicators separately. The aggregative approach attempts tosolve this issue by constructing a synthetic measurement from theinitial system. This index is obtained as a mathematical combination(or aggregation) of the indicators that represent the different com-ponents of the subject under analysis (Saisana and Tarantola, 2002;Nardo et al., 2005b). Nevertheless, the formalization of the combina-tion that generates the synthetic indicators not only reflects thecharacteristics of the concept being assessed, but implicitly reflectsthe choices made by the analyst.
However, unlike the non-aggregative approach, the aggregativeapproach assumes that the subjectivity involved in constructing asynthetic indicator is a part of the process. Thus, increasedtransparency must be ensured in the construction of the indicator tofacilitate the interpretation of the results.
Despite being criticised on the basis of this subjectivity, syntheticindicators have been widely used as tools in decision-making. Severalreasons justify the practical use of these indicators. First, syntheticindicators are simple and suitable tools for carrying out the kind ofcomparative analysis characteristic of planning procedures. Second,these indicators are particularly useful in illustrating and evaluatingcomplex objectives because they facilitate the work of the agentsinvolved. Third, these synthetic measures enable the analysis oftrends, by establishing monitoring and control procedures. Inaddition, they facilitate benchmarking issues. Finally, users can easilyunderstand the information provided by these synthetic indicators.However, the latter aspect should only provide a means for capturingattention and focusing the discussion on decision-making duringplanning processes. Obtaining synthetic indicators should never be anend itself; rather, it should be a tool to facilitate decision making.
From the methodological point of view, synthetic indicators havebeen obtained using alternative construction techniques. For exam-ple, equal weighting of the system indicators has been used for theindicator for sustainable development, which was developed by theInstitute for Sustainable Development of Italy (Ronchi et al., 2002).Other indicators have been obtained that are used in participatorymethods by an expert panel (Tsaur et al., 2006) and in the method ofpublic opinion (Cottrell et al., 2004). We also emphasize, in theaggregative approach, the use of statistical methods such as principalcomponent analysis (Mcintyre et al., 2002; Liou et al., 2004;Premachandra, 2001; Chen et al., 2004) and multiple factor analysis(García and Abascal, 2004; Sabatini, 2005). There are also methodsbased on distances, such as the synthetic indicator of distance, DP2,designed to measure levels of social welfare at a given time (Pena,1978). These can be applied to other phenomena, such as sustain-ability measures, which are techniques based on the application ofdata envelopment analysis (Cherchye et al., 2007; Murias et al., 2007).
However, recent research indicates that multicriteria assessmenttechniques are the more suited to evaluating sustainability, given itsmultidimensional nature (Martínez-Alier et al., 1998; Munda, 2005;Munda and Nardo, 2009; Shmelev and Rodríguez-Labajos, 2009).Several multicriteria techniques have been used to construct syntheticindicators. Within these, we highlight multi-attribute utility theory(Barrera-Roldán and Saldívar-Valdés, 2002; Hajkowicz, 2006), theanalytic hierarchy process (AHP) (Narayanan et al., 2007; Singh et al.,2007; Ramzan et al., 2008), outranking methods, such as Promethee

2160 F.J. Blancas et al. / Ecological Economics 69 (2010) 2158–2172
(Filipic et al., 1998; Simon et al., 2004; González-Laxe and Castillo,2007), and the use of distance from a reference point (Diaz-Balteiroand Romero, 2004a,b; Munda, 2008).
It has been demonstrated that when the aggregation methodspreviously described are used on a quantitative indicators system, theassigned weights show replacement rates between the indicators(Munda and Nardo, 2003), which forces it to take into account thecompensatory character of the synthetic indicator obtained. The finalindicator shows the net result that takes into account the compensa-tions between all the indicators present in the system.
In this context, the search for new procedures to obtain syntheticindicators that do not present a compensatory character has beenproposed (Podinovskii, 1994). These procedures are especially usefulwhen no compensation can exist between indicators. In this regard, itis worth mentioning the non-compensatory multicriteria aggregationprocedure developed byMunda and Nardo (Munda, 2005;Munda andNardo, 2009). If the weights representing the relative importance ofeach indicator are known, this procedure makes it possible to obtain afull ranking of the units analyzed from the results obtained bycomparing the units by pairs and taking into account the wholeindicator set.
Regardless of the aggregation procedure chosen, when formulat-ing a synthetic indicator to evaluate sustainability objectives, it isnecessary to set the commensurability or incommensurability of theindicators of the starting system (Martínez-Alier et al., 1998). In thissense, following the line of other studies (Shmelev and Rodríguez-Labajos, 2009), we adopt the incommensurability of the values as theassessment principle, so that we assume the non-existence of a unit ofcommon measure (whether in monetary or physical terms) withinthe different sustainability aspects under evaluation. Thus, we assumethat the synthetic indicator used to evaluate tourism sustainabilityshould permit comparisons between destinations, taking into accountthe unavoidable conflicts between the initial indicators, and practicaljudgments used to rank these destinations. In this way, we assumeone of the main principles in Ecological Economics: weak compara-bility (O'Neill, 1993; Martínez-Alier et al., 1998).
In this context, we decided to follow an ecological economicsapproach that assumes incommensurability values, uses the weakcomparability concept, and applies a multicriteria framework toevaluate tourism sustainability. Specifically, this paper proposes amethodology for obtaining synthetic indicators that is based on goalprogramming, and that mainly draws on the work of Diaz-Balteiroand Romero (2004b). Synthetic measures are obtained using theinformation provided by the deviation variables associated with thegoals of each indicator of the initial system. Thus, using practical valuejudgments to define the relative importance of each indicator and theaspiration levels, the suggested procedure evaluates the sustainabilityof each destination by measuring the fulfilment level of the goalsestablished and is expressed in relative terms as a percentage. Thisnovel synthetic measure is called the Goal Programming SyntheticIndicator (GPSI).
Furthermore, this procedure enables us to define differentsynthetic indicators that become measures of strong or weak sustain-ability depending on the degree of compensation allowed betweenthe initial indicators.
The GPSI methodology has various advantages over otherstatistical methods. The first advantage is that it requires no previousnormalizationmethod. Second, themethodology can be appliedwhenthe number of indicators is greater than the number of units of theinitial system, making it useful in practice. Third, this new method-ology builds the final synthetic indicator using all the indicators of theinitial system and thus there is no loss of information.
We develop the methodology in Section 2. In Section 3, we analysewhether the proposed indicator verifies the general properties of agood indicator, according to state-of-the-art research. This analysisprovides greater transparency regarding the process of obtaining the
indicator and constitutes a tool to improve the interpretation of theresults obtained. In addition, this ensures that each indicator is easierto compare to other measures obtained for the evaluation of the sameunderlying concept (Zheng, 1993).
Section 4 presents an application of the synthetic indicator to a realand complex problem: the analysis of sustainable tourism in thecoastal areas of Andalusia, using a set of 88 indicators. Following theguidelines of the WTO (World Tourism Organization, 2004), we notonly include general key indicators, but also specific indicators for thiscoastal area. We assess social, economic and environmental aspects,which are dimensions that reflect the extent and richness involved inthe term sustainable tourism (Dachary and Arnáiz, 2002; Fullana andAyuso, 2002). This analysis shows the wide applicability of theproposed indicator and the ease of interpreting the results obtained,even when applied to complex concepts or used to study severaldimensions. Finally, we present our conclusions.
2. Formulation of the GPSI indicators
We consider an initial system of m indicators to assess a set of nunits. We distinguish between positive, negative and neutralindicators, depending on the improvement direction (“more is better”or “less is better”). The indicator is considered positive when a highervalue represents an improvement in sustainability in the area. Incontrast, the indicator is negative when a higher value representsdeterioration in sustainability. The indicator is neutral when a specificvalue is desired. Thus, we let Iij+ denote the value that represents theith unit in the jth positive indicator, with ja J, where J is the set ofpositive indicators in the system. In the case of negative indicators, welet Iik− denote the value that provides the kth indicator for the ith unitconsidered, with kaK, where K is the set of negative indicatorsincluded in the initial system. In the case of a neutral indicator, we letIih= denote the value that provides the hth indicator for the ith unit,with haH. Therefore, |J|+|K|+|H|=m.
The proposed procedure requires us to identify the improvementdirection of each indicator, but without the need to convert all of theminto the same type, positive or negative. This facilitates theinterpretation and management of the results, as no conversion isrequired.
Once the basic elements to obtain the synthetic indicator aredefined, the synthetic indicator will be based on the concept of goalused in Goal Programming. This methodology is well-known withinthe area of Operations Research, and is characterized by an underlyingprocess of optimization that aims at finding the solution that mostclosely matches the aspiration levels established. Goal Programmingemerged after the publication of a book by Charnes and Cooper(1961). Other studies related to this concept were subsequentlypublished, such as those by Ijiri (1965), Lee (1972) and Ignizio (1976),in which the basis and first developments of this methodology wereformulated. Nevertheless, in this paper we use the underlying conceptof goal rather than the optimizing process. So, in our case, each unit iscompared, for each indicator, to a given predetermined aspirationlevel. This way, the strength or weakness of this unit regarding anindicator is established depending on the comparison of the indicatorvalue with the predetermined aspiration level.
In particular, we must set weights, wj, to state the relativeimportance of each indicator. Finally, the proposed methodologyhas to define an aspiration level for each indicator. uj+ will be used torefer to aspiration levels of the positive indicators, uk− for negativeindicators and uh
= for neutral indicators. These aspiration levelsshould be provided by an expert panel.
The interpretation of the aspiration level differs depending on thetype of indicator. In the case of positive indicators, the valueestablishes the minimum level at which a unit is considered toindicate a good situation regarding the aspect evaluated by theindicator. When the indicator is negative, the aspiration level reflects

2161F.J. Blancas et al. / Ecological Economics 69 (2010) 2158–2172
the maximum level until a unit indicates a favourable situationregarding the aspect analyzed. Finally, a unit demonstrates a goodsituation for neutral indicators when the indicator value is equal tothe aspiration level.
In the case under study, given that we assume the basic principle ofincommensurability, the aspiration levels and the weights of theinitial indicators are practical judgments that permit us to establishweak comparisons between tourist destinations.
Given the set of aspiration levels, the value that each unit presentsin each indicator is compared with the aspiration levels, as in goalprogramming. We define a goal for each indicator using deviationvariables denoted by n and p. For each unit, these variables indicatethe difference between the value of an indicator and the corre-sponding aspiration level. For the ith unit, the goals are represented asfollows:
- If the indicator Ij is positive, the goal is formulated as
Iþij + nþij − pþij = uþ
j with nþij ; p
þij ≥ 0 nþ
ij ⋅ pþij = 0
where nij+ is the under-achievement or negative deviation variable
and pij+ is the over-achievement or positive deviation variable
associated with the positive indicator.- If the indicator Ik is negative, the goal is formulated as
I−ik + n−ik − p−ik = u−
k con n−ik ; p
−ik ≥ 0 n−
ik ⋅ p−ik = 0
where nik− is the under-achievement or negative deviation variable
and pik− is the over-achievement or positive deviation variable asso-
ciated with the negative indicator.- If the indicator Ih is neutral, the goal is formulated as
I=ih + n=ih − p=
ih = u=h con n=
ih ; p=ih ≥ 0 n=
ih ⋅ p=ih = 0
where nih= is the under-achievement or negative deviation variable
and pih= is the over-achievement or positive deviation variable
associated with the neutral indicator.
Thus, when we evaluate the situation of a unit, we will beinterested in whether certain deviation variables are null. Thesevariables, identified as unwanted, will be different, n or p, dependingon the improvement direction of each indicator. In the case of positiveindicators, the unwanted variable will be the negative deviationvariable, such that better positioned units will reach the aspirationlevel or a higher value, i.e., a greater value for the positive deviationvariable. In the case of negative indicators, the unwanted variable willbe the positive deviation variable, allowing better positioned units toreach the aspiration level or a lower value, i.e., a higher value for thenegative deviation variable. Finally, in the case of neutral indicators,both deviation variables are unwanted.
At this point, we propose global measures that serve to evaluateeach destination depending on the level of fulfilment of thepredetermined aspiration levels. Quantification of the indicators isbased on the deviation variables associated with the goals set for eachindicator. These measures differ from each other by the degree ofcompensation for the fulfilment and non-fulfilment of the aspirationlevels.
The first, called the Vector Goal Programming Synthetic Indicator(GPSIV), is formed by a vector with two components (GPSI+, GPSI−).Both components are positive and attempt to combine the strengthsand weaknesses of each unit.
The first component (GPSI+) quantifies the strengths displayed byeach unit in the concept evaluated, indicating the degree to which theunit fulfils the aspiration levels set. Its definition is based on theaggregation of deviation variables, for which a higher value shows abetter relative position: the positive deviation variable for positiveindicators (pij+) and the negative deviation variable for negative
indicators (nik−). This aggregation is computed by using the weight ofeach indicator and normalizing the deviation variables with thecorresponding aspiration levels in order to obtain a correct non-dimensional measure.
Thus, the formulation of this component for a unit i is as follows:
GPSIþi = ∑j∈J
wjpþij
uþj
+ ∑k∈K
wkn−ik
u−j
∀i∈f1;2; :::; ng:
The second component enables us to measure the weaknesses ofeach unit relating to the indicator system, quantifying the degree towhich the units do not fulfil the set of aspiration levels. This is similarto the way in which the first component is determined, by adding theunwanted deviation variables for each type of indicator, normalizedand weighted. The formulation of this component for a unit i is asfollows:
GPSI−i = ∑j∈J
wjnþij
uþj
+ ∑k∈K
wkp−ik
u−k
+ ∑h∈H
wh⋅ðn¼ih + p¼ihÞu¼h
∀i∈f1;2; :::;ng:
In this way, the ratios that define the components of the vectorialindicator are a measure of the unfulfilled values registered in the initialindicators, normalized as percentages. Thefirst component of the vectorsynthetic indicator shows its strengths for each unit without taking itsweaknesses into account. The second component quantifies the degreeof weakness shown by each unit without taking into account thestrengths. Neutral indicators are represented only by their weaknesses,due to the fact that their deviation variables only indicate weakness.Thus, the vector synthetic indicator makes it possible to evaluate thesituationof eachunitwhen their strengths andweaknesses are analyzedseparately, without permitting any degree of compensation amongthem. Therefore, the vector indicator is defined as a measure of strongsustainability of a non-compensatory character.
Thus, two units, Ui and Uj, are compared using this vector syntheticindicator as follows:
Ui≻Uj⇔
GPSIþi N GPSIþj and GPSI−i b GPSI−j
GPSIþi N GPSIþj and GPSI−i = GPSI−j
GPSIþi = GPSIþj and GPSI−i b GPSI−j
:
8>><>>:
Given the non-compensatory character of the indicator GPSIV, itdoes not provide a total order on the set of the units. Thus, it mayhappen that two different units are not comparable. Although theinformation provided by the components of this synthetic indicatorseparately would provide a more realistic analysis, it is easier for thefinal user to analyse the units by ranking them all. Thus, we proposetwo synthetic indicators derived from information provided by thevector indicator in order to obtain a ranking of all the units.
The first, called the Restrictive Goal Programming SynthethicIndicator (GPSIR), is designed to define a synthetic measure that, giventhe principle of incommensurability and the conflicts existingbetween the indicators of each dimension, makes it possible for usto obtain a final ranking in terms of strong sustainability. To this end,and using the practical judgments that define the aspiration levels, weestablish a condition that the units have to fulfil to be consideredmoresustainable. This condition is based on the idea of differentiating theunits that fulfil all aspiration levels from the ones which do not. TheGPSIR is defined for a unit i by:
GPSIRi =GPSIþi if GPSI−i = 0
−GPSI−i if GPSI−i ≠0:
(
For units that fulfil all aspiration levels, we take the firstcomponent of the vector indicator (its strength). For units that are
2162 F.J. Blancas et al. / Ecological Economics 69 (2010) 2158–2172
considered weak in some aspect, we take the value of the secondcomponent, preceded by a negative sign to differentiate it. Thus, weobtain a total order on the set of the units. As with the previousindicator, the GPSIR does not allow for compensation betweenstrengths and weaknesses.
We can now consider how to achieve such compensation. Thisleads to a second global synthetic measure, called the Net GoalProgramming Synthetic Indicator (GPSIN). This indicator aims atassessing each unit, aggregating its strengths and weaknesses. Thus,the indicator for unit i is determined by the difference between thetwo components of the vector (GPSIV). These components areweighted to consider situations where the strengths are not giventhe same importance as weaknesses. That is:
GPSINi = λGPSIþi − γGPSI−i
where λ and γ are relative weights of strengths and weaknesses,respectively.
In this way, the difference between the components of the vectorindicator makes it possible to define a compensatory measure ofsustainability. The strengths in the indicators, which are the strengthsof each unit, can compensate for the weaknesses in other indicators.Thus, the synthetic indicator shows the net result obtained by takinginto account the compensations between the system's indicators and,therefore, it is measure of weak sustainability.
Thus, we can obtain a total ranking of units taking all indicators ofthe system into account. For this reason, and to maximize theinformation provided by the indicators system, we use the indicatorGPSIN to implement the empirical analysis.
None of the proposed methodologies have any internal mecha-nism to eliminate the problem of counting information twice. To avoidthis drawback, we should analyse the database, paying specialattention to the correlations between indicators. In this way, we canobtain information on the relationships between indicators andexisting redundant information, so that we can decide in advance ifwe want to consider the entire initial database or only part of it.
We complete the definition of the indicator GPSIN by providing aguideline for interpreting the obtained values of the syntheticindicator for each unit. In this case, the interpretation procedureproposed relies on the following steps.
First, we obtain a total ranking of the units analyzed in terms of thevalue of the indicator. Second, we analyse the situation of the unitsthat were in better and worse positions in this ranking, so that we cancharacterize situations that are associated with a better or worsemeasures of the concept evaluated, respectively. Thus, we have tostudy the indicators that most influence the position reached by eachunit and, simultaneously, the values of the deviation variables thatdefine the goals of the system indicators.
The positive values of the unwanted deviation variables allow us tostudy the indicators that have not fulfilled the aspiration level set, andtheir quantities. We can thus determine not only the weaknesses ofthe analyzed units, but formulate a strategy to improve the situation.
Moreover, the values of the over-achievement deviation variablesof the positive indicators and the under-achievement deviationvariables of the negative indicators allow us to analyze, for each unit,the aspects for which that unit has a better performance. In this sense,these values quantify the strengths of each unit and serve as a guide toformulate the action needed to maintain the position reached.
Analysing the values of these deviation variables also enables theidentification of the unit that acts as a benchmark, or the area inwhichthis aspect has a better evaluation. Thus, the benchmark can serve as aguide for formulating the policies needed to improve the situation ofthe remaining units.
Finally, we propose a stability analysis of the position reached byeach unit when the aspiration levels for each indicator are changed. Todo this, we multiply the aspiration levels by a parameter for the
indicators that show the same improvement directions. We denote αas the parameter for the positive indicators, such that the newaspiration level is given by α uj
+, and let β represent the parameter forthe negative indicators, for which the aspiration level is β uk
−.A higher value of the parameter corresponds to a greater
aspiration level required for the units tested. Thus, we establish arange of variation for these parameters by setting the minimum (α−)and maximum (α+) values of the parameter α, i.e., α∈ [α−, α+].Similarly, we can have an interval for the parameter β. However, insome situations, this parameter can be given by β = 1
α, due to thereciprocal meaning of these two parameters.
Next, we divide the interval into ten equal parts, obtaining thevalue of the aspiration levels for the eleven values derived from thisprocess. For each one, we obtain the values of the indicator for theunits considered, as well as the ranking of units. Studying variations inthe position reached by each unit allows us to identify the units withmore stability, regardless of the value of α and β, and we can alsoidentify the most unstable units.
We conclude that the GPSI indicator methodology has severaladvantages over other indicators obtained by statistical methods.First, it is an aggregation procedure that requires no previousnormalization method and expresses the values of the syntheticindicator obtained in a non-dimensional scale defined on the basis ofthe value of the aspiration levels. Second, this methodology can beapplied to cases in which the number of indicators exceeds thenumber of units of the initial system; it is, therefore, a much morepractical methodology. Third, this methodology is based on goalprogramming and can be applied to an aggregation process in severaldimensions, allowing us to obtain the final synthetic indicator usingthe entire initial indicators system. Thus, we do not have to give uppart of the information system to facilitate the interpretation of theresults.
Nevertheless, obtaining the GPSI indicator requires makingadditional decisions, such as setting weights and aspiration levelsfor each indicator expressed in terms of the units of the originalindicators. The inherent ease of application and interpretation ofresults compensate for the difficulty involved in having to takeadditional decisions. In the next section, we analyse how theproperties that characterize a good synthetic indicator are verified.
3. Properties of the GPSI indicators
In this section, we study the properties verified by the GPSIindicators. We conduct this analysis using the properties that must beverified in any good synthetic indicator (Zheng, 1993; Ivanova et al.,1999).Whatever the different definitions of the GPSI indicator, they allverify the same properties, but here we only analyse them for theGPSIN synthetic indicator to shorten the discussion.
As mentioned, analysing the properties of the synthetic indicatormakes the process of obtaining themmore transparent and is a usefultool to interpret the results. In addition, studying these propertiesfacilitates comparisons with other indicators that evaluate the sameunderlying concept (Zheng, 1993).
The properties of the mathematical function that defines theproposed synthetic indicator are as follows:
- Existence and determination. The GPSI indicator is formulatedusing a well-defined mathematical function, such that it canalways be evaluated and does not involve ambiguity. Only in thecase that some aspiration level is zero, would it require anotherkind of normalization (Diaz-Balteiro and Romero, 2004b).
- Monotony. This property requires that, under ceteris paribusassumptions, the value of the synthetic indicator must increasewhen an initial indicator is modified positively. Alternatively, thevalue of the synthetic indicator must decrease when the initialindicator values change negatively.
2163F.J. Blancas et al. / Ecological Economics 69 (2010) 2158–2172
To verify the monotony property, we consider that a unit iincreases the value of a positive indicator, such that the new indicatorvalue is Iij⁎≻ Iij. If the new value Iij⁎ fulfils the aspiration level of thisindicator, the change produced increases the over-achievementdeviation variable pij
+, and therefore the GPSIN value is increased. Inthe case that the change of the initial positive indicator value does notfulfil the aspiration level, this change decreases the under-achieve-ment deviation variable that defines the goal, therefore increasing theGPSIN value.
Similarly, it can be demonstrated that when the value of Iijdecreases, the synthetic indicator value for unit i does not improve.The conclusions are the same when values of the negative and neutralinitial indicators are modified. Thus, our synthetic indicator verifiesthe monotony property.
- Unicity. Given the indicator set I1, I2… In of the initial system, thisproperty ensures that the mathematical function that defines thesynthetic indicator must provide only one solution. The GPSIindicator verifies this property, since for each vector valueassociated with each unit analyzed, the expression of our indicatorprovides only one value.
- Invariance. This property implies that the values of the syntheticindicator must not be affected by origin and scale changes made tothe measurement units of initial indicators. To check if theproposed synthetic indicator verifies this property, we carry outthe following linear transformation in the indicator j:
Ij* = a + bIj
where a,baℜ, with b≠0.
When this origin and scale change is made, in the case of the GPSIindicator, it is necessary to check its effects on the ratios betweendeviation variables and aspiration levels, which determine thesynthetic indicator values. Thus, we assume that the transformedindicator j is positive. We also analyse the effects of the origin andscale change separately to facilitate checking this property.
When a scale change is made to the indicator j, the goal associatedwith this indicator is formulated in the following way:
bIij + nþij − pþij = buþ
j
The variable nij+ is equal to 0 for the units that exceed the
aspiration level, and so pij+ fulfils the following expression:
pþij = b Iij − uþj
� �
such that:
pþijbuþ
j=
b Iij−uþj
� �buþ
j=
Iij−uþj
uþj
:
In this way, when a scale change is made, the previous ratio thatdetermines the synthetic indicator values remainsconstant anddoesnotaffect the GPSIN obtained. In the same way, it is easy to check that scalechanges do not modify synthetic indicator values for units that do notexceed aspiration levels. This conclusion can be extrapolated to negativeand neutral indicators. This result guarantees that the value of thesynthetic indicator for each unit does not changewhen initial indicatorsare increased or decreased, because the mathematical function thatdefines the synthetic indicator is homogeneous of degree zero.
However, origin changes to the initial indicator affect the syntheticindicator values. In this case, the goal associated with the initialindicator is formulated as
a + Iij + nþij − pþij = a + uþ
j :
Thus, for example, in the case of the units with an initial indicatorvalue greater than aspiration level, the ratios that determine thesynthetic indicator value do not remain at their initial values:
pþija + uþ
j=
Iij−uþj
a + uþj≠
Iij−uþj
uþj
:
Equally, the units with an initial indicator value smaller than theaspiration level do not remain at the value of the ratio that determinesthe synthetic indicator value. This is also true for negative and neutralindicators of the system.
Summing up, we can affirm that the GPSI indicator partially verifiesthe invariance property given that, although the synthetic indicatorvalues are not affected by changes in the initial indicators, the valuesare modified when an origin change is made to the initial indicators.Nevertheless, this non-fulfilment can be solved using normalizedaspiration levels following the formulation presented by Diaz-Balteiroand Romero (2004b).
- Transitivity. The proposed synthetic indicator verifies this proper-ty because its values are real numbers, so it verifies an order-fulfilling transitivity property.
- Exhaustivity. This property requires that the synthetic indicatormust be able to take advantage of the useful information containedin the initial indicators system. In this context, this refers toinformation that is not false and duplicate and that can beinterpreted through ordinal or cardinal scales. Thus, the verifica-tion of this property implies that the synthetic indicator mustmake correct use of the information in the initial indicators,eliminating duplicates when necessary. The GPSI indicator doesnot have a tool to eliminate duplicate information. Thus, theverification of this property depends on the statistical analysisusing correlation coefficients to identify possible relations be-tween the indicators of the system and the quantity of duplicateinformation. Afterwards, the analyst can eliminate the indicatorsthat provide duplicate information before applying the aggregativeprocedure.
- Symmetry. A synthetic indicator verifies this property if the resultsdo not varywhen the positions of the initial indicator change. That is,symmetry implies that the synthetic indicator values are notinfluencedby the order inwhich the initial indicators are introduced.
In our case, the total sum of the deviation variables that defines theGPSI indicator is independent of the order in which initial indicatorsare considered. Thus, this synthetic indicator verifies the symmetryproperty.
We have demonstrated that the proposed synthetic indicatorsverify almost all of the properties which establish how a goodindicator should work.
4. Sustainability analysis of coastal tourism in Andalusia using theGPSI indicator
Our aim in this section is to construct synthetic indicators toevaluate sustainable tourism in coastal destinations in Andalusia,Spain, by applying the proposed methodology. Given that the conceptevaluated is a complex phenomenon, this empirical analysis showsthat the proposed methodology enhances the users' ability to obtainand interpret the results.
We first clearly define the evaluated concept: sustainable tourism. Tothis end, we use an institutional definition based on the satisfaction ofpresent and future generations, following the guidelines of the WorldTourismOrganization (WTO). Thus,wedefine sustainable tourismas thattourist activity that satisfies the present tourists and host regions whileprotecting and improving future opportunities. Such tourist activityfocuses on resource management in such a way that all economic, social

2164 F.J. Blancas et al. / Ecological Economics 69 (2010) 2158–2172
and aesthetic necessities are satisfied at the same time as respectingcultural integrity, essential ecologic processes, biological diversity and thelife support system (World Tourism Organization, 1993). In order toobtain a more operational definition, we split this concept into threecomponents or dimensions: social, economic and environmental(Dachary and Arnáiz, 2002; Fullana and Ayuso, 2002; Blackstock et al.,2006; Mauerhofer, 2008), identifying, in each dimension, the basicaspects which must be improved to achieve sustainability.
We analyse the 14 coastal counties of Andalusia, which receive37.56% of the tourist demand in the regionwhile constituting only 7.14%of the area. These counties are shown on the following map (Map 1).
We use the WTO guidelines (World Tourism Organization, 2004)to identify sustainable objectives in these coastal destinations. Theguidelines offer a representative list of aspects of sustainable tourismand relevant theoretical indicators to measure each aspect, indicatingin each case its variability and key or specific character. In this sense,we note that key indicators allow the evaluation of essential issues inmanaging tourist activity in any destination (such as tourist intensity,seasonality or the effects of tourism on a host community). In contrast,specific indicators are those that permit analysts to manage importantissues associated with the characteristics of the destination itself(islands, cultural destinations, coastal zones, etc.).
Furthermore, we have reviewed the literature regarding otheraspects and indicators used to evaluate sustainable objectives in thiscontext (Gallego and Moniche, 2005; Sancho and García, 2006; GSTC,2008).
Thus, our initial indicator system is composed of 88 sustainabletourism indicators, which are presented in Appendix A (see Table A.1,Table A.2 and Table A.3).
In the case of the social dimension, the selected indicators evaluatesix key social sustainability aspects:
- Social-cultural effects of tourist activity. For this aspect, we use agroup of seven indicators aiming at evaluating and controlling the
Map 1. Tourist counties of the coas
social benefits of tourist activity, which are indicated by the highernumber of infrastructures of public services. Specifically, theseindicators quantify the available services by health, transportation,financial, sporting and other basic services on the beaches.
- Conservation of the cultural heritage. We considered that touristexploitation of cultural heritage generates economic and socialbenefits, such as enriching people's knowledge of their culturalheritage aswell as the lifestyle of other societies and strengtheninglocal cultural identity. For this to occur, the preservation of adestination's cultural heritage must be ensured. In this respect, weinclude indicators to quantify the relative amount of culturalproperty under statutory protection and to control the intensity ofuse of such property so that the negative effects of tourismexploitation in regard to the cultural heritage are minimised.
- Destination safety. A third key aspect is the maintenance of publicsafety at the destination, preventing crime and providing visitorswith information about problematic areas in the destination. Thesystem includes two indicators to assess a visitor's sense of securityas a result of police actions and the provision of emergency serviceson the beaches.
- Control for the effects of tourist development on the populationstructure. This aspect is evaluated through six indicators to monitorthe effects of tourism development of the destination on thevariation of its population both in terms of number and compositionas well as on the spatial concentration of residents. In this sense, thesustainable management of tourism requires that the destinationmaintains its population levels, with a balanced structure and auniform distribution.
- Social-carrying capacity. This aspect includes indicators to controlthe social-carrying capacity of the destination to avoid rejection bylocal people and to monitor the pressure or the imposition offoreign culture on local customs.
- Effects of tourist activity on the host population's well-being. In thissense, we consider indicators that assess the indirect effects of
tal zone of Andalusia (Spain).
2165F.J. Blancas et al. / Ecological Economics 69 (2010) 2158–2172
tourist activity at the destination on the level of its population'swell-being and vice versa, in terms of income, the longevity of thepopulation, education levels, population dependency and access tohousing.
As regards the economic dimension the system evaluate eightaspects of sustainability:
- Economic benefits of tourism for the local population and destination.In this respect, we consider eleven indicators to control the basicissues that determine the benefits of such activity. Specifically,there are two types of indicators. The first are indicators thatcontrol the dimension of tourist activity and quantify the volumeof demand, the average stay registered and the revenue generated.The second type of indicators measures the indirect economiceffects on income, employment in the service sector and invest-ments in destinations.
- Sustaining tourist satisfaction. Sustainable tourism requires thelong-term maintenance of visitor satisfaction so that the destina-tion consolidates its market position and generates regulardemand. In our study, this aspect is evaluated by quantifyingvisitor satisfaction regarding the price-quality relationship asexperienced by tourists and tourist-demand loyalty.
- Development control. The objective of this aspect is to check thatplanning decisions aremade in an appropriate framework and thatthere are appropriate mechanisms for their implementation. Forthis reason, we include an indicator that assesses the presence orabsence of land use planning, including tourism.
- Tourist offers: providing a variety of experiences. Sustainable tourismmust support the maintenance and long-term improvement of adiverse, high-quality tourism offer. Given the importance of thisaspect, our system provides six indicators for monitoring thequantity and quality of regulated accommodation establishments,restaurants and non-official tourism accommodation offers.
- Seasonality. All destinations can improve their economic sustain-ability by establishing stable year-round activity at the destination,thereby reducing the negative effects of seasonality in terms ofemployment, resource consumption and/or intensive use of touristsites. This aspect includes three indicators for monitoring theseasonality of demand, offers and tourism employment. Theproposed measures are quantified by comparing the high- andlow seasons at each destination.
- Tourism employment. In this respect we consider two indicatorsthat allow us to evaluate the employment generated in the tourismsector in both absolute and relative terms. The quality ofemployment is quantified by seasonality indicators which mea-suring temporary recruitment.
- Transport related to tourism. Measures to evaluate the transportsystem that ensure access to the destination and mobility of thedemand are considered in this aspect. Thus, six key indicators thatassess access time to the destination through different means oftransport and existing infrastructure have been included in thesystem, where these include the available network of roads andpublic transport vehicles. In addition, a specific indicator isincorporated to evaluate accessibility to resources on the destina-tion beaches.
- Competitiveness of the destination. The economic dimension iscompleted with indicators that allow us to control the destina-tion's level of competitiveness. Specifically, the proposed indicatoris based on average occupancy rates of official establishmentoffers, which indirectly show the power of attraction of destinationproducts with regard to other destinations.
Finally, the environmental dimension considers eight sustainabil-ity aspects, as follows:
- Protection of the natural resources. Coastal sustainable developmentshould ensure the protection of the natural ecosystems within
protected natural areas at the destination. To this end, the intensityof tourist use of these areas must be controlled. This aspect isevaluated using an indicator that provides information on theprotected natural area. Furthermore, the system contains twospecific indicators to manage the percentage of the beaches withvaluable natural assets and sea-water quality.
- Management of scarce natural resources. For this issue we use fourindicators that provide information on the management of energyand water resources. Specifically, these measures address con-sumption levels, the use of renewable energy sources and the stepstaken to recycle water.
- Waste management and treatment. The system proposes nineindicators to limit the environmental impacts of tourism activity.Specifically, these indicators measure sewage treatment and flowat sewage installations, the volume of solid waste produced, theseparate collection of waste, the treatment facilities of solid wasteand the assessment of existing cleaning services by the visitor.
- Atmospheric pollution. In this respect, indicators have beenincluded to control the emissions of pollutants and noise levels.Noise pollution has been identified as one of the main problemsaffecting tourists during their stay.
- Management of the visual impact of infrastructure. Promoting thesustainable development of tourism in the long term is needed tominimise the visual impact of the infrastructure and facilities intourist areas. The proposed system thus contains four indicatorsthat evaluate this aspect through the size of the road infrastruc-ture, the level of erosion, building density and how much of thearea is comprised by natural landscape.
- Use intensity. The control of tourism use intensity in the coastalarea is an essential tool for evaluating sustainable development.Thus, we consider four indicators whose aim is to provideinformation in order to take into account the demand pressureson natural systems as well as to establish the limits to tourismdevelopment to help manage the load capacity of the destination.
- Environmental management. In this respect the system includes anindicator that evaluates the existence of a local administrative unitto manage environmental actions. The objective is to quantify thepositive impact of a comprehensive action in the management of amultidimensional concept, as is the case of sustainability.
- Specific aspects of environmental tourism sustainability. Finally, theenvironmental dimension is completed with a group of fourindicators that evaluate specific issues associated with beachmanagement: erosion of the beaches, cleaning services, qualitycertification and perception of cleanliness of the beaches.
Once suitable variables for quantifying all the system indicators arefixed, we obtain initial indicator values for specific counties using aprovince database obtained by aggregating the available officialstatistics at local levels. However, this information is insufficient toquantify all indicators. Thus, we have used secondary internal datarequested from the regional government's statistics units and havecreated new information by conducting field work. Once we quantifythe indicators system, we obtain synthetic indicators using themethodology proposed in Section 2 to aggregate system informationinto two phases. In the first one, we construct the synthetic indicatorGPSIN for eachdimension: social, economic andenvironmental. Thus,wedefine suitable tools to implement analysis and decision-making that donot require the simultaneous consideration of all the information in thesystem. In the second phase, we obtain a global synthetic indicator thatprovides a multidimensional measure of sustainable tourism thatsimultaneously considers all the indicators of each dimension. In thisway, we illustrate how the proposed methodology can be used toaggregate information in consecutive phases.
To obtain these synthetic indicators, we start from the initialvalues of the indicators system and determine the improvementdirection of each indicator, as shown in the tables (see Appendix A).
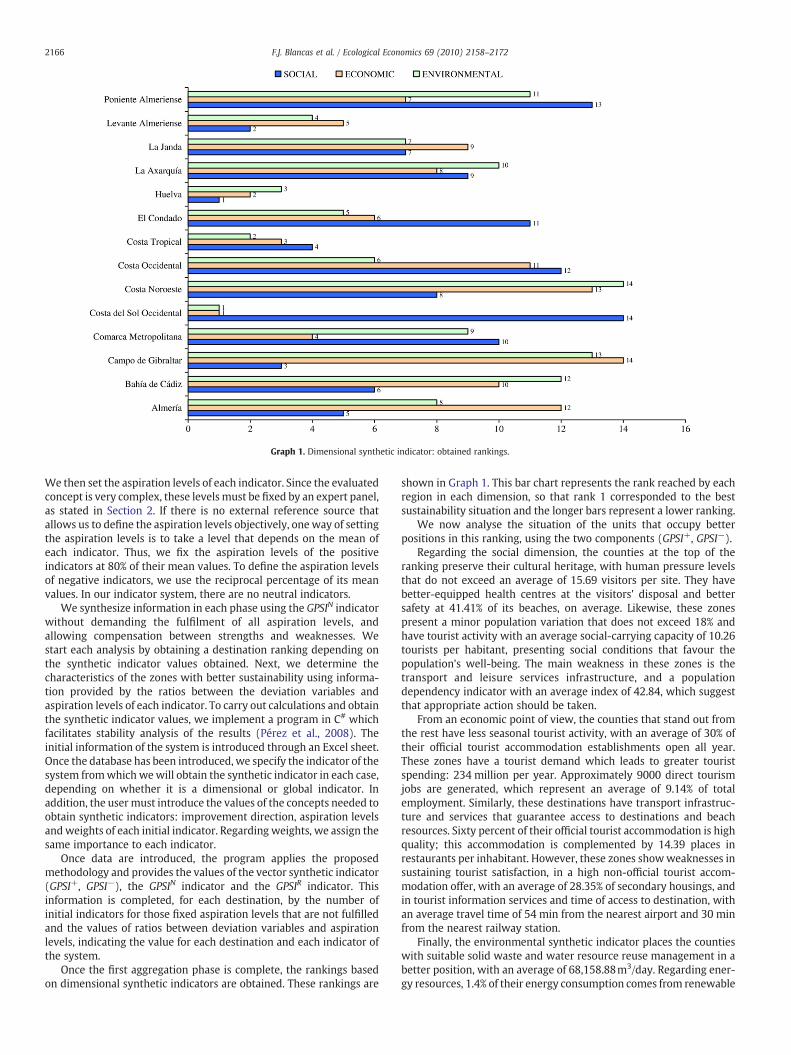
Graph 1. Dimensional synthetic indicator: obtained rankings.
2166 F.J. Blancas et al. / Ecological Economics 69 (2010) 2158–2172
We then set the aspiration levels of each indicator. Since the evaluatedconcept is very complex, these levelsmust be fixed by an expert panel,as stated in Section 2. If there is no external reference source thatallows us to define the aspiration levels objectively, one way of settingthe aspiration levels is to take a level that depends on the mean ofeach indicator. Thus, we fix the aspiration levels of the positiveindicators at 80% of their mean values. To define the aspiration levelsof negative indicators, we use the reciprocal percentage of its meanvalues. In our indicator system, there are no neutral indicators.
We synthesize information in each phase using the GPSIN indicatorwithout demanding the fulfilment of all aspiration levels, andallowing compensation between strengths and weaknesses. Westart each analysis by obtaining a destination ranking depending onthe synthetic indicator values obtained. Next, we determine thecharacteristics of the zones with better sustainability using informa-tion provided by the ratios between the deviation variables andaspiration levels of each indicator. To carry out calculations and obtainthe synthetic indicator values, we implement a program in C# whichfacilitates stability analysis of the results (Pérez et al., 2008). Theinitial information of the system is introduced through an Excel sheet.Once the database has been introduced, we specify the indicator of thesystem fromwhich wewill obtain the synthetic indicator in each case,depending on whether it is a dimensional or global indicator. Inaddition, the user must introduce the values of the concepts needed toobtain synthetic indicators: improvement direction, aspiration levelsand weights of each initial indicator. Regarding weights, we assign thesame importance to each indicator.
Once data are introduced, the program applies the proposedmethodology and provides the values of the vector synthetic indicator(GPSI+, GPSI−), the GPSIN indicator and the GPSIR indicator. Thisinformation is completed, for each destination, by the number ofinitial indicators for those fixed aspiration levels that are not fulfilledand the values of ratios between deviation variables and aspirationlevels, indicating the value for each destination and each indicator ofthe system.
Once the first aggregation phase is complete, the rankings basedon dimensional synthetic indicators are obtained. These rankings are
shown in Graph 1. This bar chart represents the rank reached by eachregion in each dimension, so that rank 1 corresponded to the bestsustainability situation and the longer bars represent a lower ranking.
We now analyse the situation of the units that occupy betterpositions in this ranking, using the two components (GPSI+, GPSI−).
Regarding the social dimension, the counties at the top of theranking preserve their cultural heritage, with human pressure levelsthat do not exceed an average of 15.69 visitors per site. They havebetter-equipped health centres at the visitors' disposal and bettersafety at 41.41% of its beaches, on average. Likewise, these zonespresent a minor population variation that does not exceed 18% andhave tourist activity with an average social-carrying capacity of 10.26tourists per habitant, presenting social conditions that favour thepopulation's well-being. The main weakness in these zones is thetransport and leisure services infrastructure, and a populationdependency indicator with an average index of 42.84, which suggestthat appropriate action should be taken.
From an economic point of view, the counties that stand out fromthe rest have less seasonal tourist activity, with an average of 30% oftheir official tourist accommodation establishments open all year.These zones have a tourist demand which leads to greater touristspending: 234 million per year. Approximately 9000 direct tourismjobs are generated, which represent an average of 9.14% of totalemployment. Similarly, these destinations have transport infrastruc-ture and services that guarantee access to destinations and beachresources. Sixty percent of their official tourist accommodation is highquality; this accommodation is complemented by 14.39 places inrestaurants per inhabitant. However, these zones showweaknesses insustaining tourist satisfaction, in a high non-official tourist accom-modation offer, with an average of 28.35% of secondary housings, andin tourist information services and time of access to destination, withan average travel time of 54 min from the nearest airport and 30 minfrom the nearest railway station.
Finally, the environmental synthetic indicator places the countieswith suitable solid waste and water resource reuse management in abetter position, with an average of 68,158.88m3/day. Regarding ener-gy resources, 1.4% of their energy consumption comes from renewable
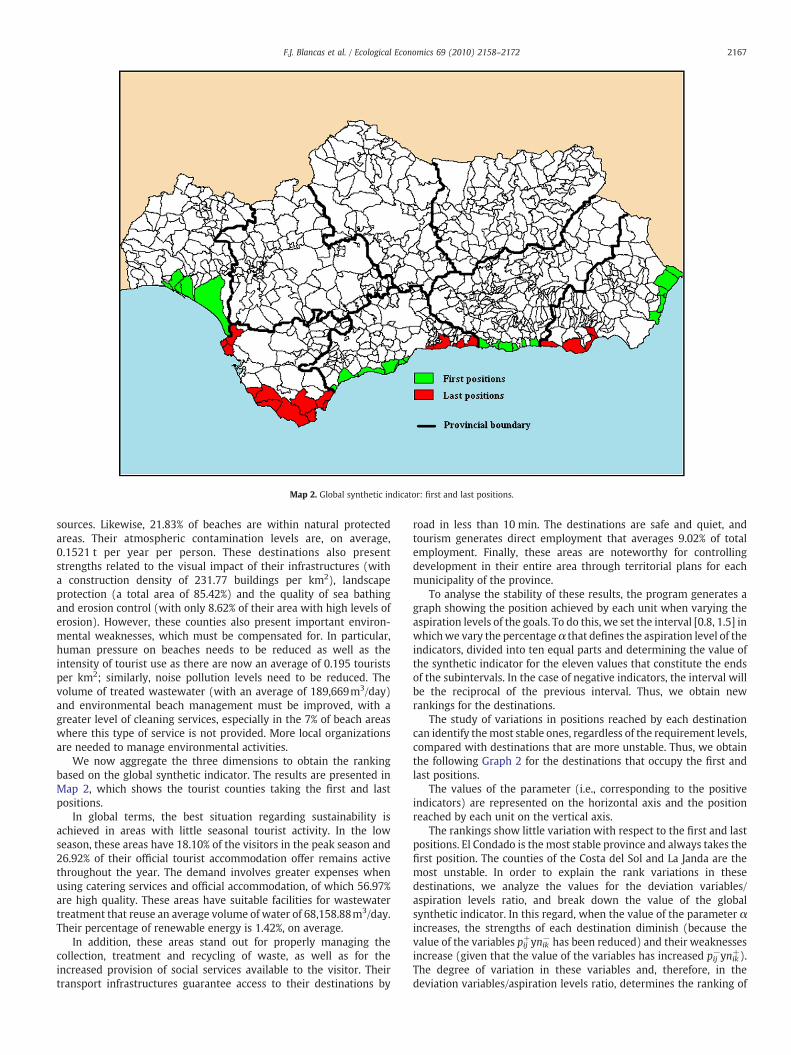
Map 2. Global synthetic indicator: first and last positions.
2167F.J. Blancas et al. / Ecological Economics 69 (2010) 2158–2172
sources. Likewise, 21.83% of beaches are within natural protectedareas. Their atmospheric contamination levels are, on average,0.1521 t per year per person. These destinations also presentstrengths related to the visual impact of their infrastructures (witha construction density of 231.77 buildings per km2), landscapeprotection (a total area of 85.42%) and the quality of sea bathingand erosion control (with only 8.62% of their area with high levels oferosion). However, these counties also present important environ-mental weaknesses, which must be compensated for. In particular,human pressure on beaches needs to be reduced as well as theintensity of tourist use as there are now an average of 0.195 touristsper km2; similarly, noise pollution levels need to be reduced. Thevolume of treated wastewater (with an average of 189,669m3/day)and environmental beach management must be improved, with agreater level of cleaning services, especially in the 7% of beach areaswhere this type of service is not provided. More local organizationsare needed to manage environmental activities.
We now aggregate the three dimensions to obtain the rankingbased on the global synthetic indicator. The results are presented inMap 2, which shows the tourist counties taking the first and lastpositions.
In global terms, the best situation regarding sustainability isachieved in areas with little seasonal tourist activity. In the lowseason, these areas have 18.10% of the visitors in the peak season and26.92% of their official tourist accommodation offer remains activethroughout the year. The demand involves greater expenses whenusing catering services and official accommodation, of which 56.97%are high quality. These areas have suitable facilities for wastewatertreatment that reuse an average volume of water of 68,158.88m3/day.Their percentage of renewable energy is 1.42%, on average.
In addition, these areas stand out for properly managing thecollection, treatment and recycling of waste, as well as for theincreased provision of social services available to the visitor. Theirtransport infrastructures guarantee access to their destinations by
road in less than 10 min. The destinations are safe and quiet, andtourism generates direct employment that averages 9.02% of totalemployment. Finally, these areas are noteworthy for controllingdevelopment in their entire area through territorial plans for eachmunicipality of the province.
To analyse the stability of these results, the program generates agraph showing the position achieved by each unit when varying theaspiration levels of the goals. To do this, we set the interval [0.8, 1.5] inwhichwe vary the percentage α that defines the aspiration level of theindicators, divided into ten equal parts and determining the value ofthe synthetic indicator for the eleven values that constitute the endsof the subintervals. In the case of negative indicators, the interval willbe the reciprocal of the previous interval. Thus, we obtain newrankings for the destinations.
The study of variations in positions reached by each destinationcan identify themost stable ones, regardless of the requirement levels,compared with destinations that are more unstable. Thus, we obtainthe following Graph 2 for the destinations that occupy the first andlast positions.
The values of the parameter (i.e., corresponding to the positiveindicators) are represented on the horizontal axis and the positionreached by each unit on the vertical axis.
The rankings show little variation with respect to the first and lastpositions. El Condado is the most stable province and always takes thefirst position. The counties of the Costa del Sol and La Janda are themost unstable. In order to explain the rank variations in thesedestinations, we analyze the values for the deviation variables/aspiration levels ratio, and break down the value of the globalsynthetic indicator. In this regard, when the value of the parameter αincreases, the strengths of each destination diminish (because thevalue of the variables pij+ynik− has been reduced) and their weaknessesincrease (given that the value of the variables has increased pij
−ynik+).The degree of variation in these variables and, therefore, in thedeviation variables/aspiration levels ratio, determines the ranking of
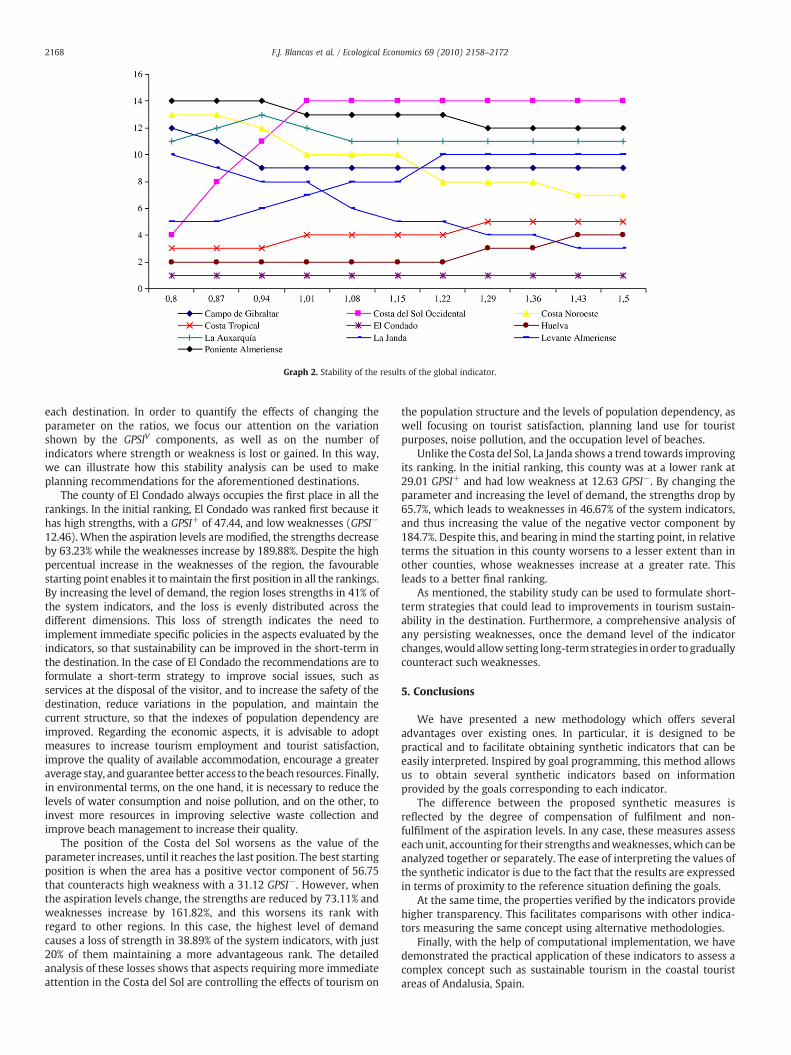
Graph 2. Stability of the results of the global indicator.
2168 F.J. Blancas et al. / Ecological Economics 69 (2010) 2158–2172
each destination. In order to quantify the effects of changing theparameter on the ratios, we focus our attention on the variationshown by the GPSIV components, as well as on the number ofindicators where strength or weakness is lost or gained. In this way,we can illustrate how this stability analysis can be used to makeplanning recommendations for the aforementioned destinations.
The county of El Condado always occupies the first place in all therankings. In the initial ranking, El Condado was ranked first because ithas high strengths, with a GPSI+ of 47.44, and low weaknesses (GPSI−
12.46). When the aspiration levels are modified, the strengths decreaseby 63.23% while the weaknesses increase by 189.88%. Despite the highpercentual increase in the weaknesses of the region, the favourablestarting point enables it tomaintain the first position in all the rankings.By increasing the level of demand, the region loses strengths in 41% ofthe system indicators, and the loss is evenly distributed across thedifferent dimensions. This loss of strength indicates the need toimplement immediate specific policies in the aspects evaluated by theindicators, so that sustainability can be improved in the short-term inthe destination. In the case of El Condado the recommendations are toformulate a short-term strategy to improve social issues, such asservices at the disposal of the visitor, and to increase the safety of thedestination, reduce variations in the population, and maintain thecurrent structure, so that the indexes of population dependency areimproved. Regarding the economic aspects, it is advisable to adoptmeasures to increase tourism employment and tourist satisfaction,improve the quality of available accommodation, encourage a greateraverage stay, and guarantee better access to the beach resources. Finally,in environmental terms, on the one hand, it is necessary to reduce thelevels of water consumption and noise pollution, and on the other, toinvest more resources in improving selective waste collection andimprove beach management to increase their quality.
The position of the Costa del Sol worsens as the value of theparameter increases, until it reaches the last position. The best startingposition is when the area has a positive vector component of 56.75that counteracts high weakness with a 31.12 GPSI−. However, whenthe aspiration levels change, the strengths are reduced by 73.11% andweaknesses increase by 161.82%, and this worsens its rank withregard to other regions. In this case, the highest level of demandcauses a loss of strength in 38.89% of the system indicators, with just20% of them maintaining a more advantageous rank. The detailedanalysis of these losses shows that aspects requiring more immediateattention in the Costa del Sol are controlling the effects of tourism on
the population structure and the levels of population dependency, aswell focusing on tourist satisfaction, planning land use for touristpurposes, noise pollution, and the occupation level of beaches.
Unlike the Costa del Sol, La Janda shows a trend towards improvingits ranking. In the initial ranking, this county was at a lower rank at29.01 GPSI+ and had low weakness at 12.63 GPSI−. By changing theparameter and increasing the level of demand, the strengths drop by65.7%, which leads to weaknesses in 46.67% of the system indicators,and thus increasing the value of the negative vector component by184.7%. Despite this, and bearing in mind the starting point, in relativeterms the situation in this county worsens to a lesser extent than inother counties, whose weaknesses increase at a greater rate. Thisleads to a better final ranking.
As mentioned, the stability study can be used to formulate short-term strategies that could lead to improvements in tourism sustain-ability in the destination. Furthermore, a comprehensive analysis ofany persisting weaknesses, once the demand level of the indicatorchanges,would allow setting long-termstrategies in order to graduallycounteract such weaknesses.
5. Conclusions
We have presented a new methodology which offers severaladvantages over existing ones. In particular, it is designed to bepractical and to facilitate obtaining synthetic indicators that can beeasily interpreted. Inspired by goal programming, this method allowsus to obtain several synthetic indicators based on informationprovided by the goals corresponding to each indicator.
The difference between the proposed synthetic measures isreflected by the degree of compensation of fulfilment and non-fulfilment of the aspiration levels. In any case, these measures assesseach unit, accounting for their strengths andweaknesses, which can beanalyzed together or separately. The ease of interpreting the values ofthe synthetic indicator is due to the fact that the results are expressedin terms of proximity to the reference situation defining the goals.
At the same time, the properties verified by the indicators providehigher transparency. This facilitates comparisons with other indica-tors measuring the same concept using alternative methodologies.
Finally, with the help of computational implementation, we havedemonstrated the practical application of these indicators to assess acomplex concept such as sustainable tourism in the coastal touristareas of Andalusia, Spain.
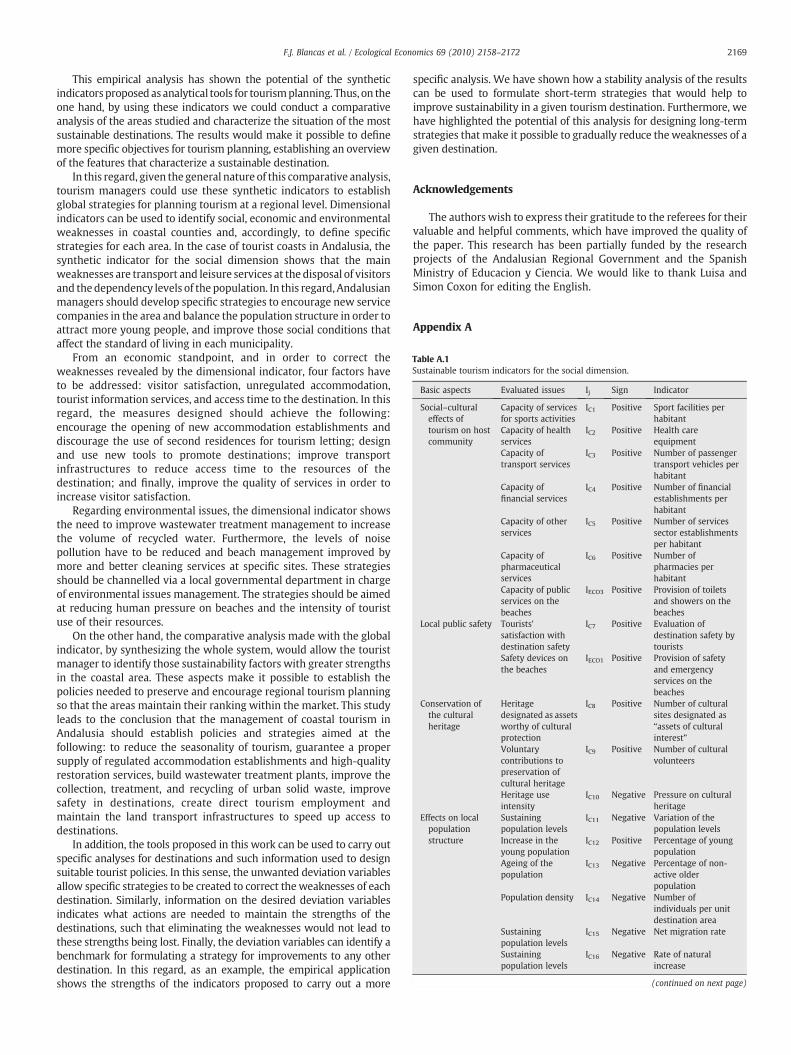
Sustainable tourism indicators for the social dimension.
Basic aspects Evaluated issues Ij Sign Indicator
Social–culturaleffects oftourism on hostcommunity
Capacity of servicesfor sports activities
IC1 Positive Sport facilities perhabitant
Capacity of healthservices
IC2 Positive Health careequipment
Capacity oftransport services
IC3 Positive Number of passengertransport vehicles perhabitant
Capacity offinancial services
IC4 Positive Number of financialestablishments perhabitant
Capacity of otherservices
IC5 Positive Number of servicessector establishmentsper habitant
Capacity ofpharmaceuticalservices
IC6 Positive Number ofpharmacies perhabitant
Capacity of publicservices on thebeaches
IECO3 Positive Provision of toiletsand showers on thebeaches
Local public safety Tourists'satisfaction withdestination safety
IC7 Positive Evaluation ofdestination safety bytourists
Safety devices onthe beaches
IECO1 Positive Provision of safetyand emergencyservices on thebeaches
Conservation ofthe culturalheritage
Heritagedesignated as assetsworthy of culturalprotection
IC8 Positive Number of culturalsites designated as“assets of culturalinterest”
Voluntarycontributions topreservation ofcultural heritage
IC9 Positive Number of culturalvolunteers
Heritage useintensity
IC10 Negative Pressure on culturalheritage
Effects on localpopulationstructure
Sustainingpopulation levels
IC11 Negative Variation of thepopulation levels
Increase in theyoung population
IC12 Positive Percentage of youngpopulation
Ageing of thepopulation
IC13 Negative Percentage of non-active olderpopulation
Population density IC14 Negative Number ofindividuals per unitdestination area
Sustainingpopulation levels
IC15 Negative Net migration rate
Sustainingpopulation levels
IC16 Negative Rate of naturalincrease
(continued on next page)
2169F.J. Blancas et al. / Ecological Economics 69 (2010) 2158–2172
This empirical analysis has shown the potential of the syntheticindicatorsproposed asanalytical tools for tourismplanning. Thus, on theone hand, by using these indicators we could conduct a comparativeanalysis of the areas studied and characterize the situation of the mostsustainable destinations. The results would make it possible to definemore specific objectives for tourism planning, establishing an overviewof the features that characterize a sustainable destination.
In this regard, given the general nature of this comparative analysis,tourism managers could use these synthetic indicators to establishglobal strategies for planning tourism at a regional level. Dimensionalindicators can be used to identify social, economic and environmentalweaknesses in coastal counties and, accordingly, to define specificstrategies for each area. In the case of tourist coasts in Andalusia, thesynthetic indicator for the social dimension shows that the mainweaknesses are transport and leisure services at the disposal of visitorsand the dependency levels of the population. In this regard, Andalusianmanagers should develop specific strategies to encourage new servicecompanies in the area and balance the population structure in order toattract more young people, and improve those social conditions thataffect the standard of living in each municipality.
From an economic standpoint, and in order to correct theweaknesses revealed by the dimensional indicator, four factors haveto be addressed: visitor satisfaction, unregulated accommodation,tourist information services, and access time to the destination. In thisregard, the measures designed should achieve the following:encourage the opening of new accommodation establishments anddiscourage the use of second residences for tourism letting; designand use new tools to promote destinations; improve transportinfrastructures to reduce access time to the resources of thedestination; and finally, improve the quality of services in order toincrease visitor satisfaction.
Regarding environmental issues, the dimensional indicator showsthe need to improve wastewater treatment management to increasethe volume of recycled water. Furthermore, the levels of noisepollution have to be reduced and beach management improved bymore and better cleaning services at specific sites. These strategiesshould be channelled via a local governmental department in chargeof environmental issues management. The strategies should be aimedat reducing human pressure on beaches and the intensity of touristuse of their resources.
On the other hand, the comparative analysis made with the globalindicator, by synthesizing the whole system, would allow the touristmanager to identify those sustainability factors with greater strengthsin the coastal area. These aspects make it possible to establish thepolicies needed to preserve and encourage regional tourism planningso that the areas maintain their ranking within the market. This studyleads to the conclusion that the management of coastal tourism inAndalusia should establish policies and strategies aimed at thefollowing: to reduce the seasonality of tourism, guarantee a propersupply of regulated accommodation establishments and high-qualityrestoration services, build wastewater treatment plants, improve thecollection, treatment, and recycling of urban solid waste, improvesafety in destinations, create direct tourism employment andmaintain the land transport infrastructures to speed up access todestinations.
In addition, the tools proposed in this work can be used to carry outspecific analyses for destinations and such information used to designsuitable tourist policies. In this sense, the unwanted deviation variablesallow specific strategies to be created to correct the weaknesses of eachdestination. Similarly, information on the desired deviation variablesindicates what actions are needed to maintain the strengths of thedestinations, such that eliminating the weaknesses would not lead tothese strengths being lost. Finally, the deviation variables can identify abenchmark for formulating a strategy for improvements to any otherdestination. In this regard, as an example, the empirical applicationshows the strengths of the indicators proposed to carry out a more
specific analysis. We have shown how a stability analysis of the resultscan be used to formulate short-term strategies that would help toimprove sustainability in a given tourism destination. Furthermore, wehave highlighted the potential of this analysis for designing long-termstrategies that make it possible to gradually reduce theweaknesses of agiven destination.
Acknowledgements
The authors wish to express their gratitude to the referees for theirvaluable and helpful comments, which have improved the quality ofthe paper. This research has been partially funded by the researchprojects of the Andalusian Regional Government and the SpanishMinistry of Educacion y Ciencia. We would like to thank Luisa andSimon Coxon for editing the English.
Appendix A
Table A.1
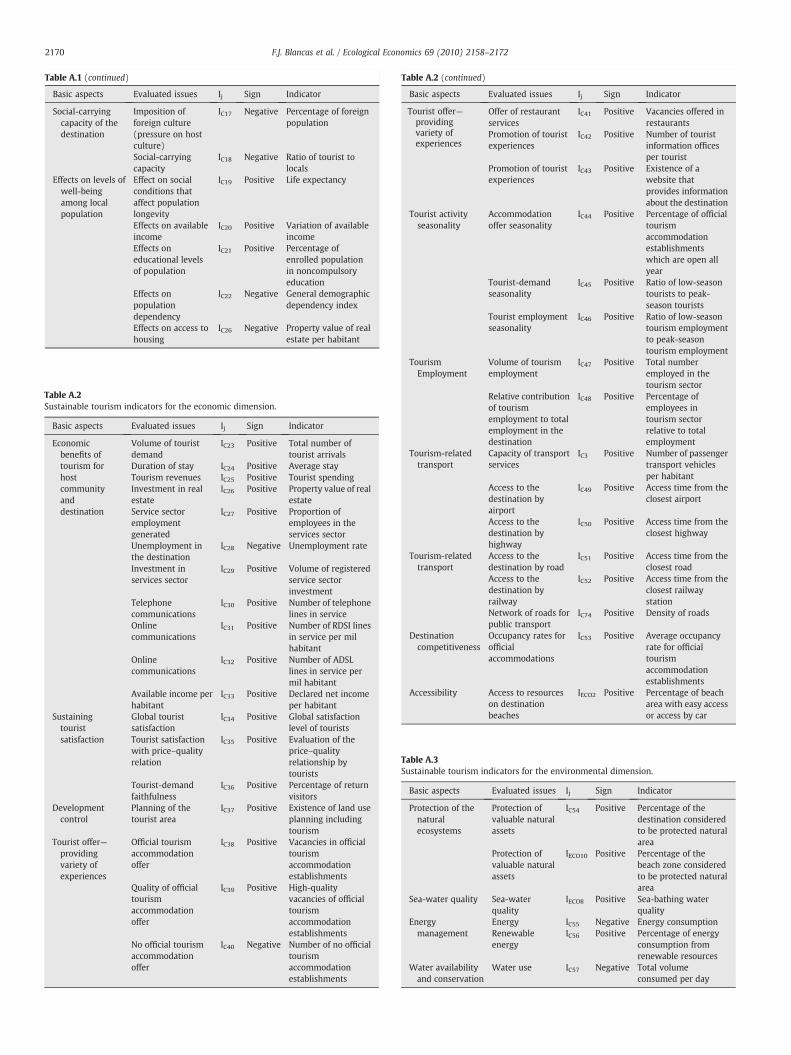
Table A.2Sustainable tourism indicators for the economic dimension.
Basic aspects Evaluated issues Ij Sign Indicator
Economicbenefits oftourism forhostcommunityanddestination
Volume of touristdemand
IC23 Positive Total number oftourist arrivals
Duration of stay IC24 Positive Average stayTourism revenues IC25 Positive Tourist spendingInvestment in realestate
IC26 Positive Property value of realestate
Service sectoremploymentgenerated
IC27 Positive Proportion ofemployees in theservices sector
Unemployment inthe destination
IC28 Negative Unemployment rate
Investment inservices sector
IC29 Positive Volume of registeredservice sectorinvestment
Telephonecommunications
IC30 Positive Number of telephonelines in service
Onlinecommunications
IC31 Positive Number of RDSI linesin service per milhabitant
Onlinecommunications
IC32 Positive Number of ADSLlines in service permil habitant
Available income perhabitant
IC33 Positive Declared net incomeper habitant
Sustainingtouristsatisfaction
Global touristsatisfaction
IC34 Positive Global satisfactionlevel of tourists
Tourist satisfactionwith price–qualityrelation
IC35 Positive Evaluation of theprice–qualityrelationship bytourists
Tourist-demandfaithfulness
IC36 Positive Percentage of returnvisitors
Developmentcontrol
Planning of thetourist area
IC37 Positive Existence of land useplanning includingtourism
Tourist offer—providingvariety ofexperiences
Official tourismaccommodationoffer
IC38 Positive Vacancies in officialtourismaccommodationestablishments
Quality of officialtourismaccommodationoffer
IC39 Positive High-qualityvacancies of officialtourismaccommodationestablishments
No official tourismaccommodationoffer
IC40 Negative Number of no officialtourismaccommodationestablishments
Table A.1 (continued)
Basic aspects Evaluated issues Ij Sign Indicator
Social-carryingcapacity of thedestination
Imposition offoreign culture(pressure on hostculture)
IC17 Negative Percentage of foreignpopulation
Social-carryingcapacity
IC18 Negative Ratio of tourist tolocals
Effects on levels ofwell-beingamong localpopulation
Effect on socialconditions thataffect populationlongevity
IC19 Positive Life expectancy
Effects on availableincome
IC20 Positive Variation of availableincome
Effects oneducational levelsof population
IC21 Positive Percentage ofenrolled populationin noncompulsoryeducation
Effects onpopulationdependency
IC22 Negative General demographicdependency index
Effects on access tohousing
IC26 Negative Property value of realestate per habitant
Table A.2 (continued)
Basic aspects Evaluated issues Ij Sign Indicator
Offer of restaurantservices
IC41 Positive Vacancies offered inrestaurants
Promotion of touristexperiences
IC42 Positive Number of touristinformation officesper tourist
Promotion of touristexperiences
IC43 Positive Existence of awebsite thatprovides informationabout the destination
Tourist activityseasonality
Accommodationoffer seasonality
IC44 Positive Percentage of officialtourismaccommodationestablishmentswhich are open allyear
Tourist-demandseasonality
IC45 Positive Ratio of low-seasontourists to peak-season tourists
Tourist employmentseasonality
IC46 Positive Ratio of low-seasontourism employmentto peak-seasontourism employment
TourismEmployment
Volume of tourismemployment
IC47 Positive Total numberemployed in thetourism sector
Relative contributionof tourismemployment to totalemployment in thedestination
IC48 Positive Percentage ofemployees intourism sectorrelative to totalemployment
Tourism-relatedtransport
Capacity of transportservices
IC3 Positive Number of passengertransport vehiclesper habitant
Access to thedestination byairport
IC49 Positive Access time from theclosest airport
Access to thedestination byhighway
IC50 Positive Access time from theclosest highway
Tourism-relatedtransport
Access to thedestination by road
IC51 Positive Access time from theclosest road
Access to thedestination byrailway
IC52 Positive Access time from theclosest railwaystation
Network of roads forpublic transport
IC74 Positive Density of roads
Destinationcompetitiveness
Occupancy rates forofficialaccommodations
IC53 Positive Average occupancyrate for officialtourismaccommodationestablishments
Accessibility Access to resourceson destinationbeaches
IECO2 Positive Percentage of beacharea with easy accessor access by car
Table A.3Sustainable tourism indicators for the environmental dimension.
Basic aspects Evaluated issues Ij Sign Indicator
Protection of thenaturalecosystems
Protection ofvaluable naturalassets
IC54 Positive Percentage of thedestination consideredto be protected naturalarea
Protection ofvaluable naturalassets
IECO10 Positive Percentage of thebeach zone consideredto be protected naturalarea
Sea-water quality Sea-waterquality
IECO8 Positive Sea-bathing waterquality
Energymanagement
Energy IC55 Negative Energy consumptionRenewableenergy
IC56 Positive Percentage of energyconsumption fromrenewable resources
Water availabilityand conservation
Water use IC57 Negative Total volumeconsumed per day
Tourist offer—providingvariety ofexperiences
2170 F.J. Blancas et al. / Ecological Economics 69 (2010) 2158–2172
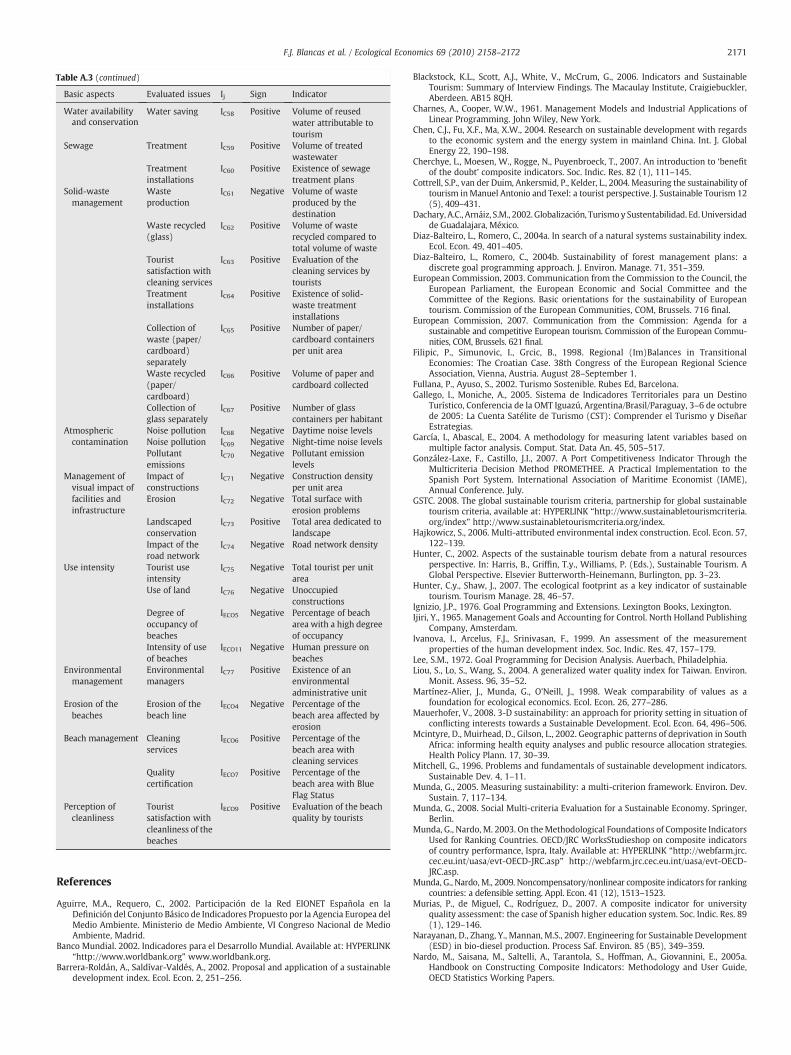
Table A.3 (continued)
Basic aspects Evaluated issues Ij Sign Indicator
Water saving IC58 Positive Volume of reusedwater attributable totourism
Sewage Treatment IC59 Positive Volume of treatedwastewater
Treatmentinstallations
IC60 Positive Existence of sewagetreatment plans
Solid-wastemanagement
Wasteproduction
IC61 Negative Volume of wasteproduced by thedestination
Waste recycled(glass)
IC62 Positive Volume of wasterecycled compared tototal volume of waste
Touristsatisfaction withcleaning services
IC63 Positive Evaluation of thecleaning services bytourists
Treatmentinstallations
IC64 Positive Existence of solid-waste treatmentinstallations
Collection ofwaste (paper/cardboard)separately
IC65 Positive Number of paper/cardboard containersper unit area
Waste recycled(paper/cardboard)
IC66 Positive Volume of paper andcardboard collected
Collection ofglass separately
IC67 Positive Number of glasscontainers per habitant
Atmosphericcontamination
Noise pollution IC68 Negative Daytime noise levelsNoise pollution IC69 Negative Night-time noise levelsPollutantemissions
IC70 Negative Pollutant emissionlevels
Management ofvisual impact offacilities andinfrastructure
Impact ofconstructions
IC71 Negative Construction densityper unit area
Erosion IC72 Negative Total surface witherosion problems
Landscapedconservation
IC73 Positive Total area dedicated tolandscape
Impact of theroad network
IC74 Negative Road network density
Use intensity Tourist useintensity
IC75 Negative Total tourist per unitarea
Use of land IC76 Negative Unoccupiedconstructions
Degree ofoccupancy ofbeaches
IECO5 Negative Percentage of beacharea with a high degreeof occupancy
Intensity of useof beaches
IECO11 Negative Human pressure onbeaches
Environmentalmanagement
Environmentalmanagers
IC77 Positive Existence of anenvironmentaladministrative unit
Erosion of thebeaches
Erosion of thebeach line
IECO4 Negative Percentage of thebeach area affected byerosion
Beach management Cleaningservices
IECO6 Positive Percentage of thebeach area withcleaning services
Qualitycertification
IECO7 Positive Percentage of thebeach area with BlueFlag Status
Perception ofcleanliness
Touristsatisfaction withcleanliness of thebeaches
IECO9 Positive Evaluation of the beachquality by tourists
Water availabilityand conservation
2171F.J. Blancas et al. / Ecological Economics 69 (2010) 2158–2172
References
Aguirre, M.A., Requero, C., 2002. Participación de la Red EIONET Española en laDefinición del Conjunto Básico de Indicadores Propuesto por la Agencia Europea delMedio Ambiente. Ministerio de Medio Ambiente, VI Congreso Nacional de MedioAmbiente, Madrid.
Banco Mundial. 2002. Indicadores para el Desarrollo Mundial. Available at: HYPERLINK“http://www.worldbank.org” www.worldbank.org.
Barrera-Roldán, A., Saldívar-Valdés, A., 2002. Proposal and application of a sustainabledevelopment index. Ecol. Econ. 2, 251–256.
Blackstock, K.L., Scott, A.J., White, V., McCrum, G., 2006. Indicators and SustainableTourism: Summary of Interview Findings. The Macaulay Institute, Craigiebuckler,Aberdeen. AB15 8QH.
Charnes, A., Cooper, W.W., 1961. Management Models and Industrial Applications ofLinear Programming. John Wiley, New York.
Chen, C.J., Fu, X.F., Ma, X.W., 2004. Research on sustainable development with regardsto the economic system and the energy system in mainland China. Int. J. GlobalEnergy 22, 190–198.
Cherchye, L., Moesen, W., Rogge, N., Puyenbroeck, T., 2007. An introduction to ‘benefitof the doubt’ composite indicators. Soc. Indic. Res. 82 (1), 111–145.
Cottrell, S.P., van der Duim, Ankersmid, P., Kelder, L., 2004. Measuring the sustainability oftourism inManuel Antonio and Texel: a tourist perspective. J. Sustainable Tourism 12(5), 409–431.
Dachary, A.C., Arnáiz, S.M., 2002. Globalización, Turismoy Sustentabilidad. Ed. Universidadde Guadalajara, México.
Diaz-Balteiro, L., Romero, C., 2004a. In search of a natural systems sustainability index.Ecol. Econ. 49, 401–405.
Diaz-Balteiro, L., Romero, C., 2004b. Sustainability of forest management plans: adiscrete goal programming approach. J. Environ. Manage. 71, 351–359.
European Commission, 2003. Communication from the Commission to the Council, theEuropean Parliament, the European Economic and Social Committee and theCommittee of the Regions. Basic orientations for the sustainability of Europeantourism. Commission of the European Communities, COM, Brussels. 716 final.
European Commission, 2007. Communication from the Commission: Agenda for asustainable and competitive European tourism. Commission of the European Commu-nities, COM, Brussels. 621 final.
Filipic, P., Simunovic, I., Grcic, B., 1998. Regional (Im)Balances in TransitionalEconomies: The Croatian Case. 38th Congress of the European Regional ScienceAssociation, Vienna, Austria. August 28–September 1.
Fullana, P., Ayuso, S., 2002. Turismo Sostenible. Rubes Ed, Barcelona.Gallego, I., Moniche, A., 2005. Sistema de Indicadores Territoriales para un Destino
Turístico, Conferencia de la OMT Iguazú, Argentina/Brasil/Paraguay, 3–6 de octubrede 2005: La Cuenta Satélite de Turismo (CST): Comprender el Turismo y DiseñarEstrategias.
García, I., Abascal, E., 2004. A methodology for measuring latent variables based onmultiple factor analysis. Comput. Stat. Data An. 45, 505–517.
González-Laxe, F., Castillo, J.I., 2007. A Port Competitiveness Indicator Through theMulticriteria Decision Method PROMETHEE. A Practical Implementation to theSpanish Port System. International Association of Maritime Economist (IAME),Annual Conference. July.
GSTC. 2008. The global sustainable tourism criteria, partnership for global sustainabletourism criteria, available at: HYPERLINK “http://www.sustainabletourismcriteria.org/index” http://www.sustainabletourismcriteria.org/index.
Hajkowicz, S., 2006. Multi-attributed environmental index construction. Ecol. Econ. 57,122–139.
Hunter, C., 2002. Aspects of the sustainable tourism debate from a natural resourcesperspective. In: Harris, B., Griffin, T.y., Williams, P. (Eds.), Sustainable Tourism. AGlobal Perspective. Elsevier Butterworth-Heinemann, Burlington, pp. 3–23.
Hunter, C.y., Shaw, J., 2007. The ecological footprint as a key indicator of sustainabletourism. Tourism Manage. 28, 46–57.
Ignizio, J.P., 1976. Goal Programming and Extensions. Lexington Books, Lexington.Ijiri, Y., 1965. Management Goals and Accounting for Control. North Holland Publishing
Company, Amsterdam.Ivanova, I., Arcelus, F.J., Srinivasan, F., 1999. An assessment of the measurement
properties of the human development index. Soc. Indic. Res. 47, 157–179.Lee, S.M., 1972. Goal Programming for Decision Analysis. Auerbach, Philadelphia.Liou, S., Lo, S., Wang, S., 2004. A generalized water quality index for Taiwan. Environ.
Monit. Assess. 96, 35–52.Martínez-Alier, J., Munda, G., O'Neill, J., 1998. Weak comparability of values as a
foundation for ecological economics. Ecol. Econ. 26, 277–286.Mauerhofer, V., 2008. 3-D sustainability: an approach for priority setting in situation of
conflicting interests towards a Sustainable Development. Ecol. Econ. 64, 496–506.Mcintyre, D., Muirhead, D., Gilson, L., 2002. Geographic patterns of deprivation in South
Africa: informing health equity analyses and public resource allocation strategies.Health Policy Plann. 17, 30–39.
Mitchell, G., 1996. Problems and fundamentals of sustainable development indicators.Sustainable Dev. 4, 1–11.
Munda, G., 2005. Measuring sustainability: a multi-criterion framework. Environ. Dev.Sustain. 7, 117–134.
Munda, G., 2008. Social Multi-criteria Evaluation for a Sustainable Economy. Springer,Berlin.
Munda, G., Nardo, M. 2003. On theMethodological Foundations of Composite IndicatorsUsed for Ranking Countries. OECD/JRC WorksStudieshop on composite indicatorsof country performance, Ispra, Italy. Available at: HYPERLINK “http://webfarm.jrc.cec.eu.int/uasa/evt-OECD-JRC.asp” http://webfarm.jrc.cec.eu.int/uasa/evt-OECD-JRC.asp.
Munda, G., Nardo,M., 2009. Noncompensatory/nonlinear composite indicators for rankingcountries: a defensible setting. Appl. Econ. 41 (12), 1513–1523.
Murias, P., de Miguel, C., Rodríguez, D., 2007. A composite indicator for universityquality assessment: the case of Spanish higher education system. Soc. Indic. Res. 89(1), 129–146.
Narayanan, D., Zhang, Y., Mannan, M.S., 2007. Engineering for Sustainable Development(ESD) in bio-diesel production. Process Saf. Environ. 85 (B5), 349–359.
Nardo, M., Saisana, M., Saltelli, A., Tarantola, S., Hoffman, A., Giovannini, E., 2005a.Handbook on Constructing Composite Indicators: Methodology and User Guide,OECD Statistics Working Papers.
2172 F.J. Blancas et al. / Ecological Economics 69 (2010) 2158–2172
Nardo, M., Saisana, M., Saltelli, A., Tarantola, S., 2005b. Tools for Composite IndicatorsBuilding, Institute for the Protection and Security of the Citizen, EuropeanCommission.
O'Neill, J., 1993. Ecology Policy and Politics. Routledge and Kegan Paul, London.Organization for Economic Co-operation and Development, 2000. Frameworksstudies
to Measure Sustainable Development. Ed. Organization for Economic Co-operationand Development Publications Service, Paris.
Patterson, M., Mc Donald, G., 2004. How Clean and Green is New Zealand Tourism?Lifecycle and Future Environmental Impacts. Landcare Research Science Series 24.Manaaki Whenua Press, Lincoln, Canterbury.
Pena, J.A., 1978. La Distancia P: Un Método para la Medición del Nivel de Bienestar. Rev.Esp. Econ. 8, 49–89.
Pérez, F., Blancas, F.J., González, M., Guerrero, F.Mª., Lozano, M., Ruiz, M., 2008. Análisis,diseño y comparación de indicadores sintéticos. Rect@ 16, 803_1-803_12.
Podinovskii, V.V., 1994. Criteria importance theory. Math. Soc. Sci. 27, 237–252.Premachandra, I.M., 2001. A note on DEA vs principal component analysis: an
improvement to Joe Zhu's approach. Eur. J. Oper. Res. 132, 553–560.Ramzan, N., Degenkolbe, S., Witt, W., 2008. Evaluating and improving environmental
performance of hc's recovery system: a case study of distillation unit. Chem. Eng. J.140, 201–213.
Ronchi, E., Federico, A., Musmeci, F., 2002. A system oriented integrated indicator forsustainable development in Italy. Ecol. Ind. 2, 197–210.
Sabatini, F., 2005. Measuring Social Capital in Italy: An Exploratory Analysis, Facolta diEconomia Universita di Bologna Sede di Forli, Working paper nº 12.
Saisana, M., Tarantola, S., 2002. State-of-the-Art Report on Current Methodologies andPractices for Composite Indicator Development. Joint Research Centre, EuropeanCommission.
Sancho, A., García, G., 2006. ¿Qué Indica un Indicador? Análisis Comparativo en losDestinos Turísticos. Ver. Anál. Tur. 2, 69–85.
Sharpe, A. 2004. HYPERLINK “http://ideas.repec.org/p/sls/resrep/0403.html” LiteratureReview of Frameworksstudies for Macro-Indicators, Available at: HYPERLINK
“http://ideas.repec.org/s/sls/resrep.html” CSLS Research Reports 2004-03, Centrefor the Study of Living Standards.
Shmelev, S.E., Rodríguez-Labajos, B., 2009. Dynamic multidimensional assessment ofsustainability at the macro level: the case of Austria. Ecol. Econ. 68, 2560–2573.
Simon, U., Brüggemann, R., Pudenz, S., 2004. Aspects of decision support in watermanagement-example Berlin and Potsdam (Germany) I—spatially differentiatedevaluation. Water Res. 38, 1809–1816.
Singh, R.K., Murty, H.R., Gupta, S.K., Dikshit, A.K., 2007. Development of compositesustainability performance index for steel industry. Ecol. Econ. 7 (3), 565–588.
Spanish Institute of Tourism Studies (Instituto de Estudios Turísticos), 2008.Movimientos Turísticos en Fronteras (FRONTUR). Informe anual 2008. Ministeriode Industria, Turismo y Comercio, Madrid.
Spanish Ministry of Environment (Ministerio de Medio Ambiente), 2007. Estrategiapara la Sostenibilidad de la Costa. Ministerio de Medio Ambiente, Madrid.
Spanish Ministry of Tourism, Trade and Sports (Consejería de Turismo Comercio yDeportes), 2007. Plan General de Turismo Sostenible. Junta de Andalucía, Sevilla.
Tsaur, H.S., Lin, Y.C., Lin, J.H., 2006. Evaluating ecotourism sustainability from theintegrated perspective of resource, community and tourism. Tourism Manage. 27,640–653.
United Nations. 2001, Indicators of Sustainable Development: Guidelines andMethodologies. Available at: HYPERLINK “http://www.un.org” http://www.un.org.
World Tourism Organization, 1993. Tourism: The Year 2000 and Beyond QualitativeAspects, Discussion paper. World Tourism Organization.
World Tourism Organization, 1995. What Tourism Managers Need to Know: a PracticalGuide to the Development and Use of Indicators of Sustainable Tourism. Ed. WorldTourism Organization, Madrid.
World Tourism Organization, 2004. Indicators of Sustainable Development for TourismDestinations. A Guidebook. Ed. World Tourism Organization, Madrid.
Zheng, B., 1993. An axiomatic characterization of the Watts Poverty Index. Econ. Lett.42, 81–86.
Related Documents


![Utterance final /S/ in Andalusian Spanish. The phonetic ...elies.rediris.es/Language_Design/LD7/oneill_p151-166.pdf · phonetic resolution is the alveolar fricative [s], Andalusian](https://static.cupdf.com/doc/110x72/5f4217cfffab12582f5c3416/utterance-final-s-in-andalusian-spanish-the-phonetic-elies-phonetic-resolution.jpg)