GLYCEMIC INDICES OF FOODS IN ASSOCIATION WITH DIABETES AMONG RURAL WOMEN OF KENYA: CASE OF AMAGORO IN BUSIA COUNTY BY REBECCA AYA EBERE B.SC. (NAIROBI). M.SC. (LEEDS) A THESIS SUBMITTED IN FULFILLMENT OF THE REQUIREMENTS FOR THE DEGREE OF DOCTOR OF PHILOSOPHY IN PUBLIC HEALTH OF THE UNIVERSITY OF NAIROBI SCHOOL OF PUBLIC HEALTH 2019

Welcome message from author
This document is posted to help you gain knowledge. Please leave a comment to let me know what you think about it! Share it to your friends and learn new things together.
Transcript
GLYCEMIC INDICES OF FOODS IN ASSOCIATION WITH DIABETES AMONG
RURAL WOMEN OF KENYA: CASE OF AMAGORO IN BUSIA COUNTY
BY
REBECCA AYA EBERE B.SC. (NAIROBI). M.SC. (LEEDS)
A THESIS SUBMITTED IN FULFILLMENT OF THE REQUIREMENTS FOR THEDEGREE OF DOCTOR OF PHILOSOPHY IN PUBLIC HEALTH OF THE
UNIVERSITY OF NAIROBI
SCHOOL OF PUBLIC HEALTH
2019

ii
DECLARATION
THIS THESIS IS MY ORIGINAL WORK AND HAS NOT BEEN PRESENTED FOR A
DEGREE IN ANY OTHER UNIVERSITY.
Signature……………………………………… Date……………………………………
REBECCA AYA EBERE
Thesis submitted with our approval as University supervisors
1. ……………………………………………… Date…………………………….
Professor Violet N. Kimani
School of Public Health, University of Nairobi
2. ……………..……………………………………Date…………………………….
Professor Jasper K. Imungi
Department of Food Science, Nutrition and Technology, University of Nairobi

iii
DECLARATION OF ORIGINALITY
DECLARATION
1. I understand what Plagiarism is and I am aware of the University’s policy in this regard
2. I declare that this thesis is my original work and has not been submitted elsewhere for exami-
nation, award of a degree or publication. Where other people’s work or my own work has
been used, this has properly been acknowledged and referenced in accordance with the Uni-
versity of Nairobi’s requirements.
3. I have not sought or used the services of any professional agencies to produce this work.
4. I have not allowed, and shall not allow anyone to copy my work with the intention of passing
it off as his/her own work.
5. I understand that any false claim in respect of this work shall result in disciplinary action, in
accordance with University Plagiarism Policy.
Signature:
Date:
Name of Student: Rebecca Aya Ebere
Registration Number: H80/93763/2013
College: Medicine and Health Sciences
School: Public Health
Department: N/A
Course Name: PhD in Public Health
Title of the work: Glycemic Indices of Foods in Association with Diabetes in Rural Women
of Kenya: Case of Amagoro in Western Province

iv
ACKNOWLEDGEMENTS
I would like to thank my supervisors, Professors Violet N. Kimani and Jasper K. Imungi for
their guidance and encouragement all through from conceptualization of the idea, proposal
development, data collection, analysis, publication and the entire process of writing this thesis. I
am grateful for their input and support throughout this process. “Thank you very much”.
I also appreciate Meru University of Science and Technology for providing research grant to
carry out this research.
Special thanks to staff at Kocholya Sub-county Hospital, especially Ms. Evelyne Olubayi for
participating and introducing key informants in the facility to this study. I am grateful to the
staff at the University of Nairobi, Laboratory of Food Chemistry especially Mr. Jeremiah
M’thika, for his kind support in ensuring timely analyses of the food samples.
My gratitude also goes to all individuals in Amagoro division for participating in the survey,
focus group discussions, key informant interviews and glycemic index analyses and all others
who actualized my dream of writing this PhD thesis. My sincere appreciation also goes to
Phidellis Atte for her assistance throughout the data collection process, Dr. Eric Mworia for
proof reading my work and my colleague Mr. Munene Mbae for the support.
I am sincerely grateful to my dear husband Dr. Luke Okunya without whose support could not
accomplish my research. His encouragement and invaluable support are very much appreciated.

v
DEDICATION
This thesis is dedicated to my late mum Miriam Ebere who succumbed to diabetes just four
days after I defended this thesis and to my dad Benjamin Ebere, Brother David Onyapidi and
Sister Sella Omulepu all of whom are suffering from diabetes mellitus type 2. I believe the
contents of this thesis will assist them in making informed lifestyle choices in order to manage
the condition more effectively. I also extend this dedication to my dear husband Luke Okunya
and children Amani, Bahati, Ebere and Siyanja.
vi
TABLE OF CONTENTS
DECLARATION .......................................................................................................................................ii
DECLARATION OF ORIGINALITY...................................................................................................iii
ACKNOWLEDGEMENTS ..................................................................................................................... iv
DEDICATION ........................................................................................................................................... v
TABLE OF CONTENTS .........................................................................................................................vi
LIST OF TABLES..................................................................................................................................viii
LIST OF FIGURES.................................................................................................................................. ix
LIST OF ACRONYMS AND ABBREVIATIONS................................................................................. x
ABSTRACT ..............................................................................................................................................xi
CHAPTER 1: INTRODUCTION ............................................................................................................1
1.1 Background to the Study....................................................................................................................1
1.2 Statement of Research Problem.........................................................................................................3
1.3 Justification of the Study ...................................................................................................................4
1.4 Objectives of the Study......................................................................................................................5
1.5 Hypothesis .........................................................................................................................................5
CHAPTER 2: LITERATURE REVIEW ................................................................................................6
2.1 Introduction .......................................................................................................................................6
2.2 Global Prevalence of Diabetes Mellitus.............................................................................................7
2.3 Prevalence of Diabetes Mellitus in Kenya.........................................................................................8
2.4 Prevention and Management of Diabetes Mellitus ............................................................................8
2.5 Association of Diet with Diabetes Mellitus .....................................................................................10
2.6 Association of non-dietary factors with diabetes mellitus ...............................................................17
2.7 Reflective Comments on Association between Diabetes and Selected Risk Factors ......................22
CHAPTER 3: ASSOCIATION BETWEEN SOCIO-ECONOMY, NUTRITIONAL STATUS AND
DIABETES PREVALENCE AMONG WOMEN OF AMAGORO ...................................................23
3.1 Introduction .....................................................................................................................................24
3.2 Study Design and Methodology.......................................................................................................25
3.3 Results And Discussion ...................................................................................................................30
CHAPTER 4: DIETARY PATTERNS OF THE WOMEN OF AMAGORO...................................41
4.1 Introduction .....................................................................................................................................42
4.2 Study Design and Methodology.......................................................................................................44
4.3 Results and Discussion ....................................................................................................................48

vii
CHAPTER 5: GLYCEMIC INDICES OF CASSAVA AND SWEET POTATOES ........................60
5.1 Introduction .....................................................................................................................................61
5.2 Study Design and Methodology.......................................................................................................63
5.2 Results and Discussion ....................................................................................................................65
CHAPTER 6: EFFECT OF ACCOMPANIMENT ON GLYCEMIC RESPONSES OF THICK
PORRIDGE “UGALI” AND RICE .......................................................................................................70
6.1 Introduction .....................................................................................................................................71
6.2 Study Design and Methodology.......................................................................................................73
6.3 Results and Discussion ....................................................................................................................74
CHAPTER 7: GLYCEMIC RESPONSES TO DIFFERENT TYPES OF UGALI ...........................81
7.1 Introduction .....................................................................................................................................82
7.2 Study Design and Methodology.......................................................................................................84
7.3 Results and Discussion ....................................................................................................................85
CHAPTER 8: ASSOCIATION BETWEEN GLYCEMIC LOAD AND DIABETES MELLITUS:
CASE OF AMAGORO DIVISION OF WESTERN KENYA.............................................................90
8.1 Introduction .....................................................................................................................................91
8.2 Study Design and Methodology.......................................................................................................92
8.3 Results and Discussion ....................................................................................................................95
CHAPTER 9: GENERAL DISCUSSION ...........................................................................................103
CHAPTER 10: CONCLUSIONS AND RECOMMENDATIONS....................................................105
10.1 Conclusions .................................................................................................................................105
10.2 Recommendations........................................................................................................................105
References ..............................................................................................................................................107
Appendices .............................................................................................................................................129
Appendix 1: Ethical Clearance ............................................................................................................129
Appendix 2: Household Survey Questionnaire....................................................................................130
Appendix 3: Focus Group Discussion Moderator’s Guide .................................................................135
Appendix 4: Key Informant Interview Moderator’s Guide .................................................................137
Appendix 5: Informed Consent Forms ................................................................................................139
Appendix 6: Map of Teso District........................................................................................................150

viii
LIST OF TABLES
Table 1: Distribution of participants with regard to socio-demographic characteristics............ 32
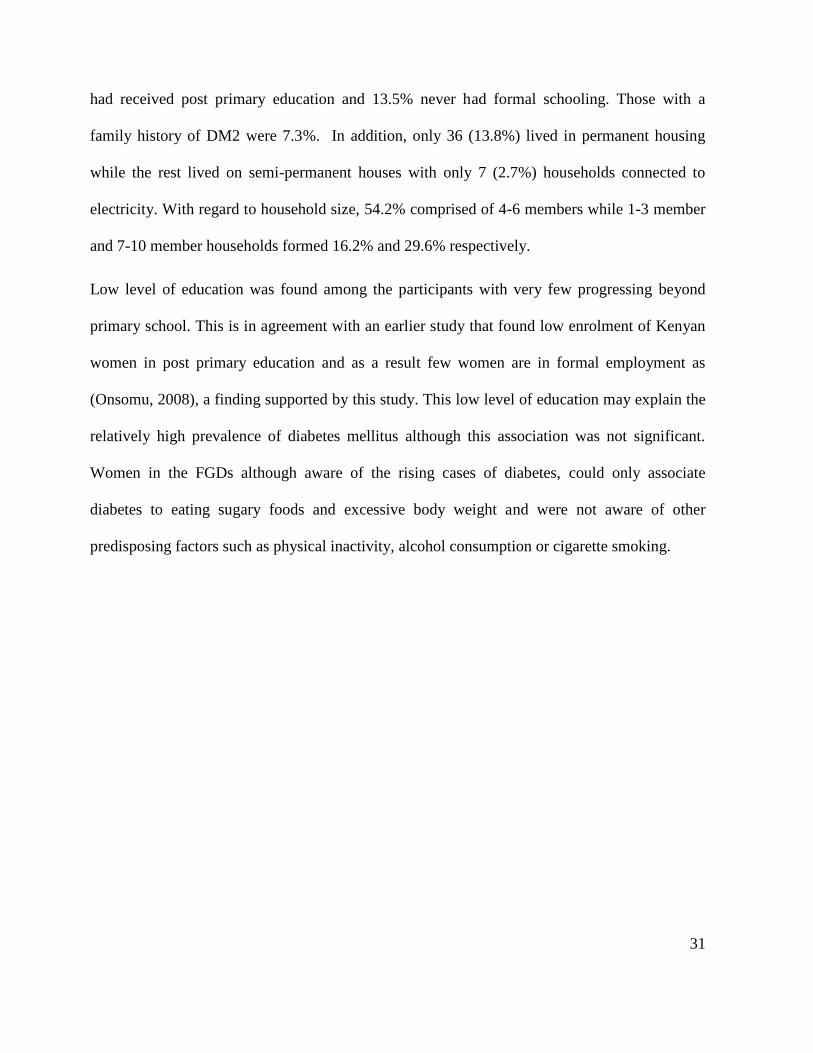
Table 2: Distribution of participants according to socio-economic characteristics ................... 33
Table 3: Distribution of participants according to nutritional status .......................................... 34
Table 4: Distribution of the participants by socio-demography and diabetes ............................ 35
Table 5: Distribution of participants by socio-economic characteristics and diabetes .............. 36
Table 6: Distribution of the participants by nutritional status and diabetes ............................... 37
Table 7: Results of univariate logistic regression for diabetes mellitus ..................................... 38
Table 8: Results of multivariate logistic regression for diabetes mellitus.................................. 39
Table 9: Individuals consuming different foods on a frequency of daily, weekly and monthly 48
Table 10: Individuals consuming various food groups on a daily, weekly and monthly basis .. 49
Table 11: Average portion sizes of some foods consumed in Amagoro .................................... 56
Table 12: Proximate composition and energy values for selected ready to eat foods................ 58
Table 13: Glycemic indices and glycemic loads of cassava and sweet potato........................... 67
Table 14: Preparation of various test foods ................................................................................ 73
Table 15: Proximate composition of the meals (% mean ± standard deviation) ........................ 74
Table 16: Food ration sizes, glycemic indices (GI) and glycemic loads (GL) of the meals ...... 77
Table 17: Preparation of test meals ............................................................................................ 84
Table 18: Incremental area under curve for various test foods and reference food ................... 86
Table 19: Glycemic indices and glycemic loads of the meals.................................................... 87
Table 20: Socio-economic characteristics of the household survey participants ....................... 96
Table 21: Behavioral characteristics of participants .................................................................. 97
Table 22: Clinical characteristics of the participants ................................................................. 98
Table 23: Glycemic load of the test meals ................................................................................. 98
Table 24: Distribution of participants by total glycemic load in relation to diabetes status ...... 99
Table 25: Multivariate regression results for participants characteristics in relation to DM2 . 100
ix
LIST OF FIGURES
Figure 1: Average consumption of various food groups............................................................ 51
Figure 2: Blood glucose response curves for cassava, sweet potato and glucose ...................... 66
Figure 3: Average blood sugar responses to ugali meals........................................................... 75
Figure 4: Average blood sugar responses to rice meals ............................................................. 75
Figure 5: Blood response curves for test meals in relation to glucose ....................................... 85
x
LIST OF ACRONYMS AND ABBREVIATIONS
ADA: American Diabetes Association
AOAC: Association of Analytical Chemists
BMI: Body Mass Index
DM1: Diabetes Mellitus Type 1
DM2: Diabetes Mellitus Type 2
DMI: Diabetes Management and Information Centre
FAO: Food and Agriculture Organization
FFQ: Food Frequency Questionnaire
FGDs: Focus Group Discussions
GI: Glycemic Index
GL: Glycemic Load
HH: Household(s)
IAUC: Incremental Area Under the Curve
IDF: International Diabetes Federation
KII: Key Informant Interview
MiMW: Mjota (Medical Journal of Therapeutics Africa) institute of Medical Writing
MoPHS: Ministry of Public Health and Sanitation of the Government of Kenya
SPSS: Statistical Package for Social Sciences
USDA: United States, Department of Agriculture
WC: Waist Circumference
WHO: World Health Organization
WHR: Waist to Hip Ratio

xi
ABSTRACT
Diabetes mellitus is a chronic medical condition in which a person’s sugar level rises above the
normal. This disease has become quite prevalent worldwide. In the year 2018, more than 500
million people were suffering from diabetes mellitus type-2 (DM2) worldwide. In 2010, an
estimated seven million cases of diabetes were found in Africa. This figure was predicted to rise
to over 18 million by the year 2030. In Kenya, an estimated 1.2 million Kenyans suffer from the
disease. This has been projected to rise to 1.5 million by the year 2025. Although DM2 is
determined primarily by genes and lifestyle, it has been strongly linked to dietary patterns.
However data linking DM2 and Glycemic index (GI) in Kenya remain scarce. Generally, foods
with high GI are more likely to lead to a high prevalence of DM2 than foods with low GI. Some
studies done in Kenya have indicated relationship between local diets and diabetes. However
these studies were hospital-based and not community-based and they did not identify the GI of
locally consumed foods and link with DM2. The objective of this study was therefore to assess
the glycemic indices of the staple foods consumed by women in a rural population and establish
the association of the glycemic load (GL) of foods with DM2. The study was cross sectional in
design with analytical components that generated both qualitative and quantitative data. The
survey involved 260 women participants aged 15-90 years, GI, focus group discussions (FGDs)
and key informant interviews (KIIs) involved a total of 12, 45 and 15 participants respectively.
Initially, FGDs and KIIs were conducted to establish community’s knowledge and self-
perceptions to foods associated with diabetes and to generate a food list that was used in
designing a structured food frequency questionnaire (FFQ). The survey was conducted using a
pre-tested questionnaire; FGD and KII guide were used to guide the FGDs and KIIs while the
GI and proximate composition of foods were determined using standard procedures. The

xii
analytical components included proximate analyses of the foods and determination of glycemic
indices (GIs). The GI of various foods was used to calculate the glycemic load (GL). Data were
analysed using Microsoft Excel and Statistical Package for Social Sciences. Descriptive
statistics were used to analyze and characterize the sample. The data was presented by absolute
frequencies and percentages. A chi-square analysis was used to compare the categories of DM2
with other variables. Multivariate logistic regression was used to identify the magnitude of
independent variable. Linear regression with mixed-effects was used to establish the differences
between GIs of different foods. Results showed that the prevalence of DM2 was 16.9%. The GI
of the foods followed the order: Cassava and sorghum Ugali with silver fish > rice plain >
cassava > whole maize ugali with beef > whole maize ugali with silver fish = cassava-sorghum
ugali and cowpea leaves = rice with beef > sweet potato > whole maize ugali = rice and beans >
whole maize ugali with cowpea leaves > beans plain. The glycemic indices of various ugali
meals were significantly different (p<0.05). Women consuming a GL of >840 were 1.36 times
more likely to suffer from DM2 as opposed to those who consumed a moderate load although
this association was not significant (p>0.05). The study concluded that there was no significant
association between glycemic index and diabetes among rural women of Amagoro. Cowpea
leaves and beans have the potential of lowering the GI of staple foods consumed alongside.
Alcohol consumption and physical activity were the strongest independent risk factors for DM2
in this study population. This calls for need to create awareness and sensitize the population on
these predisposing factors.
1
CHAPTER 1: INTRODUCTION
1.1 BACKGROUND TO THE STUDY
Diabetes mellitus is a chronic medical condition in which a person’s sugar level rises above the
normal. This results in symptoms such as hunger, thirst and frequent urination (Ripsin et al.,
2009). It happens because under normal circumstances, food that is consumed is broken down
into glucose which is later taken up into the bloodstream to serve as a source of energy. This
process is facilitated by a hormone known as insulin produced by the pancreas. Contrary to this,
among diabetics three things might be happening: the pancreas usually fails to produce enough
insulin; the body cells fail to respond to the insulin or both scenarios occur thereby resulting in
excessive sugar accumulation in the blood. Consequently, the excess sugar may damage the
nerves and blood vessels which may result in amputation, blindness, renal failure, infertility
among men, heart disease and stroke (American Diabetes Association (ADA), 2004; Majaliwa
et al., 2008).
There are three major types of diabetes mellitus namely, gestational diabetes (GD), Diabetes
Mellitus Type 1 (DM1) and Diabetes Mellitus Type 2 (DM2). GD mainly develops during
pregnancy in women, even those who previously had no diabetes. This type usually disappears
after a woman gives birth. DM1 normally occurs due to lack of insulin secretion from the
pancreas, while DM2 develops when the body cannot utilize the insulin effectively or when the
insulin produced is too little to metabolize the blood sugar effectively (ADA, 2004).
Even though in a minority of the patients, diabetes could be a result of genetic disorder that one
inherits from parents (Herder and Roden, 2011), recent studies show that it is largely developed
as a result of the lifestyle of an individual. For example, lack of physical activity, excessive

2
consumption of alcohol and smoking of cigarettes are associated with the development of
diabetes (Ripsin, et al., 2009).
Although data on diabetes remains scanty in Kenya, (Maina, 2011) it is eminently becoming
prevalent and varies among the different ethnic groups (Christensen et al., 2009) and regions
(Chege, 2016; Ayah et al., 2013; El-busaidy et al., 2014). A recent study conducted in a rural
population in Northern Kenya reported a relatively high prevalence at 16% (El-busaidy et al.,
2014).
Until recently, the main interventions in diabetes management have been curative in nature.
Basically, the patients are usually prescribed insulin and related drugs as a remedy coupled with
some nutritional advice (MiMW), 2008). Today, lifestyle interventions in diabetes are favored
over medical interventions. As a result, experts in the medical field have deliberately advocated
the need to educate and empower patients and the public about the knowledge and resources
that can facilitate self-care in diabetes. The major drive is geared towards getting people to
change their lifestyle by participating more in physical activities, consuming less alcohol and
cigarettes and consuming diet that reduce the chances of developing high blood sugar levels
such as whole grains and vegetable rich diets. Apart from the need to be more physically
active, the current preventive approach to diabetes management is driven by the need to
consume a healthy diet (Otieno et al., 2003).
Despite positive potential of these strategies, several challenges are hindering their success in
preventing and managing diabetes. The main challenge is that these strategies are largely not
affordable by ordinary citizens. For example, insulin requires refrigeration yet refrigerators are
not ordinarily available in Kenya (McFerran, 2008). At the same time, specially selected diets
3
and facilities for sports activities are too expensive for ordinary people (MiMW, 2008)
considering that more than 56% of Kenyans live below the poverty line; living on less than one
dollar per day (Ministry of Health, 2005).
This study therefore investigated the association between diet, especially glycemic indices of
foods and DM2 in Amagoro division of Busia County in Western Province of Kenya. The
inhabitants of Amagoro who are mainly of the Iteso ethnic group consume mainly starchy diets
with small amount of accompaniment (Karp and Karp, 1977). Starch is known to have a direct
influence on blood sugar while alcohol is a known risk factor to DM2. Amagoro division was
purposively selected because it has a relatively high prevalence of diabetes mellitus. A visit to
Kocholya Sub-County hospital and Alupe Sub-District hospitals showed that diabetes is a major
health problem in the division. In these hospitals, many suspected cases that were referred to the
laboratory to test for blood sugar turned out to be positive for diabetes or pre-diabetes.
1.2 STATEMENT OF RESEARCH PROBLEM
Diabetes mellitus type 2 (DM2) is becoming a widespread problem in Kenya (Otieno, 2007;
McFerran, 2008; MoPHS, 2005). It causes human suffering and is also an economic burden
(Kimani, 2007; Atieno, 2006; Otieno, 2007).
Presently, the Government relies heavily on medical interventions to manage diabetes, among
them insulin and other oral hypoglycemic agents. Unfortunately these medications are
expensive for a majority of Kenyans (MiMW, 2008) and require refrigeration which most
patients cannot afford (Kimani, 2007; MiMW, 2008). Thus investing in preventive strategies in
diabetes prevention and management would be cost effective and more beneficial to the public.

4
The main risk factors for diabetes in Kenya include unhealthy diet, obesity and inadequate
physical activity (Atieno, 2006; Ripsin et al, 2009; MoPHS, 2005). Carbohydrate-rich foods are
directly linked to blood sugar level and may pose risk for DM2. The impact of these foods on
sugar level is determined by GI and GL. The respective GI of a given carbohydrate further
depends on whether it is consumed on its own or in a meal. Dietary intervention has been
advocated to prevent and manage DM by recommending certain carbohydrate foods (Wanjala et
al., 2016). However the GI of a majority of these foods has not been documented and the direct
role of GI in development of diabetes remain obscure (Omoregie and Osagie, 2008). Residents
of Amagoro rely mainly on a starchy staple food (ugali) consumed with an accompaniment
(Karp and Karp 1977) despite limited knowledge on their GI. This study therefore investigated
the risks foods consumed in Amagoro pose for DM2.
1.3 JUSTIFICATION OF THE STUDY
Diabetes is becoming a major health problem in the developing world including Kenya.
Through this study, knowledge on GI of foods will provide better guidance on promotion of
local foods to the community with regard to prevention and management of DM2. Additionally,
information on GI/GL will be of use to health professionals and general public with regard to
DM prevention and management. This study will also improve knowledge in areas of clinical
nutrition and food science both in theory and research methodology and the policy makers can
develop guidelines on diet, agriculture and health that reduce DM2 risk in rural areas. The
knowledge generated from this study will also help the community realize the magnitude of
DM2 so that they can be receptive to intervention programs.
5
1.4 OBJECTIVES OF THE STUDY
1.4.1 Main Objective
To assess the association between glycemic indices of foods and diabetes mellitus type-2 among
rural women in Amagoro Division of Busia County in Western Kenya
1.4.2 Specific Objectives
1. To determine socio-demographic and socio-economic characteristics of the households.
2. To determine the food consumption patterns of the respondents.
3. To evaluate the nutritional status of the respondents.
4. To determine the glycemic indices and glycemic loads of selected foods.
1.5 HYPOTHESIS
There is an association between glycemic indices of foodstuff and diabetes mellitus among rural
women in Amagoro.

6
CHAPTER 2: LITERATURE REVIEW
2.1 INTRODUCTION
Diabetes mellitus is a chronic medical condition whereby a person’s blood sugar level rises
above the normal. Normal blood glucose may be indicated by fasting plasma glucose (FPG)
levels of <110 mg/dl (6.1 mmol/l) or a glucose tolerance test value of <140 mg/dl (7.8 mmol/l).
A random plasma glucose level >160 mg/dl (8.9 mmol/l) is considered a positive test result.
The diagnosis of diabetes is done through additional re-testing using FPG test or oral glucose
tolerance test performed later on (ADA, 2012; ADA, 2000).
Diabetes mellitus results in symptoms such as hunger, frequent urination and thirst (Ripsin et
al., 2009). It happens because under normal circumstances, food that is consumed is broken
down into glucose which is later taken up into the bloodstream to serve as a source of energy.
This process is facilitated by a hormone known as insulin produced by the pancreas. Among
diabetics three things might be happening: the pancreas usually fails to produce enough insulin;
the body cells fail to respond to the insulin or both thereby resulting in excessive sugar
accumulation in the blood. The excess sugar damages blood vessels and nerves which may lead
to amputation, blindness, renal failure, impotence among men and vascular diseases including
heart disease and stroke (ADA, 2004; Majaliwa et al., 2008).
There are three major types of diabetes mellitus namely, gestational diabetes (GD), diabetes
mellitus type 1(DM1) and diabetes mellitus type 2 (DM2). GD mainly occurs during pregnancy,
even in women without any previous history of diabetes and usually disappears after giving
birth. DM1 occurs normally due to lack of insulin secretion while DM2 usually develops when
7
an individual’s body cells cannot utilize the insulin hormone effectively or when the hormone
produced is inadequate for effective metabolism (ADA, 2004).
Even though in a minority of the patients, diabetes could be as a result of genetic disorder
acquired through inheritance (Herder and Roden, 2011), studies also show that it is largely
developed as a result of the lifestyle of an individual. For instance lack of physical exercise,
excessive consumption of alcohol and smoking of cigarettes have been linked to the
development of diabetes (Ripsin, et al., 2009).
2.2 GLOBAL PREVALENCE OF DIABETES MELLITUS
The prevalence of diabetes mellitus is rapidly rising. The worldwide diabetes prevalence was
estimated at 2.8 % in 2000 and projected to rise above 4.4 % by the year 2030 (Wild et al.,
2004). By the year 2011, the prevalence was estimated at 4.5% and it is now projected to reach
4.9% by the year 2030. According to International Diabetes Federation (IDF, 2017) 425 million
were suffering from diabetes mellitus. In the year 2018 there were more than 500 million people
suffering from diabetes mellitus type-2 (DM2) globally (Kaiser, Zhang and Van Der Pluijm,
2018). The prevalence is projected to increase with the highest growth expected in developing
countries despite the fact that most of these countries lack sufficient diabetes diagnostic and
monitoring tools (Hall et al., 2011; IDF Diabetes Atlas., 2011). In addition to diabetes,
impaired glucose tolerance, is also a major public health problem and if not treated, may
develop to DM2 (IDF, 2011).
An estimated 15.5 million adults aged 20-79 years were living with diabetes in the Africa
region by the year 2017 (IDF, 2017). In Africa an estimated 78 % of people with diabetes are
undiagnosed, and over 90 % of diabetic cases in Sub-Saharan Africa are of type 2 (DM2) (IDF,

8
2011). Amongst these countries, urban Kenya had the highest prevalence of 12 %, while rural
Uganda had the lowest prevalence of 1 % (Dalal et al., 2011). However a recent study
conducted in Isiolo town located in Northern Kenya reported a prevalence of 16 % and has
elicited great interest (El-busaidy et al., 2014. Nonetheless, there are limited epidemiologic
studies in Sub-Saharan Africa (Dalal et al., 2011).
2.3 PREVALENCE OF DIABETES MELLITUS IN KENYA
Although data remains scanty (Maina, 2011) diabetes is becoming rampant in Kenya (El-
busaidy et al., 2014). The exact number of people living with the disease is unknown and the
available data is limited to a few regions although the prevalence countrywide was estimated at
3.3 % with actual prevalence ranging between 2.7 % (rural) and 10.7 % (urban) (Diabetes
Management and Information Centre (DMI centre), personal communication, 2013). A
prevalence of 5.3% has been reported in Nairobi’s Kibera slums with prevalence higher in
women than men (Ayah et al., 2013). Also, a prevalence of 4.8 % and 4.0 % in women and men
respectively was reported in Nairobi’s Korogocho and Kibera slums (Oti et al., 2013) and 6.6
% in Nakuru (Mathenge et al., 2010). A recent study in Isiolo County, located in Northern
Kenya also revealed a relatively high prevalence at 16 % (El-busaidy et al., 2014).
2.4 PREVENTION AND MANAGEMENT OF DIABETES MELLITUS
Diabetes management aims at keeping glucose levels in the blood closer to the normal levels as
much as possible. This involves changes in diet, exercise and use of treatment drugs (ADA,
2010). However many diabetic patients cannot afford the treatment due to the high cost
resulting in the high mortality and prevalence of complications experienced especially in Sub-
Saharan Africa (Hall et al., 2011). Since many persons with DM2 are insulin resistant and
9
overweight, the initial therapy involves a healthy diet, weight reduction and physical activity
(Dedoussis et al., 2007; Mozaffarian et al., 2009; ADA, 2010; IDF, 2011). In addition, diabetes
management also involves limiting alcohol consumption; avoiding cigarette smoking; regular
monitoring for associated complications including eye and foot checks, blood sugar and
pressure controls and checking risks for kidney and cardiovascular diseases (IDF, 2011).
Since the associated complications are expensive as well as difficult to treat, the best option is
to adequately maintain blood sugar levels (Colberg et al., 2010). This can be achieved by
maintaining a healthy diet, body weight and physical activity although treatment may require
oral glucose-lowering agents and/or insulin injection in addition to these lifestyle changes
(ADA, 2010). For instance, a healthy lifestyle involving walking for at least 30 minutes
regularly per day reduces the DM2 risk by 35 to 40% (IDF Diabetes Atlas, 2011). Other
interventions that can prevent and control diabetes and associated complications include regular
screening and health education.
The Kenyan government is facing a number of challenges with regard to diabetes prevention
and management. These include lack of routine screening as a result of limited resources
leading to many undiagnosed cases; inadequately trained health care workers and lack of
necessary equipment to effectively manage diabetes and its complications coupled with low
public awareness (Ministry of Public Health and Sanitation (MoPHS), 2005). Also, population-
based data on the burden, trends and effective practices for controlling diabetes is lacking
(MoPHS, 2005). For example, nutrition education is important in facilitating the adoption of a
lower glycemic index (GI) diet by diabetes individuals (Miller et al., 2009) but the GI of most
traditional foods consumed by Kenyans remains unknown.
10
Until recently, the main interventions in the diabetes management have been curative in nature.
Basically, the patients are usually prescribed insulin as a remedy coupled with some nutritional
advice on the kind of diet to take in order to avoid raising blood sugar level (MiMW, 2008).
Despite their potential positive effect, these strategies are meeting several challenges that hinder
their success in preventing diabetes. The main one is that these strategies are largely not
affordable by ordinary citizens. For example, insulin requires refrigeration yet refrigerators are
not ordinarily available in Kenya (McFerran, 2008). At the same time, specially selected diets
may be too expensive for ordinary people (MiMW, 2008) considering that a majority of
Kenyans are poor (MoH, 2005; El-busaidy et al., 2014). This means that even though as a result
of poverty people might still be taking part in physically demanding activities to facilitate their
livelihoods such as digging, cycling and walking long distances, it is highly likely that due to
poverty their dietary consumption does not take into account the potential risk of diabetes it
exposes them to.
This study therefore investigated the association between diet and diabetes mellitus type-2
(DM2) in Amagoro division of Busia County in Kenya. Blood sugar levels usually rise in
response to a carbohydrate-rich meal since the carbohydrates are the preferred energy source for
the body. Thus, it is the carbohydrates in the diet that are directly linked to the blood sugar
levels (Jenkins et al., 1981) although there are several other factors that may moderate the
carbohydrate’s effect on blood sugar levels.
2.5 ASSOCIATION OF DIET WITH DIABETES MELLITUS
A variety of food consumption/dietary patterns have been associated with increased diabetes
risk. These include regular consumption of sugar-sweetened soft drinks and fruit drinks (Palmer
11
et al., 2008; Forouhi et al., 2018), consumption of meat (Banard et al., 2014) especially
processed red meat and refined grains (Forouhi et al., 2018). On the other hand patterns of food
intake that are high in vegetables, fruit, whole grains, legumes, nuts, and dairy products have
been promoted for prevention and management of diabetes mellitus (Forouhi et al., 2018).
Other diets found to reduce the risk of diabetes are vegetarian diet (Chiu et al., 2018) and low-
carbohydrate diet (Nanri et al., 2015).
Despite the various dietary patterns, the major influential component of the diet is
carbohydrates since it comprises 40 to 80 % of the total food intake and contributes 70 % to 80
% of the calories consumed (Fennema, 1996). Carbohydrates influence satiety and help in
maintaining blood sugar by influencing glycemic response and insulin metabolism (FAO/WHO,
1998). A high glycemic load (GL) from dietary carbohydrates increases diabetes and heart
disease risk (Liu et al., 2000; Choudhary, 2004; FAO/WHO, 1998). Therefore understanding
this connection would be useful considering the fact that previous studies have shown that
various carbohydrates differ in physico-chemical properties which affect their degradation rate
and bio-availability (Englyst et al., 1999). Similarly, the consumption of carbohydrates together
with other macronutrients such as proteins is likely to influence the carbohydrate effect on
blood sugar level (van Loon et al., 2003). Although dietary supplements have been used to fight
obesity and in the regulation of glucose for diabetic patients (Brennan, 2005), the use of dietary
intervention cannot be ignored.
Carbohydrate foods are made up of sugars and starches both of which are metabolized into
glucose which then enters the bloodstream. High starch diets that are low in fiber are linked to a
higher risk of DM2 (AlEssa et al., 2015). As opposed to sucrose and starch, glucose and
fructose sugars are inversely associated with the risk of diabetes (Ahmadi-Abhari et al., 2014).

12
Studies have shown a positive relation between the rate of degradation of carbohydrate during
digestion and the regulation of blood sugar and insulin level (Brennan, 2005). The rate at which
these carbohydrates are broken down to glucose as indicated by the glycemic index is of
particular importance with regard to blood sugar regulation. Thus most important aspect of diet
with regard to hyperglycemia is the glycemic index and glycemic load of the specific foods.
2.5.1 Glycemic Index and Glycemic Load
The term glycemic index (GI) was first introduced by Jenkins et al (1981) to classify
carbohydrates on the basis of blood glucose response after ingestion. GI is computed by
dividing the area under the blood glucose response curve above the fasting blood sugar level
after consuming 50 g available carbohydrates from a test food by area under the blood glucose
response curve above the fasting level after consuming 50 g available carbohydrates from a
standard or reference food and multiplying the resulting value by 100. The reference or standard
food is usually white bread or glucose and is normally assigned a GI of 100 (FAO/WHO, 1998).
Since dietary fibre resists digestion and absorption in the small intestine, they are not included
when calculating the 50 g carbohydrate portion to be administered (FAO/WHO, 1998). The GI
therefore measures the glycemic response to 50 g available carbohydrate of a test food relative
to an equal amount of glucose or white bread. This is because the glycemic response to a
carbohydrate-rich food has been found to increase linearly with the increase in the amounts of
carbohydrate up to about 50 g then it levels off (Pi-Sunyer 2002, Wolever, 2003). Nonetheless
25 g available carbohydrate may be used especially if the portion size providing this amount of
carbohydrates tends to be large (Aston et al., 2008).
13
The knowledge of GI has been valuable in evaluating whether particular foodstuffs pose a
higher or lower diabetes risk and thereby help in managing DM2. Thus foods have been
categorized into low (<55), medium (55-70) and high (>70) GI with glucose as a standard or
values of <60, 60-85 and >85 representing low, medium and high GI respectively with white
bread as a standard or reference food (Beals, 2005). High GI foods result in a greater blood
glucose response as opposed to low GI foods (Foster-Powell et al., 2002). However, consuming
a high GI food alongside a low GI food may reduce the overall blood glucose response of a high
GI food. For example, the GI of rice has been reduced by vinegar, beans and dairy products
when consumed together (Sugiyama et al., 2003).
Glycemic Load (GL) on the other hand has been suggested as an alternative and better measure
for blood sugar response. The glycemic load (GL) accounts for both the quality as measured
using GI and amount of food consumed (serving size). This means that foodstuff can have a
high GI, but only consumed in small amounts in normal circumstances which does not
significantly raise the blood sugar; while on the other hand foods possessing low GI may be
consumed in large quantities resulting in elevated blood sugar level. Thus, some high GI foods
are actually low on the GL and vice versa. The GL is computed by multiplying the amount of
available carbohydrate in the diet with the GI of the food and dividing the resulting value by
100 (Foster-Powell et al., 2002). GL = GI/100 x Available carbohydrates (total dietary
carbohydrates - dietary fiber). Using this approach, the foods can be classified into low (1-10),
medium (11-19) and high (≥20) GL (Foster-Powell., 2002).
2.5.2 Methods for Measuring the Glycemic Index
The GI of food has generally been accepted and proven to be very useful in the classification of
carbohydrate in relation to health. Two main approaches, namely, in vitro and in vivo, have

14
been used. The in vitro method mimics the human digestive system by employing the use of
necessary digestive enzymes and activities such as mastication by use of homogenization,
grinding etc in a laboratory setting. This method has been suggested to be cheap and quick
(Englyst et al., 1999, Foster-Powell et al., 2002) producing reliable results which are
comparable to the in vivo (Araya, 2003; Brouns et al., 2005; Englyst et al., 1999). However,
other studies do not agree that the in vitro method produce reliable indications of the metabolic
behaviour of carbohydrate-rich foodstuff (Bjorck et al., 1994; Foster-Powell et al., 2002). This
is because some of the factors that influence the GI in vivo such as gastric emptying and the
effect of hormones are not accounted for (Berti et al., 2004). The effect of proteins, fat or
dietary fibre which affects gastric emptying may not be mimicked in vitro and human trials
therefore remains the gold standard for GI measurement (Foster-Powell et al., 2002).
The in vivo approach involves feeding of test-foods to human subjects and measuring their
blood glucose within two hours of digestion. Capillary blood sampling has been recommended
for measuring the GI whereby fasting blood glucose is taken from a finger-prick after a 10-12
hour fast (in the morning), immediately before the test meal is administered, then every 15
minutes after the test meal has been given for 1 hour and thereafter every 30 minutes for the
next 1 hour (Wolever, 2003). Despite being more precise than in vitro method, in vivo method
has its own shortcomings too which influence the result. The GI thus is influenced by a number
of factors as discussed below.
2.5.3 Factors Affecting the Glycemic Index of Foodstuff
The GI of a carbohydrate-rich food can vary depending on a number of factors. Some of these
factors are briefly explained below and they include those related and unrelated to the food
itself.

15
a) Food related factors
Nature of carbohydrates
Carbohydrates differ in their physical and chemical properties and this influences their rate of
degradation (Engyst et al., 1999; Lovegrove et al., 2017). Starch is composed mainly of
amylose and amylopectin, and the ratios of these components influence the physico-chemical
properties of starch and hence its digestibility and bioavailability (Lovegrove et al., 2017).
Amylose for example form secondary structures that are difficult to disperse hence digested
slowly than amylopectin (Thorne et al., 1983; Lovegrove et al., 2017). However, processing
may reduce the effect of amylose: amylopectin ratio in some foods with the exception of very
high-amylose starches (Gallant et al., 1992). Foods composed of gelatinized starches or free
sugars are rapidly digested and absorbed (Englyst et al., 2003). The nature of the
monosaccharide components also influences the GI with glucose and fructose being
metabolised differently (Bray et al., 2004).
Fibre-rich foods generally have a low glycemic index (GI) (Riccardi et al., 2008) because fibre
creates a physical barrier limiting the access of amylolytic enzymes to starch (Vahouny and
Kritchevsky, 1986). Thus dietary fibre intake has the potential to reduce diabetes risk (Feldman
et al., 2017).
(b) Presence of other macronutrients
Generally people consume mixed meals consisting of more than one macronutrient (Beals,
2005). Research has shown that the higher the proportion of carbohydrate in a specific food
relative to protein and fat, the higher the GI. This is because protein or fat increase insulin
response thereby reducing glycemic response (Pi-Sunyer, 2002). However, the addition of
protein or fat may be undesirable since they increase the overall energy content of the food
16
(Beals, 2005). The GI of mixed meals will therefore vary depending on the proportions of each
of these macronutrients despite the fact that minimal research has been conducted on such
meals (Araya, 2003). Although some researchers have recommended calculating the GI of a
meal from the GI of the individual foods, the use of such calculated values remain controversial
(Beals, 2005) and research is now focusing on determining the GI of foods in the combinations
they are consumed in normal circumstances (Ruhembe et al., 2014).
(c) Presence of micronutrients
Micronutrients including antioxidants, chromium, zinc and herbal supplements have been
shown to improve diabetes control (Fowler, 2007). The risk of DM2 has be reduced by intake of
zinc (Sun et al., 2009), calcium (Villegas et al., 2009), magnesium (Schulze et al., 2007;
Lopez-Ridaura et al., 2004; Villegas et al., 2009; Hopping et al., 2010; Kirii et al., 2010; Dong
et al., 2011; Murakami et al., 2005) and vitamin D (Penckofer et al., 2008) while high iron
(Lee et al., 2004; Murakami et al., 2005) and selenium (Stranges et al., 2010) have been
associated with a higher risk.
(d) Food preparation, processing and storage
Food preparation and processing greatly influence the GI (Aston et al., 2008). Cooking affects
the degradation of carbohydrate-rich foods (Lovegrove et al., 2017). For example, the low GI of
raw potato has been known to increase on cooking because of improved digestibility as a result
of starch gelatinization (Pi-Sunyer, 2002). When it cools, resistant starch forms which lower the
GI (Beals, 2005) and the rate of digestion further decreases on storage (Agama-Acevedo et al.,
2005).
17
(e) Ripeness and particle size
The ripeness and particle size of a foodstuff greatly affects its GI. When a fruit ripens, starch is
converted to sugar which has lower GI (Pi-Sunyer, 2002). Reducing the foods particle size
increases the surface area for enzyme action and consequently resulting in a rise in the GI
(Araya, 2003; Aston et al., 2008).
(f) Other factors
Other factors include subject variation and the time of the day that the GI is measured.
Glycemic responses vary both between subjects and within a subject to the same test food
measured in separate occasions (Wolever, 2003). The time of day when the glycemic response
is measured affects the GI. For example when measured in the morning or at midday (Beals,
2005; Pi-Sunyer 2002) as well as the foods consumed earlier. Legumes or whole grains
consumed at breakfast decreases glycemic response at lunch and/or dinner while consumption
of the same at dinner reduces the response at breakfast the following morning (Higgins, 2012).
Nonetheless studies seem to agree on carrying out the tests in the morning after an overnight
fast (10-12 hours) to reduce the effect of the previous meal on the GI of the test food
(FAO/WHO, 1998).
2.6 ASSOCIATION OF NON-DIETARY FACTORS WITH DIABETES MELLITUS
According to the Kenya Ministry of Public Health and Sanitation, Kenya National Diabetes
Strategy of 2010; the key risk factors to DM2 in the country included unhealthy diet, obesity
and physical inactivity. Others are smoking cigarettes, excessive alcohol consumption, genetics,
age, stress, chronic steroid use, socio-economic status, high blood pressure among others

18
(MoPHS, 2005). There is a greater chance of individuals developing diabetes when they have
many of such predisposing risk factors.
2.6.1 Clinical and Genetic Factors
Clinical factors are influenced by a combination of genetic and other lifestyle factors (Mathers
et al., 2010). Blood pressure, excessive weight, polycystic ovary syndrome and use of steroids
are briefly discussed in this section. Hypertension which exists when blood pressure is equal or
greater than 140/90 mmHg is a common condition in people suffering from diabetes and it
affects 20 to 60% of diabetic patients. Those with hypertension and possess excessive weight
are at a greater risk of diabetes irrespective of their age (Weycker et al., 2008; Zanella et al.,
2001; ADA, 2002; Chege, 2016). Moderate sodium restriction reduces blood pressure in
hypertensive individuals (ADA, 2002) as well as weight loss and physical activity (Zanella et
al., 2001; ADA, 2002).
Cases of overweight (BMI of 25 to 30 kg/m2) and obesity (BMI ≥ 30 kg/m2) are rising rapidly
worldwide and especially in developing countries (Hjartåker et al., 2008). Obesity is a risk fac-
tor in diabetes because the fatty tissue causes body cells to be resistant to insulin (Hussain et al.,
2010). However, even lean subjects can develop insulin resistance if they accumulate ab-
dominal fat (Kahn et al., 2001).
Polycystic ovary syndrome is a common condition in women of child-bearing age and it
increases the risk of DM2 (Gambineri et al., 2012; Moran et al., 2010). Long-term steroid use
may also increase diabetes risk and interfere with its control (Faul et al., 1998; Blackburn et al.,
2002).

19
Genetic factors also play a major role in the development of DM2. Even in Kenya where the
population is predominantly Africans, the prevalence differs among the 42 tribes (Christensen et
al., 2009). The risk of diabetes is even higher if a parent or sibling has DM2 (Dedoussis et al.,
2007; Herder and Roden, 2011; Chege, 2016). Women with a history of GD are particularly at
an increased risk of DM2 in future (Ryan, 2003; McIntyre et al., 2010) and children born from
such mothers are also at an elevated risk (Hillier et al., 2007; Boerschmann et al., 2010).
2.6.2 Demographic and Socio-Economic Factors
These include age and socio-economic status. A rapid rise in the prevalence of DM2 worldwide
had been associated with an increasing number of elderly (above 65 years) people (IDF, 2011).
The risk of DM2 therefore increases with age (Colberg et al., 2010; IDF, 2011; Chege, 2016).
This could be due to the weight gained as individual ages and also the fact that physical activity
is greatly reduced among the elderly (Donato et al., 2003; Tanaka and Seals, 2008). The
excessive weight results in reduced insulin sensitivity especially abdominal obesity (Racette et
al., 2006). The pancreas is also ageing and becomes incapable of producing sufficient insulin;
the aged body cells become more resistant to insulin although a lifetime of physical activity has
been found to prevent insulin resistance (Booth et al., 2011). Nonetheless as people age the co
morbidities seem to increase (Grundy et al., 1999).
A number of studies have associated socio-economic status and diabetes (Robbins et al., 2000;
Wikström et al., 2011; Corsi and Subramanian 2012; Hwang and Shon, 2014). Economic
disadvantage has been linked to increased prevalence of DM2 among African-American women
(Robbins et al., 2000) especially low education and household income levels (Wikström.et al.,
2011). However Corsi and Subramanian (2012) found greater DM2 risk among those in the

20
highest socio-economic status in India. In the United Kingdom lower wealth, but not income
was associated with diabetes mellitus especially among the elderly (Tanaka et al., 2012).
2.6.3 Environmental Factors
These include factors such as exposure to sunlight, stress as well as endocrine disruptors.
Sunlight participates in glucose metabolism which may influence the development of
hyperglycemia (Lindqvist et al., 2010). Sunlight helps in the synthesis of vitamin D which is
suggested to delay or prevent the onset of diabetes as well as reduce some of its associated
complications (Penckofer et al., 2008). A recent study also revealed that in door confinement of
cats increased diabetes risk (Ohlund et al., 2017).
Different forms of stress including general emotional stress, depression, anger or hostility,
increase diabetes risk (Kato et al., 2009; Rod et al., 2009; Pouwer et al., 2010 Adriaanse, 2010;
Kelly and Ismail, 2015). This could be because people under stress may not be taking good care
of themselves with some developing unhealthy behaviors such as poor dietary habits, smoking
cigarettes, excessive alcohol consumption and low exercise (Bonnet et al., 2005; Rod et al.,
2009).
Many studies have shown that some of the environmental chemicals can interfere with or mimic
some hormones resulting in diabetes, obesity and the metabolic syndrome (Alonso-Magdalena
et al., 2010; Tang-Péronard et al., 2011; De Coster and van Larebeke, 2012). For example,
exposure to bisphenol A and phthalates which are used to manufacture plastics, personal-care
products as well as in industry and medical devices have been associated with insulin resistance,
weight gain, pancreatic endocrine dysfunction and thyroid hormone disruption, all of which
have been linked to the development of diabetes (Svensson et al., 2011; Shankar and Teppala,
21
2011). However, a later study disputed these findings citing insufficient evidence (Kuo et al.,
2013).
2.6.4 Behavioural Factors
These are risk factors that can be reduced or eliminated through behaviour or lifestyle change.
Apart from unhealthy diet, other behavioural risk factors include: physical inactivity, use of
tobacco and excessive use of alcohol. A recent study has emphasized the importance of
physical activity and sedentary behavior on the risk of DM2 (Joseph et al., 2016). In fact
physical inactivity is associated with approximately 27 % of diabetes disease burden and has
been attributed to 6% of deaths globally (WHO, 2009). Physical activity controls body weight,
regulates blood pressure, uses up glucose as energy and makes body cells more sensitive to
insulin thereby decreasing incidence of DM2 (Helmrich et al., 1991; Hu et al., 1999; Folsom et
al., 2000; Colberg et al., 2010). WHO recommends a level of at least 150 minutes per week of
moderate-intensity activity for adults (WHO, 2010).
Studies have found an increased risk of DM2 in non alcohol drinkers and those with high
alcohol intakes, when compared with moderate alcohol intake (ADA, 2002; Wannamethee et
al., 2003; Baliunas et al., 2009) since moderate alcohol improves insulin sensitivity (Mayer et
al., 1993; Facchini et al., 1994). A later study investigating the glycemic and insulinemic
indices of beer concluded that alcohol increases the postprandial glucose response and
suggested the cause to be impaired insulin sensitivity (Hätönen, et al., 2012). Nonetheless, the
type of alcoholic beverage is important. For example, wine was associated with a more
significant reduced risk of DM2 compared with beer or spirits (Huang et al., 2017).
22
Also, cigarette smoking increases the risk of DM2 (ADA, 2002; Willi, 2008) with smokers
having a 44% more risk compared with non-smokers (Willi, 2008). Thus avoiding smoking
cigarettes should be encouraged in diabetes prevention and management (Chang, 2012).
2.7 REFLECTIVE COMMENTS ON ASSOCIATION BETWEEN DIABETES AND
SELECTED RISK FACTORS
Carbohydrates are the major dietary component that has a direct impact on blood sugar levels.
However a number of factors discussed above influence or moderate the effect of carbohydrates
on glycemic response. Thus the effect of carbohydrates should be considered alongside other
dietary components especially the macronutrients since it may not be possible to determine the
effect of each dietary nutritional component. This is also because people do not consume
specific nutrients but a variety of them in a meal. In this regard, this study considered the
carbohydrate-rich foods in the combinations with other foods as they are normally consumed.
Although dietary carbohydrates have a direct impact on blood sugar as earlier described, other
non-dietary components may moderate its effect on blood sugar levels. Some of these factors
are considered in this study as part of the confounding variables while some and especially the
environmental risk factors are not accounted for. This study investigated the effect of dietary
carbohydrates in influencing the occurrence of diabetes taking into account these non dietary
risk factors specifically, age, income, level of education, blood pressure, physical activity and
sedentary behavior, cigarette smoking and alcohol consumption. The results are discussed in the
following sections.

23
CHAPTER 3: ASSOCIATION BETWEEN SOCIO-ECONOMY, NUTRITIONAL
STATUS AND DIABETES PREVALENCE AMONG WOMEN OF AMAGORO
ABSTRACT
The aim of this study was to establish the prevalence of diabetes mellitus type 2 in association
with demography, socio-economy and nutritional status of women in Amagoro Division of
Western Kenya. This was a cross-sectional household-based study involving 260 women aged
15-90 years. Households were chosen by cluster and stratified sampling. Data on demography
and socio-economy and diabetes status were collected by interviews using pre-tested
questionnaires. Blood sugar levels were measured using a glucometer and levels ≥7.8 mmol/L
underwent a confirmatory test using fasting blood sugar. Anthropometric measurements were
taken following standard protocols. Body mass index as indicator of nutritional status was
calculated by dividing weight (kg) by height (m2) and classified as underweight (<18.5); normal
weight (18.5-24.9); overweight (25.0-29.9) and obese (≥30). Waist circumference > 88 cm
indicated abdominal obesity. Waist-hip-ratio >0.80 was considered abnormal. Focus group
discussions were also conducted and selected repeated themes were noted. The mean age of the
participants was 37.1±14.8 years. The prevalence of diabetes mellitus was 16.9%. Although the
women were aware of the rising cases of diabetes, they were not aware of the various risk
factors. The factors significantly associated with diabetes were employment status (OR=3.16,
p=0.02), household income (OR=14.21, p=0.04) and place of residence (OR=4.54, p=0.03).
Published as:
Ebere RA, Kimani VN and Imungi JK (2017). Prevalence of diabetes mellitus and itsassociation with demography, socio-economy and nutritional status of women of Amagorodivision in western Kenya. IOSR Journal of Nursing and Health Science; 6(3): 51-57.
24
3.1 INTRODUCTION
Diabetes mellitus is a chronic medical condition whereby the blood sugar level of a person rises
above normal (ADA, 2010). The three main types of diabetes mellitus are type-1 (DM1), type-
2 (DM2) and gestational diabetes (GD) (ADA, 2010). DM2 is the most common of diabetes
representing about 85% of the cases worldwide (WHO/IDF, 2008). In Sub-Saharan Africa,
DM2 accounts for more than 90% of DM cases (Dalal et al., 2011).
Causes attributed to DM2 are genetic and non genetic factors (ADA, 2010; Herder and Roden,
2011). It is more common in women, especially those with a history of GD (ADA, 2010) and
those with a family history of diabetes (Herder and Roden, 2011). Behavioural factors highly
associated with DM2 include unhealthy diet, obesity and lack of physical activity (ADA, 2010).
These factors are strongly influenced by the demography and socio-economic status of the
individuals which have been found to be associated with DM2 (Corsi and Subramanian, 2012;
Rao et al., 2010; Veghari et al., 2010). Some of the demographic and socio-economic risk
factors include age, marital status and education and income levels.
The risk of DM2 increases with age (Colberg et al., 2010) which could be due to weight gain,
reduced physical activity (Donato et al., 2003; Tanaka and Seals, 2008), the ageing pancreas
and insulin resistance by cells (Booth et al., 2011). Marital status has also been linked to
increased risk of DM2 especially widowed men possibly due to poor lifestyle (Cornelis et al.,
2014). There is conflicting evidence on the association between income levels and risk of DM2.
A previous study found the household income level to be inversely associated with DM2
(Hwang and Shon, 2014) while others reported contrary results, or found no association at all
(Tanaka et al., 2012). DM2 has been found to be inversely associated with the level of
25
education (Hwang and Shon, 2014; Lessmann et al., 2012; Veghari et al., 2010).
Overweight/obesity especially abdominal obesity has been associated with increased risk of
DM2 (Moretto et al., 2015) mainly because of associated insulin resistance (Hussain et al.,
2010). Abdominal obesity is indicated by a waist-to-hip (WHR) ratio > 0.80 for females (Ayah
et al., 2013) or a BMI > 30.0 (WHO, 2011). A waist circumference (WC) > 88 cm for women
represent an increased diabetes risk (Ayah et al., 2013; Gezawa et al., 2015; WHO, 2011).
In Kenya the prevalence of diabetes mellitus is rising and has been estimated at 2.7% in rural
and 10.7% in urban areas (Personal communication, DMI centre, Nairobi). A prevalence of
12% and 16% has been reported in an urban and rural population of Kenya respectively (Dalal
et al., 2011; El-busaidy et al., 2014). Due to such inconsistency in the results, more prevalence
studies need to be conducted. Also the risk factors could not be clearly established due to the
limitations in the available data (Dalal et al., 2011). Nonetheless very little research has been
done on diabetes mellitus type 2 in Kenya which has specifically targeted women as a group.
The purpose of this study was therefore to determine prevalence of diabetes mellitus and its
association with demography, socio-economy and nutritional status of women of Amagoro
division in Western Kenya.
3.2 STUDY DESIGN AND METHODOLOGY
3.2.1 Study Design
A cross-sectional study with both descriptive and analytical components was conducted among
women aged 15 – 90 years. The study used a structured questionnaire to collect information
through self-reporting. The interviews were conducted at the participants’ home by trained

26
research assistants. Six focus group discussions were also conducted with participants drawn
from those who took part in the survey.
3.2.2 Study Site
The study was conducted in Amagoro division of Teso North District of Busia County in
Western Province of Kenya (see appendix 6). Its administrative headquarters is in Amagoro
town. It is bordered by Bungoma district to the North and East, Teso South district in the South
and Republic of Uganda in the West. The division has nine administrative locations, namely;
Okuleu, Kokare, Amoni, Osajai, Kocholia, Kamolo, Kamuriai, Amagoro and Akadetewai. The
inhabitants of Amagoro division are predominantly Tesos. The division has a population of
56,207 (29, 843 female and 26, 364 male) and an area of 114.3 square kilometers. It has a total
of 12, 478 households (Kenya census, 2009).
The inhabitants of Amagoro division depend on agriculture, trading across the Kenya-Uganda
border and bicycle and motor cycle taxi businesses for livelihood. The major crops grown in
this area are maize, beans and sorghum in order of preference with maize being the most
preferred. Other crops include millet, cassava and groundnuts among others while the main cash
crop is tobacco. The major livestock types are: indigenous chicken followed by zebu cattle,
local goats and sheep (Ministry of Agriculture, Personal Communication, 2013).
3.2.3 Sampling Procedure
From the nine locations in Amagoro division, three locations were sampled for this study. First
the locations with less than 1000 households were excluded and these were Okuleu, Kokare and
Kamuriai. Of the 6 locations left, three are located along the Kenya-Uganda highway (Kocholia,
Amagoro and Akadetewai). Amagoro which is located in the middle was sampled from this
group. Two more locations were sampled from the remaining 3 (Amoni, Osajai and Kamolo)

27
which are located in the interior. To the south of Amagoro were Amoni and Kamolo. Kamolo
was sampled since it was more interior and had the highest number of households. To the North
of Amagoro and most interior Osajai location was also sampled. Therefore the three locations
that participated in this study were Amagoro (central), Osajai (north) and Kamolo (south). The
sample size was proportionately distributed among the three locations.
3.2.4 Sample Size Calculation
The sample size was calculated according to the formula adopted from Fox, Hunn and Mathers
namely: N= P (100%-P)/ (SE) 2. N= Desired sample size; P= Prevalence of diabetes in rural
Kenya (Isiolo County) (16%). SE= the confidence interval of 5% divided by 1.96. In this case
the SE= 2.55 and therefore N=207. Allowing attrition, 260 households participated in the study.
3.2.5 Data Collection Tools
Data were collected using pretested questionnaires, focus group discussion and key informant
interviews’ guides were also administered. Weight was measured using a bathroom scale and
height using a non-stretchable tape. Glucose and blood pressure meters were used to measure
blood glucose and blood pressure respectively.
3.2.6 Data Collection
The outcome variable was diabetes mellitus which was diagnosed using random and fasting
blood sugar levels. This was conducted using the On-Call Plus blood glucose monitoring sys-
tem (On-Call Plus ACON Laboratories, USA) which is an electrochemical enzymatic assay for
the quantitative detection of glucose in capillary whole blood. This system contains a blood
glucose meter, blood glucose test strips and control solution. The finger of each participant was
pricked using a sterile lancet and blood sample was applied directly to the end tip of the test
strip which was connected to the blood glucose meter. The result was read from the meter dis-
28
play. Each test strip was used only once. Since the whole blood sample was applied directly
from the finger tip to the test strip, there were no special handling or storage procedures. A cal-
ibration code chip was provided with each vial of test strips. A control was run by applying the
glucose control solution to the tip of the test strip that had been inserted into the meter. The re-
sult of the control was acceptable within the range indicated on the test strip vial label.
A random blood sugar (RBS) was obtained from a finger prick using a sterile lancet and glucose
level was measured using a glucometer. Participants with a RBS ≥ 7.8 mmol/l were considered
to have hyperglycemia and underwent a confirmatory test the following morning using fasting
blood sugar. Total diabetes was thus defined by those who reported to have been diagnosed
with diabetes mellitus in addition to the newly diagnosed cases. A fasting blood sugar ≥7.0
mmol/L was considered as a confirmation for the disease (Ayah, et al., 2013).
Independent variables were demography, socio-economy and nutritional status. Age
categorization was adopted from Gezawa et al (2015). Education level and marital status were
classified respectively into four (no formal schooling, primary education, secondary education
and tertiary education) and four (single, married, divorced/separated, and widowed).
Employment status, main source of household income and monthly household income were
sorted respectively into four (unemployed, self employed, informal employment, formal
employment), three (salary/wages, subsistence farming, small-scale business) and three (KES 0-
4999, 5000-10000, 10001-16000).
Nutritional status was assessed in terms of Body Mass Index (BMI). Height and weight were
measured using standard protocols with a few modifications (Ayah et al., 2013; Rao et al.,
2010). Each participant was asked to remove footwear and headgear. Height was measured
using a tape measure and recorded in metres. The tape was stuck onto a flat wall. The

29
participant was requested to stand on a flat surface adjacent to the wall. A wooden head rest was
then placed on the head to allow the measurement to be read on the wall straight from the top of
the head. The participant was asked to keep the feet together with the heels against the wall and
knees kept straight. The height was taken and recorded to the nearest 0.5 cm. Weight was
measured using a bathroom scale (Camry Model: BR 9012) and recorded to the nearest 0.5 kg.
These two measurements were then used to calculate body mass index (BMI) using the formula:
weight (kg) divided by height (m) 2.
BMI was then computed and participants classified into four categories of < 18.5; 18.5-24.9;
25.0-29.9 and ≥ 30 representing underweight; normal weight; overweight and obesity
respectively (Cornelis et al., 2014). Waist and hip circumference were also measured using
standard protocols (WHO, 2011). Waist circumference > 88 cm and WHR > 0.80 were
considered to be abnormal (Ayah et al., 2013). Diabetes data and history of diabetes in the
family were obtained from the self-reported questions.
After the survey, a few participants were invited to focus group discussions (FGDs). The
discussions involved 7 to 10 members and a moderator and were conducted at local churches
for convenience. A FGD guide was used and findings were noted. A total of six FGDs were
conducted.
30
3.2.7 Ethical Consideration
Ethical approval was granted by Kenyatta National Hospital and University of Nairobi Ethics,
Research and Standards Committee. Participants gave an informed consent and for those below
18 years, consent was sought from the guardian/parent. The inclusion criteria included being
female, resides permanently in the household, sound vision, hearing and memory, understands
the questions and agrees to participate. The exclusion criteria were poor vision, hearing and
memory or being ill (Hussain et al., 2010; Moretto et al., 2015).
3.2.8 Data Analysis
Data were analyzed using Statistical Package for the Social Sciences (SPSS) version 20.0.
Descriptive statistics were used in analyzing and characterizing the sample. Data were presented
in absolute frequencies, percentages, mean and standard deviation. A chi-square analysis was
used to compare the outcome with independent variables. Binary logistic regression enabled the
associations between DM2 and independent variables to be determined while multivariate
logistic regression analysis determined the magnitude of the independent risk factors. The
significance level adopted in these tests was 5% (p<0.05). Findings from FGDs were
summarized according to themes.
3.3 RESULTS AND DISCUSSION
3.3.1 Socio-Demographic Characteristics of the Respondents
The socio-demographic characteristics included age, education level, marital status, family
history of diabetes and place of residence. Participants were mainly from the Iteso ethnic group
(91.2%). Luhya’s and other tribes were 6.5% and 2.3% of the participants respectively. Their
mean age was 37.1 ± 14.8 years. The majority of the women were young (15 – 34 years) and
very few (3.1%) were over 64 years (Table 1). Most of them were married (90%). Only 28.9%
31
had received post primary education and 13.5% never had formal schooling. Those with a
family history of DM2 were 7.3%. In addition, only 36 (13.8%) lived in permanent housing
while the rest lived on semi-permanent houses with only 7 (2.7%) households connected to
electricity. With regard to household size, 54.2% comprised of 4-6 members while 1-3 member
and 7-10 member households formed 16.2% and 29.6% respectively.
Low level of education was found among the participants with very few progressing beyond
primary school. This is in agreement with an earlier study that found low enrolment of Kenyan
women in post primary education and as a result few women are in formal employment as
(Onsomu, 2008), a finding supported by this study. This low level of education may explain the
relatively high prevalence of diabetes mellitus although this association was not significant.
Women in the FGDs although aware of the rising cases of diabetes, could only associate
diabetes to eating sugary foods and excessive body weight and were not aware of other
predisposing factors such as physical inactivity, alcohol consumption or cigarette smoking.

32
Table 1: Distribution of participants with regard to socio-demographic characteristics
Variables Categories Frequencies
n %
Age (years) 15-34 175 67.3
35-64 77 29.6
≥65 8 3.1
Marital status Single 16 6.2
Married 234 90
Divorced/separated 5 1.9
Widowed 5 1.9
Level of education Never gone to school 35 13.5
Primary education 176 67.7
Secondary education 46 17.7
Tertiary education 3 1.2
Family history of diabetes Yes 19 7.3
No 241 92.7
Place of residence Kamolo 97 37.3
Amagoro 98 37.7
Osajai 65 25
3.3.2 Socio-Economic Characteristics of the Respondents
The socio-economic characteristics included employment status, main source of household
income and households’ monthly income. Most participants were unemployed and as a result
nearly 70% relied on subsistence farming (Table 2). The participant’s average monthly income
level was KES 2438±2592 which mainly came from subsistence farming (69.6%). A majority
of the households’ average monthly income was below KES 10,000. They all fall under
Kenya’s low income group. However, this is a rural population that obtains most food through
subsistence farming and therefore spends considerably less (KNBS, 2015).
33
Table 2: Distribution of participants according to socio-economic characteristics
Variable Categories Frequency Percent
Employment status Unemployed 135 51.9
Self employed 65 25
Informal employment 59 22.7
Formal employment 1 0.4
Main source of household income Salary/wages 23 8.8
Farming (subsistence) 181 69.6
Business (small-scale) 43 16.5
Other 13 5
Family monthly income (KES) 0-4999 222 85.4
5000-10000 34 13.1
10001-16000 4 1.5
3.3.3 Nutritional Status of the Respondents
The nutritional status was categorized in terms of BMI. In addition WC and WHR were used to
define abdominal obesity as one of the risks for DM2. The mean WC, BMI and WHR were
78.7±9.9, 22.7±3.44 and 0.85±0.08 respectively (Table 3). The prevalence of
overweight/obesity was 23.1% which was relatively higher than from previous studies in Kenya
possibly because this study sampled only women. Most studies have reported a relatively high
prevalence of obesity in women than men (Chege, 2010; Mathenge et al., 2010; Dalal et al.,
2011; Chege, 2016). Those with abnormal WHR were 75.8%. A majority of the participants
(82.7%) had a normal WC. Cases of underweight were also reported among the women (6.9%).

34
Table 3: Distribution of participants according to nutritional status
Variable Categories Frequency Percent
Body mass index (BMI) Underweight 18 6.9
Normal weight 182 70
Overweight 52 20
Obesity 8 3.1
Waist circumference (WC) Normal 215 82.7
Abdominal obesity 45 17.3
Waist-to-hip ratio (WHR) Normal 63 24.2
Abnormal 197 75.8
3.3.4 Prevalence of Diabetes Mellitus
The prevalence of DM2 among the women across all categories was found to be 16.9%. Of this
proportion (36) 13.8% were already diagnosed while (8) 3.1% were newly diagnosed cases.
This figure is much higher than earlier reported in Kenya (Dalal et al., 2011). However, the
prevalence in rural areas seems to be rising. Isiolo County, a rural population in Northern Kenya
reported prevalence of 16% (El-busaidy et al., 2014). The rising prevalence could partly be due
to increased awareness about the disease, improved diagnosis (IDF, 2011) and prevalence of
human immunodeficiency virus (HIV)/AIDS (Ledergerber et al., 2007) which was 6.4% in
women of Western Kenya in 2007 (Onsomu, 2008). HIV drugs are suggested to increase the
risk of DM2 (Ledergerber et al., 2007) possibly due to associated obesity and cells developing
insulin resistance (Hall et al., 2011). The women who participated in the focus group
discussions (FGDs) also agreed that the prevalence of diabetes is rising. They asserted that the
disease can affect anyone and not as earlier believed that it only affects rich people.
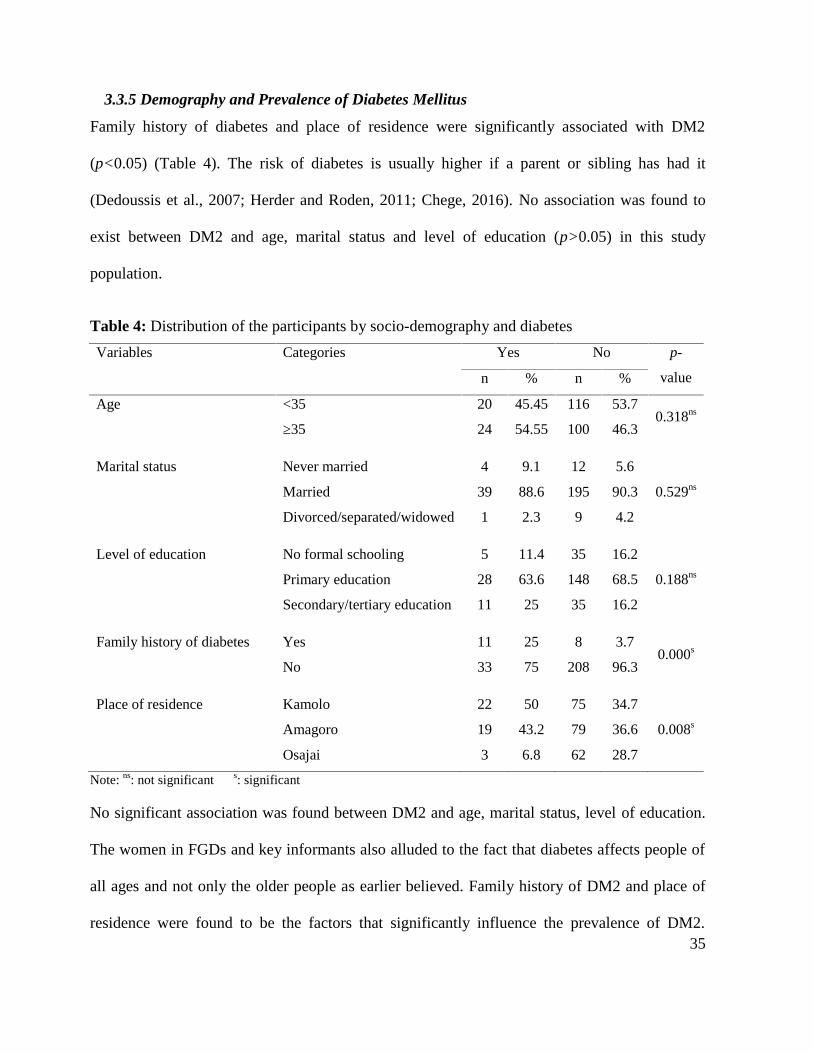
35
3.3.5 Demography and Prevalence of Diabetes Mellitus
Family history of diabetes and place of residence were significantly associated with DM2
(p<0.05) (Table 4). The risk of diabetes is usually higher if a parent or sibling has had it
(Dedoussis et al., 2007; Herder and Roden, 2011; Chege, 2016). No association was found to
exist between DM2 and age, marital status and level of education (p>0.05) in this study
population.
Table 4: Distribution of the participants by socio-demography and diabetes
Variables Categories Yes No p-
valuen % n %
Age <35 20 45.45 116 53.70.318ns
≥35 24 54.55 100 46.3
Marital status Never married 4 9.1 12 5.6
0.529nsMarried 39 88.6 195 90.3
Divorced/separated/widowed 1 2.3 9 4.2
Level of education No formal schooling 5 11.4 35 16.2
0.188nsPrimary education 28 63.6 148 68.5
Secondary/tertiary education 11 25 35 16.2
Family history of diabetes Yes 11 25 8 3.70.000s
No 33 75 208 96.3
Place of residence Kamolo 22 50 75 34.7
Amagoro 19 43.2 79 36.6 0.008s
Osajai 3 6.8 62 28.7
Note: ns: not significant s: significant
No significant association was found between DM2 and age, marital status, level of education.
The women in FGDs and key informants also alluded to the fact that diabetes affects people of
all ages and not only the older people as earlier believed. Family history of DM2 and place of
residence were found to be the factors that significantly influence the prevalence of DM2.
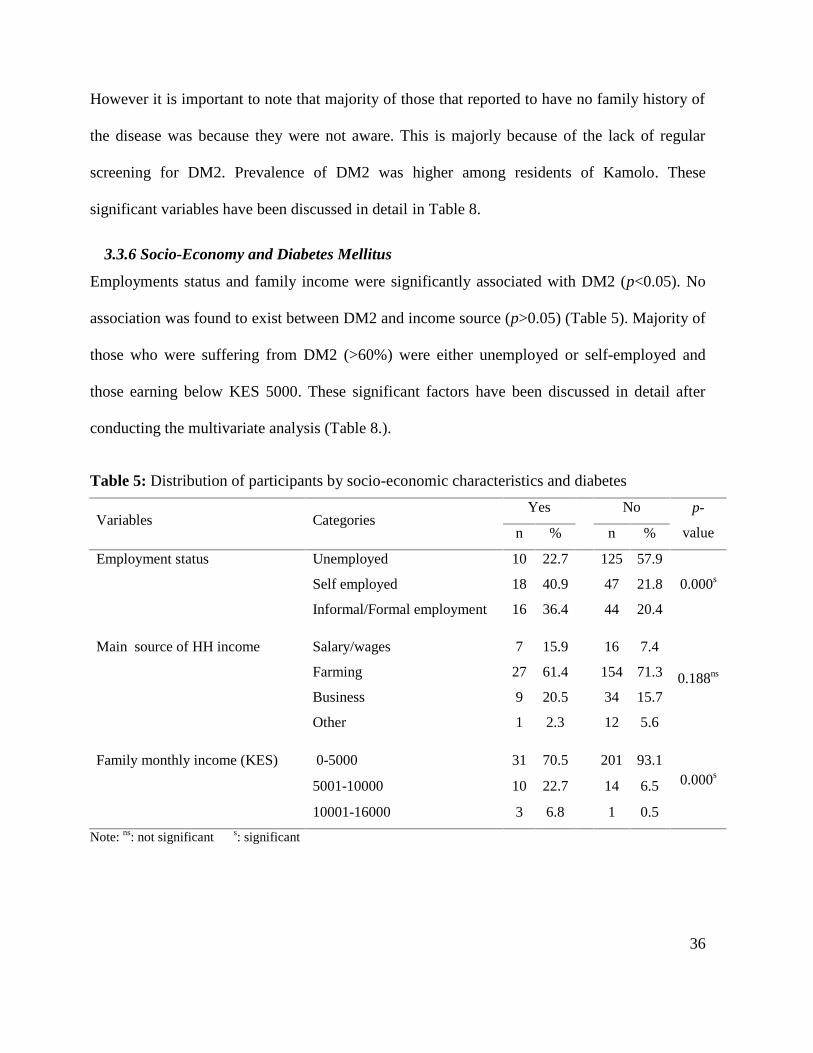
36
However it is important to note that majority of those that reported to have no family history of
the disease was because they were not aware. This is majorly because of the lack of regular
screening for DM2. Prevalence of DM2 was higher among residents of Kamolo. These
significant variables have been discussed in detail in Table 8.
3.3.6 Socio-Economy and Diabetes Mellitus
Employments status and family income were significantly associated with DM2 (p<0.05). No
association was found to exist between DM2 and income source (p>0.05) (Table 5). Majority of
those who were suffering from DM2 (>60%) were either unemployed or self-employed and
those earning below KES 5000. These significant factors have been discussed in detail after
conducting the multivariate analysis (Table 8.).
Table 5: Distribution of participants by socio-economic characteristics and diabetes
Variables CategoriesYes No p-
valuen % n %
Employment status Unemployed 10 22.7 125 57.9
0.000sSelf employed 18 40.9 47 21.8
Informal/Formal employment 16 36.4 44 20.4
0.188ns
Main source of HH income Salary/wages 7 15.9 16 7.4
Farming 27 61.4 154 71.3
Business 9 20.5 34 15.7
Other 1 2.3 12 5.6
0.000s
Family monthly income (KES) 0-5000 31 70.5 201 93.1
5001-10000 10 22.7 14 6.5
10001-16000 3 6.8 1 0.5
Note: ns: not significant s: significant

37
3.3.7 Nutritional Status and Diabetes Mellitus
The prevalence of overweight/obesity was 23.1% with more than 75% having abnormal WHR.
Despite this, there was no significant association between BMI, WHR and WC with DM2
(p>0.05) (Table 6). However those with abnormal WHR (>0.80) were 1.4 times more likely to
have DM2 as opposed to those with normal WHR (Table 7). This could possibly be due to the
cut-off values used which may not be appropriate for this population. Despite these findings,
other studies conducted in different parts of Kenya involving different communities had
established a positive association especially between abdominal obesity and DM2 (Chege,
2010; El-busaidy et al., 2014). Although they had low level of education, women in the FGDs
were also aware of the link between excessive weight and a number of diseases including
diabetes.
Table 6: Distribution of the participants by nutritional status and diabetes
Variables Categories
Yes No
p-valuen % n %
Body mass index <25 34 77.3 166 76.9
0.952ns≥25 10 22.7 50 23.1
Waist circumference <88 39 88.6 176 81.5
0.253ns≥88 5 11.4 40 18.5
Waist-to-hip ratio <0.8 13 29.5 50 23.1
0.367ns≥0.8 31 70.5 166 76.9
p-value: Pearson Chi-Square, ns: not significant
3.3.8 Socio-Demography and Odds Ratios for Diabetes Mellitus
With regard to age, the elderly (≥65 years) were 1.2 times more likely to suffer from DM2 as
compared to the young (15-34 years) although this finding was not statistically significant
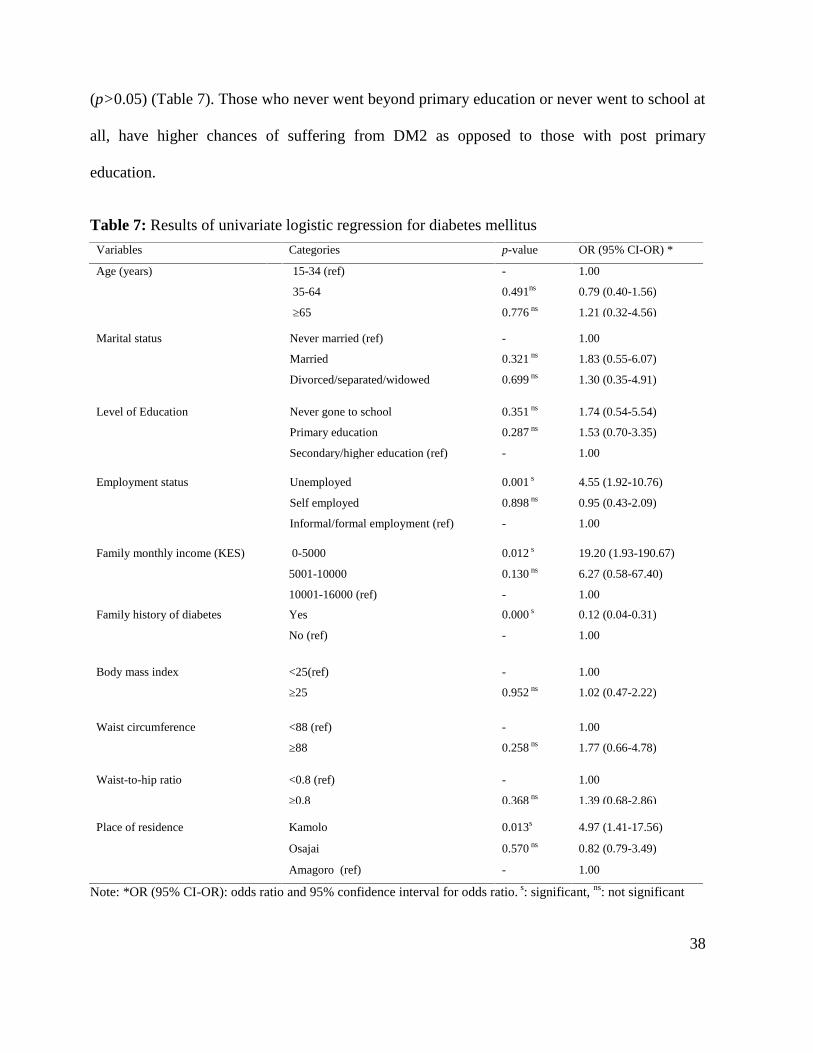
38
(p>0.05) (Table 7). Those who never went beyond primary education or never went to school at
all, have higher chances of suffering from DM2 as opposed to those with post primary
education.
Table 7: Results of univariate logistic regression for diabetes mellitus
Variables Categories p-value OR (95% CI-OR) *
Age (years) 15-34 (ref) - 1.00
35-64 0.491ns 0.79 (0.40-1.56)
≥65 0.776 ns 1.21 (0.32-4.56)
Marital status Never married (ref) - 1.00
Married 0.321 ns 1.83 (0.55-6.07)
Divorced/separated/widowed 0.699 ns 1.30 (0.35-4.91)
Level of Education Never gone to school 0.351 ns 1.74 (0.54-5.54)
Primary education 0.287 ns 1.53 (0.70-3.35)
Secondary/higher education (ref) - 1.00
Employment status Unemployed 0.001 s 4.55 (1.92-10.76)
Self employed 0.898 ns 0.95 (0.43-2.09)
Informal/formal employment (ref) - 1.00
Family monthly income (KES) 0-5000 0.012 s 19.20 (1.93-190.67)
5001-10000 0.130 ns 6.27 (0.58-67.40)
10001-16000 (ref) - 1.00
Family history of diabetes Yes 0.000 s 0.12 (0.04-0.31)
No (ref) - 1.00
Body mass index <25(ref) - 1.00
≥25 0.952 ns 1.02 (0.47-2.22)
Waist circumference <88 (ref) - 1.00
≥88 0.258 ns 1.77 (0.66-4.78)
Waist-to-hip ratio <0.8 (ref) - 1.00
≥0.8 0.368 ns 1.39 (0.68-2.86)
Place of residence Kamolo 0.013s 4.97 (1.41-17.56)
Osajai 0.570 ns 0.82 (0.79-3.49)
Amagoro (ref) - 1.00
Note: *OR (95% CI-OR): odds ratio and 95% confidence interval for odds ratio. s: significant, ns: not significant

39
Family history, employment status, family income and the place of residence showed
association with DM2 (p<0.05). The influence of family history would not be clearly explained
since it was assumed that those who did not know of the history had no history. However, these
results show that irrespective of history chances of suffering DM2 are still there in this
population.
Compared to those in employment whether formal or informal, unemployed respondents were
4.55 times more likely to suffer from DM2. Residents of Kamolo were more likely to suffer
from DM2 as opposed to those from Amagoro and Osajai.
Table 8: Results of multivariate logistic regression for diabetes mellitus
Variables Categories p-value OR (95% CI-OR) *
Employment status Unemployed 0.02 3.16 ( 1.22-8.19)
Self employed 0.19 0.55 (0.22-1.34)
Informal/formal employment (ref) - 1.00
Family monthly income (KES)
0-4999
0.04 14.21 (1.19-
169.69)
5000-10000 0.15 6. 0 (0.51-84.61)
10001-16000 (ref) - 1.00
Place of residence Kamolo 0.03 4.54 (1.17-17.55)
Osajai 0.19 0.58 (0.26-1.30)
Amagoro (ref) - 1.00
Note: *OR (95% CI-OR) means odds ratio and 95% confidence interval for the odds ratio.
Multivariate logistic regression analysis indicated that employment status, family income and
place of residence were significantly associated with diabetes mellitus (p<0.05). Participants
who were unemployed were three times more likely to suffer from DM2 as opposed to those in
formal employment while those earning less than KES 5000 per month also stood higher chance

40
of being diabetic than those on a higher income bracket. A similar finding was reported in
Northern Kenya where low economic status was associated with higher risk for DM2 (El-
busaidy et al., 2014). Being unemployed and thereby having low income may predispose an
individual to depression or stress which has been shown to increase diabetes risk (Kato et al.,
2009; Rod et al., 2009; Pouwer et al., 2010 Adriaanse, 2010; Kelly and Ismail, 2015). People
under stress may not take good care of themselves; they develop unhealthy lifestyle behaviors
such as reduced exercise, poor dietary habits, consuming excess alcohol and smoking cigarette
(Bonnet et al., 2005; Rod et al., 2009).
Residents of Kamolo were more than four times likely to suffer from diabetes mellitus as
opposed to those residing in Amagoro while those in Osajai were less likely to suffer from the
disease. These differences in risk could possibly be explained by the fact that a majority of
those sample came from Kamolo location and also the possible difference in the type of diet
they subsist on, level of alcohol consumption as well as physical activities they could be
engaged in. It’s also important to note that majority of the participants were sampled from
Kamolo location which could contribute to it showing a higher prevalence than other sampled
locations.
41
CHAPTER 4: DIETARY PATTERNS OF THE WOMEN OF AMAGORO
ABSTRACT
Kenya is especially experiencing a rise in diabetes incidences as well as other non-
communicable diseases. A healthy diet is important in the prevention and management of such
diseases. This study was therefore designed to describe the dietary patterns of the Iteso
community, the main inhabitants of Amagoro in Western Kenya. The study provides
background knowledge on possible diet and health intervention that would help to improve
health status. This was a cross sectional survey involving 260 women aged between 15 - 90
years. First, focus group discussions and key informant interviews were conducted to establish
cultural and social aspects surrounding food and people’s common views towards food. They
also helped generate a food list that was used in designing a food frequency questionnaire. This
was then followed by a household survey using a pretested structured questionnaire
administered through interviews. The results showed that the diet of these people was generally
starch-based and was limited in protein. The common food being porridge prepared from maize
which lack some essential amino acids such as tryptophan and lysine. Foods were mostly
consumed thrice a day. Thin porridge or black tea was popular for breakfast and stiff porridge
for lunch and supper. There is therefore need to develop strategies that seek to increase the
availability of protein sources and diversify carbohydrate sources. Improving income sources
would help in meeting nutritional needs without people having to sell their protein-rich foods
for money. The population also needs to be educated on possible adjustment of stiff porridge to
relish ratio.
Published as:
Ebere RA, Kimani VK and Imungi JK (2017). Dietary patterns of the Iteso community living inAmagoro Division in Western Kenya. IOSR Journal of Nursing and Health Science; 63 (3): 1-9.

42
4.1 INTRODUCTION
As a result of the rising cases of non-communicable diseases in Kenya (Mohajan, 2014), it is
important to understand the foods and culture of various groups of people in order to be able to
effectively develop and implement health promotion activities (Kuhnlein et al., 2013). A
healthy diet is important in reducing the incidences of such diseases (DGAC, 2015; Ofwona,
2013; Kuhnlein et al., 2013) especially by identifying and promoting intake of culturally-
acceptable staple foods (Mattei et al., 2015).
The Kenyan population is divided along ethnic, geographical as well as economical back-
grounds (Oniang’o and Komokoti, 1999). Consequently, different ethnic groups have different
dietary patterns (Oniang’o and Komokoti 1999; Hansen et al., 2011; Kuhnlein et al., 2013). For
example the Kamba, Luo and Maasai have considerably different dietary patterns (Hansen et
al., 2011). However, despite the diverse dietary patterns, food insecurity is a major challenge
facing a majority of Kenyans irrespective of their ethnicity (Hansen et al., 2011; Mohajan,
2014; Ofwona, 2013; Oiye et al., 2009). This challenge justifies the need to describe various
dietary patterns (Hansen et al., 2011; Ofwona, 2013) since it will enable the government to
know the extent of the problem and devise policies to address them (Ofwona, 2013; Kuhnlein et
al., 2013).
Government interventions must be targeted to specific populations since most indigenous peo-
ple are located in rural and remote areas. In addition, there are differences in local food sources
and socio-cultural characteristics (Kuhnlien et al., 2013). For example in most parts of Kenya
food preparation is mainly done by women (Karp and Karp, 1977; Steenbergen et al., 1984;
Oiye et al., 2009). The responsibility of growing or purchasing food is left to women (Karp and
43
Karp, 1977). Consequently, they are responsible for making decisions relating to food including
the choice of food, its source, preparation and consumption (Oiye et al., 2009). Socio-
demographic characteristics including household sizes, employment status, level of education,
may explain both the choice and amount of food consumed (Macharia et al., 2012).
Amagoro division which is located in the northern part of Busia County in Western Kenya is
mainly the Iteso community who belong to the Nilotic-speaking group (Karp and Karp 1977).
Karp and Karp (1977) conducted a study between 1969 and 1971 in Amukura area of Busia
County (then Busia district) which is also inhabited by the Iteso. These anthropologists de-
scribed the Iteso culture including the foods consumed although their study did not describe the
frequencies of consumption of various foods neither did they specify the average serving sizes
for various foods. Nonetheless there is a possibility of change in dietary patterns considering
they conducted their study 46 years ago.
Despite the known association between dietary and various health outcomes (DGAC, 2015),
data on food consumption patterns among the poor populations of Kenya is not readily available
(Ofwona, 2013). This study therefore aimed at describing the dietary patterns of the Iteso com-
munity living in Amagoro division of Western Kenya. This will provide background knowledge
for possible association between diet and health especially with regard to non-communicable
diseases among the Iteso community.
44
4.2 STUDY DESIGN AND METHODOLOGY
The study design, site and ethical considerations were as described in Chapter three.
4.2.1 Data Collection Tools
The study used a structured pretested questionnaire to collect information through self-
reporting. The interviews were conducted at the participants’ home. Focus group discussions
and key informant interviews were also conducted in the area.
4.2.2 Sample Size Determination
The sample size for the survey was calculated according to the formula adopted from Fox et al
(2009) namely: N= P (100%-P)/ (SE) 2. N= the desired sample size; P= Proportion of main
dietary component associated with DM2 (carbohydrates) in the diet (80%). SE= the confidence
interval of 5% divided by 1.96. In this case the SE= 2.55 and therefore N=246. Allowing
attrition, a total of 260 households participated in the study.
4.2.3 Sampling Procedure
Based on FAO recommendations that surveys should target the person who mostly prepare
meals for the household, the questionnaires were administered to women mostly involved in
preparing meals for the household (FAO, 2008). Food preparation is mainly done by women in
the Iteso community (Karp and Karp, 1977). The participants were drawn from three locations
selected from the nine locations as described in section 3.1. These were locations with many
households, located to the North (Osajai), south (Kamolo) and central (Amagoro). The partici-
pants were then proportionately distributed among these locations depending on the number of
households in each location.

45
A maximum of 10 participants each from a different household were recruited then on
voluntary basis from each location to participate in focus group discussions (FGDs). Each FGD
consisted of between 6-10 participants and a moderator. Each location had 2 FGDs conducted in
their local church. A pretested moderators’ guide was used and data was taken by recording and
note taking.
The key informant interviews (KII) participants were sampled purposively to ensure that the
composition of final sample reflects the representatives from the various categories of
institutions and people in the study area. Fifteen key informants including a doctor, a clinical
officer, nutritionist, social development officer, nurse, religious leaders, teachers, public health
officer, agricultural officer, political leader and assistant chiefs were interviewed. The data was
collected through recording and note taking.
4.2.4 Dietary Assessment Using a Food Frequency Questionnaire
Dietary assessment was conducted by face-to-face interviews at the participants’ home using
pretested structured questionnaires. A semi-quantitative food-frequency questionnaires (FFQs)
were administered to women who were the persons mainly responsible for food preparation.
Participants were asked about their food intake in the past one year (Rodrigo et al., 2015). The
FFQ contained 54 locally available food items. The frequency of consumption of these foods
was assessed and presented as: daily, weekly, monthly or yearly intake. In order to accurately
assess the amounts of specific foods consumed, the trained interviewers carried some household
measures including cups, bowls and spoons. All the ingredients were also recorded including
their amounts.

46
4.2.5 Conducting Focus Group Discussions and Key Informant Interviews
The focus group discussions (FGDs) were conducted using the moderator’s guide (Appendix 3).
The areas covered included the food consumption patterns in the area and their knowledge on
diet in relation to disease. Other social habits were also captured. In addition to the FGDs, key
informant interviews (KIIs) provided preliminary information about the foods consumed in the
area including the cultural aspects surrounding food consumption. KIIs moderators’ guide was
used (appendix 4).
4.2.6 Proximate Analyses
Proximate composition of the foods was analyzed according to the AOAC official methods
(AOAC, 2000) of analysis at University of Nairobi’s Food Chemistry Laboratory. Proximate
analysis was mainly carried out to help in the calculation of the available carbohydrates and
various calories from the meals.
Moisture content was determined by weighing approximately 5 g of sample accurately in an
aluminium dish, and dried to constant weight in an air-oven at 80 oC. The weight loss of the
sample was calculated as percent moisture content.
Crude protein was determined using about 5 g accurately weighed sample as total nitrogen by
semi-micro Kjeldahl method and multiplied by an empirical factor of 6.25 to convert to protein.
Crude fibre was determined by digesting about 5 g sample accurately weighed in a 400 ml
beaker, with dilute strong alkali and dilute strong acid, drying the residue to constant weight and
incinerating in a muffle furnace at 500 oC to constant weight. The difference between the
weight of dry residue and ash was calculated as percent fibre content of the sample.

47
Total ash was determined by weighing accurately about 5 g sample in a porcelain crucible. This
was then placed in a muffle furnace and incinerated at 500 oC to constant weight. The total ash
was calculated as percent of sample.
Soluble or digestible carbohydrate content was calculated as difference [100 – (moisture +
crude protein + crude fat + crude fibre + total ash)].
4.2.7 Data Analysis
The data was analyzed using SPSS version 20.0 and Microsoft Excel. Data analysis procedure
for the food frequency questionnaire was adopted from Fanzo et al., 2011. A Consumption
frequency score (CFS) was computed for every food item. It was defined as the number of times
the food item was consumed in a week with a score of 1 represented once weekly, 7 represented
once daily and other values scaled accordingly (Fanzo et al., 2011).
The 13 food categories were: cereals; roots, tubers and plantains; legumes; vegetables; fruits;
eggs; fish and poultry; meat; nuts and seeds; milk and milk products; fats and oils; sweets, other
soft beverages. This study did not distinguish between organ meat and flesh meat. The CFS for
a food group was computed by summing up the CFSs of foods in that food group (Fanzo et al.,
2011). Categorization of specific foods or food groups were based on the consumption
frequencies of at least daily scored at 7, and ‘at least weekly’ and ‘at least monthly’ receiving a
score of 1 and 0.25 respectively. Daily consumption was represented by those with a CFS of
that food group being ≥7. The percentage of individuals consuming each of the food groups ei-
ther on a daily, weekly or monthly basis was determined.
Individual food variety scores (FVS) for various categories; daily, weekly and monthly were
calculated as the number of food items consumed in the respective frequency category. In addi-

48
tion, individual diet diversity scores were generated for daily, weekly and monthly time periods
based on the 13 categories of food. These were calculated as the number of food groups that
were consumed daily, weekly or monthly respectively (Fanzo et al., 2011).
Descriptive statistics were used in analyzing and characterizing the survey participants. The
data was presented in frequencies including percentages; and by mean including standard
deviation. Data from the key informant interviews and focus group discussions was transcribed,
summarized and key/repeated phrases noted.
4.3 RESULTS AND DISCUSSION
4.3.1 Food Consumption Frequencies
The food consumption frequency was described in terms of food variety and diet diversity as
shown below.
4.3.2 Consumption of Various Food Types (Food Variety)
Most of the participants (71.9 %) consumed more than 4 different foods on a daily basis
(medium to high food variety) with a mean of 5±3 foods types (Table 9). The mean food
varieties consumed on a weekly and monthly basis were 9±4 and 7±3 food types respectively.
However it’s possible that these foods belong to similar food groups. For this reason diet
diversity scores were also analysed (Table 10).
Table 9: Individuals consuming different foods on a frequency of daily, weekly and monthly
Number of foodsNumber of individuals consuming various foods n (%)At least daily At least weekly At least monthly
Lowest food diversity (≤ 3 foods) 73 (28.1) 21 (8.1) 45 (17.3)Medium food diversity (4-5 foods) 95 (36.5) 34 (13.1) 46 (17.7)High food diversity (≥6 foods) 92 (35.4) 205 (78.8) 169 (65.0)Mean food types 5±3 9±4 7±3
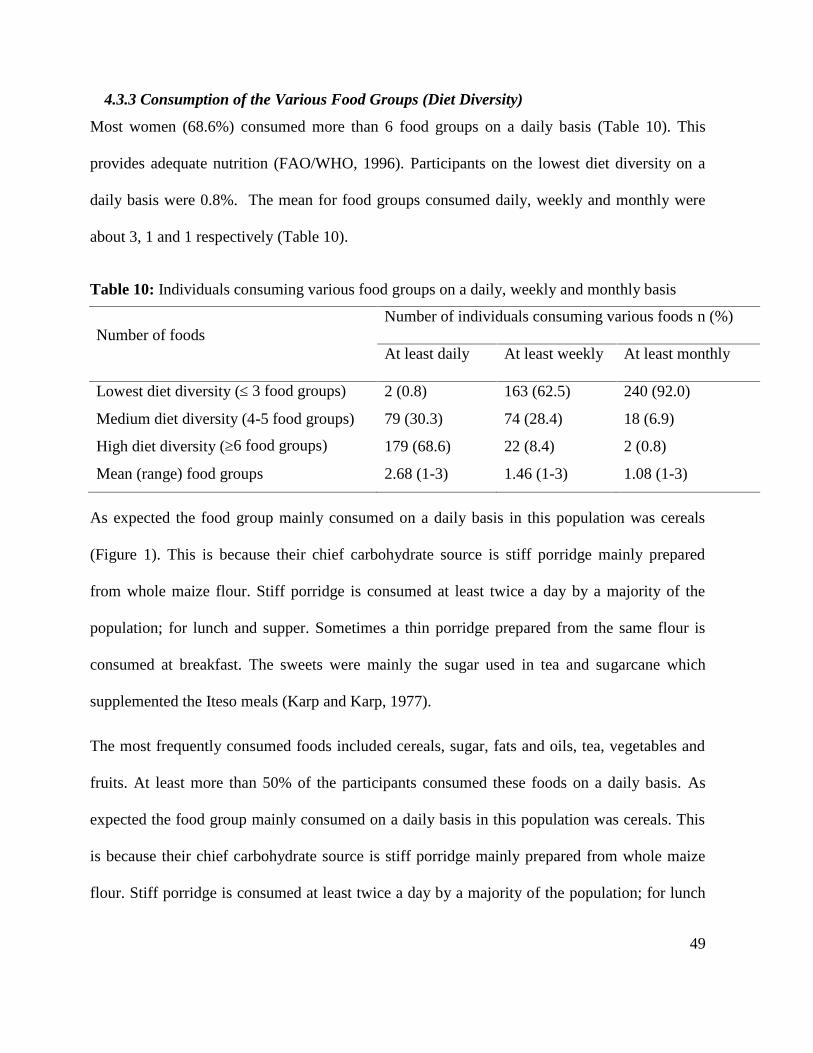
49
4.3.3 Consumption of the Various Food Groups (Diet Diversity)
Most women (68.6%) consumed more than 6 food groups on a daily basis (Table 10). This
provides adequate nutrition (FAO/WHO, 1996). Participants on the lowest diet diversity on a
daily basis were 0.8%. The mean for food groups consumed daily, weekly and monthly were
about 3, 1 and 1 respectively (Table 10).
Table 10: Individuals consuming various food groups on a daily, weekly and monthly basis
Number of foodsNumber of individuals consuming various foods n (%)
At least daily At least weekly At least monthly
Lowest diet diversity (≤ 3 food groups) 2 (0.8) 163 (62.5) 240 (92.0)
Medium diet diversity (4-5 food groups) 79 (30.3) 74 (28.4) 18 (6.9)
High diet diversity (≥6 food groups) 179 (68.6) 22 (8.4) 2 (0.8)
Mean (range) food groups 2.68 (1-3) 1.46 (1-3) 1.08 (1-3)
As expected the food group mainly consumed on a daily basis in this population was cereals
(Figure 1). This is because their chief carbohydrate source is stiff porridge mainly prepared
from whole maize flour. Stiff porridge is consumed at least twice a day by a majority of the
population; for lunch and supper. Sometimes a thin porridge prepared from the same flour is
consumed at breakfast. The sweets were mainly the sugar used in tea and sugarcane which
supplemented the Iteso meals (Karp and Karp, 1977).
The most frequently consumed foods included cereals, sugar, fats and oils, tea, vegetables and
fruits. At least more than 50% of the participants consumed these foods on a daily basis. As
expected the food group mainly consumed on a daily basis in this population was cereals. This
is because their chief carbohydrate source is stiff porridge mainly prepared from whole maize
flour. Stiff porridge is consumed at least twice a day by a majority of the population; for lunch
50
and supper. Sometimes a thin porridge prepared from the same flour is consumed at breakfast.
The sweets were mainly the sugar used in tea and sugarcane which supplemented the Iteso
meals (Karp and Karp, 1977). The traditional diet of stiff porridge prepared from maize flour is
accompanied mostly by green leafy vegetables. The vegetable is boiled in sour milk or is sometimes
flavoured with ash filtrate made from the ashes of certain leaves (Karp and Karp, 1977).
Milk, eggs and meat are expensive and are only consumed by very few people. It is worth
noting that milk and eggs are seldom consumed by the majority. Sugar and tea as well as fats
and oils are used every other day on average. Fat and oils are majorly used in the preparation of
vegetables or meat and is frequently part of the daily diet. Vegetable consumption is high
mainly because it’s cheap, it’s the main accompaniment to stiff porridge and also, a majority
plants them on their own farms.
The overall food consumption pattern seems to be limited in protein despite the fact that the
households produce legumes. The frequency of consumption of protein-rich foods (legume,
meat, eggs and milk) was very low. This could be due to high levels of poverty as demonstrated
by high unemployment and low income as well as low level of education. Household income
has been suggested to have higher impacts on meat consumption (Bett et al., 2012) for example.
Increase in household income also increased consumption of roots and tubers as well as fruits
especially in rural populations (Musyoka et al., 2014). In Amagoro, most household rely on
subsistence farming as a source of food and income. Some of these protein sources can be got
from own farms but they rather sell these products for money instead of own consumption.

51
Figure 1: Average consumption of various food groups
4.3.4 Frequency of Ugali Consumption
The main staple in this population was stiff porridge with 240 (92.3%) households consuming it
on a daily basis and 20 (7.3%) consuming it at least weekly. “We are all alive because of uga-
li”, Jane emphasized in a FGD. “Ugali is strength”, the women concurred. The stiff porridge is
mainly prepared from whole maize meal but also from sifted maize meal, cassava, sorghum,
millet or any combination thereof (Wanjala et al 2016).
The frequency of consumption followed the order whole maize > cassava-sorghum> cassava-
sorghum-millet > sifted maize > cassava-millet. The choice usually depends on preference,
availability and affordability. This is because in rural areas, the type of food consumed mainly
depends on the households’ own production (Oiye et al., 2009; Macharia et al., 2012; Wanjala
et al., 2016).
52
The results of the key informant interviews (KIIs) and focus group discussions (FGDs)
concurred with this finding. The most preferred ugali is prepared from whole maize while
cassava mixed with either millet, sorghum or both is popular mainly during the famine season
when maize stocks have run out and also due to the fact the maize is more expensive as opposed
to cassava. The popular mixture for cassava-based ugali is cassava and sorghum. This is
because millet is expensive unless it is harvested from own farm. “What is eaten in the home
depends mainly on what is available on the farm” concurred the women in FGDs.
4.3.5 Foods for Various Groups of People and Specific Occasions
a) Pregnant and lactating women
Pregnant women are discouraged from the traditionally distilled liquor (chang’aa) and black tea.
The lactating women are given plenty of white tea and thin porridge prepared from plain millet
or composite flour. They also eat stiff porridge with meat or chicken although this special diet
lasts for only 3 days after delivery to help the mother regain her energy. Apart from thin
porridge, other foods believed to boost milk production include sugarcane, groundnuts, sesame
seeds, local alcoholic brew (busaa), bone soup and local green leafy vegetables prepared with
sour milk and peanut and/or sesame butter. Cowpeas leaves and any vegetable prepared from
special ash filtrate (abalang) are not recommended for lactating women. They are believed to
lower milk production.
b) Infants
The infants are breastfed until the recommended age of six months although mothers who did
not produce enough milk opted to wean the child earlier. Milk is introduced first followed by
thin porridge. However some cannot afford milk and give the thin porridge. Thin porridge is
usually prepared form composite flour containing maize, millet, sorghum, soya beans,

53
groundnuts, silver fish or beans depending on the availability. This composite flour porridge is
believed to boost energy and improve the health of the baby especially its ability to fight
disease. Other foods may include fruits, Irish potatoes or green bananas or pumpkins mashed
with pumpkin leaves or mashed foods from the family table. There was no special food for
toddlers, school going children and adolescents.
c) Children, adolescents and adults
Foods are normally consumed three times in a day; breakfast, lunch and supper. However some
people skip breakfast and only eat twice a day especially during times of scarcity. Snacks are
not part of the daily meals. Nonetheless fruit or sugarcane can be eaten if it’s available on own
farm, sometimes black tea with or without accompaniment can be taken as a snack. “What is
eaten in the home depends mainly on what is available on the farm” was the common statement
from FGDs and KIIs.
Foods commonly consumed for breakfast are black tea or thin porridge flavored with sugar. In
addition porridge may be flavored with milk, sugar, lemon juice or sometimes margarine. Black
tea is popular due to lack of access to milk. The thin porridge is prepared mainly from whole
maize or millet. Millet is expensive and is therefore only consumed when it’s harvested in the
home. Tea can be consumed with sweet potatoes, cassava, green maize, groundnuts, roasted
soya beans, plantains, mixture of maize and beans, eggs, chapatti, bread or mandazi.
There is no difference between the foods consumed at lunch and supper. The most common
food is stiff porridge (ugali). In most cases the left over vegetables at lunch time are used for
supper. In this case only ugali is freshly prepared.

54
Ugali is either made from whole maize or cassava in combination with millet, sorghum or both.
The most preferred stiff porridge is from whole maize while cassava based is popular mainly
during the famine season when maize stocks have run out and also due to the fact the maize is
more expensive compared to cassava. Millet is expensive and therefore rare. Ugali is usually
consumed with local green leafy vegetables or silver fish popularly known as omena. Meat,
poultry and fish may also accompany ugali. Most of these vegetables are simply boiled or
boiled in ash filtrate. During the famine season, the popular vegetable is cowpeas leaves cooked
with special ash filtrate (abalang) with groundnut paste and/or fresh milk. This way no cooking
oil is required.
Other foods that may be consumed for lunch especially in famine season include sweet potatoes
and cassava which are eaten with black tea or local vegetables or mashed with beans; plantain;
rice with Irish potatoes; beans; green grams or mixture of maize and beans. Beans dishes are
only prepared when beans are in season. This is because of the high price of beans.
The sick people eat depending on their appetite although what they request for must be
available in the home. In most cases, the best they can get is eggs, fruits and plain millet
porridge in addition to the usual family diet.
d) Special occasions
Different groups of people have different unique variety of foods. The social settings where
some of these foods are consumed are of great significance (Kuhnlein et al., 2013). The Iteso
community is no exemption. Special occasions include weddings and visiting in-laws and these
demand special foods. During weddings special foods include ugali prepared from cassava,
millet and sorghum served alongside elumuch (sauce prepared from smoked-dried meat, sour

55
milk, sesame and/or groundnut paste) and a mixture of boiled local green leafy vegetables
flavored with sour milk, peanut and/or sesame butter. Other foods include rice, meat, chapatti,
chicken, pilau (spiced meal prepared from rice and beef), local alcoholic brew (busaa), soft
drinks, white tea served with groundnuts or mandazi. In addition cake is served during wedding
ceremonies.
e) Average serving size and nutrient composition of some foods
Bowls and cups were used to standardize some food measures. For example a bowl of ugali
weighed 500 g (as is basis) and the women consumed an average of one serving (500 g) while
participants consumed an average of one cup of thin porridge and 2 cups of tea (Table 11).
Cereals formed the main source of energy in the diet and included ugali, chapatti and rice with
ugali contributing the largest portion size. The vegetables included kales, cowpea leaves and
local vegetables. A cup of kales and cowpea leaves weighed 100 g while local vegetables
weighed 200 g. This is because most local green leafy vegetables are soft and less fibrous as
opposed to kales or cowpeas and thus, a larger quantity. The participants consumed more of
these vegetables. Other foods included groundnuts, mandazi, beef stew, silver fish, sweet potato
and cassava. Although the participants consumed 4 serving of sweet potato or cassava, they
consumed more of sweet potato in total, this could be because of the sweetness associated with
the sweet potato that encourages more intake as opposed to cassava.

56
Table 11: Average portion sizes of some foods consumed in Amagoro
Food Measure for serving (“as is” basis) Average serving reported
Stiff porridge 1 bowl (500 g) 1
Thin porridge 1 cup 1
Tea 1 cup 2
Ground nuts (dried) 110 g (3 handfuls) 1
Beans 1 cup 4
Chapatti 1 chapatti (85 g ) 3
Rice 1 bowl (350 g) 1
Mandazi 1 mandazi (50 g) 3
Kales 1 cup (100 g) 1
Cowpea leaves 1 cup (100 g) 1
Local vegetables 1 cup (200 g) 1
Beef stew 3 pieces (90 g) 1
Sweet potato 1 piece (140 g) 4
Cassava 1 piece (100 g) 4
Silver fish 1 cup (170 g) 1
Participants generally consumed large portions of carbohydrates mainly inform of ugali (500 g).
When ugali is not available especially when maize is out of stock, beans, cassava or sweet
potato would be consumed as the main meal for the household mostly without an
accompaniment. This partly explains the large portion sizes apart from the fact that snacking
does not form part of their dietary habit. For breakfast, participants consumed mainly black tea
or thin porridge and in most cases without an accompaniment. Meals are also consumed after
vigorous physical activity mainly involving digging as well as other farm and household
activities.

57
4.3.6 Proximate Composition and Energy Contents of some Foods Consumed in Amagoro
The proximate composition and energy for various ready to eat foods were calculated as grams
per 100 g on dry weight basis and energy values were expressed as KCal/100 g (Table 12).
Means and standard deviation values were computed. The energy values were calculated from
the available carbohydrates, protein, fat, and fibre values by multiplying with their respective
empirical conversion factors of 4, 4, 9 and 2 respectively (Stadlmayr et al., 2012). Although
earlier studies did not consider fibre as a source of energy, the West African food composition
table which shares some similarity with Kenyan foods documented that fibre contributes 2
Kcal/100 g.
The moisture content varied among various ugali types, cereals grains including maize,
sorghum and millet shown lower moisture content compared to those types that contain cassava
in their formulation. This could be attributed to the differences in the nature of starch that might
have influenced water uptake. It could also be due to the fact that cassava forms a sticky mass
during preparation that is difficult to mix and thus the tendency to use less flour as opposed to
cereal grains formulations. Cowpea leaves had the highest moisture content while silver fish
had the lowest. This is because cowpea leaves naturally have high moisture content and was
also stewed as opposed to sun-dried silver fish with naturally low moisture content. In terms of
fat content, silver fish had the highest while sweet potatoes had the lowest. This is because of
the vegetable oil added during the vegetable preparation as opposed to sweet potato that was
simply boiled in water. Among the ugali formulations, whole maize ugali had the highest fat
due to the inclusion of the oil-rich germ. As expected the highest protein and fibre content was
reported in silver fish and cowpea leaves respectively and consequently, these two foods
reported the highest ash content. The highest carbohydrate content was reported in ugali and the

58
least in cowpea leaves. This is because the ugali was mainly cereal or cassava based. Cowpea
leaves had the highest energy content mainly because of vegetable oil used in its preparation
which significantly contributed to energy as is the case with silver fish. However, the energy
contribution from ugali could still be high due to the higher ugali to cowpea leaves or silver fish
ratio in a normal serving. Although rice and beans have close energy contents, most of the
energy of rice comes from carbohydrates while beans also contain relatively high protein and
fat in addition to carbohydrate. Other foods analyzed included boiled cassava and boiled sweet
potato whose energy contents were nearly similar.
Table 12: Proximate composition and energy values for selected ready to eat foodsSample name Moisture
(%)
Fat
(%)
Protein
(%)
Fibre
(%)
Total Ash
(%)
Soluble
Carbohydrates(%)
Energy
(Kcal/100g)
Ugali (whole maize) 66.14±1.50 2.74±0.05 1.65±0.35 2.04±0.50 1.48±0.05 92.09±0.27 403.70
Ugali (millet) 65.06±1.15 0.94±0.15 2.49±0.05 3.86±0.25 3.03±0.05 89.87±0.30 385.62
Ugali (sorghum) 63.16±0.20 2.22±0.12 1.11±0.11 3.20±0.25 2.20±0.02 90.17±0.25 391.50
Ugali (cassava) 71.63±1.00 2.61±0.16 1.52±0.14 1.23±0.10 2.33±0.20 92.46±0.25 401.87
Ugali (cassava-millet) 68.34±0.50 1.07±0.25 1.67±0.02 3.00±0.15 1.64±0.15 92.80±0.50 392.15
Ugali (cassava-sorghum) 68.09±0.10 1.85±0.40 1.50±0.60 2.63±0.20 2.23±0.06 91.79±0.12 395.07
Ugali (cassava-sorghum-millet) 65.70±0.13 1.79±0.03 1.55±0.10 2.24±0.15 2.51±0.20 92.07±0.24 395.07
Ugali (sifted maize meal) 69.03±0.60 2.13±0.15 7.65±0.05 1.19±0.03 0.77±0.05 88.34±0.30 457.66
Cowpeas leaves 80.17±0.25 36.86±0.05 17.85±0.25 15.23±0.12 11.20±0.06 18.86±0.05 509.34
Silver fish 61.89±0.24 18.00±0.25 33.59±1.10 1.99±0.03 11.99±0.10 34.45±0.03 438.14
Sweet potatoes 66.96±0.50 0.12±0.30 2.94±0.60 2.97±0.35 3.66±0.05 90.04±0.03 378.94
Cassava 63.67±0.25 3.70±0.15 4.82±0.15 3.22±0.45 3.17±0.10 78.81±0.45 374.26
Rice 70.00±1.00 3.30±0.05 8.90±0.44 1.07±0.35 1.20±0.02 86.60±0.12 413.84
Beans 71.43±0.50 7.56±0.20 27.23±0.30 5.18±0.50 3.92±0.02 56.12±0.15 411.80
Note: All analyses were performed in duplicate and averages ± standard deviations computed. Contents are in“grams per 100g” reported on “dry weight basis” except for moisture content.
Ugali generally had higher carbohydrate content although the carbohydrate content of whole
maize meal ugali was slightly higher than that of cassava-sorghum ugali. Silver fish had the
59
highest protein content while cowpea leaves and silver fish were rich in lipids since they were
fried and stewed respectively using vegetable oil.
Whole maize ugali recorded slightly higher carbohydrate content than cassava-sorghum
possibly due to the final consistency achieved. Cassava-sorghum is difficult to cook since it
forms a sticky mass and consequently has slightly higher moisture content. Likewise, similar
products from West Africa recorded high carbohydrate content (Omoregie and Osagie, 2008)
despite the different processing methods. Slightly lower carbohydrate content which could be
attributed to different preparation methods especially as regards to the amount of flour used to
obtain the desired consistency has been reported (Ruhembe et al., 2014). Cowpea leaves and
silver fish had high fat content translating to high energy values.
On the other hand sweet potatoes had higher carbohydrate content (90.04 %) than cassava
(78.81 %). The dry matter and fibre, fat and protein were higher for cassava (36.33 %) than for
sweet potatoes (33.04 %). In a separate study conducted in Nigeria, boiled sweet potato had a
carbohydrate content of 70.54 % (Abubakar et al., 2010). The differences could be attributable
to the variety since starch content has been found to vary widely (9.5 % to 40.5 %) among
different cassava varieties (Ntawuruhunga and Okidi, 2010). The average dry matter content of
cassava in this study was found to be within the range of 24 to 42 % reported for different
varieties (Ntawuruhunga and Okidi, 2010) while that of sweet potatoes was also within the
range of 30.2 % to 39.2 % reported for different varieties in the neighboring Uganda (Nabubuya
et al., 2012).
60
CHAPTER 5: GLYCEMIC INDICES OF CASSAVA AND SWEET POTATOES
ABSTRACT
There is a rapidly growing interest on the Glycemic Index (GI) with regard to its role in
preventing and managing diabetes mellitus. Glycemic index is used to classify carbohydrate-
rich foods especially those containing at least 15 % carbohydrates. This study therefore
investigated the glycemic indices of cassava and sweet potato which are widely produced and
consumed in Western Kenya. Proximate analysis of the samples was conducted according
AOAC methodology and glycemic index was determined according to the methodology
recommended by FAO/WHO using eight healthy volunteers. The results of the proximate
analysis showed the carbohydrate content for cassava to be 90 % and sweet potato at 78% on
dry weight basis. Cassava had a glycemic index 74 which is considered high while sweet
potatoes had a GI of 65 which is medium. However these test foods were not significantly
different (p>0.05). Despite differences in GI both cassava and sweet potato had high glycemic
load. Thus, they should be consumed in moderation by individuals suffering from diabetes
mellitus.
Published as:
Ebere RA, Imungi JK and Kimani VN (2017). Glycemic responses of cassava and sweetpotatoes consumed in Western Kenya. Food Science and Quality Management; 63: 7-12.

61
5.1 INTRODUCTION
Glycemic index (GI) refers to a number (index) used to rank carbohydrate-rich foods depending
on how they raise the blood sugar levels (FAO/WHO, 1998). Carbohydrates are the major
influential dietary component since it’s comprised of sugars and starches that are broken down
in the digestive system into glucose that enters the bloodstream (FAO/WHO, 1998). Of
particular importance is the rate at which these carbohydrates are broken down to glucose as
indicated by the Glycemic Index (GI) which differs among different foods (Bahado-Singh,
Riley, Wheatley and Lowe, 2011; Eli-Cophie, Agbenorhevi and Annan, 2017). Meals with low
GI have been suggested to reduce both postprandial blood glucose and insulin responses as
opposed to those with a high GI (Brand-Miller et al., 2009).
GI is determined by dividing the incremental area under the curve for a test meal by incremental
area under curve of reference food (glucose or white bread) after consuming 50 g available
carbohydrates for the test food and glucose (standard). GL is an alternative measure of blood
sugar response and it is computed by dividing the GI of the food by the available carbohydrate
and multiplying by 100 (Jenkins et al., 1981). A high dietary glycemic load (GL) from
carbohydrates has been associated with increased risk of diabetes mellitus and heart disease
(Choudhary, 2004; FAO/WHO, 1998; Liu et al., 2000).
The GI has been found to vary depending on their origin, variety, processing and preparation,
maturity, other nutrients consumed with the food, the time of the day the GI is measured, the
method used to measure the GI and the physical and chemical characteristics of the foods (Pi-
Sunyer, 2002; Foster-Powell et al., 2002; Arvidsson-Lenner et al., 2004; Lin, Wu, Lu and Lin,
2010; Bahado-Singh et al., 2011; Eli-Cophie et al., 2017).

62
GI and GL concepts have taken into consideration the carbohydrate quality and quantity issues
as the influence postprandial glucose levels (Wheeler and Pi-Sunyer, 2008). However, in order
to guide on food choices, it is advisable not to consider the GI alone but in relation to other
nutritional components of the food (Arvidsson-Lenner et al., 2004; Venn and Green, 2007;
Riccardi, Rivellese and Giacco, 2008). For example the food might be of low GI but contain
high amount of fats which may impart negatively on health.
Although the significance of GI is still unclear in healthy people (Arvidsson-Lenner et al.,
2004), knowledge of the GI of starchy foods is important in the management and even
prevention of diabetes mellitus (Lin et al 2010). For example, low and medium GI foods may be
beneficial to people suffering from diabetes (Arvidsson-Lenner et al., 2004; Allen et al., 2012).
Cassava (Manihot esculenta Crantz) and sweet potato (Ipomoea batatas L.) are carbohydrate-
rich, drought tolerant crops which are widely produced and consumed in developing countries
(FAO, 1998; Ogbuji and David-Chukwu, 2016). They are important in ensuring food security
(FAO, 1998). Cassava comes first followed by sweet potato in terms of production and
consumption worldwide among the tuberous roots (Padmaja et al., 2012), similar to observation
made in Western Kenya (Nungo, 1999). Sweet potato varieties include white-, orange- yellow-
and purple-fleshed as discussed earlier in (chapter 4, 2008). In Western Kenya, common
varieties include the white-fleshed and a few yellow-fleshed (Nungo, 1999) and orange-fleshed
varieties. The preparation methods include boiling, roasting and mashing with other foods
(Nungo, 1999).
Although the GI of cassava and sweet potato has been investigated elsewhere, the same has not
been conducted in Western Kenya considering the variations in origin, variety and preparation

63
methods. This study therefore investigated the GI and GL of cassava and sweet potato
consumed in Western Kenya. This study fills a gap in knowledge on the GI of carbohydrate-rich
foods consumed in Kenya.
5.2 STUDY DESIGN AND METHODOLOGY
5.2.1 Experimental Design
Eight healthy adults were served cassava, sweet potato and glucose on separate occasions. This
was done each day after 10-12 hours of overnight fast. Testing started at 0800 hours and
participants were requested to eat the last meal by 2100 hours. Subjects were requested to avoid
strenuous physical activity and alcohol on the day prior to the experiment. The samples
contained 50 g available carbohydrate. 50 g of glucose was given as a reference food on three
separate occasions. All samples were consumed with 250 ml of water. Blood glucose was
recorded at different time intervals for a total period of 2 hours.
5.2.2 Participants’ Inclusion and Exclusion Criteria
The participants were chosen on voluntary basis. Inclusion criteria included healthy males and
females with normal BMI, blood pressure, blood sugar and not on medication; the females were
not pregnant or lactating; between 18–75 years old and not suffering from diabetes mellitus.
Exclusion criteria included those with HIV/AIDS or diabetes; BMI ≥ 25kg/m2; those on
medication and those uncomfortable with the experimental procedures (Robert et al., 2008;
Wolever et al., 2008).
5.2.3 Preparation of Test Foods
The food samples were locally purchased from Amagoro market in Busia County of Western
Kenya. Anhydrous glucose was purchased from a local supermarket in Amagoro. The food
samples included fresh cassava (Manihot esculenta Crantz) and white-fleshed sweet potato

64
(Ipomoea batatas L.). These foods were peeled, washed and boiled in sufficient amount of
water until tender. Excess water was then drained off.
5.2.4 Proximate Analyses
Proximate composition of the foods was analyzed according to the AOAC official methods as
described in Chapter four.
5.2.5 Blood Sugar Determination
The food portions were packed in similar containers for each participant. Each participant
consumed glucose as a standard or reference food on three different occasions with blood sugar
being recorded on each occasion. The test foods were consumed with 250 ml of water. The
anhydrous glucose was dissolved in same amount of water before drinking. Test meals were
consumed within 7 minutes. Timing for blood samples started with the first bite of the test meal
and results recorded in a table in the following time intervals: 0 (fasting blood sugar), 15, 30,
45, 60, 90 and 120 minute after consuming the test food. Blood glucose levels were measured
using a glucometer (On-Call Plus ACON Laboratories, Inc.USA). Participants’ finger was
pricked using a sterile lancet. Blood sample was applied directly to the end tip of the test strip
which was connected to the blood glucose meter and the result was shown on the meter display.
5.2.6 Ethical Approval
Kenyatta National Hospital/University of Nairobi, Research and Ethics Committee approved
this study. All subjects signed an informed consent form before commencing the experiment.
65
5.2.7 Data Analysis
Blood sugar against time was plotted in Microsoft Excel spreadsheets using a scatter diagram.
Linear mixed effect model of SPSS package version 20.0 was used to determine whether the
means of the samples were different (p set at 0.05). The IAUC was then calculated using the
trapezoidal rule (FAO/WHO, 1998; Wolever, 2003; Omoregie and Osagie, 2008). The glycemic
index (GI) was computed using the formula: GI= IAUC for the test food ÷ IAUC for reference
food ×100. The glycemic index of a food was obtained as a mean of the glycemic index of the
food by different individuals (FAO/WHO, 1998). Data was then presented by graphs, means
and standard deviation values. The glycemic load (GL) was calculated by multiplying the
dietary carbohydrate content with the GI of the food and dividing by 100 (Foster-Powell et al.,
2002). GL = GI/100 x Net Carbohydrates (Net carbohydrates = total carbohydrates - dietary
fibre). The portion sizes served to participants contained 50 g available carbohydrates.
5.2 RESULTS AND DISCUSSION
5.2.1 Characteristics of the Subjects
The study involved eight volunteers drawn from Amagoro division of Western Kenya. They
were 22 to 40 years old with a mean age of 32.6±5.32 years. The BMI ranged from 18.75 to
24.8 kg/m2 with a mean of 20.67±2.09 kg/m2. The mean fasting blood sugar was 4.8±0.29
mmol/L. The mean systolic and diastolic blood pressure was 124±10.14 and 74.4±4.2 mm Hg
respectively. These participants were all healthy as shown by their BMI (18.5-24.9 kgm-2)
(Cornelis et al., 2014; Veghari et al., 2010; Gezawa et al., 2015), fasting blood sugar (≤ 5.5
mmol/L) (ADA, 2012; ADA, 2000) and blood pressure below 140/90 mmHg (Weycker et al.,
2008; Zanella et al., 2001; ADA, 2002; Ayah et al., 2013; Gezawa et al., 2015; Chege, 2016). In

66
addition these individuals were not on any medication due to the possibility of the illness or
medication to interfere with an individual’s metabolism and consequently the GI of the food.
5.2.2 Blood Sugar Response Curves
The nutritional composition of the test foods is as described in Table 12 of Chapter 4. Despite
the fact that all the foods consumed supplied 50 g available carbohydrates, the quality of the
carbohydrates differed depending on the source. Glucose produced the highest response
followed by cassava with sweet potato showing the least response (Figure 2). This is because
glucose is directly absorbed into the blood stream as opposed to cassava and sweet potatoes
whose carbohydrate has to been broken down to glucose before it’s taken up into the blood.
These foods also contain other macronutrients which have been known to influence the blood
sugar response (Pi-Sunyer, 2002; Beals, 2005). All the foods reached the peak response at 45th
minute.
Figure 2: Blood glucose response curves for cassava, sweet potato and glucose

67
The incremental area under the blood glucose response curves (IAUC) were calculated for each
subject for the test foods and the standard (glucose). The glycemic index (GI) was computed
using the formula: GI= IAUC for the test food ÷ IAUC for reference food ×100 (Table 13). The
GI of a food was obtained as a mean of the GI of the food by different individuals. The GL was
then calculated by multiplying the dietary carbohydrate content with the GI of the food and
dividing by 100.
5.2.3 Glycemic Indices and Glycemic Load
In order to provide an equivalent of 50 g available carbohydrates, 175 g of cassava and 168 g of
sweet potatoes were served to participants. Cassava and sweet potato both had high glycemic
load (GL) despite sweet potato having a moderate glycemic index (GI) (Table 13).
Table 13: Glycemic indices and glycemic loads of cassava and sweet potato
Food type GI (mean±sd) GL (mean±sd) p-value
Cassava 74.10±17.85 36.99±9.42 0.16
Sweet potato 64.54±20.13 32.27±10.76
The two test foods were not statistically different (p>0.05). This could be because of the close
similarity between starch composition of these foods both of which belong to root and tubers
classification. The mean GI of these two foodstuffs which are not statistically different would
be 69 thereby classifying them as medium GI. However, the load remains high (>20).
5.2.4 Glycemic Index of Cassava
The glycemic index for boiled cassava was 74 ranking it a high GI food. This is consistent with
other finding that reported cassava food products as having high GI (Omoregie and Osagie,
2008; Ogbuji and David-Chukwu, 2016). Processing and preparation methods have a strong
influence on the glycemic index (GI) of cassava (Eli-Cophie et al., 2017). Boiling has been

68
known to increase starch gelatinization and digestibility (Pi-Sunyer, 2002; Lin et al., 2010;
Bahado-Singh et al., 2011). Cassava also has high amylopectin to amylose ratio (USDA, 2002)
which may have been responsible for the high GI since amylopectin being more branched is
more susceptible to amylolytic enzymes (Arvidsson-Lenner et al., 2004). Amylose on the other
hand tends to form secondary structures that are difficult to disperse making it to be slowly
digested than amylopectin (Thorne et al., 1983; Gallant et al., 1992). In fact the amylose content
may vary within the same variety depending on differences in cultural conditions and
geographic location/origin (Gao et al., 2014).
5.2.5 Glycemic Index of Sweet potato
The GI of sweet potato was medium in this study. This is in agreement with Foster-Powell et al
(2002) who reported a GI of 61. However, another study recorded a low GI for the boiled sweet
potato among the different varieties investigated in Jamaica (Bahado-Singh et al., 2011). This
could be due to the sweet potato variety (Bahado-Singh et al., 2011) as well as origin (Pi-
Sunyer, 2002; Foster-Powell et al., 2002). Food processing preparation method seem to play a
major role as opposed to variety (Bahado-Singh et al., 2011; Allen et a., 2013; Eli-Cophie et
al., 2017) although some researchers dispute this finding arguing that food preparation methods
has no effect on glycemic indices of foods (Ogbuji and David-Chukwu, 2016). As opposed to
baking and roasting, boiled sweet potato had the lowest GI (Bahado-Singh et al., 2011).
Steamed, baked and microwaved sweet potato exhibited moderate GI while raw sweet potato
and dehydrated sweet potato recorded a low GI (Allen et al., 2012). Despite the many findings
of low to medium GI for sweet potatoes, some research has reported a high GI (Allen et al.,
2013) which could be due to difference in variety and geographical location (Pi-Sunyer, 2002;
Foster-Powell et al., 2002; Gao et al., 2014).

69
The results of this study support earlier review which recommended the consumption of sweet
potatoes in moderation by diabetic individuals due to lack of sufficient evidence to recommend
sweet potato to people suffering from diabetes mellitus (Dutta, S., 2015). This could be because
sweet potatoes can cause a higher rise in blood sugar among diabetics (Fatema et al., 2011).
5.2.6 Glycemic Load of Cassava and Sweet Potato
Both foodstuff possessed a high glycemic load (>20). This is because of the large portion sizes
normally consumed (about 400 g of cassava and 560 g of sweet potato at each serving). This
explains why despite the average of the two ranking them as moderate GI, they have a high
glycemic load. This is because the GL accounts not only on the quality of carbohydrate as
measured by the GI but also the total amount of available carbohydrate in the diet (Foster-
Powell et al., 2002). Other studies above (Bahado-Singh et al., 2011; Allen et al., 2013) carried
conducted ton glycemic indices of sweet potato did not consider the GL. Foster-Powell et al
(2002) reported a GL of 17 as opposed to a GL of 32 in this study. This would be because of the
differences in the portion size which was 150 g as opposed to 560 g in this study. Studies on the
GI of cassava (Omoregie and Osagie, 2008; Ogbuji and David-Chukwu, 2016; Eli-Cophie et al.,
2017) did not calculate the GL.

70
CHAPTER 6: EFFECT OF ACCOMPANIMENT ON GLYCEMIC RESPONSES OF
THICK PORRIDGE “UGALI” AND RICE
ABSTRACT
The term glycemic index has been used to categorize carbohydrate-rich foods on the basis of
their blood sugar raising potential. Despite the existence of a table of glycemic indices of some
foods, the glycemic indices of staple foods consumed in Kenya is still very scanty. This study
therefore was designed to evaluate the glycemic indices (GI) of rice and ugali (stiff/thick
porridge), the most commonly consumed foods in Kenya in the way they are normally prepared
and consumed. Ugali is usually served with side dishes of cowpea leaves or beef and rice is
usually served with either beans or beef stews. The foods were analyzed for proximate
composition using the AOAC methods. Glycemic index was determined following FAO/WHO
recommended methodology. From the results of proximate analyses, it was established that the
content of carbohydrates varied in the order: Ugali > rice > beans > cowpea leaves. Glycemic
indices followed the order plain rice > ugali and beef > rice and beef > rice and beans equal to
plain ugali > ugali and cowpea leaves > plain beans. These GI values were found to be
significantly different (p<0.05). All the foods had a high glycemic load (≥20). Cowpea leaves
and beans lowered the GI of ugali and white rice respectively. This GI lowering is especially
important in the dietary management of diabetes mellitus.
Published as:
Ebere RA, Imungi JK and Kimani VN (2017). Proximate composition, energy contents andblood sugar responses of stiff porridge and rice meals consumed in Kenya. Food Science andQuality Management; 63:64-73.
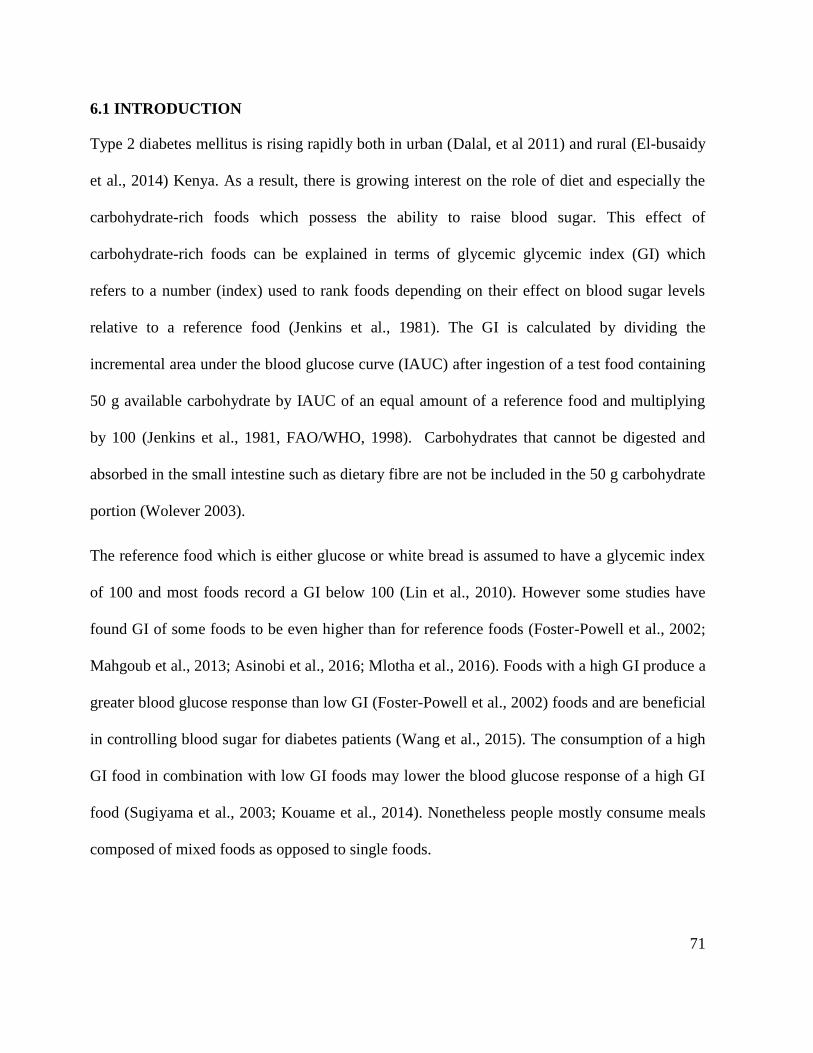
71
6.1 INTRODUCTION
Type 2 diabetes mellitus is rising rapidly both in urban (Dalal, et al 2011) and rural (El-busaidy
et al., 2014) Kenya. As a result, there is growing interest on the role of diet and especially the
carbohydrate-rich foods which possess the ability to raise blood sugar. This effect of
carbohydrate-rich foods can be explained in terms of glycemic glycemic index (GI) which
refers to a number (index) used to rank foods depending on their effect on blood sugar levels
relative to a reference food (Jenkins et al., 1981). The GI is calculated by dividing the
incremental area under the blood glucose curve (IAUC) after ingestion of a test food containing
50 g available carbohydrate by IAUC of an equal amount of a reference food and multiplying
by 100 (Jenkins et al., 1981, FAO/WHO, 1998). Carbohydrates that cannot be digested and
absorbed in the small intestine such as dietary fibre are not be included in the 50 g carbohydrate
portion (Wolever 2003).
The reference food which is either glucose or white bread is assumed to have a glycemic index
of 100 and most foods record a GI below 100 (Lin et al., 2010). However some studies have
found GI of some foods to be even higher than for reference foods (Foster-Powell et al., 2002;
Mahgoub et al., 2013; Asinobi et al., 2016; Mlotha et al., 2016). Foods with a high GI produce a
greater blood glucose response than low GI (Foster-Powell et al., 2002) foods and are beneficial
in controlling blood sugar for diabetes patients (Wang et al., 2015). The consumption of a high
GI food in combination with low GI foods may lower the blood glucose response of a high GI
food (Sugiyama et al., 2003; Kouame et al., 2014). Nonetheless people mostly consume meals
composed of mixed foods as opposed to single foods.

72
With glucose as a reference, foods have been classified into low (<55), medium (55-69) and
high (>70) GI (Beals, 2005). In addition to the GI of the food, it is also important to investigate
the overall blood sugar response to a meal in relation to the quantity consumed. Thus, glycemic
load (GL) has been used as an alternative measure for blood sugar responses. The (GL) takes
account of both the quality and quantity of the food consumed. The GL is calculated by
multiplying the available carbohydrate content with the GI of the food and dividing by 100
(Foster-Powell et al., 2002).
Despite the much emphasis and benefits attributed to the GI concept especially with regard to
management of metabolic conditions such as diabetes mellitus, GI of most traditional foods in
Kenya is yet to be evaluated. This will guide better the promotion of local foods to the
community (Idril et al., 2013), even for management of such conditions as diabetes mellitus
although the GI concept is applicable for foods containing at least 15 g available carbohydrates
per serving (Arvidsson-Lenner et al., 2004).
The experts have stated an urgent need to pass the information to health professionals and the
general public about responses (GI and GL) of foods (Augustin et al., 2015) yet the glycemic
responses of most foods consumed in Kenya remain unknown. This study considered two major
staple foods in Kenya which include stiff or thick porridge (ugali) which is mostly prepared
from maize flour (Wanjala et al., 2016) and locally grown rice. These carbohydrate-rich foods
are usually consumed with a side dish. This study therefore investigated the GI/GL of ugali and
rice and the effect of various side dishes on their GI/GL.
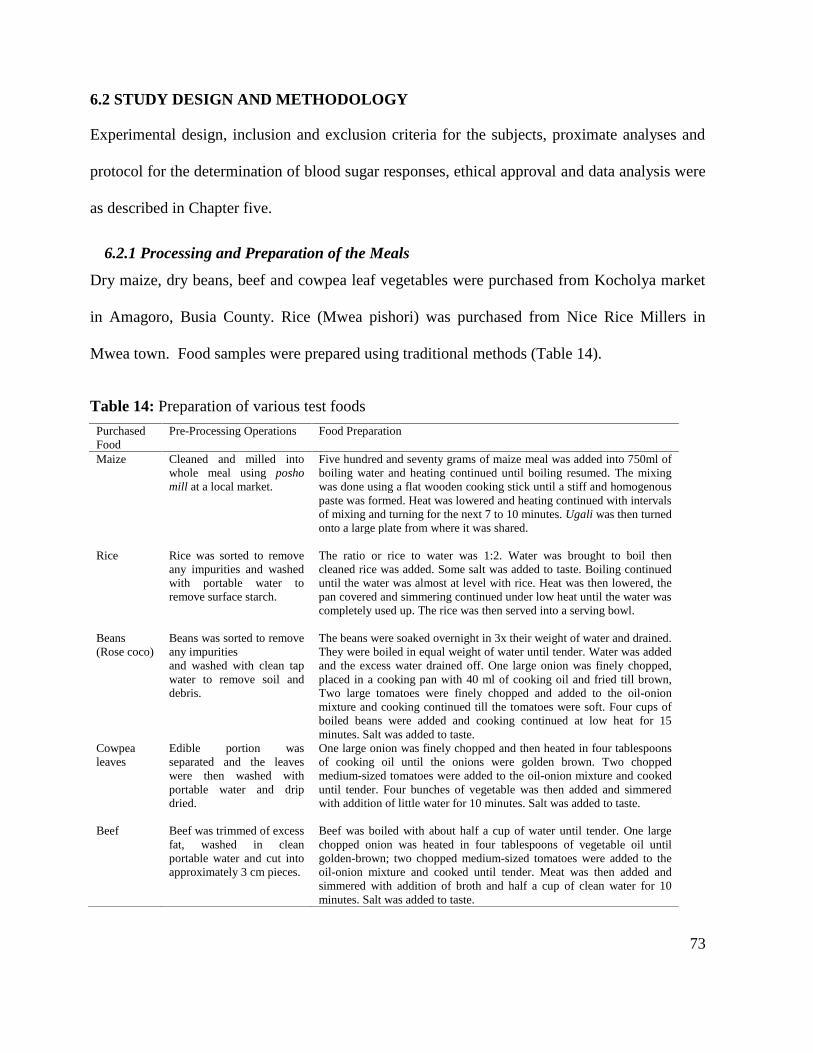
73
6.2 STUDY DESIGN AND METHODOLOGY
Experimental design, inclusion and exclusion criteria for the subjects, proximate analyses and
protocol for the determination of blood sugar responses, ethical approval and data analysis were
as described in Chapter five.
6.2.1 Processing and Preparation of the Meals
Dry maize, dry beans, beef and cowpea leaf vegetables were purchased from Kocholya market
in Amagoro, Busia County. Rice (Mwea pishori) was purchased from Nice Rice Millers in
Mwea town. Food samples were prepared using traditional methods (Table 14).
Table 14: Preparation of various test foods
PurchasedFood
Pre-Processing Operations Food Preparation
Maize Cleaned and milled intowhole meal using poshomill at a local market.
Five hundred and seventy grams of maize meal was added into 750ml ofboiling water and heating continued until boiling resumed. The mixingwas done using a flat wooden cooking stick until a stiff and homogenouspaste was formed. Heat was lowered and heating continued with intervalsof mixing and turning for the next 7 to 10 minutes. Ugali was then turnedonto a large plate from where it was shared.
Rice Rice was sorted to removeany impurities and washedwith portable water toremove surface starch.
The ratio or rice to water was 1:2. Water was brought to boil thencleaned rice was added. Some salt was added to taste. Boiling continueduntil the water was almost at level with rice. Heat was then lowered, thepan covered and simmering continued under low heat until the water wascompletely used up. The rice was then served into a serving bowl.
Beans(Rose coco)
Beans was sorted to removeany impuritiesand washed with clean tapwater to remove soil anddebris.
The beans were soaked overnight in 3x their weight of water and drained.They were boiled in equal weight of water until tender. Water was addedand the excess water drained off. One large onion was finely chopped,placed in a cooking pan with 40 ml of cooking oil and fried till brown,Two large tomatoes were finely chopped and added to the oil-onionmixture and cooking continued till the tomatoes were soft. Four cups ofboiled beans were added and cooking continued at low heat for 15minutes. Salt was added to taste.
Cowpealeaves
Edible portion wasseparated and the leaveswere then washed withportable water and dripdried.
One large onion was finely chopped and then heated in four tablespoonsof cooking oil until the onions were golden brown. Two choppedmedium-sized tomatoes were added to the oil-onion mixture and cookeduntil tender. Four bunches of vegetable was then added and simmeredwith addition of little water for 10 minutes. Salt was added to taste.
Beef Beef was trimmed of excessfat, washed in cleanportable water and cut intoapproximately 3 cm pieces.
Beef was boiled with about half a cup of water until tender. One largechopped onion was heated in four tablespoons of vegetable oil untilgolden-brown; two chopped medium-sized tomatoes were added to theoil-onion mixture and cooked until tender. Meat was then added andsimmered with addition of broth and half a cup of clean water for 10minutes. Salt was added to taste.

74
6.3 RESULTS AND DISCUSSION
6.3.1 Proximate Composition
The proximate composition of the meals was calculated as grams per 100 g on “wet weight
basis” and energy values were expressed as Kcal/100 g. All analyses were performed in two
replications. Means and standard deviation values were then computed. Plain ugali had the
highest carbohydrate content, while cowpea leaves had the lowest following the order ugali >
rice > beans > cowpea leaves. Protein content was in the order of beans > cowpea leaves > rice
> ugali while fibres followed the order, cowpea leaves > beans > ugali > rice (Table 15).
Table 15: Proximate composition of the meals (% mean ± standard deviation)
Food Moisture Fat Protein Fibre Ash CHO* Energy
(Kcal/100g)
Ugali 66.14±1.50 0.93±0.05 0.56±0.35 0.69±0.50 0.50±0.05 31.18±0.27 135.33
Cowpeas leaves 80.17±0.25 7.31±0.05 3.54±0.25 3.02±0.12 2.22±0.06 3.74±0.05 94.95
Boiled white rice 70.00±1.00 0.99±0.05 2.67±0.44 0.32±0.35 0.36±0.02 25.98±0.12 123.51
Bean stew 71.43±0.50 2.16±0.20 7.78±0.30 1.48±0.50 1.12±0.02 16.03±0.15 114.68
*Carbohydrates
6.3.2 Blood Sugar Responses to Ugali Meals
The blood sugar responses are presented separately for ugali meals and for rice meals. There
was a sharp rise in blood sugar in the first 30 minutes of consuming each meal except for plain
ugali (Figure 3). The reference glucose presented the highest rise each time. Ugali meals
reached peak at 30th minute as opposed to glucose and plain ugali that peaked at 45th minute.
Although plain ugali showed lower response, it is rarely consumed as so, but with a relish.
Cowpea leaves give lower response as opposed to beef. These two are some of the commonly
used accompaniments to ugali.
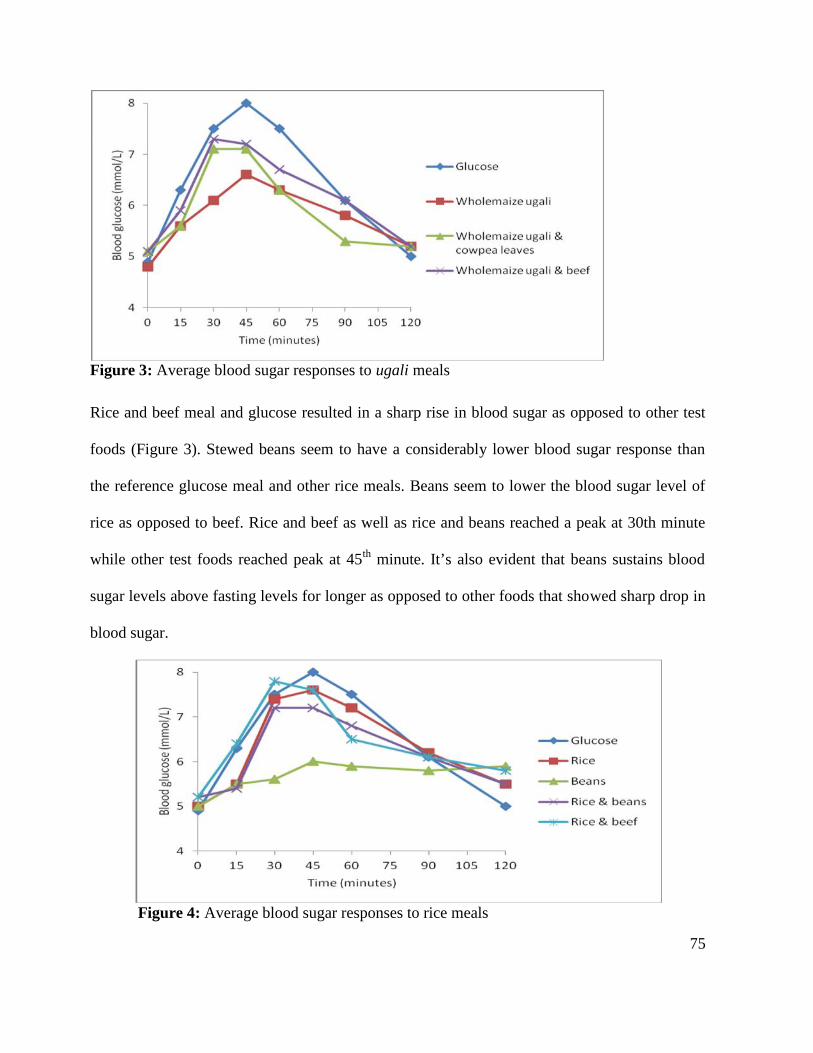
75
Figure 3: Average blood sugar responses to ugali meals
Rice and beef meal and glucose resulted in a sharp rise in blood sugar as opposed to other test
foods (Figure 3). Stewed beans seem to have a considerably lower blood sugar response than
the reference glucose meal and other rice meals. Beans seem to lower the blood sugar level of
rice as opposed to beef. Rice and beef as well as rice and beans reached a peak at 30th minute
while other test foods reached peak at 45th minute. It’s also evident that beans sustains blood
sugar levels above fasting levels for longer as opposed to other foods that showed sharp drop in
blood sugar.
Figure 4: Average blood sugar responses to rice meals
76
6.3.3 Glycemic Indices of Ugali and Rice Meals
The GI concept has been used to rank carbohydrate-rich foods depending on how they raise the
blood sugar after consumption. It is thus only appropriate to be applied to foods that provide at
least 15 g or 20 g available carbohydrates per normal serving (Arvidsson-Lenner et al., 2004).
This study therefore considered the main carbohydrate-rich staple foods consumed in Kenya.
The sample size for glycemic index (GI) determination provided 50 g available carbohydrate
and this amount was used to compute the glycemic load. The GI was highest in rice and lowest
in beans. Meals containing beef had higher GI as opposed to meals composed of beans and
cowpea leaves. Although incorporating beef in rice seem to have lowered the GI of rice, beef
seems to have increased the GI of ugali. In this analysis beef was assumed to provide zero
carbohydrates (Table 16).

77
Table 16: Food ration sizes, glycemic indices (GI) and glycemic loads (GL) of the meals
Food sample (ration size) GI GI class p-value GLPlain ugali (160 g) 62±25.3 Medium
0.035
30.9±11.8
Ugali (158 g) & cowpea leaves (50 g) 45±18.7 Low 22.7±8.7
Ugali (160 g) & beef (150 g) 71±19.0 High 35.4±8.6
Rice (192 g) 77±16.1 High 38.6±8.0
Beans (312 g) 44±28.3 Low 21.8±15.1
Rice (142 g) & beans (80 g) 62±14.6 Medium 31.1±7.8
Rice (192g) & beef (150g) 69±21.8 Medium 34.5±11.7
These foods were found to be statistically different (p>0.05) in terms of glycemic index
6.3.4 Glycemic Indices of Ugali Meals
The carbohydrate content of ugali in this study was found to be higher compared to that
consumed in Tanzania (Table 16). This is attributable to the different cooking methods with
Tanzanians ugali having a higher moisture content of 76.54% as opposed to 66.14% reported in
this study (Ruhembe et al., 2014). The glycemic index of plain whole maize ugali was medium
(62). However, ugali is always accompanied by a side dish/relish. Consuming ugali with beef
raised the GI while cowpea leaves reduced the GI of ugali. The glycemic index of whole maize
ugali consumed with beef was high (71) in this study as opposed to low (51) in a study
conducted in Tanzania (Ruhembe et al., 2014). This could be because in this study, it was
assumed that beef had zero carbohydrate content. The difference could also be attributed to
different methodology and food processing/preparation methods including the foods’ particle
size. For example a study on stiff porridges prepared from whole-maize flour and grits were
found to be about 94 and 110 respectively (Mlotha et al., 2016).
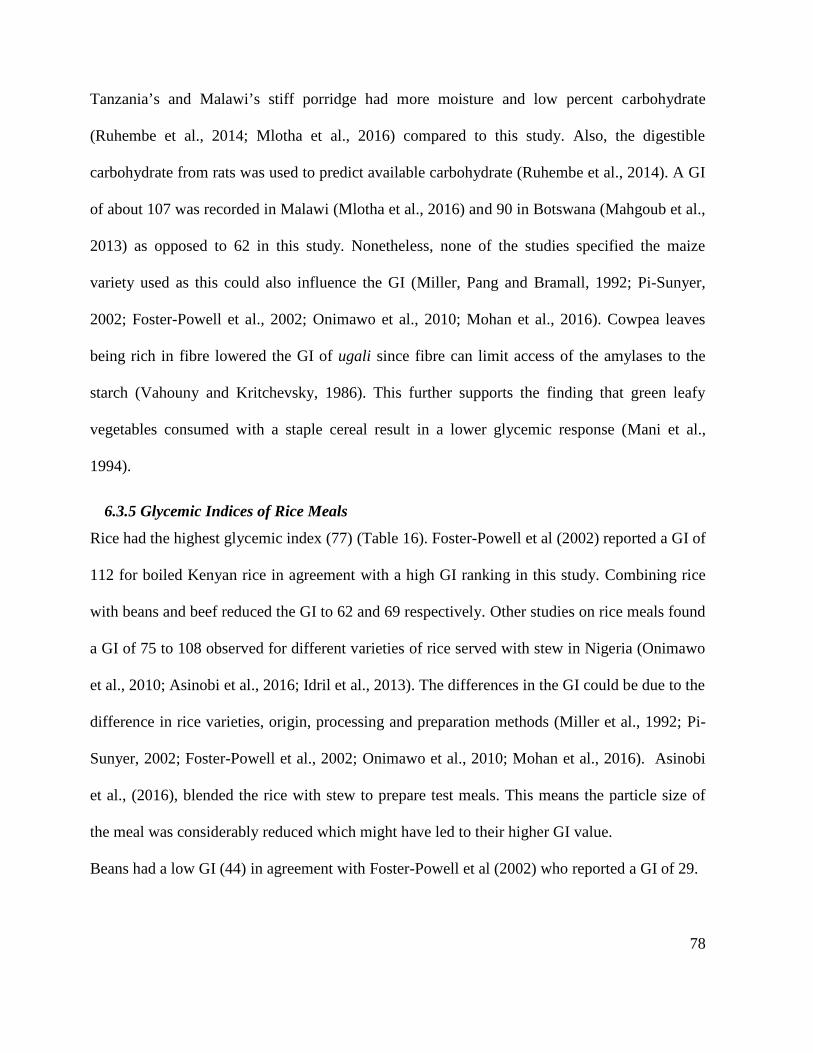
78
Tanzania’s and Malawi’s stiff porridge had more moisture and low percent carbohydrate
(Ruhembe et al., 2014; Mlotha et al., 2016) compared to this study. Also, the digestible
carbohydrate from rats was used to predict available carbohydrate (Ruhembe et al., 2014). A GI
of about 107 was recorded in Malawi (Mlotha et al., 2016) and 90 in Botswana (Mahgoub et al.,
2013) as opposed to 62 in this study. Nonetheless, none of the studies specified the maize
variety used as this could also influence the GI (Miller, Pang and Bramall, 1992; Pi-Sunyer,
2002; Foster-Powell et al., 2002; Onimawo et al., 2010; Mohan et al., 2016). Cowpea leaves
being rich in fibre lowered the GI of ugali since fibre can limit access of the amylases to the
starch (Vahouny and Kritchevsky, 1986). This further supports the finding that green leafy
vegetables consumed with a staple cereal result in a lower glycemic response (Mani et al.,
1994).
6.3.5 Glycemic Indices of Rice Meals
Rice had the highest glycemic index (77) (Table 16). Foster-Powell et al (2002) reported a GI of
112 for boiled Kenyan rice in agreement with a high GI ranking in this study. Combining rice
with beans and beef reduced the GI to 62 and 69 respectively. Other studies on rice meals found
a GI of 75 to 108 observed for different varieties of rice served with stew in Nigeria (Onimawo
et al., 2010; Asinobi et al., 2016; Idril et al., 2013). The differences in the GI could be due to the
difference in rice varieties, origin, processing and preparation methods (Miller et al., 1992; Pi-
Sunyer, 2002; Foster-Powell et al., 2002; Onimawo et al., 2010; Mohan et al., 2016). Asinobi
et al., (2016), blended the rice with stew to prepare test meals. This means the particle size of
the meal was considerably reduced which might have led to their higher GI value.
Beans had a low GI (44) in agreement with Foster-Powell et al (2002) who reported a GI of 29.

79
Consuming beans together with white rice lowered the GI of rice. This is in agreement with
earlier studies (Thompson et al., 2012) despite the difference in bean varieties. A similar effect
was observed in soybean products (Sugiyama et al., 2003). This could be because of the higher
fibre content of beans (Asinobi et al., 2016). Fibre-rich foods generally have a low glycemic
index (GI) and have been shown to lower postprandial glucose (Riccardi et al., 2008) since fibre
creates a physical barrier limiting the access of amylolytic enzymes to starch (Vahouny and
Kritchevsky, 1986). Asinobi et al., (2016) reported a GI of 87 for bean stew as opposed to 44 in
this study which could be attributed to the variety, processing and preparation methods. Asinobi
et al., (2016) served blended foods as opposed to whole beans in this study. It could therefore be
argued that the effect of fibre seems to be lost during food processing. However, the lowering
effect of beans on the GI of rice could also be due to the fact that beans being a low GI food
may have diluted the effect of the high GI rice. Nonetheless the GI of rice may be lowered by
other accompaniments such as groundnut sauce which was found to have a GI of 45 when
consumed with rice (Kouame et al., 2014).
This study involved healthy volunteers as opposed to diabetic individuals (Thompson et al.,
2012). This shows that a meal comprising of rice and beans which is widely consumed
worldwide (Thompson et al., 2012) could be used in both prevention and even management of
existing type 2 diabetes mellitus. It is therefore important that before low GI foods are
recommended to diabetic individuals, GI testing should first be undertaken among people
suffering from diabetes. Bangladeshi Irish potatoes and sweet potatoes for example produced a
much higher glucose response when given to diabetics (GI of 162 and 191 respectively) despite
the fact that they are low to medium GI foods (Fatema et al., 2011).

80
In general the differences in the GI among different studies could be attributed to the many
factors that influence the GI of foods including their origin (Pi-Sunyer, 2002; Foster-Powell et
al., 2002), variety (Pi-Sunyer, 2002; Foster-Powell et al., 2002; Allen et al., 2013; Idril, et al.,
2013; Atayoglu et al., 2016; Mohan et al., 2016), processing and preparation (Bahado-Singh et
al., 2011; Allen et al., 2012; Ogbuji and David-Chukwu, 2016), maturity of the food (Pi-Sunyer,
2002; Foster-Powell et al., 2002), other nutrients that are consumed with the food (Pi-Sunyer,
2002; Foster-Powell et al., 2002), as well as the physical/chemical characteristics of the foods
(Pi-Sunyer, 2002; Foster-Powell et al., 2002; Atayoglu et al., 2016).

81
CHAPTER 7: GLYCEMIC RESPONSES TO DIFFERENT TYPES OF UGALI
ABSTRACT
Glycemic responses which have been measured in terms of glycemic indices (GIs) differ among
various carbohydrate-rich foods. Despite the existence of a GI Table of most common foods,
the records of the GIs of most Kenyan traditional foods still remain scanty. This study therefore
evaluated the GIs of Kenya’s most popular food, ugali which is a stiff mash of maize meal,
cassava, finger millet, sorghum or any combinations thereof with water. This study considered
ugali from whole maize and cassava-sorghum flours which were served in accompaniment with
cowpea leaves or silver fish. The meals were analyzed for proximate composition by AOAC
method and the amount of carbohydrates varied in the order: whole-maize ugali > cassava-
sorghum ugali > silver fish > cowpea leaves. GI was determined following FAO/WHO
recommended methodology and results followed the order: cassava-sorghum ugali with silver
fish > GI whole maize ugali with silver fish = cassava-sorghum with cowpeas leaves > whole
maize ugali with cowpea leaves. These meals were found to be significantly different (p<0.05).
Cowpea leaves seem to lower the GI of ugali which is important in planning diets for people
with tendency to hyperglycemia such as diabetes mellitus patients.
Published as:
Ebere RA, Imungi JK and Kimani VN (2017). Glycemic responses of stiff porridge (ugali)meals consumed in Western Kenya. Food Science and Quality Management; 63: 55-63.

82
7.1 INTRODUCTION
As a result of rising cases of chronic diseases such as diabetes mellitus, there is a growing
interest globally on the effect foods rich in carbohydrates have on blood sugar responses. These
responses can be measured in terms of glycemic indices and glycemic loads. The term glycemic
index (GI) is used to indicate the potential of a food to raise blood glucose. GI is defined as “the
incremental area under the blood glucose curve (AUC) after ingestion of 50 grams available
carbohydrate of a test food , expressed as a percentage of the AUC of an equal amount of a
reference food (usually glucose or white bread)” (Jenkins et al., 1981). Foods have thus been
classified into low (GI <55), medium (55-70) and high GI (>70) using glucose as a standard
(Beals, 2005). High GI foods produce a greater rise in blood glucose than low GI foods (Foster-
Powell et al., 2002). Blood glucose response to a high GI food may however be lowered by
consuming the food in combination with a food that has low GI (Sugiyama et al., 2003).
Irrespective of the GI of a foodstuff, the blood sugar response to a carbohydrate-rich meal also
depends on the portion size. Glycemic Load (GL) has therefore been used as an alternative
measure for blood sugar response. The GL takes account of both the quality and quantity of the
meal consumed. The GL is calculated by multiplying the dietary carbohydrate content with the
GI of the food and dividing by 100. The higher the GL, the greater is the rise in blood glucose
(Foster-Powell et al., 2002). The GL of foods has thus been categorized as low (GL=1-10,)
medium (GL=11-19) and high (GL≥20) (Foster-Powell et al., 2002).
Although there are many studies on the GI and GL of foods, only limited information is
available on African traditional foods (Omoregie and Osagie, 2008). Ugali as it is popularly
known in Kenya is a thick porridge which is mainly prepared from maize (Zea mays L.) flour
83
and boiling water (Wanjala et al., 2016). It is served as the main dish usually for lunch or supper
and is consumed alongside a side dish (relish) composed of vegetables, fish, legumes, meats or
mixtures thereof (Karp and Karp, 1977; Onyango, 2014; Wanjala et al., 2016). Ugali may also
be prepared from flours of cassava (Manihot esculenta Crantz L.), finger millet (Eleusine
coracana (L.) Gaertn), sorghum (Sorghum bicolor (L.) Moench), or combinations thereof. The
choice depends on the preference, availability and cost of the raw materials as well as the
predominant crop in the locality (Wanjala et al., 2016). The stiff porridge is also widely
consumed in other parts of Africa including, Tanzania (Ruhembe et al., 2014), Malawi (Mlotha
et al., 2016), Cote d’Ivore (Kouame et al., 2015), Botswana (Mahgoub et al., 2013), Nigeria
(Omoregie and Osagie, 2008) and South Africa (Mbhenyane et al., 2001).
Using dietary intervention is one of the strategies being advocated for preventing and managing
diabetes as well as delaying the development of related complications (Otieno et al., 2003;
Ruhembe et al., 2014; Wanjala et al., 2016). Whole-milled maize, sorghum and finger millet
have been recommended for making ugali for people with DM2 in Western Kenya (Wanjala et
al., 2016) despite lack of data on their associated glycemic response. This study was therefore
designed to determine the nutritional composition and glycemic responses of some traditional
ugali-based meals consumed in Western Kenya and it is the first study so far of this kind. The
knowledge generated from this study is important in evaluating the potential of particular ugali
meals to pose risk of diabetes and thereby hinder or help in the management of DM2 both
locally and in other parts of Africa.

84
7.2 STUDY DESIGN AND METHODOLOGY
Experimental design, inclusion and exclusion criteria for the subjects, proximate analyses and
protocol for the determination of blood sugar responses, ethical approval and data analysis were
as described in Chapter five.
7.2.1 Preparation of Food
The food ingredients were locally purchased from Kocholya market in Busia County of Western
Kenya. The food samples included maize (Zea mays), fermented and sun-dried cassava
(Manihot esculenta) pieces, sorghum (Sorghum bicolor), cowpea (Vigna unguiculata) and silver
fish (Rastrineobola argetea) (locally known as omena or dagaa), Beef was purchased from a
local butchery. The foods were prepared using traditional recipes as shown in Table 17.
Table 17: Preparation of test meals
PurchasedFood
Pre-Processing Operations Food Preparation
Maizeugali
Maize was milled using hammermill at a local posho mill atKocholya market.
Five hundred and seventy grams of maize flour was added intofour cups (750ml) of boiling water and heating continued untilboiling resumes. The mixing is done using a flat woodencooking stick until a stiff paste was formed. Mixing thencontinued for the next 7 to 10 minutes.
Cassava &Sorghumugali (3:1)on weightbasis
The cassava had undergonefermentation, chopped intopieces and dried. The mixture ofcassava and sorghum was milledusing hammer mill at a localposho mill at Kocholya market.
Four cups of water was brought to boil then 490g of flour wasadded while stirring with a flat wooden cooking stick until athick semi-solid paste was formed. Mixing continued for thenext 5 to 7 minutes.
Silver fish Sorted and washed with warmwater.
Three tablespoons of cooking oil was heated in a cooking pan,1 large onion was added and fried until brown. Three mediumsized chopped tomatoes were added and cooked until tender.Three cups of silver fish were added and simmered in littlewater for 10 minutes. Salt was added to taste.
Cowpealeaves
Edible tender upper leaves werepicked from growing crop. Theleaves were then washed withwater.
One large onion was heated in four tablespoons of cooking oil.Two chopped medium-sized tomatoes were added and cookeduntil tender. Vegetable was then added and simmered withaddition of little water for 10 minutes. Salt was added to taste.

85
7.3 RESULTS AND DISCUSSION
7.3.1 Blood Sugar Responses to Test Meals
Blood sugar measurements were taken for 2 hours after each test meal or reference food
(glucose) was taken. After consumption, all the test foods resulted in a rise in blood sugar which
peaked at 30 and 45 minute (Figure 5). The highest peak was recorded for glucose followed by
cassava-sorghum ugali served with cowpea leaves. The samples were found to be significantly
different (p<0.05). Despite cassava-sorghum ugali meals reaching peak at 30 minutes, the
release of glucose seems to be sustained for longer as indicated by higher reading after two
hours as compared to whole maize ugali meals. All the test meals recorded a lower peak with
reference to glucose.
Figure 5: Blood response curves for test meals in relation to glucose
The incremental area under the blood glucose response curve was calculated for glucose
(standard) and each test food consumed by each subject. Cassava-sorghum ugali consumed with
silver fish had the largest area above the fasting level while whole maize ugali consumed with
cowpea leaves had the least (Table 18).
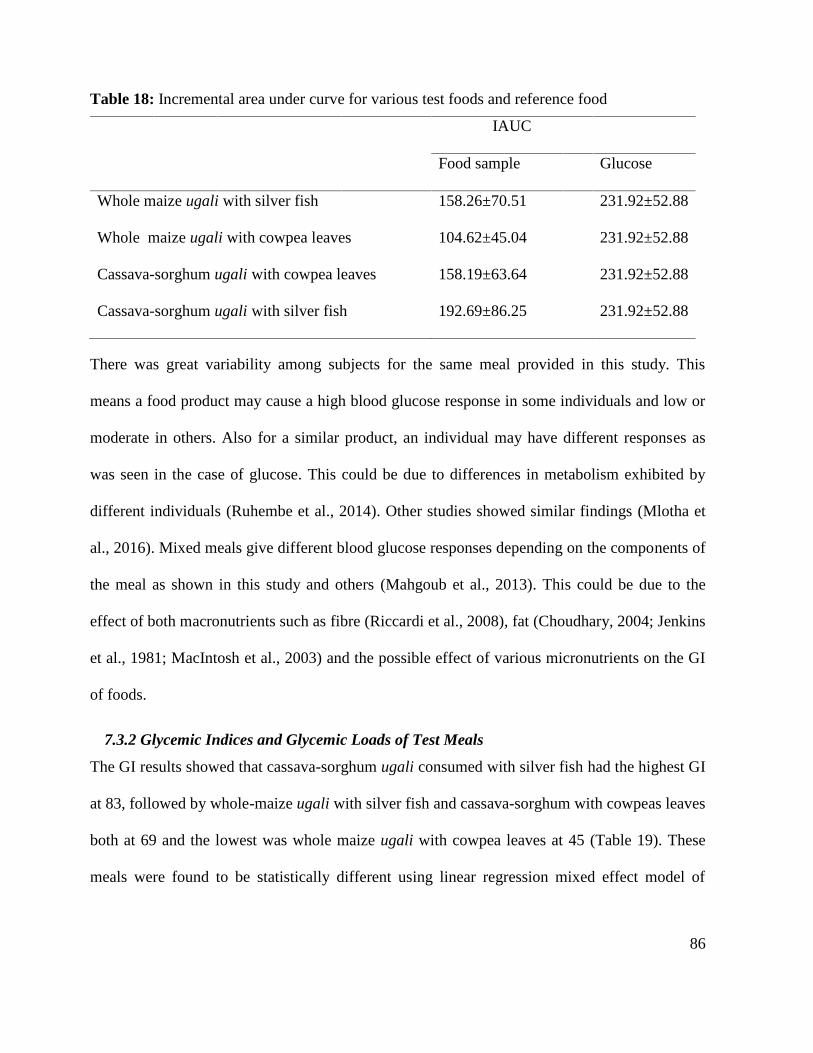
86
Table 18: Incremental area under curve for various test foods and reference food
IAUC
Food sample Glucose
Whole maize ugali with silver fish 158.26±70.51 231.92±52.88
Whole maize ugali with cowpea leaves 104.62±45.04 231.92±52.88
Cassava-sorghum ugali with cowpea leaves 158.19±63.64 231.92±52.88
Cassava-sorghum ugali with silver fish 192.69±86.25 231.92±52.88
There was great variability among subjects for the same meal provided in this study. This
means a food product may cause a high blood glucose response in some individuals and low or
moderate in others. Also for a similar product, an individual may have different responses as
was seen in the case of glucose. This could be due to differences in metabolism exhibited by
different individuals (Ruhembe et al., 2014). Other studies showed similar findings (Mlotha et
al., 2016). Mixed meals give different blood glucose responses depending on the components of
the meal as shown in this study and others (Mahgoub et al., 2013). This could be due to the
effect of both macronutrients such as fibre (Riccardi et al., 2008), fat (Choudhary, 2004; Jenkins
et al., 1981; MacIntosh et al., 2003) and the possible effect of various micronutrients on the GI
of foods.
7.3.2 Glycemic Indices and Glycemic Loads of Test Meals
The GI results showed that cassava-sorghum ugali consumed with silver fish had the highest GI
at 83, followed by whole-maize ugali with silver fish and cassava-sorghum with cowpeas leaves
both at 69 and the lowest was whole maize ugali with cowpea leaves at 45 (Table 19). These
meals were found to be statistically different using linear regression mixed effect model of
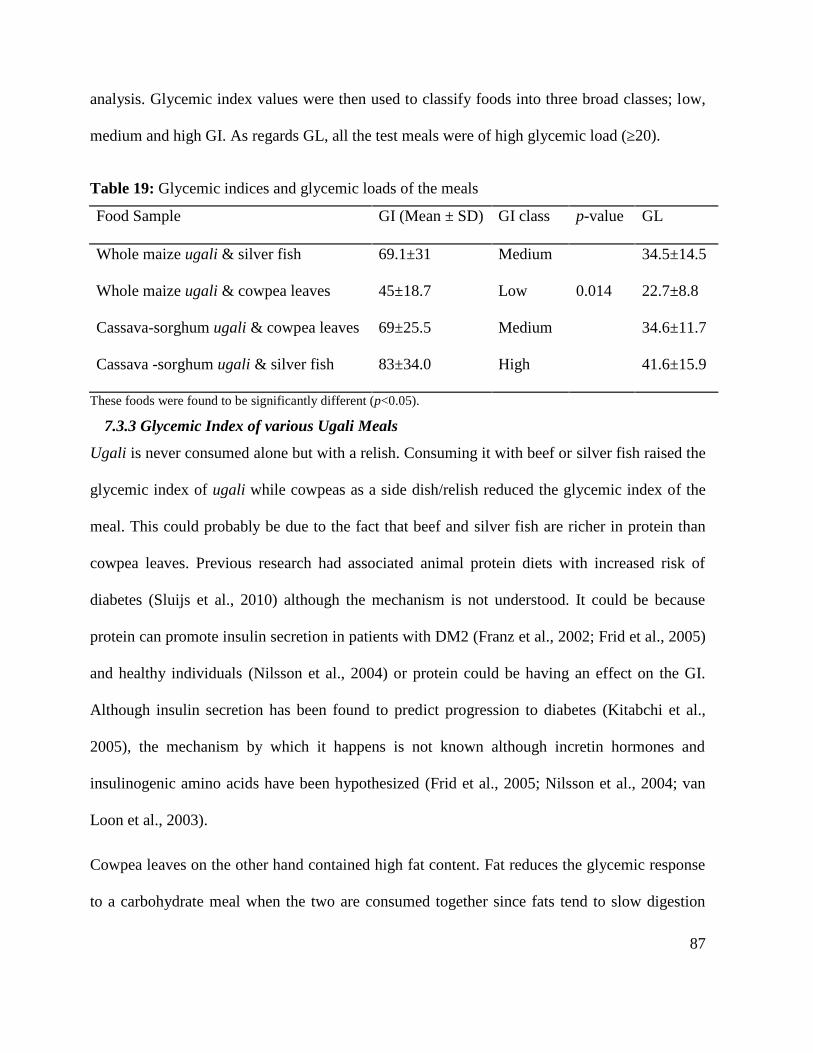
87
analysis. Glycemic index values were then used to classify foods into three broad classes; low,
medium and high GI. As regards GL, all the test meals were of high glycemic load (≥20).
Table 19: Glycemic indices and glycemic loads of the meals
Food Sample GI (Mean ± SD) GI class p-value GL
Whole maize ugali & silver fish 69.1±31 Medium
0.014
34.5±14.5
Whole maize ugali & cowpea leaves 45±18.7 Low 22.7±8.8
Cassava-sorghum ugali & cowpea leaves 69±25.5 Medium 34.6±11.7
Cassava -sorghum ugali & silver fish 83±34.0 High 41.6±15.9
These foods were found to be significantly different (p<0.05).
7.3.3 Glycemic Index of various Ugali Meals
Ugali is never consumed alone but with a relish. Consuming it with beef or silver fish raised the
glycemic index of ugali while cowpeas as a side dish/relish reduced the glycemic index of the
meal. This could probably be due to the fact that beef and silver fish are richer in protein than
cowpea leaves. Previous research had associated animal protein diets with increased risk of
diabetes (Sluijs et al., 2010) although the mechanism is not understood. It could be because
protein can promote insulin secretion in patients with DM2 (Franz et al., 2002; Frid et al., 2005)
and healthy individuals (Nilsson et al., 2004) or protein could be having an effect on the GI.
Although insulin secretion has been found to predict progression to diabetes (Kitabchi et al.,
2005), the mechanism by which it happens is not known although incretin hormones and
insulinogenic amino acids have been hypothesized (Frid et al., 2005; Nilsson et al., 2004; van
Loon et al., 2003).
Cowpea leaves on the other hand contained high fat content. Fat reduces the glycemic response
to a carbohydrate meal when the two are consumed together since fats tend to slow digestion
88
resulting in delayed gastric emptying (Choudhary, 2004; Collier et al., 1984; Jenkins et al.,
1981; MacIntosh et al., 2003). Cowpea leaves were also rich in fibre. Fibre-rich foods generally
have a low GI (Riccardi et al., 2008). Apart from its effect on the GI, fibre also has additional
known health benefits (Beals, 2005). Dried bean leaf stew has been found to lower the GI of
ugali in a South African Study (Mbhenyane et al., 2001) emphasizing the possible effect of
leafy vegetables on the GI of ugali. Generally, meals containing silver fish posed a high GI as
opposed to cowpea leaves irrespective of ugali type. Comparing silver fish and cowpea leaves
dishes; whole maize ugali meals had a lower GI as opposed to cassava-sorghum meals. This is
despite the fact that sorghum grains contain slowly digestible starches, resistant starches and
dietary fibre (Stefoska-Needham et al., 2015). However sorghum was mixed with cassava
which may have diluted the effect of sorghum on the GI of the meals.
The GI of whole maize ugali was within the range of 51 to 105 as reported by other studies in
Africa. For example, Tanzania reported a GI of 51 when consumed with meat (Ruhembe et al.,
2014). Other countries recorded different values including; Cote d’Ivore 74 (Kouame et al.,
2015), 76 in Botswana (Mahgoub et al., 2013) while Malawi reported 94 (Mlotha et al., 2016)
and South Africa 105 (Mbhenyane et al., 2001). The difference in the GI values could be
attributed to ugali accompaniment and the different preparation methods which may have
influenced the level of starch gelatinization. The method of ccooking and food processing,
nature of monosaccharide components and, nature of starch (Bjorck et al., 1994; FAO/WHO,
1998; Lee et al., 2005; Foster-Powell et al 2002; Pi-Sunyer, 2002) all affect the GI in different
ways. The differences in various studies could also be due to the possible differences in
physical properties of maize meal used in the preparation of ugali which has been found to be
variable in sub Saharan Africa (Onyango, 2014). In this study, the test foods were dried, milled

89
into flour and cooked in boiling water to obtain the ugali. This means there was reduction in
particle size and gelatinization which influenced the GI. For example the physical properties of
hammer-milled maize meal differ from that of sifted maize meal in terms of absorption,
solubility and viscosity (Onyango, 2014) which may impact on the gelatinization process and
ultimately the GI.
This study found GI of cassava-sorghum meals to be 69 to 83. Omoregie and Osagie (2008) in
Nigeria and Ruhembe et al., (2014) in Tanzania found a GI of 85 and 66 respectively for
dehulled sorghum product. Cassava meal had a GI of about 50 (Ruhembe et al., 2014). The
sorghum used in this study was whole and it was mixed with cassava contributing to the
difference in GI values.
All the meals in this study had high glycemic loads. Considering that the GL was calculated on
the portion size given to participants, the load could be much higher since the average serving
size of ugali is about 500 g in Western Kenya. Further research could therefore focus on
exploring different food combinations to reduce the GI of popular staple foods.

90
CHAPTER 8: ASSOCIATION BETWEEN GLYCEMIC LOAD AND DIABETES
MELLITUS: CASE OF AMAGORO DIVISION OF WESTERN KENYA
ABSTRACT
Glycemic load (GL) has been found to be a stronger measure for glycemic response to
carbohydrate-rich foods. This is because it accounts for both the quality and quantity of
carbohydrates consumed. This study therefore investigated the association between the total
glycemic load from Kenya’s most popular staple food “ugali”, with diabetes mellitus type 2
(DM2). The study was cross-sectional study involving 260 women aged 18 – 90 years drawn
from households located in Amagoro division of Western Province of Kenya. Households were
chosen by cluster and stratified sampling. Data on demography, socio-economy and diabetes
status were collected by interviews using pre-tested questionnaires. Blood sugar levels were
measured using a glucometer and levels ≥7.8 mmol/L underwent a confirmatory test using
fasting blood sugar. Anthropometric measurements were taken following standard protocols
with some modifications. Body mass index was obtained by dividing weight (kg) by height (m2)
and classified as underweight (<18.5); normal weight (18.5-24.9); overweight (25.0-29.9) and
obesity (≥30). Waist circumference > 88 cm indicated abdominal obesity. Waist-hip-ratio >0.80
was considered abnormal. The total GL was calculated by adding glycemic load of individual
ugali-based meals. The odds ratio showed that those consuming glycemic load ≥ 840 per week
were 1.25 times more likely to have DM2 as opposed to those consuming GL less that 840 per
week although this finding was not statistically significant (OR= 1.25, 95% CI - OR 0.48-3.27,
p=0.646). After controlling for confounding variables, no significant association was found
between GL and DM2 although those consuming more >840 were 1.36 times more likely to
suffer from DM2 as opposed to those on moderate load. Physical activity and alcohol
consumption were the independent risk factors for DM2 in this population (p<0.05).
Published as:
Ebere RA, Kimani VN, Imungi JK and Nyabola LO (2017). Association between GlycemicLoad and Diabetes Mellitus among Women: Case of Amagoro Division in Western Kenya IOSRJournal of Nursing and Health Science (IOSR-JNHS); 6 (6) Ver. IV; 94-100.

91
8.1 INTRODUCTION
As a result of rising cases of chronic diseases such as diabetes mellitus, there is a growing
interest globally on the effect that foods rich in carbohydrates have on blood sugar responses.
These responses can be measured in terms of glycemic indices (GI) and glycemic loads (GL).
Irrespective of the GI of a foodstuff, the blood sugar response to a carbohydrate-rich meal also
depends on the portion size. Glycemic Load (GL) has therefore been used as an alternative
measure for blood sugar response. The GL takes account of both the quality and quantity of the
meal consumed. The GL is calculated by multiplying the dietary carbohydrate content with the
GI of the food and dividing by 100. The higher the GL, the greater is the rise in blood glucose
(Foster-Powell et al., 2002). The GL of foods has thus been categorized as low (GL=1-10,)
medium (GL=11-19) and high (GL≥20) (Foster-Powell et al., 2002).
Only limited information is available on glycemic responses of African traditional foods
(Omoregie and Osagie, 2008). Ugali as it is popularly known in Kenya is a thick porridge
which is mainly prepared from maize (Zea mays L.) flour and boiling water (Wanjala et al.,
2016). It is served as the main dish usually for lunch or supper and is consumed alongside a side
dish (relish) composed of vegetables, fish, legumes, meats or mixtures thereof (Onyango, 2014,
Wanjala et al., 2016). Ugali may also be prepared from flours of cassava (Manihot esculenta
Crantz L.), finger millet (Eleusine coracana (L.) Gaertn), sorghum (Sorghum bicolor (L.)
Moench) or combinations thereof. The choice depends on the preference, availability and cost
of the raw materials as well as the predominant crop in the locality (Wanjala et al., 2016). The
stiff porridge is also widely consumed in other parts of Africa including, Tanzania (Ruhembe et
al., 2014), Malawi (Mlotha et al., 2016), Cote d’Ivore (Kouame et al., 2015), Botswana

92
(Mahgoub et al., 2013), Nigeria (Omoregie and Osagie) and South Africa (Mbhenyane et al.,
2001) among others.
In Amagoro Division of Western Kenya, the commonly consumed stiff porridge is prepared
from flours of whole maize or cassava and sorghum mix. Dietary intervention has been
advocated for preventing and managing diabetes as well as delay the development of related
complications (Otieno et al., 2003, Ruhembe et al., 2014, Wanjala et al., 2016). Despite this, the
direct role of the glycemic load (GL) of foods in the development of diabetes especially in
populations that subsist on high carbohydrate diets remain obscure (Villegas et al., 2007).
Whole-milled maize, sorghum and finger millet have been recommended for making ugali for
people with DM2 in Western Kenya (Wanjala et al., 2016) despite lack of data on their
associated glycemic response.
This study therefore investigated the association between glycemic responses of some ugali-
based meals consumed in Busia County of Kenya and it is the first study conducted on such
meals from the region. The knowledge generated would be important in evaluating the potential
of particular ugali meals to pose risk of diabetes and thereby hinder or help in the management
of DM2 both locally and in other parts of Africa.
8.2 STUDY DESIGN AND METHODOLOGY
8.2.1 Study Design
This was a cross-sectional study conducted among women aged 18 – 90 years. The study used a
structured questionnaire to collect information through self-reporting. The interviews were
conducted at the participants’ home.

93
8.2.2 Study Site
Amagoro division is located in Teso North District of Busia County in Western Kenya.
8.2.3 Sample Size Determination
The sample size for the survey was calculated as described in Chapter four.
8.2.4 Ethical Considerations
Kenyatta National Hospital and University of Nairobi Ethics, Research and Standards
Committee reviewed and approved this study. Participants gave an informed consent and for
those below 18 years, consent was sought from the guardian/parent. The inclusion criteria
included being female, residing permanently in the household, having sound vision, hearing and
memory, understanding the questions and agreeing to participate. The exclusion criteria were
poor vision, hearing and memory or being ill (Moretto et al., 2015).
8.2.5 Sampling Procedure
From the nine locations in Amagoro division, three locations were sampled for this study. First
the locations with less than 1000 households were eliminated and this included Okuleu (860
HHs), Kokare (823 HHs) and Kamuriai (273 HHs). Of the 6 locations left, three are located
along the Kenya – Uganda highway (Kocholia, Amagoro and Akadetewai). Amagoro which is
located along the highway was sampled from this group. Two more locations were sampled
from the remaining 3 (Amoni, Osajai and Kamolo) which were located in the interior. To the
south of Amagoro was Amoni (1525 HHs) and Kamolo (1589 HHs). Kamolo was sampled
since it was more interior and had the highest number of households. To the North of Amagoro
and most interior Osajai location was sampled. Therefore the three locations that participated in
this study included Amagoro (central), Osajai (north) and Kamolo (south). The sample size was
proportionately distributed among the three locations. To determine the sample size per

94
location, the total number of HHs in that location was divided by the total number of HHs
(4467) in the three locations and divided by the total desired sample size required for the study.
For the household surveys, interviews were conducted to obtain the information on socio-
demographic and clinical risk factors as well as physical activity and dietary intake.
Measurements were then taken for blood pressure using a blood pressure monitor (AutoTensio
SPG 420, France), random blood sugar using a glucometer (On call plus, USA) and
anthropometric measurements were taken and BMI calculated as described in section 3.1.
Age, level of education, household income and glycemic load were classified into three
categories. Family history of diabetes, blood pressure, blood sugar, cigarette smoking, alcohol
consumption and self-reported diabetes were each classified into two categories while level of
education was categorized into seven. For statistical purposes some of these categories were
merged into either two or three categories.
A global physical activity questionnaire developed by the World Health Organization was
adopted in this study with some modifications. Vigorous and moderate physical activity were
multiplied by 8 and 4 respectively to convert them into metabolic equivalent for task (MET)
which were then summed as total physical activity and scored in MET hours per day.
8.2.6 Data Analysis
The analyses were conducted using SPSS version 20.0. Descriptive statistics were used in
analyzing and characterizing the survey participants. The data was presented in frequencies
including percentages; and by mean including standard deviation. A chi-square analysis was
used to compare blood sugar levels with independent variables. In order to determine
associations between DM2 and independent variables, binary logistic regression analyses were

95
performed and multivariate logistic regression analysis was used to determine the magnitude of
the independent risk factors. The significance level adopted in these tests was 5% (p<0.05).
8.3 RESULTS AND DISCUSSION
8.3.1 Socio-Economic Characteristics of the Household Survey Participants
These characteristics are as described in chapter 3. About half of the survey participants were
below the age of 35 years while the elderly were the least at 6.9% (Table 20). A majority of
those who went to school did not go beyond primary level. In fact only 17.7% completed
primary education. This probably explains the low level of household income, with about 85%
earning below KES 5000 per month.

96
Table 20: Socio-economic characteristics of the household survey participants
Risk factor Categories Frequency Percent
Age <35 136 52.3
≥65 years 18 6.9
Education level Never gone o school 35 13.5
Primary incomplete 129 49.6
Primary complete 46 17.7
Secondary incomplete 19 7.3
Secondary complete 28 10.8
Tertiary 3 1.2
Income level (KES) < 5000 222 85.4
5000-9999 28 10.8
≥10000 10 3.8
Family history of diabetes Present 19 7.3
Absent 241 92.7
8.3.2 Behavioural Factors of the Participants
They were generally very active physically, all above the recommended levels by the World
Health Organization (Table 21). A few smoked cigarettes (3.1%) and less than half the sampled
population consumed alcohol.

97
Table 21: Behavioral characteristics of participants
Risk factor Categories Frequency Percent
Physical activity (MET hours) < 25 87 33.5
25-49 150 57.7
≥ 50 23 8.8
Cigarette smoking Smokers 8 3.1
Non-smokers 252 96.9
Alcohol consumption Yes 88 33.8
No 172 66.2
8.3.3 Clinical Factors
Some of these factors have been described in Chapter 3. A few participants were underweight
(6.9%) or obese (3.1%) while the majority (70%) had a normal body weight (Table 22).
Hypertension was at 22.3% and while 16.9% were suffering from DM2.
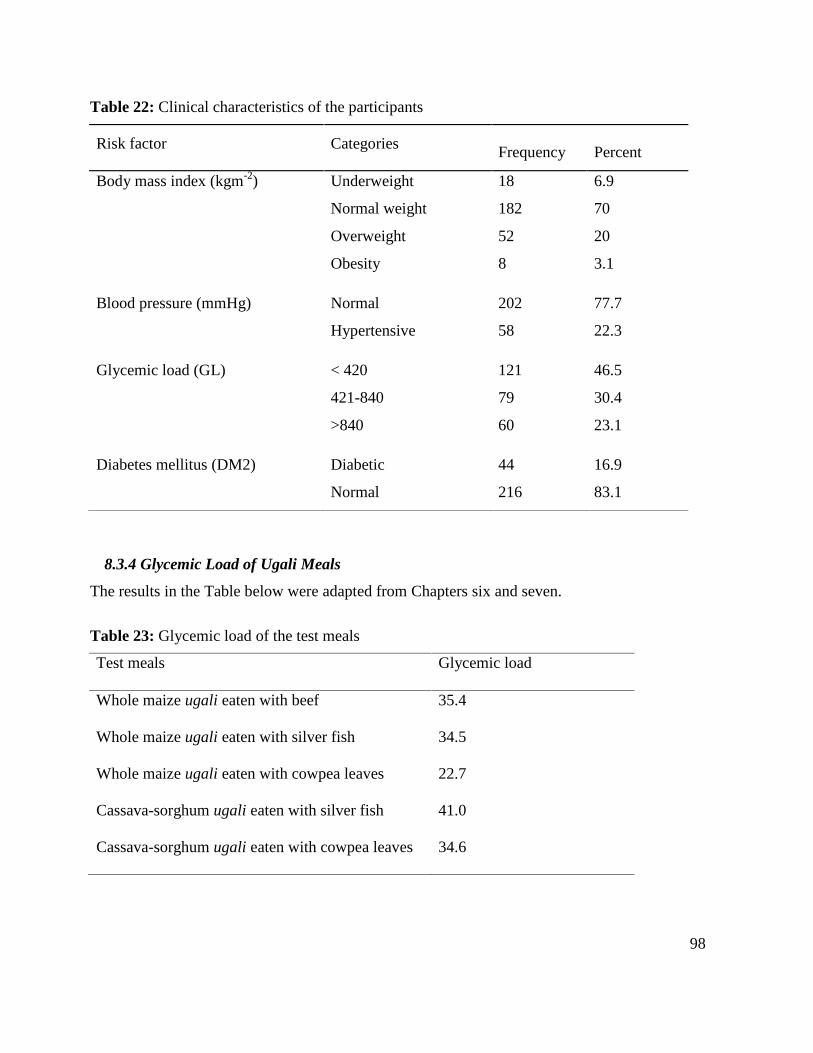
98
Table 22: Clinical characteristics of the participants
Risk factor Categories Frequency Percent
Body mass index (kgm-2) Underweight 18 6.9
Normal weight 182 70
Overweight 52 20
Obesity 8 3.1
Blood pressure (mmHg) Normal 202 77.7
Hypertensive 58 22.3
Glycemic load (GL) < 420 121 46.5
421-840 79 30.4
>840 60 23.1
Diabetes mellitus (DM2) Diabetic 44 16.9
Normal 216 83.1
8.3.4 Glycemic Load of Ugali Meals
The results in the Table below were adapted from Chapters six and seven.
Table 23: Glycemic load of the test meals
Test meals Glycemic load
Whole maize ugali eaten with beef 35.4
Whole maize ugali eaten with silver fish 34.5
Whole maize ugali eaten with cowpea leaves 22.7
Cassava-sorghum ugali eaten with silver fish 41.0
Cassava-sorghum ugali eaten with cowpea leaves 34.6
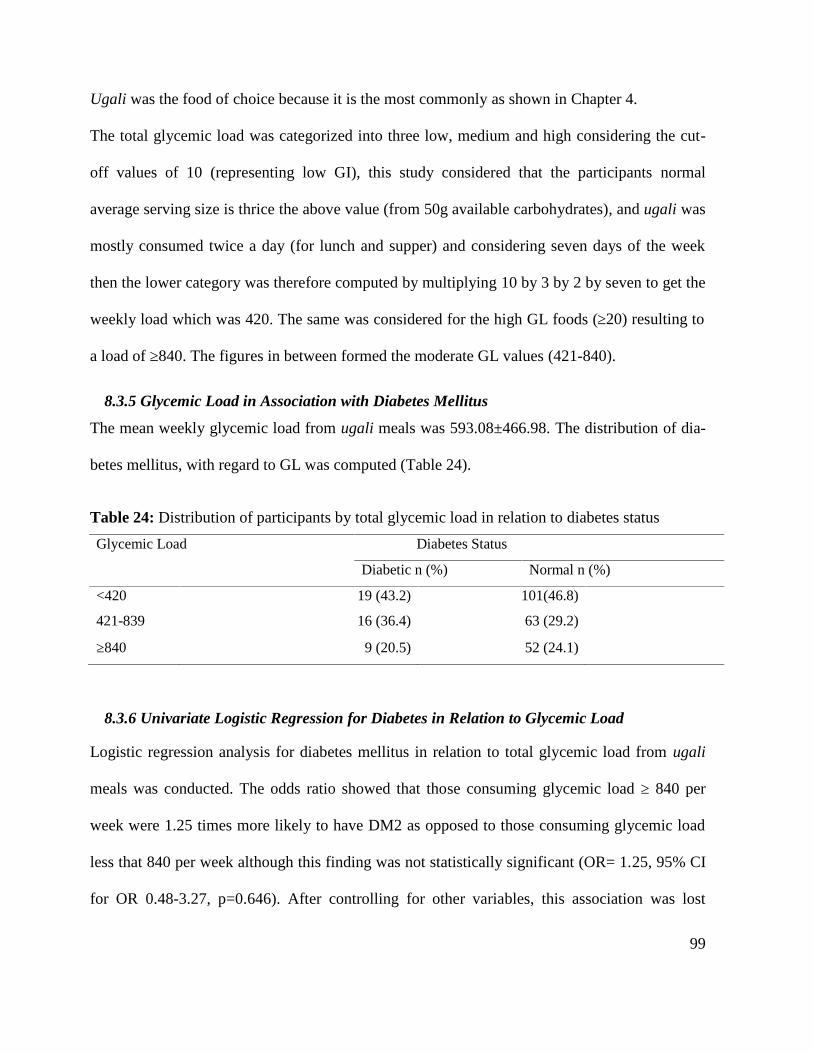
99
Ugali was the food of choice because it is the most commonly as shown in Chapter 4.
The total glycemic load was categorized into three low, medium and high considering the cut-
off values of 10 (representing low GI), this study considered that the participants normal
average serving size is thrice the above value (from 50g available carbohydrates), and ugali was
mostly consumed twice a day (for lunch and supper) and considering seven days of the week
then the lower category was therefore computed by multiplying 10 by 3 by 2 by seven to get the
weekly load which was 420. The same was considered for the high GL foods (≥20) resulting to
a load of ≥840. The figures in between formed the moderate GL values (421-840).
8.3.5 Glycemic Load in Association with Diabetes Mellitus
The mean weekly glycemic load from ugali meals was 593.08±466.98. The distribution of dia-
betes mellitus, with regard to GL was computed (Table 24).
Table 24: Distribution of participants by total glycemic load in relation to diabetes status
Glycemic Load Diabetes Status
Diabetic n (%) Normal n (%)
<420 19 (43.2) 101(46.8)
421-839 16 (36.4) 63 (29.2)
≥840 9 (20.5) 52 (24.1)
8.3.6 Univariate Logistic Regression for Diabetes in Relation to Glycemic Load
Logistic regression analysis for diabetes mellitus in relation to total glycemic load from ugali
meals was conducted. The odds ratio showed that those consuming glycemic load ≥ 840 per
week were 1.25 times more likely to have DM2 as opposed to those consuming glycemic load
less that 840 per week although this finding was not statistically significant (OR= 1.25, 95% CI
for OR 0.48-3.27, p=0.646). After controlling for other variables, this association was lost
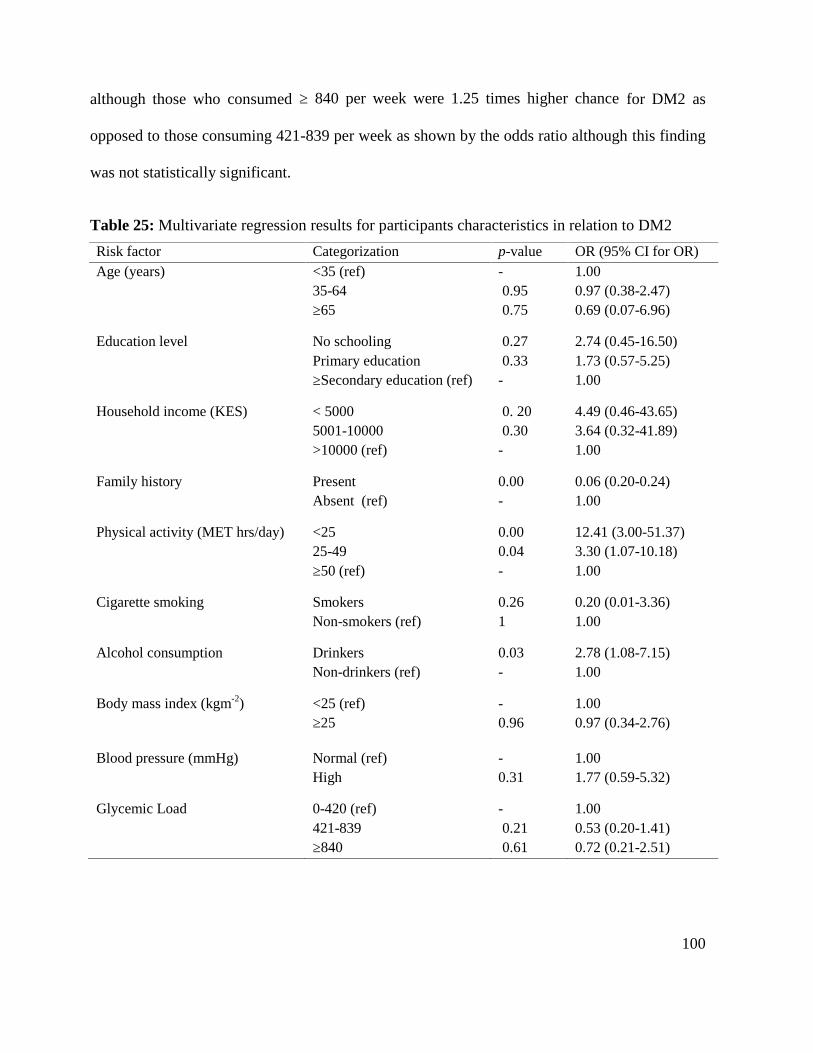
100
although those who consumed ≥ 840 per week were 1.25 times higher chance for DM2 as
opposed to those consuming 421-839 per week as shown by the odds ratio although this finding
was not statistically significant.
Table 25: Multivariate regression results for participants characteristics in relation to DM2
Risk factor Categorization p-value OR (95% CI for OR)Age (years) <35 (ref) - 1.00
35-64 0.95 0.97 (0.38-2.47)≥65 0.75 0.69 (0.07-6.96)
Education level No schooling 0.27 2.74 (0.45-16.50)Primary education 0.33 1.73 (0.57-5.25)≥Secondary education (ref) - 1.00
Household income (KES) < 5000 0. 20 4.49 (0.46-43.65)5001-10000 0.30 3.64 (0.32-41.89)>10000 (ref) - 1.00
Family history Present 0.00 0.06 (0.20-0.24)Absent (ref) - 1.00
Physical activity (MET hrs/day) <25 0.00 12.41 (3.00-51.37)25-49 0.04 3.30 (1.07-10.18)≥50 (ref) - 1.00
Cigarette smoking Smokers 0.26 0.20 (0.01-3.36)Non-smokers (ref) 1 1.00
Alcohol consumption Drinkers 0.03 2.78 (1.08-7.15)Non-drinkers (ref) - 1.00
Body mass index (kgm-2) <25 (ref) - 1.00≥25 0.96 0.97 (0.34-2.76)
Blood pressure (mmHg) Normal (ref) - 1.00High 0.31 1.77 (0.59-5.32)
Glycemic Load 0-420 (ref) - 1.00421-839 0.21 0.53 (0.20-1.41)≥840 0.61 0.72 (0.21-2.51)
101
After controlling for the confounding variables this study did not find any association between
age, family history of diabetes, cigarette smoking, BMI and glycemic load with diabetes
mellitus (Table 25).
Although not statistically significant socio-economic status as represented by level of education
and household income is an important variable with regards to DM2. As opposed to those who
had post primary education, those who never went to school were 2.74 times more likely to
suffer from DM2. In fact there were 1.58 times more likely to suffer than those who simply
went to primary school. Those who earned less than KES 10,000 per month were more likely to
suffer from DM2 as compared to those earning above KES 10, 000 although all these fall under
low income group. This is the case despite the fact that a majority rely on subsistence farming
for their livelihood.
Those with hypertension were 1.77 times more likely to suffer from DM2 as opposed to those
with normal blood pressure. Hypertension has been found to be common in diabetic people and
is estimated to affect 20–60% of the patients (ADA, 2002).
8.3.7 Independent Risk Factors for Diabetes Mellitus
Physical activity and alcohol consumption were the factors significantly associated with DM2
in this population (p<0.05) (Table 25). Those who exercised moderately were 3.3 times more
like to suffer from DM2 as opposed to those who exercised highly (≥ 50 MET Hours/day) and
those with lower physical activity in this population were 12.41 more likely to suffer from DM2
as opposed to those with higher levels. This was the case in this population despite the fact that
all the participants level of activity was much higher than that recommended by the World
Health Organization (WHO, 2010). This could mean that this population needs higher levels of
physical activity to maintain good health and protect against DM2.

102
Physical activity is known to reduce the risk of DM2 by 35% to 40% (IDF Diabetes Atlas,
2011) approximately 27% of diabetes disease burden has been attributed to physical activity
(WHO, 2009). However the cut-off values may not be applied across the population. Although
WHO recommends level of ≥ 150 minutes of activity of moderate-intensity per week for adults
(WHO, 2010) and others recommend walking for ≥ 30 minutes per day (Roberts and Barnard,
2005), this population surpassed all these recommendations and yet physical activity remains an
independent risk factor.
This study supports the fact that physical activity is important risk factor for DM2 and
especially in this population. Physical activity apart from controlling body weight by utilizing
glucose in the process, it regulates blood pressure and makes body cells more sensitive to
insulin thereby decreasing incidence of DM2 (Helmrich et al., 1991; Hu et al., 1999; Folsom et
al., 2000; Colberg et al., 2010).
The other independent risk factor was alcohol consumption (Table 25). Although earlier studies
had found an increased risk of developing DM2 in non drinkers and heavy drinkers, when
compared with moderate drinkers (Wei et al., 2000; Ajani et al., 2000; ADA, 2002;
Wannamethee et al., 2003), this study found that irrespective of the amount of alcohol, those
who consumed alcohol were 2.78 more likely to suffer from DM2 as opposed to those who
never consumed alcohol.
103
CHAPTER 9: GENERAL DISCUSSION
The prevalence of diabetes mellitus among women of Amagoro division was 16.9%. A similar
high prevalence (16%) was previously reported in a rural population in Northern Kenya (El-
busaidy et al., 2014). Several other studies have reported varying prevalence among ethnic
groups in Kenya (Christensen et al., 2008) and regions (Ayah et al., 2013; Oti et al., 2013; El-
busaidy et al., 2014). The rising prevalence has been associated to increased awareness,
improved diagnosis (IDF, 2011), rising prevalence of human immunodeficiency virus (Onsomu,
2008) and the rapidly changing lifestyle of Kenyans (Waweru, 2017).
Diet has a direct role in influencing the level of blood sugar in the body. This study found out
that ugali and rice had high glycemic responses that were modulated by an accompaniment. For
instance beans and cow pea leaves lowered the GIs of rice and ugali respectively. This supports
earlier studies that reported meal combination may influence the GI of a staple food (Sugiyama
et al., 2003; Ruhembe et al., 2014). In this study, beans and cow pea leaves were found to be
rich in protein and fat. These macronutrients have been shown to reduce glycemic response as a
result of increased insulin sensitivity (Pi-Sunyer, 2002). Additionally, beans and cowpea leaves
possessed high ash content. These leaves have been previously reported to be rich in calcium,
zinc, iron (Imungi and Potter, 1983; Mamiro et al., 2011) and phosphorus (Imungi and Potter,
1983). Also beans are known to contain magnesium, zinc and phosphorus which have been
shown to improve insulin sensitivity (Larsson and Wolk, 2007; Ortega et al., 2012; Khattab et
al., 2015). Besides minerals, beans and cowpea leaves also contain vitamin K known to reduce
insulin resistance (Yoshida et al., 2008). Cow pea leaves and beans have been suggested for
consideration during meal planning for diabetic patients (Mani et al, 1994). In line with these
findings, this study recommends that cowpea leaves and beans can be consumed alongside

104
staple foods to modulate blood sugar in diabetic patients. However this study was limited to
glycemic responses of a few ugali-based meals which are the main staple food in this
population. Therefore there is need to establish glycemic responses to other foods including
fruits in order to provide better guidance on dietary choices for people suffering from diabetes.
However this study did not find significant association between glycemic responses of foods
and diabetes mellitus among rural women in Amagoro. The strongest independent risk factors
in this population were physical activity and alcohol consumption. Physical activity improves
insulin sensitivity (Balkau et al., 2008), prevents hypertension (Diaz and Shimbo, 2013) and
utilizes glucose as a source of energy. Although the participants fulfilled WHO recommended
level of physical activity (WHO, 2010), it is clear that this cut-off may not be sufficient to offer
protection against DM2 in this population. Gill and Cooper, (2008) had earlier suggested that
much higher levels of physical activity may be necessary to significantly minimize the risk of
diabetes in those with many other associated risk factors. In line with this, it is necessary to
establish different threshold for physical activity in different populations.
Alcohol consumption was also identified as an independent risk factor for DM2. Those who
consumed alcohol were more likely to suffer from DM2 as opposed to those who did not.
Earlier studies had found an increased risk of developing DM2 in non-drinkers and heavy
drinkers when compared with moderate drinkers (Wei et al., 2000; Ajani et al., 2000; ADA,
2002; Wannamethee et al., 2003). More studies are required to establish the effect of the
amount of alcohol consumed on DM2 in this population.

105
CHAPTER 10: CONCLUSIONS AND RECOMMENDATIONS
10.1 CONCLUSIONS
Socio-demographic and economic characteristics: Population was characterized by low level of
education, high unemployment and low income.
Food consumption patterns: Food was consumed thrice a day and snacks were not a part of their
diet. The diet was generally starch-based mainly presented inform of thick porridge with limited
protein in the overall diet.
Nutritional status: Prevalence of excessive weight was relatively high although cases of under-
weight were also reported.
Food consumption patterns: Food consumed thrice a day without snacks. The diet of this
population is highly starch-based presented in form of porridge with little protein in the overall
diet.
Association between glycemic indices and DM2: Prevalence of diabetes was relatively high.
Glycemic indices and load of staples were generally high. Cowpea leaves and beans lower the
GI of staple foods. No significant association between glycemic responses from ugali meals and
DM2 especially after controlling for the confounding variables (p>0.05. Alcohol consumption
and physical activity were the strongest independent risk factors for DM2 in this population.
10.2 RECOMMENDATIONS
The finding from this study could be used by county government for:
i. Creating awareness and undertaking regular screening for DM2.
ii. Empowering women by improving access to education and employment so that they
may boost their income levels and improve on their nutrition and health.
106
iii. Developing strategies that increase availability of protein sources and diversify carbo-
hydrate sources.
iv. Sensitizing women on effect of physical activity and alcohol consumption.
v. Focusing on factors that put rural population at risk; expand welfare programs to include
all ages; increase funding on research and collaboration to develop low GI food varie-
ties.
Further research could focus on:
i. Factors in the cowpea leaves and beans that lower GI.
ii. Effect of leaf maturity and preparation methods.
iii. Effect of other green leafy vegetables and legumes GI
iv. Effect of type and amount of alcohol.
v. Suitable physical activity threshold for local population.
vi. Developing crops with low GI

107
REFERENCES1. Abubakar HN, Olayiwola IO, Sanni SA and Idowu MA (2010). Chemical composition
of sweet potato (Ipomea batatas Lam) dishes as consumed in Kwara state,Nigeria. International Food Research Journal; 17:411-416.
2. American Diabetes Association (2000) Screening for Type 2 Diabetes Originallyapproved April 1989. Most recent review/revision, 1999. Clinical Diabetes;18(2) position statement. Reprinted with permission from Diabetes Care 23(Supp1 1):S20-23, 2000.
3. A.D.A (2002). Treatment of Hypertension in Adults with Diabetes. Diabetes Care; 25:S71-S73.
4. A.D.A (2004). American Diabetes Association. Diagnosis and classification of diabetesmellitus. Diabetes Care; 27:5–10.
5. A.D.A (2008).American Diabetes Association. Diagnosis and Classification of DiabetesMellitus Diabetes Care; 31 (1): S55-S60
6. A.D.A (2010). American Diabetes Association. Diagnosis and classification of diabetesmellitus. Diabetes Care; 33(1):S62–9
7. ADA (2012). American Diabetes Association. Standards of medical care in diabetes.Diabetes Care; 35(S1):S12-S14)
8. Agama-Acevedo E, Rendon-Villalobos R, Tovar J, Trejo-Estrada SR, and Bello-PerezLA (2005). Effect of storage time on in vitro digestion rate and resistant starchcontent of tortillas elaborated from commercial corn masas. ArchivosLatinoamericanos de Nutrición; 55(1):86-92.
9. Ahmadi-Abhari S, Luben RN, Powell N, Bhaniani A, Chowdhury R, Wareham NJ,Forouhi NG and Khaw KT (2014). Dietary intake of carbohydrates and risk oftype 2 diabetes: the European prospective investigation into cancer-Norfolkstudy. British Journal of Nutrition, 111 (2): 342-52.
10. Ajani UA, Hennekens CH, Spelsberg A and Manson JE (2000). Alcohol consumptionand risk of Type 2 diabetes mellitus among US male physicians. Archives ofInternal Medicine; 160:1025–30.
11. Allen JC, Corbitt AD, Maloney KP, Butt M.S and Truong V (2012). Glycemic index ofsweet potato as affected by cooking methods. The open Nutrition Journal; 12(6):1-11.
12. Allen JC, Sun W and Truong V (2013). Sweet potato cultivar flesh color andcompositional effects on glycemic index. The Official Journal of the Federationof American Societies for Experimental Biology; 27(1) 1079.24.
13. Alonso-Magdalena P, Ropero AB, Soriano S, Quesada I and Nadal A (2010) Bisphenol-A: a new diabetogenic factor? Hormones; 9(2):118-126.

108
14. AlEssa HB, Bhupathiraju SN, Malik Vs, Wedick NM, Campos H, Rosner B, Willet WCand Hu FB (2015). Carbohydrate quality and quantity and the risk of type 2diabetes in US women. American Journal of Clinical Nutrition, 102(6):1543-53.
15. A.O.A.C (2000). Official methods of analysis. 17th edition. Association of OfficialAnalytical Chemists. Horowitz, W(ed) Vols.1 and 2, AOAC International,Maryland.
16. Araya H (2003). Digestion rate of legume carbohydrates and glycemic index of legume-based meals. International Journal of Food Science and Nutrition; 54 (2):119-26.
17. Arvidsson-Lenner R, Asp N, Axelsen M, Bryngelsson S, Haapa E, Jarvi A, Karlstrom B,Raben A, Sohlstrom A, Thorsdottir I and Vessby B (2004). Glycemic index.Relevance for health, dietary recommendations and food labeling. ScandinavianJournal of Nutrition; 48(2): 84-94.
18. Asinobi C, Uzoagba H, Mba-Anyadioha A and Johnkennedy N (2016). Glycemic indexof some traditional fortified staple meals on the postprandial blood glucose ofNigerian undergraduate students: an open-label study. Functional Foods inHealth and Disease 2016; 6(7):414-424.
19. Aston LM, Gambell JM, Lee DM, Bryant SP and Jebb SA (2008). Determination of theglycemic index of various staple carbohydrate-rich foods in the UK diet.European Journal of Clinical Nutrition, 62 (2): 279-285.
20. Atayoglu AT, Soylu M, Silici S and Inanc N (2016). Glycemic index values ofmonofloral Turkish honeys and the effect of their consumption on glucosemetabolism. Turkish Journal of medical Sciences; 46:483-488.
21. Atieno, J (2006). Diabetes care in a primary care setting: The Kenyatta NationalHospital.; Diabetes voice; 51 (3) 27-29.
22. Augustin LSA, Kendall, CWC, Jenkins DJA, Willet WC, Astrup A, Barclay AW,Bjorck I, Brand-Miller JC, Brighenti F, Buyken AE, Ceriello A, La Vecchia CL,Livesey, G, Liu S, Riccardi G, Rizkalla SW, Sievenpiper JL, Trichopoulou A,Wolever TMS, Baer-Sinnott S and Poli A (2015). Glycemic index, glycemicload and glycemic response: An international scientific consensus summit fromthe international carbohydrate quality consortium (ICQC). Nutrition, Metabolismand cardiovascular diseases; 25(9):795-815.
23. Ayah R, Joshi MD, Wanjiru R, Njayu EK, Otieno CF, Njeru EK and Mutai KK (2013).A population-based survey of prevalence of diabetes and correlates in an urbanslum community in Nairobi, Kenya. Biomed Central Public Health. doi:10.1186/1471-2458-13-371.
109
24. Bahado-Singh PS, Riley CK, Wheatley AO and Lowe HIC (2011). Relationshipbetween processing method and the glycemic indices of ten sweet potato(Ipomoea batatas) cultivars commonly consumed in Jamaica. Journal ofNutrition and Metabolism; Article ID 584832.http://dx.doi.org/10.1155/2011/584832.
25. Balkau B, Mhamdi L, Oppert J, Nolan J, Golay A, Porcellati F, Laakso M andFerrannini E (2008). Physical activity and insulin sensitivity. The RISC study.Diabetes; 57:2613-2618.
26. Baliunas DO, Taylor BJ, Irving H, Roerecke M, Patra J, Mohapatra S and Rehm J(2009). Alcohol as a risk factor for type 2 diabetes: A systematic review andmeta-analysis. Diabetes Care; 32(11):2123-32.
27. Barnard N, Levin S and Trapp C (2014). Meat consumption as a risk factor for type 2diabetes. Nutrients; 6(2): 897–910.
28. Bloomfield GS, Mwangi A, Chege P, Simiyu CJ, Aswa DF, Odhiambo D, Obala, AA,Ayuo P and Khwa-Otsyula BO (2013). Multiple cardiovascular risk factors inKenya: evidence from a health and demographic surveillance system usingWHO Stepwise approach to chronic disease risk factor surveillance. Heart;99(18):1323-1329.
29. Brand-Miller J, McMillan-Prince J, Steinbeck K and Caterson I (2009). Dietaryglycemic index: health implications. Journal of American College of Nutrition;446s-449s.
30. Brennan CS (2005). Dietary fibre, glycaemic response, and diabetes. MolecularNutrition and Food Research; 49 (6): 560 – 570.
31. Beals KA (2005). The Glycaemic Index: Research Meets Reality. A special publicationof the Unites States Potato Board, 2005. Available in:http://www.uspotatoes.com/downloads/3581giwhite. Site visited on 5/9/14.
32. Berti C, Riso P, Monti LD and Porrini M (2004). In vitro starch digestibility and in vivoglucose response of gluten free foods and their gluten counterparts. EuropeanJournal of Clinical Nutrition; 43:198-204.
33. Bett HK, Musyoka MP, Peters KJ and Bokelmann W (2012). Demand for meat in therural and urban areas of Kenya: A focus on indigenous chicken. EconomicResearch International; Volume 2012 (2012), Article ID 401472, 10 pageshttp://dx.doi.org/10.1155/2012/401472
34. Bjorck I, Granfeldt Y, Liljeberg H, Tovar J and Asp NG (1994). Food propertiesaffecting the digestion and absorption of carbohydrates. American Journal ofClinical Nutrition; 59: 696S-705S.
110
35. Blackburn D, Hux J and Mamdani M (2002). Quantification of the risk of corticosteroid-induced diabetes mellitus among the elderly. Journal of General InternalMedicine; 17(9): 717–720.
36. Bray GA, Nielsen SJ and Popkin BM (2004). Consumption of high-fructose corn syrupin beverages may play a role in the epidemic of obesity. American Journal ofClinical Nutrition; 79 (4): 537-543.
37. Brouns F, Bjorck I, Frayn K N, Gibbs AL, Lang V, Slama G and Wolever TM (2005).Glycaemic index methodology. Nutrition Research Reviews; 18 (1):145-171.
38. Boerschmann H, Pflüger M, Henneberger L, Ziegler AG and Hummel S (2010).Prevalence and predictors of overweight and insulin resistance in offspring ofmothers with gestational diabetes mellitus. Diabetes Care; 33(8):1845-9.
39. Bonnet F, Irving K, Terra JL, Nony P, Berthezene F and Moulin P (2005). Anxiety anddepression are associated with unhealthy lifestyle in patients at risk ofcardiovascular disease. Atherosclerosis; 178(2):339-344.
40. Booth FW, Laye MJ and Roberts MD (2011). Lifetime sedentary living acceleratessome aspects of secondary aging. Journal of Applied Physiology; 111(5): 1497-1504.
41. Chang SA (2012). Smoking and type 2 diabetes mellitus. Diabetes and MetabolismJournal, 36(6): 399-403.
42. Chege MP (2010). Risk factors for type 2 diabetes mellitus among patients attending arural Kenyan hospital. African Journal of Primary Health Care Family Medicine2010; 2(1). Doi: 10.4102/phcfm.v2i1.96.
43. Chege MP (2016). Multiple cardiovascular disease risk factors in rural Kenya: evidencefrom a health and demographic surveillance system using the WHO STEP-wiseapproach to chronic disease risk factor surveillance. South African FamilyPractice 58, 54-61.
44. Chiu THT, Pan W, Lin M, Lin C (2018). Vegetarian diet, change in dietary patterns,and diabetes risk: a prospective study. Nutrition and Diabetes volume 8,Article number: 12 (2018).
45. Choudhary, P (2004). Review of dietary recommendations for diabetes mellitusDiabetes Research and Clinical Practice; 65: S9-S15.
46. Christensen DL, Friis H, Mwaniki DL, Kilonzo B, Tetens I, Boit MK, Omondi, B,Kaduka L, Borch-Johnsen K (2009). Prevalence of glucose intolerance andassociated risk factors in rural and urban populations of different ethnic groupsin Kenya. Diabetes Research and Clinical Practice; 84(3):303-10. doi:10.1016/j.diabres.2009.03.007.
111
47. Colberg SR, Sigal RJ, Fernhall B, Regensteiner JG, Blissmer BJ, Rubin RR, Chasan-Taber L, Albright AL and Braun B (2010). Exercise and Type 2 Diabetes: TheAmerican College of Sports Medicine and the American Diabetes Association:joint position statement. Diabetes Care; 33:e147-e167.
48. Collier G, McLean A and O'Dea K (1984). Effect of co-ingestion of fat on the metabolicresponses to slowly and rapidly absorbed carbohydrates. Diabetologia; 26: 50-4.
49. Cornelis MC, Chiuve SE, Glymour MM, Chang S, Techetgen EJT, Liang L, KoenenKC, Rimm EB, Kawachi I and Kubzansky LD (2014). Bachelors, divorcees, andwidowers: Does marriage protect men from type 2 diabetes? PLoS ONE 2014;9(9): e106720. doi:10.1371/journal.pone.0106720.
50. Corsi DJ and Subramanian SV (2012). Association between socioeconomic status andself-reported diabetes in India: a cross-sectional multilevel analysis. BMJ Open2012; 2012;2:e000895.doi:10.1136/bmjopen-2012-000895.
51. Dalal S, Beunza JJ, Volmink J, Adebamowo C, Bajunirwe F, Njelekela M, MozaffarianD, Fawzi W, Willet W, Adami H and Holmes MD (2011). Non-communicablediseases in sub-Saharan Africa: what we know now. International Journal ofEpidemiology; 40(4): 885-901.
52. De Coster S and van Larebeke N (2012). Endocrine-disrupting chemicals: associateddisorders and mechanisms of action. Journal of Environmental and PublicHealth; 2012 (2012), Article ID 713696, 52 pages.http://dx.doi.org/10.1155/2012/713696 .
53. Dedoussis GVZ, Kaliora AC and Panagiotakos, DB (2007). Genes, diet and type 2diabetes mellitus: The review of diabetic studies. Journal of the Society forBiomedical Diabetes Research; 4(1):13-24.
54. DGAC, 2015. Dietary patterns are defined as the quantities, proportions, variety orcombinations of different 28 foods and beverages in diets, and the frequencywith which they are habitually consumed. Scientific report on the 2015 dietaryguidelines advisory committee (DGAC). Part D. Chapter 2: Dietary Patterns,Foods and Nutrients, and Health Outcomeshttps://health.gov/dietaryguidelines/2015-scientific-report/PDFs/07-Part-D-Chapter-2.pdf.
55. Diaz KM and Daichi MD (2013). Physical activity and the prevention of hypertension.Current Hypertension Reports; 15(6):659-668.
56. Donato AJ, Tench K, Glueck DH, Seals DR, Eskurza I and Tanaka H (2003). Declinesin physiological functional capacity with age: a longitudinal study in peakswimming performance. Journal of Applied Physiology; 94(2):764-769.
112
57. Dong JY, Xun P, He K and Qin LQ (2011). Magnesium Intake and Risk of Type 2Diabetes: Meta-analysis of prospective cohort studies. Diabetes Care;34(9):2116-22.
58. dos Santos LC, de Padua CI, Fisberg M and Martini LA (2008). Calcium intake and itsrelationship with adiposity and insulin resistance in post-pubertal adolescents.Journal of Human Nutrition and Dietetics; 21(2):109-16.
59. Dutta S (2015). Sweet potatoes for diabetes mellitus: a systematic review.Pharmacophore; 6(1):60-72.
60. El-busaidy H, Dawood M, Kasay A, Mwamlole C, Koraya N and Parpia H (2014). Howserious is the impact of type II diabetes in rural kenya? The Open DiabetesJournal; 7:1-4.
61. Eli-Cophie D, Agbenorhevi JK and Annan RA (2017). Glycemic index of some localstaples in Ghana. Food Science and Nutrition; 5(1):131-138.
62. Englyst KN, Englyst HN, Hudson GJ, Cole TJ and Cummings JH (1999). Rapidlyavailable glucose in foods: an in vitro measurement that reflects the glycemicresponse American Journal of Clinical Nutrition; 69: 448–54.
63. Englyst KN, Vinoy S, Englyst HN and Lang V (2003). Glycaemic index of cerealproducts explained by their content of rapidly and slowly available glucose.British Journal of Nutrition 89, 329 – 339.
64. Facchini FS, Chen YD and Reaven GM (1994). Light-to-moderate alcohol intake isassociated with enhanced insulin sensitivity. Diabetes Care; 17:115–19.
65. FAO, (2008) Food and Agriculture Organization of the United Nations and Food andNutrition Technical Assistance Project. Guidelines for Measuring Householdand Individual Dietary Diversity. FAO, Rome, 2008.
66. FAO/WHO (1996). Preparation and use of food-based dietary guidelines. Report of ajoint FAO/WHO consultation Nicosia Cyprus. Nutrition Program, WHOGeneva.
67. FAO/WHO (1998) Carbohydrates in human nutrition, Report of a Joint FAO/WHOExpert Consultation. FAO Food Nutrition Paper 66:1–140.www.fao.org/docrep/w8079e/w8079e00.htm
68. FAO (1998). Storage and processing of roots and tubers in the tropics. Food andAgriculture Organization of the United Nations, Agro-industries and Post-Harvest Management Service Agricultural Support Systems Division.www.fao.org/docrep/x5415e/x5415e00.htm#contents. Site visited on 6th
February 2017.
113
69. Fanzo J, Remans R, Pronyk PM, Negin J, Wariero J, Mutuo P, Masira J, Diru, W,Lelerai, Kim D, Nemser B, Muniz M, Palm C, Sanchez P, Ehrlich S, and SachsJD (2011). A 3-year Cohort Study to Assess the Impact of an Integrated Food-and Livelihood-based Model on Undernutrition in Rural Western Kenya. InBrian Thompson and Leslie Amoroso (Eds) Combating Micronutrientdeficiencies: Food-Based approached. Ville delle Terme Caracalla, Italy: TheFood and Agriculture Organization of the United Nations and CAB International.
70. Fatema K, Rahman F, Sumi N, Kobura K and Ali L (2011). Glycemic and insulinemicresponses to commonly consumed potatoes in Bangladeshi type 2 diabeticsubjects. European Journal of Food Research and Review; 1(2):52-60.
71. Faul JL, Tormey W, Tormey V and Burke C (1998). High dose inhaled corticosteroidsand dose dependent loss of diabetic control. British Medical Journal; 317:1491.
72. Feldman AL, Long GH, Johansson I, Weinehall L, Fhärm E, Wennberg P, Norberg M,Griffin SJ and Rolandsson O (2017). Change in lifestyle behaviors and diabetesrisk: evidence from a population-based cohort study with 10 year follow-up.International Journal of Behavioral Nutrition and Physical Activity 14:39.
73. Fennema O (1996) Food chemistry, 3rd Edition, Marcel Dekker, New York.
74. Folsom AR, Kushi LH and Hong CP (2000). Physical activity and incident diabetesmellitus in postmenopausal women. American Journal of Public Health;90(1):134-8.
75. Forouhi NG, Misra A, Mohan V, Taylor R and Yancy W (2018). Dietary and nutritionalapproaches for prevention and management of type 2 diabetes. British MedicalJournal; 361 doi: https://doi.org/10.1136/bmj.k2234
76. Foster-Powell K, Holt SHA and Brand-Miller JC (2002). International tables ofglycemic index and glycemic load values. American Journal Clinical Nutrition76 (1), 5-56.
77. Fowler, M.J (2007) Diabetes Treatment, Part 1: Diet and Exercise Clinical Diabetes;25(3) 105-109.
78. Fox N, Hunn A and Mathers N (2009). Sampling and sample size calculation. Leeds:The National Institute for Health Research- Research Design Service for the EastMidlands / Yorkshire and the Humber.http://www.webpages.uidaho.edu/ed571/571-Modules/M3/NIHS-Sampling_Sample_Size_calculation.pdf.
79. Franz MJ, Bantle JP, Beebe CA, Brunzell JD, Chiasson JL, Garg, A, Holzmeister LA,Hoogwerf B, Mayer-Davis E, Mooradian AD, Purnell JQ and Wheeler M (2002).Evidence-based nutrition principles and recommendations for the treatment andprevention of diabetes and related complications. Diabetes Care; 1:148–199.

114
80. Frid AH, Nilsson M, Holst JJ and Bjorck IM (2005). Effect of whey on blood glucoseand insulin responses to composite breakfast and lunch meals in type 2 diabeticsubjects. American Journal of Clinical Nutrition; 82 (1), 69-75.
81. Gallant DJ, Bouchet B, Buleon A and Perez S (1992). Physical characteristics of starchgranules and susceptibility to enzymatic degradation. European Journal ofClinical Nutrition; 46 (2) S3 – S16.
82. Gambineri A, Patton L, Altieri P, Pagotto U, Pizzi C, Manzoli L and Pasquali R (2012).Polycystic ovary syndrome is a risk factor for type 2 diabetes results from along-term prospective study. Diabetes; 61 (9) 2369-2374.
83. Gao H, Cai J, HanW, Huai H, Chen Y and Wei C (2014). Comparison of starchesisolated from three different trapa species. Food Hydrocolloids; 37:174-181.http://dx.doi.org/10.1016/j.foodhyd.2013.11.001.
84. Gezawa ID, Puepet FH, Mubi BM, Uloko AE, Bakki B, Talle MA and Haliru I (2015)Socio-demographic and Anthropometric risk factors for Type 2 diabetes inMaiduguri, North-Eastern Nigeria. Sahel Medical Journal; 18:S1-7.
85. Gill JM and Cooper AR (2008). Physical activity and prevention of type 2 diabetesmellitus. Sports Medicine; 38(10):807-24.
86. Grundy SM, Pasternak R, Greenland P, Smith SJr and Fuster V (1999). Assessment ofcardiovascular risk by use of multiple-risk-factor assessment equations; astatement for healthcare professionals from the American Heart Association andthe American College of Cardiology. Circulation; 100(13): 1481-1492.
87. Hall V, Thomsen RW, Henriksen O and Lohse N (2011). Diabetes in Sub SaharanAfrica 1999-2011: epidemiology and public health implications A systematicreview. Bio Med Central Public Health;; 11:564. doi:10.1186/1471-2458-11-564.
88. Hansen AW, Christensen DL, Larsson MW, Eis J, Christensen T, Frijs H, Mwaniki DL,Kilonzo B, Boit MK, Borch-Johnsen K and Tetens I (2011). Dietary patterns,food and macronutrient intakes among adults in three ethnic groups in ruralKenya. Public Health Nutrition; 14(9):1671-9. doi:10.1017/S1368980010003782.
89. Hätönen KA, Virtamo J, Eriksson JG., Perälä M, Sinkko HK, Leiviskä J and ValstaLM (2012). Modifying effects of alcohol on the postprandial glucose and insulinresponses in healthy subjects. American Journal of Clinical Nutrition; 96(1) 44-49.
90. Helmrich SP, Ragland DR, Leung RW and Paffenbarger RSJr (1991) Physical activityand reduced occurrence of non-insulin-dependent diabetes mellitus. NewEngland Journal of Medicine 325, 147–152.
115
91. Herder C and Roden M (2011). "Genetics of type 2 diabetes: pathophysiologic andclinical relevance". European journal of clinical investigation; 41 (6): 679–92.
92. Higgins JA (2012). Whole grains, legumes, and the subsequent meal effect: implicationsfor blood glucose control and the role of fermentation. Journal of Nutrition andMetabolism. doi: 10.1155/2012/829238.
93. Hillier TA, Pedula KL, Schmidt MM, Mullen JA, Charles MA and Pettitt DJ (2007).Childhood obesity and metabolic imprinting: the ongoing effects of maternalhyperglycemia. Diabetes Care; 30(9): 2287-92.
94. Hjartåker A, Langseth H and Weiderpass E (2008). Obesity and diabetes epidemics:cancer repercussions. Advances in Experimental Medicine and Biology; 630:72-93.
95. Hopping BN, Erber E, Grandinetti A, Verheus M, Kolonel LN and Maskarinec G(2010). Dietary fiber, magnesium, and glycemic load alter risk of type 2 diabetesin a multiethnic cohort in Hawaii. Journal of Nutrition; 140(1):68-74.
96. Hu FB, Sigal RJ, Rich-Edwards JW, Colditz GA, Solomon CG, Willet WC, Speizer FEand Manson JE (1999). Walking compared with vigorous physical activity andrisk of type 2 diabetes in women: a prospective study. Journal of the AmericanMedical Association; 282(15):1433-9.
97. Huang J, Wang X amd Zhang Y (2017). Specific types of alcoholic beverageconsumption and risk of type 2 diabetes: a systematic review and meta-analysis.Journal of Diabetes Investigation, 8(1):56-68.
98. Hussain A, Hydrie MZI, Claussen B and Asghar S (2010). Type 2 Diabetes and obesity:A review. Journal of Diabetology; 2(1):1-7.
99. Hwang J and Shon C (2014). Relationship between socioeconomic status and type 2diabetes: results from Korea National Health and Nutrition Examination Survey(KNHANES) 2010–2012. BMJ Open 2014; 4:e005710 pmid: 25138810.
100. Idril NI, Diana A and Wargahadibrata AF (2013). Preliminary study: glycemic index ofbrown and white rice variant IR64 in healthy adult men. International Journal ofIntergrated Health Sciences; 1(1):37-41.
101. Imungi JK and Potter NN (1983). Nutrient contents of raw and cooked cowpea leaves.Journal of Food Science; 48(4): 1252-1254.
102. International Diabetes Federation (IDF) Diabetes Atlas, 5th edition (2011):www.idf.org/diabetesatlas site visited on 1st September 2012.
103. International Diabetes Federation. IDF Diabetes Atlas, 8th edn. Brussels, Belgium:International Diabetes Federation, 2017. http://www.diabetesatlas.org
116
104. Jee SH, Foong AW, Hur NW and Samet, JM (2010). Smoking and risk for diabetesincidence and mortality in Korean men and women. Diabetes Care; 33:2567-2572.
105. Jenkins DJ, Wolever TM, Taylor RH, Baker H, Fielden H, Baldwin JM, Bowling AC,Newman HC, Jenkins AL and Goff DV (1981). Glycemic index of foods: aphysiological basis for carbohydrate exchange. American Journal ClinicalNutrition; 34:362–6.
106. Joseph JJ, Echouffo-Tcheugui JB, Golden SH, Chen H, Jenny NS, Carnethon MR,Jacobs JrD, Burke GL, Vaidya D, Ouyang P and Bertoni AG (2016). Physicalactivity, sedentary behaviours and the incidence of type 2 diabetes mellitus: theMulti-Ethnic Study of Atherosclerosis (MESA). BMJ Open Diabetes Researchand Care, doi: 10.1136/bmjdrc-2015-000185
107.Kahn SE, Prigeon RL, Schwartz RS, Fujimoto WF, Knopp RH, Brunzell JD and PorteDJr (2001). Obesity, body fat distribution, insulin sensitivity and islet β-cellfunction as explanations for metabolic diversity. Journal of Nutrition; 131(2)354S-360S.
108.Kaiser AB., Zhang N and Van Der Pluijm W (2018). Global Prevalence of Type 2Diabetes over the Next Ten Years (2018-2028). Diabetes; 67(Supplement 1): -doi.org/10.2337/Db18-202-LB.
109.Karp I and Karp P (1977) Social Aspects of Iteso Cookery. From Jessica Kuper, (ed.,)‘The Anthropologists' Cookbook. Routledge, and Kegan Paul, Pages 100-106.
110.Kato M, Noda M, Inoue M, Kadowaki T and Tsugane S (2009). Psychological factors,coffee and risk of diabetes mellitus among middle-aged Japanese: a population-based prospective study in the JPHC study cohort. Endocrinology Journal56(3):459-468.
111.Kelly SJ and Ismail M (2015). Stress and type 2 diabetes: a review of how stresscontributes to the development of type 2 diabetes. Annual Reviews of PublicHealth, 36:441-62
112.Kennedy G, Ballard T and Dop M (2010) Nutrition and Consumer Protection Division,Food and Agriculture Organization of the United Nations and Food and NutritionTechnical Assistance Project. Guidelines for Measuring Household andIndividual Dietary Diversity. FAO, Rome, 2008. ISBN 978-92-5-106749-9http://www.fao.org/3/a-i1983e.pdf.
113.Khattab M, Abi-Rashed C, Ghattas H, Hlais S and Obeid O (2015). Phosphorusingestion improves oral glucose tolerance of healthy male subjects: a crossoverexperiment. Nutrition Journal; 14:112. Doi 10.1186/s12973-015-0101-5.

117
114.Kirii K, Iso, H, Date C, Fukui M and Tamakoshi A (2010). Magnesium intake andrisk of self-reported type 2 diabetes among Japanese. Journal of the AmericanCollege of Nutrition; 29(2):99-106.
115.Kimani, D (2007) Kenya: Increasing affluences leading to rise in diabetes. Retrieved onthe 7th of June, 2010 from: http://www.propertykenya.com/news/490729-increasing-affluence-
116.Kitabchi AE, Temprosa M, Knowler WC, Kahn SE, Fowler SE, Haffner SE, Andres R,Saudek C, Edelsten SL, Arakaki R, Murphy MB and Shamoon H (2005). TheDiabetes Prevention Program Research Group. Role of insulin secretion andsensitivity in the evolution to type 2 diabetes in the diabetes prevention program.Diabetes; 54(8): 2404-2414.
117.KNBS (2005). Kenya National Bureau of Statistics. Economic survey. www.knbs.or.kesite visited on 7/10/ 16.
118.Kouame CA, Kouakou NK, Coulibaly A, N’dri DY, Tiahou GG, Adrien L and AmaniGD (2014). Glycemic index and glycemic load of selected staples based on rice,yam and cassava commonly consumed in Cote d’Ivoire, Food and NutritionSciences; 5(4):308-315.
119.Kouame AC, Kouassi KN, N’dri YD and Amani NG (2015). Glycaemic index andload values tested in normoglycemic adults for five staple
foodstuffs: Pounded yam, pounded cassava-plantain, placali, attieke and maizemeal stiff porridge. Nutrients; 7(2): 1267-1281.
120.Kuhnlein HV, Erasmus B, Spigelski D and Burlingame B (Eds.) (2013). Indigenouspeoples’ food systems and well-being, interventions and policies for healthycommunities. Food and Agriculture Organization of the United Nations Centrefor Indigenous Peoples’ Nutrition and Environment. Rome 2013; pp 5-9. ISBN978-92-5-107433-6. http://www.fao.org/docrep/018/i3144e/i3144e.pdf.
121.Kuo C, Moon K, Thayer KA and Navas-Acien A (2013). Environmental chemicals andtype 2 diabetes: an updated systematic review of the epidemiology evidence.Current Diabetes Reports; 13(6): 831-849.
122.Larsson SC and Wolk A (2007). Magnesium intake and risk of type 2 diabetes: a meta-analysis. Journal of Internal Medicine; 262(2): 208-214.
123.Ledergerber B, Furrer H, Rickenbach M, Lehmann R, Elzi L, Hirschel B, Cavassini M,Bernasconi E, Schmid P, Egger M and Weber R (2007). Factors associated withthe incidence of type 2 diabetes mellitus in HIV-infected participants in theSwiss HIV cohort study. Clinical Infectious Diseases; 45:111-119.
124.Lee DH, Folsom AR and Jacobs DR Jr (2004). Dietary iron intake and Type 2 diabetesincidence in postmenopausal women: the Iowa Women's Health Study.Diabetologia; 47(2):185-94.
118
125.Lee SW, Lee JH, Han SH, Lee JW and Rhee, C (2005). Effect of various processingmethods on the physical properties of cooked rice and on in vitro starchhydrolysis and blood glucose response in rats. Starch-starke; 57 (11), 531-539.
126.Lessmann JC, Silva DMGV and Nassar SM (2012). Women with type 2 diabetesmellitus: socio-demographic profile, biometrics and health. Acta PaulistaEnfermagem; 25(1):81-6.
127.Lin MHA, Wu MC, Lu S and Lin J (2010). Glycemic index, glycemic load andinsulinemic index of Chinese starchy foods. World Journal of Gastroenterology;16(39): 4973-4979.
128.Lindqvist PG, Olsson H and Landin-Olsson M (2010). Are active sun exposure habitsrelated to lowering risk of type 2 diabetes mellitus in women, a prospectivecohort study? Diabetes Research and Clinical Practice; 90(1):109-14.
129.Liu S, Willett W, Stampfer M, Hu FB, Franz M, Sampson L, Hennekens CH andManson JE (2000). A prospective study of dietary glycemic load, carbohydrateintake, and risk of coronary heart disease in US women. American Journal ofClinical Nutrition; 71: 1455–61.
130.Lopez-Ridaura R,Willet WC, Rimm EB, Liu S, Stampfer MJ, Manson JE and Hu FB(2004). Magnesium intake and risk of type 2 diabetes in men and women.Diabetes Care; 27(1):134-40.
131.Lovegrove A, Edwards CH, DeNoni I, Patel H, El SN, Grassby T, Zielke C, Ulmius M,Nilsson L, Butterworth PJ, Ellis PR and Shewry PR (2017). Critical Reviews inFood Science and Nutrition, 57(2):237-253
132.Macharia I, Orr A and Schipmann C (2012). Cereals consumption patterns in Kenya.International Crops Research Institute for the Semi-Arid Tropics (ICRISAT),Nairobi. http://hope.icrisat.org/wp-content/uploads/2015/11/Cereal-Consumption-Pattern-in-Kenya.pdf.
133.MacIntosh CG, Holt SHA and Brand-Miller JC (2003). The degree of fat saturationdoes not alter glycemic, insulinemic or satiety responses to a starchy staple inhealthy men. Journal of Nutrition; 133(8):2577-2580.
134.Mahgoub SO, Sabone M and Jackson J (2013). Glycaemic index of selected staplecarbohydrate-rich foods commonly consumed in Botswana. South AfricanJournal of Clinical Nutrition; 26(4):182-187.
135.Maina, W.K (2011) non-communicable diseases control in Kenya past, present, andfuture. Times media, Available at: http://www.times-publications.com/non-communicable.htm Accessed on 5/7/12.
119
136.Majaliwa, E.S., Elusiyan,B.E.J., Adesiyun, O.O., and Laigong,P (2008) Type 1diabetes mellitus in the African population: epidemiology and managementchallenges Acta Biomedica; 79: 255-59.
137.Mamiro PS, Mbwaga AM, Mamiro DP, Mwanri AW and Kinabo JL (2011).Nutritional quality and utilization of local and improved cowpea varieties insome regions in Tanzania. African Journal of food, Agriculture, Nutrition andDevelopment; 11(1): 4490-4506.
138.Mani UV, Iyer UM, Rai V and Parulkar J (1994). Study on the glycemic index ofselected cereals and cereal-green leafy vegetable combinations in non-insulin-dependent diabetes mellitus patients. Journal of Nutritional Medicine; 4(3):321-325. http://dx.doi.org/10.3109/13590849409007231.
139.Mathenge W, Foster A, Kuper H (2010). Urbanization, ethnicity and cardiovascularrisk in a population in transition in Nakuru, Kenya: a population-based survey.BMC Public Health.10: 569-10.1186/1471-2458-10-569.
140.Mathers C, Stevens G and Mascarenhas M (2010). WHO report on global health risks:mortality and burden of disease attributable to selected major risks.www.who.int/healthinfo/global_burden_disease/GlobalHealthRisks_report_full.pdf.
141.Mattei JM, Malik V, Wedick NM, Hu FB, Spiegelman D, Willet WC and Campos H(2015). Reducing the global burden of type 2 diabetes by improving the qualityof staple foods: The global nutrition and epidemiologic transition initiative.Globalization and Health, 2015; 11:23. DOI 10.1186/s12992-015-0109-9.
142.Mayer EJ, Newman B, Quesenberry CP, Friedman GD and Selby JV (1993). Alcoholconsumption and insulin concentrations. Role of insulin in associations ofalcohol intake with high density lipoprotein cholesterol and triglycerides.Circulation; 88: 2190–7.
143.Mayfield J (1998). Diagnosis and classification of diabetes mellitus: New criteria.American Family Physician; 58(6):1355-1362.
144.Mbhenyane XG, Venter CS, Vorster HH and Steyn HS (2001). Glycemic index ofindigenous South African foods. South African Journal of Clinical Nutrition;14(3):88-95.
145.Mbochi R, Kuria E, Kimiywe J, Ochola S and Steyn N (2012). Predictors ofoverweight and obesity in adult women in Nairobi Province, Kenya. BioMedCentral Public Health 12:823. DOI: 10.1186/1471-2458-12-823.
146.McFerran L (2008). Obstacles to diabetes care in Kenya. Medical Journal ofTherapeutics Africa; 2:127-129.
147.McIntyre HD, Chang AM, Callaway LK, Cowley DM, Dyer AR, Radaelli T, FarrellKA, Huston-Presley L, Amini SB, Kirwan JP and Catalano PM (2010).

120
Hormonal and metabolic factors associated with variations in insulin sensitivityin human pregnancy. Diabetes Care; 33 (2):356-360.
148.Miller JB, Pang E and Bramall L (1992). Rice: a high or low glycemic index food?American Journal of Clinical Nutrition; 56:1034-6.
149.Miller CK, Gutshcall MD and Mitchell DC (2009). Change in food choices following aglycemic load intervention in adults with type 2 diabetes. Journal of theAmerican Dietetic Association; 109(2):319-24.
150.MiMW (MJoTA Institute of Medical Writing) (2008). Obstacles to diabetes care inKenya. Medical Journal of Therapeutics Africa, vol.2 (2): 127-30
151.MoPHS (Ministry of Public Health and Sanitation) (2005). Kenya national diabetesstrategy 2010 – 2015 www.pubhealth.go.ke.
152.Mlotha V, Mwangwela AM, Kasapila W, Siyame EWP and Masamba K (2016).Glycemic responses to maize flour stiff porridges prepared using local recipes inMalawi. Food Science and Nutrition; 4(2): 322-328.
153.Mohajan HR (2014). Food and nutrition scenario of Kenya. American Journal of Foodand Nutrition, 2014; 2(2):28-38. DOI:10.12691/ajfn-2-2-3.
154.Mohan V, Anjana RM, Gayathri R, Bai MR, Jakir MM, Shobana S, Unnikrishnan R,Krishnaswamy K, Henry JK and Sudha V (2016). Glycemic index of a novelhigh-fiber white rice variety developed in india- a randomized control trial study.Diabetes Technology and Therapeutics; 18(3). DOI: 10.1089/dia.2015.0313.
155.Moran LJ, Misso ML, Wild RA and Norman RJ (2010). Impaired glucose tolerance,type 2 diabetes and metabolic syndrome in polycystic ovary syndrome: asystematic review and meta-analysis. Human Reproduction Update; 16: 347–63.
156.Moretto MC, Tadono MI, Neri AL and Guariento ME (2015). Associations among self-reported diabetes, nutritional status, and socio-demographic variables incommunity-dwelling older adults. Revista de Nutricao Campinas; 27(6): 653-664.
157.Mozaffarian D, Kamineni A, Carnethon M, Djousse, Mukamal KJ and Siscovick D(2009). Lifestyle risk factors and new-onset diabetes mellitus in older adults: thecardiovascular health study. Archives of Internal Medicine; 169(8):798-807.
158.Murakami K, Okubo H and Sasaki S (2005). Effect of dietary factors on incidence oftype 2 diabetes: a systematic review of cohort studies. Journal of NutritionalScience and Vitaminology; 51(4):292-310.
159.Musyoka MP, Kavoi MM and Omiti JM (2014). Food consumption patterns anddistributional welfare impact of import tariff reduction on cereals in Kenya.African Journal of Agricultural and Resource Economics; 9(3): 183-199.
121
160.Nabubuya A, Namutebi A, Byaruhanga Y, Narvhus J and Wicklund T (2012). Potentialuse of selected sweet potato (Ipomea batata Lam) varieties as defined bychemical and flour pasting characteristics. Food and Nutrition Sciences, 2012; 3:889-896.
161.Nanri A, Mizoue T, Kayo Kurotani K, Goto A, Oba S, Noda M, SawadaN and TsuganeS (2015). Low-Carbohydrate Diet and Type 2 Diabetes Risk in Japanese Menand Women: The Japan Public Health Center-Based Prospective Study. PLosOne https://doi.org/10.1371/journal.pone.0118377
162.Nilsson M, Stenberg M, Frid AH, Holst JJ, and Bjorck IM (2004) Glycemia andinsulinemia in healthy subjects after lactose equivalent meals of milk and otherfood proteins: the role of plasma amino acids and incretins. American Journal ofClinical Nutrition 80 (5), 1246-53.
163.Ntawuruhunga P and Okidi J (2010). East Africa root crops research network(EARRNET) Legacy. International Institute of Tropical Agriculture, 2010;56pp. www.iita.org.
164.Nungo RA (1999). Promoting sweet potato processing and utilization: experience inWestern Kenya. Unpublished article. Site visited on 5th January, 2017.https://assets.publishing.service.gov.uk/…/R7036_File_Rhoda_Kakamega.
165.Ofwona AC (2013). An analysis of patterns of food consumption among households inKenya. Journal of Emerging Trends in Economics and Management Sciences(JETEMS); 4(1): 111-113.
166.Ogbuji CA and David-Chukwu NP (2016). Gycemic indices of different cassava foodproducts. European Journal of Basic and Applied Sciences; 3(2): 2059-3058.
167.Ohlund M, Egenvall A, Fall T, Hansson-Hamlin H, Rocklinsberg H and Holst BS(2017). Journal of Veterinary Internal Medicine, 31(1): 29-35.
168.Oiye, S., Ole Simel J., Oniang’o R and Johns, T (2009) .The Maasai food system andfood and nutrition security. Indigenous Peoples’ food systems: the manydimensions of culture, diversity and environment for nutrition and health;pp231-249. Food and Agriculture Organization of the United Nations Centre forIndigenous Peoples’ Nutrition and Environmentftp://ftp.fao.org/docrep/fao/012/i0370e/i0370e12.pdf site visited on 10th March,2017).
169.Omoregie ES and Osagie AU (2008). Glycemic indices and glycemic load of someNigerian Food. Pakistan Journal of Nutrition; 7 (5): 710-716.
170.Oniang’o RK and Komokoti A (1999). Food habits in Kenya: The effect of change andattendant methodological problems. Appetite; 32:93-96.Article No.appe.1998.0201, available online at http://www.idealibrary.com.
122
171.Onimawo IA, Arukwe IJ and Nzeagwu OC (2010). Evaluation of glycemic indices ofrice (served with stew) prepared from four varieties of rice in Abakaliki, Nigeria.Nigerian Journal of Nutritional Sciences; 31(2)http://dx.doi.org/10.4314/njns.v31i2.63920.
172.Onsomu E (2008). Profile of Women’s Socio- Economic Status in Kenya. Institute ofEconomic Affairs – Kenya; ISBN: 9966-7183-3-8.
173.Onyango C (2014). Physical properties of dry-milled maize meals and their relationshipwith texture of stiff and thin porridge. African Journal of Food Science 8, 435-443.
174.Ortega RM, Rodriguez-Rodriguez E, Aparicio A and Jimenez AI (2012). Poor zincstatus is associated with increased risk of insulin resistance in Spanish children.British Journal of Nutrition; 107(3):398-404.
175.Oti SO, van der Vijver SJM, Agyemang C and Kyobutungi C (2013). The magnitude ifdiabetes and its association with obesity in the slums of Nairobi, Kenya: resultsfrom a cross-sectional study. Tropical Medicine and International Health;18(12): 1520-1530.
176.Otieno CF, Kariuki M and Ng’ang’a L (2003). Quality of glycaemic control inambulatory diabetics at the out-patient clinic of Kenyatta National Hospital,Nairobi. East African Medical Journal; 80 (8): 406-10.
177.Otieno R (2007). News Article. Increasing affluences leading to rise in diabetes AfricaNews, East African, 4/7/2007.
178.Padmaja G, Sheriff J and Sajeev MS (2012). Food uses and nutritional benefits ofsweet potato. Fruit, Vegetable and Cereal Science and Biotechnology; 6(1): 115-123.
179.Palmer JR, Boggs DA, Krishnan S, Hu FB, Singer M, Rosenberg L (2008). Sugar-Sweetened Beverages and Incidence of Type 2 Diabetes Mellitus in AfricanAmerican Women. Archives of Internal Medicine. 168(14):1487-1492.doi:10.1001/archinte.168.14.1487.
180.Passos TU, Sampaio HA, Sabry MOD, Melo MLP, Coelho MAM and Lima JWD(2014). Glycemic index and glycemic load of tropical fruits and the potential riskfor chronic diseases. Food Science and Technology, Campinas, 35(1): 66-73.
181.Pastakia S, Ali S, Kamano J, Akwanalo C, Ngege S, Buckwalter V, Vedanthan R andBloomfield GS (2013). Screening for diabetes and hypertension in a rural lowincome setting in western Kenya utilizing home-based and community-basedstrategies. Globalization and Health; 9:21. DOI: 10.1186/1744-8603-9-21.

123
182.Penckofer S, Kouba J, Wallis DE and Emanuela MA (2008). Vitamin D and diabetes:let the sunshine in. Diabetes Education; 34(6):939-40.
183.Penckofer S, Kouba J, Byrn M and Estwing FC (2010). Vitamin D and depression:where is all the sunshine? Issues in Mental Health Nursing; 31(6):385-93.
184.Pi-Sunyer FX (2002). Glycemic index and disease. American Journal ClinicalNutrition; 76: 290S-8S.
185.Popkin B (2002). An overview on the nutrition transition and its health implications:the Bellagio meeting. Public Health Nutrition; 5:93-103.
186.Pouwer F, Kupper N and Adriaanse MC (2010). Does emotional stress cause type 2diabetes mellitus? A review from the European depression in diabetes (EDID)research consortium. Discovery Medicine; 9(45):112-18.
187.Racette SB, Evans EM, Weiss EP, Hagberg JM and Holloszy JO (2006). Abdominaladiposity is a stronger predictor of insulin resistance than fitness among 50–95year olds. Diabetes care; 29(3):673-8.
188.Rao CR, Kamath VG, Shetty A and Kamath A (2010). A study on the prevalence oftype 2 diabetes in coastal Karnataka. International Journal of Diabetes DevCtries; 30(2):80–85.
189.Riccardi A, Rivellese AA and Giacco R (2008). Role of glycemic index and glycemicload in the healthy state, in prediabetes, and in diabetes. American Journal ofClinical Nutrition; 87(1) 269S-74S.
190.Ripsin, C.M., Kang, H and Urban, R.J (2009) "Management of blood glucose in type 2diabetes mellitus". American Family Physicians; 79 (1): 29–36.
191.Robert, S.D., Ismail, A.A, Winn, T and Wolever, T.M.S (2008) Glycemic index ofcommon Malaysian fruits Asia Pacific Journal of Clinical Nutrition; 17(1):35-39
192.Roberts, C.K and Barnard, R.J (2005) Effects of exercise and diet on chronic diseaseJournal of Applied Physiology, 98(1), 3 - 30.
193.Robbins JM, Vaccarino V, Zhang H and Kasl S (2000) Excess type 2 diabetes inAfrican-American women and men aged 40–74 and socioeconomic status:evidence from the Third National Health and Nutrition Examination Survey.Journal of Epidemiology and Community Health; 54:839-45.
194.Rod NH, Grønbaek M, Schnohr P, Prescott E and Kristensen TS (2009). Perceivedstress as a risk factor for changes in health behaviour and cardiac risk profile: alongitudinal study. Journal of Internal Medicine; 266(5):467-475.
195.Rodrigo CM, Aranceta J, Salvador G and Varela-Moreiras G (2015). Food FrequencyQuestionnaires. Nutrition Hospitalaria; 31 (Supl.3):49-56

124
196.Ruhembe CC, Nyaruhucha CNM and Mosha TCE (2014). Glycemic Index of selectedstaple foods used in the management of type 2 diabetes mellitus in Tanzania.International Journal of Sciences: Basic and Applied Research; 13(2):48-62.
197.Ryan E A (2003). Hormones and insulin resistance during pregnancy. The Lancet; 362(9398: 1777-78.
198. Schulze MB, Schulz M, Heidemann C, Schienkiewitz A, Hoffmann K and Boeing H(2007). Fiber and magnesium intake and incidence of type 2 diabetes: aprospective study and meta-analysis Archives of Internal Medicine; 167(9):956-65.
199.Shankar A and Teppala S (2011). Relationship between urinary bisphenol A levels anddiabetes mellitus. Journal of Clinical Endocrinology and Metabolism;96(12):3822-6.
200.Siega-Riz A, Evenson K and Dole N (2004). Pregnancy-related weight gain- a link toobesity? Nutrition Reviews; 62:S105-S111.
201.Sluijs I, Beulens JW, van ber A DL, Spikerman AMW, Grobbee DE and van derSchouw YT (2010). Dietary intake of total, animal, and vegetable protein andrisk of type 2 diabetes in the European Prospective Investigation into Cancer andNutrition (EPIC)-NL study. Diabetes Care; 33(1):43-48.
202.Stranges S, Sieri S, Vinceti M, Grioni S, Guallar E, Laclaustra M, Muti P, Berrino Fand Krogh V (2010). A prospective study of dietary selenium intake and risk oftype 2 diabetes. BioMedCentral Public Health; 21: 10:564.
203.Stadlmayr B, Charrondiere R, Enujiugha VN, Bayili RG, Fagbohoun EG, Samb B,Addy P, Barikmo I, Ouattara F, Oshaug A, Akinyele I, Annor GA, Bomfeh K,Ene-Obong H, Smith IF, Thiam I and Burlingame B (2012). West African foodcomposition table. The Food and Agriculture Organization of the United Nations(FAO) Viale delle Terme di Caracalla, 00153 Rome, Italy. ISBN 978-92-5-007207-4.
204.Steenbergen WM, Kusin JA and Onchere SR (1984). Household activities and dietarypatterns. In: Maternal and child health in rural Kenya: an epidemiological study,edited by Van Ginneken JK and Muller AS. London, England, Croom Helm,1884.31-42.
205.Stefoska-Needham A, Beck E, Johnson SK and Tapsell LC (2015). Sorghum: anunderutilized cereal whole grain with the potential to assist in the prevention ofchronic disease. Food Reviews International; 31(4):401-437.
206.Sugiyama M, Tang AC, Wakaki Y and Koyama W. (2003). Glycemic index of singleand mixed meal foods among common Japanese foods with white rice as areference food. European Journal of Clinical Nutrition; 57, 743-52.
125
207.Sun Q, van Dam RM, Willet WC and Hu FB (2009). Prospective study of zinc intakeand risk of type 2 diabetes in women Diabetes Care; 32(4):629-34.
208.Svensson K, Hernandez-Ramirez RU, Burguete-Garcia A, Cebrian ME, Calafat AM,Needham LL, Claudio L and López-Carrilo L (2011). Phthalate exposureassociated with self-reported diabetes among Mexican women. EnvironmentalResearch; 111(6):792-6.
209.Thompson SV, Winham DM and Hutchins AM (2012). Bean and rice meals reducepostprandial glycemic response in adults with type 2 diabetes: a cross-overstudy. Nutrition Journal; 11: 23 doi: 10.1186/1475-2891-11-23.
210.Thorne MJ, Thompson LU and Jenkins D (1983). Factors affecting starch digestibilityand the glycemic responses with special reference to legumes. American Journalof Clinical Nutrition; 38:481-488
211.Tuomilehto J, Lindström J, Eriksson JG, Valle TT, Hämäläinen K, Illanne-Parikka P.,Keinänen-Kiuaanniemi S, Laakso M, Louheranta A, Rastas M, Salminen V,Aunola S, Cepaitis Z, Moltchanov V, Hakumäki M, Mannelin M, Martikkala V,Sundvall J and Uusitupa M (2001). Prevention of type 2 diabetes mellitus bychanges in lifestyle among subjects with impaired glucose tolerance. The NewEnglish Journal of Medicine; 344:1343-50.
212.Tanaka H and Seals DR (2008). Endurance exercise performance in Masters Athletes:age-associated changes and underlying physiological mechanisms. The Journalof Physiology; 586, 55-63.
213.Tanaka T, Gjonça E and Gullifor MC (2012). Income, wealth and risk of diabetesamong older adults: cohort study using the English longitudinal study of ageing.European Journal of Public Health; 22(3):310-7.
214.Tang-Péronard JL, Andersen HR, Jensen TK and Heitmann BL (2011). Endocrine-disrupting chemicals and obesity development in humans: a review. ObesityReviews; 12(8):622-36.
215.USDA (United States Department of Agriculture) (2002). Nutrient database forstandard reference. www.ndb.nal.usda.gov/ndb/nutrients/reports/nutrients. Sitevisited in 9th May 2014.
216.Vahouny GV and Kritchevsky D (Eds.) (1986). Dietary fiber basic and clinical aspects.Proceedings of the second Washington symposium on dietary fiber, held April25-28, in Washington, D.C. Plenum press, New York.
217.van Loon LJ, Kruisjshoop M, Menheere PP, Wagenmakers AJ, Saris WH and KeizerHA (2003). Amino acid ingestion strongly enhances insulin secretion in patientswith long-term type 2 diabetes Diabetes Care; 26(3): 625-30.

126
218.Veghari G, Sedaghat M, Joshaghani H, Hoseini SA, Niknezad F, Angizeh A, Tazik Eand Moharloei P (2010). Association between socio-demographic factors anddiabetes mellitus in the north of Iran: A population-based study. InternationalJournal of Diabetes Mellitus; 2:154–157.
219.Venn BJ and Green TJ (2007). Glycemic index and glycemic load: measurement issuesand their effect on diet-disease relationships. European Journal of ClinicalNutrition; 61 (S1):S122-31.
220.Villegas R, Liu S, Gao Y, Yang G, Li H, Zheng W and Shu XO (2007). Prospectivestudy of dietary carbohydrates, glycemic index, glycemic load and incidence oftype 2 diabetes mellitus in Middle-aged Chinese women. Archives of InternalMedicine; 167(21):2310-2316.
221.Villegas R, Gao YT, Dai Q, Yang G,Cai H, Li H, Zheng W and Shu XO (2009).Dietary calcium and magnesium intakes and the risk of type 2 diabetes: theShanghai Women's Health Study. American Journal of Clinical Nutrition;89(4):1059-67.
222.Wanjala WG, Onyango A, Makayoto M and Onyango C (2016). Indigenous technicalknowledge of thick (ugali) and thin (uji) porridges consumed in Kenya. AfricanJournal of Food Science; 10(12): 385-396.
223.Wang Q, Xia W, Zhago Z and Zhang H (2015). Effects comparison between lowglycemic index diets and high glycemic index diets on HbA1c and fructoseaminefor patients with diabetes: A systematic review and meta-analysis. Primary carediabetes; 9(5): 362-369.
224.Wannamethee S, Camargo CJ, Manson J, Willet W and Rimm E (2003). Alcoholdrinking patterns and risk of type 2 diabetes mellitus among younger women.Archives of Internal Medicine; 163: 1329-1336.
225.Waweru M (2017). More at risk of diabetes with increased unhealthy lifestyle. CapitalNews 11/5/2017. Available at: www.capitalfm.co.ke/news/201 (Accessed on18/6/17).
226. Wei M, Gibbons LW, Mitchell TL, Kampert JB and Blair SN (2000). Alcohol intakeand incidence of type 2 diabetes in men. Diabetes Care; 23(1):18-22
227.Weycker D, Nichols GG, O’Keeffe-Rosetti M, Edelsberg J, Vincze G, Khan ZM andOster G (2008). Excess risk of diabetes in persons with hypertension. Journal ofDiabetes Complications; 23(5):330-6.
228.Wolever TMS (2003). Carbohydrate and the regulation of blood glucose andmetabolism Nutrition Reviews 61, S40 - S48.
127
229.Wheeler ML and Pi-Sunyer FX (2008) Carbohydrate issues: type and amount. Journalof the American Dietetic Association; 108(4) (S1):S34-9.
230.WHO/IDF (2008). World Health Organization (WHO)/IDF report of consultation:Definition, diagnosis of diabetes mellitus and intermediate glycemic. Geneva:World Health Organization; WHO. Report on diabetes and other chronic noncommunicable diseases. Geneva:www.who.int/diabetes/.../Definition%20and%20diagnosis%20of%20diabetes_new.pdf
231.WHO (2009). World Health Organization. Global health risks: mortality and burden ofdisease attributable to selected major risks. Geneva.
232.WHO (2010). World Health Organization.. Estimates of the global and regional burdenof diabetes. World Diabetes Foundation Summit for Latin America. Salvador,Bahia, Brazilhttp://www.worlddiabetesfoundation.org/media(9358,1033)/Roglic,_Gojka.pdfsite visited on 6th august 2014.
233.WHO (2011).World Health Organization. Waist Circumference and Waist–Hip Ratio:Report of a WHO Expert Consultation Geneva, 8–11 December 2008.http://apps.who.int/iris/bitstream/10665/44583/1/9789241501491_eng.pdf.
234.Wikström K, Lindström J, Tuomilehto J, Saaristo TE, Korpi-Hyövälti E, Oksa H,Vanhala M, Niskanen L, Keinänen-Kiukaanniemi S, Uusitupa M and Peltonen M(2011). Socio-economic differences in dysglycemia and lifestyle-related riskfactors in the Finnish middle-aged population. European Journal of PublicHealth; 21 (6): 768-74.
235.Wild S, Roglic G, Green A, Sicree R and King H (2004). Global Prevalence ofDiabetes: Estimates for the year 2000 and projections for 2030. Diabetes Care;27(5):1047-53.
236.Wild S and Byrne C (2006). Risk factors for diabetes and coronary heart disease.British Medical Journal 333, 1009-1011. doi:10.1136/bmj.39024.568738.43.
237.Willi C (2008).Type 2 Diabetes Risk Higher in Smokers. The Journal of the AmericanDental Association; 139(2): 132-33.
238.Wolever, T.M.S, Brand-Miller, J.C., Abernethy, J., Astrup, A.,Atkinson F, Axelsen M,Bjorck I, Brighenti F, Brown R, Brynes A, Casiraghi MC, Cazaubiel M,Dahiqvist L, Delport E, Denyer GS, Erba D, Frost G, Granfeldt Y, Hampton S,Hart VA, Hatonen KA, Henry CJ, Hertzler S, Hull S, Jerling J, Johnson KL,Lightowler H, Mann N, Morgan L, Panlasiqui LN, Pelkman C, Perry T, PfeifferAF, Pieters M, Ramdath DD, Ramsingh RT, Robert SD, Robinson C, SarkkinenE, Scazzina F, Sison DC, Sloth B, Staniforth J, Tapola N, Valsta LM, VerkooijenI, Weickert MO, Weseler AR, Wilkie P and Zhang J (2008). Measuring the

128
glycemic index of foods: interlaboratory study. American Journal of ClinicalNutrition; 87 (1): 247S-57S.
239.Yeh H, Duncan B, Schmidt M, Wang N and Brancati F (2010). Smoking, smokingcessation, and risk for type 2 diabetes mellitus: a cohort study. Annals of InternalMedicine; 152: 10-17.
240.Yoshida M, Jacques PF, Meigs JB, Saltzman E, Shea MK, Gundberg C, Dawson-Hughes B, Dallal G and Booth SL (2008). Effect of vitamin K supplementationon insulin resistance in older men and women. Diabetes Care; 31(11):2092-6.doi: 10.2337/dc08-1204.
241.Zanella MT, Kohlmann Jr O and Ribeiro AB (2001). Treatment of ObesityHypertension and Diabetes Syndrome. Hypertension; 38: 705-708.
242. (2008), Chapter 4: Nutritionally improved sweet potato. Comprehensive reviews inFood Science and Food Safety; 7:81-91. doi:10.11.1111/j.1541-4337.2007.00029_6.x.

129
APPENDICES
Appendix 1: Ethical Clearance

130
Appendix 2: Household Survey Questionnaire
General Information
Date…………… Location ……………. Sub-location ………….. Interviewer …………..
Language used: Kiswahili [ ] Ateso [ ] Both [ ] Time Started:…… Time Ended: ….……
Section A. Socio-Demographic and Socio-Economic Status
1. Personal Information
Name: ………………………………. ………………….. Age: ………………………
Marital status: …………………………………………… Ethnicity: …………………
Highest level of education: ……………………………… Employment: …………….
Number of family members: ………………….
2. What is the main source of income for the household?
Salary/wages [ ] Farming [ ] Business [ ] Earnings from assets [ ] other (specify)……...
3. What is your households’ monthly income (salary/non salary)? KES ……………………….
Section B: Diabetes, History and Physical Activity
1. Do you know whether you are suffering from diabetes? Yes [ ] No [ ]
2. Does any of your parent or sibling suffer from diabetes? Yes [ ] No [ ]
Activity at Work
3.a) Does your work involve vigorous-intensity activity such as carrying or lifting heavy loads,digging or construction work for at least 10 minutes continuously? Yes [ ] No [ ]
b) If yes, how many days in a week? [ ] Number of days
c) How much time do you spend doing these vigorous-intensity activities at work on a typicalday? ………..hrs
131
4.a) Does your work involve moderate-intensity activity such as brisk walking or carrying lightloads for at least 10 minutes continuously? Yes [ ] No [ ]
b) If yes, how many days in a week? [ ] Number of days
c) How much time do you spend doing moderate-intensity activities at work on a typical day?………hrs
Travel to and from places
The next questions exclude the physical activities at work that you have already mentioned.Now I would like to ask you about the usual way you travel to and from places. For example towork, shopping, market or to place of worship.
5.a) Do you walk or use a bicycle for at least 10 minutes continuously to get to and fromplaces? Yes [ ] No [ ]
b) If yes, how many days in a week? [ ] Number of days
c) How much time do you spend walking or bicycling for travel on a typical day? ……..hrs
Sedentary Behavior
The following question is about relaxing. It includes time spent sitting at a desk, sitting withfriends, traveling in a vehicle, reading or watching television, but not the time spent sleeping.
6. How much time do you usually spend sitting or relaxing on a typical day? ..……..hrs

132
Section C: Dietary Intake
Table 2: Food Frequency Questionnaire
How often did you eat the following foods over the past month?
Food Description (popular cookingmethod)
Amount PerDay
PerWeek
PerMonth
Seldom/Never
(a) Cereals & legumes
Ugali Whole meal maize servings
Sifted maize meal servings
Cassava/millet servings
Cassava/sorghum servings
Cassava/millet/sorghum servings
Ugali and meat
Ugali and green vegetables(specify)
Ugali and other relish(specify)
Porridge Whole maize meal cups
Sifted maize meal cups
Millet cups
Other (specify) cups
Bread White/Brown slices
Rice White/brown servings
Chapatti White/brown
Green maize cobs
Githeri: maize-beans servings
Mandazi
Groundnuts bowls
Sesame seeds balls/bowls

133
Beans bowls
Soya beans bowls
Cowpeas seeds bowls
Green grams bowls
Fruits & vegetables
Mango
Guava
Avocado
Banana
Pineapples
Passion
Lemon/lime
Orange
Watermelon
Kales bowls
Cowpeas leaves bowls
Local vegetables (specify) bowls
Cassava pieces
Cassava-beans mash servings
Sweet potatoes Flesh color pieces
Sweet potato - beans mash Boiled/fried ……servings
Plantain servings
Mushrooms bowls
Beverages & Cigarette
Tea cups
Soft drinks bottles/cups
Alcohol Busaa (local brew) cups
Chang’aa (local distilled liquor) cups

134
Industrial beer/wine cups
Cigarette
Meat
Red meat bowls
Lamb mutton bowls
Goat mutton bowls
Pork bowls
Beef offals (matumbo) bowls
Fish & poultry
Chicken pieces
Fish pieces
Silver fish bowls
bowls
Eggs
Dairy products
Fresh milk cups
Mala cups
Yoghurt cups
Are there other foods/beverages not listed that you consumed in the past year? If so, explain:
Section D: Anthropometry
Weight (kg)………Height (m)……Waist Circumference (cm) ………………………………….
Hip Circumference (cm) .……Blood Pressure (mmHg).........Blood Sugar (mmol/L)....................
Thank you for your cooperation and patience. Your telephone number please ………………Good-bye!
135
Appendix 3: Focus Group Discussion Moderator’s Guide
1. Food consumption pattern in the area
What foods do you normally consume in this area? …………………………………………..
How many times do you eat in a normal day? ……………………………………………………
Do you have any specific foods for special occasions such as for weddings, in-laws or for the
sick? ………………………………………………………………………………………………
If yes, what foods are these? ……………………………………………………… ……………
Are there any foods that you consider as taboo foods? (e.g. for elderly, young, pregnant,
lactating women) If yes, which ones? ……………………………………………………………
What specific foods are meant for infants, young children, pregnant and lactating
women? ...........................................................................................................................................
2. Diet and diseases knowledge
What foods do you consider as healthy foods? ………………………………………
Are there any foods that you associate with disease? If yes, which foods and what diseases?
……………………………………………………………………………………………………
Is overweight associated with disease? What diseases are caused by being overweight?
……………………………………………………………………………………………………..
3. Knowledge about diabetes
What do you think causes diabetes? Who is affected by it? What treatment is available here?
What do you normally do to prevent and manage existing diabetes? Is the healthcare available
here sufficient? What do you think can be done to improve the healthcare in this area?
Causes: ……………………………………………………………………………………………………
Affected group: ………………………………………………………………………………………….
Prevention and management: …………………………………………………………………………….
136
What foods do you associate with diabetes?
Foods for diabetes management: ………….................................…………………………………
Foods that cause diabetes: ……………………………………….……………………………….
Training on nutrition; understanding of glycemic index ………….………………………………
Barriers to management of diabetes and suggestions to improve diabetes management ……..…..
4. Social and health habits
Do you know of any health problems caused by drinking too much alcohol or smoking
cigarettes? If yes, which ones?
Drinking too much alcohol: ………………………………………………………………..………….
Smoking cigarettes: …………………………………………………………………………………. .
Do you have any questions or final comments? Is there anything important you think I missed?
Thank you for your cooperation! “May I have your telephone number please?” …………….

137
Appendix 4: Key Informant Interview Moderator’s Guide
Food consumption patterns in the area
What foods do people normally consume in this area? ………………………………………….
How many times do people eat in a normal day? ………………………………………………
Do people have any specific foods for special occasions (weddings/in-laws/the sick)…………..
If yes, what foods are these? …………………………………………………………………..
Are there any foods that people consider as taboo foods? If yes, which ones?
……………………………………………………………………………………………………
What specific foods are meant for infants, young children, pregnant and lactating
women? ..........................................................................................................................................
2. Diet and diseases knowledge
What foods do people consider as healthy foods? …………………………………………… ..
Are there any foods that people associate with disease? If yes, which foods and what diseases?
………………………………………………………………………………………………… …
What diseases do people think can result from eating too much carbohydrate, fat or sugar?
Carbohydrates: ………………………………………………………………….……………..
Fat: ……………………………………………………………...........................……………
Sugar: ………………………………………………………………………………………..
Is overweight associated with disease? What diseases are caused by being overweight?
………………………………………………………………………………………………..
3. Knowledge about diabetes
What do people think causes diabetes? Who is affected by it? What treatment is available here?
How do people normally prevent and manage existing diabetes? Is the healthcare available
here sufficient? What do you think can be done to improve the healthcare in this area?
Causes: ……………………………………………………………………………………………………

138
Affected group: ………………………………………………………………………………………….
Prevention and management: ………………………………………………………………………….
What foods do people associate with diabetes?
Foods for diabetes management: ……………………………………………………………….
Foods that cause diabetes: ……………………………………………………………………………….
Training on nutrition; understanding of glycemic index: ……………………………………...
Barriers to management of diabetes and suggestions to improve diabetes management ………
4. Social and health habits
Do you know of any health problems caused by drinking too much alcohol or smoking
cigarettes? If yes, which ones?
Drinking too much alcohol: ………………………………………………………………………
Smoking cigarettes: …………………………………………………………………………. …..
Do you have any questions or final comments? Is there anything important you think I missed?
Thank you for your cooperation! “May I have your telephone number please?” …....................

139
Appendix 5: Informed Consent Forms
(a) Household Survey Participants
Researchers Statement
We are requesting you to participate as a volunteer in our research. The study is titled “the
glycemic indices in association with diabetes in rural women of Kenya: case of Amagoro in
Busia County”.
This consent form is meant to give you the necessary information you may need in order to
decide whether to be a participant or not. Please read this form carefully and ask for
clarification where necessary.
Purpose of the Study
This study is aimed at helping us understand why diabetes is prevalent in Amagoro. The
information will particularly help us understand whether the foods we consume play any role.
We shall be able to know if people are eating enough and if they are healthy. This information
will help health care personnel and policy makers to gain additional understanding on ways of
improving diabetes management in this region.
Study Procedures
We want to find out what people living in this area eat and drink. First we shall questions about
yourself and your family in general. I will later on go through a list of foods and drinks and I
would like you to tell me: - if you eat the food - how the food is prepared - how much of the
food you eat at a time - how many times a day you eat it and if you do not eat it every day, how
many times a week, month or in a year you eat it. We have cups, spoons and bowls that you can
use to estimate the amount of food you ate. Estimate if you are not sure. There is no right or
wrong answer in this interview. We estimate that the interview may take 30 to 40 minutes. You
participation is voluntary and you can therefore agree or refuse to participate. You can also
decline to answer specific questions that you feel you are uncomfortable with.

140
Risks
Since the information released during the interview might be personal and sensitive, the
researcher will carry out debrief for all the participants to ensure that anybody who might have
been negatively affected during the process gets the necessary help.
Benefits
The information gathered from this study will be communicated back to you and if you have
any questions regarding the relationship between diet and disease especially diabetes, you may
ask. You can also have free testing to establish whether you are diabetic or not if you wish to.
We can also share some information on healthy living at the end of our session if you will be
interested. We also expect that there will be benefits to the society as information gathered from
this study will help health care personnel gain more knowledge that would improve diabetes
management in this region.
Confidentiality
All the information you will give will be kept in a secure place and destroyed after it has been
analyzed. With the exception of the research team, nobody else will have access.
Voluntary Participation
You have the absolute freedom to decide whether to participate in the study or not. You can
also decline to answer any question that you are uncomfortable with. However since your views
are very important, we hope that you will agree to participate in this survey.
Leaving the Study
You are free to leave the discussion at any time.
Your Rights as a Participant
Kenyatta National Hospital and University of Nairobi Ethics and Research Committee
(KNH/UoN-ERC) have reviewed and approved this research. If you have any questions about
your rights, you may contact the principal investigator, study supervisor or the Chairman
(KNH/UoN-ERC) on the following numbers.
Principal investigator: Rebecca Ebere-0738 877 050
141
Supervisor: Prof Violet Kimani-0722 445 120
Chairman KNH/UoN-ERC:-020726300
Your participation in this survey would be highly appreciated. You are required to sign this
consent form before we start. If you have any questions about the study you may ask them now.
Statement of Consent and Signatures
This document that describes procedures for the research titled “The glycemic indices in
association with diabetes in rural women of Kenya: case of Amagoro in Busia County”
including its risks and benefits has been explained to me. By signing this form, I do understand
that I do not give up my rights as a participant.
Signed (Signature or thumb print)
Participant ………………………… Date …………………………
Study staff ………………………… Date …………………………
Witness…………………………….. Date…………………………
Copies to: 1. Investigator 2. Study participant
(b) Key Informant Interview (KII) Participants
Researchers’ Statement
We are requesting you to be a volunteer in a research study titled “The glycemic indices in
association with diabetes in rural women of Kenya: case of Amagoro in Busia County”.
This consent form gives you the information that will help you to decide whether to be in the
study or not. Read this form carefully and ask for clarification where necessary.
Purpose of the Study
This study is aimed at helping us understand why diabetes is prevalent in Amagoro. The
information will particularly help us understand whether the foods we consume play a role in
increasing its prevalence here. This information will help health care personnel gain more
understanding on ways of improving diabetes management in this region.
142
Study Procedures
We are requesting you to share with us information about the diet in this region. I would like us
to discuss some issues about food consumption and the relationship between food and disease
especially diabetes in this region as well as other health issues. We are going to discuss about
the foods normally consumed here, how frequently its consumed, and foods eaten on special
occasions as well as foods that we relate to disease especially diabetes. This discussion will be
led by a moderator and a research assistant will be present to note and tape-record the
discussion so that none of the important insights and discussions is missed. Both of them will
maintain your information confidential. The interview will not be recorded if you do not prefer
it to be. The audiotape will not have your name on it and will be kept in a secure location. You
are only requested to participate only once, however we may contact you for some clarification
if necessary. We estimate that the interview may take 15 to 25 minutes.
Risks
Since the information released during discussion might be personal and sensitive, the researcher
will carry out debrief for all the participants to ensure that anybody who might have been
negatively affected during the process gets the necessary help.
Benefits
The information gathered from this study will be communicated back to you and if you have
any questions regarding the relationship between diet and diabetes, you may ask. You will get
free testing so that you can know your diabetes status. We can also share some information on
healthy living at the end of our session if you will be interested. We also expect that there the
information gathered from this study will help health care personnel improve their
understanding on ways of improving diabetes management in this region.
Confidentiality
The recorded tapes shall only be accessible to the principal investigator. The recorded
information transcribed later and the recorded information will not be presented in any forum.
All the information you will give will be destroyed once the discussions are analyzed which
should be within one year.

143
Voluntary Participation
You are free to choose whether you want to participate in this study or not. You may decline to
answer any question that you may be uncomfortable with. You may also stop the interview at
any point without having to offer any explanation. Your views are very important to us and we
therefore hope that you agree to participate.
Leaving the Study
You are free to leave the discussion at any time.
Your Rights as a Participant
Kenyatta National Hospital and University of Nairobi Ethics and Research Committee
(KNH/UoN-ERC) has approved this study. If you have any questions about your rights, you
may contact the principal investigator, study supervisor or the Chairman (KNH/UoN-ERC) on
the following numbers.
Principal Investigator: Rebecca Ebere-0738 877 050
Supervisor: Prof Violet Kimani-0722 445 120
Chairman KNH/UoN-ERC:-020726300
You are required to sign this consent form before we start. If you have any questions about the
study you may ask them now.
Statement of Consent and Signatures
This document explaining the procedures, benefits and risks for the research titled “The
glycemic indices in association with diabetes in rural women of Kenya: case of Amagoro in
Busia County” has been explained to me and all my questions have been answered.
Signed (Signature or thumb print)
Participant ………………………… Date …………………………
Study staff ………………………… Date …………………………
Witness…………………………….. Date…………………………...
Copies to: 1. Investigator 2. Study participant

144
(c) Focus Group Discussions (FGD)
Researchers Statement
We are requesting you to volunteer to participate in a research study. The study is titled “The
glycemic indices in association with diabetes in rural women of Kenya: case of Amagoro in
Busia County”.
This consent form gives you the information you need in order to make a decision whether to
participate in the study or not. Please read this form carefully and ask for clarification where
necessary.
Purpose of the Study
This study is aimed at helping us understand why diabetes is prevalent in Amagoro. The
information will particularly help us understand whether the foods we consume contribute to the
increasing cases of diabetes in Amagoro. The information generated will help health care
personnel gain more understanding regarding ways of improving diabetes management in this
region.
Study Procedures
We are requesting you to share with us information about your diet in general. I would like us
to discuss some issues about food consumption and the relationship between food and disease
especially diabetes as well as other health issues. We are going to discuss about the foods we
normally consume. There is no right or wrong response in this discussion. You only need to
share your opinions and beliefs. The discussion will be led by a moderator and a research
assistant will be present to tape record the discussion so that none of the important insights and
discussions is missed. Both of them will maintain confidentiality. The interview will not be
recorded if you do not want. The audiotape will not have your name on it and will be kept in a
secure location. Please be honest; your individual comments will remain confidential but will
be compiled into a report. Be respectful and avoid personal attacks; if you disagree, please tell
us but in a calm and respectful manner. Just stay on the subject. We are asking you to sign this
form before you participate in the discussion. You will only attend a single discussion. The
discussion will last about 30 to 45 minutes. You may decline to contribute to questions that you
are not comfortable with.

145
Risks
Since the information released during discussion might be personal and sensitive, the researcher
will carry out debrief for all the participants to ensure that anybody who might have been
negatively affected during the process gets the necessary help. Those taking part in this
discussion will be requested not to discuss what they hear from the discussion to other people
outside this discussion although this cannot be guaranteed.
Benefits
The information gathered from this study will be communicated back to you and if you have
any questions regarding the relationship between diet and disease especially diabetes, you may
ask. You will also be able to get free testing so that you may know whether you are diabetic or
not. We can also share some information on healthy living at the end of our session if you will
be interested. We also expect that there will be benefits to the society as information gathered
from this study will help health care personnel provide better advice to patients with regard to
diabetes management.
The government may also use the information generated from this study to plan health care
services.
Confidentiality
We shall request those taking part in the discussion group not to discuss what they hear from the
discussion to people outside this group although we may not guarantee that everyone will
comply. The recorded tapes shall only be accessible to the principal investigator. All the
information you will give will only be accessible to the research time and it will be destroyed
once the discussions are written down and analyzed.
Voluntary Participation
You can choose to participate in this study or decline. You do not have to respond to questions
that you may feel not comfortable with.
Leaving the Study
You are free to leave the discussion at any time.

146
Your Rights as a Participant
Kenyatta National Hospital and University of Nairobi Ethics and Research Committee
(KNH/UoN-ERC) has approved this study. If you have any questions about your rights, you
may contact the principal investigator, study supervisor or the Chairman (KNH/UoN-ERC) on
the following numbers.
Principal investigator: Rebecca Ebere-0738 877 050
Supervisor: Prof Violet Kimani-0722 445 120
Chairman KNH/UoN-ERC:-020726300
Your participation in this discussion would be highly appreciated. You are required to sign this
consent form before we start. If you have any questions about the study you may ask them now.
Statement of Consent and Signatures
This document describing the procedures, risks and benefits for the research titled “The
glycemic indices in association with diabetes in rural women of Kenya: case of Amagoro in
Busia County” has been explained to me and all my questions have been answered. I
understand that participation in this study is voluntary.
Signed (Signature or thumb print)
Participant ………………………… Date …………………………
Study Staff ………………………… Date …………………………
Witness…………………………….. Date…………………………...
Copies to: 1. Investigator 2. Study participant
147
(d) Glycemic Index Participants
Researchers Statement
We are requesting you to volunteer to participate in a research study. The study is titled “The
glycemic indices in association with diabetes in rural women of Kenya: case of Amagoro in
Busia County”.
The consent form provides you with the information you need in order to decide whether to
participate. Please read it carefully and ask for clarification where necessary.
Purpose of the Study
This study is aimed at helping us understand why diabetes is prevalent in Amagoro. The
information will particularly help us understand whether the foods we consume increase is
associated with this illness in Amagoro. This information may be useful to health care personnel
who normally give advice on ways of improving diabetes management.
Study Procedures
If you choose to participate in this study, we shall give you some food samples to consume then
take a blood sample to find out your blood sugar. Blood will be taken by pricking you finger.
The blood samples will drawn at 15 minutes interval during the first 1 hour then after every 30
minutes for the next one hour after the meal (at times 0, 15, 30, 45, 60, 90, 120 min; the
beginning of the food intake will be time 0). The tests shall take approximately two and a half
hours after which breakfast will be served to all the participants.
Risks
There is risk of infection since it involves drawing blood samples. However this will be avoided
by ensuring that we use a new sterile lancet for each test and surgical spirit will also be
provided. You will also experience some slight sharp pain during the pricking of your finger
lasting approximately five seconds but this will immediately go away.
Benefits
The information gathered from this study will be communicated back to you and if you have
any questions regarding the relationship between diet and disease especially diabetes, you may
ask. You will also be able to know whether you have diabetes or not. We can also share some

148
information on healthy living at the end of our session if you will be interested. We also expect
that there will be benefits to the society as information gathered from this study will help health
care personnel in improving diabetes management in this region. The government may also use
this information in planning their health services.
Confidentiality
Your name will not appear on the final report and all the information we shall get from you will
only be accessible to the research team. All the information gathered here will be destroyed
once the discussions are analyzed.
Voluntary Participation
You can choose to be a participant in this study or not. In case you are not comfortable with any
question then you may remain decline to comment. Your views are very important to us and we
therefore hope that you will participate.
Leaving the Study
You are free to leave the discussion at any point without having to explain.
Your Rights as a Participant
Kenyatta National Hospital and University of Nairobi Ethics and Research Committee
(KNH/UoN-ERC) reviewed and approved this research. In case of any queries regarding your
rights as a participant you may contact the principal investigator, study supervisor or the
Chairman (KNH/UoN-ERC) on the following numbers.
Principal investigator: Rebecca Ebere: 0738 877 050
Supervisor: Prof Violet Kimani: 0722 445 120
Chairman KNH/UoN-ERC: 02 072 6300
You are required to sign this consent form before we start. If you have any questions about the
study you may ask them now.
Statement of Consent and Signatures
This document that describes the procedures, benefits and risks for the research titled “The
glycemic indices in association with diabetes in rural women of Kenya: case of Amagoro in
149
Busia County” has been explained to me and all my questions have been answered. I
understand that my is voluntary and can also withdraw at any time if wish to. By signing this
form, I do not give up any rights that I have as a research participant.
Signed (Signature or thumb print)
Participant ………………………… Date …………………………
Study Staff ………………………… Date …………………………
Witness…………………………….. Date…………………………...
Copies to: 1. Investigator 2. Study participant

150
Appendix 6: Map of Teso District
Related Documents