Glycemic Index and Macrovascular Disease in Type 2 Diabetes by Laura Chiavaroli A thesis submitted in conformity with the requirements for the degree of Doctor of Philosophy Department of Nutritional Sciences University of Toronto © Copyright by Laura Chiavaroli (2016)

Welcome message from author
This document is posted to help you gain knowledge. Please leave a comment to let me know what you think about it! Share it to your friends and learn new things together.
Transcript
Glycemic Index and Macrovascular Disease in Type 2 Diabetes
by
Laura Chiavaroli
A thesis submitted in conformity with the requirements for the degree of Doctor of Philosophy
Department of Nutritional Sciences University of Toronto
© Copyright by Laura Chiavaroli (2016)
ii
Glycemic Index and Macrovascular Disease in Type 2 Diabetes
Laura Chiavaroli Doctor of Philosophy
Department of Nutritional Sciences University of Toronto
2016 Abstract The rapid rise in type 2 diabetes (T2DM) prevalence seen over the past few decades is projected to increase further, together with an increased risk of cardiovascular disease (CVD). Thus, there is a need to find effective and sustainable prevention and treatment strategies for diabetes, including dietary strategies. Low glycemic index (GI) diets may be suitable to assist in T2DM management; however there is a lack of evidence on long term adherence, as well as on the association with surrogate markers of CVD risk beyond traditional risk factors. Recently, advances have been made in measures of subclinical arterial disease through the use of magnetic resonance imaging (MRI), which, along with standard measures from carotid ultrasound scanning (CUS), have been associated with CVD events. To address these knowledge gaps, we conducted a randomized controlled trial in those with T2DM at high risk of CVD to assess the effect of a low GI diet over 3 years. The trial, currently ongoing, has already yielded a rich
iii
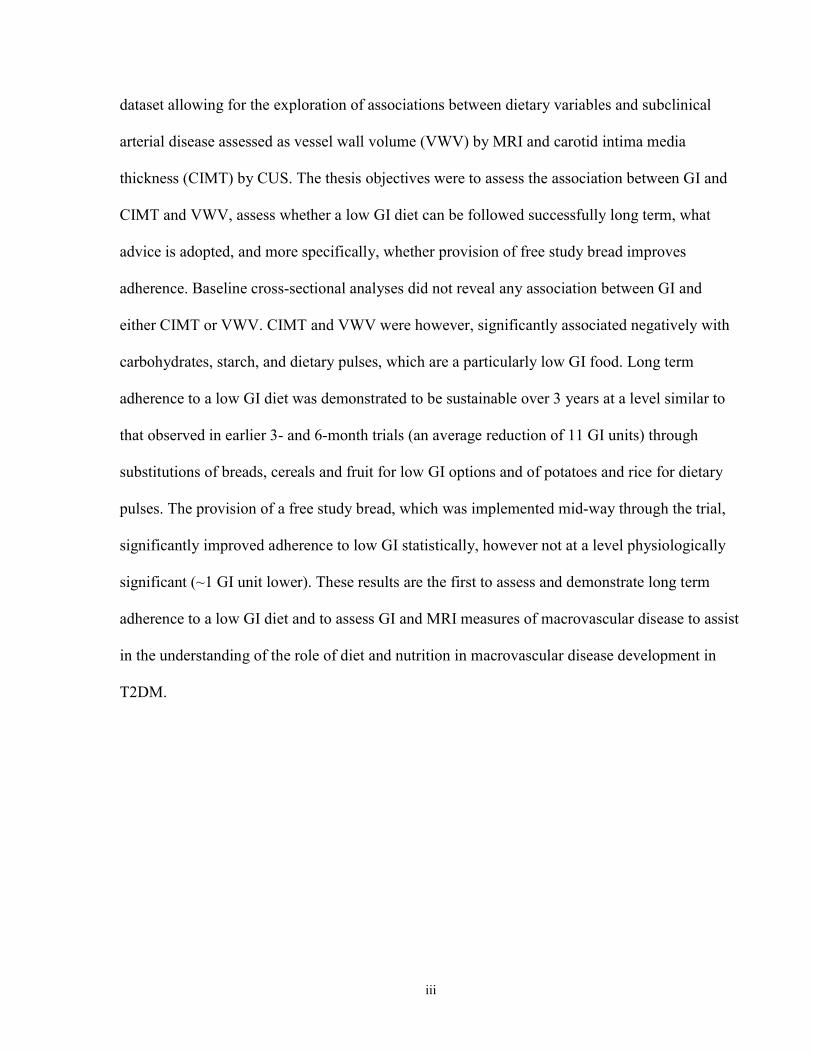
dataset allowing for the exploration of associations between dietary variables and subclinical arterial disease assessed as vessel wall volume (VWV) by MRI and carotid intima media thickness (CIMT) by CUS. The thesis objectives were to assess the association between GI and CIMT and VWV, assess whether a low GI diet can be followed successfully long term, what advice is adopted, and more specifically, whether provision of free study bread improves adherence. Baseline cross-sectional analyses did not reveal any association between GI and either CIMT or VWV. CIMT and VWV were however, significantly associated negatively with carbohydrates, starch, and dietary pulses, which are a particularly low GI food. Long term adherence to a low GI diet was demonstrated to be sustainable over 3 years at a level similar to that observed in earlier 3- and 6-month trials (an average reduction of 11 GI units) through substitutions of breads, cereals and fruit for low GI options and of potatoes and rice for dietary pulses. The provision of a free study bread, which was implemented mid-way through the trial, significantly improved adherence to low GI statistically, however not at a level physiologically significant (~1 GI unit lower). These results are the first to assess and demonstrate long term adherence to a low GI diet and to assess GI and MRI measures of macrovascular disease to assist in the understanding of the role of diet and nutrition in macrovascular disease development in T2DM.

iv
My Contributions 1. I have been the Clinical Trial Coordinator for the 3-year MRI Study (described in Chapter 2) since it began in 2010 and have played a lead role in each aspect (including recruitment, screening, clinic visits, scheduling, coordination of study staff, dietitians, participant follow up, managing data safety monitoring board meetings, and research ethics board (REB) submissions). 2. I manage all of the data entry for the MRI study. 3. I manage the coordination between all MRI study collaborators, including collaborators at Sunnybrook Health Sciences Center for MRI and ultrasound scans and the vitroretinal subspecialist ophthalmologists at St. Michael’s Hospital for the retinal exams and photographs (including patient scheduling, obtaining data, and organizing discussions on interpretation). 4. I play a strong role in all data analyses, particularly all those within the thesis. 5. I have and continue to play a lead role in writing manuscripts, including all thesis chapters. 6. I have and continue to present data at conferences, including both oral and poster presentations.

v
Acknowledgments One of the first things I learned when I walked into Dr. Jenkins’ lab was Murphy’s Law. What I originally thought was an odd poster to have up on the wall, has over the years become an increasingly important adage to bear in mind when engaging not only in research but many aspects of life. It has allowed me to be prepared for challenges and to understand that if something goes wrong, that’s ok, because inevitably something will. But this is where learning happens. Learning how to encounter challenges and how to react when things don’t turn out as you expect them is one of the greatest lessons a researcher can have because your study will rarely begin when it is planned for, recruitment will take twice as long, a better outcome measure will be found, and your results may not support your original hypothesis. I’d first like to thank Dr. David Jenkins for being a great mentor. Since the beginning, Dr. Jenkins had confidence in my capabilities before I did. I experienced a great variety of opportunities which allowed me to develop a diverse skill set, including those for clinical trial coordination and presentation, and organizational skills for involvement in multiple concurrent activities and projects. I would like to thank him for his immense support over the years, the encouragement to be confident in my abilities and think independently, and the opportunities to travel globally for conferences sharing our work and learning from leading experts. I also had the great privilege of having Dr. John Sievenpiper as a mentor. John exposed me to learning experiences beyond my niche of conducting clinical trials: the world of systematic reviews and meta-analyses. John has always been exceptionally supportive and encouraging, has provided great opportunities for new skill development and knowledge transfer at conferences, and has always made time to discuss future goals and career planning. I would like to thank Dr. Shannan Grant for being not only a great mentor and friend, but an inspiration. Her enthusiasm and passion is motivational. She has been a great source of strength during challenging times and has been especially supportive in helping me to develop and achieve my goals.

vi
Of course, I must also thank my dear friend Arash Mirrahimi who has been there since the beginning of this journey. He was there through long days of clinic, following up with participants and the joy of having them also became our friends. I am so grateful for having him be a part of the many good times, and especially during the challenging ones. I was very fortunate to have a particularly encouraging and valuable thesis committee, which included Dr. Lawrence Leiter, Dr. Alan Moody and Dr. Pauline Darling. They each demonstrated great interest in my development over the past 5 years, took time to share their knowledge in their various areas of expertise and assist in my growth and understanding. They helped me to see things from different perspectives and provided me with the benefit of a well-rounded view. After reflecting on the past years during which I have experienced the challenges of a PhD, I believe I have been exceptionally fortunate to have encountered such a very special group of individuals, each of which have demonstrated an immense appetite for life that has inspired me to develop my passions and to have the confidence to embrace them as I move forward. I would like to thank everyone at the Risk Factor Modification Center at St. Michael’s Hospital and the Department of Nutritional Sciences at the University of Toronto, many of whom have shared a large part of my journey through this degree. I would also like to thank the team at GI Labs for morning talks providing diverse perspectives and the time to develop skills from a different angle. I recently came across a saying one morning while working at GI Labs that resonated with me: “Great things never came from comfort zones”. It is a saying I will carry with me moving forward to gather the confidence to take chances and explore new opportunities, beginning with the planning of my next steps. My family has played a fundamental role in encouraging me to pursue my education and passions. My parents, Carlo and Christina Chiavaroli, have always had confidence in my abilities to achieve my goals and encouraged me to think independently and freely and I am very appreciative of having been given the opportunities to do so. I am also very appreciative of always knowing that although I have my independence to pursue my goals and follow my dreams, I will always have a supportive home.

vii
I am very grateful to all the exceptional people who have contributed to the lessons I have learned, to the person I am today, and to the development of a new set of goals I am eager to begin to set out to achieve. I am especially grateful for my best friend and partner, Francesco Agueci, who has demonstrated what it is to be truly supportive during this last and most challenging stretch of my degree and who anticipates the great things that lie ahead with me.
viii
Table of Contents Glycemic Index and Macrovascular Disease in Type 2 Diabetes .................................. i Glycemic Index and Macrovascular Disease in Type 2 Diabetes ................................. ii My Contributions ........................................................................................................................... iv Acknowledgments............................................................................................................................v Table of Contents ......................................................................................................................... viii List of Tables ................................................................................................................................ xii List of Figures .............................................................................................................................. xiv List of Appendices ....................................................................................................................... xvi Introduction – Thesis Overview.......................................................................................................1 Chapter 1 Literature Review: Glycemic Index and Diabetes Mellitus: Evidence on prevention
and management and implications on insulin resistance ............................................................4 1 Literature Review ........................................................................................................................5
1.1 Introduction: Background on Diabetes and the Current State .............................................5 1.1.1 Diabetes....................................................................................................................5 1.1.2 Carbohydrate Quality & Glycemia ..........................................................................6
1.2 GI & Diabetes Prevention ....................................................................................................7 1.2.1 Overview ..................................................................................................................7 1.2.2 Observational Evidence ...........................................................................................8 1.2.3 Clinical Trial Evidence ..........................................................................................11 1.2.4 GI & Insulin ...........................................................................................................18
1.3 GI & Diabetes Treatment ...................................................................................................19 1.3.1 Overview ................................................................................................................19 1.3.2 Observational Evidence .........................................................................................20 1.3.3 Clinical Trial Evidence ..........................................................................................22
1.4 Adherence and Adaptive Trial Design** ...........................................................................31
ix
1.5 GI Mechanisms of Action ..................................................................................................33 1.6 Conclusions and Perspectives ............................................................................................35
1.6.1 Recommendations for Future Research .................................................................35 1.6.2 Recommendations for Dietary Choices for those with Diabetes ...........................36
Chapter 2 Low Glycemic Index Diet to improve Glycemic Control and Cardiovascular Disease in Type 2 Diabetes: design and methods for a randomized controlled clinical trial ...41
2 Abstract .....................................................................................................................................42 2.1 Introduction ........................................................................................................................43 2.2 Methods and Analysis ........................................................................................................44
2.2.1 Study Design ..........................................................................................................44 2.2.2 Outcomes and Study Measures ..............................................................................46
2.3 Interventions ......................................................................................................................50 2.4 Sample Size ........................................................................................................................51 2.5 Statistical Analyses Planned ..............................................................................................51 2.6 Ethics and Dissemination ...................................................................................................52
2.6.1 Participant Safety ...................................................................................................53 2.7 Discussion and Implications ..............................................................................................53
Chapter 3 Knowledge Gaps, Hypotheses, Aims & Objectives ......................................................56 3 Knowledge Gaps, Hypotheses, Aims & Objectives .................................................................56
3.1 Knowledge Gaps ................................................................................................................56 3.2 Hypotheses .........................................................................................................................56 3.3 Aims ...................................................................................................................................56 3.4 Objectives ..........................................................................................................................57
Chapter 4 Dietary Intake and Carotid Intima Media Thickness in Type 2 Diabetes .....................58 4 Abstract .....................................................................................................................................58
4.1 Introduction ........................................................................................................................59
x
4.2 Methods..............................................................................................................................60
4.2.1 Participants .............................................................................................................60 4.2.2 Protocol ..................................................................................................................61 4.2.3 Biochemical and Dietary Analyses ........................................................................62 4.2.4 Statistical Analyses ................................................................................................62
4.3 Results ................................................................................................................................63 4.3.1 CIMT and Baseline Participant Characteristics .....................................................63 4.3.2 CIMT and Baseline Dietary Intake ........................................................................64
4.4 Discussion ..........................................................................................................................66 4.4.1 Discussion ..............................................................................................................66 4.4.2 Strengths and Limitations ......................................................................................69
4.5 Conclusion .........................................................................................................................70 Chapter 5 Dietary Intake and Carotid Plaque Volume in Type 2 Diabetes ...................................78 5 Abstract .....................................................................................................................................78
5.1 Introduction ........................................................................................................................79 5.2 Methods..............................................................................................................................79
5.2.1 Participants .............................................................................................................79 5.2.2 Protocol ..................................................................................................................80 5.2.3 Biochemical and Dietary Analyses ........................................................................81 5.2.4 Statistical Analyses ................................................................................................82
5.3 Results ................................................................................................................................82 5.3.1 VWV and Baseline Participant Characteristics .....................................................82 5.3.2 VWV and Baseline Dietary Intake ........................................................................83
5.4 Discussion ..........................................................................................................................86 5.4.1 Discussion ..............................................................................................................86 5.4.2 Strengths and Limitations ......................................................................................88
xi
5.5 Conclusion .........................................................................................................................89
Chapter 6 Adherence and the Effect of Provision of a Study Food in a Long Term Clinical Trial on Glycemic Index in Type 2 Diabetes ............................................................................94
6 Abstract .....................................................................................................................................94 6.1 Introduction ........................................................................................................................95 6.2 Methods..............................................................................................................................97
6.2.1 Study Design ..........................................................................................................97 6.2.2 Statistical Analysis .................................................................................................99
6.3 Results ..............................................................................................................................100 6.3.1 Adherence over 3 years - within NonSubstudy Completers ................................100 6.3.2 Substudy Intervention of Free Bread Provision ...................................................103 6.3.3 Adherence of All Completers – Non-Substudy and Substudy .............................107
6.4 Discussion ........................................................................................................................109 6.4.1 Discussion ............................................................................................................109 6.4.2 Strengths and Limitations ....................................................................................112
6.5 Conclusions ......................................................................................................................113 Chapter 7 Overall Discussion & Conclusions .............................................................................123 7 Overall Discussion & Conclusions .........................................................................................123
7.1 Overall Discussion ...........................................................................................................123 References ....................................................................................................................................131 Appendices ...................................................................................................................................158

xii
List of Tables Chapter 1 Table 1.1: Glycemic Index and Glycemic Load in Various Diabetes Guidelines Table 1.2: Example of Low GI Dietary Substitutions for a 2000kcal Diet Chapter 2 Table 2.1: Inclusion and Exclusion Criteria Chapter 4 Table 4.1: Participant Characteristics by Quartiles of Carotid Intima Media Thickness Table 4.2: Participant Characteristics and Associations with Carotid Intima Media Thickness Table 4.3: Dietary Intake by Quartiles of Carotid Intima Media Thickness Table 4.4: Dietary Intake and Associations with Carotid Intima Media Thickness Table 4.5: Protein Sources and Carotid Intima Media Thickness Table 4.6: Starch Sources and Carotid Intima Media Thickness Table 4.7: Dietary Fiber Intake Categorized by Recommended Intake and Associations with Carotid Intima Media Thickness Chapter 5 Table 5.1: Participant Characteristics and Associations with Vessel Wall Volume Table 5.2: Dietary Intake and Associations with Vessel Wall Volume Table 5.3: Protein Sources and Vessel Wall Volume Table 5.4: Starch Sources and Vessel Wall Volume
xiii
Chapter 6 Table 6.1: Baseline and Dietary Intake Over 3 Years in Non-substudy Completers by Diet Group Table 6.2: Dietary Changes Explaining Change in Glycemic Load on the Low GI Diet in Non-Substudy Completers Table 6.3: Consumption of Carbohydrate Servings at Baseline and Over 3 Years on the Low GI Diet in Nonsubstudy Completers Table 6.4: Change from Baseline in Dietary Variables Pre vs Post Free Bread in the Low GI Group Table 6.5: Consumption of Carbohydrate Servings at Baseline and Over 3 Years on the Low GI Diet Pre and Post Substudy Table 6.6: Change from Baseline in Dietary Variables Pre vs Post Free Bread in the High Fiber Group Table 6.7: Effect of Free Bread within and between Treatment Groups Table 6.8: Dietary Changes Explaining Change in Glycemic Load in All Low GI Completers Table 6.9: Consumption of Carbohydrate Servings at Baseline and Over 3 Years on the Low GI Diet in All Completers Chapter 7 Table 7.1: Dietary Intake and Associations with Vessel Wall Volume and Carotid Intima Media Thickness Table 7.2: Participant Characteristics and Associations with Vessel Wall Volume and Carotid Intima Media Thickness

xiv
List of Figures Chapter 1 Figure 1.1: Meta-analysis of prospective cohort studies investigating the association between GI and risk of type 2 diabetes Figure 1.2: Meta-analysis of prospective cohort studies investigating the association between GL and risk of type 2 diabetes Figure 1.3: The effect of acarbose on incidence of diabetes in those with impaired glucose tolerance by metabolic syndrome status Figure 1.4: Meta-analysis of randomized controlled trials on the effect of low versus high GI dietary interventions on LDL-C Figure 1.5: Meta-analysis of randomized controlled trials on the effect of a low GI diet compared to a control diet (high GI or other) on HbA1c in those with diabetes Figure 1.6: Meta-analysis of randomized controlled trials on the effect of pulses as part of a low GI diet compared to a high GI diet on HbA1c in those with and without diabetes Figure 1.7: Hypothetical effect of feeding diets with a low (A) or high (B) GI on gastrointestinal glucose absorption Chapter 2 Figure 2.1: Schematic representation of the study protocol Figure 2.2: Diagrammatic example of a right common carotid artery scan Chapter 4 Figure 4.1: Model of association between dietary pulse intake and carotid intima media thickness
xv
Chapter 5 Figure 5.1: Model of the association between dietary pulse intake and vessel wall volume Chapter 6 Figure 6.1: Dietary GI over 3 years in non-substudy completers by dietary intervention Figure 6.2: Dietary fiber intakes over 3 years in non-substudy completers by dietary intervention Figure 6.3: Percentage of contributions of carbohydrate servings on the low GI diet in non-substudy completers Figure 6.4: Disposition of participants at the time when the free bread intervention began Figure 6.5: Average GI at baseline and Pre and Post substudy in the low GI diet among substudy participants Figure 6.6: Percentage of contributions of carbohydrate servings on the low GI diet Pre and Post substudy Figure 6.7: Dietary GI over 3 years in all completers by dietary intervention Figure 6.8: Dietary fiber intakes over 3 years in all completers by dietary intervention Chapter 7 Figure 7.1: Correlation between vessel wall volume and carotid intima media thickness
xvi
List of Appendices Appendix 1: Dietary Instruction Sheet for Low GI Diet Used in 3-y Intervention Trial Appendix 2: Dietary Instruction Sheet for High Fiber Diet Used in 3-y Intervention Trial
1
Introduction – Thesis Overview Rates of diabetes have quadrupled within the past 3.5 decades with type 2 diabetes representing the vast majority of cases1. Diabetes is a complex condition which affects the vasculature throughout the entire body, including the small vessels increasing the risk of blindness and renal failure2-4. Even more concerning is the damage to the larger vessels of the body, namely the coronary and carotid arteries caused by an increased deposition and composition of plaque, increasing the risk of cardiovascular disease (CVD), which is the primary cause of death in this population5, 6. Pharmaceutical means to control glycemia have been demonstrated in randomized controlled trials to benefit the microvascular complications of diabetes7-10 and more recently in longer term follow up of trials, including UKPDS11 and VADT12, have also demonstrated benefit for CVD. Beyond pharmaceutical approaches to glycemic control, there is an increased need for evidence for dietary and lifestyle strategies which can assist in the prevention and management of diabetes complications. A low glycemic index (GI) diet may be one such strategy since it has been demonstrated to improve CVD risk factors, including blood pressure13 and cholesterol14-16, in addition to improving glycemic control in those with type 2 diabetes17-19. Systematic reviews and meta-analysis of observational studies have demonstrated that low GI diets are associated with lower risk of coronary heart disease (CHD) and CVD20-22. A pharmacological analogue for a low GI diet is the anti-diabetic drug acarbose, which in a large 3-year randomized controlled trial in those with impaired glucose tolerance demonstrated in a secondary analysis that acarbose was associated with a 49% relative risk reduction in CV events, although the number of events was small23. A larger CVD event trial is currently underway to confirm this finding. Acarbose works by inhibiting starch digestion, resulting in a reduction in the glycemic excursion after a meal, similar to a low GI diet. However, there is no trial to date assessing the effect of a low GI diet on CVD. Advances have been made in imaging technology which allow for the measurement of subclinical arterial damage which has been demonstrated to predict CVD events. One such imaging modality is carotid ultrasound (CUS) which measures plaque by carotid intima media thickness (CIMT) 2-dimensionally. CIMT is a validated technique which has demonstrated good reproducibility24, has been used in trials of statins25-28, and is used clinically as the gold standard in refining CVD risk assessment29. However, its ability to assess change has been questioned by
2
systematic reviews and meta-analyses30-32, therefore further exploration is warranted and alternative methods are required. Recently, advances have been made in imaging using magnetic resonance imaging (MRI) and with the new use of MRI, 3-dimensional vessel wall volume (VWV) can be measured with high accuracy and reproducibility and has been validated against histology33-37. The advantage of MRI over CUS includes; minimizes inter- and intra-operator variability since it is not operator dependent 38; has higher reproducibility 39, 40; measures the entire circumference of the carotid wall for a more comprehensive coverage allowing for better capture of plaque and detection of early wall thickening 38; and can additionally image plaque characteristics, such as intraplaque hemorrhage (IPH) and lipid-rich necrotic core (LRNC), which are closely related to plaque vulnerability and cardiovascular risk, thus providing information on plaque quality in addition to quantity38, 41. MRI is now the preferred measuring tool to assess change in intervention trials. No dietary trials on GI have included assessments of these subclinical markers of carotid arterial disease, and very few diet trials overall have included CIMT. Therefore, there is a need to explore if there is any association between dietary GI and carotid plaque assessed by CIMT and VWV as subclinical measures of arterial disease Furthermore, the success of any dietary intervention is dependent on how participants adhere to the dietary advice given. The majority of trials which have explored the effect of a low GI diet have been relatively short (<6months), therefore it is uncertain as to whether a low GI diet can be followed successfully over a longer period of time. In order to be able to assist in the successful adherence to low GI dietary advice, it is important to know what dietary changes people adopt when given low GI diet advice, in addition to determining what the potential challenges are to lowering the GI of the diet. Some trials have demonstrated how the provision of a study food can enhance adherence and lead to success in CHD and CVD as primary outcomes of interest, such as the Lyon Heart and PREDIMED studies42, 43. Therefore, it is of interest to explore whether or not the provision of a study food would further enhance adherence to a low GI diet. Therefore, current knowledge gaps include the following:
1. It is unknown whether a low GI diet is associated with carotid plaque extent in those with type 2 diabetes.
3
2. It is unknown whether a low GI diet can be followed successfully long term, what dietary
changes are adopted as a result of low GI diet advice, and whether or not the provision of a study food can enhance adherence to a low GI diet.
This thesis will address these knowledge gaps using data from a 3-year randomized controlled trial in those with type 2 diabetes randomly assigned to either a low GI or a higher GI, high cereal fiber diet, which is currently still ongoing. As part of inclusion criteria, participants had a screening CUS scan to determine their CIMT since only those with a maximum CIMT≥1.2mm were included in the trial to capture those at higher CVD risk. Those who did not qualify or did not enter the trial had the option of participating in one of 2 concurrently running acute trials with the same inclusion criteria, other than CIMT, and the same baseline procedures. The 3-year trial included the additional assessment of VWV by MRI. Therefore, baseline data was available to address the first knowledge gap to assess if there is an association between dietary GI, or key low GI foods, and VWV or CIMT as measures of subclinical arterial disease. Although currently ongoing, the 3-year trial had 60% of participants complete the study, as of December 1, 2015. These participants’ food record data allowed for an exploration into the first part of the second knowledge gap regarding whether or not a low GI diet can be followed successfully long term and what dietary changes are adopted as the result of low GI diet advice. Furthermore, mid-way through the trial, as a result of the publication of the success of the PREDIMED study which provided a free study food to participants, it was decided to implement the provision of our own study food as part of adaptive trial design, which is now an accepted part of long term interventions44, 45. Therefore, as of February 1, 2014, participants still in the study were provided free bread corresponding to their diet group. Using data as of December 1, 2015 from 115 participants who had received free bread, the second half of the second knowledge gap could be addressed to assess whether or not the provision of a study food would affect adherence to a low GI diet. Overall, these data will allow for a greater understanding of GI both in how it is associated with carotid plaque as measures of subclinical arterial disease in those with type 2 diabetes, as well as how low GI diet advice is incorporated as a lifestyle long term, and assessing possible ways to further improve adherence.
4
Chapter 1 Literature Review: Glycemic Index and Diabetes Mellitus:
Evidence on prevention and management and implications on insulin resistance
Laura Chiavaroli1,2, Livia SA Augustin2,3, Cyril WC Kendall1,2,4, David JA Jenkins1,2,5,6 1 Department of Nutritional Sciences, Faculty of Medicine, University of Toronto, Toronto, ON, Canada 2 Clinical Nutrition and Risk Factor Modification Centre, St. Michael’s Hospital, Toronto, ON, Canada 3 National Cancer Institute "Fondazione G. Pascale", Naples, Italy 4 College of Pharmacy and Nutrition, University of Saskatchewan, Saskatoon, SK, Canada 5 Department of Medicine, Faculty of Medicine, University of Toronto, Toronto, ON, Canada 6 Li Ka Shing Knowledge Institute, St. Michael’s Hospital, Toronto, ON, Canada Note: this chapter is currently in press as a chapter in a book on the glycemic index, thus it has been reviewed by all co-authors listed above, as well as the editors of the book Laura Chiavaroli, Livia SA Augustin, Cyril WC Kendall, David JA Jenkins. (2016). GI and Diabetes Mellitus (Type I, II) prevention and management including implications on insulin resistance. The Glycemic Index: Applications in Practice. Taylor and Francis Group; 2016, In Press. * headings with an asterisk indicate a heading that has been added post-submission of the book chapter ** headings with 2 asterisks indicate a section that has been added or modified post-submission of the book chapter
5
1 Literature Review
1.1 Introduction: Background on Diabetes and the Current State 1.1.1 Diabetes Diabetes is currently the fastest growing chronic disease worldwide and it is widely acknowledged that both genes and the environment are important determinants in its development. Nevertheless, since changes in the gene pool and earlier detection cannot account for the recent rapid increase over the past few decades in the incidence of diabetes, environmental changes are key to understanding this increase. The last few decades have seen dramatic changes in food production and processing which have resulted in a marked rise in availability of highly processed, energy dense but nutrient poor foods. These nutritional changes have contributed to the obesity pandemic and accompanying rise in diabetes. With the recent doubling of diabetes globally, a further doubling projected in the next 20 years and given its heavy burden on healthcare costs 46, there is a great need for targeting both the prevention and management of diabetes. Type 1 diabetes mellitus is characterized by the autoimmune destruction of pancreatic beta-cells which progressively decreases insulin secretory capacity, resulting in hyperglycemia and chronic inflammation, and in most cases, in the ultimate dependency on exogenous insulin 47. It is thought to be triggered by an infection, however the causative environmental factors continue to be debated 48. Type 2 diabetes mellitus results from the development of insulin resistance and decompensation of the pancreatic beta cells, leading to a relative lack of insulin, and thus causing hyperglycemia 49. Insulin resistance is a state where the body’s cells fail to respond to insulin, thus its ineffective use results in elevated blood glucose concentration 50. Insulin resistance can result from a variety of factors, including obesity and excess caloric intake. These conditions lead to repeated exposure to excess glucose concentration, stimulating insulin secretion and elevations in triglycerides and free fatty acids, which in turn impair the insulin-mediated uptake of glucose 51-53. Other factors which have been associated with the development and progression of insulin resistance include a sedentary lifestyle and lack of physical activity 54, 55; chronic inflammation, which correlates with increases in circulating free fatty acids 56; and gut microbiota, which influences the inflammatory state of the body 57, as well as genetic factors 58,
6
59. In uncontrolled diabetes, the resulting elevated blood glucose concentrations affect the vasculature throughout the entire body both at the microvascular level, increasing the risk of eye diseases (retinopathy) and kidney diseases (nephropathy), and at the macrovascular level, resulting in a near doubling of the risk of cardiovascular disease (CVD) and reduction in the lifespan of up to 10 years compared to people without diabetes 60. Insulin resistance has also been a recognized feature in people with type 1 diabetes 61 and has been associated with increased risk of microvascular and macrovascular complications 62. In order to reduce the risk of the associated complications in both type 1 and type 2 diabetes, there is a continued focus on the development of means to control elevated blood glucose concentration through both lifestyle and pharmaceutical means. Prospective cohort studies have demonstrated that good glycemic control in both type 1 and type 2 diabetes is associated with improved risk of microvascular complications, including retinopathy and nephropathy 7-10, as is discussed in diabetes guidelines globally 63-68. However, the results of 3 large randomized trials published in 2008 (ACCORD, ADVANCE and VADT)69-71 failed to show significant CVD benefit for improved glycemic control over a 3-5 year period of time. At about the same time, largely prompted by concern about cardiovascular safety of rosiglitazone and other anti-diabetic medications, the U.S. Food and Drug Administration (FDA) required demonstration of the cardiovascular safety of all new anti-diabetic agents72. Since then, longer term follow up of some of these trials (VADT, UKPDS)11, 12, as well as the recently published EMPA REG OUTCOME study73 with the SGLT2 inhibitor empagliflozin, have demonstrated CVD benefit. Additionally, there are some anti-diabetic medications for intensive glycemic control that have been demonstrated to confer a greater risk of hypoglycemia7, 9, 74, which has recently been suggested to contribute to the risk of diabetes complications75. The use of diet and lifestyle factors for glycemic control, which usually have a more subtle effect without the risk of hypoglycemia, are of importance, and they may also be particularly beneficial in the prevention of diabetes in those at high risk76, 77.
1.1.2 Carbohydrate Quality & Glycemia Since both diabetes and prediabetes (insulin resistant status) are characterized by postprandial hyperglycemia, the metabolic effects of different carbohydrate foods and their absorption profiles (carbohydrate quality) are of great potential relevance. One way to classify the quality of carbohydrates is by the glycemic index (GI). The GI is a physiological classification of the
7
available carbohydrate content in foods based on their postprandial blood glucose responses 78. The GI is defined as the glycemic response elicited by a portion of a carbohydrate-rich food compared to the response elicited by the same amount of carbohydrate from a standard or reference food. Therefore, foods which release their carbohydrates slowly, eliciting small rises in blood glucose are referred to as low GI foods 79. High GI foods on the other hand elicit higher glycemic and insulinemic responses and are considered fast release carbohydrates. The rise in blood glucose is influenced both by the type of carbohydrate (whether it is low or high GI) and by the amount of carbohydrate present in a serving. The glycemic load (GL) allows both the quality and quantity of carbohydrate to be accounted for. The GL is the product of GI and the total available carbohydrate content of a given amount of food 79. So if the amount of carbohydrate consumed is increased, the glycemic response and hence the GL will also increase, and the same would occur if a higher GI food were consumed. Therefore, since both GI (quality) and GL (quality and quantity) affect glycemia, their health effects are of great interest in the area of diabetes prevention and management.
1.2 GI & Diabetes Prevention 1.2.1 Overview Type 2 diabetes is thought to result from the toxic effects of chronically elevated levels of blood glucose and fatty acids on the pancreatic beta cells that release insulin. Initially, the beta cells can respond to greater fluxes in glucose by compensating with a greater secretion of insulin, which results in hyperinsulinemia 80. However, over time, beta cell compensation to the chronic surplus in blood glucose is less successful. This is due to continuous increased release of free fatty acids which impair glucose-stimulated insulin secretion, thus leading to beta cell dysfunction and damage which results in further hyperglycemia, also called impaired fasting glycemia and impaired glucose tolerance (IGT) for those at this stage 49. In the long term, these elevated glucose levels in IGT are toxic to the beta cells, leading to increased beta cell failure and blood glucose concentrations elevated further to those levels considered to be characteristic of diabetes. Even at the upper end of normal glucose tolerance, impaired beta cell function has been demonstrated to occur in both those who are lean and obese 81. Thus, it is important to target prevention of any extreme rises in blood glucose concentration to reduce the risk of beta cell failure and hence prevent the development of diabetes. Additionally, a high GI diet has been
8
shown to induce damage to pancreatic islet cells in animals 82. Therefore, low GI foods, which by definition elicit a lower blood glucose response, may represent a potential strategy to reduce the risk of developing diabetes.
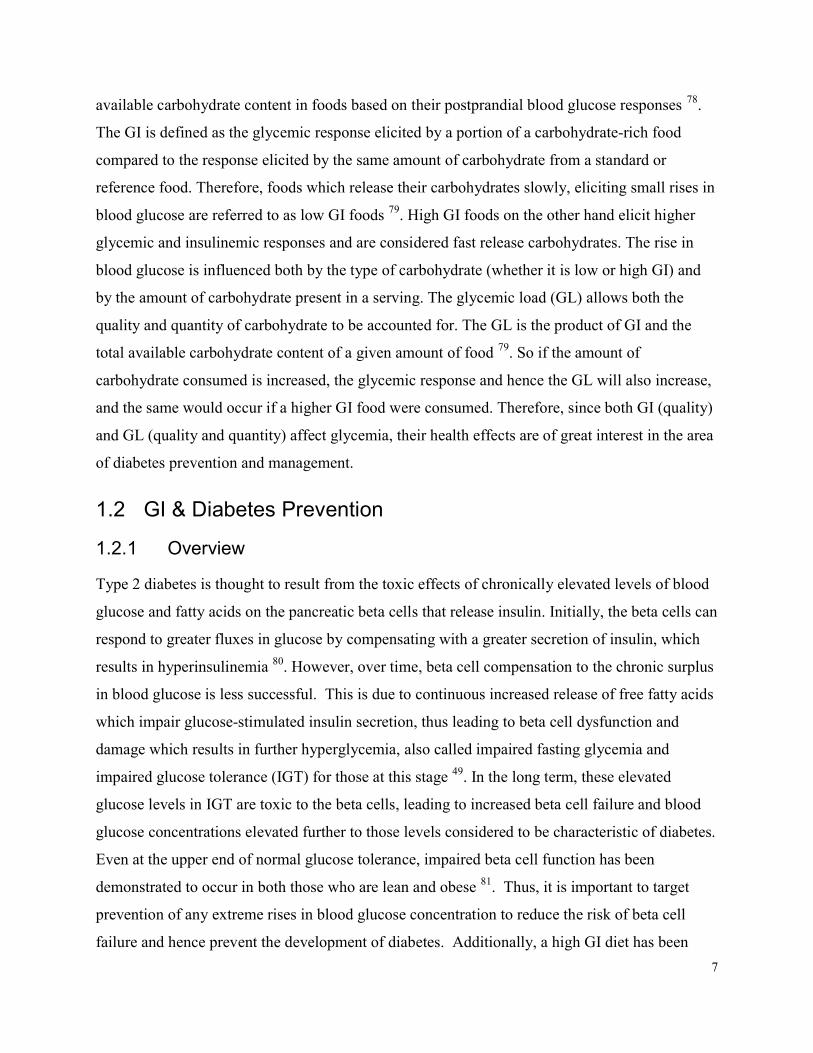
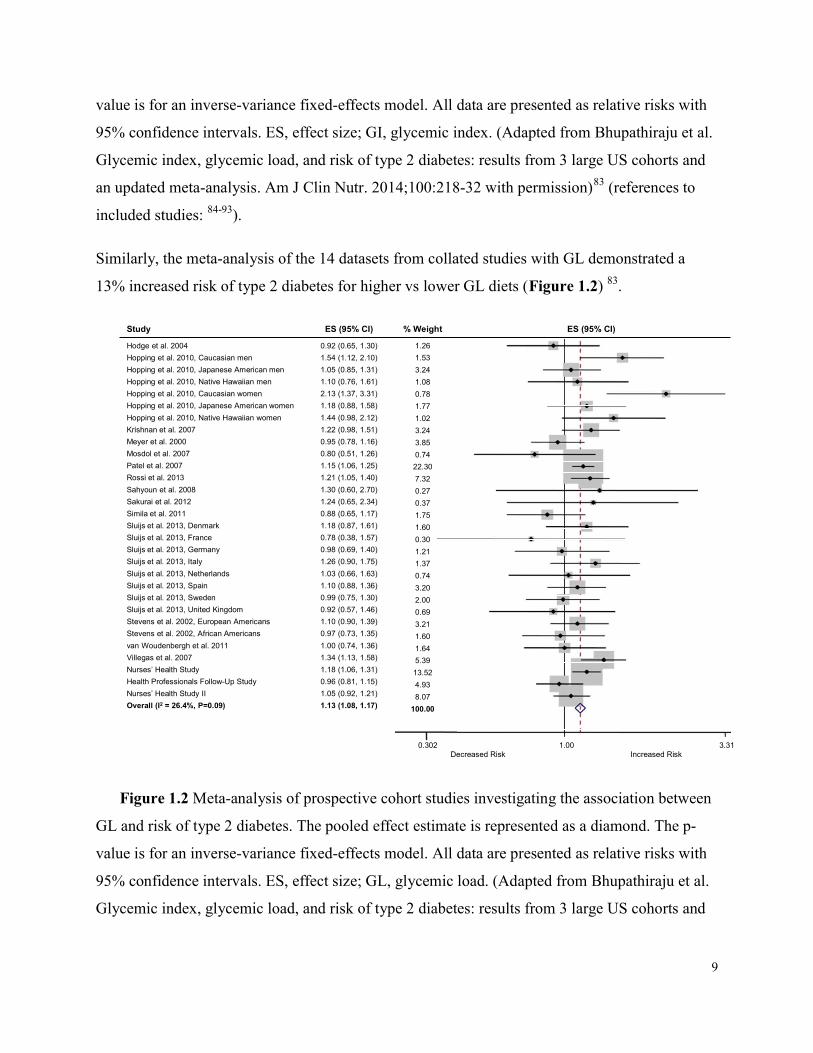
1.2.2 Observational Evidence Over the past approximately 15 years, multiple prospective cohort studies have explored the association between GI/GL and the risk of developing type 2 diabetes, and multiple systematic reviews and meta-analyses have collated these studies and assessed the overall effect. Of these, the most recent included 3 large cohort studies which added data from an additional 205,157 participants: the Nurses’ Health Study, the Nurses’ Health Study II and the Health Professionals Follow-Up Study 83. The meta-analysis for GI, which included 10 datasets from studies collated, demonstrated a 19% increased risk for developing type 2 diabetes with higher dietary GI when compared to the lowest GI category (Figure 1.1) 83.
0.272 1.00 3.67Decreased Risk Increased Risk
Study ES (95% CI) % Weight ES (95% CI)Krishnan et al. 2007Meyer et al. 2000Mosdol et al. 2007Rossi et al. 2013Sahyoun et al. 2008Sakurai et al. 2012Simila et al. 2011Sluijs et al. 2013, DenmarkSluijs et al. 2013, FranceSluijs et al. 2013, GermanySluijs et al. 2013, ItalySluijs et al. 2013, NetherlandsSluijs et al. 2013, SpainSluijs et al. 2013, SwedenSluijs et al. 2013, United Kingdomvan Woudenbergh, et al. 2011Villegas et al. 2007Nurses’ Health StudyHealth Professionals Follow-Up StudyNurses’ Health Study IIOverall (I2 = 68.5%, P<0.0001)
1.23 (1.05, 1.44)0.89 (0.72, 1.10)0.94 (0.71, 1.23)1.14 (1.01, 1.30)1.00 (0.50, 2.00)1.96 (1.04, 3.67)0.87 (0.71, 1.07)1.03 (0.80, 1.32)1.30 (0.73, 2.33)0.94 (0.66, 1.34)1.29 (0.96, 1.73)0.80 (0.55, 1.16)1.01 (0.85, 1.20)1.07 (0.85, 1.35)1.33 (0.88, 2.02)0.95 (0.75, 1.21)1.21 (1.03, 1.43)1.44 (1.33, 1.57)1.30 (1.15, 1.47)1.20 (1.08, 1.34)1.19 (1.14, 1.24)
6.443.582.1310.080.330.403.822.560.481.281.851.155.403.000.932.815.9723.3410.6613.80
100.00
Figure 1.1 Meta-analysis of prospective cohort studies investigating the association between
GI and risk of type 2 diabetes. The pooled effect estimate is represented as a diamond. The p-
9
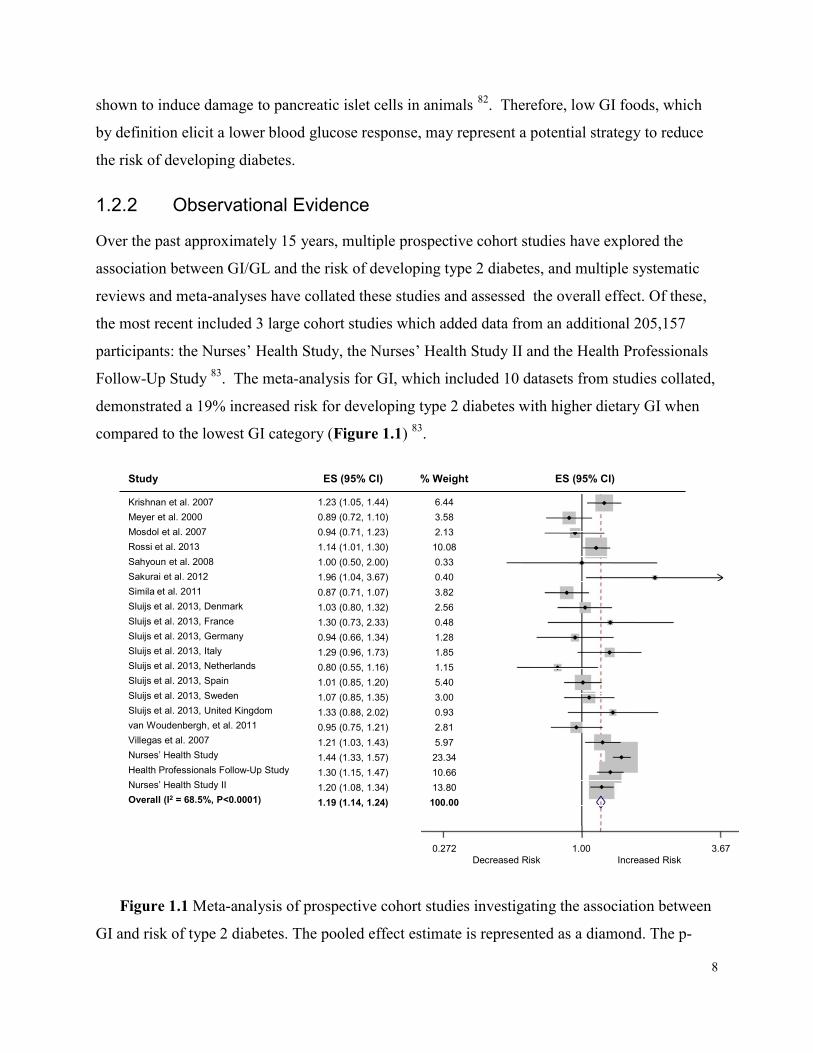
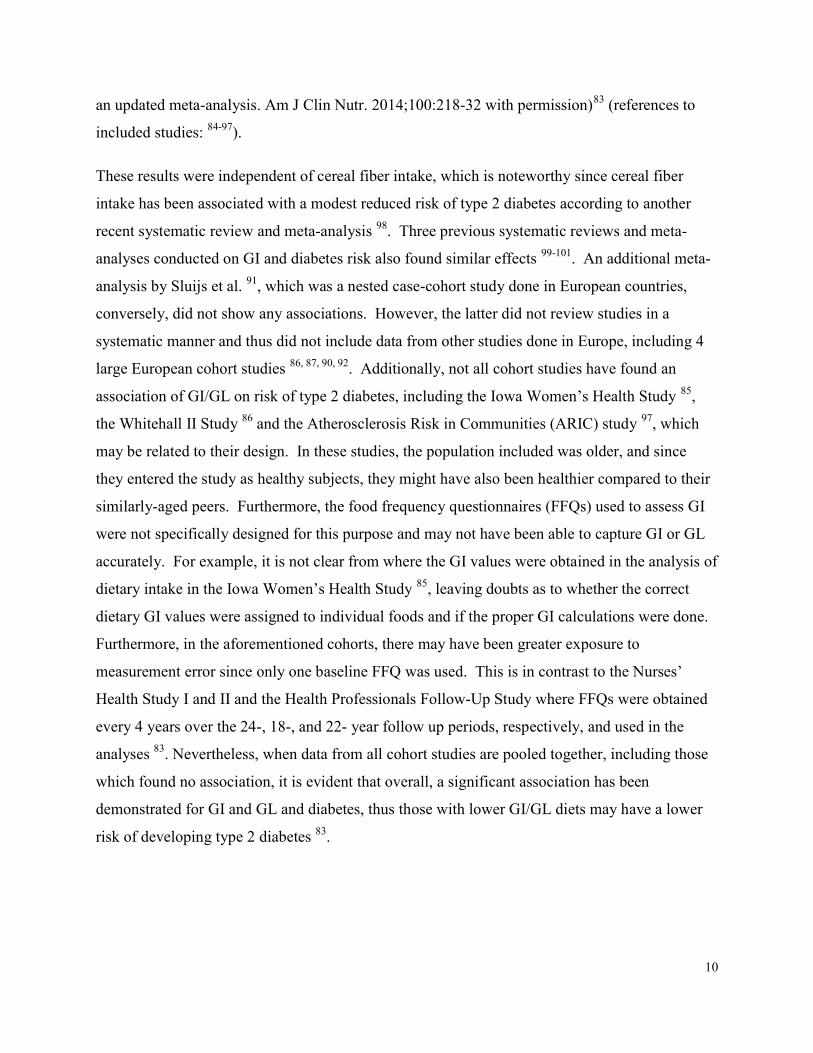
value is for an inverse-variance fixed-effects model. All data are presented as relative risks with 95% confidence intervals. ES, effect size; GI, glycemic index. (Adapted from Bhupathiraju et al. Glycemic index, glycemic load, and risk of type 2 diabetes: results from 3 large US cohorts and an updated meta-analysis. Am J Clin Nutr. 2014;100:218-32 with permission)83 (references to included studies: 84-93). Similarly, the meta-analysis of the 14 datasets from collated studies with GL demonstrated a 13% increased risk of type 2 diabetes for higher vs lower GL diets (Figure 1.2) 83.
Study ES (95% CI) % Weight ES (95% CI)Hodge et al. 2004Hopping et al. 2010, Caucasian menHopping et al. 2010, Japanese American menHopping et al. 2010, Native Hawaiian menHopping et al. 2010, Caucasian womenHopping et al. 2010, Japanese American womenHopping et al. 2010, Native Hawaiian womenKrishnan et al. 2007Meyer et al. 2000Mosdol et al. 2007Patel et al. 2007Rossi et al. 2013Sahyoun et al. 2008Sakurai et al. 2012Simila et al. 2011Sluijs et al. 2013, DenmarkSluijs et al. 2013, FranceSluijs et al. 2013, GermanySluijs et al. 2013, ItalySluijs et al. 2013, NetherlandsSluijs et al. 2013, SpainSluijs et al. 2013, SwedenSluijs et al. 2013, United KingdomStevens et al. 2002, European AmericansStevens et al. 2002, African Americansvan Woudenbergh et al. 2011Villegas et al. 2007Nurses’ Health StudyHealth Professionals Follow-Up StudyNurses’ Health Study IIOverall (I2 = 26.4%, P=0.09)
0.92 (0.65, 1.30)1.54 (1.12, 2.10)1.05 (0.85, 1.31)1.10 (0.76, 1.61)2.13 (1.37, 3.31)1.18 (0.88, 1.58)1.44 (0.98, 2.12)1.22 (0.98, 1.51)0.95 (0.78, 1.16)0.80 (0.51, 1.26)1.15 (1.06, 1.25)1.21 (1.05, 1.40)1.30 (0.60, 2.70)1.24 (0.65, 2.34)0.88 (0.65, 1.17)1.18 (0.87, 1.61)0.78 (0.38, 1.57)0.98 (0.69, 1.40)1.26 (0.90, 1.75)1.03 (0.66, 1.63)1.10 (0.88, 1.36)0.99 (0.75, 1.30)0.92 (0.57, 1.46)1.10 (0.90, 1.39)0.97 (0.73, 1.35)1.00 (0.74, 1.36)1.34 (1.13, 1.58)1.18 (1.06, 1.31)0.96 (0.81, 1.15)1.05 (0.92, 1.21)1.13 (1.08, 1.17)
1.261.533.241.080.781.771.023.243.850.7422.307.320.270.371.751.600.301.211.370.743.202.000.693.211.601.645.3913.524.938.07
100.00
0.302 1.00 3.31Decreased Risk Increased Risk
Figure 1.2 Meta-analysis of prospective cohort studies investigating the association between GL and risk of type 2 diabetes. The pooled effect estimate is represented as a diamond. The p-value is for an inverse-variance fixed-effects model. All data are presented as relative risks with 95% confidence intervals. ES, effect size; GL, glycemic load. (Adapted from Bhupathiraju et al. Glycemic index, glycemic load, and risk of type 2 diabetes: results from 3 large US cohorts and
10
an updated meta-analysis. Am J Clin Nutr. 2014;100:218-32 with permission)83 (references to included studies: 84-97). These results were independent of cereal fiber intake, which is noteworthy since cereal fiber intake has been associated with a modest reduced risk of type 2 diabetes according to another recent systematic review and meta-analysis 98. Three previous systematic reviews and meta-analyses conducted on GI and diabetes risk also found similar effects 99-101. An additional meta-analysis by Sluijs et al. 91, which was a nested case-cohort study done in European countries, conversely, did not show any associations. However, the latter did not review studies in a systematic manner and thus did not include data from other studies done in Europe, including 4 large European cohort studies 86, 87, 90, 92. Additionally, not all cohort studies have found an association of GI/GL on risk of type 2 diabetes, including the Iowa Women’s Health Study 85, the Whitehall II Study 86 and the Atherosclerosis Risk in Communities (ARIC) study 97, which may be related to their design. In these studies, the population included was older, and since they entered the study as healthy subjects, they might have also been healthier compared to their similarly-aged peers. Furthermore, the food frequency questionnaires (FFQs) used to assess GI were not specifically designed for this purpose and may not have been able to capture GI or GL accurately. For example, it is not clear from where the GI values were obtained in the analysis of dietary intake in the Iowa Women’s Health Study 85, leaving doubts as to whether the correct dietary GI values were assigned to individual foods and if the proper GI calculations were done. Furthermore, in the aforementioned cohorts, there may have been greater exposure to measurement error since only one baseline FFQ was used. This is in contrast to the Nurses’ Health Study I and II and the Health Professionals Follow-Up Study where FFQs were obtained every 4 years over the 24-, 18-, and 22- year follow up periods, respectively, and used in the analyses 83. Nevertheless, when data from all cohort studies are pooled together, including those which found no association, it is evident that overall, a significant association has been demonstrated for GI and GL and diabetes, thus those with lower GI/GL diets may have a lower risk of developing type 2 diabetes 83.
11
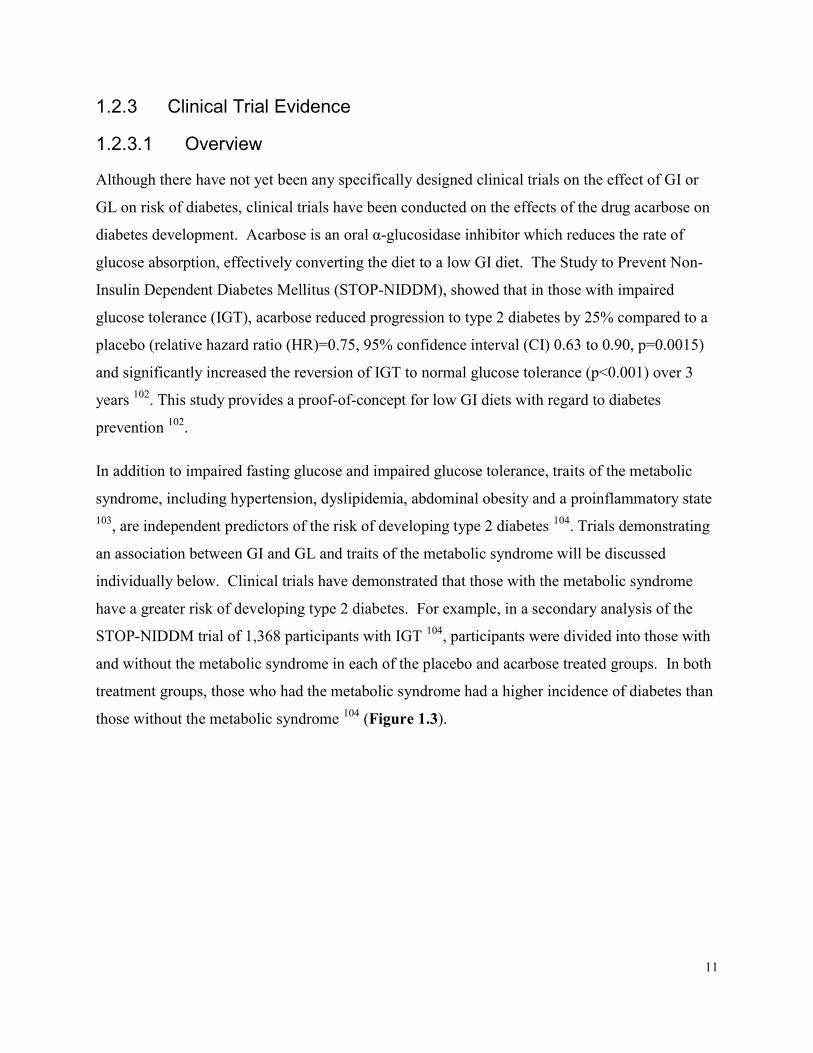
1.2.3 Clinical Trial Evidence 1.2.3.1 Overview Although there have not yet been any specifically designed clinical trials on the effect of GI or GL on risk of diabetes, clinical trials have been conducted on the effects of the drug acarbose on diabetes development. Acarbose is an oral α-glucosidase inhibitor which reduces the rate of glucose absorption, effectively converting the diet to a low GI diet. The Study to Prevent Non-Insulin Dependent Diabetes Mellitus (STOP-NIDDM), showed that in those with impaired glucose tolerance (IGT), acarbose reduced progression to type 2 diabetes by 25% compared to a placebo (relative hazard ratio (HR)=0.75, 95% confidence interval (CI) 0.63 to 0.90, p=0.0015) and significantly increased the reversion of IGT to normal glucose tolerance (p<0.001) over 3 years 102. This study provides a proof-of-concept for low GI diets with regard to diabetes prevention 102. In addition to impaired fasting glucose and impaired glucose tolerance, traits of the metabolic syndrome, including hypertension, dyslipidemia, abdominal obesity and a proinflammatory state 103, are independent predictors of the risk of developing type 2 diabetes 104. Trials demonstrating an association between GI and GL and traits of the metabolic syndrome will be discussed individually below. Clinical trials have demonstrated that those with the metabolic syndrome have a greater risk of developing type 2 diabetes. For example, in a secondary analysis of the STOP-NIDDM trial of 1,368 participants with IGT 104, participants were divided into those with and without the metabolic syndrome in each of the placebo and acarbose treated groups. In both treatment groups, those who had the metabolic syndrome had a higher incidence of diabetes than those without the metabolic syndrome 104 (Figure 1.3).
12
Figure 1.3 The effect of acarbose on incidence of diabetes in those with impaired glucose tolerance by metabolic syndrome status. MS, metabolic syndrome; NCEP, National Cholesterol Education Program; NNT, number needed to treat. (Reproduced from Hanefeld et al. Metabolic syndrome and its single traits as risk factors for diabetes in people with impaired glucose tolerance: the STOP-NIDDM trial. Diabetes and Vascular Disease Research. 2009 6: 32-7, with permission)104 Of the 4 groups, those with the metabolic syndrome receiving the placebo treatment, had the highest incidence of diabetes and those without the metabolic syndrome receiving the acarbose treatment had the lowest risk 104. Interestingly, those with the metabolic syndrome who received the acarbose treatment appeared to have the same risk of developing diabetes as those without the metabolic syndrome who received the placebo treatment 104 (Figure 1.3). This suggests that reducing postprandial glycemia, either through the use of acarbose or possibly using low GI diets may reduce the risk of developing diabetes, especially in those with the metabolic syndrome.
1.2.3.2 LDL-C (low-density lipoprotein-cholesterol) It is of great interest to target LDL-C in people with diabetes since CVD is the leading cause of death in this population and LDL-C is the primary target for CVD risk reduction. Low GI diets have been demonstrated to improve dyslipidemia, particularly LDL-C 14, 15. A systematic review
13
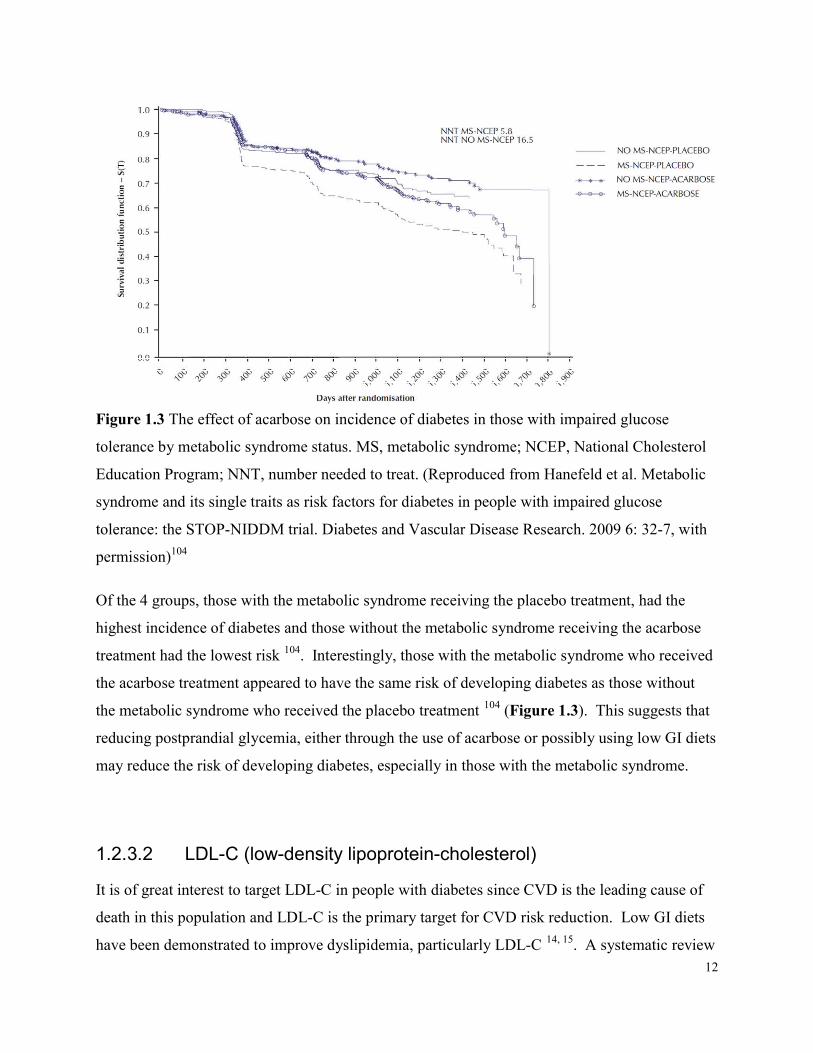
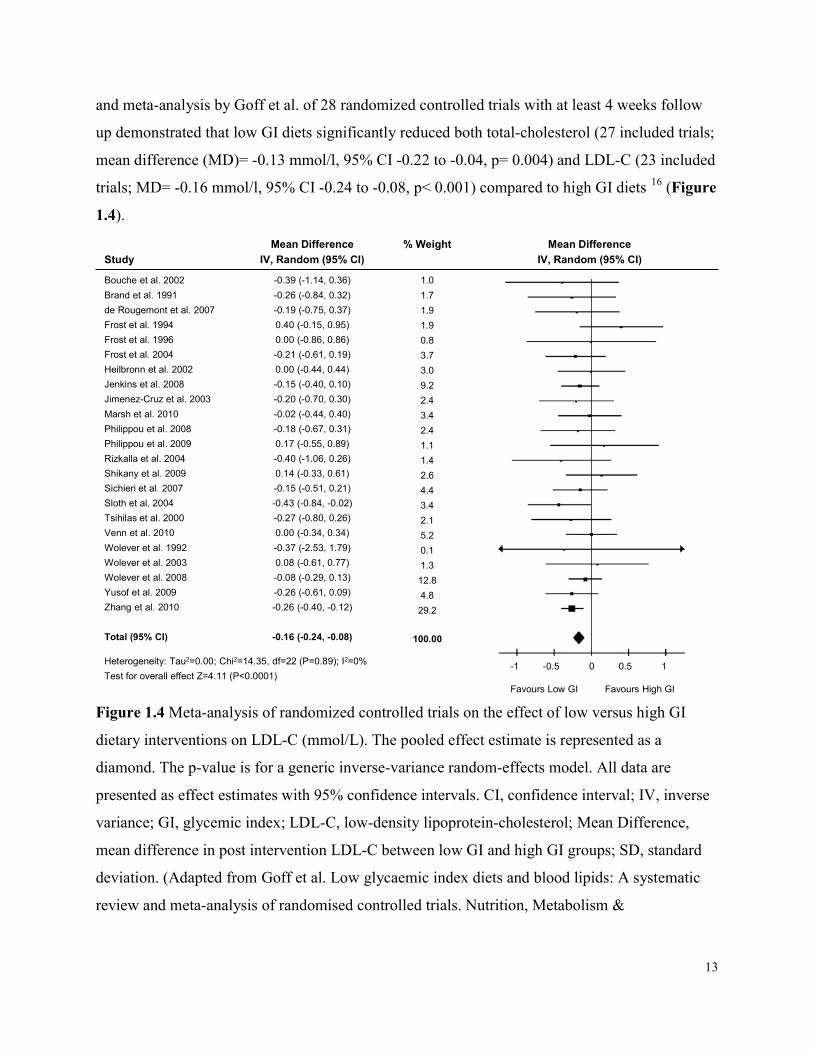
and meta-analysis by Goff et al. of 28 randomized controlled trials with at least 4 weeks follow up demonstrated that low GI diets significantly reduced both total-cholesterol (27 included trials; mean difference (MD)= -0.13 mmol/l, 95% CI -0.22 to -0.04, p= 0.004) and LDL-C (23 included trials; MD= -0.16 mmol/l, 95% CI -0.24 to -0.08, p< 0.001) compared to high GI diets 16 (Figure 1.4).
-1 -0.5 0 0.5 1 Favours Low GI Favours High GI
StudyMean Difference
IV, Random (95% CI)% Weight Mean Difference
IV, Random (95% CI)Bouche et al. 2002Brand et al. 1991de Rougemont et al. 2007Frost et al. 1994Frost et al. 1996Frost et al. 2004Heilbronn et al. 2002Jenkins et al. 2008Jimenez-Cruz et al. 2003Marsh et al. 2010Philippou et al. 2008Philippou et al. 2009Rizkalla et al. 2004Shikany et al. 2009Sichieri et al. 2007Sloth et al. 2004Tsihilas et al. 2000Venn et al. 2010Wolever et al. 1992Wolever et al. 2003Wolever et al. 2008Yusof et al. 2009Zhang et al. 2010
Total (95% CI)
-0.39 (-1.14, 0.36)-0.26 (-0.84, 0.32)-0.19 (-0.75, 0.37)0.40 (-0.15, 0.95)0.00 (-0.86, 0.86)-0.21 (-0.61, 0.19)0.00 (-0.44, 0.44)-0.15 (-0.40, 0.10)-0.20 (-0.70, 0.30)-0.02 (-0.44, 0.40)-0.18 (-0.67, 0.31)0.17 (-0.55, 0.89)-0.40 (-1.06, 0.26)0.14 (-0.33, 0.61)-0.15 (-0.51, 0.21)-0.43 (-0.84, -0.02)-0.27 (-0.80, 0.26)0.00 (-0.34, 0.34)-0.37 (-2.53, 1.79)0.08 (-0.61, 0.77)-0.08 (-0.29, 0.13)-0.26 (-0.61, 0.09)-0.26 (-0.40, -0.12)
-0.16 (-0.24, -0.08)
1.01.71.91.90.83.73.09.22.43.42.41.11.42.64.43.42.15.20.11.312.84.829.2
100.00Heterogeneity: Tau2=0.00; Chi2=14.35, df=22 (P=0.89); I2=0%Test for overall effect Z=4.11 (P<0.0001)
Figure 1.4 Meta-analysis of randomized controlled trials on the effect of low versus high GI dietary interventions on LDL-C (mmol/L). The pooled effect estimate is represented as a diamond. The p-value is for a generic inverse-variance random-effects model. All data are presented as effect estimates with 95% confidence intervals. CI, confidence interval; IV, inverse variance; GI, glycemic index; LDL-C, low-density lipoprotein-cholesterol; Mean Difference, mean difference in post intervention LDL-C between low GI and high GI groups; SD, standard deviation. (Adapted from Goff et al. Low glycaemic index diets and blood lipids: A systematic review and meta-analysis of randomised controlled trials. Nutrition, Metabolism &
14
Cardiovascular Diseases. 2013. 23(1):1-10, with permission)16 (References to included studies: 105-127). Importantly, this reduction in LDL-C was observed independently of weight loss, which has been proven to improve cholesterol 128. In subgroup analyses by diabetes status, the reduction in LDL-C remained statistically significant both in those with and without diabetes 16. The reduction in LDL-C following consumption of low GI diets may be due to the increased intake of dietary fiber, since subgroup analyses demonstrated significant reductions in LDL-C in those studies where low GI diets also contained significantly more fiber than high GI diets (p<0.05). Importantly, different subgroups are likely to contain other variables which differ, beyond what they are divided on, which may act as confounders and influence the difference in observed effect(s) 129. Thus, the studies in the subgroup of low GI diets with significantly greater fiber intakes may also have, for example, greater differences in GIs, potentially driving the subgroup effect 16. Still, the effect of low GI diets on LDL-C may be in part driven by fiber, particularly viscous fiber. Indeed, low GI foods are characterized by a higher viscous fiber content, which is known for its cholesterol-lowering effects 130-132.
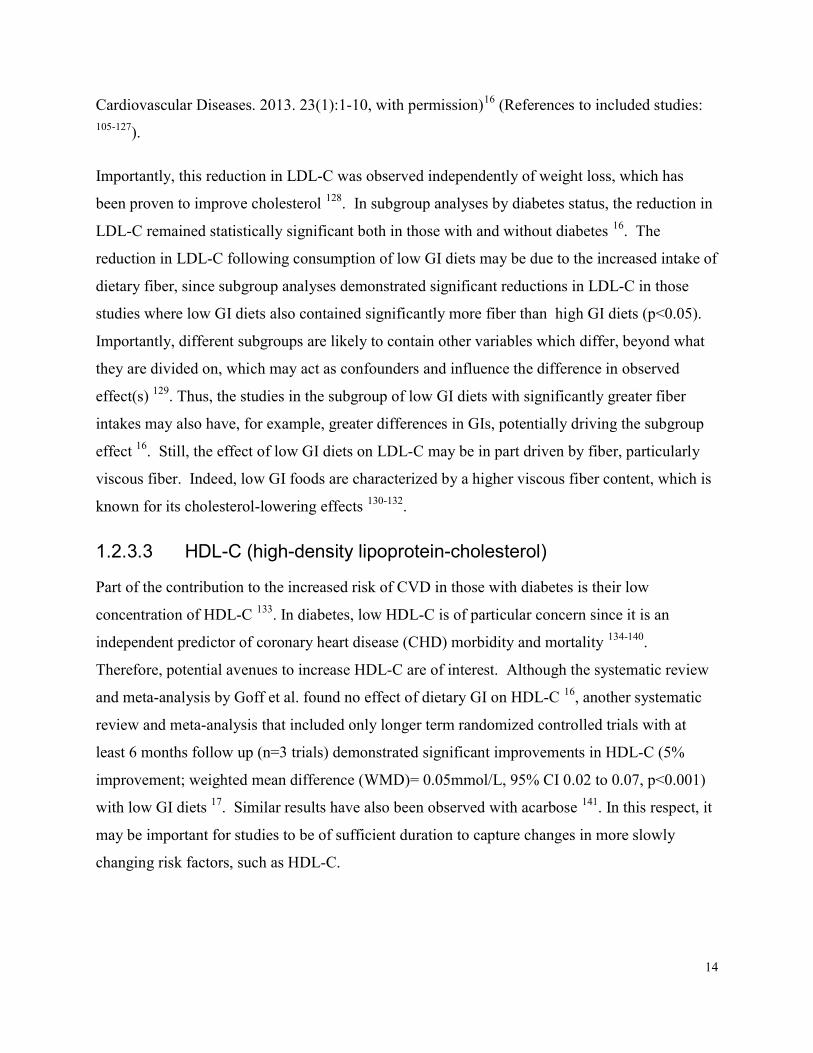
1.2.3.3 HDL-C (high-density lipoprotein-cholesterol) Part of the contribution to the increased risk of CVD in those with diabetes is their low concentration of HDL-C 133. In diabetes, low HDL-C is of particular concern since it is an independent predictor of coronary heart disease (CHD) morbidity and mortality 134-140. Therefore, potential avenues to increase HDL-C are of interest. Although the systematic review and meta-analysis by Goff et al. found no effect of dietary GI on HDL-C 16, another systematic review and meta-analysis that included only longer term randomized controlled trials with at least 6 months follow up (n=3 trials) demonstrated significant improvements in HDL-C (5% improvement; weighted mean difference (WMD)= 0.05mmol/L, 95% CI 0.02 to 0.07, p<0.001) with low GI diets 17. Similar results have also been observed with acarbose 141. In this respect, it may be important for studies to be of sufficient duration to capture changes in more slowly changing risk factors, such as HDL-C.
15
1.2.3.4 Weight Loss Obesity is the single most frequent risk factor for the development of type 2 diabetes 142 and indeed a substantial proportion of people with type 2 diabetes are overweight or obese. Additionally, in people with diabetes, a higher body mass index (BMI) is associated with increased mortality 143. Weight loss is thus a primary target in guidelines to reduce diabetes risk 48 and substantial benefits result from weight management. In light of these facts, the effect of low GI diets on weight loss has been assessed in people with and without diabetes. In a systematic review and meta-analysis which included only randomized controlled trials with the objective of weight loss in people without diabetes with a follow-up of at least 4 weeks, low GI diets were found to be significantly more effective for weight loss in comparison to conventional energy-restricted diets (n=4 trials), especially when the GL was lowered 144. A more recent systematic review and meta-analysis by Schwingshackl and Hoffmann, which included long term randomized controlled trials with a minimum follow up of 6 months in obese individuals and of which ~30% of included trials were conducted in those with diabetes, found a similar reduction in body weight resulting from consumption of low GI/GL diets compared to high GI/GL diets (n=14 trials), although the effect did not reach statistical significance (p=0.06) 145. This outcome, however, is perhaps less remarkable since the majority of included trials were not intended for weight loss. Additionally, in a 22-week randomized trial of participants with type 2 diabetes instructed to follow either a vegan diet or the 2003 American Diabetes Association recommendations, the dietary GI was demonstrated to significantly predict changes in body weight after adjustments for various factors including dietary fiber, energy, carbohydrate and fat intake 146. Interestingly, in an analysis of 3 prospective cohorts from the United States (Nurses’ Health Study, Nurses’ Health Study II, and the Health Professionals Follow Up Study) of over 120,000 healthy men and women, increases in GL were independently associated with greater weight gain over an average 4-year follow up 147. This evidence suggests that a low GI/GL diet may be a useful dietary strategy for weight loss. A number of physiological adaptations during weight loss can mitigate post weight loss success, including perturbations in appetite-regulating hormones and energy homeostasis 148. This has prompted the investigation of the effect of energy-restricted low GI/GL diets on factors which can impede success post weight loss. In a randomized parallel-design study of energy-restricted
16
low GL or low fat diets in 39 overweight or obese young adults post 10% weight loss, resting energy expenditure decreased less, and less hunger was reported on the low GL compared to the low fat diet 149. Of great interest is the result of the Diogenes trial, which was a randomized trial of 773 overweight adults from 8 European countries given one of 5 ad libitum diets varying in protein content and GI over 26 weeks to assess the effect on weight regain after at least 8% body weight loss on a low calorie diet 150. The study demonstrated that a low GI diet moderately high in protein prevented weight regain 6-months after the weight loss program where the effect of GI was independent of the effect of protein 150. Although in a 12-month follow up on a subset of 256 study participants from 2 of the 8 participating countries there was no observed difference between the diets varying in protein and GI, the authors note they were unable to objectively verify the small reported difference of 5 GI units between the high and low GI diet groups as obtained from the 3-day food records 151. Furthermore, in the additional 6-month follow up, participants were no longer provided with 80% of relevant foods free of charge as they had been in the first 6 months 151, thus continued adherence to the diet may have been an issue in the follow up. The potential for prevention of weight regain is particularly noteworthy since this is one of the greatest challenges with weight loss programs 152 and recently it has been debated as to whether programs specifically targeting weight loss are at all useful if not harmful in treating obesity because of the excess weight fluctuations which they may cause 153. Weight cycling has also been associated with increased incidence of diabetes 154. Therefore, finding successful lifestyle changes which also result in weight loss without regain, and may include low GI/GL diets, would be particularly beneficial to reducing the risk of diabetes.
1.2.3.5 Inflammation Markers of systemic inflammation, such as C-reactive protein (CRP), have been cross-sectionally associated with reduced insulin sensitivity and pancreatic beta cell function and are thus targets of interest in those both at risk of and living with diabetes 155, 156. There has been some evidence that low GI diets may reduce inflammation, which is particularly important in diabetes prevention and management since inflammation is also regarded to play a large role in the pathophysiology of obesity 157, and is an independent risk factor for CVD 158. A recent systematic review of clinical trials found a more consistent anti-inflammatory benefit for low GI
17
diets compared to high fiber and whole grain diets 159. More specifically, low GI diets have been demonstrated to reduce CRP in a recent systematic review and meta-analysis of randomized controlled trials with ≥ 6months follow up (n=7 trials) 145. Of these trials, the randomized controlled trial with the longest follow up of 52 weeks by Wolever et al., was conducted in people with well-controlled type 2 diabetes and demonstrated that those on the low GI diet had a mean CRP 30% less than those on the high GI diet 125. Furthermore, considering that a CRP level >2mg/L is a risk factor for coronary heart disease (CHD) 160 and the baseline CRP in the study by Wolever et al. 125 was 2.64mg/L, the 30% reduction drove CRP concentrations below the risk level, similar to the effect observed with the use of statins 161, 162. Additionally, in 902 women with diabetes from the Nurses’ Health Study, it was demonstrated that GI may reduce systemic inflammation through associations with reduced CRP 163, as well as increased adiponectin 164 which is known to have anti-inflammatory effects 165, 166. Although there are some observational trials which did not demonstrate significant correlations between inflammatory markers and GI/GL 167, 168, some have found borderline significance 169 while other notably large trials, including the Women’s Health Initiative 170, found significant correlations between GI and CRP. Since inflammation is associated with increased adipocytokine production from adipose tissue, which is recognized as a central mechanism underlying energy balance, obesity and comorbidities including cardiometabolic risk, it is important also to consider the effects of GI on these molecules. Adiponectin, which is inversely correlated with insulin resistance, glucose intolerance, dyslipidemia and atherosclerosis 171, 172, is the most abundant adipocytokine in the human body. Some studies on GI and GL have demonstrated beneficial effects, such as a 4-week randomized crossover trial by Neuhouser et al., which demonstrated that a low GL diet modestly increased adiponectin in addition to significantly reducing CRP concentration compared to a high GL diet in 80 overweight individuals 173. Additionally, a longitudinal analysis of the PREDIMED cohort, where ~55% of the 511 high risk individuals had diabetes, demonstrated that after 1-year of follow up, those with greater increases in GI and GL showed greater reductions in adiponectin and leptin 174 also implicated in energy balance and cardiometabolic risk 175. Furthermore, a 7-month randomized trial on acarbose in 188 individuals with diabetes demonstrated significant increases in plasma adiponectin, in addition to reductions in lipemia as well as body weight, which were significantly different from the control group with the
18
exception of body weight 176. Thus GI may be effective in targeting inflammation as seen through effects on CRP and adipocytokines. Overall, the potential multi-level effects of low GI/GL diets may work in combination to reduce the risk of developing diabetes.
1.2.4 GI & Insulin Type 2 diabetes mellitus stems from the development of insulin resistance and a reduction in insulin secretion, thus assessment of the effect of GI and GL on this significant hormone is imperative. C-peptide is a marker of insulin secretion and is secreted in equivalent units when the proinsulin molecule is cleaved to release insulin. Insulin demand, pancreatic stress, and high C-peptide concentration have been associated with insulin resistance and the development of diabetes and CVD 177. An assessment of healthy women from the Nurses’ Health Study I and II demonstrated a positive association where higher GL was associated with higher C-peptide levels 178. Additionally, the earliest clinical trials on low GI diets done in people with type 2 diabetes demonstrated reductions in urinary C-peptide, as well as reductions in fasting blood glucose and HbA1c when compared to high GI diets 179, 180. Furthermore, a recent systematic review and meta-analysis of trials in overweight and obese individuals with follow up greater than 6 months, demonstrated significantly greater reductions in fasting insulin in those following low GI/GL diets compared to control diets 145. More recently, clinical trials in individuals in the prediabetic phase have examined the effect of GI on insulin sensitivity and beta cell function. A controlled clinical trial in 22 obese participants with prediabetes randomized to either a low or high GI diet combined with an exercise program for 12 weeks demonstrated similar weight loss on both diets, however postprandial hyperinsulinemia was reduced only on the low GI diet whereas the high GI diet demonstrated impaired β-cell function despite significant weight loss 181. Additional studies have demonstrated improvements in insulin sensitivity assessed by the HOmeostatic Model Assessment Index (HOMA-IR) on a low GI compared to a high GI diet 182 and to a low fat diet 183. Similar results, again using HOMA-IR, were found in the Framingham Offspring Study where increases in GI and GL were associated with increases in insulin resistance 184. Furthermore, a 4-week randomized crossover clinical trial conducted in individuals with type 2
19
diabetes where whole body peripheral insulin sensitivity was measured using the gold-standard euglycaemic hyperinsulinaemic clamp, reported insulin sensitivity to be significantly higher after the consumption of a low-GI diet compared to after a high-GI diet 117. Low GI and GL diets have been demonstrated in clinical trials to improve insulin sensitivity in both those with diabetes and in most, but not all, studies of healthy participants 185, which is similar to what has been observed with the drug acarbose 176. A notable exception is a study by Sacks et al. where in a large, short term (5 weeks) study of 163 overweight participants in their early 50s (mean age 53 years) with a relatively low incidence of metabolic syndrome (20%), no effect of GI was seen on HOMA-IR, insulin sensitivity, serum lipids or blood pressure in DASH-type diets with either high or low level of carbohydrate 186. However, these discrepancies may be the result of short duration and the generally low risk of the participants. Overall, the weight of evidence suggests that where there is a sufficient level of risk, low GI/GL diets may reduce risk and improve the condition of type 2 diabetes by improving insulin sensitivity and reducing insulin resistance.
1.3 GI & Diabetes Treatment 1.3.1 Overview Diabetes is characterized by chronic hyperglycemia, thus its treatment and management focuses specifically on how to best control these glycemic elevations. In addition to recommendations for pharmaceutical treatments, diabetes guidelines including the Canadian, American and European diabetes guidelines, among others, support the consumption of low GI carbohydrates for glycemic control 187-193 (Table 1.1). Without proper glycemic control, chronic hyperglycemia affects the vasculature at both the microvascular and macrovascular level resulting in whole-body complications. At the microvascular level, diabetic retinopathy has been found to be present in 21-39% of patients at time of diagnosis of type 2 diabetes and it is the leading cause of vision loss in Western Nations 2, 3, 194. Diabetes is also the leading cause of kidney failure 195, 196. At the macrovascular level, CVD is the leading cause of death 6, 197 and the leading driver of healthcare costs for people with diabetes 198. Therefore management strategies affecting glycemic control and preventing microvascular and macrovascular complications are of particular importance both for an improved quality of life for those living with diabetes and the alleviation of the burden on healthcare systems.
20
1.3.2 Observational Evidence 1.3.2.1 Cardiovascular Disease in Individuals with Type 2 Diabetes
Mellitus Prospective cohort studies exploring associations of GI and GL and management of diabetes complications, both at the microvascular and macrovascular level, have been sparse and inconsistent. A recent assessment of the EPIC cohort of over 6,000 individuals with confirmed type 2 diabetes from 6 European countries found no significant associations between baseline GI or GL and all-cause or CVD mortality after a median follow-up of 9.2 years 199. There was, however, a positive association between GL and mortality in the subgroup of normal weight individuals. It should be noted that there were important limitations of this prospective study since it relied on baseline dietary intake for the assessment of GI which could lead to misclassifications due to dietary changes during the long follow up period. Furthermore, the food frequency questionnaires (FFQs) used were not specifically designed to measure GI or GL. In fact, in the overall assessment of EPIC GI methodology it was concluded that ranking of participants based on GL values was acceptable, however, ranking according to GI was considered less reliable 200. This limitation also applies to the prospective ARIC study of 12, 251 healthy adults, aged 45-64 years at baseline with a follow up of 9 years, which found a positive association between GI and GL and CHD in the entire cohort but not in the diabetes subgroup. The association in the diabetes subgroup was positive but did not reach statistical significance; this, however, was limited by the small sample size of 1,378 people with diabetes 201. Another limitation with the use of a FFQ to assess GI and GL, which is probably an issue in other studies using FFQs, is misreporting, and specifically underreporting of snack-type and carbohydrate-rich foods, which is particularly common in those who are overweight. This could explain the lack of effect seen in the diabetes or obese subgroups 202. Interestingly, in another analysis of the EPIC cohort, examination of the association with intakes of legumes, which are a particularly low GI food, found significant reductions in all-cause and CVD mortality 203. Overall, prospective studies of CVD in individuals with diabetes are few and limited in their assessment of the association between GI and GL and all-cause or CVD mortality risk, and thus there remains a need for further exploration of any association.
21
1.3.2.2 Retinopathy and Macular Degeneration At the microvascular level, diabetes increases the risk of eye diseases, especially diabetic retinopathy (DR) 204, 205. Age-related macular degeneration (AMD) is a leading cause of vision loss in the elderly. Studies suggest that older people with diabetes are more susceptible to AMD than those without diabetes 206. The risk of both DR and AMD may be greatly impacted by hyperglycemia 207. To the best of our knowledge, there has been one observational study which assessed GI on retinal parameters and found that it was associated with both DR and AMD 208. The Blue Mountain Eye Study was a population-based cohort followed for 10-years with retinal photographs taken at baseline and at 10-year follow up. A cross-sectional analysis of the 1952 participants who were re-examined at 10-year follow up found that a higher mean dietary GI was associated with a 77% increased 10-year risk of early AMD when comparing the highest and lowest quartiles of GI (relative risk=1.77, 95% CI 1.13 to 2.78, p for trend= 0.03), and early AMD is a recognized precursor of sight-threatening late AMD 208. In the same cohort, a doubling in the risk of stroke was demonstrated between the highest and lowest GI tertile, as well as a 5-fold increased risk of stroke when the highest GI and the lowest cereal fiber tertile were combined and compared to the lowest GI and highest cereal fiber intake tertile 209. Also increasing GI and decreasing cereal fiber were associated with significant retinal (venular) vessel widening (p for trend <0.01), which is associated with markers of inflammation and endothelial dysfunction 210-212 and is known to predict stroke 209. Furthermore, the increased risk of stroke mortality associated with a higher GI diet was attenuated by 50% after accounting for variations in retinal venular caliber and thus it is thought that the deleterious cerebrovascular effects from high-GI diets could operate partly by anatomic effects on the cerebral microvasculature 209. Concerning another area of the eye, GI was found to significantly predict the incidence of cortical cataract in the 10-year follow up of the cohort from the Blue Mountains Eye Study 213. Thus, there is some evidence that GI may be associated with eye diseases; however limited assessment has been done to date, calling for a well-designed study to assess any association.
1.3.2.3 Kidneys Although very limited, there is also some evidence from observational studies that GI may affect microvascular disease at the level of the kidneys. In a longitudinal analysis of the Blue Mountains Eye Study, participants in the highest GI quartile had a 55% increased likelihood of
22
having moderate chronic kidney disease (CKD) as defined by an estimated glomerular filtration rate (eGFR) <60mL/min/1.73m2, compared with those in the first quartile (multivariable adjusted odds ratio = 1.55, 95% CI 1.07 to 2.26, p for trend=0.01) 214. This suggests that a low GI diet may confer some benefit at the level of the kidney. Overall, from the prospective studies done to date, low GI/GL diets may provide some benefit to the microvascular and macrovascular complications associated with diabetes, however there is a need for both well-designed observational studies and randomized controlled trials to specifically explore any associations.
1.3.3 Clinical Trial Evidence 1.3.3.1 Glycemic Control 1.3.3.1.1 GI & Glycemic Control in Randomized Controlled Trials* The primary focus for management of diabetes is glycemic control. A recent systematic review and meta-analysis of randomized controlled clinical trials ≥6 months in those with type 2 diabetes demonstrated a significant improvement in HbA1c (MD= -0.14%, 95% CI -0.24 to -0.03%, p<0.008) favouring low GI diets 17. Although the reduction was small (0.14 HbA1c units), only 3 trials were included in this meta-analysis due to the restriction on length of follow up 17. Of these 3 trials, 2 did not demonstrate a significant effect of GI. However, one of these trials, that by Wolever et al., included 156 participants who commenced the study with already optimized HbA1c levels at baseline (mean of 6.1%) and who did not yet require oral hypoglycemic medication 125 and the other study by Ma et al. of 40 participants with diabetes did not achieve a significant GI (or GL) difference between the 2 groups since the actual difference at 12 months was only 4 GI units 215. The study by Ma et al. did however demonstrate that significantly less anti-diabetic medication was required in those given the low GI dietary advice compared to those given the American Diabetes Association-recommended dietary advice 215. The one study of these three, the study by Jenkins et al., which did show a significant reduction of 0.5% HbA1c on the low GI diet, this being significantly lower than on the control high cereal fiber diet, had 210 participants with type 2 diabetes commence with a mean HbA1c level of 7.1% and achieved an 11 unit GI difference between the two groups 112. Thus, in participants with less well-controlled diabetes (baseline HbA1c between 6.6-8.5%) and with an achievement of a
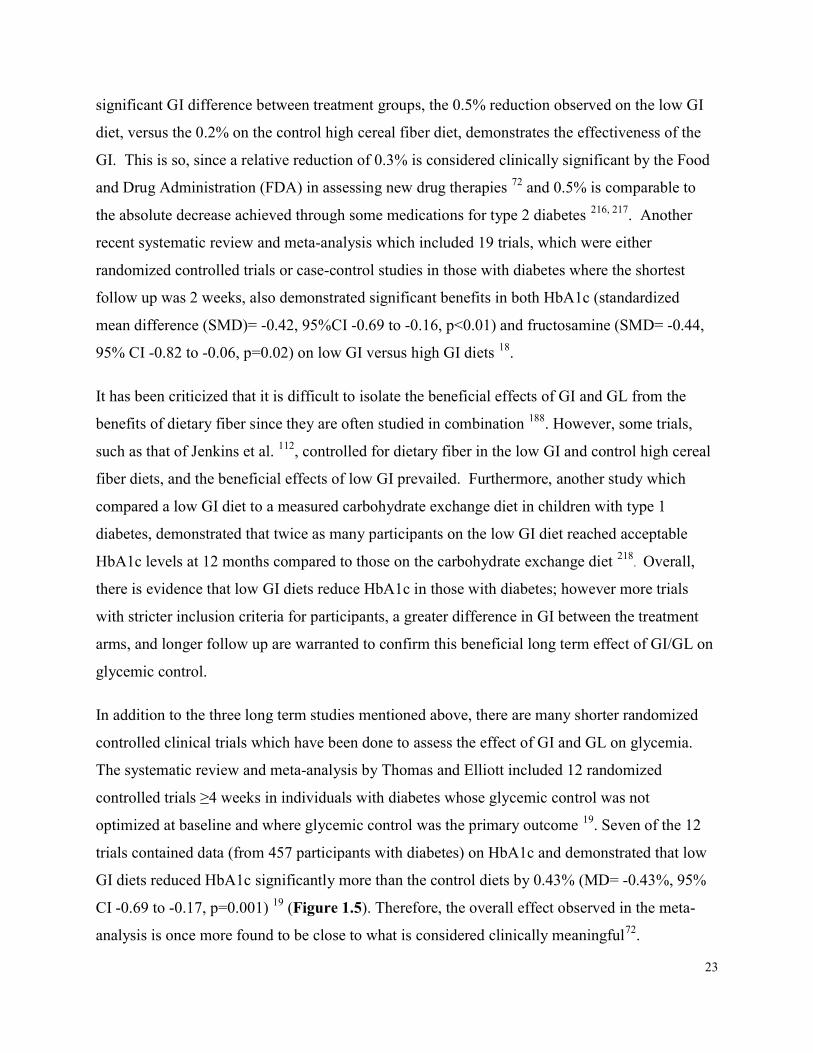
23
significant GI difference between treatment groups, the 0.5% reduction observed on the low GI diet, versus the 0.2% on the control high cereal fiber diet, demonstrates the effectiveness of the GI. This is so, since a relative reduction of 0.3% is considered clinically significant by the Food and Drug Administration (FDA) in assessing new drug therapies 72 and 0.5% is comparable to the absolute decrease achieved through some medications for type 2 diabetes 216, 217. Another recent systematic review and meta-analysis which included 19 trials, which were either randomized controlled trials or case-control studies in those with diabetes where the shortest follow up was 2 weeks, also demonstrated significant benefits in both HbA1c (standardized mean difference (SMD)= -0.42, 95%CI -0.69 to -0.16, p<0.01) and fructosamine (SMD= -0.44, 95% CI -0.82 to -0.06, p=0.02) on low GI versus high GI diets 18. It has been criticized that it is difficult to isolate the beneficial effects of GI and GL from the benefits of dietary fiber since they are often studied in combination 188. However, some trials, such as that of Jenkins et al. 112, controlled for dietary fiber in the low GI and control high cereal fiber diets, and the beneficial effects of low GI prevailed. Furthermore, another study which compared a low GI diet to a measured carbohydrate exchange diet in children with type 1 diabetes, demonstrated that twice as many participants on the low GI diet reached acceptable HbA1c levels at 12 months compared to those on the carbohydrate exchange diet 218. Overall, there is evidence that low GI diets reduce HbA1c in those with diabetes; however more trials with stricter inclusion criteria for participants, a greater difference in GI between the treatment arms, and longer follow up are warranted to confirm this beneficial long term effect of GI/GL on glycemic control. In addition to the three long term studies mentioned above, there are many shorter randomized controlled clinical trials which have been done to assess the effect of GI and GL on glycemia. The systematic review and meta-analysis by Thomas and Elliott included 12 randomized controlled trials ≥4 weeks in individuals with diabetes whose glycemic control was not optimized at baseline and where glycemic control was the primary outcome 19. Seven of the 12 trials contained data (from 457 participants with diabetes) on HbA1c and demonstrated that low GI diets reduced HbA1c significantly more than the control diets by 0.43% (MD= -0.43%, 95% CI -0.69 to -0.17, p=0.001) 19 (Figure 1.5). Therefore, the overall effect observed in the meta-analysis is once more found to be close to what is considered clinically meaningful72.
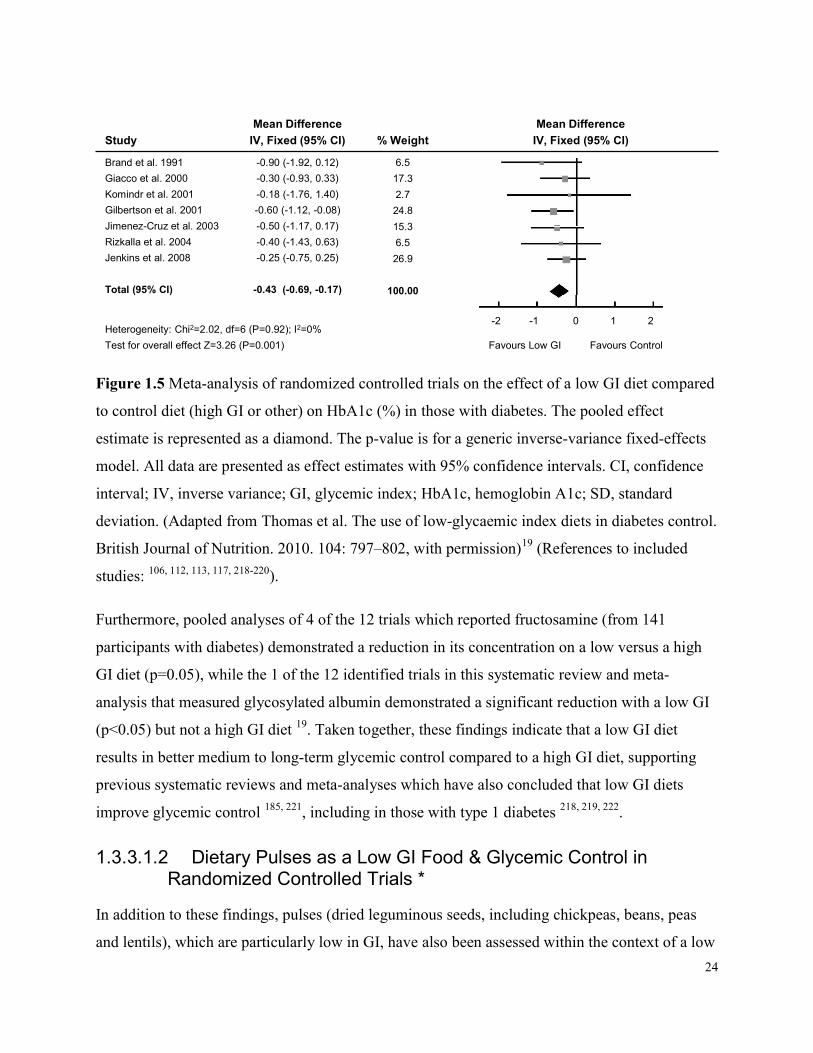
24
StudyMean Difference
IV, Fixed (95% CI) % WeightMean Difference
IV, Fixed (95% CI)Brand et al. 1991Giacco et al. 2000Komindr et al. 2001Gilbertson et al. 2001Jimenez-Cruz et al. 2003Rizkalla et al. 2004Jenkins et al. 2008
Total (95% CI)
-0.90 (-1.92, 0.12)-0.30 (-0.93, 0.33)-0.18 (-1.76, 1.40)-0.60 (-1.12, -0.08)-0.50 (-1.17, 0.17)-0.40 (-1.43, 0.63)-0.25 (-0.75, 0.25)
-0.43 (-0.69, -0.17)
6.517.32.724.815.36.526.9
100.00
Heterogeneity: Chi2=2.02, df=6 (P=0.92); I2=0%Test for overall effect Z=3.26 (P=0.001)
-2 -1 0 1 2 Favours Low GI Favours Control
Figure 1.5 Meta-analysis of randomized controlled trials on the effect of a low GI diet compared to control diet (high GI or other) on HbA1c (%) in those with diabetes. The pooled effect estimate is represented as a diamond. The p-value is for a generic inverse-variance fixed-effects model. All data are presented as effect estimates with 95% confidence intervals. CI, confidence interval; IV, inverse variance; GI, glycemic index; HbA1c, hemoglobin A1c; SD, standard deviation. (Adapted from Thomas et al. The use of low-glycaemic index diets in diabetes control. British Journal of Nutrition. 2010. 104: 797–802, with permission)19 (References to included studies: 106, 112, 113, 117, 218-220). Furthermore, pooled analyses of 4 of the 12 trials which reported fructosamine (from 141 participants with diabetes) demonstrated a reduction in its concentration on a low versus a high GI diet (p=0.05), while the 1 of the 12 identified trials in this systematic review and meta-analysis that measured glycosylated albumin demonstrated a significant reduction with a low GI (p<0.05) but not a high GI diet 19. Taken together, these findings indicate that a low GI diet results in better medium to long-term glycemic control compared to a high GI diet, supporting previous systematic reviews and meta-analyses which have also concluded that low GI diets improve glycemic control 185, 221, including in those with type 1 diabetes 218, 219, 222.
1.3.3.1.2 Dietary Pulses as a Low GI Food & Glycemic Control in Randomized Controlled Trials *
In addition to these findings, pulses (dried leguminous seeds, including chickpeas, beans, peas and lentils), which are particularly low in GI, have also been assessed within the context of a low
25
GI diet. In a systematic review and meta-analysis conducted by Sievenpiper et al. 223, pulses were demonstrated to significantly reduce markers of long term glycemic control, including glycated proteins, measured by HbA1c or fructosamine, compared to a high GI diet, in both individuals with and without diabetes (Figure 1.6).
StudySMD
IV, Random (95% CI) % WeightSMD
IV, Random (95% CI)Jenkins et al. 1987Jenkins et al. 1988Brand et al. 1991Wolever et al. 1992aFontvieille et al. 1992Wolever et al. 1992bFrost et al. 1994Gilbertson et al. 2001Komindr et al. 2001Jimenez-Cruz et al. 2003Rizkalla et al. 2004Jimenez-Cruz et al. 2004Frost et al. 2004Wolever et al. 2008Ma et al. 2008
Total (95% CI)
-0.93 (-1.52, -0.34)-0.62 (-1.09, -0.15)-0.55 (-1.06, -0.04)-0.24 (-0.38, -0.10)0.00 (-0.18, 0.18)
-0.31 (-0.53, -0.09)-0.40 (-0.97, 0.17)-0.49 (-0.90, -0.08)-0.07 (-0.44, 0.30)-0.56 (-0.83, -0.29)-0.69 (-1.10, -0.28)0.00 (-0.98, 0.98)0.10 (-0.27, 0.47)0.00 (-0.27, 0.27)0.09 (-0.34, 0.52)
-0.28 (-0.42, -0.14)
3.95.24.811.310.69.84.16.16.78.66.11.86.78.65.8
100.00
Heterogeneity:Tau2=0.04; Chi2=37.66, df=14 (P=0.0006); I2=63%Test for overall effect Z=3.93 (P<0.0001)
-4 -2 0 2 4 Favours pulses (LGI) Favours Control
Figure 1.6 Meta-analysis of randomized controlled trials on the effect of pulses as part of a low GI diet compared to a high GI diet on HbA1c (%) in those with and without diabetes. The pooled effect estimate is represented as a diamond. The p-value is for a generic inverse-variance random-effects model. All data are presented as effect estimates with 95% confidence intervals. CI, confidence interval; HbA1c, hemoglobin A1c; IV, inverse variance; LGI, low glycemic index; SMD, standardized mean difference. (Adapted from Sievenpiper et al. Effect of non-oil-seed pulses on glycaemic control: a systematic review and meta-analysis of randomized controlled experimental trials in people with and without diabetes. Diabetologia. 2009. 52:1479–1495, with permission)223 (References to included studies: 106, 109, 110, 113, 117, 124, 125, 179, 215, 218, 220, 224-227).
26
1.3.3.1.3 Benefits of GI Over Alternatives for Glycemic Control* Low GL diets have been demonstrated to significantly reduce HbA1c compared to low fat diets as seen in a long term (40 weeks) randomized trial of 79 obese participants with type 2 diabetes (low GL -0.8%±1.3 vs low fat -0.1±0.2%; p=0.01) where both diets were consumed hypocalorically and resulted in similar weight loss 228. A noteworthy benefit of a low GI diet over standard diabetes medications is that it reduces glycemia without the relevant adverse effects that are often associated with some anti-diabetic medications, specifically hypoglycemia, which has recently been suggested to contribute to the risk of diabetes complications 75. Two studies in the systematic review by Thomas and Elliott 19 report on low GI diets and hypoglycemia in individuals with type 1 diabetes mellitus. One of these studies conducted in adults found significantly fewer episodes of hypoglycemia on the low GI, high fiber diet compared to the high GI, low fiber diet 219. The second (in children) found that although there were no significant differences in hypoglycemia, there were significantly fewer episodes of hyperglycemia reported on the low GI diet 218. The latter study also reported that quality of life was significantly higher on the low GI diet compared to the standard of care, carbohydrate exchange diet, as assessed by difficulty in selecting meals, and also found a greater reporting that diabetes did not limit family activities 218. Thus, a low GI diet may be useful in managing glycemic control in diabetes without the pharmacological risk of hypoglycemia.
1.3.3.2 Microvascular Disease Tight glycemic control has been demonstrated to improve the microvascular complications of diabetes 9. For example, the Diabetes Control and Complications Trial (DCCT) in individuals with type 1 diabetes randomized to receive either intensive or conventional treatment for glycemic control, found a significant relationship between HbA1c level and risk of microvascular complications including retinopathy and nephropathy. Thus, better glycemic control was found to significantly reduce microvascular risk 229. Furthermore, in those intensively treated participants who had provided dietary data, diets higher in fat and saturated fat and lower in carbohydrate were found to be associated with worse glycemic control, independently of exercise and BMI 230. This confirms that carbohydrate consumption per se may be of importance in diabetes management, as suggested by dietary guidelines 187-193. However
27
specific clinical trials on low GI diets directly assessing the effects on microvascular disease, including diabetic retinopathy or nephropathy, are lacking and necessary.
1.3.3.3 Macrovascular Disease At the macrovascular level, although there is a lack of controlled clinical trials assessing the effects of GI and GL on cardiovascular risk in diabetes, a few trials, including some conducted with acarbose, suggest a potential benefit.
1.3.3.3.1 GI & Surrogate Measures of Endothelial Function* A surrogate measure of CVD is endothelial function, which can be measured by flow mediated dilation (FMD), a measure which has demonstrated to be a predictor of CVD events 231, 232. In a 3-month randomized controlled clinical trial of high versus low GI weight loss diets matched for macronutrients and dietary fiber in 40 overweight and obese participants, FMD was significantly improved on the low GI diet compared to the high GI diet (p<0.005) 233. Furthermore, a pilot study conducted in 38 men with at least 1 CHD risk factor randomized to a low or high GI diet for 6-months along with healthy eating and weight loss advice, demonstrated that 24-hour blood pressure was significantly improved in those on the low GI versus high GI diet 115. Additionally, the study demonstrated that carotid-femoral pulse wave velocity, which is a surrogate measure of arterial compliance (an index of the elasticity of large arteries and an important cardiovascular risk factor), was only significantly improved on the low GI diet 115. FMD, 24-hour blood pressure and carotid-femoral pulse wave velocity are all measures of endothelial dysfunction resulting from insulin resistance, which reduces nitric oxide production and may be associated with increased production of reactive oxygen species, collectively leading to atherosclerosis 234, 235. Interestingly, a low GI diet has also previously been shown in healthy adults to be associated with a reduction in oxidative stress compared to a high GI diet 236, 237.
1.3.3.3.2 GI & Subclinical Measures of Arterial Disease – Carotid Ultrasound**
Since it is of greater interest to assess the effect of interventions on more direct measures of CVD beyond traditional risk factors, and CVD event trials are lengthy and costly, there has been an emergence in new subclinical measures of CVD through the use of imaging modalities.
28
One such imaging modality for carotid plaque is carotid intima media thickness (CIMT) by 2-dimensional (2D) carotid ultrasound (CUS). CIMT by CUS has been used for over 20 years, has demonstrated good reproducibility 238 and has been linked to an increased risk of subsequent CVD events 32, 239-243, including in those with diabetes 244. CIMT can be used reliably for CVD diagnosis 245 and is used clinically to refine CVD risk assessment as outlined in various clinical practice guidelines 14, 29, 246-250. For example, the European Society of Hypertension (ESH) and of the European Society of Cardiology (ESC) Practice Guidelines for the management of arterial hypertension and CVD prevention indicate a CIMT >0.9mm to be indicative of subclinical organ damage and is used to assist in stratifying total CVD risk 248, 249. The Mannheim Carotid Intima-Media Thickness and Plaque Consensus 250 identifies CIMT>1.5mm as the beginning of atheromatous changes which can be used to add further to cardiovascular risk assessment. CIMT is included as optional testing for risk stratification in the Canadian Cardiovascular Society Guidelines where CIMT≥1.0mm is considered abnormal and CIMT≥1.5mm is considered an indication for statin therapy14. CIMT is a 2-D measure of carotid plaque which has been validated 24 and has been used in many trials of statins to explore effects on the development of arterial disease 25-28. Improvements in CIMT have also been demonstrated in trials with anti-diabetic medications, including the anti-diabetic drug acarbose, a pharmacological analogue to a low GI diet. With regard to clinical trials, a 12-month clinical trial in those with type 2 diabetes randomized to receive a sulphonylurea with or without acarbose, demonstrated a significant reduction in CIMT only in the group given acarbose 141, thus indicating a potential reduction in arteriosclerotic risk. Furthermore, in a meta-analysis of randomized controlled trials of the effect of alpha-glucosidase inhibitors on CIMT, where 5 trials of 411 participants were identified, alpha-glucosidase therapy was associated with a significant reduction in the progression of CIMT and subgroup analyses demonstrated a significant effect both in those with type 2 diabetes (4 trials) and those with impaired glucose tolerance (IGT) (1 trial) 251. These data are in line with an international multi-center, double-blind, placebo-controlled trial of 1429 participants with IGT randomly assigned to receive either 100mg of acarbose three times a day or placebo 23. Although this was a secondary analysis and there were few CVD events, acarbose was demonstrated to result in a 49% relative risk reduction in the development of CVD events
29
(hazard ratio, HR=0.51, 95% CI 0.28 to 0.93, p=0.030) and a 34% reduction in new cases of hypertension (HR=0.66, 95% CI 0.49 to 0.89, p=0.006) over 3 years, even after adjustment for major risk factors 23. A larger CVD event trial with acarbose in those with diabetes is currently underway to directly assess the effect. Additionally, a meta-analysis of 7 randomized double-blind placebo-controlled acarbose studies with a minimum treatment duration of 52 weeks in individuals with type 2 diabetes demonstrated that acarbose showed favorable trends towards risk reduction in all categories of CVD, with a significant reduction for any CVD event (HR=0.65, 95% CI 0.48 to 0.88, p<0.001) 252. Furthermore, the anti-diabetic drugs repaglinide and nateglinide, which are insulin secretagogues that act similarly to acarbose in that they reduce postprandial glycemia, have also demonstrated regression in CIMT 253, 254. Thus there is potential for targeting post prandial glycemia in improving subclinical markers of CVD. There have not been any dietary intervention trials assessing change in CIMT, aside from as a secondary analysis in a few trials on the Mediterranean diet. One trial in hyperlipidaemic men demonstrated a reduction in progression by following a Mediterranean diet pattern compared to no advice, which was significantly correlated with consumption of fruit and berries 255. A second trial assessed change in CIMT over 1 year in a subgroup of 187 high risk asymptomatic Spanish participants within the PREDIMED trial, randomized to either a Mediterranean diet supplemented with extra virgin olive oil or nuts, compared to a low fat diet for primary cardiovascular prevention. In the subgroup, common carotid artery (CCA) CIMT significantly regressed only in those with a baseline CIMT≥0.9mm, demonstrating a -0.093mm (95% CI -0.146 to -0.039) reduction in the group on the Mediterranean diet plus olive oil and a -0.086mm (95% CI -0.138 to -0.034) reduction in the group plus nuts over 1 year256, highlighting benefit only in those at particularly high CVD risk. Additionally, in a cross-sectional analysis of PREDIMED baseline data, those with dietary fiber intakes above 35g/d had significantly lower CCA-CIMT (-0.051mm, 95% CI -0.094 to -0.009) compared to those with intakes <25g/d 257. CIMT has also been associated with saturated fat where for every 10g/d increase in saturated fat, CIMT is 0.03mm greater 258. These observed associations with diet are noteworthy since the average rate of increase of CIMT is around 0.01mm-0.02mm/year in those who are healthy to those with type 2 diabetes.
30
The PREDIMED study furthermore demonstrated in their primary outcome with 7447 high CVD risk participants that both supplemented Mediterranean diets significantly reduced incidence of major cardiovascular events over a median follow up of 4.8 years 43. In a longitudinal analysis of 2866 participants, the Mediterranean diet interventions were associated with reductions in dietary GI and GL, thus they were lower GI and GL compared to the control diet 259. When assessed for associations with all-cause mortality, high GI/GL was positively associated with all-cause mortality when comparing those in the highest to lowest quartile of GI and GL, over a median follow up of 4.7 years 260. Thus, there may be some potential for low GI/GL diets, which act to lower postprandial glycemia, to reduce CVD risk, possibly through improvements in carotid plaque. It is important to note that systematic reviews and meta-analyses have indicated that CIMT may be suboptimal for assessing change 30-32. Limitations include differences between studies in methods used for measuring CIMT, some report mean CIMT while others maximum CIMT, or measure only one of the three segments of the carotid artery (common carotid artery, bifurcation, and internal carotid artery) 261. Further investigation into the usefulness of CIMT as a tool to measure change in subclinical arterial disease is warranted, although it is still used as a gold standard tool for refining CVD risk assessment247, 250.
1.3.3.3.3 GI & Subclinical Measures of Arterial Disease – MRI** More recently, advances have been made in MRI techniques, and with the new use of MRI, 3-dimensional images of carotid plaque allow for the calculation of vessel wall volume (VWV) which has demonstrated high accuracy and reproducibility and has been validated against histology 33-37. The advantage of MRI over CUS includes; minimizes inter- and intra-operator variability since it is not operator dependent 38; has higher reproducibility 39, 40; measures the entire circumference of the carotid wall for more comprehensive coverage allowing for better capture of plaque and detection of early wall thickening 38; and can additionally image plaque characteristics, such as intraplaque hemorrhage (IPH) and lipid rich necrotic core (LRNC), which are closely related to plaque vulnerability and cardiovascular risk, 38, 41 thus providing information on plaque quality in addition to quantity. MRI techniques have improved over the past 5-6 years where measurement error for carotid vessel wall volume previously was ~5.8% 262 and is now lower at ~2.25% 36. Carotid plaque burden has been correlated with CVD risk factors
31
263 and plaque characteristics, such as IPH, LRNC and calcification, are established predictors of future cerebrovascular events 41. Thus, MRI is the preferred measuring tool to assess change in intervention trials and additionally, the feasibility of multi-center studies for MRI assessment of carotid plaque has been established 264. Various trials have demonstrated improvements in carotid plaque burden as a result of statin therapy 265-268 and one trial demonstrated vessel wall volume regression as a result of cardiovascular guideline regimens in those with type 2 diabetes 269. No dietary trials have been published to date assessing the effect on carotid plaque burden by MRI, although a published abstract from the PREDIMED study assessed change in a subgroup who had CIMT>2.0mm and underwent an MRI at baseline and after the intervention (average 1.8 years) 270. A reduction in vessel wall volume of 0.029cm3 on the Mediterranean diet plus nuts and a reduction of 0.098cm3 on the Mediterranean diet plus olive oil was demonstrated 270. The reduction in the arm with olive oil was similar to what has been found in one of the trials assessing the effect of statins over a 6-month period (-8.8% or ~ -0.091cm3) 265 and in the trial with the cardiovascular guidelines provided over a 2 year period (-9.6%) 269. Therefore, there is potential for dietary interventions to improve cardiovascular risk assessed through subclinical markers of arterial disease. Therefore, overall, a long-term trial assessing the effect of a low GI diet on CIMT by CUS or preferably carotid plaque volume by MRI in those with diabetes would be of great interest, in addition to a longer follow up trial with CVD events being the primary outcome, in order to directly assess whether a low GI diet is beneficial for CVD risk reduction in high risk individuals.
1.4 Adherence and Adaptive Trial Design** It is of great importance to recognize whether research findings can be translated to clinical practice. Acute or short term dietary trials may demonstrate success within these short periods, but long term follow up is required to assess if the dietary intervention is sustainable and will result in long term lifestyle changes. The majority of trials conducted on the effect of a low GI diet have been of relatively short duration (<6months), thus it is unknown whether a low GI diet can be adopted successfully long term.
32
An important consideration in dietary intervention trials is that they reflect real life in order to assess effectiveness. Thus, metabolically controlled trials, although they may be useful to determine efficacy, do not determine effectiveness since they remove all opportunity for free choice and application of dietary principles of the intervention by the participants. The objective of the trial and spirit of the protocol must be maintained as closely as possible, namely to maintain the differences between the test and control groups. However, particularly with long term trials, challenges may occur, such as crossover and contamination, which can reduce the estimate of the treatment effect 271. In order to address these real life challenges, there is the need to be able to adapt protocols to maintain the differences between test and control groups in order to assess the effects between them. Adaptive trial design is a concept supported by the Food and Drug Administration (FDA), which states that “compared to non-adaptive studies, adaptive design approaches may lead to a study that (1) more efficiently provides the same information, (2) increases the likelihood of success on the study objective, or (3) yields improved understanding of the treatment’s effect” 44, 45. The FDA document on adapative trial design indicates that adaptations to the study protocol may be based on planned unblinded interim analyses or blinded evaluations which can occur before or after the study has started and that these do not introduce statistical bias to the study. The possible design modifications can include treatment regimens of the different study groups, concomitant treatments, planned schedule of patient evaluations for data collection, primary endpoint, selection and/or order of secondary endpoints, among others44, 45. Thus, if evidence emerges during a trial, the trial protocol may be adapted (altered/improved) to make the trial more efficient at maintaining its original objective. For example, when the PREDIMED trial results were published 43 and demonstrated success of the dietary interventions in which a key food component was provided to all study participants, for long term dietary trials which were currently ongoing it may be suitable to incorporate the provision of a free study food if it was provided equally among treatment groups so as not to introduce any bias. Therefore, adaptive trial design should be considered in long term dietary trials to maintain the objective of the protocol and allow for the improved understanding of the treatment’s effect. These considerations should be taken into account in the planning and execution of future long term dietary trials to assess the effect of a low GI diet, where crossover is a significant concern.
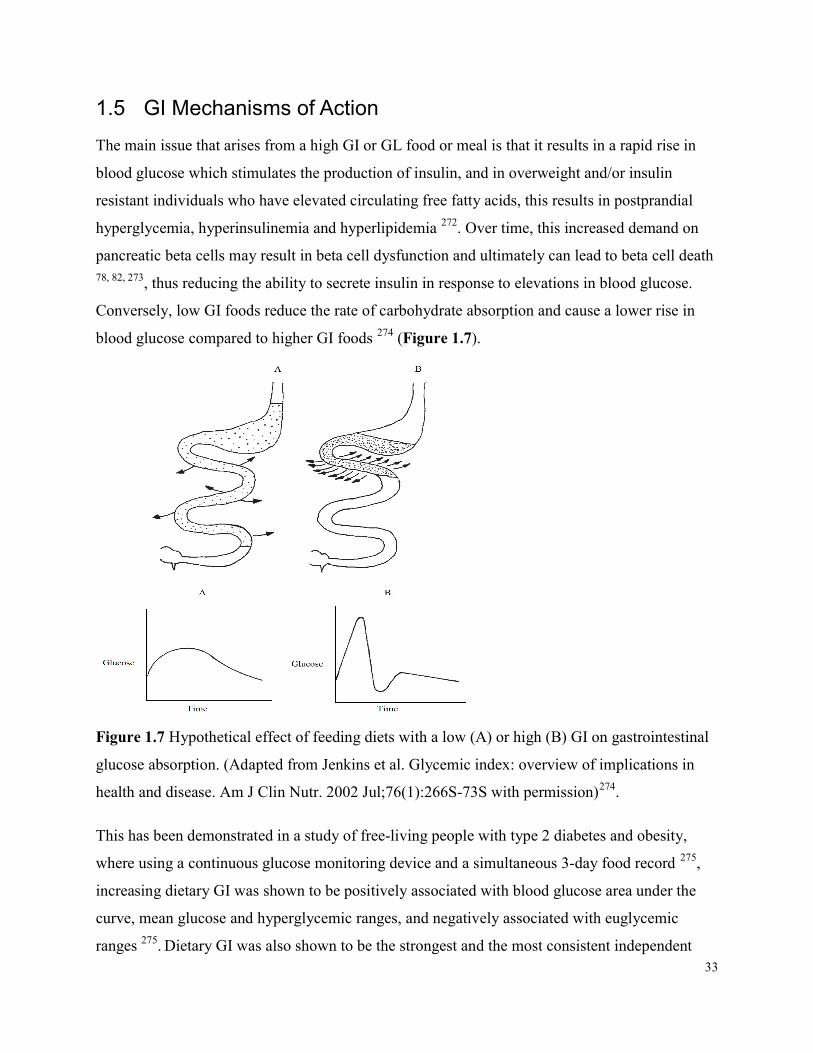
33
1.5 GI Mechanisms of Action The main issue that arises from a high GI or GL food or meal is that it results in a rapid rise in blood glucose which stimulates the production of insulin, and in overweight and/or insulin resistant individuals who have elevated circulating free fatty acids, this results in postprandial hyperglycemia, hyperinsulinemia and hyperlipidemia 272. Over time, this increased demand on pancreatic beta cells may result in beta cell dysfunction and ultimately can lead to beta cell death 78, 82, 273, thus reducing the ability to secrete insulin in response to elevations in blood glucose. Conversely, low GI foods reduce the rate of carbohydrate absorption and cause a lower rise in blood glucose compared to higher GI foods 274 (Figure 1.7).
Figure 1.7 Hypothetical effect of feeding diets with a low (A) or high (B) GI on gastrointestinal glucose absorption. (Adapted from Jenkins et al. Glycemic index: overview of implications in health and disease. Am J Clin Nutr. 2002 Jul;76(1):266S-73S with permission)274. This has been demonstrated in a study of free-living people with type 2 diabetes and obesity, where using a continuous glucose monitoring device and a simultaneous 3-day food record 275, increasing dietary GI was shown to be positively associated with blood glucose area under the curve, mean glucose and hyperglycemic ranges, and negatively associated with euglycemic ranges 275. Dietary GI was also shown to be the strongest and the most consistent independent
34
predictor of glycemic fluctuations 275. Thus, as a result of the consumption of a low GI diet, the reduction in glycemic fluctuations would lower the demand for insulin and thus reduce circulating insulin along with related gastrointestinal hormones, including the incretins, gastric inhibitory polypeptide (GIP) and glucagon-like peptide-1 (GLP-1) 276. Prolongation of glucose absorption and the longer but lower insulin concentration would maintain a longer suppression of free fatty acids, thereby improving cellular glucose metabolism while maintaining blood glucose concentration closer to baseline, despite continued absorption from the small intestine. This scenario has been demonstrated in healthy participants who sipped glucose over 4 hours as opposed to drinking it in a bolus 277. Slowed absorption of glucose is relevant for both the prevention and management of diabetes as it helps prevent beta cell dysfunction by reducing the insulin demand, as well as minimizing oxidative stress and inflammation resulting from hyperglycemia. Furthermore, reduced insulin demand and improvement in insulin resistance are associated with prevention in the development of type 2 diabetes, better management of both type 1 and type 2 diabetes and a reduction in the risk of microvascular and macrovascular complications 62. The delayed absorption of carbohydrate in low GI foods through the mechanisms described above can have multiple beneficial effects. Firstly, it may affect body weight possibly due to increased satiety278 or may reduce hunger by preventing hyperglycemia, since hyperinsulinemia which follows a high GI/GL diet causes rapid reductions in blood glucose, depleting the metabolic fuels in the body, which in turn may stimulate hunger 279. Secondly, there is evidence of a “second meal” effect where after consumption of a low GI meal, uptake of glucose after the subsequent meal is improved, possibly related to the prolonged suppression of free fatty acid concentration 277, 280. Thirdly, it is hypothesized that at both the micro- and macrovascular levels, repeated occurrences of hyperglycemia and hypoglycemia (increased glycemic variability) may overwhelm the pathways by which glucose is metabolized, resulting in adverse reactions, including downregulation of genes involved in free radical detoxification, which result in formation of advanced glycation end products (AGEs) 237. Glycemic variability has been demonstrated to activate oxidative stress 237, 281, 282 whereas, by creating a more blunted and sustained glycemic response with a low GI diet, oxidative stress, as well as the production of AGEs, would be reduced. Furthermore, without the control of glycemic variability, AGEs, along with other molecules associated with oxidative damage and inflammation, may accumulate in the
35
vasculature, altering cellular metabolism, causing dysfunction (glycating enzymes) and even cellular death, which contributes to the vascular complications of diabetes 207. Overall, low GI diets may reduce the metabolic stress induced by rapid absorption of carbohydrates and may thus delay the progression of type 2 diabetes and the development of the associated vascular complications.
1.6 Conclusions and Perspectives Due to the rapid rise in diabetes prevalence over the past few decades and the projected further increase over the next 20 years, as well as the many complications which develop as a result of diabetes, the quality and duration of life is severely diminished and the economic burden on our healthcare systems and individual patients is substantial. Thus, there is a need to find effective and sustainable prevention and treatment strategies for diabetes. Pharmacological strategies are being actively sought and many new drugs are being brought to market. Nevertheless, sustainable lifestyle changes, such as low GI diets, may be suitable to assist in both prevention and management of diabetes, possibly also allowing pharmacological therapy to be effective at lower doses with the subsequent lower risk of side effects. At this point in time, there is a lack of evidence on the effect of low GI diets on hard endpoints, particularly for CVD which is the primary cause of death in diabetes. However, there is evidence that low GI diets may reduce the risk of diabetes and associated risk factors, including improving body weight and insulin resistance, and in clinical trials of participants with diabetes, improve glycemic control, CVD risk factors and some diabetes-related complications. For these reasons many international diabetes associations are now recommending low GI over high GI carbohydrate choices (Table 1.1).
1.6.1 Recommendations for Future Research As a result of the high prevalence of diabetes, obesity and the metabolic syndrome globally, there is a great need to identify strategies, specifically lifestyle changes, which may be effective in combating this challenge, for which there is growing evidence that low GI diets may be useful. Although low GI diets have been demonstrated to reduce the risk of diabetes and its associated complications including body weight and cholesterol, and specifically improve the control of blood glucose concentration, there is a great need for well-designed trials with harder endpoints.
36
Observational studies exploring GI and GL on the management of diabetes complications are sparse and limited. The literature would benefit from a properly designed assessment of the association between GI/GL and diabetes complications including: (1) proper assessment of GI using validated food frequency questionnaires (FFQ) in a cohort with diabetes, (2) FFQs to be collected at repeated time points over the duration of follow up for accurate representation, (3) proper assessment of the outcomes of interest, for example diabetic retinopathy using retinal photographs which are graded using specialized computer technology 283, and (4) longer follow up for better assessment of these outcomes. Additionally, although there have been randomized controlled trials which have demonstrated benefit of low GI diets on glycemic control in diabetes, further trials, specifically assessing the hard endpoints of diabetes complications are warranted. These trials need to be specifically designed to assess both microvascular (diabetic retinopathy and nephropathy) and macrovascular (carotid plaque development, CIMT and CVD events and mortality) outcomes. A particularly useful trial would be one designed to assess plaque volume by magnetic resonance imaging (MRI), including intraplaque hemorrhage and risk factors for plaque rupture, with longer follow up and CVD events being the primary outcome in high risk individuals (those with diabetes and the metabolic syndrome). For clinical trials, maintaining a significant difference in GI between the treatment groups, while holding all other variables constant, including dietary fiber, will also be an important consideration. Along these lines, it is necessary to provide consumers and health professionals with accurate and reliable information about the GI. This points to the need to develop GI education tools and make them widely available, as well as to have information on GI in food composition tables and food labels which should be updated at regular intervals 79.
1.6.2 Recommendations for Dietary Choices for those with Diabetes Randomized controlled trials have fairly consistently shown a benefit of low GI diets on glycemic control in those with diabetes. Therefore adopting a lower GI diet within the context of a healthy diet is advantageous and the use of a low GI diet or low GI foods is recommended by diabetes guidelines internationally (Table 1.1). Examples of low GI dietary substitutions which could be implemented in a healthy diet are presented in Table 1.2. These modifications have been used in research 13, 112, 284 to reduce the GI of the diet by about 9-14 GI units and which have demonstrated significant improvements in blood glucose control in diabetes.
37
It is advisable that those who are consuming a high GI diet could make gradual dietary changes starting with replacing one high GI food item with a low GI one at each meal, including the substitution of a high GI fruit with a low GI fruit. The latter change has also been shown to be associated with improvements in glycemic control 285. In order for the public to make low GI choices, they will require validated tools and education. This point further highlights the need for better validated GI education tools for both health professionals and the public.
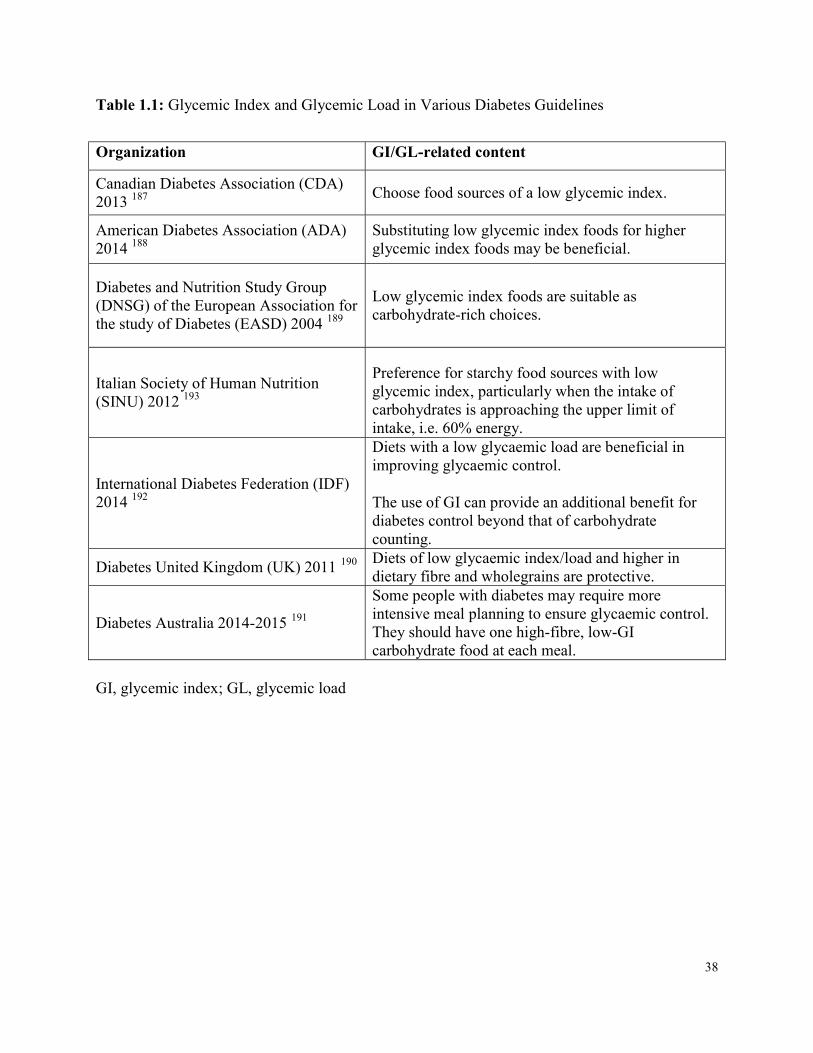
38
Table 1.1: Glycemic Index and Glycemic Load in Various Diabetes Guidelines
Organization GI/GL-related content Canadian Diabetes Association (CDA) 2013 187 Choose food sources of a low glycemic index. American Diabetes Association (ADA) 2014 188
Substituting low glycemic index foods for higher glycemic index foods may be beneficial.
Diabetes and Nutrition Study Group (DNSG) of the European Association for the study of Diabetes (EASD) 2004 189
Low glycemic index foods are suitable as carbohydrate-rich choices.
Italian Society of Human Nutrition (SINU) 2012 193
Preference for starchy food sources with low glycemic index, particularly when the intake of carbohydrates is approaching the upper limit of intake, i.e. 60% energy.
International Diabetes Federation (IDF) 2014 192
Diets with a low glycaemic load are beneficial in improving glycaemic control. The use of GI can provide an additional benefit for diabetes control beyond that of carbohydrate counting.
Diabetes United Kingdom (UK) 2011 190 Diets of low glycaemic index/load and higher in dietary fibre and wholegrains are protective.
Diabetes Australia 2014-2015 191 Some people with diabetes may require more intensive meal planning to ensure glycaemic control. They should have one high-fibre, low-GI carbohydrate food at each meal.
GI, glycemic index; GL, glycemic load
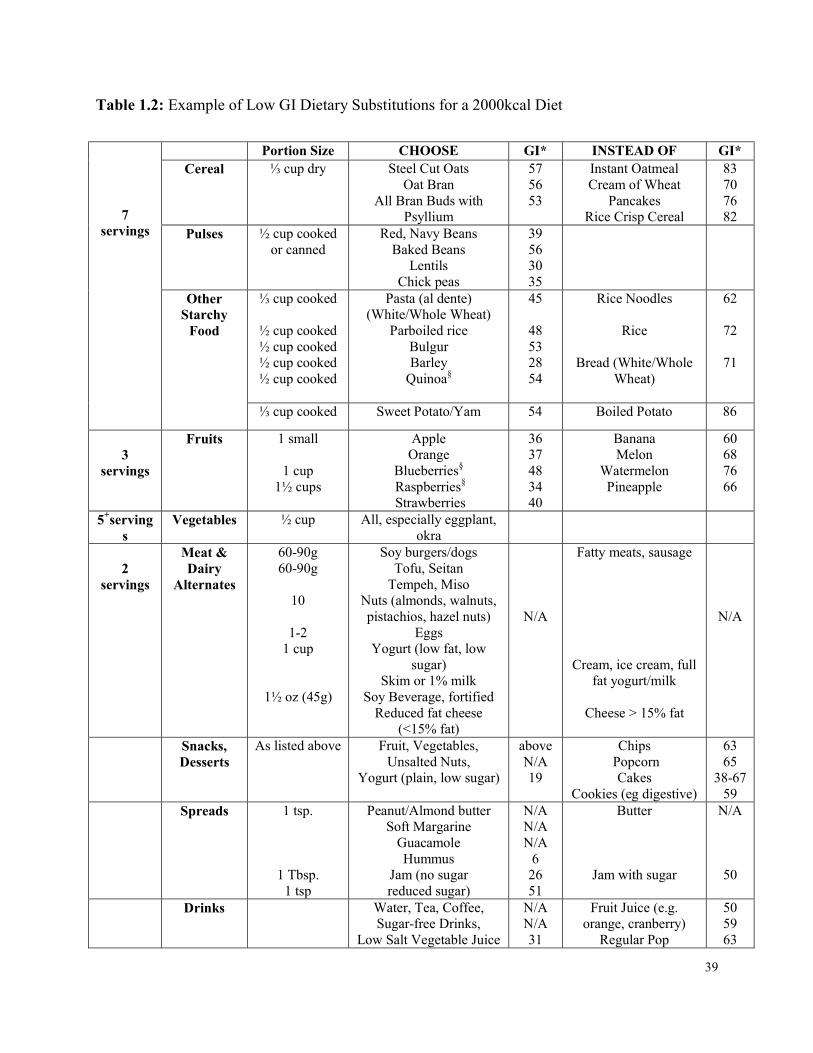
39
Table 1.2: Example of Low GI Dietary Substitutions for a 2000kcal Diet
7 servings
Portion Size CHOOSE GI* INSTEAD OF GI* Cereal ⅓ cup dry
Steel Cut Oats
Oat Bran All Bran Buds with
Psyllium
57 56 53
Instant Oatmeal Cream of Wheat
Pancakes Rice Crisp Cereal
83 70 76 82
Pulses ½ cup cooked or canned
Red, Navy Beans Baked Beans
Lentils Chick peas
39 56 30 35
Other Starchy
Food
⅓ cup cooked
½ cup cooked ½ cup cooked ½ cup cooked ½ cup cooked
Pasta (al dente) (White/Whole Wheat)
Parboiled rice Bulgur Barley
Quinoa§
45
48 53 28 54
Rice Noodles
Rice
Bread (White/Whole Wheat)
62
72
71
⅓ cup cooked Sweet Potato/Yam 54 Boiled Potato 86
3 servings
Fruits 1 small
1 cup 1½ cups
Apple Orange
Blueberries§ Raspberries§ Strawberries
36 37 48 34 40
Banana Melon
Watermelon Pineapple
60 68 76 66
5+servings
Vegetables ½ cup All, especially eggplant, okra
2 servings
Meat & Dairy
Alternates 60-90g 60-90g
10
1-2
1 cup
1½ oz (45g)
Soy burgers/dogs Tofu, Seitan
Tempeh, Miso Nuts (almonds, walnuts, pistachios, hazel nuts)
Eggs Yogurt (low fat, low
sugar) Skim or 1% milk
Soy Beverage, fortified Reduced fat cheese
(<15% fat)
N/A
Fatty meats, sausage
Cream, ice cream, full fat yogurt/milk
Cheese > 15% fat
N/A
Snacks, Desserts
As listed above Fruit, Vegetables, Unsalted Nuts,
Yogurt (plain, low sugar) above N/A 19
Chips Popcorn
Cakes Cookies (eg digestive)
63 65
38-67 59
Spreads 1 tsp.
1 Tbsp. 1 tsp
Peanut/Almond butter Soft Margarine
Guacamole Hummus
Jam (no sugar reduced sugar)
N/A N/A N/A
6 26 51
Butter
Jam with sugar
N/A
50
Drinks Water, Tea, Coffee, Sugar-free Drinks,
Low Salt Vegetable Juice N/A N/A 31
Fruit Juice (e.g. orange, cranberry)
Regular Pop 50 59 63

40
* GI values are presented on the glucose scale (to convert to the bread scale, multiply by 1.41). Classification: GI ≤ 55 = low GI; 56-69 = medium GI; ≥70 = high GI. GI values are approximate values obtained from an average of those tested and presented in the International Tables of GI and GL values (Atkinson et al. International tables of glycemic index and glycemic load values: 2008. Diabetes Care. 2008 Dec;31(12):2281-3.). § for these foods, GI testing was performed through the University of Toronto at Glycemic Index Laboratories, Canada. GI, glycemic index; GL, glycemic load; MF, milk fat; N/A, not applicable since the food is not a significant source of carbohydrates
41
Chapter 2
Low Glycemic Index Diet to improve Glycemic Control and Cardiovascular Disease in Type 2 Diabetes: design and methods
for a randomized controlled clinical trial Laura Chiavaroli1,2, Arash Mirrahimi2,3, Christopher Ireland1,2, Sandra Mitchell1,2, Sandhya Sahye-Pudaruth1,2, Judy Coveney2, Omodele Olowoyeye4,5, Tishan Maraj4,5, Darshna Patel1,2, Russell J de Souza2,6, Livia SA Augustin2,11, Balachandran Bashyam1,2, Sonia Blanco Mejia1,2, Stephanie K Nishi1,2, Lawrence A Leiter1,7, Robert G Josse1,7, Gail McKeown-Eyssen8, Alan Moody4,5, Alan Berger9, Cyril WC Kendall2,10, John L Sievenpiper1,2, David JA Jenkins1,2 1 Department of Nutritional Sciences, Faculty of Medicine, University of Toronto, Toronto, ON, Canada 2 Clinical Nutrition and Risk Factor Modification Center, St. Michael’s Hospital, Toronto, ON, Canada 3 School of Medicine, Faculty of Health Sciences, Queen’s University, Kingston, ON, Canada 4 Department of Medical Imaging, Sunnybrook Health Sciences Centre, Toronto, ON, Canada 5 Institute of Medical Science, University of Toronto, Toronto, ON, Canada 6 Department of Clinical Epidemiology and Biostatistics, Faculty of Health Sciences, McMaster University, Hamilton, ON, Canada 7 Division of Endocrinology and Metabolism, St. Michael’s Hospital, Toronto, ON, Canada 8 Dalla Lana School of Public Health, University of Toronto, Toronto, ON, Canada 9 Department of Ophthalmology, St. Michael’s Hospital, Toronto, ON, Canada 10 College of Pharmacy and Nutrition, University of Saskatchewan, Saskatoon, SK, Canada 11 National Cancer Institute "Fondazione G. Pascale", Naples, Italy Note: this chapter has been accepted for publication in BMJ Open
42
2 Abstract
Introduction: Type 2 diabetes (T2DM) produces macro and microvascular damage significantly increasing the risk of cardiovascular disease (CVD), renal failure and blindness. As rates of T2DM rise, the need for effective dietary and other lifestyle changes to improve diabetes management become more urgent. Low glycemic index (GI) diets may improve glycemic control in diabetes in the short term, however there is a lack of evidence on the long term adherence to low GI diets, as well as on the association with surrogate markers of CVD beyond traditional risk factors. Recently, advances have been made in measures of subclinical arterial disease through the use of magnetic resonance imaging (MRI), which, along with standard measures from carotid ultrasound scanning (CUS), have been associated with CVD events. We therefore designed a randomized controlled clinical trial to assess whether low GI dietary advice can significantly improve surrogate markers of CVD and long term glycemic control in T2DM. Methods and Analysis: 169 otherwise healthy individuals with T2DM were recruited to receive intensive counseling on a low GI or high cereal fiber diet for 3-years. To assess macrovascular disease, MRI and CUS are used, and to assess microvascular disease, retinal photography and 24-hr urinary collections are taken at baseline and Years 1 and 3. Risk factors for CVD are assessed every 3 months. Ethics and Dissemination: The study protocol and consent form have been approved by the research ethics board of St. Michael’s Hospital. If the study shows a benefit, these data will support the use of low GI and/or high fiber foods in the management of T2DM and its complications. Trial Registration: clinicaltrials.gov identifier: NCT01063374
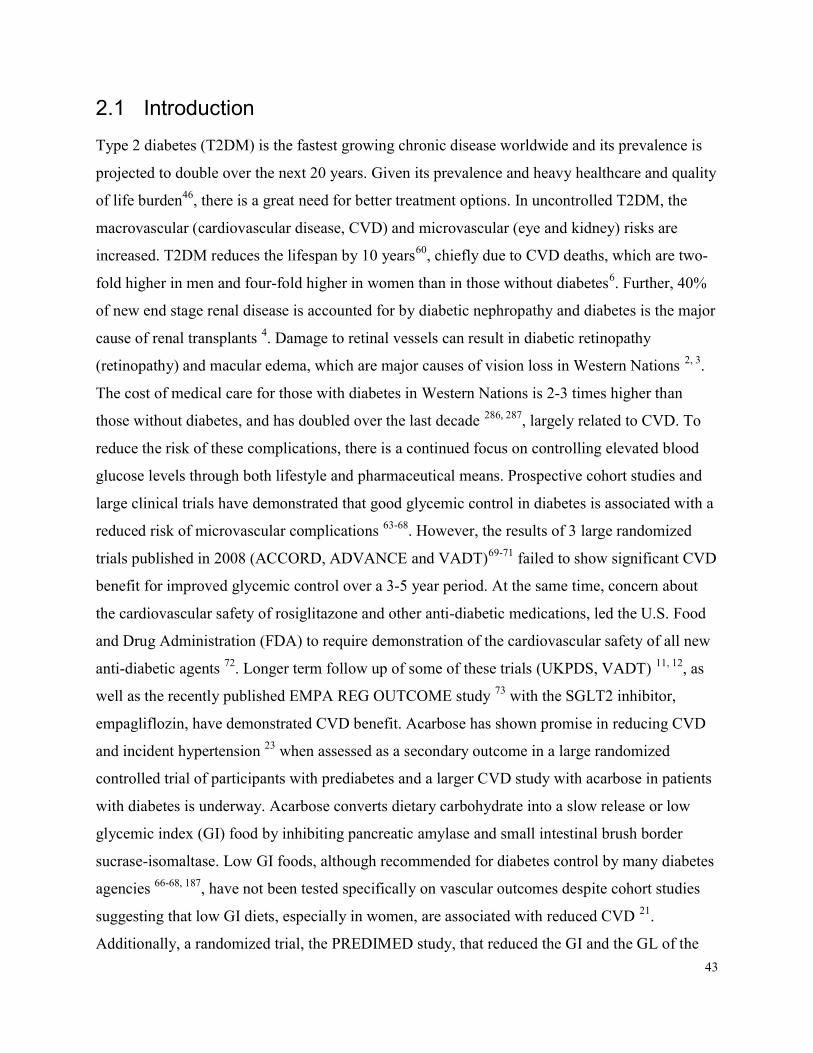
43
2.1 Introduction Type 2 diabetes (T2DM) is the fastest growing chronic disease worldwide and its prevalence is projected to double over the next 20 years. Given its prevalence and heavy healthcare and quality of life burden46, there is a great need for better treatment options. In uncontrolled T2DM, the macrovascular (cardiovascular disease, CVD) and microvascular (eye and kidney) risks are increased. T2DM reduces the lifespan by 10 years60, chiefly due to CVD deaths, which are two-fold higher in men and four-fold higher in women than in those without diabetes6. Further, 40% of new end stage renal disease is accounted for by diabetic nephropathy and diabetes is the major cause of renal transplants 4. Damage to retinal vessels can result in diabetic retinopathy (retinopathy) and macular edema, which are major causes of vision loss in Western Nations 2, 3. The cost of medical care for those with diabetes in Western Nations is 2-3 times higher than those without diabetes, and has doubled over the last decade 286, 287, largely related to CVD. To reduce the risk of these complications, there is a continued focus on controlling elevated blood glucose levels through both lifestyle and pharmaceutical means. Prospective cohort studies and large clinical trials have demonstrated that good glycemic control in diabetes is associated with a reduced risk of microvascular complications 63-68. However, the results of 3 large randomized trials published in 2008 (ACCORD, ADVANCE and VADT)69-71 failed to show significant CVD benefit for improved glycemic control over a 3-5 year period. At the same time, concern about the cardiovascular safety of rosiglitazone and other anti-diabetic medications, led the U.S. Food and Drug Administration (FDA) to require demonstration of the cardiovascular safety of all new anti-diabetic agents 72. Longer term follow up of some of these trials (UKPDS, VADT) 11, 12, as well as the recently published EMPA REG OUTCOME study 73 with the SGLT2 inhibitor, empagliflozin, have demonstrated CVD benefit. Acarbose has shown promise in reducing CVD and incident hypertension 23 when assessed as a secondary outcome in a large randomized controlled trial of participants with prediabetes and a larger CVD study with acarbose in patients with diabetes is underway. Acarbose converts dietary carbohydrate into a slow release or low glycemic index (GI) food by inhibiting pancreatic amylase and small intestinal brush border sucrase-isomaltase. Low GI foods, although recommended for diabetes control by many diabetes agencies 66-68, 187, have not been tested specifically on vascular outcomes despite cohort studies suggesting that low GI diets, especially in women, are associated with reduced CVD 21. Additionally, a randomized trial, the PREDIMED study, that reduced the GI and the GL of the
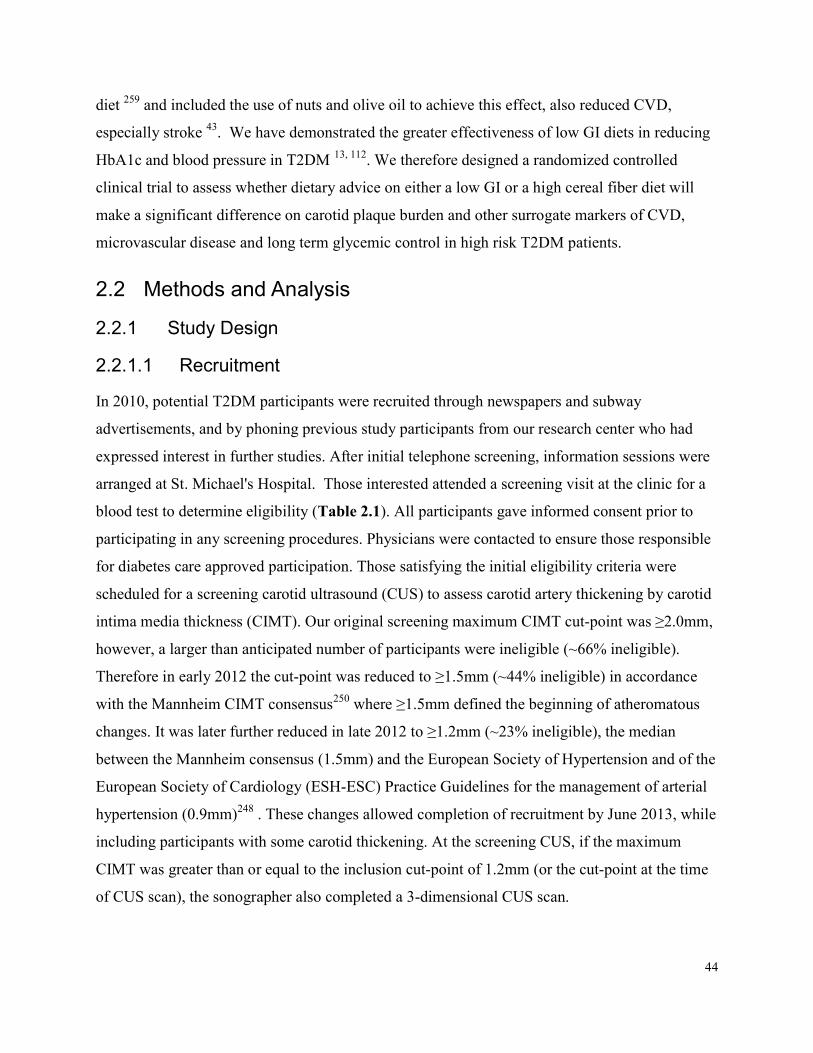
44
diet 259 and included the use of nuts and olive oil to achieve this effect, also reduced CVD, especially stroke 43. We have demonstrated the greater effectiveness of low GI diets in reducing HbA1c and blood pressure in T2DM 13, 112. We therefore designed a randomized controlled clinical trial to assess whether dietary advice on either a low GI or a high cereal fiber diet will make a significant difference on carotid plaque burden and other surrogate markers of CVD, microvascular disease and long term glycemic control in high risk T2DM patients.
2.2 Methods and Analysis 2.2.1 Study Design 2.2.1.1 Recruitment In 2010, potential T2DM participants were recruited through newspapers and subway advertisements, and by phoning previous study participants from our research center who had expressed interest in further studies. After initial telephone screening, information sessions were arranged at St. Michael's Hospital. Those interested attended a screening visit at the clinic for a blood test to determine eligibility (Table 2.1). All participants gave informed consent prior to participating in any screening procedures. Physicians were contacted to ensure those responsible for diabetes care approved participation. Those satisfying the initial eligibility criteria were scheduled for a screening carotid ultrasound (CUS) to assess carotid artery thickening by carotid intima media thickness (CIMT). Our original screening maximum CIMT cut-point was ≥2.0mm, however, a larger than anticipated number of participants were ineligible (~66% ineligible). Therefore in early 2012 the cut-point was reduced to ≥1.5mm (~44% ineligible) in accordance with the Mannheim CIMT consensus250 where ≥1.5mm defined the beginning of atheromatous changes. It was later further reduced in late 2012 to ≥1.2mm (~23% ineligible), the median between the Mannheim consensus (1.5mm) and the European Society of Hypertension and of the European Society of Cardiology (ESH-ESC) Practice Guidelines for the management of arterial hypertension (0.9mm)248 . These changes allowed completion of recruitment by June 2013, while including participants with some carotid thickening. At the screening CUS, if the maximum CIMT was greater than or equal to the inclusion cut-point of 1.2mm (or the cut-point at the time of CUS scan), the sonographer also completed a 3-dimensional CUS scan.
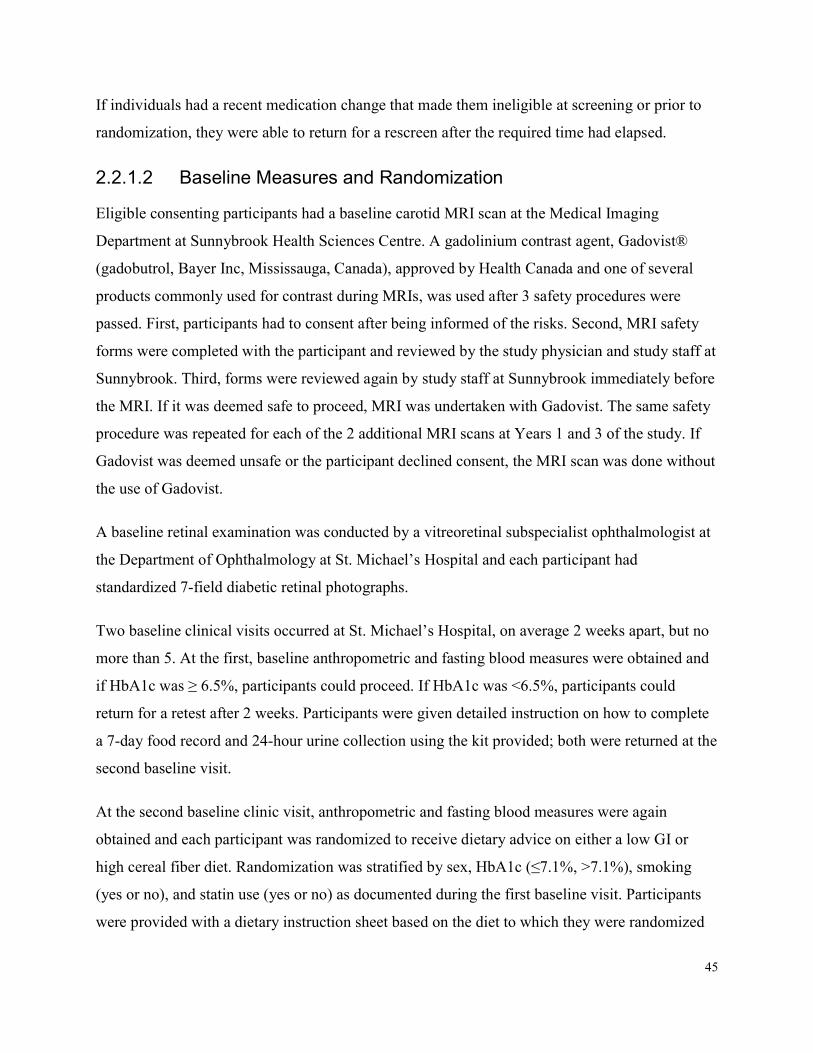
45
If individuals had a recent medication change that made them ineligible at screening or prior to randomization, they were able to return for a rescreen after the required time had elapsed.
2.2.1.2 Baseline Measures and Randomization Eligible consenting participants had a baseline carotid MRI scan at the Medical Imaging Department at Sunnybrook Health Sciences Centre. A gadolinium contrast agent, Gadovist® (gadobutrol, Bayer Inc, Mississauga, Canada), approved by Health Canada and one of several products commonly used for contrast during MRIs, was used after 3 safety procedures were passed. First, participants had to consent after being informed of the risks. Second, MRI safety forms were completed with the participant and reviewed by the study physician and study staff at Sunnybrook. Third, forms were reviewed again by study staff at Sunnybrook immediately before the MRI. If it was deemed safe to proceed, MRI was undertaken with Gadovist. The same safety procedure was repeated for each of the 2 additional MRI scans at Years 1 and 3 of the study. If Gadovist was deemed unsafe or the participant declined consent, the MRI scan was done without the use of Gadovist. A baseline retinal examination was conducted by a vitreoretinal subspecialist ophthalmologist at the Department of Ophthalmology at St. Michael’s Hospital and each participant had standardized 7-field diabetic retinal photographs. Two baseline clinical visits occurred at St. Michael’s Hospital, on average 2 weeks apart, but no more than 5. At the first, baseline anthropometric and fasting blood measures were obtained and if HbA1c was ≥ 6.5%, participants could proceed. If HbA1c was <6.5%, participants could return for a retest after 2 weeks. Participants were given detailed instruction on how to complete a 7-day food record and 24-hour urine collection using the kit provided; both were returned at the second baseline visit. At the second baseline clinic visit, anthropometric and fasting blood measures were again obtained and each participant was randomized to receive dietary advice on either a low GI or high cereal fiber diet. Randomization was stratified by sex, HbA1c (≤7.1%, >7.1%), smoking (yes or no), and statin use (yes or no) as documented during the first baseline visit. Participants were provided with a dietary instruction sheet based on the diet to which they were randomized
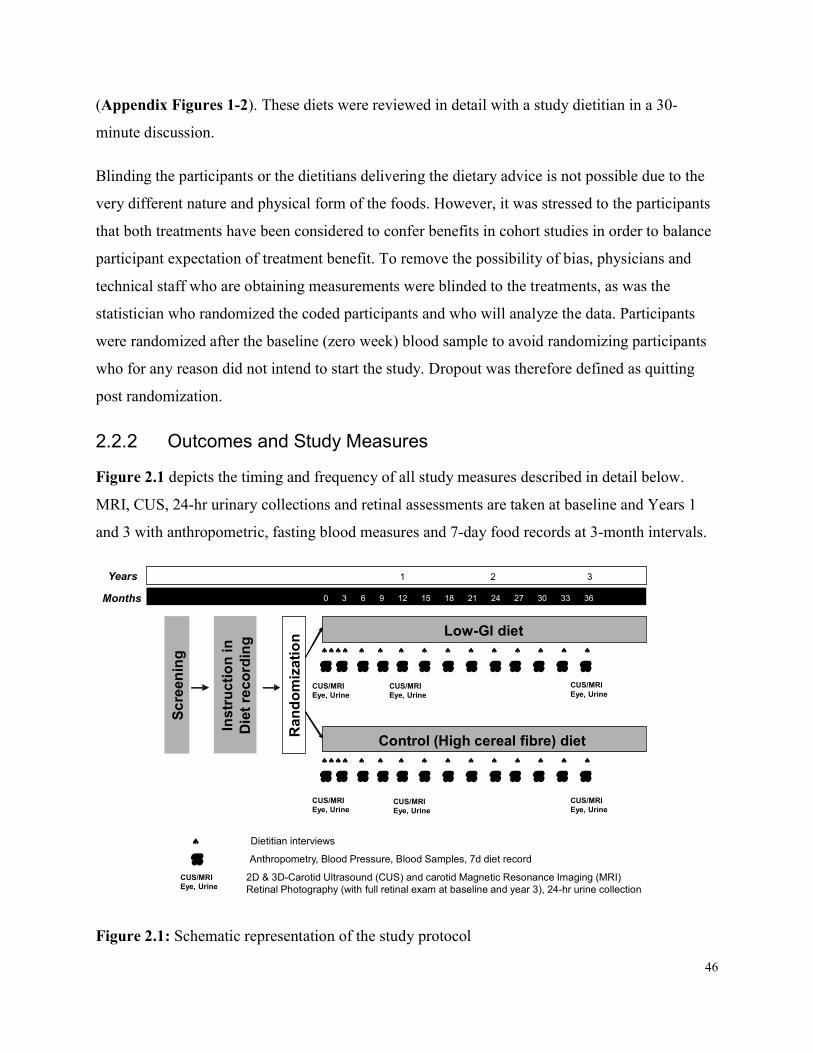
46
(Appendix Figures 1-2). These diets were reviewed in detail with a study dietitian in a 30-minute discussion. Blinding the participants or the dietitians delivering the dietary advice is not possible due to the very different nature and physical form of the foods. However, it was stressed to the participants that both treatments have been considered to confer benefits in cohort studies in order to balance participant expectation of treatment benefit. To remove the possibility of bias, physicians and technical staff who are obtaining measurements were blinded to the treatments, as was the statistician who randomized the coded participants and who will analyze the data. Participants were randomized after the baseline (zero week) blood sample to avoid randomizing participants who for any reason did not intend to start the study. Dropout was therefore defined as quitting post randomization.
2.2.2 Outcomes and Study Measures Figure 2.1 depicts the timing and frequency of all study measures described in detail below. MRI, CUS, 24-hr urinary collections and retinal assessments are taken at baseline and Years 1 and 3 with anthropometric, fasting blood measures and 7-day food records at 3-month intervals. YearsMonths
Anthropometry, Blood Pressure, Blood Samples, 7d diet record
0 3 6 9 12 15 18 21 24 27 30 33 36 1 2 3
Low-GI diet
Control (High cereal fibre) diet
CUS/MRIEye, Urine
CUS/MRIEye, Urine
CUS/MRIEye, Urine
Rand
omiza
tion
CUS/MRIEye, Urine
2D & 3D-Carotid Ultrasound (CUS) and carotid Magnetic Resonance Imaging (MRI)Retinal Photography (with full retinal exam at baseline and year 3), 24-hr urine collection
Instru
ction
in
Diet re
cordi
ng
CUS/MRIEye, Urine
CUS/MRIEye, Urine
CUS/MRIEye, Urine
Dietitian interviews
Scree
ning
p
pp p p p p p p p p p p p
pp p p p p p p p p p p p
Figure 2.1: Schematic representation of the study protocol
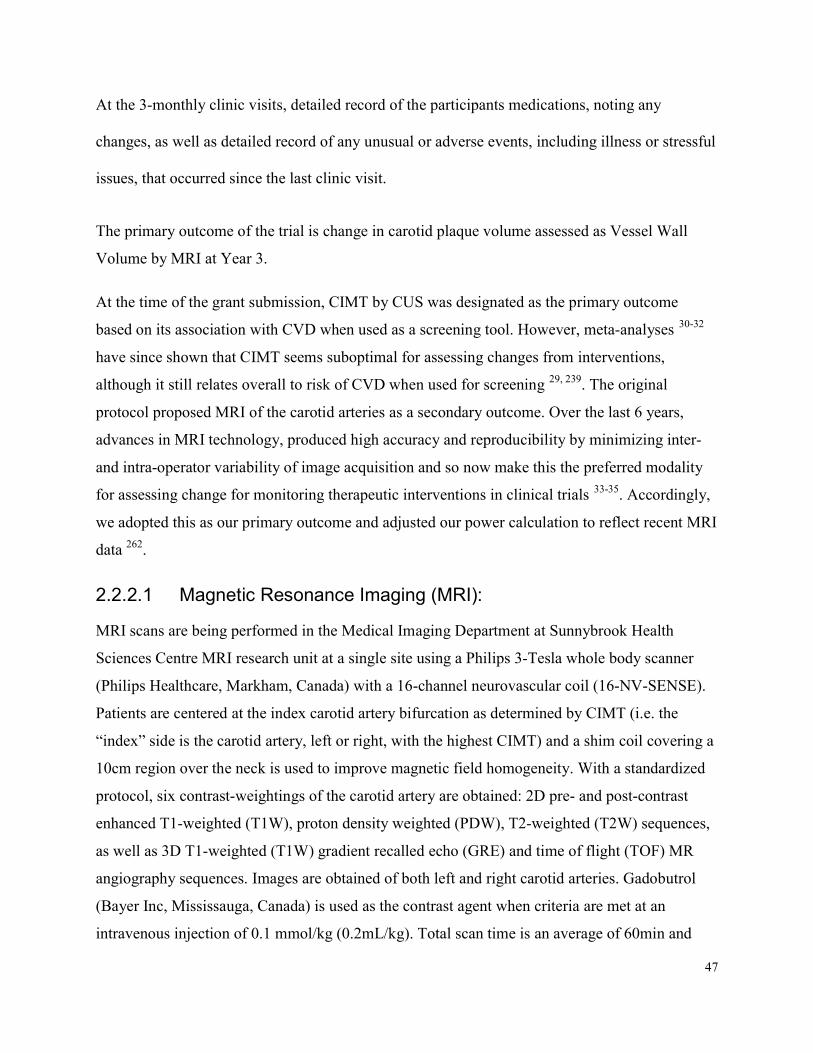
47
At the 3-monthly clinic visits, detailed record of the participants medications, noting any changes, as well as detailed record of any unusual or adverse events, including illness or stressful issues, that occurred since the last clinic visit.
The primary outcome of the trial is change in carotid plaque volume assessed as Vessel Wall Volume by MRI at Year 3. At the time of the grant submission, CIMT by CUS was designated as the primary outcome based on its association with CVD when used as a screening tool. However, meta-analyses 30-32 have since shown that CIMT seems suboptimal for assessing changes from interventions, although it still relates overall to risk of CVD when used for screening 29, 239. The original protocol proposed MRI of the carotid arteries as a secondary outcome. Over the last 6 years, advances in MRI technology, produced high accuracy and reproducibility by minimizing inter- and intra-operator variability of image acquisition and so now make this the preferred modality for assessing change for monitoring therapeutic interventions in clinical trials 33-35. Accordingly, we adopted this as our primary outcome and adjusted our power calculation to reflect recent MRI data 262.
2.2.2.1 Magnetic Resonance Imaging (MRI): MRI scans are being performed in the Medical Imaging Department at Sunnybrook Health Sciences Centre MRI research unit at a single site using a Philips 3-Tesla whole body scanner (Philips Healthcare, Markham, Canada) with a 16-channel neurovascular coil (16-NV-SENSE). Patients are centered at the index carotid artery bifurcation as determined by CIMT (i.e. the “index” side is the carotid artery, left or right, with the highest CIMT) and a shim coil covering a 10cm region over the neck is used to improve magnetic field homogeneity. With a standardized protocol, six contrast-weightings of the carotid artery are obtained: 2D pre- and post-contrast enhanced T1-weighted (T1W), proton density weighted (PDW), T2-weighted (T2W) sequences, as well as 3D T1-weighted (T1W) gradient recalled echo (GRE) and time of flight (TOF) MR angiography sequences. Images are obtained of both left and right carotid arteries. Gadobutrol (Bayer Inc, Mississauga, Canada) is used as the contrast agent when criteria are met at an intravenous injection of 0.1 mmol/kg (0.2mL/kg). Total scan time is an average of 60min and
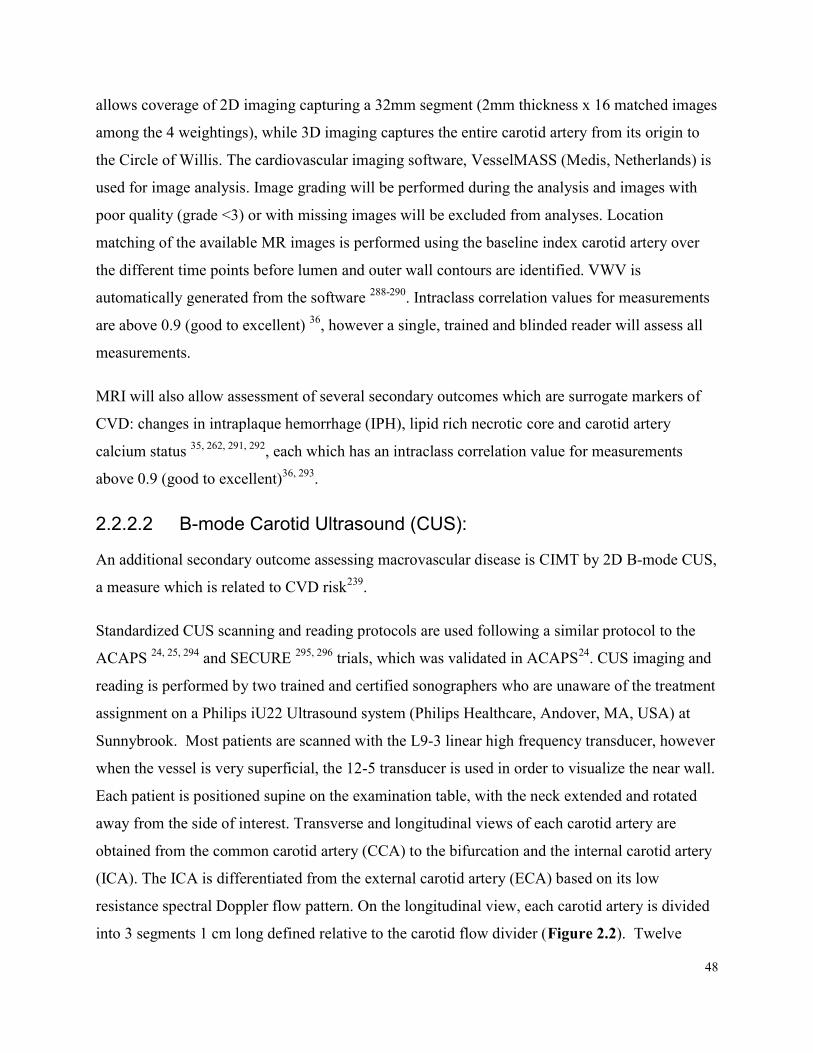
48
allows coverage of 2D imaging capturing a 32mm segment (2mm thickness x 16 matched images among the 4 weightings), while 3D imaging captures the entire carotid artery from its origin to the Circle of Willis. The cardiovascular imaging software, VesselMASS (Medis, Netherlands) is used for image analysis. Image grading will be performed during the analysis and images with poor quality (grade <3) or with missing images will be excluded from analyses. Location matching of the available MR images is performed using the baseline index carotid artery over the different time points before lumen and outer wall contours are identified. VWV is automatically generated from the software 288-290. Intraclass correlation values for measurements are above 0.9 (good to excellent) 36, however a single, trained and blinded reader will assess all measurements. MRI will also allow assessment of several secondary outcomes which are surrogate markers of CVD: changes in intraplaque hemorrhage (IPH), lipid rich necrotic core and carotid artery calcium status 35, 262, 291, 292, each which has an intraclass correlation value for measurements above 0.9 (good to excellent)36, 293.
2.2.2.2 B-mode Carotid Ultrasound (CUS): An additional secondary outcome assessing macrovascular disease is CIMT by 2D B-mode CUS, a measure which is related to CVD risk239. Standardized CUS scanning and reading protocols are used following a similar protocol to the ACAPS 24, 25, 294 and SECURE 295, 296 trials, which was validated in ACAPS24. CUS imaging and reading is performed by two trained and certified sonographers who are unaware of the treatment assignment on a Philips iU22 Ultrasound system (Philips Healthcare, Andover, MA, USA) at Sunnybrook. Most patients are scanned with the L9-3 linear high frequency transducer, however when the vessel is very superficial, the 12-5 transducer is used in order to visualize the near wall. Each patient is positioned supine on the examination table, with the neck extended and rotated away from the side of interest. Transverse and longitudinal views of each carotid artery are obtained from the common carotid artery (CCA) to the bifurcation and the internal carotid artery (ICA). The ICA is differentiated from the external carotid artery (ECA) based on its low resistance spectral Doppler flow pattern. On the longitudinal view, each carotid artery is divided into 3 segments 1 cm long defined relative to the carotid flow divider (Figure 2.2). Twelve
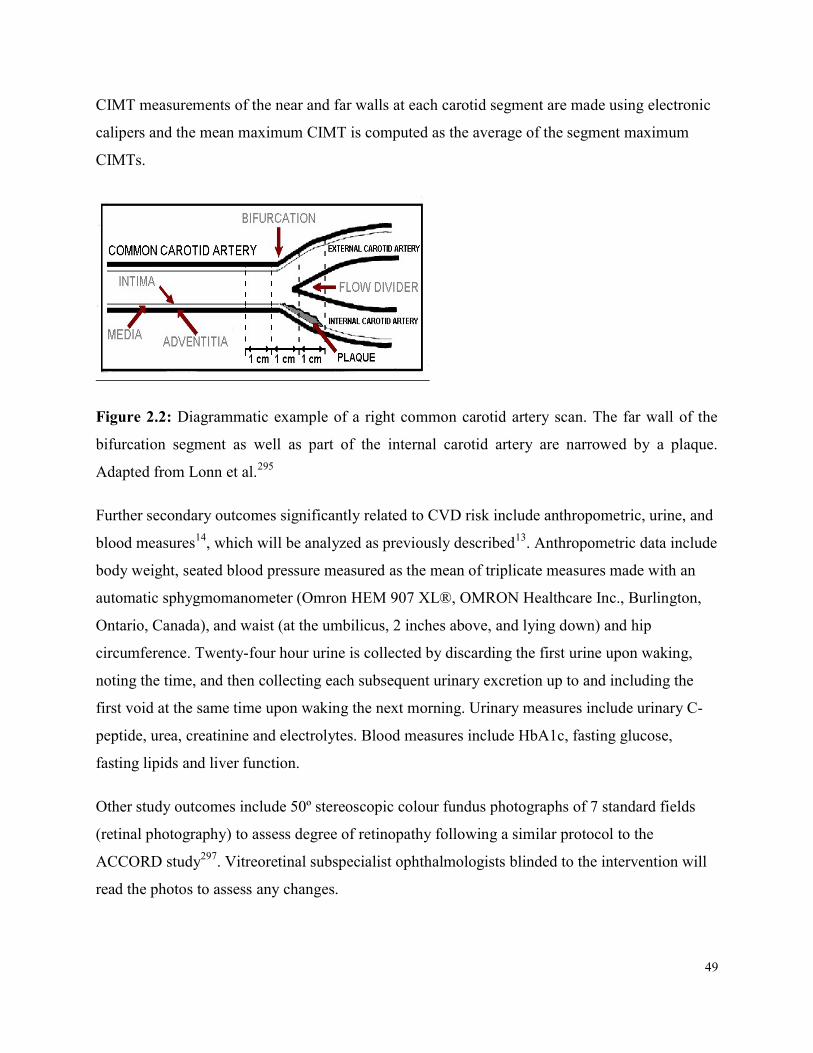
49
CIMT measurements of the near and far walls at each carotid segment are made using electronic calipers and the mean maximum CIMT is computed as the average of the segment maximum CIMTs.
Figure 2.2: Diagrammatic example of a right common carotid artery scan. The far wall of the bifurcation segment as well as part of the internal carotid artery are narrowed by a plaque. Adapted from Lonn et al.295
Further secondary outcomes significantly related to CVD risk include anthropometric, urine, and blood measures14, which will be analyzed as previously described13. Anthropometric data include body weight, seated blood pressure measured as the mean of triplicate measures made with an automatic sphygmomanometer (Omron HEM 907 XL®, OMRON Healthcare Inc., Burlington, Ontario, Canada), and waist (at the umbilicus, 2 inches above, and lying down) and hip circumference. Twenty-four hour urine is collected by discarding the first urine upon waking, noting the time, and then collecting each subsequent urinary excretion up to and including the first void at the same time upon waking the next morning. Urinary measures include urinary C-peptide, urea, creatinine and electrolytes. Blood measures include HbA1c, fasting glucose, fasting lipids and liver function. Other study outcomes include 50º stereoscopic colour fundus photographs of 7 standard fields (retinal photography) to assess degree of retinopathy following a similar protocol to the ACCORD study297. Vitreoretinal subspecialist ophthalmologists blinded to the intervention will read the photos to assess any changes.
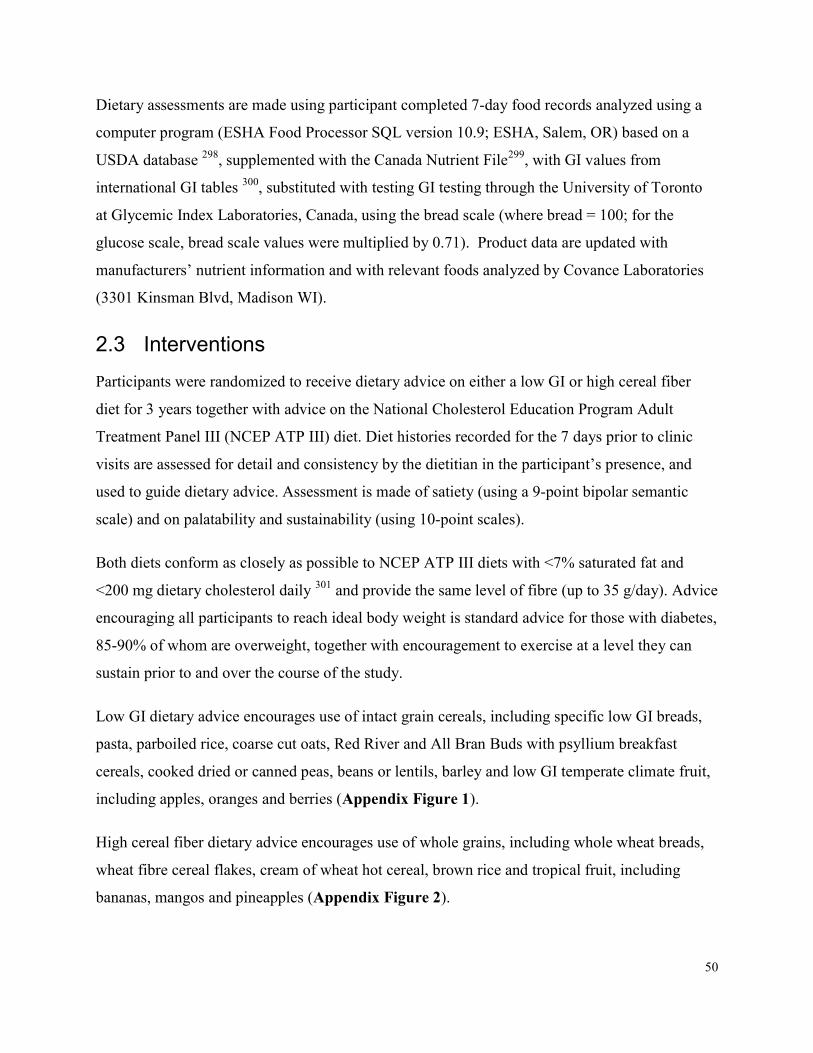
50
Dietary assessments are made using participant completed 7-day food records analyzed using a computer program (ESHA Food Processor SQL version 10.9; ESHA, Salem, OR) based on a USDA database 298, supplemented with the Canada Nutrient File299, with GI values from international GI tables 300, substituted with testing GI testing through the University of Toronto at Glycemic Index Laboratories, Canada, using the bread scale (where bread = 100; for the glucose scale, bread scale values were multiplied by 0.71). Product data are updated with manufacturers’ nutrient information and with relevant foods analyzed by Covance Laboratories (3301 Kinsman Blvd, Madison WI).
2.3 Interventions Participants were randomized to receive dietary advice on either a low GI or high cereal fiber diet for 3 years together with advice on the National Cholesterol Education Program Adult Treatment Panel III (NCEP ATP III) diet. Diet histories recorded for the 7 days prior to clinic visits are assessed for detail and consistency by the dietitian in the participant’s presence, and used to guide dietary advice. Assessment is made of satiety (using a 9-point bipolar semantic scale) and on palatability and sustainability (using 10-point scales). Both diets conform as closely as possible to NCEP ATP III diets with <7% saturated fat and <200 mg dietary cholesterol daily 301 and provide the same level of fibre (up to 35 g/day). Advice encouraging all participants to reach ideal body weight is standard advice for those with diabetes, 85-90% of whom are overweight, together with encouragement to exercise at a level they can sustain prior to and over the course of the study. Low GI dietary advice encourages use of intact grain cereals, including specific low GI breads, pasta, parboiled rice, coarse cut oats, Red River and All Bran Buds with psyllium breakfast cereals, cooked dried or canned peas, beans or lentils, barley and low GI temperate climate fruit, including apples, oranges and berries (Appendix Figure 1). High cereal fiber dietary advice encourages use of whole grains, including whole wheat breads, wheat fibre cereal flakes, cream of wheat hot cereal, brown rice and tropical fruit, including bananas, mangos and pineapples (Appendix Figure 2).
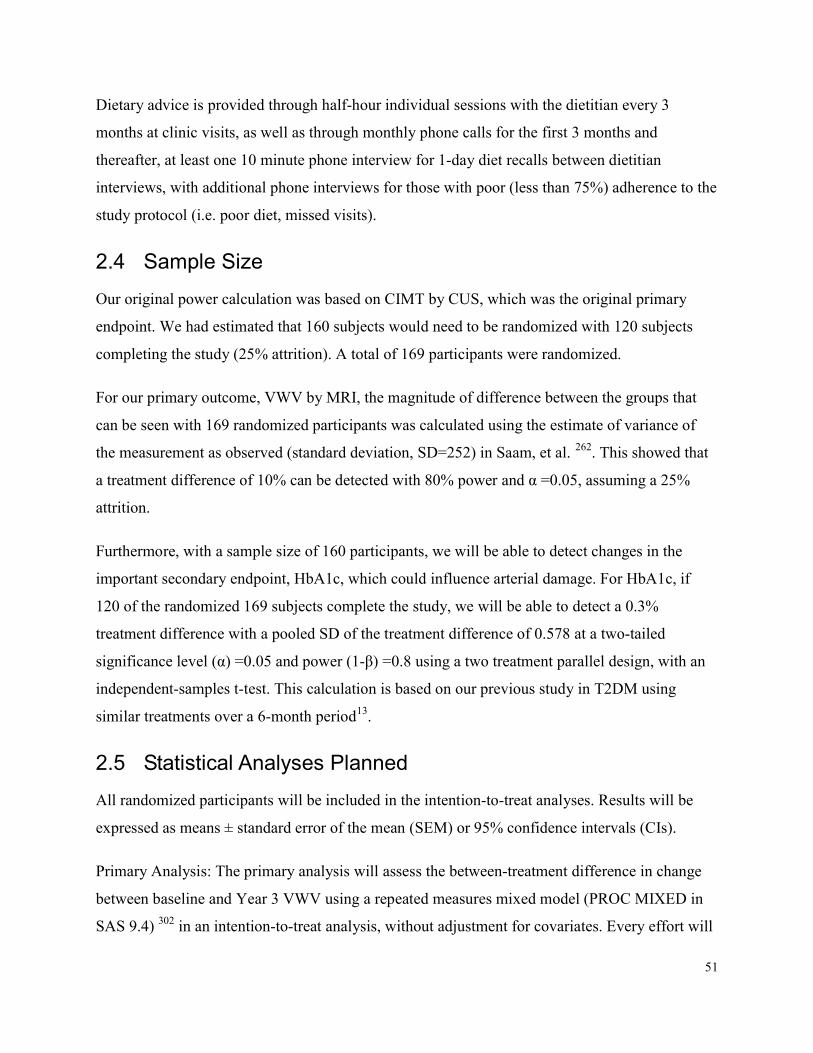
51
Dietary advice is provided through half-hour individual sessions with the dietitian every 3 months at clinic visits, as well as through monthly phone calls for the first 3 months and thereafter, at least one 10 minute phone interview for 1-day diet recalls between dietitian interviews, with additional phone interviews for those with poor (less than 75%) adherence to the study protocol (i.e. poor diet, missed visits).
2.4 Sample Size Our original power calculation was based on CIMT by CUS, which was the original primary endpoint. We had estimated that 160 subjects would need to be randomized with 120 subjects completing the study (25% attrition). A total of 169 participants were randomized. For our primary outcome, VWV by MRI, the magnitude of difference between the groups that can be seen with 169 randomized participants was calculated using the estimate of variance of the measurement as observed (standard deviation, SD=252) in Saam, et al. 262. This showed that a treatment difference of 10% can be detected with 80% power and α =0.05, assuming a 25% attrition. Furthermore, with a sample size of 160 participants, we will be able to detect changes in the important secondary endpoint, HbA1c, which could influence arterial damage. For HbA1c, if 120 of the randomized 169 subjects complete the study, we will be able to detect a 0.3% treatment difference with a pooled SD of the treatment difference of 0.578 at a two-tailed significance level (α) =0.05 and power (1-β) =0.8 using a two treatment parallel design, with an independent-samples t-test. This calculation is based on our previous study in T2DM using similar treatments over a 6-month period13.
2.5 Statistical Analyses Planned All randomized participants will be included in the intention-to-treat analyses. Results will be expressed as means ± standard error of the mean (SEM) or 95% confidence intervals (CIs). Primary Analysis: The primary analysis will assess the between-treatment difference in change between baseline and Year 3 VWV using a repeated measures mixed model (PROC MIXED in SAS 9.4) 302 in an intention-to-treat analysis, without adjustment for covariates. Every effort will
52
be made to obtain final vascular imaging and blood samples from those who do not provide these in clinic due to attrition or loss-to-follow up. Sensitivity Analysis: Robustness will be assessed of our primary finding to model assumptions: 1) To address the impact of potential imbalance in prognostic factors, we will repeat the primary analysis using mixed models with age, sex, duration of diabetes, waist circumference, cholesterol medication use, baseline VWV, smoking, hypertension and family history of CVD included in the models. Missing data for covariates will be handled using the missing indicator method; 2) To assess the robustness of our primary analysis of missing data, we will repeat the primary analysis using both completer and per–protocol analyses, and multiple imputations to generate missing data; and 3) To assess the impact of participant-level factors on the primary outcome, we will examine changes in indices of vascular damage separately in a) those who meet HbA1c target versus those with less good glycemic control (e.g. HbA1c ≤ 7 vs. >7% at end of study) and b) those with good compliance, i.e. low GI completers with GI <70 (bread scale) at Years 1 and 3 and high fiber completers with >15g fibre/1000kcal. Exploratory assessment of the significance of between-subgroup changes in the primary outcome will be undertaken with Wald tests of the interaction terms. Exploratory Analyses: We anticipate this study will yield a rich dataset. We have therefore mapped out some exploratory analyses to assess: 1) response trajectories, by comparing treatment slopes across all post-treatment measures, i.e. an assessment of whether Year 1 values differ from Year 3 values; 2) treatment differences in medication use over all post-treatment values; 3) Further analyses will examine causal pathways between diet, metabolic parameters, and measures of arterial function using methods of path analysis and structural equation modeling, as appropriate.
2.6 Ethics and Dissemination The protocol and consent forms were approved by the research ethics board of St. Michael’s Hospital. The study was registered with clinicaltrials.gov (identifier: NCT01063374).

53
2.6.1 Participant Safety Privacy will be enhanced by data de-identification. Databases with personal health information will be password protected. Paper forms with personal health information (e.g. participant charts) will be kept in locked cabinets, in locked rooms, and the department door locked after hours. Electronic files will identify participants only through identification codes. Access to paper and electronic data files is limited to the principal investigator (PI), statisticians, dietitians, students, and data entry personnel working on the project. A separate chart with routine clinical information is maintained for contact with participants' family physicians and will be accessible only to the PI and study staff. A Data Safety Monitoring Board (DSMB) will periodically review (approximately once per year or when safety issues arise) the progress of the trial to oversee participant safety and provide advice on the status and continuation of the overall study. HbA1c is reviewed at each visit and as necessary with one of the physicians of the Safety Committee who are not involved in the day to day running of the trial (Robert Josse, Lawrence Leiter) with participants identified only by code. Participants will be referred to his/her family physician for treatment if HbA1c exceeds the 8.5% threshold on two successive occasions, or if hypoglycemic symptoms associated with low blood glucose levels occur. If a participant’s physician considers that a change in dosage or medication is required, a predetermined paradigm will be used, and the Safety Committee notified. Adverse events will be dealt with on a case-by-case basis depending on whether the situation is likely to resolve spontaneously or whether medical intervention is required.
2.7 Discussion and Implications This study will be the first to document the effects of a dietary intervention on measures of macrovascular disease through the detection of changes in carotid VWV as a surrogate measure of CVD, in high-risk patients. We believe this will open the way for other investigators to use vascular MRI in their research and for use in clinical practice as a diagnostic tool and especially for follow up. It is also the longest trial to date to assess the effect of altering the dietary GI and
54
will also provide invaluable data on the natural history of vascular disease. In view of the global rise in the incidence of T2DM and the associated vascular complications, including increased CVD risk, therapeutic approaches which address both micro and macrovascular risk factors are now urgently required. At present, diabetes is an immense burden on the healthcare system of Western Nations, projected to continue to increase, and largely related to CVD and microvascular complications 286, 287. A 25% sparing of T2DM microvascular complications would result long term from a 0.9% reduction in HbA1c according to the UKPDS data 303. We achieved a 0.5% reduction in HbA1c in our previous 6-month randomized controlled trial of similar low GI dietary advice in those with T2DM 112, so expect a similar reduction in this investigation. The economic (let alone social) impact of even one third the reduction in HbA1c seen in the UKPDS 303, is likely to be considerable. If low GI diets can be shown to reduce macrovascular disease risk factors in addition to reducing microvascular disease, then results will not only increase the understanding of the role of diet and nutrition in macrovascular disease development in T2DM, but will influence guidelines for the treatment of diabetes, the nature of the products produced by the food industry, and the savings in cost and suffering will be significant.
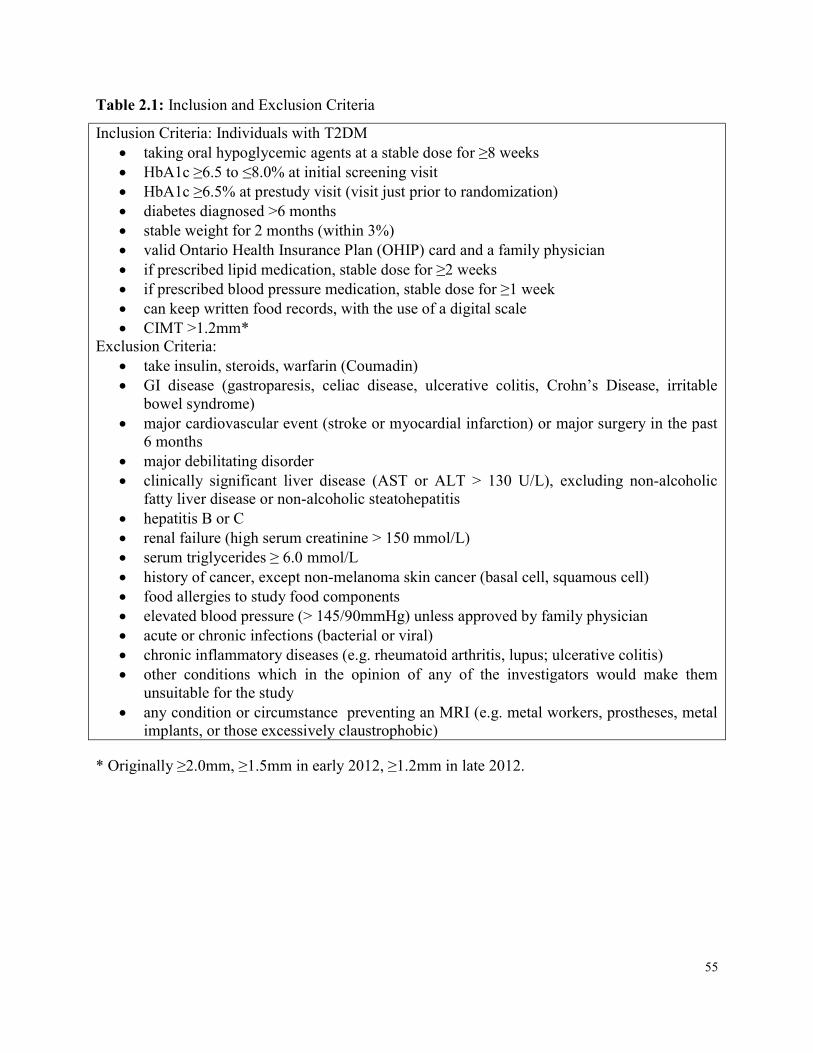
55
Table 2.1: Inclusion and Exclusion Criteria Inclusion Criteria: Individuals with T2DM taking oral hypoglycemic agents at a stable dose for ≥8 weeks HbA1c ≥6.5 to ≤8.0% at initial screening visit HbA1c ≥6.5% at prestudy visit (visit just prior to randomization) diabetes diagnosed >6 months stable weight for 2 months (within 3%) valid Ontario Health Insurance Plan (OHIP) card and a family physician if prescribed lipid medication, stable dose for ≥2 weeks if prescribed blood pressure medication, stable dose for ≥1 week can keep written food records, with the use of a digital scale CIMT >1.2mm* Exclusion Criteria: take insulin, steroids, warfarin (Coumadin) GI disease (gastroparesis, celiac disease, ulcerative colitis, Crohn’s Disease, irritable
bowel syndrome) major cardiovascular event (stroke or myocardial infarction) or major surgery in the past 6 months major debilitating disorder clinically significant liver disease (AST or ALT > 130 U/L), excluding non-alcoholic fatty liver disease or non-alcoholic steatohepatitis hepatitis B or C renal failure (high serum creatinine > 150 mmol/L) serum triglycerides ≥ 6.0 mmol/L history of cancer, except non-melanoma skin cancer (basal cell, squamous cell) food allergies to study food components elevated blood pressure (> 145/90mmHg) unless approved by family physician acute or chronic infections (bacterial or viral) chronic inflammatory diseases (e.g. rheumatoid arthritis, lupus; ulcerative colitis) other conditions which in the opinion of any of the investigators would make them unsuitable for the study any condition or circumstance preventing an MRI (e.g. metal workers, prostheses, metal implants, or those excessively claustrophobic)
* Originally ≥2.0mm, ≥1.5mm in early 2012, ≥1.2mm in late 2012.

56
Chapter 3
Knowledge Gaps, Hypotheses, Aims & Objectives
3 Knowledge Gaps, Hypotheses, Aims & Objectives 3.1 Knowledge Gaps
1. It is unknown whether a low GI diet is associated with carotid plaque levels in those with type 2 diabetes
2. It is unknown whether a low GI diet can be followed successfully long term, what dietary changes are adopted as a result of low GI diet advice, and whether or not the provision of a study food can enhance adherence to a low GI diet
3.2 Hypotheses Overall Hypothesis: Low GI diets are sustainable and will reduce evidence of arterial damage in type 2 diabetes Specific hypotheses:
1. Lower GI diets and greater use of key low GI foods will be associated with lower plaque build-up in the carotid arteries
2. Low GI diet advice in those with type 2 diabetes will be sustainable over 3 years; and the provision of a study food will enhance adherence
3.3 Aims 1. To assess in cross-sectional analyses the associations between GI and its dietary
components on measures of vascular damage and cardiovascular risk factors 2. To assess long term adherence to low GI diet advice in those with type 2 diabetes
participating in a 3-year trial, to assess what dietary changes participants would adopt as
57
a result of low GI diet advice, and whether the provision of a study food enhances adherence
3.4 Objectives 1. Perform cross-sectional analyses of the associations between GI and key low GI foods
and intima media thickness by carotid ultrasound, plaque volume by MRI, and cardiovascular risk factors
2. Analyze how adherence to low GI diets change over 3-years, which components of the low GI diet are being adopted in the long term, and whether provision of free study bread improves adherence to diet advice
58
Chapter 4 Dietary Intake and Carotid Intima Media Thickness in Type 2
Diabetes 4 Abstract
Background: One of the main goals of diabetes management is to reduce the risk of cardiovascular disease (CVD) which is the leading cause of death in those with type 2 diabetes. Carotid ultrasound (CUS) to assess carotid intima media thickness (CIMT) is considered a biomarker of atherosclerosis and related overall to CVD risk. Methods: Baseline data from 325 participants with type 2 diabetes, recruited for 3 randomized controlled trials, were collected in the same way; including CIMT by CUS, dietary intake using 7-day food records, anthropometric measures and fasting serum samples. Multivariate regression models, adjusted for age, sex, smoking, waist circumference, cholesterol medication use and energy intake, using SAS version 9.4 were conducted to assess the relationship between dietary intake and CIMT, as well as anthropometric measures. Dietary variables were energy adjusted and non-normally distributed variables were transformed. Results: CIMT was not significantly associated with GI, however was significantly negatively associated with dietary pulse intake, available carbohydrates, starch, GL and vegetable protein, and was positively associated with total and saturated fat intake, and dairy protein in the multivariate adjusted models. CIMT was also significantly associated positively with age, body weight, systolic blood pressure and mean arterial pressure, total and LDL-cholesterol and calculated CVD risk. GI was not significantly associated with anthropometric or bloodwork measures. Dietary pulse intake was associated with lower body weight, systolic and diastolic blood pressure and mean arterial pressure, and there was a trend for lower total and LDL-cholesterol and calculated CVD risk. Conclusions: Although no association was found between GI and CIMT, dietary pulse intake was significantly associated with lower baseline CIMT, blood pressure and body weight, suggesting a potential role for dietary pulses in reduction in risk of CVD in type 2 diabetes.
59
Saturated fat intake was strongly associated with CIMT and thus warrants further exploration, particularly in light of the recent debate around saturated fat intake and CVD risk.
4.1 Introduction People with type 2 diabetes are at high risk of cardiovascular disease (CVD), which is the leading cause of death in this population 304, 305. Risk assessment through atherosclerosis imaging includes the use of carotid intima media thickness (CIMT) by carotid ultrasound (CUS), which is recommended as a screening tool for assessing CVD risk by various CVD prevention clinical practice guidelines 246, 306. CIMT is considered a biomarker of atherosclerosis and is associated with overall CVD risk, particularly in those with type 2 diabetes 243, 307, 308. Observational studies have recently demonstrated carotid atherosclerosis, assessed by CIMT, to be associated with glycemic status 309-311 and intervention trials with anti-diabetic agents have demonstrated reductions in CIMT both in those with and without diabetes 253, 254, 312, 313. Some of these anti-diabetic agents exert their effect post-prandially, that is, at mealtime they reduce the postprandial blood glucose peak, including insulin secretagogues (nateglinide and repaglinide) and the alpha-glucosidase inhibitor acarbose, for which trials have not only demonstrated reductions in CIMT but also identified markers of glycemia (HbA1c and glucose peak) as determinants of changes in CIMT 254, 314-316. Low glycemic index (GI) foods result in lower post-prandial glucose responses compared to higher GI foods, thus low GI diets may have potential for benefit on CIMT, however have not yet been explored. Dietary patterns assessed in various countries globally have been demonstrated to be associated with improved CVD risk 317, and specifically, foods which affect glycemia, such as dietary pulses which are particularly low GI foods, have demonstrated reduced CVD risk318-320. A systematic review and meta-analysis of observational studies demonstrated an inverse association between dietary pulse intake and ischemic heart disease risk321, and others including those involving randomized controlled trials demonstrated improvements in CVD risk factors such as glycemia 13, 223, waist circumference 122, blood pressure 13, 322, cholesterol 323, 324, and inflammatory markers 325.
60
The objective of the present study was to determine the association between GI, dietary pulses and other dietary variables and risk of CVD as assessed by CIMT using CUS in a population with type 2 diabetes.
4.2 Methods 4.2.1 Participants Details of the study protocol can be found in Chapter 2. From February 2010 to June 2013 participants with type 2 diabetes were recruited for a 3-year dietary intervention study to assess the effect of a low GI diet on carotid plaque burden and other surrogate markers of CVD, microvascular disease and long term glycemic control. Inclusion criteria included a diagnosis of type 2 diabetes greater than 6 months ago, an HbA1c between 6.5% and 8.0% at screening, taking oral hypoglycemic agents at a stable dose for ≥8 weeks, not taking insulin, free from any gastrointestinal disease, clinically significant liver disease or history of cancer, except non-melanoma skin cancer, and had not had a major cardiovascular event or major surgery in the past 6 months. Participants also had a CUS performed by one of two trained and certified sonographers on a Philips iU22 Ultrasound system (Philips Healthcare, Andover, MA, USA) at the Medical Imaging Department at Sunnybrook Health Sciences Centre. CIMT was assessed and as part of screening criteria, only those participants with CIMT≥1.2mm were eligible. However, for those who did not meet this CIMT cut-point, they had the option to participate in one of two other acute trials13, 284. Using baseline data from these 3 trials which had the same inclusion criteria (with the exception of one trial with the additional criteria of a maximum CIMT ≥1.2mm, as described Chapter 2), including 7-day food records, anthropometric measures and fasting blood samples, as well as the CUS data, which were all collected in the same way, this cross-sectional study was conducted on 325 study participants (Table 4.1). Briefly, one of the two other acute studies, published in Archives of Internal Medicine 13, was a 3-month randomized parallel study in which participants were given either low GI diet advice with an emphasis on consuming 1 cup of dietary pulses per day, or high cereal fiber diet advice. The second acute study, published in Diabetes Care 284, was a similar 3-month randomized parallel study where participants were given canola or whole wheat bread provided against the same background diet of low GI or high cereal fiber dietary advice, respectively.
61
All 3 studies were approved by the research ethics board of St Michael’s Hospital and written consent was obtained from all participants.
4.2.2 Protocol In this cross-sectional study, data is obtained from baseline measures of study participants and CIMT data obtained from CUS scans completed at the Medical Imaging Department at Sunnybrook Health Sciences Centre MRI research unit which has been described in Chapter 2. One of two trained and certified sonographers performed CIMT measures using a Philips iU22 Ultrasound system (Philips Healthcare, Andover, MA, USA) with standardized CUS scanning and reading protocols 24, 294. CIMT was measured with the subject recumbent, with the neck extended and rotated away from the side of interest. Imaging was performed on both the right and left carotid arteries, with identification of the near wall (closest to the skin surface) and the far wall (farthest from the skin surface) of 3 arterial segments: the proximal 8 mm of the internal carotid artery, the carotid bifurcation beginning at the tip of the flow divider (site of the division of flow between the external carotid artery and internal carotid artery) and extending 8 mm proximally, and the common carotid artery 8 to 16 mm proximal to the flow divider (Figure 2.2 in Chapter 2). The mean value of the 12 maximal CIMT measurements (mean maximum CIMT) is then used as the outcome measure. For participant baseline data, all 3 studies included two baseline clinic visits at the Risk Factor Modification Centre at St. Michael’s Hospital and occurred within one month of each other. At the first, baseline anthropometric and fasting blood measures were obtained. Participants were given detailed instruction on how to complete a 7-day food record which was returned at the next visit. At the second baseline clinic visit, anthropometric and fasting blood measures were again obtained and each participant was randomized to receive either dietary advice on a low GI or high cereal fiber diet. Anthropometric data include body weight, seated blood pressure measured as the mean of triplicate measures made with an automatic sphygmomanometer (Omron HEM 907 XL®, OMRON Healthcare Inc., Burlington, Ontario, Canada), and waist (at the umbilicus, 2 inches above, and lying down) and hip circumference. Blood measures include HbA1c, fasting glucose and fasting lipids.
62
For participants who participated in more than one of the three studies, their first CUS and corresponding baseline study measurements were used in the analyses.
4.2.3 Biochemical and Dietary Analyses The HbA1c value was analyzed within 24 hours using whole blood collected in EDTA Vacutainer tubes (Vacutainer; Becton, Dickinson and Co) in the hospital routine analytical laboratory by a turbidometric inhibition latex immunoassay (TINIA Roche Diagnostics) with a coefficient of variation between assays of 3% to 4%. Blood glucose and serum lipid levels were also measured in the hospital routine analytical laboratory using a Random Access Analyzer and Beckman reagents (SYNCHRON LX Systems; Beckman Coulter), with a coefficient of variation of 1.6% to 2.3% for blood glucose level and 1.3% to 3.0% for total cholesterol, triglycerides, and high-density lipoprotein cholesterol (HDL-C) levels. The low-density lipoprotein cholesterol (LDL-C) level was calculated by the method of Friedewald et al. 326 (LDL-C level = total cholesterol – [(triglycerides/5) X (HDL-C level)]). Dietary assessments using participant completed 7-day food records were analyzed using a computer program (ESHA Food Processor SQL version 10.9; ESHA, Salem, OR) based on a USDA database 298, supplemented with the Canada Nutrient File299, with GI values from international GI tables 300 using the bread scale (where bread = 100; for the glucose scale, bread scale values were multiplied by 0.71). Product data were updated with manufacturers’ nutrient information and relevant foods were analyzed by Covance Laboratories (3301 Kinsman Blvd, Madison WI).
4.2.4 Statistical Analyses Analyses were performed on all baseline study participants who had a CUS scan (n=325). Data are expressed as means ± SD. All analyses were carried out using SAS software, version 9.4 302. Multivariate mixed effects regression models were conducted to assess the association between dietary intake variables and CIMT assessed by CUS. Dietary intake variables were energy adjusted. Analyses were adjusted for age, sex, smoking, use of cholesterol-lowering medication, waist circumference and energy intake. Smoking was defined using 3 categories: current (current smoker or quit within the past year), former (quit between 1 and 15 years ago), and non-smoker (never smoked, or quit over 15 years ago) according to the WHO definitions of CHD risk 327.
63
Use of cholesterol-lowering medication was defined as user or non-user based on the baseline visits and waist circumference was the average of the measurements obtained at the 2 baseline visits, measured at the umbilicus. There was one participant missing waist circumference measurements thus he was excluded from any analysis where waist circumference was included. Overall 10 year CVD risk was calculated according to the 1991 Framingham cardiovascular risk equation 328. Ultrasonographer was treated as a random effect throughout analyses. All non-normally distributed variables were transformed according to the Box Cox Model and where lambda was found to be 0, data were log transformed 329. Probability values <0.05 were considered statistically significant. Sensitivity analyses were conducted on the CIMT measures obtained from the far walls, the left versus right carotid arteries, and the highest versus lowest artery.
4.3 Results 4.3.1 CIMT and Baseline Participant Characteristics Characteristics of the 325 study participants are presented in Table 4.1 by quartiles of CIMT and in Table 4.2 for all 325 participants. The mean age for all participants was 60.3±8.7 years, 56% were male, the mean BMI was 30.3±5.7kg/m2, and the mean waist circumference was 105.5±15.0cm in females and 104.1±12.3cm in males. 72.3% were taking cholesterol- lowering medications, 5.2% were current smokers, 10.2% former smokers, and 84.6% non-smokers. The mean maximum CIMT was 1.0±0.3mm and maximum CIMT was 2.0±0.9mm. CIMT and dietary pulse, fiber and vegetable, red meat and dairy protein intake were non-normally distributed, therefore were transformed using Box Cox transformations329. The lambda for CIMT was -1, thus, (IMT^-1 -1) /-1 was used to transform CIMT, and that for these dietary variables was 0, thus the natural logarithm was used to transform these data. CIMT was significantly positively associated with age (β=0.011, p<0.001), body weight (β=0.003, p=0.028), systolic blood pressure (β=0.004, p<0.001), mean arterial pressure (β=0.005, p=0.002), pulse pressure (β=0.004, p<0.001), pulse as beats per minute (β=-0.003, p=0.040), total cholesterol (β=0.032, p=0.019), non-HDL-C (β=0.041, p=0.005), LDL-C (β=0.040, p=0.014), total:HDL-C ratio (β=0.035, p=0.007), FRS (β=0.007, p<0.001) and smoking (β= -0.089, p=0.007) in the fully adjusted models (adjusted for age, sex, smoking, use
64
of cholesterol-lowering medication, waist circumference and energy intake), and a non-significant trend for an association with waist-to-hip ratio (β=0.537, p=0.063) (Table 4.2).
4.3.2 CIMT and Baseline Dietary Intake Table 4.3 presents the dietary intake of study participants by quartiles of CIMT. The associations between CIMT and dietary variables using multivariate regression models are presented in Table 4.4. No relation was found between CIMT and GI (β= -0.002, p=0.370). CIMT was significantly associated negatively with log pulse intake (β= -0.021, p=0.004). CIMT was also significantly associated negatively with log vegetable protein (β= -0.130, p=0.023), available carbohydrate (β= -0.004, p=0.007), glycemic load (GL) (β= -0.001, p=0.007) and starch (β= -0.005, p=0.008), and positively with saturated fat (β=0.015, p=0.001), and total fat (β=0.005, p=0.006), as well as log dairy protein (β=0.079, p=0.005) in fully adjusted models, with a trend for a negative association with log total dietary fiber (β= -0.068, p=0.088) and positive for log red meat protein (β=0.033, p=0.068). Sensitivity analyses revealed consistent results. When saturated fat was added to the full models of either available carbohydrate or starch, only saturated fat remained significant (p=0.032 and p=0.021, respectively). Similar results occurred for log red meat protein and log dairy protein. When all protein sources were added to the model, log dairy protein was the only significant contributor (p=0.011) and in stepwise regression, both log red meat protein and log dairy protein remained significant (Table 4.5). When animal versus vegetable protein was added to the model neither were significant (p=0.468 and p=0.154, respectively). GL is a calculation of GI and available carbohydrate, therefore available carbohydrate was added to the model of GL and CIMT, in which GL was then no longer significant (p=0.497). To explore starch, each major source of starch in the diet was assessed, including potato, pasta, rice, bread and pulse, where crude calculations of grams of starch coming from each carbohydrate source was used in analyses. To calculate starch, the following foods were used: boiled white potato, cooked macaroni for pasta, long grain rice, white and whole wheat bread, and the average starch from 3 beans (chickpea, black bean, and kidney bean) and lentils. Starch from each source was expressed as percentage calories (%kcal) for each variable in the models.
65
All other sources were pooled (other starch). All starch sources were added to the fully adjusted model and then using a stepwise regression, one starch source was removed at a time based on least significant contribution to the model. Pulse starch was the only remaining significant contributor to the association with CIMT in both models (p=0.040 and p=0.004, respectively) (Table 4.6). Interestingly, CIMT was negatively associated with log rice (p=0.035) and positively with log potato (p=0.041) intake. However, log rice intake was significantly correlated with log pulse intake (r=0.257, p<0.001) and log potato intake was significantly correlated with log red meat protein intake (r=0.234, p<0.001). When both pulses and rice were included in the fully adjusted model together, dietary pulse intake was more strongly associated with CIMT (p=0.022 versus rice, p=0.125), thus pulses was independent of rice and therefore rice was significantly associated with CIMT possibly because of the strong correlation with dietary pulses. When red meat protein and potatoes were both included in the fully adjusted model, neither were significant (p=0.078 for potato and p=0.187 for red meat protein). When dietary fiber was categorized based on recommended intake, <25g/d, 25-35g/d and >35g/d, CIMT was lower with increasing fiber intake (1.04mm, 1.02mm, 0.95mm, respectively). When dietary fiber was entered into the full model by these categories without calories, it was significant (p=0.025) (Table 4.7). However when calories was included in the full model, significance was lost (p=0.052), suggesting fiber may affect caloric intake, supported by a strong correlation between dietary fiber and total calories (r= -0.203, p<0.001). GI was not significantly associated with anthropometric or bloodwork measures. Dietary pulse intake was significantly associated with lower body weight (β= -0.029, p=0.012), systolic (β= -0.016, p=0.044) and diastolic (β= -0.027, p=0.023) blood pressure, and mean arterial pressure (β= -0.027, p=0.017) in fully adjusted models, and with BMI (β= -0.031, p=0.049) in the age adjusted model. Dietary pulse intake was not significantly associated with cholesterol in the overall group. However, in those not taking cholesterol-lowering medication, when comparing pulse consumers to non-consumers, consumers of pulses had significantly lower LDL-cholesterol levels (n=90, 3.03±0.12 vs 2.75±0.10mmol/L, p=0.027).
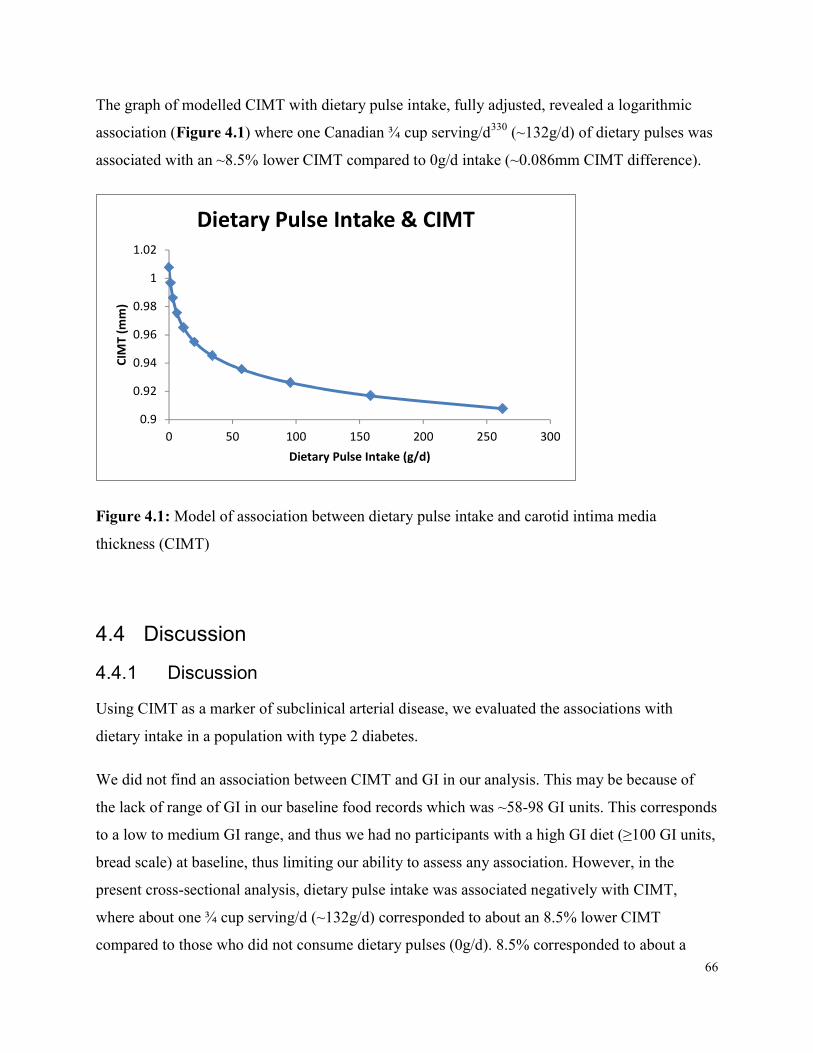
66
The graph of modelled CIMT with dietary pulse intake, fully adjusted, revealed a logarithmic association (Figure 4.1) where one Canadian ¾ cup serving/d330 (~132g/d) of dietary pulses was associated with an ~8.5% lower CIMT compared to 0g/d intake (~0.086mm CIMT difference).
0.90.920.940.960.98
11.02
0 50 100 150 200 250 300
CIMT (m
m)
Dietary Pulse Intake (g/d)
Dietary Pulse Intake & CIMT
Figure 4.1: Model of association between dietary pulse intake and carotid intima media thickness (CIMT)
4.4 Discussion 4.4.1 Discussion Using CIMT as a marker of subclinical arterial disease, we evaluated the associations with dietary intake in a population with type 2 diabetes. We did not find an association between CIMT and GI in our analysis. This may be because of the lack of range of GI in our baseline food records which was ~58-98 GI units. This corresponds to a low to medium GI range, and thus we had no participants with a high GI diet (≥100 GI units, bread scale) at baseline, thus limiting our ability to assess any association. However, in the present cross-sectional analysis, dietary pulse intake was associated negatively with CIMT, where about one ¾ cup serving/d (~132g/d) corresponded to about an 8.5% lower CIMT compared to those who did not consume dietary pulses (0g/d). 8.5% corresponded to about a
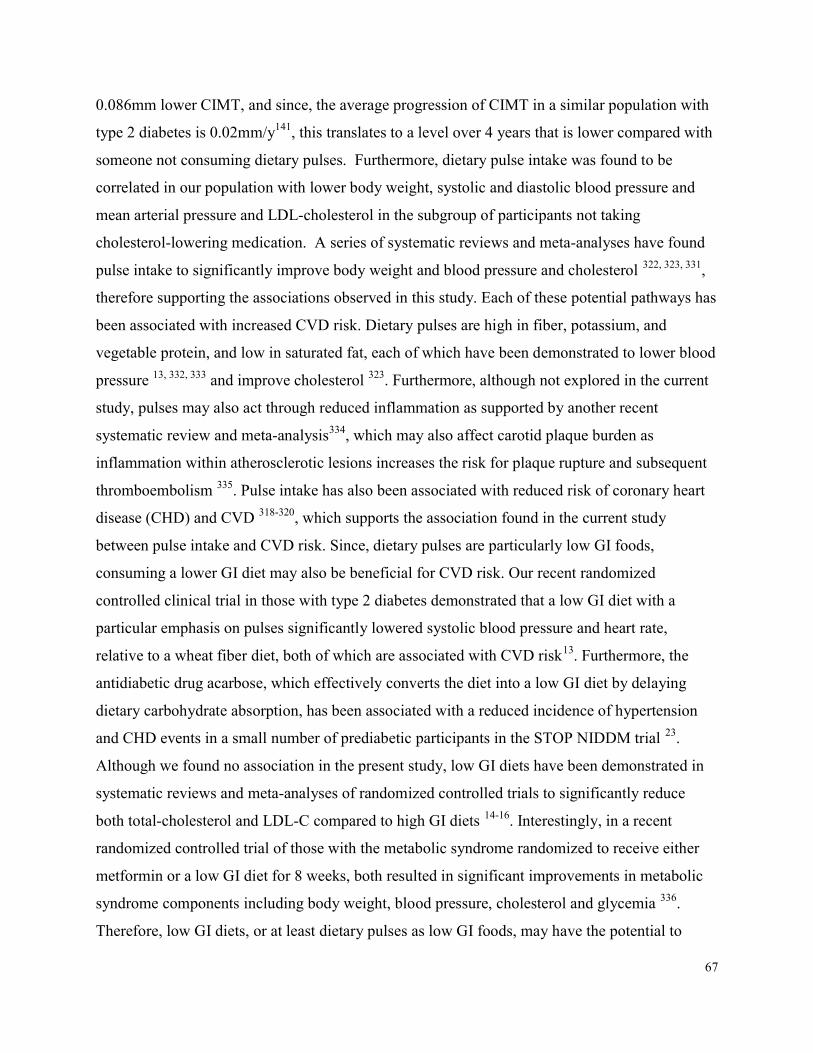
67
0.086mm lower CIMT, and since, the average progression of CIMT in a similar population with type 2 diabetes is 0.02mm/y141, this translates to a level over 4 years that is lower compared with someone not consuming dietary pulses. Furthermore, dietary pulse intake was found to be correlated in our population with lower body weight, systolic and diastolic blood pressure and mean arterial pressure and LDL-cholesterol in the subgroup of participants not taking cholesterol-lowering medication. A series of systematic reviews and meta-analyses have found pulse intake to significantly improve body weight and blood pressure and cholesterol 322, 323, 331, therefore supporting the associations observed in this study. Each of these potential pathways has been associated with increased CVD risk. Dietary pulses are high in fiber, potassium, and vegetable protein, and low in saturated fat, each of which have been demonstrated to lower blood pressure 13, 332, 333 and improve cholesterol 323. Furthermore, although not explored in the current study, pulses may also act through reduced inflammation as supported by another recent systematic review and meta-analysis334, which may also affect carotid plaque burden as inflammation within atherosclerotic lesions increases the risk for plaque rupture and subsequent thromboembolism 335. Pulse intake has also been associated with reduced risk of coronary heart disease (CHD) and CVD 318-320, which supports the association found in the current study between pulse intake and CVD risk. Since, dietary pulses are particularly low GI foods, consuming a lower GI diet may also be beneficial for CVD risk. Our recent randomized controlled clinical trial in those with type 2 diabetes demonstrated that a low GI diet with a particular emphasis on pulses significantly lowered systolic blood pressure and heart rate, relative to a wheat fiber diet, both of which are associated with CVD risk13. Furthermore, the antidiabetic drug acarbose, which effectively converts the diet into a low GI diet by delaying dietary carbohydrate absorption, has been associated with a reduced incidence of hypertension and CHD events in a small number of prediabetic participants in the STOP NIDDM trial 23. Although we found no association in the present study, low GI diets have been demonstrated in systematic reviews and meta-analyses of randomized controlled trials to significantly reduce both total-cholesterol and LDL-C compared to high GI diets 14-16. Interestingly, in a recent randomized controlled trial of those with the metabolic syndrome randomized to receive either metformin or a low GI diet for 8 weeks, both resulted in significant improvements in metabolic syndrome components including body weight, blood pressure, cholesterol and glycemia 336. Therefore, low GI diets, or at least dietary pulses as low GI foods, may have the potential to
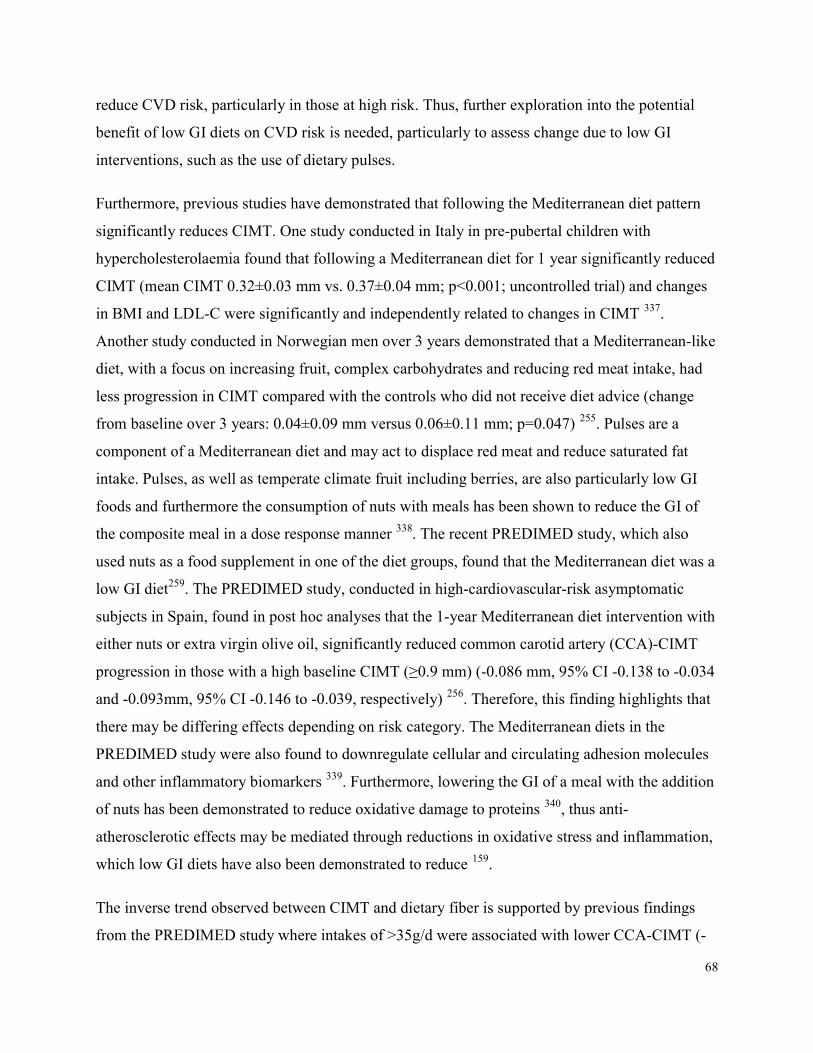
68
reduce CVD risk, particularly in those at high risk. Thus, further exploration into the potential benefit of low GI diets on CVD risk is needed, particularly to assess change due to low GI interventions, such as the use of dietary pulses. Furthermore, previous studies have demonstrated that following the Mediterranean diet pattern significantly reduces CIMT. One study conducted in Italy in pre-pubertal children with hypercholesterolaemia found that following a Mediterranean diet for 1 year significantly reduced CIMT (mean CIMT 0.32±0.03 mm vs. 0.37±0.04 mm; p<0.001; uncontrolled trial) and changes in BMI and LDL-C were significantly and independently related to changes in CIMT 337. Another study conducted in Norwegian men over 3 years demonstrated that a Mediterranean-like diet, with a focus on increasing fruit, complex carbohydrates and reducing red meat intake, had less progression in CIMT compared with the controls who did not receive diet advice (change from baseline over 3 years: 0.04±0.09 mm versus 0.06±0.11 mm; p=0.047) 255. Pulses are a component of a Mediterranean diet and may act to displace red meat and reduce saturated fat intake. Pulses, as well as temperate climate fruit including berries, are also particularly low GI foods and furthermore the consumption of nuts with meals has been shown to reduce the GI of the composite meal in a dose response manner 338. The recent PREDIMED study, which also used nuts as a food supplement in one of the diet groups, found that the Mediterranean diet was a low GI diet259. The PREDIMED study, conducted in high-cardiovascular-risk asymptomatic subjects in Spain, found in post hoc analyses that the 1-year Mediterranean diet intervention with either nuts or extra virgin olive oil, significantly reduced common carotid artery (CCA)-CIMT progression in those with a high baseline CIMT (≥0.9 mm) (-0.086 mm, 95% CI -0.138 to -0.034 and -0.093mm, 95% CI -0.146 to -0.039, respectively) 256. Therefore, this finding highlights that there may be differing effects depending on risk category. The Mediterranean diets in the PREDIMED study were also found to downregulate cellular and circulating adhesion molecules and other inflammatory biomarkers 339. Furthermore, lowering the GI of a meal with the addition of nuts has been demonstrated to reduce oxidative damage to proteins 340, thus anti-atherosclerotic effects may be mediated through reductions in oxidative stress and inflammation, which low GI diets have also been demonstrated to reduce 159. The inverse trend observed between CIMT and dietary fiber is supported by previous findings from the PREDIMED study where intakes of >35g/d were associated with lower CCA-CIMT (-
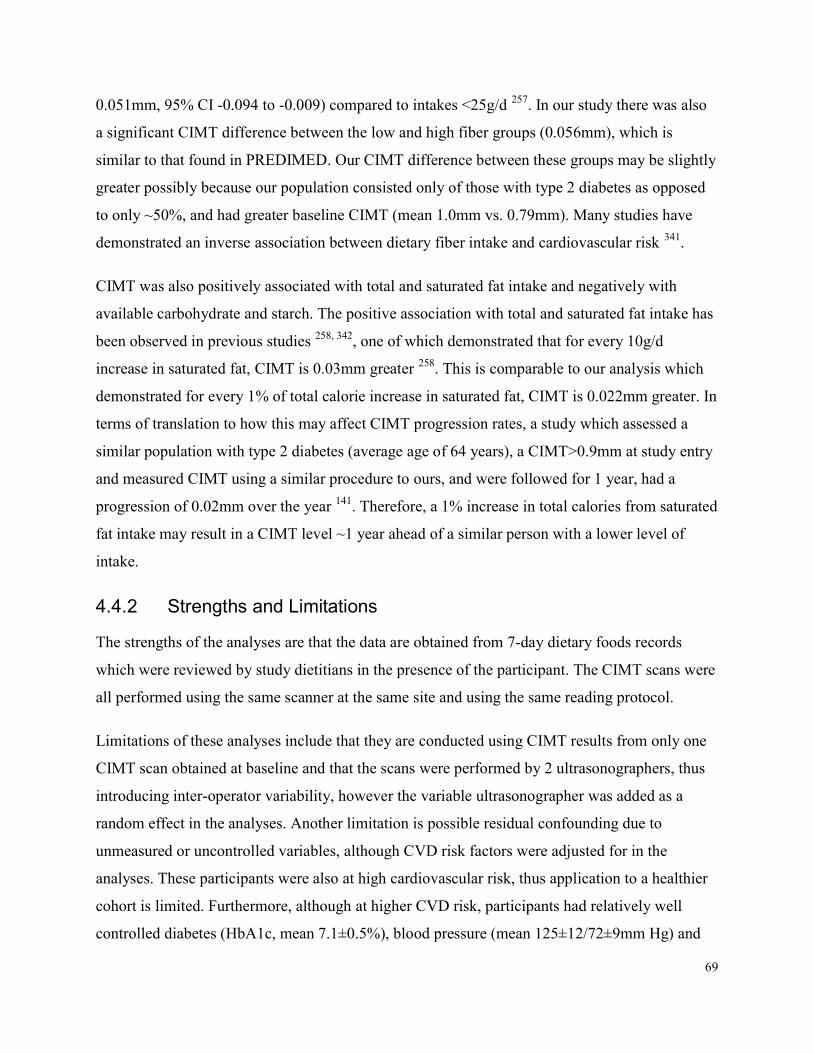
69
0.051mm, 95% CI -0.094 to -0.009) compared to intakes <25g/d 257. In our study there was also a significant CIMT difference between the low and high fiber groups (0.056mm), which is similar to that found in PREDIMED. Our CIMT difference between these groups may be slightly greater possibly because our population consisted only of those with type 2 diabetes as opposed to only ~50%, and had greater baseline CIMT (mean 1.0mm vs. 0.79mm). Many studies have demonstrated an inverse association between dietary fiber intake and cardiovascular risk 341. CIMT was also positively associated with total and saturated fat intake and negatively with available carbohydrate and starch. The positive association with total and saturated fat intake has been observed in previous studies 258, 342, one of which demonstrated that for every 10g/d increase in saturated fat, CIMT is 0.03mm greater 258. This is comparable to our analysis which demonstrated for every 1% of total calorie increase in saturated fat, CIMT is 0.022mm greater. In terms of translation to how this may affect CIMT progression rates, a study which assessed a similar population with type 2 diabetes (average age of 64 years), a CIMT>0.9mm at study entry and measured CIMT using a similar procedure to ours, and were followed for 1 year, had a progression of 0.02mm over the year 141. Therefore, a 1% increase in total calories from saturated fat intake may result in a CIMT level ~1 year ahead of a similar person with a lower level of intake.
4.4.2 Strengths and Limitations The strengths of the analyses are that the data are obtained from 7-day dietary foods records which were reviewed by study dietitians in the presence of the participant. The CIMT scans were all performed using the same scanner at the same site and using the same reading protocol. Limitations of these analyses include that they are conducted using CIMT results from only one CIMT scan obtained at baseline and that the scans were performed by 2 ultrasonographers, thus introducing inter-operator variability, however the variable ultrasonographer was added as a random effect in the analyses. Another limitation is possible residual confounding due to unmeasured or uncontrolled variables, although CVD risk factors were adjusted for in the analyses. These participants were also at high cardiovascular risk, thus application to a healthier cohort is limited. Furthermore, although at higher CVD risk, participants had relatively well controlled diabetes (HbA1c, mean 7.1±0.5%), blood pressure (mean 125±12/72±9mm Hg) and
70
LDL-cholesterol (mean 2.2±0.9mmol/L), with ~ 70% on blood pressure medication and ~76% on cholesterol-lowering medication at baseline, therefore possibly limiting the ability to assess associations between risk factors for CVD and CIMT and dietary intake, as well as limiting application to those with uncontrolled risk factors. Importantly, the cross-sectional design of the study is a limitation to establish causality due to the possibility of reverse causation bias. Longitudinal studies and randomized controlled trials are needed to confirm the observed associations.
4.5 Conclusion No relation between CIMT and GI was observed. However, dietary pulse intake as a key low GI food was significantly associated with lower baseline CIMT, blood pressure, body weight, and LDL-C, suggesting a potential role for dietary pulses in CVD risk reduction in type 2 diabetes. Saturated fat intake was also associated with CIMT and thus warrants further exploration. Properly designed randomized controlled trials are necessary to confirm if these dietary factors including increased intake of dietary pulses as a key low GI food, and a reduction in saturated fat intake, are potential strategies to reduce CVD in those with type 2 diabetes. Furthermore, these types of trials will also be necessary in order to better assess if there is any effect of GI, where a low GI diet is the result of healthy low GI dietary advice, thus the results of the current trial underway are greatly anticipated.
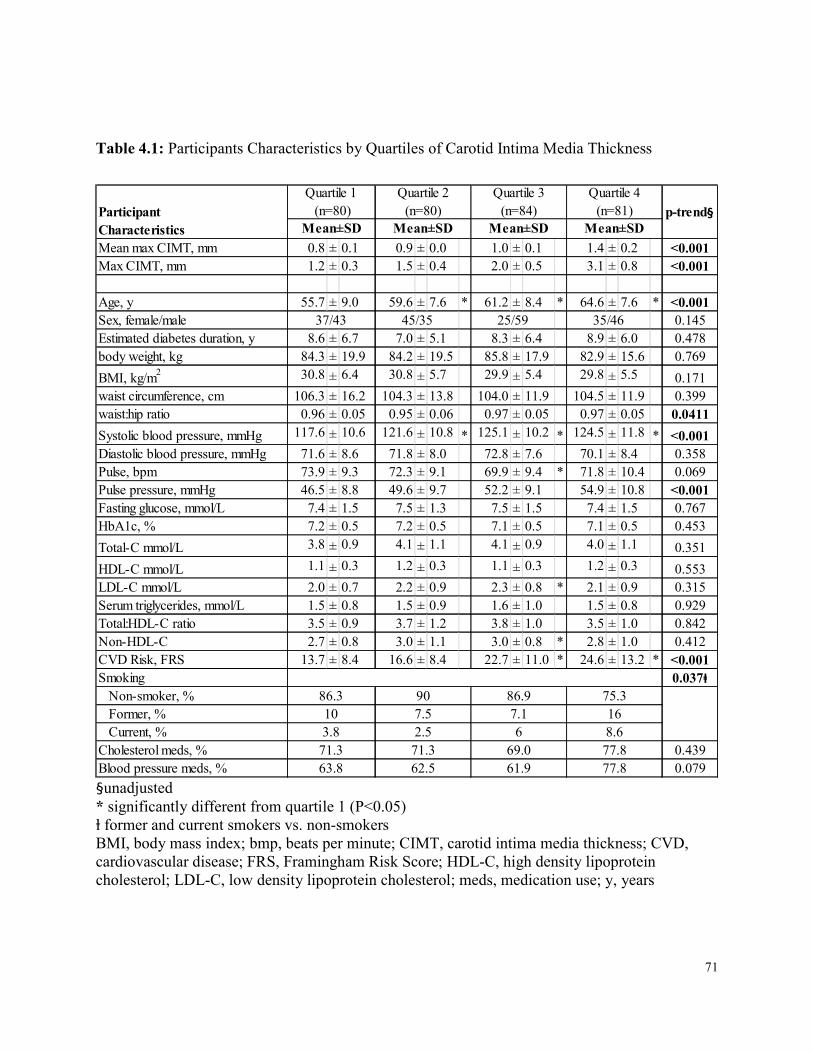
71
Table 4.1: Participants Characteristics by Quartiles of Carotid Intima Media Thickness
Mean max CIMT, mm 0.8 ± 0.1 0.9 ± 0.0 1.0 ± 0.1 1.4 ± 0.2 <0.001Max CIMT, mm 1.2 ± 0.3 1.5 ± 0.4 2.0 ± 0.5 3.1 ± 0.8 <0.001Age, y 55.7 ± 9.0 59.6 ± 7.6 * 61.2 ± 8.4 * 64.6 ± 7.6 * <0.001Sex, female/male 0.145Estimated diabetes duration, y 8.6 ± 6.7 7.0 ± 5.1 8.3 ± 6.4 8.9 ± 6.0 0.478body weight, kg 84.3 ± 19.9 84.2 ± 19.5 85.8 ± 17.9 82.9 ± 15.6 0.769BMI, kg/m2 30.8 ± 6.4 30.8 ± 5.7 29.9 ± 5.4 29.8 ± 5.5 0.171waist circumference, cm 106.3 ± 16.2 104.3 ± 13.8 104.0 ± 11.9 104.5 ± 11.9 0.399waist:hip ratio 0.96 ± 0.05 0.95 ± 0.06 0.97 ± 0.05 0.97 ± 0.05 0.0411Systolic blood pressure, mmHg 117.6 ± 10.6 121.6 ± 10.8 * 125.1 ± 10.2 * 124.5 ± 11.8 * <0.001Diastolic blood pressure, mmHg 71.6 ± 8.6 71.8 ± 8.0 72.8 ± 7.6 70.1 ± 8.4 0.358Pulse, bpm 73.9 ± 9.3 72.3 ± 9.1 69.9 ± 9.4 * 71.8 ± 10.4 0.069Pulse pressure, mmHg 46.5 ± 8.8 49.6 ± 9.7 52.2 ± 9.1 54.9 ± 10.8 <0.001Fasting glucose, mmol/L 7.4 ± 1.5 7.5 ± 1.3 7.5 ± 1.5 7.4 ± 1.5 0.767HbA1c, % 7.2 ± 0.5 7.2 ± 0.5 7.1 ± 0.5 7.1 ± 0.5 0.453Total-C mmol/L 3.8 ± 0.9 4.1 ± 1.1 4.1 ± 0.9 4.0 ± 1.1 0.351HDL-C mmol/L 1.1 ± 0.3 1.2 ± 0.3 1.1 ± 0.3 1.2 ± 0.3 0.553LDL-C mmol/L 2.0 ± 0.7 2.2 ± 0.9 2.3 ± 0.8 * 2.1 ± 0.9 0.315Serum triglycerides, mmol/L 1.5 ± 0.8 1.5 ± 0.9 1.6 ± 1.0 1.5 ± 0.8 0.929Total:HDL-C ratio 3.5 ± 0.9 3.7 ± 1.2 3.8 ± 1.0 3.5 ± 1.0 0.842Non-HDL-C 2.7 ± 0.8 3.0 ± 1.1 3.0 ± 0.8 * 2.8 ± 1.0 0.412CVD Risk, FRS 13.7 ± 8.4 16.6 ± 8.4 22.7 ± 11.0 * 24.6 ± 13.2 * <0.001Smoking 0.037ⱡ Non-smoker, % Former, % Current, %Cholesterol meds, % 0.439Blood pressure meds, % 0.079
Participant Characteristics Mean±SD
86.3
p-trend§Quartile 2
(n=80)Mean±SD
Quartile 3 (n=84)
Mean±SDQuartile 4
(n=81)Mean±SD
25/5937/43
Quartile 1 (n=80)
45/35 35/46
103.8
71.363.8
907.52.5
71.362.5
86.97.16
69.061.9
75.3168.677.877.8 §unadjusted
* significantly different from quartile 1 (P<0.05) ⱡ former and current smokers vs. non-smokers BMI, body mass index; bmp, beats per minute; CIMT, carotid intima media thickness; CVD, cardiovascular disease; FRS, Framingham Risk Score; HDL-C, high density lipoprotein cholesterol; LDL-C, low density lipoprotein cholesterol; meds, medication use; y, years
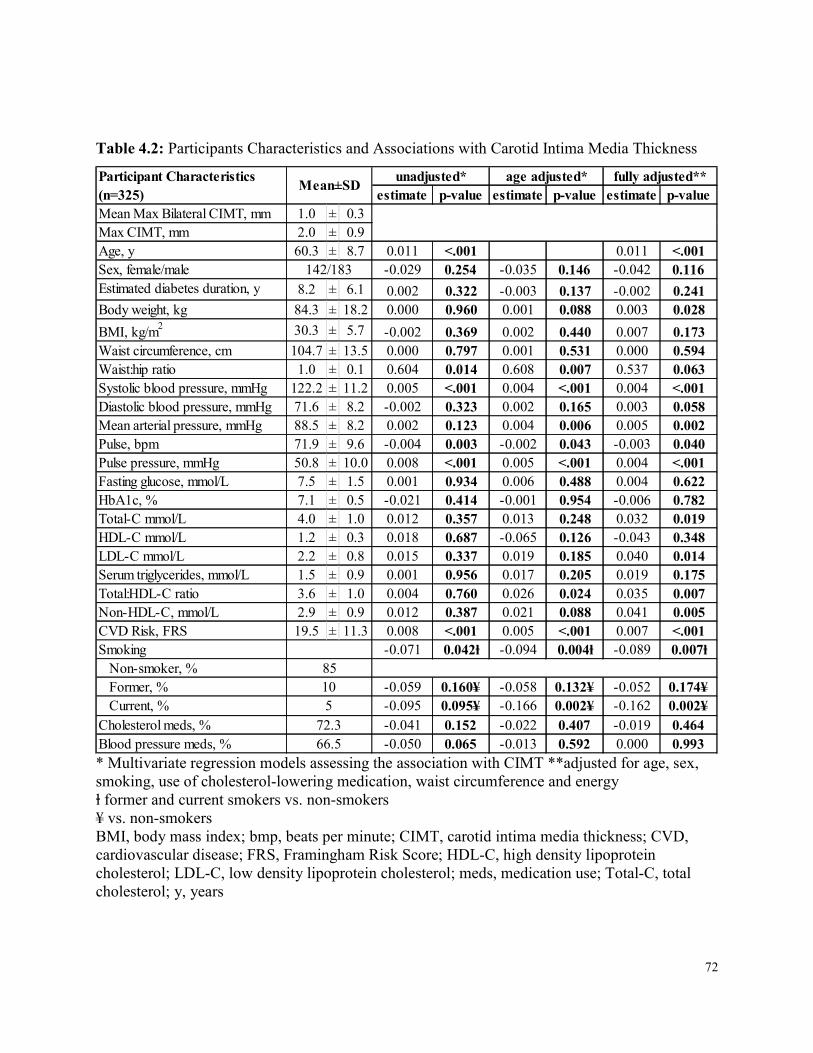
72
Table 4.2: Participants Characteristics and Associations with Carotid Intima Media Thickness
estimate p-value estimate p-value estimate p-valueMean Max Bilateral CIMT, mm 1.0 ± 0.3Max CIMT, mm 2.0 ± 0.9Age, y 60.3 ± 8.7 0.011 <.001 0.011 <.001Sex, female/male -0.029 0.254 -0.035 0.146 -0.042 0.116Estimated diabetes duration, y 8.2 ± 6.1 0.002 0.322 -0.003 0.137 -0.002 0.241Body weight, kg 84.3 ± 18.2 0.000 0.960 0.001 0.088 0.003 0.028BMI, kg/m2 30.3 ± 5.7 -0.002 0.369 0.002 0.440 0.007 0.173Waist circumference, cm 104.7 ± 13.5 0.000 0.797 0.001 0.531 0.000 0.594Waist:hip ratio 1.0 ± 0.1 0.604 0.014 0.608 0.007 0.537 0.063Systolic blood pressure, mmHg 122.2 ± 11.2 0.005 <.001 0.004 <.001 0.004 <.001Diastolic blood pressure, mmHg 71.6 ± 8.2 -0.002 0.323 0.002 0.165 0.003 0.058Mean arterial pressure, mmHg 88.5 ± 8.2 0.002 0.123 0.004 0.006 0.005 0.002Pulse, bpm 71.9 ± 9.6 -0.004 0.003 -0.002 0.043 -0.003 0.040Pulse pressure, mmHg 50.8 ± 10.0 0.008 <.001 0.005 <.001 0.004 <.001Fasting glucose, mmol/L 7.5 ± 1.5 0.001 0.934 0.006 0.488 0.004 0.622HbA1c, % 7.1 ± 0.5 -0.021 0.414 -0.001 0.954 -0.006 0.782Total-C mmol/L 4.0 ± 1.0 0.012 0.357 0.013 0.248 0.032 0.019HDL-C mmol/L 1.2 ± 0.3 0.018 0.687 -0.065 0.126 -0.043 0.348LDL-C mmol/L 2.2 ± 0.8 0.015 0.337 0.019 0.185 0.040 0.014Serum triglycerides, mmol/L 1.5 ± 0.9 0.001 0.956 0.017 0.205 0.019 0.175Total:HDL-C ratio 3.6 ± 1.0 0.004 0.760 0.026 0.024 0.035 0.007Non-HDL-C, mmol/L 2.9 ± 0.9 0.012 0.387 0.021 0.088 0.041 0.005CVD Risk, FRS 19.5 ± 11.3 0.008 <.001 0.005 <.001 0.007 <.001Smoking -0.071 0.042ⱡ -0.094 0.004ⱡ -0.089 0.007ⱡ Non-smoker, % Former, % -0.059 0.160¥ -0.058 0.132¥ -0.052 0.174¥ Current, % -0.095 0.095¥ -0.166 0.002¥ -0.162 0.002¥Cholesterol meds, % -0.041 0.152 -0.022 0.407 -0.019 0.464Blood pressure meds, % -0.050 0.065 -0.013 0.592 0.000 0.993
142/183
85105
72.366.5
Participant Characteristics (n=325) Mean±SD unadjusted* age adjusted* fully adjusted**
* Multivariate regression models assessing the association with CIMT **adjusted for age, sex, smoking, use of cholesterol-lowering medication, waist circumference and energy ⱡ former and current smokers vs. non-smokers ¥ vs. non-smokers BMI, body mass index; bmp, beats per minute; CIMT, carotid intima media thickness; CVD, cardiovascular disease; FRS, Framingham Risk Score; HDL-C, high density lipoprotein cholesterol; LDL-C, low density lipoprotein cholesterol; meds, medication use; Total-C, total cholesterol; y, years
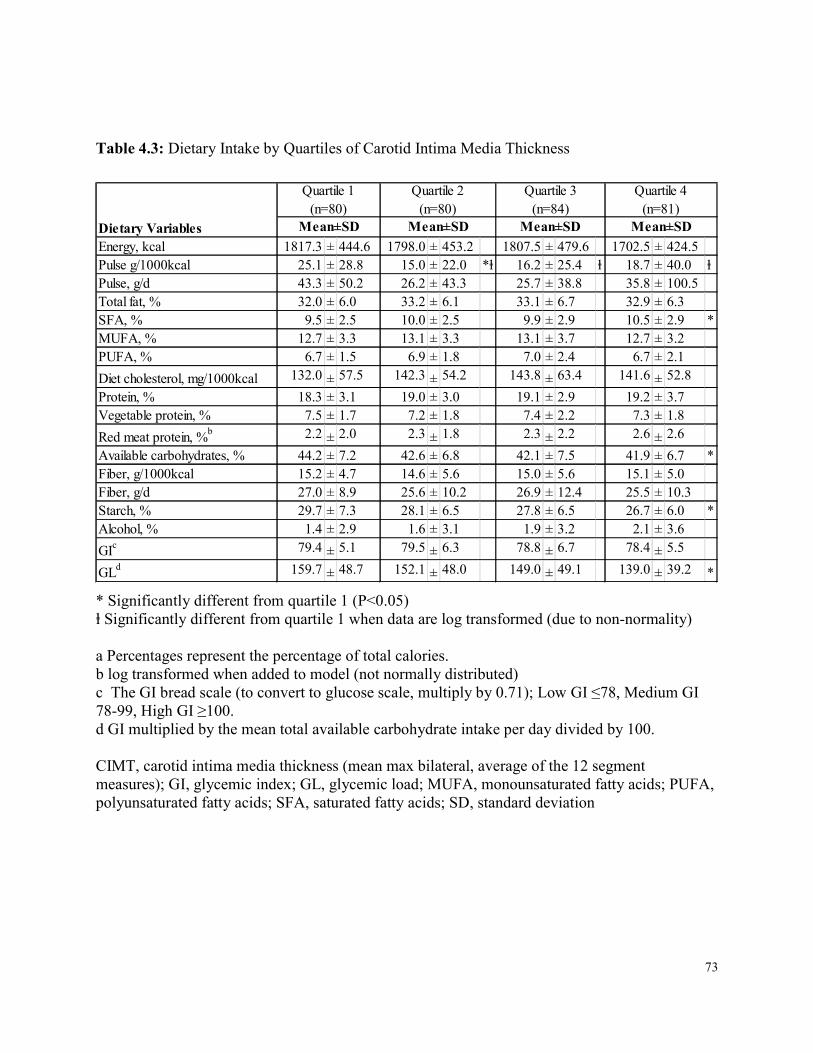
73
Table 4.3: Dietary Intake by Quartiles of Carotid Intima Media Thickness
Energy, kcal 1817.3 ± 444.6 1798.0 ± 453.2 1807.5 ± 479.6 1702.5 ± 424.5Pulse g/1000kcal 25.1 ± 28.8 15.0 ± 22.0 *ⱡ 16.2 ± 25.4 ⱡ 18.7 ± 40.0 ⱡPulse, g/d 43.3 ± 50.2 26.2 ± 43.3 25.7 ± 38.8 35.8 ± 100.5Total fat, % 32.0 ± 6.0 33.2 ± 6.1 33.1 ± 6.7 32.9 ± 6.3SFA, % 9.5 ± 2.5 10.0 ± 2.5 9.9 ± 2.9 10.5 ± 2.9 *MUFA, % 12.7 ± 3.3 13.1 ± 3.3 13.1 ± 3.7 12.7 ± 3.2PUFA, % 6.7 ± 1.5 6.9 ± 1.8 7.0 ± 2.4 6.7 ± 2.1Diet cholesterol, mg/1000kcal 132.0 ± 57.5 142.3 ± 54.2 143.8 ± 63.4 141.6 ± 52.8Protein, % 18.3 ± 3.1 19.0 ± 3.0 19.1 ± 2.9 19.2 ± 3.7Vegetable protein, % 7.5 ± 1.7 7.2 ± 1.8 7.4 ± 2.2 7.3 ± 1.8Red meat protein, %b 2.2 ± 2.0 2.3 ± 1.8 2.3 ± 2.2 2.6 ± 2.6Available carbohydrates, % 44.2 ± 7.2 42.6 ± 6.8 42.1 ± 7.5 41.9 ± 6.7 *Fiber, g/1000kcal 15.2 ± 4.7 14.6 ± 5.6 15.0 ± 5.6 15.1 ± 5.0Fiber, g/d 27.0 ± 8.9 25.6 ± 10.2 26.9 ± 12.4 25.5 ± 10.3Starch, % 29.7 ± 7.3 28.1 ± 6.5 27.8 ± 6.5 26.7 ± 6.0 *Alcohol, % 1.4 ± 2.9 1.6 ± 3.1 1.9 ± 3.2 2.1 ± 3.6GIc 79.4 ± 5.1 79.5 ± 6.3 78.8 ± 6.7 78.4 ± 5.5GLd 159.7 ± 48.7 152.1 ± 48.0 149.0 ± 49.1 139.0 ± 39.2 *
Quartile 1 (n=80)
Mean±SDQuartile 2
(n=80)Quartile 3
(n=84)Quartile 4
(n=81)Mean±SD Mean±SD Mean±SDDietary Variables
* Significantly different from quartile 1 (P<0.05) ⱡ Significantly different from quartile 1 when data are log transformed (due to non-normality) a Percentages represent the percentage of total calories. b log transformed when added to model (not normally distributed) c The GI bread scale (to convert to glucose scale, multiply by 0.71); Low GI ≤78, Medium GI 78-99, High GI ≥100. d GI multiplied by the mean total available carbohydrate intake per day divided by 100. CIMT, carotid intima media thickness (mean max bilateral, average of the 12 segment measures); GI, glycemic index; GL, glycemic load; MUFA, monounsaturated fatty acids; PUFA, polyunsaturated fatty acids; SFA, saturated fatty acids; SD, standard deviation
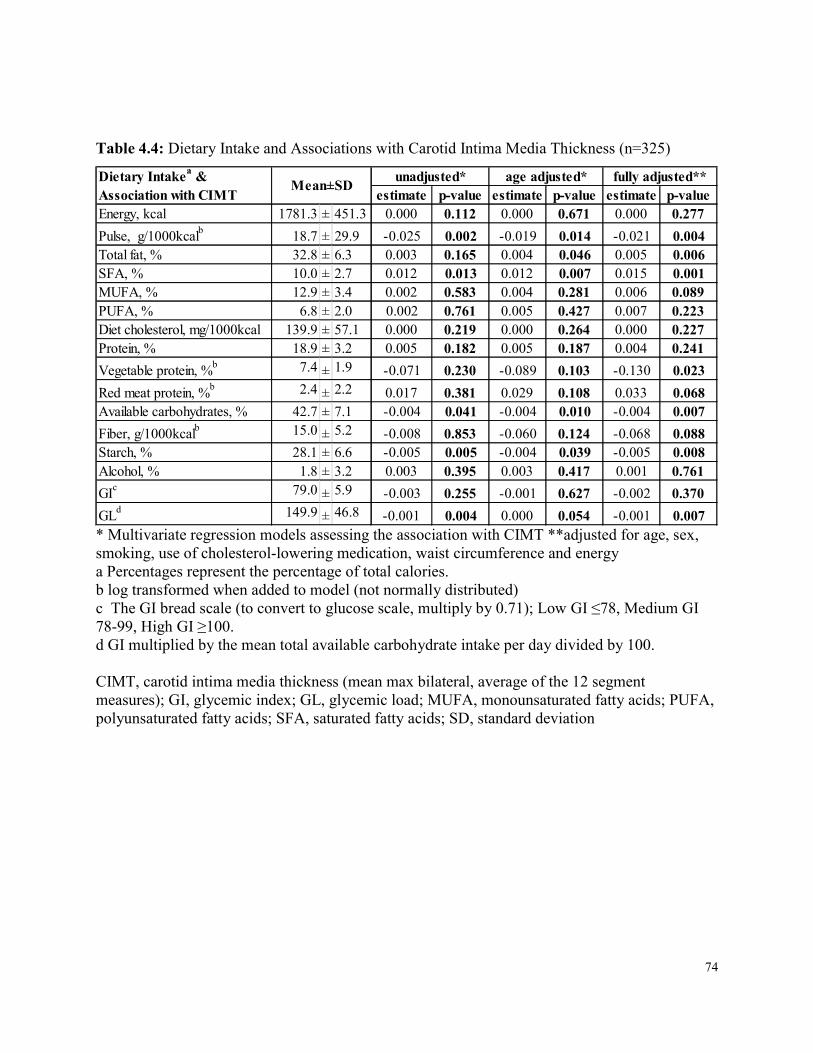
74
Table 4.4: Dietary Intake and Associations with Carotid Intima Media Thickness (n=325)
estimate p-value estimate p-value estimate p-valueEnergy, kcal 1781.3 ± 451.3 0.000 0.112 0.000 0.671 0.000 0.277Pulse, g/1000kcalb 18.7 ± 29.9 -0.025 0.002 -0.019 0.014 -0.021 0.004Total fat, % 32.8 ± 6.3 0.003 0.165 0.004 0.046 0.005 0.006SFA, % 10.0 ± 2.7 0.012 0.013 0.012 0.007 0.015 0.001MUFA, % 12.9 ± 3.4 0.002 0.583 0.004 0.281 0.006 0.089PUFA, % 6.8 ± 2.0 0.002 0.761 0.005 0.427 0.007 0.223Diet cholesterol, mg/1000kcal 139.9 ± 57.1 0.000 0.219 0.000 0.264 0.000 0.227Protein, % 18.9 ± 3.2 0.005 0.182 0.005 0.187 0.004 0.241Vegetable protein, %b 7.4 ± 1.9 -0.071 0.230 -0.089 0.103 -0.130 0.023Red meat protein, %b 2.4 ± 2.2 0.017 0.381 0.029 0.108 0.033 0.068Available carbohydrates, % 42.7 ± 7.1 -0.004 0.041 -0.004 0.010 -0.004 0.007Fiber, g/1000kcalb 15.0 ± 5.2 -0.008 0.853 -0.060 0.124 -0.068 0.088Starch, % 28.1 ± 6.6 -0.005 0.005 -0.004 0.039 -0.005 0.008Alcohol, % 1.8 ± 3.2 0.003 0.395 0.003 0.417 0.001 0.761GIc 79.0 ± 5.9 -0.003 0.255 -0.001 0.627 -0.002 0.370GLd 149.9 ± 46.8 -0.001 0.004 0.000 0.054 -0.001 0.007
Mean±SDDietary Intakea & Association with CIMT
unadjusted* age adjusted* fully adjusted**
* Multivariate regression models assessing the association with CIMT **adjusted for age, sex, smoking, use of cholesterol-lowering medication, waist circumference and energy a Percentages represent the percentage of total calories. b log transformed when added to model (not normally distributed) c The GI bread scale (to convert to glucose scale, multiply by 0.71); Low GI ≤78, Medium GI 78-99, High GI ≥100. d GI multiplied by the mean total available carbohydrate intake per day divided by 100. CIMT, carotid intima media thickness (mean max bilateral, average of the 12 segment measures); GI, glycemic index; GL, glycemic load; MUFA, monounsaturated fatty acids; PUFA, polyunsaturated fatty acids; SFA, saturated fatty acids; SD, standard deviation
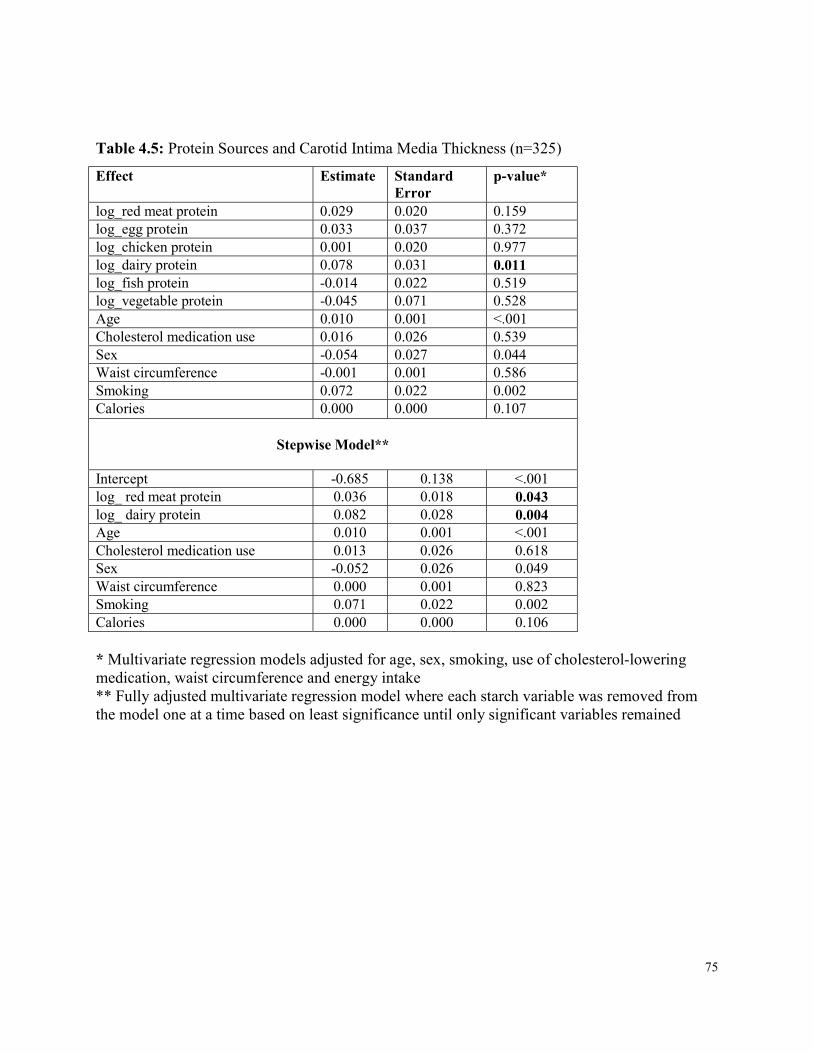
75
Table 4.5: Protein Sources and Carotid Intima Media Thickness (n=325) Effect Estimate Standard
Error p-value*
log_red meat protein 0.029 0.020 0.159 log_egg protein 0.033 0.037 0.372 log_chicken protein 0.001 0.020 0.977 log_dairy protein 0.078 0.031 0.011 log_fish protein -0.014 0.022 0.519 log_vegetable protein -0.045 0.071 0.528 Age 0.010 0.001 <.001 Cholesterol medication use 0.016 0.026 0.539 Sex -0.054 0.027 0.044 Waist circumference -0.001 0.001 0.586 Smoking 0.072 0.022 0.002 Calories 0.000 0.000 0.107
Stepwise Model**
Intercept -0.685 0.138 <.001 log_ red meat protein 0.036 0.018 0.043 log_ dairy protein 0.082 0.028 0.004 Age 0.010 0.001 <.001 Cholesterol medication use 0.013 0.026 0.618 Sex -0.052 0.026 0.049 Waist circumference 0.000 0.001 0.823 Smoking 0.071 0.022 0.002 Calories 0.000 0.000 0.106 * Multivariate regression models adjusted for age, sex, smoking, use of cholesterol-lowering medication, waist circumference and energy intake ** Fully adjusted multivariate regression model where each starch variable was removed from the model one at a time based on least significance until only significant variables remained
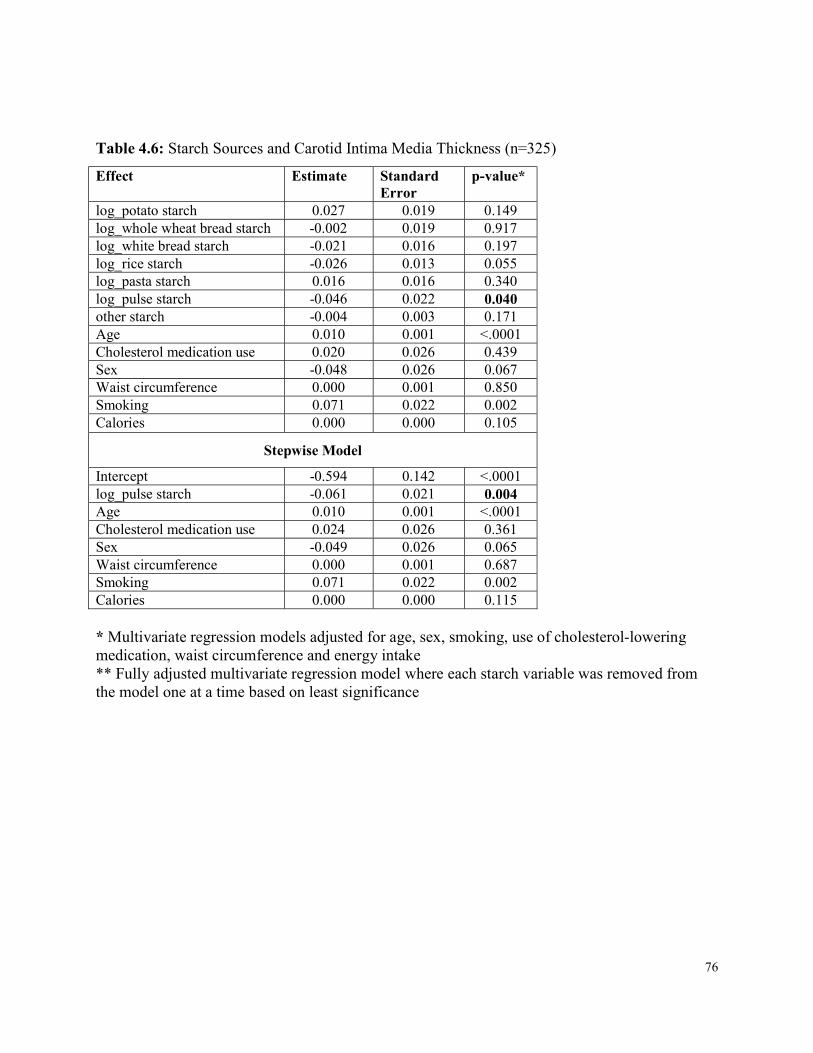
76
Table 4.6: Starch Sources and Carotid Intima Media Thickness (n=325) Effect Estimate Standard
Error p-value*
log_potato starch 0.027 0.019 0.149 log_whole wheat bread starch -0.002 0.019 0.917 log_white bread starch -0.021 0.016 0.197 log_rice starch -0.026 0.013 0.055 log_pasta starch 0.016 0.016 0.340 log_pulse starch -0.046 0.022 0.040 other starch -0.004 0.003 0.171 Age 0.010 0.001 <.0001 Cholesterol medication use 0.020 0.026 0.439 Sex -0.048 0.026 0.067 Waist circumference 0.000 0.001 0.850 Smoking 0.071 0.022 0.002 Calories 0.000 0.000 0.105
Stepwise Model Intercept -0.594 0.142 <.0001 log_pulse starch -0.061 0.021 0.004 Age 0.010 0.001 <.0001 Cholesterol medication use 0.024 0.026 0.361 Sex -0.049 0.026 0.065 Waist circumference 0.000 0.001 0.687 Smoking 0.071 0.022 0.002 Calories 0.000 0.000 0.115 * Multivariate regression models adjusted for age, sex, smoking, use of cholesterol-lowering medication, waist circumference and energy intake ** Fully adjusted multivariate regression model where each starch variable was removed from the model one at a time based on least significance
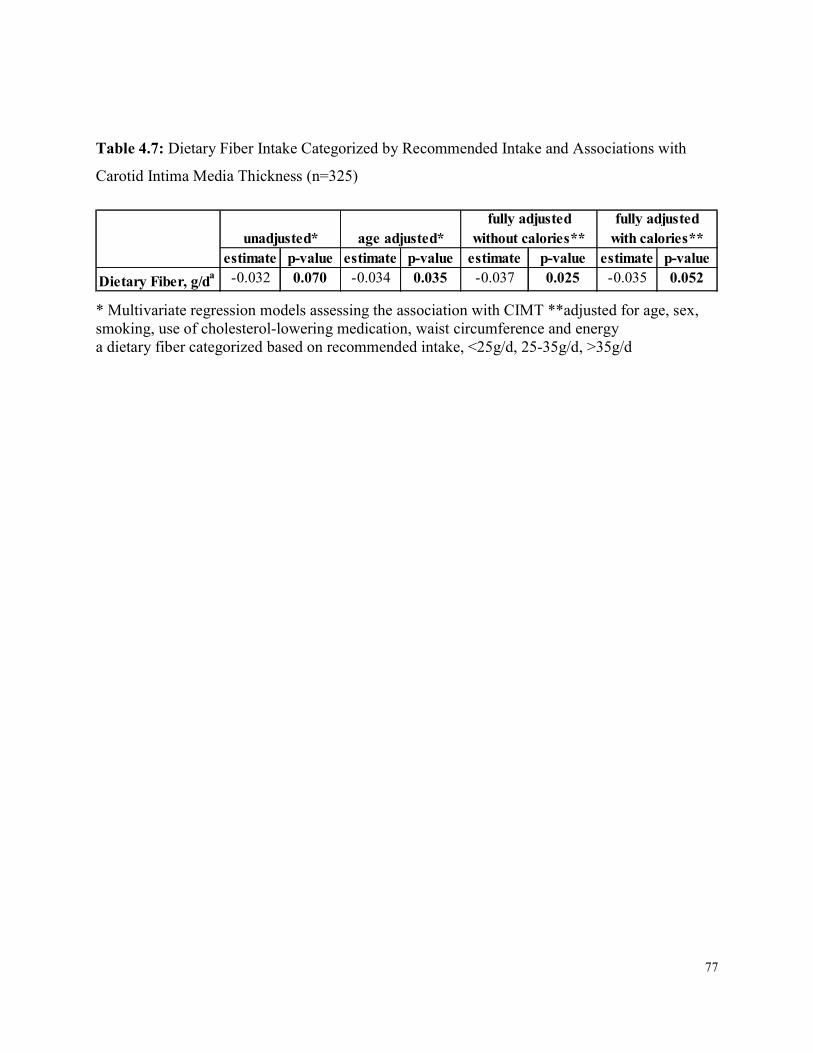
77
Table 4.7: Dietary Fiber Intake Categorized by Recommended Intake and Associations with Carotid Intima Media Thickness (n=325)
estimate p-value estimate p-value estimate p-value estimate p-valueDietary Fiber, g/da -0.032 0.070 -0.034 0.035 -0.037 0.025 -0.035 0.052
fully adjusted without calories**
fully adjusted with calories**unadjusted* age adjusted*
* Multivariate regression models assessing the association with CIMT **adjusted for age, sex, smoking, use of cholesterol-lowering medication, waist circumference and energy a dietary fiber categorized based on recommended intake, <25g/d, 25-35g/d, >35g/d
78
Chapter 5 Dietary Intake and Carotid Plaque Volume in Type 2 Diabetes
5 Abstract Background: Cardiovascular disease (CVD) is the leading cause of mortality in those with type 2 diabetes. Magnetic Resonance Imaging (MRI) has recently been demonstrated to detect with high reproducibility plaque burden within the carotid arteries by measuring vessel wall volume (VWV), an accepted marker of CVD. Methods: Baseline data from 169 participants with type 2 diabetes, recruited for a randomized controlled trial, were collected; including VWV by MRI, dietary intake using 7-day food records, anthropometric measures and fasting serum samples. Generalized Estimation Equations, adjusted for age, sex, smoking, waist circumference, cholesterol medication use and energy intake, using SAS version 9.4 were conducted to assess the relationship between dietary intake and VWV, as well as anthropometric measures. Dietary variables were energy adjusted and non-normally distributed variables were transformed. Results: There was no association between GI and VWV; however VWV was significantly associated negatively with dietary pulse intake. VWV was also significantly associated negatively with available carbohydrates, starch, glycemic load and vegetable protein, and was positively associated with saturated fat, dietary cholesterol, total protein and red meat protein in fully adjusted models. Conclusions: GI was not significantly associated with VWV; however dietary pulse intake was significantly associated with lower baseline VWV, suggesting a potential role for dietary pulses in CVD prevention in type 2 diabetes.
79
5.1 Introduction Cardiovascular disease (CVD) is the leading cause of mortality worldwide 304, 305. Thus, strategies to reduce the risk of CVD in those with type 2 diabetes are of importance. Pharmacological trials have demonstrated that intensive glycemic control may reduce CVD events 11, 12. Dietary interventions which have demonstrated improvements in glycemic control in those with type 2 diabetes include low glycemic index (GI) diets 17, 18, particularly those consisting of dietary pulses since they are especially low GI foods. In addition to improving glycemic control 223, pulses have been demonstrated to improve blood pressure 322 and lipids targets for CVD 323. Beyond traditional risk factors, novel assessments of CVD risk which directly measure subclinical arterial damage have recently been developed to assist in better classification of patients at high risk. Carotid magnetic resonance imaging (MRI) can non-invasively measure total carotid plaque burden by measuring the volume of plaque within the vessel (vessel wall volume, VWV) with high reproducibility and accuracy 37. Carotid VWV is useful in the assessment of arterial disease as it is a direct measure of carotid plaque burden 343 and has been used in various statin trials to assess change 268, 344, 345. However, there are no published dietary interventions trials to date using VWV to measure carotid plaque burden. Therefore, the objective of the present study was to assess associations between dietary intake variables and risk of CVD as assessed by VWV using MRI in a population with type 2 diabetes.
5.2 Methods 5.2.1 Participants Details of the study protocol can be found in Chapter 2. From February 2010 to June 2013, 169 participants with type 2 diabetes were recruited for a 3-year dietary intervention trial to assess the effect of a low GI diet on plaque burden and other surrogate markers of CVD, microvascular disease and long term glycemic control. Inclusion criteria included a diagnosis of type 2 diabetes greater than 6 months ago, an HbA1c between 6.5% and 8.0% at screening, taking oral hypoglycemic agents at a stable dose for ≥8 weeks, not taking insulin, free from any gastrointestinal disease, clinically significant liver disease or history of cancer, except non-
80
melanoma skin cancer, had not had a major cardiovascular event or major surgery in the past 6 months, and had a carotid intima media thickness (CIMT)≥1.2mm as assessed by a screening carotid ultrasound (CUS). All eligible consenting participants had an MRI scan scheduled at the Medical Imaging Department at Sunnybrook Health Sciences Centre. Those participants with missing images or images graded as poor quality (<3) were excluded from analyses (n=9). Therefore, this cross-sectional analysis focused on the baseline data from 160 study participants who also provided 7-day food records and had baseline anthropometric measures and fasting blood samples obtained (Table 5.1). The study was approved by the research ethics board of St Michael’s Hospital and written consent was obtained from all participants.
5.2.2 Protocol In this cross-sectional analysis, data was obtained from baseline measures from study participants. Participants had an MRI scan completed at the Medical Imaging Department at Sunnybrook Health Sciences Centre MRI research unit which has been described in Chapter 2. A gadolinium contrast agent, Gadovist® (gadobutrol, Bayer Inc, Mississauga, Canada), approved by Health Canada and one of several products commonly used for contrast during MRIs, was used if safety procedures were met and participants consented at an intravenous injection of 0.1 mmol/kg (0.2mL/kg), otherwise the MRI was performed without the use of the Gadovist. Details of the MRI scanning protocol can be found in Chapter 2. Patients were centered on the index carotid artery (i.e. the artery with the higher max CIMT as determined from the CUS) at the carotid artery bifurcation and slices were scanned 16mm below and 16mm above the bifurcation. Total scan time was an average of 60min and allowed coverage of 3-dimensional (3D) imaging capturing the entire carotid artery. Cardiovascular imaging software, VesselMASS (Medis, Netherlands) was used for image analysis. Image grading of all sequences in each MRI scan was rated on a 5-point scale (1=worst; 5=best) 346 and images with poor quality (grade <3) or with missing images were excluded. Vessel wall volume (VWV) calculations were automatically generated from the software 288-290. One reader performed all VWV measurements. Two baseline clinical visits occurred at the Risk Factor Modification Centre at St. Michael’s Hospital and were on average 2 weeks apart, but no more than 5. At the first, baseline
81
anthropometric and fasting blood measures were obtained. Participants were given detailed instruction on how to complete a 7-day food record which was returned at the next visit. At the second baseline clinic visit, anthropometric and fasting blood measures were again obtained and each participant was randomized to receive dietary advice on either a low GI or high cereal fiber diet. Anthropometric data included body weight, seated blood pressure measured as the mean of triplicate measures made with an automatic sphygmomanometer (Omron HEM 907 XL®, OMRON Healthcare Inc., Burlington, Ontario, Canada), and waist (at the umbilicus, 2 inches above, and lying down) and hip circumference. Fasting blood measures included HbA1c, glucose and lipids.
5.2.3 Biochemical and Dietary Analyses The HbA1c value was analyzed within 24 hours using whole blood collected in EDTA Vacutainer tubes (Vacutainer; Becton, Dickinson and Co) in the hospital routine analytical laboratory by a turbidometric inhibition latex immunoassay (TINIA Roche Diagnostics) with a coefficient of variation between assays of 3% to 4%. Blood glucose and serum lipid levels were also measured in the hospital routine analytical laboratory using a Random Access Analyzer and Beckman reagents (SYNCHRON LX Systems; Beckman Coulter), with a coefficient of variation of 1.6% to 2.3% for blood glucose level and 1.3% to 3.0% for total cholesterol, triglycerides, and high-density lipoprotein cholesterol (HDL-C) levels. The low-density lipoprotein cholesterol (LDL-C) level was calculated by the method of Friedewald et al 326. Dietary assessments were made using participant completed 7-day food records analyzed using a computer program (ESHA Food Processor SQL version 10.9; ESHA, Salem, OR) based on a USDA database 298, supplemented with the Canada Nutrient File299, with GI values from international GI tables 300 using the bread scale (where bread = 100; for the glucose scale, bread scale values were multiplied by 0.71). Product data were updated with manufacturers’ nutrient information and with relevant foods analyzed by Covance Laboratories (3301 Kinsman Blvd, Madison WI). GI values were added to foods in the database using international GI tables 300 and GI values obtained from the testing of specific foods at Glycemic Index Laboratories (Toronto, Canada). GI values are expressed using the bread scale.
82
5.2.4 Statistical Analyses Analyses were performed on all baseline study participants who had an MRI scan completed with a quality rating >3 (n=160). Data are expressed as means ± SDs, unless otherwise indicated. All analyses were carried out using SAS software, version 9.4 302. Due to the fact that there were 2 measures per participant (namely the left and right carotid artery), generalized estimation equation analysis were conducted with an exchangeable correlation matrix including the 2 levels per participant, to assess the association between dietary intake variables and VWV. Dietary intake variables were energy adjusted, unless otherwise indicated. Analyses were adjusted for age, sex, smoking, use of cholesterol-lowering medication, waist circumference and energy intake. Smoking was defined using 3 categories: smoker (current or quit within the past year), ex-smoker (quit between 1 and 15 years ago), and non-smoker (never smoked, or quit over 15 years ago) according to the WHO definitions 327. Use of cholesterol-lowering medication was defined as user or non-user based on the baseline visits and waist circumference was the average of the measurements obtained at the 2 baseline visits, measured at the umbilicus. Overall 10 year CVD risk was calculated according to the Framingham cardiovascular risk equation (FRS) 328. All non-normally distributed variables were transformed according to the Box Cox Model and where lambda was found to be 0, data were log transformed 329. Probability values <0.05 were considered statistically significant. A mixed random coefficient model was conducted as sensitivity analyses, as well as independent analyses of the right and left carotid arteries and of the highest and lowest of the 2 sides.
5.3 Results 5.3.1 VWV and Baseline Participant Characteristics Of the 169 study participants, 160 had good quality MRI data which were available for this cross-sectional analysis. Characteristics of these study participants are presented in Table 5.1. The mean age was 62.0±7.8 years, 61.9% were male, the mean BMI was 29.7±5.0kg/m2, and the mean waist circumference was 104.9±12.8cm in females and 102.5±10.7cm in males. 75.8% were taking cholesterol- lowering medications, 69.7% blood pressure-lowering medications, 5.1% were current smokers, 13.1% former smokers, and 81.8% non-smokers. The mean VWV was 1.3±0.3cm3 on the index side, and 1.2±0.2 cm3 on the non-index side.
83
VWV differed significantly between sexes (β=0.184, p<0.001) and was significantly associated with age (β=0.008, p<0.001) and waist circumference (β=0.003, p<0.001) in the fully adjusted model. When the model was adjusted for age alone, VWV was significantly associated positively with waist to hip ratio (β=1.143, p=0.006), systolic blood pressure (β=0.004, p=0.016) and FRS (β=0.006, p=0.004). When separated by sex, in men, age remained significant and there was a significant negative association with HbA1c (p=0.032) in the fully adjusted model. When the model for men was adjusted for age alone, BMI was significantly positively association with VWV (p=0.044). In women, age, waist circumference, fasting blood glucose, and FRS were significantly positively associated with VWV in the fully adjusted model. When the model in women was adjusted for age alone, HbA1c was significantly positive associated with VWV (p=0.030). There was also a non-significant trend in the fully adjusted model for a positive association with LDL-C in women (p=0.071). In terms of the negative association between HbA1c and VWV in men, as opposed to the positive association found in women, men with higher HbA1c did not differ significantly compared to men with lower HbA1c on any anthropometric or blood measures. However, when the data were split based on sulfonylurea use, there was no association in users and a significant negative association with non-users. Non-users of sulfonylureas had significantly less disease duration compared to users (p=0.008). Therefore, disease duration was added to the full model of HbA1c and VWV in non-users and the association with HbA1c was no longer significant (p=0.085). One participant was missing waist circumference measurements, therefore was excluded from any analyses including waist.
5.3.2 VWV and Baseline Dietary Intake The associations between VWV and all dietary variables are presented in Table 5.2. Pulse intake, vegetable and egg protein, fiber and red meat protein were non-normally distributed; therefore values were transformed using the natural log (since lambda from Box Cox modelling was found to be 0). No association was found for GI and VWV (Table 5.2).
84
With regards to dietary pulse intake, there was a significant negative association between log pulse intake and VWV (β= -0.024, p=0.013). With regards to other dietary variables, VWV was significantly associated negatively with log vegetable protein (β= -0.206, p=0.006), available carbohydrate (β= -0.006, p=0.014), glycemic load (GL) (β= -0.002, p=0.003) and starch (β= -0.009, p<0.001), and positively with saturated fat (β= 0.015, p=0.021), dietary cholesterol (β= 0.001, p<0.001), total protein (β=0.011, p=0.024), log red meat protein (β=0.020, p=0.003), and log egg protein (β=0.096, p=0.044) in fully adjusted models (Table 5.2). Sensitivity analyses revealed consistency in results. GL is a calculation of GI and available carbohydrate, therefore available carbohydrate was added to the model of GL and VWV, in which GL was then no longer significant (p=0.126). Further analyses in the whole group were conducted to explore the associations found with dietary variables and VWV. When saturated fat and available carbohydrate were both included in the fully adjusted model, neither remained significant (p=0.168 and p=0.278, respectively), which may be the result of the strong correlation between these variables (r= -0.582, p<0.001). Dietary cholesterol and log red meat protein were both strongly correlated with saturated fat intake (r=0.376, p<0.001 and r=0.291, p<0.01, respectively), however remained significant when saturated fat was added to the models (p=0.009 and p=0.0194, respectively) but saturated fat was not significant in either of these (p=0.060 and p=0.0774, respectively). Similarly, when available carbohydrate was added to the model instead of saturated fat, both dietary cholesterol and red meat protein remained significant (p=0.011 and p=0.020, respectively). When starch was instead added, they remained significant (p=0.018 and p=0.031, respectively) but starch was also significant (p=0.007 and p=0.006, respectively for the two models). When both dietary cholesterol and log red meat protein were both included in the fully adjusted model, they were both significant (p=0.017 and p=0.024, respectively), thus are independently associated with VWV. Interestingly, when saturated fat and starch are together in the full model, only starch remained significant (p=0.006), whereas saturated fat was not (p=0.178). Furthermore, when all protein sources were included in the full model (including red meat, chicken, fish, dairy, egg, and vegetable), red meat was the only significant contributor (p=0.041) (Table 5.3).
85
To explore starch, each major source of starch in the diet was assessed, including potato, pasta, rice, bread and dietary pulses, where crude calculations of grams of starch coming from each carbohydrate source was used in analyses. To calculate starch, the following foods were used: boiled white potato, cooked macaroni for pasta, long grain rice, white and whole wheat bread, and the average starch from 3 beans (chickpea, black bean, and kidney bean) and lentils. Starch from each source was expressed as percentage of total calories (%kcal) for each variable in the models. All other sources were pooled and entitled “other starch”. All starch sources were added to the fully adjusted model and then using a stepwise regression, one starch source was removed at a time based on least significant contribution to the model. Pulse starch was the only remaining significant contributor to the association with VWV (p=0.014) (Table 5.4). When components of starch, which include fiber, vegetable protein, GI and available carbohydrate, were added to the model, starch was no longer significant (p=0.096), therefore these components may explain the effect of starch observed. In terms of associations with anthropometric and bloodwork measures, GI was significantly association positively with HbA1c (β=0.184, p=0.020) and negatively with systolic blood pressure (β= -0.162, p=0.041) in unadjusted models. The association between GI and HbA1c remained significant in energy and age adjusted models, however became non-significant in the fully adjusted model (p=0.053). The association between GI and systolic blood pressure became non-significant when either energy or age were added to the model, as well as in the fully adjusted model (p=0.097). Dietary pulse intake was not significantly association with any anthropometric or blood measures. The GEE of the fully adjusted model of VWV and dietary pulse intake, is presented as a graph in Figure 5.1. This analysis revealed a logarithmic association where an approximately one Canadian ¾ cup serving/d330 (~132g/d) of dietary pulses is associated with an ~8% lower VWV compared to the VWV in those consuming 0g/d.
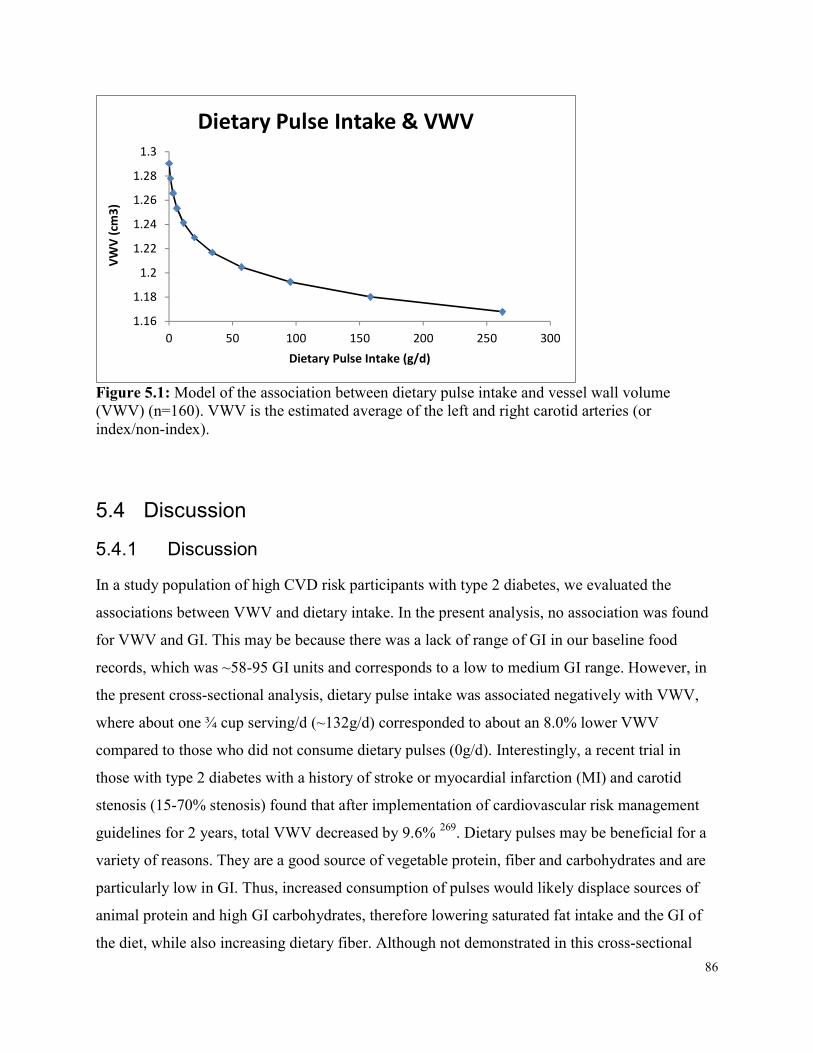
86
1.161.18
1.21.221.241.261.28
1.3
0 50 100 150 200 250 300
VWV (c
m3)
Dietary Pulse Intake (g/d)
Dietary Pulse Intake & VWV
Figure 5.1: Model of the association between dietary pulse intake and vessel wall volume (VWV) (n=160). VWV is the estimated average of the left and right carotid arteries (or index/non-index).
5.4 Discussion 5.4.1 Discussion In a study population of high CVD risk participants with type 2 diabetes, we evaluated the associations between VWV and dietary intake. In the present analysis, no association was found for VWV and GI. This may be because there was a lack of range of GI in our baseline food records, which was ~58-95 GI units and corresponds to a low to medium GI range. However, in the present cross-sectional analysis, dietary pulse intake was associated negatively with VWV, where about one ¾ cup serving/d (~132g/d) corresponded to about an 8.0% lower VWV compared to those who did not consume dietary pulses (0g/d). Interestingly, a recent trial in those with type 2 diabetes with a history of stroke or myocardial infarction (MI) and carotid stenosis (15-70% stenosis) found that after implementation of cardiovascular risk management guidelines for 2 years, total VWV decreased by 9.6% 269. Dietary pulses may be beneficial for a variety of reasons. They are a good source of vegetable protein, fiber and carbohydrates and are particularly low in GI. Thus, increased consumption of pulses would likely displace sources of animal protein and high GI carbohydrates, therefore lowering saturated fat intake and the GI of the diet, while also increasing dietary fiber. Although not demonstrated in this cross-sectional
87
analysis, dietary pulses may improve carotid plaque through improved body weight 347, glycemia 223 and cholesterol 323, since these have previously been demonstrated in systematic reviews and meta-analyses to be significantly improved by increased pulse intake. Another recent systematic review and meta-analysis suggested that pulses may reduce inflammation334 , which may also affect carotid plaque burden as inflammation within atherosclerotic lesions increases the risk for plaque rupture and subsequent thromboembolism 335. Pulse intake has also been demonstrated to be associated with reduced risk of CHD and CVD 318-320. The positive association between VWV and saturated fat intake is of interest in light of recent meta-analyses of prospective studies since 1980 that do not show an association between saturated fat and CVD 348, 349, where part of the reason may be the comparator. A relative negative effect of saturated fat was demonstrated on CVD risk when compared to polyunsaturated fats350. In addition, a recent meta-analysis of randomized controlled trials demonstrated that a reduction in saturated fat intake reduced CVD events by 17% and MI by 10% 351. The significant positive association with dietary cholesterol is possibly just a marker of a diet that is higher in animal versus plant foods, since it was highly correlated with log red meat protein (r=0.29, p<0.001) and negatively with log vegetable protein (r= -0.38, p<0.001), and a lower fiber intake (r= -0.33, p<0.001). Indeed, large cohort studies and systematic reviews and meta-analyses have demonstrated that increased red meat intake is associated with a higher risk of CVD mortality 352, 353, whereas increased dietary fiber intake is associated with lower risk of CVD and all-cause mortality 354. The present results on protein are similar to what has been demonstrated previously. For example, the Health Professionals’ Follow Up Study (HPFU) found a positive trend in risk of ischemic heart disease (IHD) by quintiles of percentage of energy from total protein, as well as a positive trend for animal and a negative trend for vegetable protein 355. Additionally, the Nurses’ Health Study (NHS) demonstrated that higher intakes of red meat, as well as red meat excluding processed meat, were significantly associated with elevated risk of CHD356. A recent review on protein and CVD risk also supports the use of plant sources of protein and limiting saturated fat357.
88
Further to the significant positive association with total protein, when log red meat protein was added to the fully adjusted model with protein, protein was no longer significant (p=0.220) and log red meat protein demonstrated a non-significant trend (p=0.070). When multiple protein sources, including chicken, dairy, egg, fish, soy and vegetable, were combined in a fully adjusted model to assess contributions, only log red meat protein was significant (p=0.041) and only vegetable protein was negatively associated with VWV. The significant association between available carbohydrates and VWV may also be explained by the association with saturated fat as it is the converse, that is, the result of lower saturated fat intake.
5.4.2 Strengths and Limitations The strengths of these analyses are that the VWV measures were obtained from non-invasive MRI scans and that dietary intake data were obtained from 7-day food records which were reviewed by study dietitians in the presence of the participant. MRI is a preferred imaging modality since has been validated against histology and has high reproducibility and accuracy37. MRI also has the added advantage over other imaging techniques in its ability to image the entire circumference of the carotid wall bulb where plaque forms in its earliest stage, including the outer wall of the carotid 38. Another strength of the analyses is the inclusion criteria of high risk study participants since all eligible participants had to have a CIMT≥1.2mm which is considered to indicate high CVD risk 250. A limitation of these analyses is the cross-sectional design of the study, thus we cannot infer causality. Another limitation is the limited range in baseline intake of some of the dietary variables, for example GI, as well as other particularly low GI foods, such as pasta and temperate climate fruit, which reduce the ability to explore relationships. Furthermore, participants had relatively well controlled diabetes (HbA1c 6.5-8.0%), blood pressure (mean 125±12/72±9mm Hg) and LDL-cholesterol (mean 2.2±0.9mmol/L), with ~ 70% on blood pressure medication and ~76% on cholesterol-lowering medication, therefore possibly limiting the ability to assess associations between CVD risk factors and VWV and dietary intake. Additionally, the anthropometric and blood measures in these analyses reflect at most the past few months, as opposed to the past years during which carotid plaque may have been developing, thus limiting
89
the ability to assess associations between the CVD risk factors and VWV. Since the participants were at high cardiovascular risk, this limits application to a healthier cohort. Although there was a sex difference in the association with VWV, there was inadequate sample size and variability within the female sex to explore whether the dietary associations with VWV actually differ between the sexes. Another limitation is possible residual confounding due to unmeasured or uncontrolled variables, however, known CVD risk factors were adjusted for in analyses. Although 7-day food records best capture food intake, our baseline foods records capture only the past 7 days, whereas carotid plaque may have been developing over years. The average disease duration of diabetes in our population is approximately 8 years, therefore diet modifications may have occurred over this time, and so dietary intakes which may have contributed to plaque development for the majority of the disease may not be captured in the 7 day records, whereas they might have been captured by a food frequency questionnaire.
5.5 Conclusion No association was found for GI and VWV, however dietary pulses as key low GI foods were significantly associated with lower baseline VWV. Conversely, saturated fat intake was signficantly associated with higher baseline VWV. These results may reflect quantity and quality of carbohydrate intake, and possible animal versus plant food intake. Therefore, importantly, using this new MRI technology to assess carotid arterial disease as plaque volume, we have been able to demonstrate that there may be a role for dietary variables in carotid plaque reduction, thus potentially altering CVD risk. Further exploration is warranted since these are cross-sectional analyses and the results of interventional trials are anticipated to shed light on these concepts which suggest a potential role for dietary pulses in CVD risk reduction in type 2 diabetes.
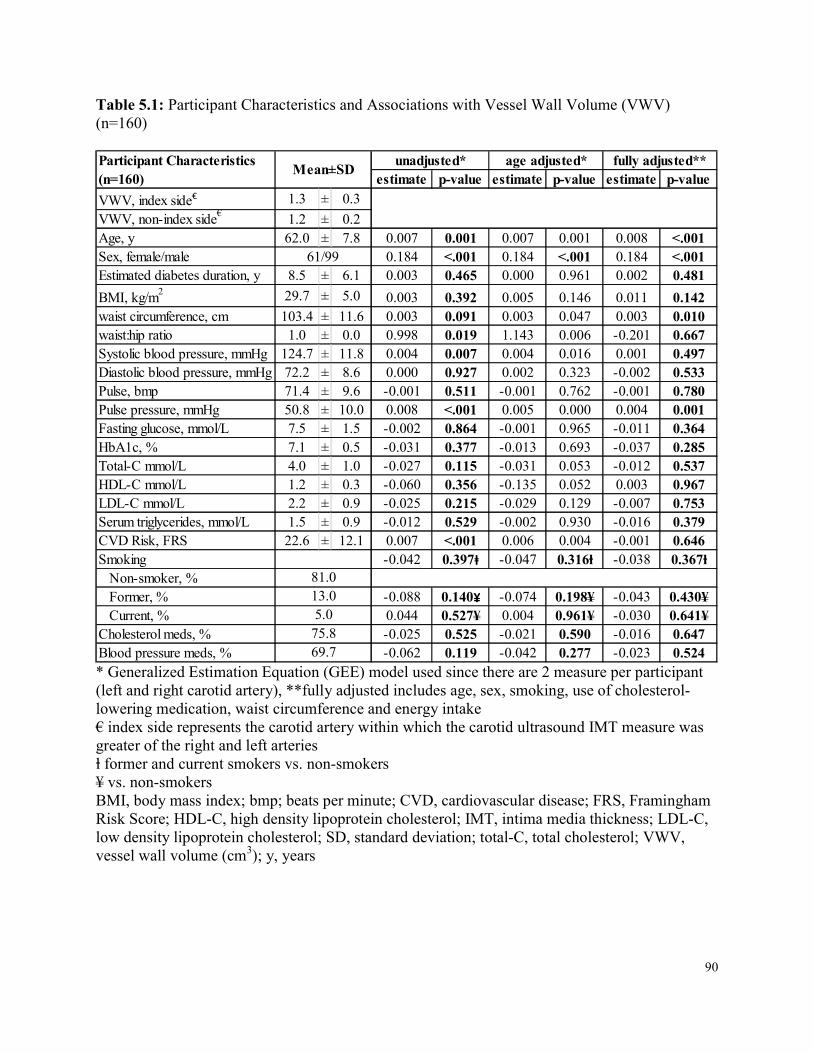
90
Table 5.1: Participant Characteristics and Associations with Vessel Wall Volume (VWV) (n=160)
estimate p-value estimate p-value estimate p-valueVWV, index side€ 1.3 ± 0.3VWV, non-index side€ 1.2 ± 0.2Age, y 62.0 ± 7.8 0.007 0.001 0.007 0.001 0.008 <.001Sex, female/male 0.184 <.001 0.184 <.001 0.184 <.001Estimated diabetes duration, y 8.5 ± 6.1 0.003 0.465 0.000 0.961 0.002 0.481BMI, kg/m2 29.7 ± 5.0 0.003 0.392 0.005 0.146 0.011 0.142waist circumference, cm 103.4 ± 11.6 0.003 0.091 0.003 0.047 0.003 0.010waist:hip ratio 1.0 ± 0.0 0.998 0.019 1.143 0.006 -0.201 0.667Systolic blood pressure, mmHg 124.7 ± 11.8 0.004 0.007 0.004 0.016 0.001 0.497Diastolic blood pressure, mmHg 72.2 ± 8.6 0.000 0.927 0.002 0.323 -0.002 0.533Pulse, bmp 71.4 ± 9.6 -0.001 0.511 -0.001 0.762 -0.001 0.780Pulse pressure, mmHg 50.8 ± 10.0 0.008 <.001 0.005 0.000 0.004 0.001Fasting glucose, mmol/L 7.5 ± 1.5 -0.002 0.864 -0.001 0.965 -0.011 0.364HbA1c, % 7.1 ± 0.5 -0.031 0.377 -0.013 0.693 -0.037 0.285Total-C mmol/L 4.0 ± 1.0 -0.027 0.115 -0.031 0.053 -0.012 0.537HDL-C mmol/L 1.2 ± 0.3 -0.060 0.356 -0.135 0.052 0.003 0.967LDL-C mmol/L 2.2 ± 0.9 -0.025 0.215 -0.029 0.129 -0.007 0.753Serum triglycerides, mmol/L 1.5 ± 0.9 -0.012 0.529 -0.002 0.930 -0.016 0.379CVD Risk, FRS 22.6 ± 12.1 0.007 <.001 0.006 0.004 -0.001 0.646Smoking -0.042 0.397ⱡ -0.047 0.316ⱡ -0.038 0.367ⱡ Non-smoker, % Former, % -0.088 0.140¥ -0.074 0.198¥ -0.043 0.430¥ Current, % 0.044 0.527¥ 0.004 0.961¥ -0.030 0.641¥Cholesterol meds, % -0.025 0.525 -0.021 0.590 -0.016 0.647Blood pressure meds, % -0.062 0.119 -0.042 0.277 -0.023 0.524
61/99
81.013.05.0
75.869.7
unadjusted* age adjusted* fully adjusted**Participant Characteristics (n=160) Mean±SD
* Generalized Estimation Equation (GEE) model used since there are 2 measure per participant (left and right carotid artery), **fully adjusted includes age, sex, smoking, use of cholesterol-lowering medication, waist circumference and energy intake € index side represents the carotid artery within which the carotid ultrasound IMT measure was greater of the right and left arteries ⱡ former and current smokers vs. non-smokers ¥ vs. non-smokers BMI, body mass index; bmp; beats per minute; CVD, cardiovascular disease; FRS, Framingham Risk Score; HDL-C, high density lipoprotein cholesterol; IMT, intima media thickness; LDL-C, low density lipoprotein cholesterol; SD, standard deviation; total-C, total cholesterol; VWV, vessel wall volume (cm3); y, years
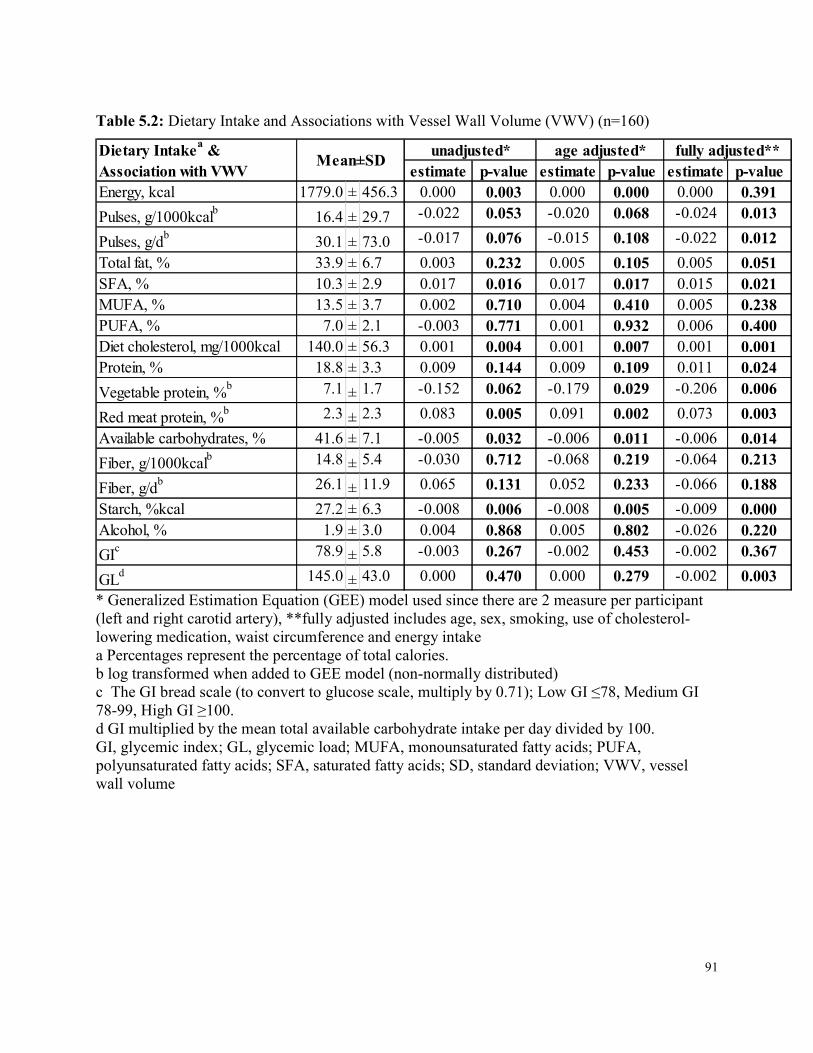
91
Table 5.2: Dietary Intake and Associations with Vessel Wall Volume (VWV) (n=160)
estimate p-value estimate p-value estimate p-valueEnergy, kcal 1779.0 ± 456.3 0.000 0.003 0.000 0.000 0.000 0.391Pulses, g/1000kcalb 16.4 ± 29.7 -0.022 0.053 -0.020 0.068 -0.024 0.013Pulses, g/db 30.1 ± 73.0 -0.017 0.076 -0.015 0.108 -0.022 0.012Total fat, % 33.9 ± 6.7 0.003 0.232 0.005 0.105 0.005 0.051SFA, % 10.3 ± 2.9 0.017 0.016 0.017 0.017 0.015 0.021MUFA, % 13.5 ± 3.7 0.002 0.710 0.004 0.410 0.005 0.238PUFA, % 7.0 ± 2.1 -0.003 0.771 0.001 0.932 0.006 0.400Diet cholesterol, mg/1000kcal 140.0 ± 56.3 0.001 0.004 0.001 0.007 0.001 0.001Protein, % 18.8 ± 3.3 0.009 0.144 0.009 0.109 0.011 0.024Vegetable protein, %b 7.1 ± 1.7 -0.152 0.062 -0.179 0.029 -0.206 0.006Red meat protein, %b 2.3 ± 2.3 0.083 0.005 0.091 0.002 0.073 0.003Available carbohydrates, % 41.6 ± 7.1 -0.005 0.032 -0.006 0.011 -0.006 0.014Fiber, g/1000kcalb 14.8 ± 5.4 -0.030 0.712 -0.068 0.219 -0.064 0.213Fiber, g/db 26.1 ± 11.9 0.065 0.131 0.052 0.233 -0.066 0.188Starch, %kcal 27.2 ± 6.3 -0.008 0.006 -0.008 0.005 -0.009 0.000Alcohol, % 1.9 ± 3.0 0.004 0.868 0.005 0.802 -0.026 0.220GIc 78.9 ± 5.8 -0.003 0.267 -0.002 0.453 -0.002 0.367GLd 145.0 ± 43.0 0.000 0.470 0.000 0.279 -0.002 0.003
Mean±SD unadjusted* age adjusted* fully adjusted**Dietary Intakea & Association with VWV
* Generalized Estimation Equation (GEE) model used since there are 2 measure per participant (left and right carotid artery), **fully adjusted includes age, sex, smoking, use of cholesterol-lowering medication, waist circumference and energy intake a Percentages represent the percentage of total calories. b log transformed when added to GEE model (non-normally distributed) c The GI bread scale (to convert to glucose scale, multiply by 0.71); Low GI ≤78, Medium GI 78-99, High GI ≥100. d GI multiplied by the mean total available carbohydrate intake per day divided by 100. GI, glycemic index; GL, glycemic load; MUFA, monounsaturated fatty acids; PUFA, polyunsaturated fatty acids; SFA, saturated fatty acids; SD, standard deviation; VWV, vessel wall volume
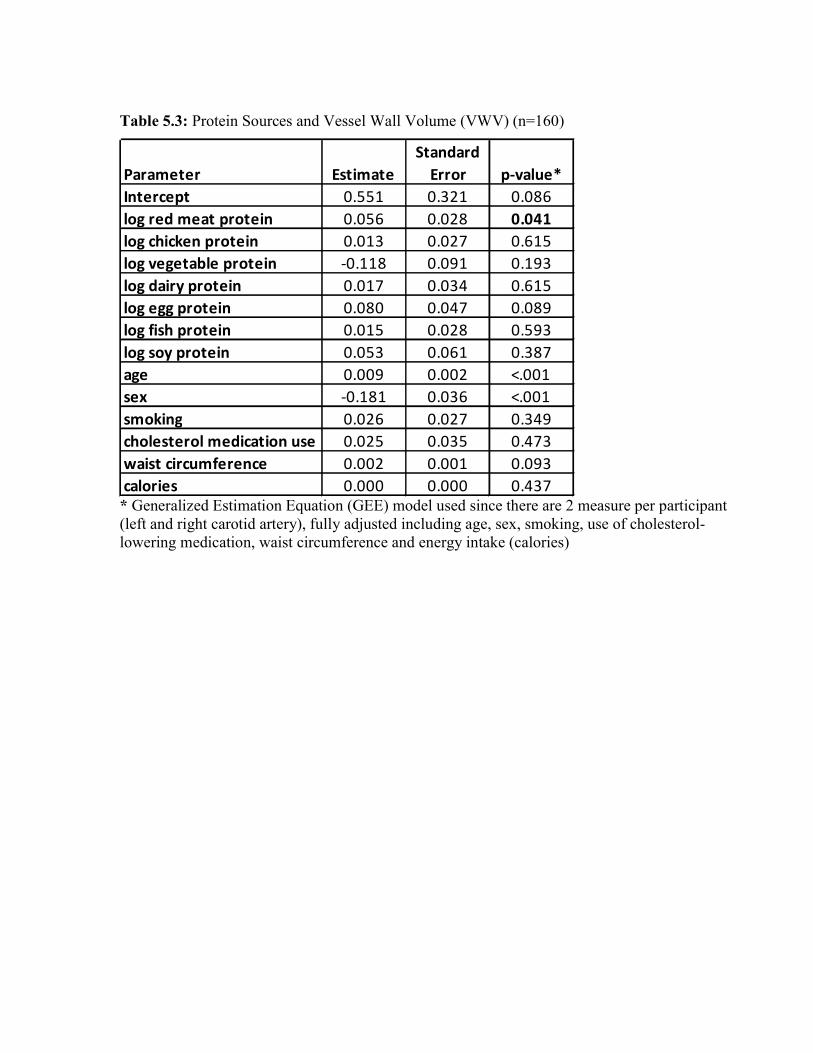
Table 5.3: Protein Sources and Vessel Wall Volume (VWV) (n=160)
Parameter EstimateStandard
Error p-value*Intercept 0.551 0.321 0.086log red meat protein 0.056 0.028 0.041log chicken protein 0.013 0.027 0.615log vegetable protein -0.118 0.091 0.193log dairy protein 0.017 0.034 0.615log egg protein 0.080 0.047 0.089log fish protein 0.015 0.028 0.593log soy protein 0.053 0.061 0.387age 0.009 0.002 <.001sex -0.181 0.036 <.001smoking 0.026 0.027 0.349cholesterol medication use 0.025 0.035 0.473waist circumference 0.002 0.001 0.093calories 0.000 0.000 0.437 * Generalized Estimation Equation (GEE) model used since there are 2 measure per participant
(left and right carotid artery), fully adjusted including age, sex, smoking, use of cholesterol-lowering medication, waist circumference and energy intake (calories)
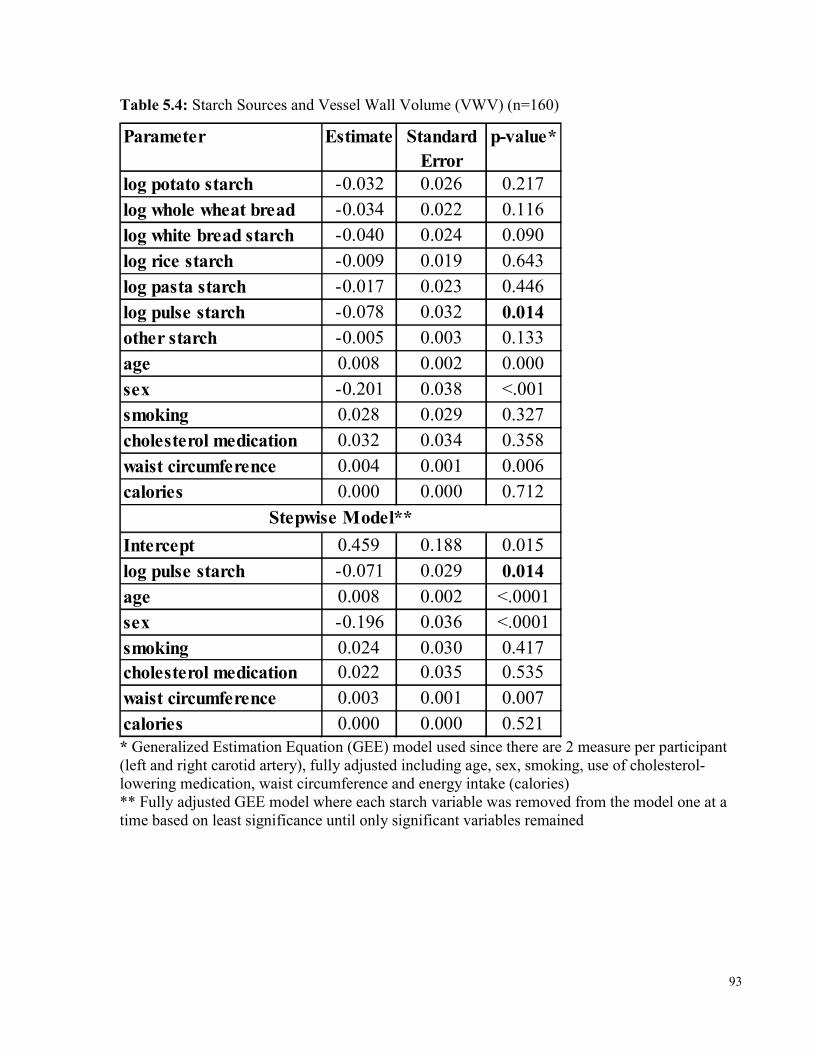
93
Table 5.4: Starch Sources and Vessel Wall Volume (VWV) (n=160) Parameter Estimate Standard
Errorp-value*
log potato starch -0.032 0.026 0.217log whole wheat bread -0.034 0.022 0.116log white bread starch -0.040 0.024 0.090log rice starch -0.009 0.019 0.643log pasta starch -0.017 0.023 0.446log pulse starch -0.078 0.032 0.014other starch -0.005 0.003 0.133age 0.008 0.002 0.000sex -0.201 0.038 <.001smoking 0.028 0.029 0.327cholesterol medication 0.032 0.034 0.358waist circumference 0.004 0.001 0.006calories 0.000 0.000 0.712
Intercept 0.459 0.188 0.015log pulse starch -0.071 0.029 0.014age 0.008 0.002 <.0001sex -0.196 0.036 <.0001smoking 0.024 0.030 0.417cholesterol medication 0.022 0.035 0.535waist circumference 0.003 0.001 0.007calories 0.000 0.000 0.521
Stepwise Model**
* Generalized Estimation Equation (GEE) model used since there are 2 measure per participant (left and right carotid artery), fully adjusted including age, sex, smoking, use of cholesterol-lowering medication, waist circumference and energy intake (calories) ** Fully adjusted GEE model where each starch variable was removed from the model one at a time based on least significance until only significant variables remained
94
Chapter 6 Adherence and the Effect of Provision of a Study Food in a Long
Term Clinical Trial on Glycemic Index in Type 2 Diabetes
6 Abstract Background: As a result of the continued rise in incidence of type 2 diabetes, strategies that may assist in the management of diabetes and its complications, especially cardiovascular disease (CVD), are of great interest. Low glycemic index (GI) diets have demonstrated effectiveness in improving glycemic control and CVD risk factors in randomized controlled trials, however most trials have been of short duration (<6 months). Therefore, there is a need to assess whether a low GI diet can be successfully incorporated into long term dietary changes and whether there are factors which can improve adherence to a low GI diet. Methods: Data were obtained from an ongoing randomized controlled trial assessing the effect of the GI on vascular disease in 169 participants with type 2 diabetes given either low GI or high cereal fiber dietary advice for 3 years. Participants attend clinic visits every 3 months where 7-day dietary food records are obtained. Mid-way through the trial, the provision of a free study bread to each diet group was initiated where participants could come to the clinic to pick up unlimited bread. All food records as of December 1, 2015 were analyzed and used for dietary assessments. As of December 1, 2015, 28 participants (12 on the low GI diet) completed the trial before the provision of free bread began and 82 (41 on the low GI diet) completed who had received free bread, which were used to assess adherence to the low GI dietary advice over 3 years. A total of 115 participants received free bread and were used to assess the effect of the provision by comparing the food records Pre and Post free bread. All analyses were undertaken using random coefficient models adjusted for baseline and energy intake using SAS version 9.4. Results: Of the 28 participants who completed the trial prior to the provision of free bread, the 12 who were on the low GI diet had an overall significant reduction of 11.7 GI units (p<0.001) over 3 years, whereas those on the high fiber diet had a 2.6 GI unit increase, resulting in a significant 14.3 GI unit difference between the 2 groups (p>0.001). The 82 completers who had received free bread had similar results and thus, when pooling all completers, those on the low GI diet had
95
an overall significant reduction of 11.0 GI units (p<0.001) and between the 2 diet groups, there was a significant 14.2 GI unit difference (p<0.001). Post provision of free bread on the low GI diet, resulted in significantly greater reductions in GI compared to Pre (-1.14 GI units, p=0.013). Additionally, nut (+1.5g/1000kcal, p<0.001) and vegetable protein intake (+1.43% kcal, p<0.001) increased, while low GI fruit (-0.4%kcal, p=0.005) and low GI prescribed bread intake (-13g/1000kcal, p<0.001) decreased. Dietary pulse intake increased non-significantly (6.1g/d, p=0.172). Conclusions: Low GI dietary advice is sustainable and well incorporated into long term dietary changes since significant reductions in GI which have been observed in 3- and 6-month trials can be maintained up to 3 years. The provision of a free study food, particularly one from a food group that is commonly consumed, such as bread, may assist in continued adherence to low GI dietary advice, however further improvements may be observed if inconvenience in obtaining the free food is addressed. Therefore, a low GI diet can be successfully adopted and sustained long term and may be in the population at large, especially with education on which carbohydrate foods make good choices and making them readily accessible on supermarket shelves.
6.1 Introduction Due to the global rise in incidence of type 2 diabetes, there is an increased interest in strategies that may assist in the management of glycemic control, as well as the risk of cardiovascular disease (CVD) since this is the primary cause of death in this population, including dietary and lifestyle strategies. Low glycemic index (GI) foods, which have a lower glycemic burden, have been demonstrated to improve glycemic control in type 2 diabetes 13, 17, 18, 112 and have also demonstrated possible effectiveness in randomized controlled trials in improving CVD risk factors, including blood pressure 13, 112 and cholesterol 14-17. These low GI trials have generally had short follow up periods (<6 months), thus there is not only a need for low GI trials specifically designed to assess CVD more directly, but also to assess how well a low GI diet can be followed over a longer period of time (>1 year) and whether there are particular aspects of a low GI diet that are more likely to be adopted.
96
Additionally, one of the major challenges with long term dietary intervention trials is continued adherence. Although metabolically controlled studies circumvent this issue, they greatly increase budgetary requirements and remove all opportunity for free choice and application of dietary principles of the intervention by the participants, thus lack any demonstration of effectiveness. Provision of a study food in an intervention trial, however may be a suitable alternative solution. An early study in 1968 found that participants who were given the opportunity to purchase appropriate fat modified foods from study distribution centers had 35% greater reductions in serum cholesterol than those given dietary instruction alone over a 2-year period 358. In the early 1990s, the Lyon Heart Study (terminated at 27 months) provided a canola oil-based margarine, with a composition similar to olive oil, in the Mediterranean intervention arm as an integrative part of the Mediterranean diet model and found significant reduction in coronary heart disease (CHD) events compared to the control regular French diet 42. Similarly, the PREDIMED study (median 4.7 years follow up) used the rationale for provision of olive oil and nuts at participants’ 3-monthly visits that they would help with the overall Mediterranean dietary food pattern and furthermore, that provisions would improve compliance by providing extra for the family unit43. Both these studies provided one study food of the intervention with the goal of improving adherence to the entire diet and they both demonstrated success in benefit to the primary outcome (CHD and CVD, respectively). In our randomized controlled clinical trial on the effect of a low GI diet over 3 years in those with type 2 diabetes, the original dietary intervention was advice alone. However, as a result of perceived challenges in accessing key low GI foods and thus on adherence to the diet, and after the recent publication of the PREDIMED results, we saw the provision of a food as a potential strategy to address this challenge. Therefore, mid-way through our trial, we elected to provide study bread to each arm of the trial to assess if the provision of a study food would affect adherence in our long term clinical trial. Our overall aims were to assess: (1) whether a low GI diet is sustainable long term, (2) what dietary changes high risk people may adopt when given low GI dietary advice, (3) whether provision of a low GI food affects adherence to low GI dietary advice by comparing the food records of participants prior to free bread with their food records after (post) free bread, as well as to compare those participants who had already completed the trial without free bread to those who had received free bread.
97
6.2 Methods 6.2.1 Study Design These analyses were conducted within an ongoing randomized controlled, parallel group, dietary intervention trial assessing the effect of the GI on vascular disease in type 2 diabetes over 3 years (Trial Registration: clinicaltrials.gov identifier: NCT01063374). Participants were randomly assigned to either a low GI or a high cereal fiber diet for 3 years. The design of the trial has been reported (Chapter 2). The protocol and consent forms were approved by the research ethics board of St. Michael’s Hospital and all participants gave informed consent prior to participating.
6.2.1.1 Study Participants The study randomized 169 men and women with type 2 diabetes. Participants had an HbA1c between 6.5 and 8.0% at screening, were on oral hypoglycemic agents at a stable dose for ≥8 weeks, not taking insulin, did not have a major cardiovascular event (stroke or myocardial infarction) or major surgery in the 6 months prior to screening, and were otherwise healthy. They also had detectable carotid plaque (carotid intima media thickness, CIMT ≥1.2mm) as assessed by a carotid ultrasound scan (CUS).
6.2.1.2 Dietary Intervention Participants were randomized to receive dietary advice on either a low GI or high cereal fiber diet for 3 years along with advice on the National Cholesterol Education Program Adult Treatment Panel III (ATP III) diet (<7% saturated fat and <200 mg dietary cholesterol daily) 301. Diet histories were recorded for the 7 days prior to their clinic visits every 3 months, assessed for detail and consistency by the dietitian in the participant’s presence, and used to assist in determining diet challenges and encouragement of the appropriate diet intervention. Low GI dietary advice includes the encouragement to eat intact grain cereals, including specific low GI breads, pasta, parboiled rice, coarse cut oats, Red River and All Bran Buds with psyllium breakfast cereals, cooked dried or canned peas, beans or lentils, barley and low GI temperate climate fruit, including apples, oranges and berries.
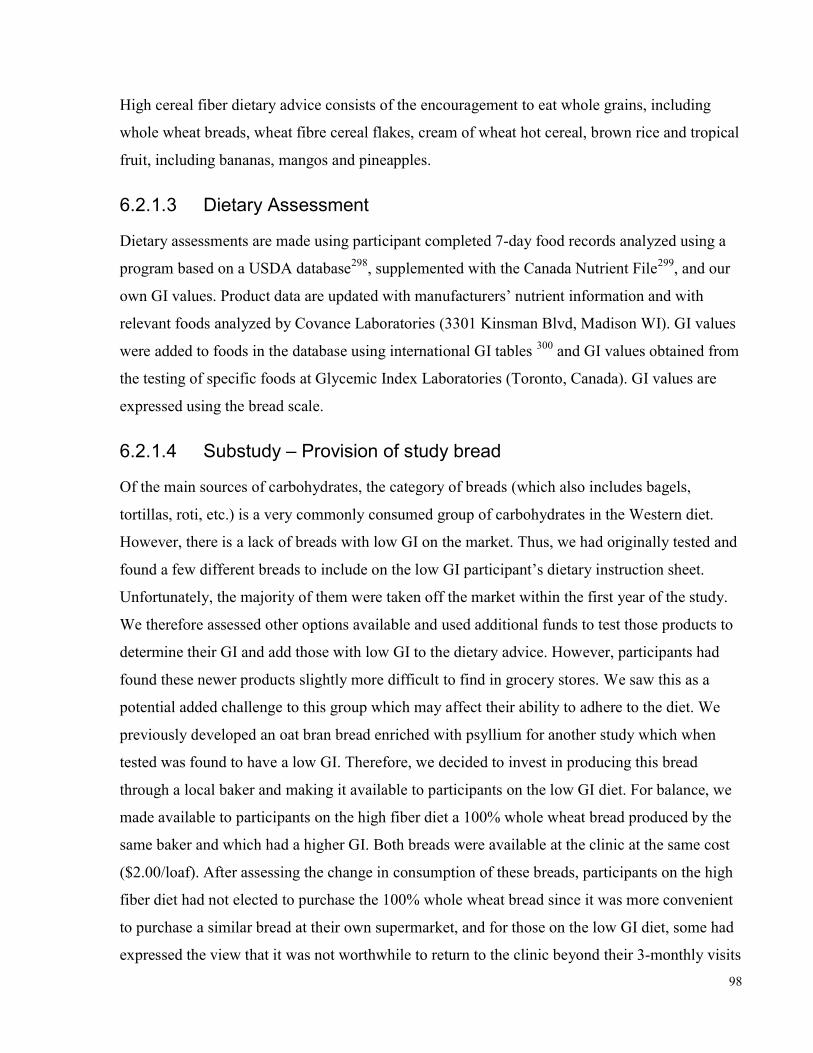
98
High cereal fiber dietary advice consists of the encouragement to eat whole grains, including whole wheat breads, wheat fibre cereal flakes, cream of wheat hot cereal, brown rice and tropical fruit, including bananas, mangos and pineapples.
6.2.1.3 Dietary Assessment Dietary assessments are made using participant completed 7-day food records analyzed using a program based on a USDA database298, supplemented with the Canada Nutrient File299, and our own GI values. Product data are updated with manufacturers’ nutrient information and with relevant foods analyzed by Covance Laboratories (3301 Kinsman Blvd, Madison WI). GI values were added to foods in the database using international GI tables 300 and GI values obtained from the testing of specific foods at Glycemic Index Laboratories (Toronto, Canada). GI values are expressed using the bread scale.
6.2.1.4 Substudy – Provision of study bread Of the main sources of carbohydrates, the category of breads (which also includes bagels, tortillas, roti, etc.) is a very commonly consumed group of carbohydrates in the Western diet. However, there is a lack of breads with low GI on the market. Thus, we had originally tested and found a few different breads to include on the low GI participant’s dietary instruction sheet. Unfortunately, the majority of them were taken off the market within the first year of the study. We therefore assessed other options available and used additional funds to test those products to determine their GI and add those with low GI to the dietary advice. However, participants had found these newer products slightly more difficult to find in grocery stores. We saw this as a potential added challenge to this group which may affect their ability to adhere to the diet. We previously developed an oat bran bread enriched with psyllium for another study which when tested was found to have a low GI. Therefore, we decided to invest in producing this bread through a local baker and making it available to participants on the low GI diet. For balance, we made available to participants on the high fiber diet a 100% whole wheat bread produced by the same baker and which had a higher GI. Both breads were available at the clinic at the same cost ($2.00/loaf). After assessing the change in consumption of these breads, participants on the high fiber diet had not elected to purchase the 100% whole wheat bread since it was more convenient to purchase a similar bread at their own supermarket, and for those on the low GI diet, some had expressed the view that it was not worthwhile to return to the clinic beyond their 3-monthly visits
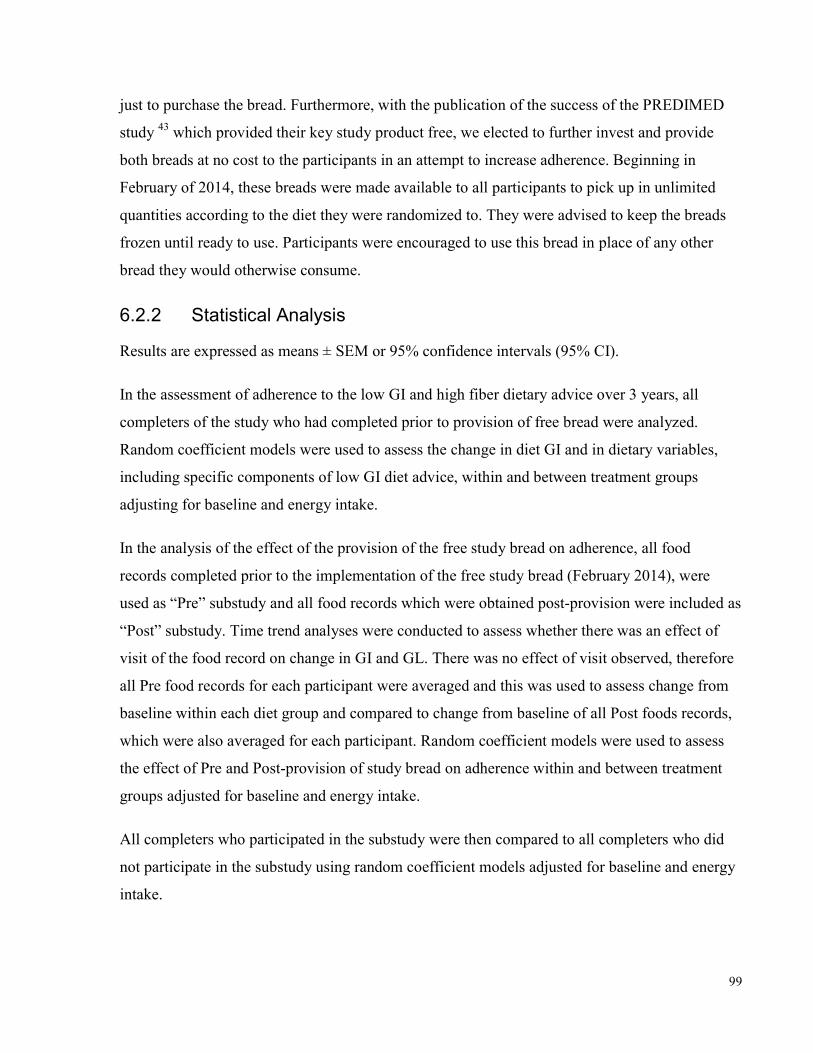
99
just to purchase the bread. Furthermore, with the publication of the success of the PREDIMED study 43 which provided their key study product free, we elected to further invest and provide both breads at no cost to the participants in an attempt to increase adherence. Beginning in February of 2014, these breads were made available to all participants to pick up in unlimited quantities according to the diet they were randomized to. They were advised to keep the breads frozen until ready to use. Participants were encouraged to use this bread in place of any other bread they would otherwise consume.
6.2.2 Statistical Analysis Results are expressed as means ± SEM or 95% confidence intervals (95% CI). In the assessment of adherence to the low GI and high fiber dietary advice over 3 years, all completers of the study who had completed prior to provision of free bread were analyzed. Random coefficient models were used to assess the change in diet GI and in dietary variables, including specific components of low GI diet advice, within and between treatment groups adjusting for baseline and energy intake. In the analysis of the effect of the provision of the free study bread on adherence, all food records completed prior to the implementation of the free study bread (February 2014), were used as “Pre” substudy and all food records which were obtained post-provision were included as “Post” substudy. Time trend analyses were conducted to assess whether there was an effect of visit of the food record on change in GI and GL. There was no effect of visit observed, therefore all Pre food records for each participant were averaged and this was used to assess change from baseline within each diet group and compared to change from baseline of all Post foods records, which were also averaged for each participant. Random coefficient models were used to assess the effect of Pre and Post-provision of study bread on adherence within and between treatment groups adjusted for baseline and energy intake. All completers who participated in the substudy were then compared to all completers who did not participate in the substudy using random coefficient models adjusted for baseline and energy intake.
100
6.3 Results 6.3.1 Adherence over 3 years - within NonSubstudy Completers Baseline dietary intakes of the nonsubstudy completers are presented within Table 6.1 for each diet group. At baseline, both groups were consuming similar diets (~44% available carbohydrate, ~32% fat, ~18-19% protein) with both saturated fat (~10%) and total dietary fiber (~25g/d) intakes being consumed close to recommended levels 301, 330. Baseline GI was ~79 in both diet groups, which falls in the medium GI category (medium GI 78-99, bread scale) and dietary pulse intake was about 25g/d which is about 1/8th of a cup (i.e., 1/6th of a recommended serving according to Canada’s food guide330). Overall, on the low GI intervention, there was a significant reduction in GI of 11.7 GI units and a significant increase in dietary fiber of 7.2g/1000kcal (~10.8g/d). On the high fiber intervention, there was an increase in GI of 2.6 GI units and a significant increase in dietary fiber of 4.6g/1000kcal (~7.4g/d). During the study, the difference in GI between the low GI (-11.7 GI units) and high fiber (+2.6 GI units) diet groups was statistically significant, at 14.3 GI units (p<0.001), and remained significant after adjustment for baseline and calories (p<0.001). The difference in total dietary fiber intake between the diet groups during the study was ~2.6g/1000kcal, which was not statistically significantly different (p=0.077). These changes were fairly consistent over time (Figure 6.1 and Figure 6.2).
101
5060708090
100
0 3 6 9 12 15 18 21 24 27 30 33 36
GI (B
read S
cale)
Visits (months)
GI Values* - Non-Substudy Participants -Completers
HighFiber(n=16)LowGI(n=12)
Figure 6.1: Dietary GI over 3 years in non-substudy completers by dietary intervention *GI values are based on the bread scale (to convert to glucose scale, multiply by 0.71); Low GI ≤78, Medium GI 78-99, High GI ≥100. GI, glycemic index
01020304050
0 3 6 9 12 15 18 21 24 27 30 33 36
Dietar
y Fibe
r Intak
e (g/d)
Study Visits (months)
Dietary Fiber Intake - Non-Substudy Participants - Completers
HighFiber(n=16)Low GI(n=12)
Figure 6.2: Dietary fiber intakes over 3 years in non-substudy completers by dietary intervention
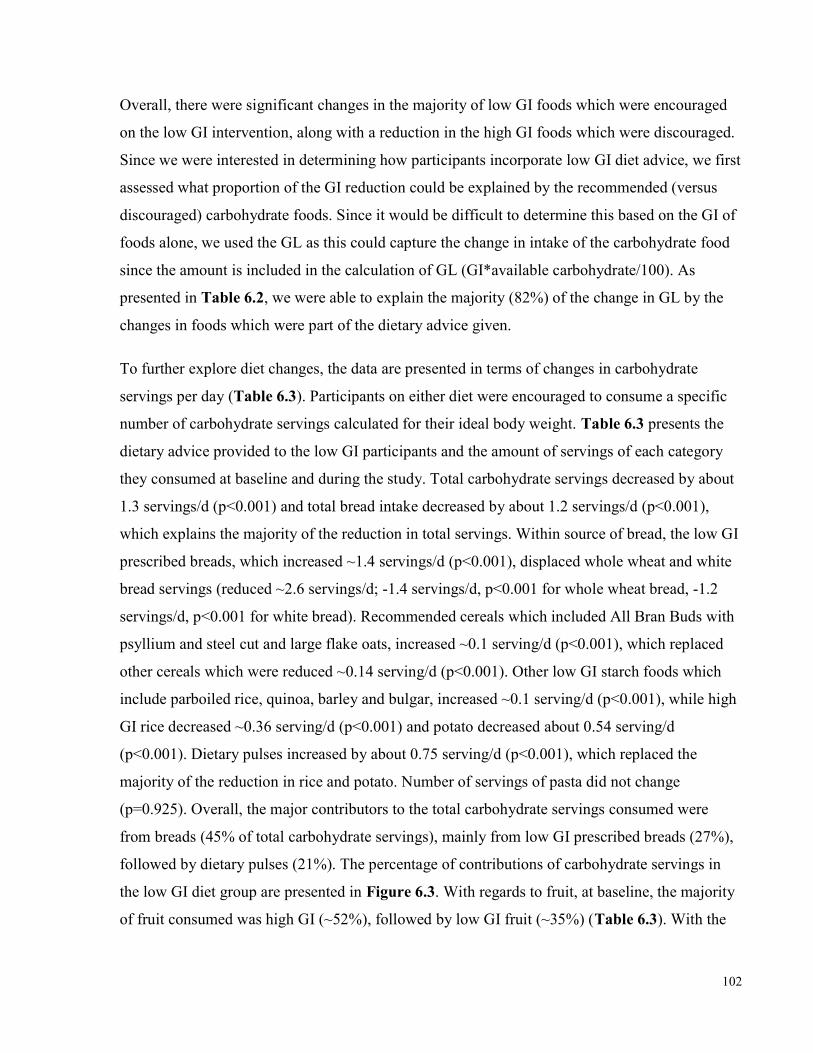
102
Overall, there were significant changes in the majority of low GI foods which were encouraged on the low GI intervention, along with a reduction in the high GI foods which were discouraged. Since we were interested in determining how participants incorporate low GI diet advice, we first assessed what proportion of the GI reduction could be explained by the recommended (versus discouraged) carbohydrate foods. Since it would be difficult to determine this based on the GI of foods alone, we used the GL as this could capture the change in intake of the carbohydrate food since the amount is included in the calculation of GL (GI*available carbohydrate/100). As presented in Table 6.2, we were able to explain the majority (82%) of the change in GL by the changes in foods which were part of the dietary advice given. To further explore diet changes, the data are presented in terms of changes in carbohydrate servings per day (Table 6.3). Participants on either diet were encouraged to consume a specific number of carbohydrate servings calculated for their ideal body weight. Table 6.3 presents the dietary advice provided to the low GI participants and the amount of servings of each category they consumed at baseline and during the study. Total carbohydrate servings decreased by about 1.3 servings/d (p<0.001) and total bread intake decreased by about 1.2 servings/d (p<0.001), which explains the majority of the reduction in total servings. Within source of bread, the low GI prescribed breads, which increased ~1.4 servings/d (p<0.001), displaced whole wheat and white bread servings (reduced ~2.6 servings/d; -1.4 servings/d, p<0.001 for whole wheat bread, -1.2 servings/d, p<0.001 for white bread). Recommended cereals which included All Bran Buds with psyllium and steel cut and large flake oats, increased ~0.1 serving/d (p<0.001), which replaced other cereals which were reduced ~0.14 serving/d (p<0.001). Other low GI starch foods which include parboiled rice, quinoa, barley and bulgar, increased ~0.1 serving/d (p<0.001), while high GI rice decreased ~0.36 serving/d (p<0.001) and potato decreased about 0.54 serving/d (p<0.001). Dietary pulses increased by about 0.75 serving/d (p<0.001), which replaced the majority of the reduction in rice and potato. Number of servings of pasta did not change (p=0.925). Overall, the major contributors to the total carbohydrate servings consumed were from breads (45% of total carbohydrate servings), mainly from low GI prescribed breads (27%), followed by dietary pulses (21%). The percentage of contributions of carbohydrate servings in the low GI diet group are presented in Figure 6.3. With regards to fruit, at baseline, the majority of fruit consumed was high GI (~52%), followed by low GI fruit (~35%) (Table 6.3). With the
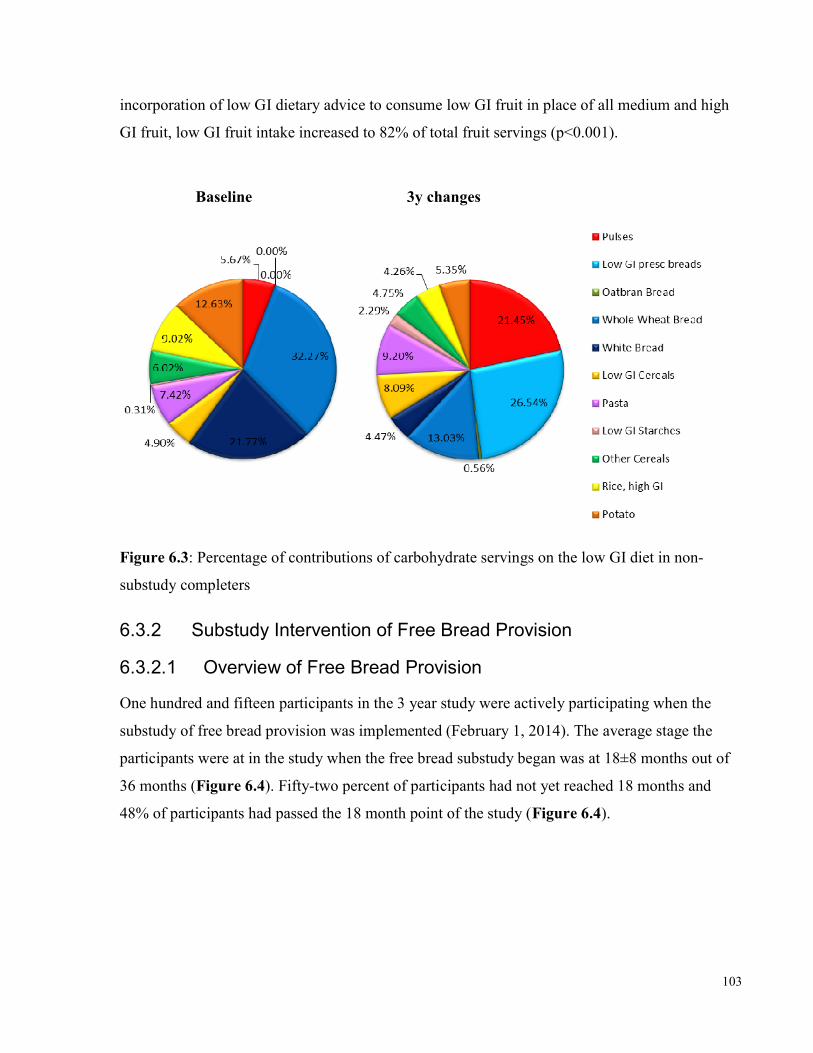
103
incorporation of low GI dietary advice to consume low GI fruit in place of all medium and high GI fruit, low GI fruit intake increased to 82% of total fruit servings (p<0.001). Baseline 3y changes
Figure 6.3: Percentage of contributions of carbohydrate servings on the low GI diet in non-substudy completers
6.3.2 Substudy Intervention of Free Bread Provision 6.3.2.1 Overview of Free Bread Provision One hundred and fifteen participants in the 3 year study were actively participating when the substudy of free bread provision was implemented (February 1, 2014). The average stage the participants were at in the study when the free bread substudy began was at 18±8 months out of 36 months (Figure 6.4). Fifty-two percent of participants had not yet reached 18 months and 48% of participants had passed the 18 month point of the study (Figure 6.4).
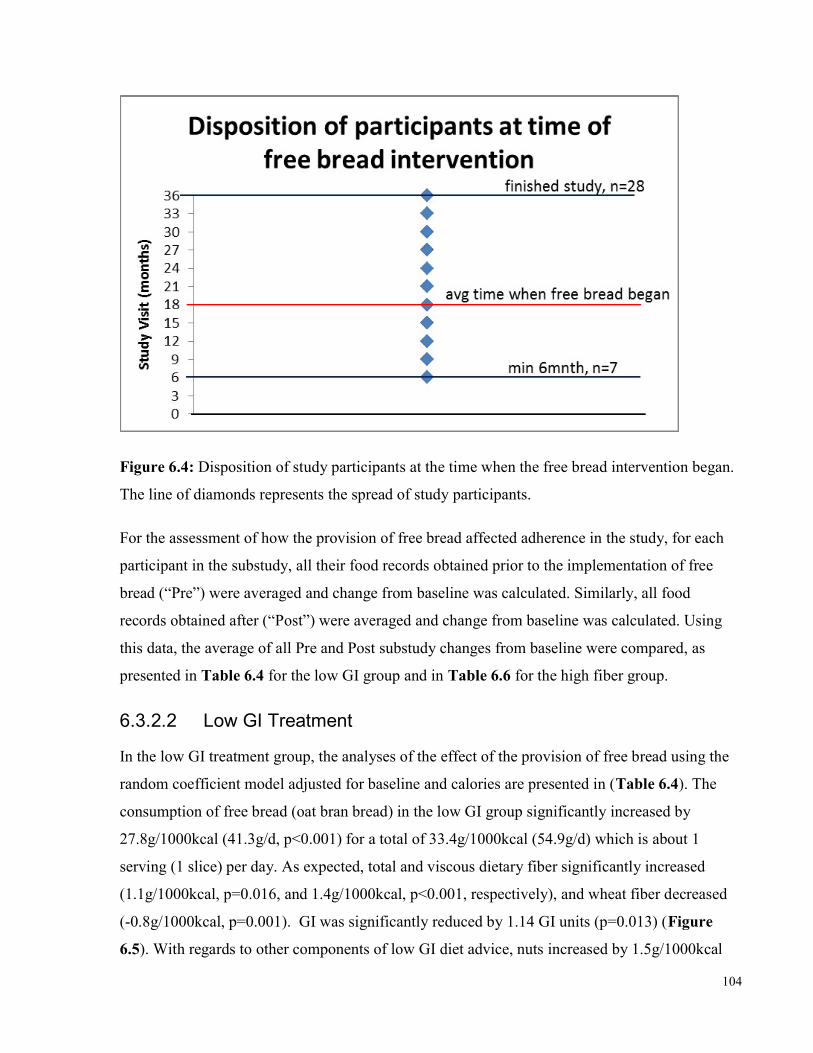
104
Figure 6.4: Disposition of study participants at the time when the free bread intervention began. The line of diamonds represents the spread of study participants. For the assessment of how the provision of free bread affected adherence in the study, for each participant in the substudy, all their food records obtained prior to the implementation of free bread (“Pre”) were averaged and change from baseline was calculated. Similarly, all food records obtained after (“Post”) were averaged and change from baseline was calculated. Using this data, the average of all Pre and Post substudy changes from baseline were compared, as presented in Table 6.4 for the low GI group and in Table 6.6 for the high fiber group.
6.3.2.2 Low GI Treatment In the low GI treatment group, the analyses of the effect of the provision of free bread using the random coefficient model adjusted for baseline and calories are presented in (Table 6.4). The consumption of free bread (oat bran bread) in the low GI group significantly increased by 27.8g/1000kcal (41.3g/d, p<0.001) for a total of 33.4g/1000kcal (54.9g/d) which is about 1 serving (1 slice) per day. As expected, total and viscous dietary fiber significantly increased (1.1g/1000kcal, p=0.016, and 1.4g/1000kcal, p<0.001, respectively), and wheat fiber decreased (-0.8g/1000kcal, p=0.001). GI was significantly reduced by 1.14 GI units (p=0.013) (Figure 6.5). With regards to other components of low GI diet advice, nuts increased by 1.5g/1000kcal
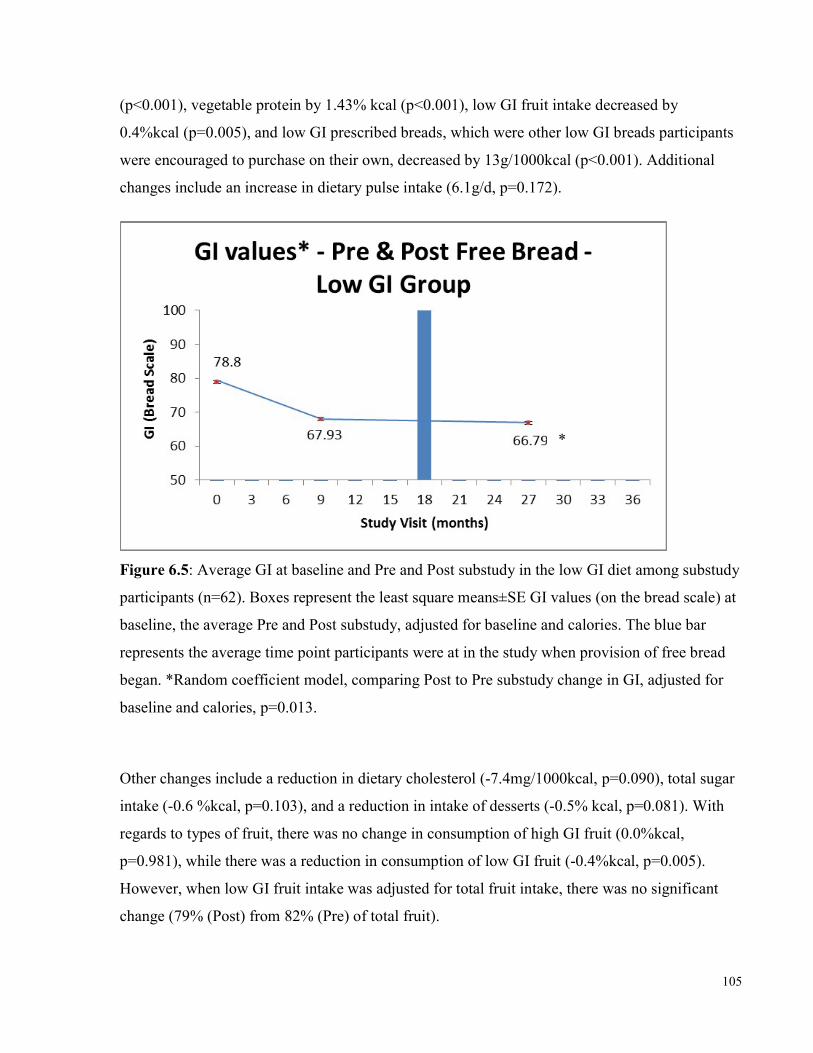
105
(p<0.001), vegetable protein by 1.43% kcal (p<0.001), low GI fruit intake decreased by 0.4%kcal (p=0.005), and low GI prescribed breads, which were other low GI breads participants were encouraged to purchase on their own, decreased by 13g/1000kcal (p<0.001). Additional changes include an increase in dietary pulse intake (6.1g/d, p=0.172).
Figure 6.5: Average GI at baseline and Pre and Post substudy in the low GI diet among substudy participants (n=62). Boxes represent the least square means±SE GI values (on the bread scale) at baseline, the average Pre and Post substudy, adjusted for baseline and calories. The blue bar represents the average time point participants were at in the study when provision of free bread began. *Random coefficient model, comparing Post to Pre substudy change in GI, adjusted for baseline and calories, p=0.013. Other changes include a reduction in dietary cholesterol (-7.4mg/1000kcal, p=0.090), total sugar intake (-0.6 %kcal, p=0.103), and a reduction in intake of desserts (-0.5% kcal, p=0.081). With regards to types of fruit, there was no change in consumption of high GI fruit (0.0%kcal, p=0.981), while there was a reduction in consumption of low GI fruit (-0.4%kcal, p=0.005). However, when low GI fruit intake was adjusted for total fruit intake, there was no significant change (79% (Post) from 82% (Pre) of total fruit).
*
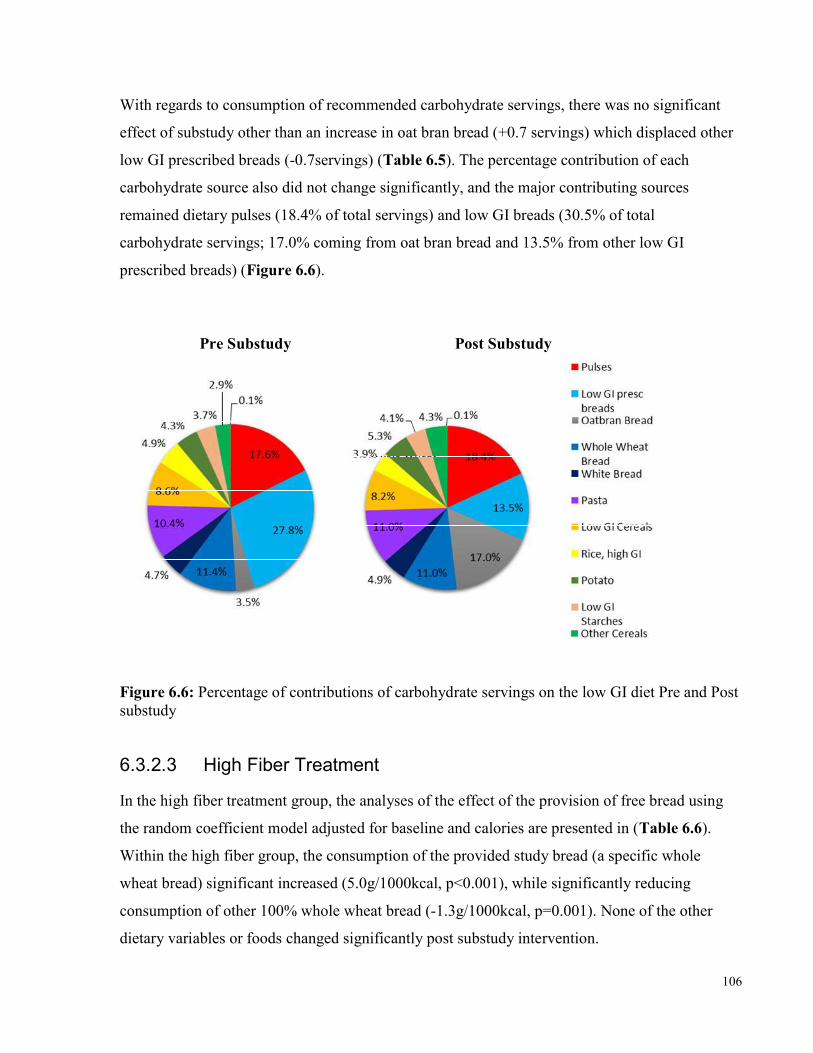
106
With regards to consumption of recommended carbohydrate servings, there was no significant effect of substudy other than an increase in oat bran bread (+0.7 servings) which displaced other low GI prescribed breads (-0.7servings) (Table 6.5). The percentage contribution of each carbohydrate source also did not change significantly, and the major contributing sources remained dietary pulses (18.4% of total servings) and low GI breads (30.5% of total carbohydrate servings; 17.0% coming from oat bran bread and 13.5% from other low GI prescribed breads) (Figure 6.6). Pre Substudy Post Substudy Figure 6.6: Percentage of contributions of carbohydrate servings on the low GI diet Pre and Post substudy 6.3.2.3 High Fiber Treatment In the high fiber treatment group, the analyses of the effect of the provision of free bread using the random coefficient model adjusted for baseline and calories are presented in (Table 6.6). Within the high fiber group, the consumption of the provided study bread (a specific whole wheat bread) significant increased (5.0g/1000kcal, p<0.001), while significantly reducing consumption of other 100% whole wheat bread (-1.3g/1000kcal, p=0.001). None of the other dietary variables or foods changed significantly post substudy intervention.
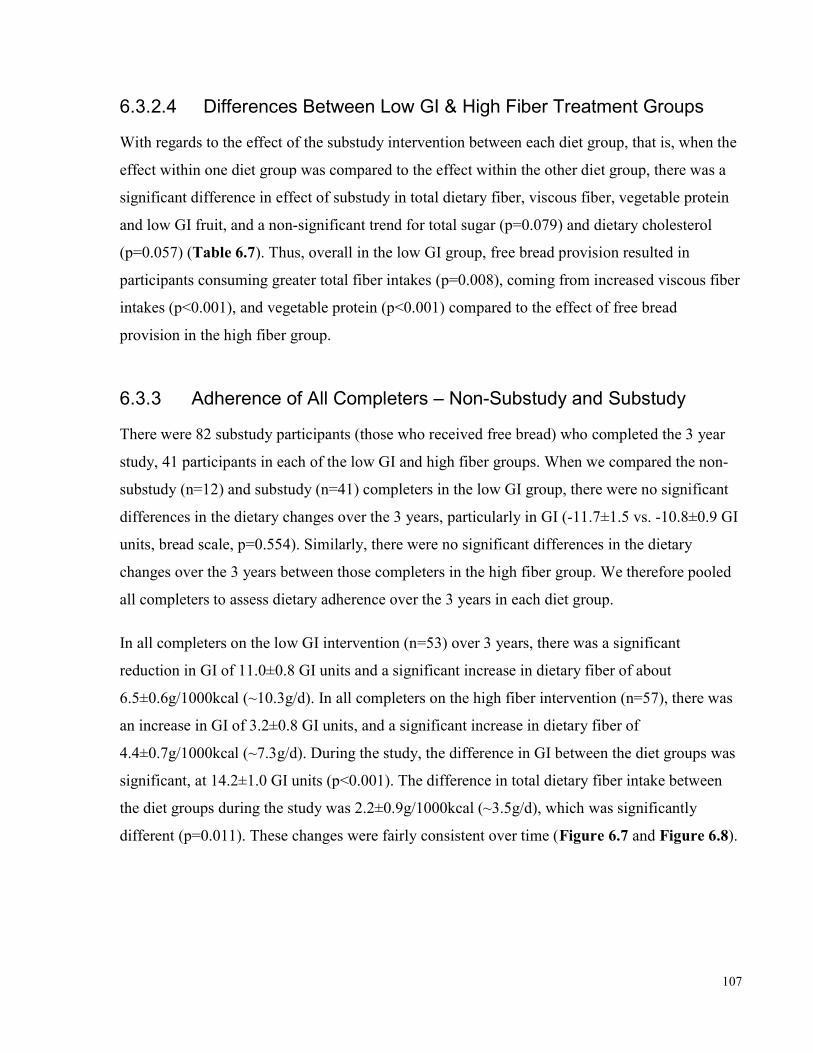
107
6.3.2.4 Differences Between Low GI & High Fiber Treatment Groups With regards to the effect of the substudy intervention between each diet group, that is, when the effect within one diet group was compared to the effect within the other diet group, there was a significant difference in effect of substudy in total dietary fiber, viscous fiber, vegetable protein and low GI fruit, and a non-significant trend for total sugar (p=0.079) and dietary cholesterol (p=0.057) (Table 6.7). Thus, overall in the low GI group, free bread provision resulted in participants consuming greater total fiber intakes (p=0.008), coming from increased viscous fiber intakes (p<0.001), and vegetable protein (p<0.001) compared to the effect of free bread provision in the high fiber group. 6.3.3 Adherence of All Completers – Non-Substudy and Substudy There were 82 substudy participants (those who received free bread) who completed the 3 year study, 41 participants in each of the low GI and high fiber groups. When we compared the non-substudy (n=12) and substudy (n=41) completers in the low GI group, there were no significant differences in the dietary changes over the 3 years, particularly in GI (-11.7±1.5 vs. -10.8±0.9 GI units, bread scale, p=0.554). Similarly, there were no significant differences in the dietary changes over the 3 years between those completers in the high fiber group. We therefore pooled all completers to assess dietary adherence over the 3 years in each diet group. In all completers on the low GI intervention (n=53) over 3 years, there was a significant reduction in GI of 11.0±0.8 GI units and a significant increase in dietary fiber of about 6.5±0.6g/1000kcal (~10.3g/d). In all completers on the high fiber intervention (n=57), there was an increase in GI of 3.2±0.8 GI units, and a significant increase in dietary fiber of 4.4±0.7g/1000kcal (~7.3g/d). During the study, the difference in GI between the diet groups was significant, at 14.2±1.0 GI units (p<0.001). The difference in total dietary fiber intake between the diet groups during the study was 2.2±0.9g/1000kcal (~3.5g/d), which was significantly different (p=0.011). These changes were fairly consistent over time (Figure 6.7 and Figure 6.8).
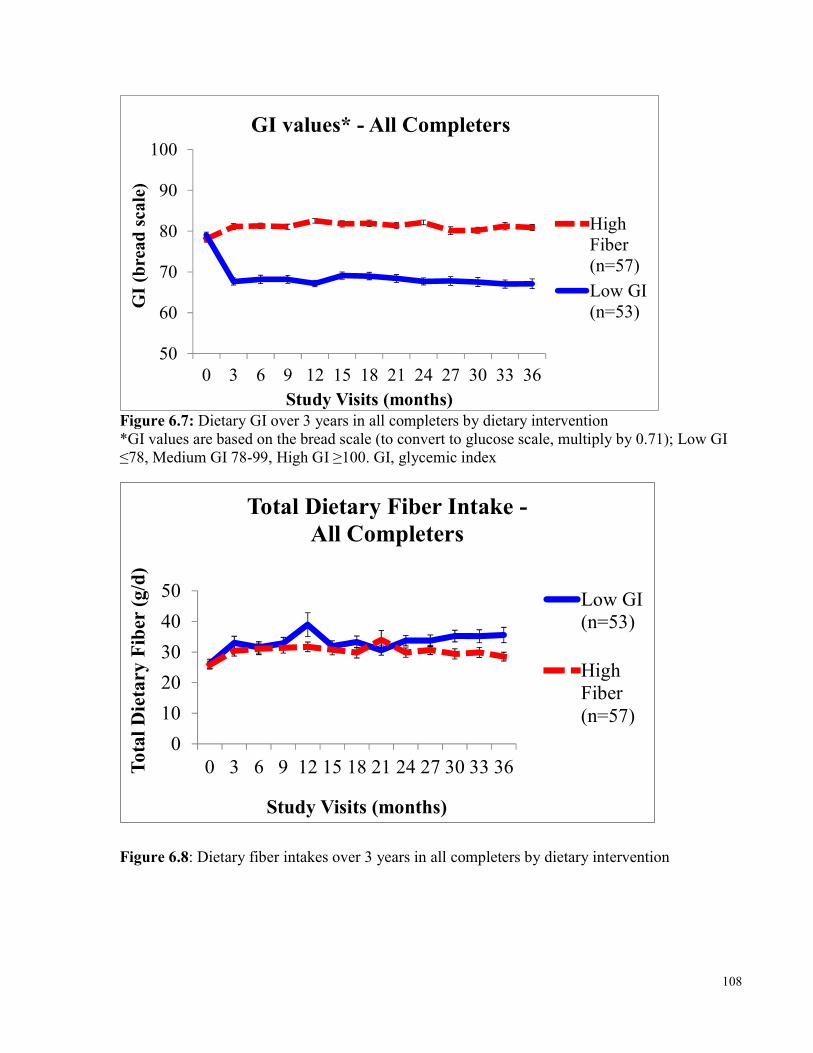
108
5060708090
100
0 3 6 9 12 15 18 21 24 27 30 33 36
GI (b
read s
cale)
Study Visits (months)
GI values* - All Completers
HighFiber(n=57)Low GI(n=53)
Figure 6.7: Dietary GI over 3 years in all completers by dietary intervention *GI values are based on the bread scale (to convert to glucose scale, multiply by 0.71); Low GI ≤78, Medium GI 78-99, High GI ≥100. GI, glycemic index
01020304050
0 3 6 9 12 15 18 21 24 27 30 33 36Total D
ietary
Fiber (
g/d)
Study Visits (months)
Total Dietary Fiber Intake -All Completers
Low GI(n=53)HighFiber(n=57)
Figure 6.8: Dietary fiber intakes over 3 years in all completers by dietary intervention
109
Similar to what was observed in all non-substudy completers (section 6.3.1), when we assessed changes in GL from the recommended and discouraged carbohydrate foods in all completers, we were able to explain the majority (89%) of the overall change in GL (Table 6.8). We also saw similar changes over 3 years on the low GI diet in consumption of carbohydrate servings (Table 6.9). Total carbohydrate servings decreased by about 1.2 servings/d (p<0.001) and total bread intake decreased by about 1.2 servings/d (p<0.001), which explains the majority of the reduction in total servings. Within source of bread, the low GI prescribed breads, which increased ~1.2 servings/d (p<0.001), displaced whole wheat and white bread servings (reduced ~2.3 servings/d; -1.7 servings/d, p<0.001for whole wheat bread, -0.6 servings/d, p<0.001 for white bread). Recommended cereals which included All Bran Buds with psyllium and steel cut and large flake oats, increased ~0.3 serving/d (p<0.001), which replaced other cereals which were reduced ~0.3 serving/d (p<0.001). Other low GI starch foods which include parboiled rice, quinoa, barley and bulgar, increased ~0.1 serving/d (p<0.001), while high GI rice decreased ~0.32 serving/d (p=0.002) and potato decreased about 0.65 serving/d (p<0.001). Dietary pulses increased by about 0.6 serving/d (p<0.001), which explains the majority of the reduction in rice and potato. Number of servings of pasta did not change (p=0.875). Overall, the major contributors to the total carbohydrate servings consumed were from breads (46% of total carbohydrate servings), mainly from low GI prescribed breads and oat bran bread (25.0% and 5%, respectively), followed by dietary pulses (18%). With regards to fruit, low GI fruit intake increased to 81% of total fruit servings (p<0.001) (Table 6.9).
6.4 Discussion 6.4.1 Discussion In a patient population with type 2 diabetes and at high risk of CVD (CIMT≥1.2mm at screening), dietary advice on a low GI diet was incorporated well with an overall GI reduction of about 11 GI units over 3 years, which is very similar to what we have found in our previous 3- and 6-month low GI dietary trials (10-13 GI unit reductions) 13, 112. As can be seen in Figure 6.7, this reduction in GI is fairly consistent over time, thus demonstrating that a low GI diet can be adopted and sustained over a long period of time. With regards to how low GI dietary advice is incorporated, in all completers of the study thus far, the percentage of servings of bread did not change (about 46% of carbohydrate servings,
110
Table 6.9), thus bread appears to be the preferred carbohydrate choices in our population. High GI breads consumed at baseline are substituted with low GI breads as a result of low GI diet advice. Similarly, high GI cereals are substituted with low GI cereals. Interestingly, the reductions in rice (-4% of carbohydrate servings) and potatoes (-9% of carbohydrate servings) are substituted with very little other starchy low GI foods, such as parboiled rice, quinoa, bulgur and barley (~2% increase of carbohydrate servings), but instead mostly with dietary pulses (~13% increase in carbohydrate servings). Interestingly, pasta intake did not change significantly in the low GI group (~2% increase) even though it was part of the low GI recommended food list (Appendix 1). It is possible that pasta may not have a very positive public perception and that there is a lack of awareness of the potential benefits of pasta, including that it is a low GI food, therefore highlighting the need for more trials to demonstrate any beneficial effects of pasta consumption. Furthermore, since bread consumption was the greatest percentage of total carbohydrate servings, and breads can vary in GI depending on ingredients and processing techniques, this emphasizes the importance of proper GI testing of foods and making this information publically available, since it would be difficult for people to follow a low GI diet without knowledge of which breads to choose from. For our study, we had all specific breads which were encouraged, tested for their GI, so it was very clear to participants which breads they could purchase to use. To allow the public to follow a low GI diet, it is necessary to provide them, as well as health professionals, with accurate and reliable information about GI. This highlights the need for GI education tools and to make them widely available, including having this GI information in food composition tables and on food labels. Overall, there are some perceived challenges to following a low GI diet observed in this study which could limit success in the public at large. In addition to the need for knowledge about what foods are good low GI options, adherence to a low GI diet may be limited by public perceptions of foods (like pasta), and accessibility to good carbohydrate choices (including on supermarket shelves and in restaurants, for example more choices with beans, barley, quinoa, and bulgar instead of mainly bread, rice and potatoes). Therefore, addressing these limitations may help make the adoption of a low GI diet more sustainable in the general public.
111
The effect of the provision of free bread in the substudy was surprisingly subtle. In the low GI diet group, the only significant change in selection of carbohydrate foods (Table 6.5) was the substitution of the other prescribed low GI breads with the provided oat bran bread. Although in the dietary comparisons of the Pre and Post changes, GI was significantly lower Post substudy (Table 6.4), the reduction of 1.14 GI units is not physiologically significant and may be the result of the oat bran bread having a slightly lower GI compared to the other low GI prescribed breads (GI=69 vs average of 76, bread scale). Similarly, the significant increase found for nut intake (~1.5g/1000kcal = 2.4g/d) is also small, corresponding to ~2.5 almonds, which is again not physiologically significant as it is only ~8% of a serving (~28.5g/d) which has been demonstrated as physiologically effective, e.g. at lowering cholesterol 359. In both diet groups, the effect of the provision of the free study bread did not result in significant dietary changes, however this may be because the groups were already maintaining their initial changes well over the long study period (Figures 6.7 and 6.8). The difference in effect of the free bread between diet groups may be partly because the oat bran bread was higher in fiber and had a lower GI compared to the low GI prescribed breads it replaced, whereas the whole wheat bread was very similar to the whole wheat breads already being consumed by the high fiber group off supermarket shelves. This would explain why dietary fiber increased slightly in the low GI group, but not in the high fiber group (p=0.008) (Table 6.7). Interestingly, compared to the high fiber group, there was a trend in the low GI group, for a greater reduction in sugar intake (difference of -0.9%kcal (~3.6g/d), p=0.079), dietary cholesterol (difference of -12.3g/1000kcal (~20mg/d), p=0.057), and dessert intake (difference of -0.7%kcal, p=0.108) as a result of the substudy. These differences may be the result of the greater dietary fiber intake since it came from viscous fiber which has been demonstrated to improve satiety 360, 361. It could also be the result of greater use of the provided bread, which may have displaced other foods like desserts, since in the low GI group, the oat bran bread intake increased 27.8g/1000kcal, whereas in the high fiber group, the whole wheat bread provided increased only 5.0g/1000kcal with the majority continuing to come from participant self-purchased whole wheat bread. This difference between diet groups in use of the provided study breads may be because of the inconvenience in obtaining the free bread and difference in incentive between groups to overcome this inconvenience. Participants had to travel to the clinic to pick up their bread and since the breads were frozen, they were also limited by how many loaves they could take home in one trip due to limited freezer space. For the low GI group, there was a greater incentive to make the effort to pick up
112
their study bread because the oat bran bread was specifically made by our local baker and thus not available in supermarkets. Additionally, the other low GI prescribed breads were very specific and more difficult to find on supermarket shelves than regular whole wheat bread. In contrast, those in the high fiber group could easily purchase whole wheat bread off supermarket shelves at a cost less than the prescribed low GI breads ($2.00 vs. $4.00/loaf on average) and conveniently pick it up during their weekly groceries. Therefore, the incentive to use the provided study bread was greater in the low GI group. Furthermore, the limitation of freezer space and of additional travels to the clinic to pick up study bread, also may have limited the amount of bread consumed within the both groups. Thus, there could be potential for greater improvements to adherence with the provision of a study food if inconvenience was addressed. For example, study breads could be provided in biweekly deliveries so they are always easily available to participants to consume. Overall, the slightly further improvements which were demonstrated post substudy in the low GI group, as opposed to the lack of change in the high fiber group, could be the result of effectiveness of what was chosen as the study food to provide for free, which highlights the importance of what is selected to be provided in a study, as well as ease of obtaining it. Overall, the result of the free bread supplementation, even for free food, was disappointing because it was not consumed at sufficient amounts to make a difference. In retrospect, it is surprising given the consistent reduction in GI achieved by the low GI group as a whole. Therefore, it was not due to lack of willingness to make a change in GI of the diet, but possibly some “set point” in terms of preparedness to lower the dietary GI. It is of interest that in our previous studies, that an approximately 10 GI unit difference has been achieved in our 6-month study and in our 3-month high pulse low GI study. Alternative strategies may have to be employed to lower the GI further. These may include providing pulse dishes, or pasta dishes that are rich in pulses and vegetables, and developing strategies to displace breads, with other low GI starches including bulgar, barley, pulses, and pasta, all of which have lower GI compared to breads, even low GI breads.
6.4.2 Strengths and Limitations The strengths of the data include that the dietary intakes were captured by 7-day food records at 3-monthly intervals over the 3 years which were reviewed by the study dietitians with the
113
participants. Additionally, many of the foods which were recommended in the study were specifically tested for their GI, thus the most accurate GIs of the foods were available. This dataset is limited by the amount of change which can occur in our participant group because at baseline, the dietary GI was at the low end of the medium range and saturated fat and dietary fiber intakes were already at levels recommended by guidelines301, 330. Thus, the participants may already be a particularly health aware group, in addition to the fact that they are a group who are volunteering to participant in a 3-year dietary trial. A limitation of the substudy is that there was a perceived difficulty of obtaining the free bread, particularly from those on the high fiber diet, which limited its use. Obtaining additional funds to have perhaps biweekly delivery of the free study food could have increased its use in both diet groups and potentially may have allowed for greater improvements in adherence.
6.5 Conclusions Overall, these data demonstrate that low GI dietary advice is well incorporated into long term dietary changes as significant reductions in GI which have been observed at 3- and 6-months can be maintained up to 3 years. The preferred food changes may be the substitution of breads and cereals for low GI options, as well as an increase in dietary pulses for other starchy foods, such as potatoes. This underlies the potential importance of proper GI testing of foods, especially foods like breads, since breads make up a large portion of carbohydrate selections, and making information and education on GI clinically and publically available for use in everyday life since it is possible to adopt a low GI diet long term. The provision of a free study food, particularly one from a food group that is commonly consumed, may assist in continued adherence to dietary advice but also highlights the importance of accessibility. Therefore, a low GI diet can be successfully adopted and sustained long term and may be in the population at large, especially with education on which carbohydrate foods make good choices and making them readily accessible on supermarket shelves.
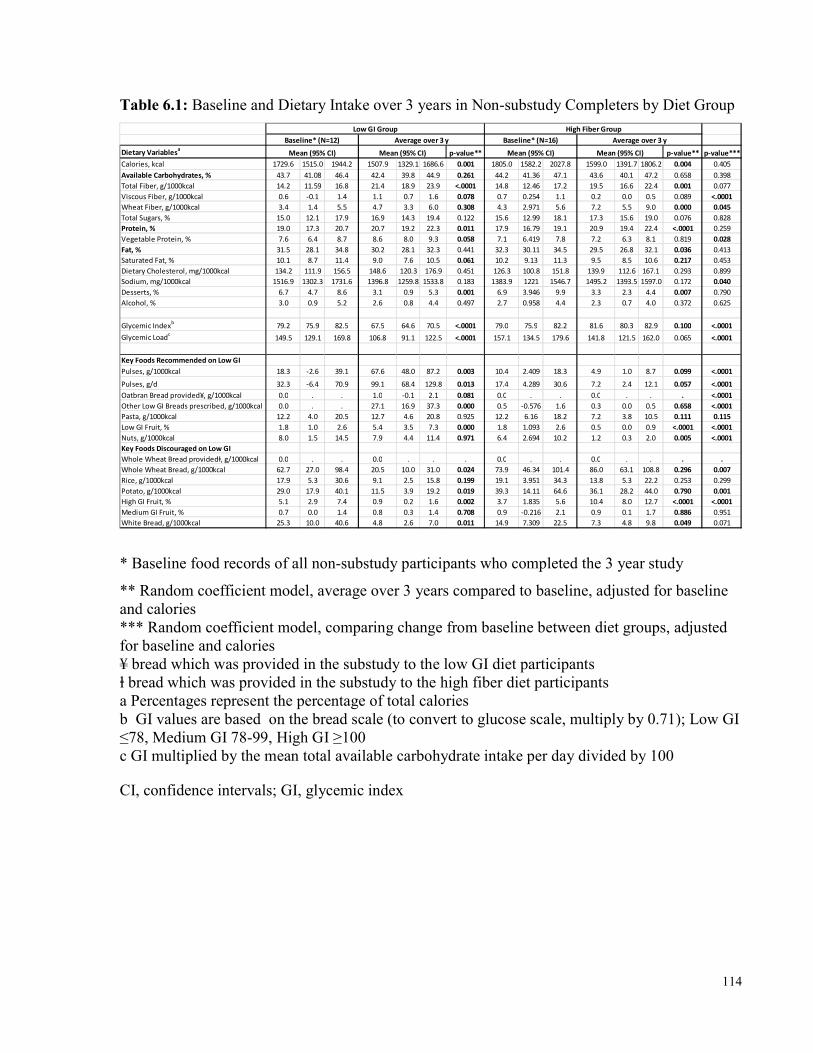
114
Table 6.1: Baseline and Dietary Intake over 3 years in Non-substudy Completers by Diet Group Dietary Variablesa p-value** p-value** p-value***Calories, kcal 1729.6 1515.0 1944.2 1507.9 1329.1 1686.6 0.001 1805.0 1582.2 2027.8 1599.0 1391.7 1806.2 0.004 0.405Available Carbohydrates, % 43.7 41.08 46.4 42.4 39.8 44.9 0.261 44.2 41.36 47.1 43.6 40.1 47.2 0.658 0.398Total Fiber, g/1000kcal 14.2 11.59 16.8 21.4 18.9 23.9 <.0001 14.8 12.46 17.2 19.5 16.6 22.4 0.001 0.077Viscous Fiber, g/1000kcal 0.6 -0.1 1.4 1.1 0.7 1.6 0.078 0.7 0.254 1.1 0.2 0.0 0.5 0.089 <.0001Wheat Fiber, g/1000kcal 3.4 1.4 5.5 4.7 3.3 6.0 0.308 4.3 2.971 5.6 7.2 5.5 9.0 0.000 0.045Total Sugars, % 15.0 12.1 17.9 16.9 14.3 19.4 0.122 15.6 12.99 18.1 17.3 15.6 19.0 0.076 0.828Protein, % 19.0 17.3 20.7 20.7 19.2 22.3 0.011 17.9 16.79 19.1 20.9 19.4 22.4 <.0001 0.259Vegetable Protein, % 7.6 6.4 8.7 8.6 8.0 9.3 0.058 7.1 6.419 7.8 7.2 6.3 8.1 0.819 0.028Fat, % 31.5 28.1 34.8 30.2 28.1 32.3 0.441 32.3 30.11 34.5 29.5 26.8 32.1 0.036 0.413Saturated Fat, % 10.1 8.7 11.4 9.0 7.6 10.5 0.061 10.2 9.13 11.3 9.5 8.5 10.6 0.217 0.453Dietary Cholesterol, mg/1000kcal 134.2 111.9 156.5 148.6 120.3 176.9 0.451 126.3 100.8 151.8 139.9 112.6 167.1 0.293 0.899Sodium, mg/1000kcal 1516.9 1302.3 1731.6 1396.8 1259.8 1533.8 0.183 1383.9 1221 1546.7 1495.2 1393.5 1597.0 0.172 0.040Desserts, % 6.7 4.7 8.6 3.1 0.9 5.3 0.001 6.9 3.946 9.9 3.3 2.3 4.4 0.007 0.790Alcohol, % 3.0 0.9 5.2 2.6 0.8 4.4 0.497 2.7 0.958 4.4 2.3 0.7 4.0 0.372 0.625Glycemic Indexb 79.2 75.9 82.5 67.5 64.6 70.5 <.0001 79.0 75.9 82.2 81.6 80.3 82.9 0.100 <.0001Glycemic Loadc 149.5 129.1 169.8 106.8 91.1 122.5 <.0001 157.1 134.5 179.6 141.8 121.5 162.0 0.065 <.0001Key Foods Recommended on Low GIPulses, g/1000kcal 18.3 -2.6 39.1 67.6 48.0 87.2 0.003 10.4 2.409 18.3 4.9 1.0 8.7 0.099 <.0001Pulses, g/d 32.3 -6.4 70.9 99.1 68.4 129.8 0.013 17.4 4.289 30.6 7.2 2.4 12.1 0.057 <.0001Oatbran Bread provided¥, g/1000kcal 0.0 . . 1.0 -0.1 2.1 0.081 0.0 . . 0.0 . . . <.0001Other Low GI Breads prescribed, g/1000kcal 0.0 . . 27.1 16.9 37.3 0.000 0.5 -0.576 1.6 0.3 0.0 0.5 0.658 <.0001Pasta, g/1000kcal 12.2 4.0 20.5 12.7 4.6 20.8 0.925 12.2 6.16 18.2 7.2 3.8 10.5 0.111 0.115Low GI Fruit, % 1.8 1.0 2.6 5.4 3.5 7.3 0.000 1.8 1.093 2.6 0.5 0.0 0.9 <.0001 <.0001Nuts, g/1000kcal 8.0 1.5 14.5 7.9 4.4 11.4 0.971 6.4 2.694 10.2 1.2 0.3 2.0 0.005 <.0001Key Foods Discouraged on Low GIWhole Wheat Bread providedⱡ, g/1000kcal 0.0 . . 0.0 . . . 0.0 . . 0.0 . . . .Whole Wheat Bread, g/1000kcal 62.7 27.0 98.4 20.5 10.0 31.0 0.024 73.9 46.34 101.4 86.0 63.1 108.8 0.296 0.007Rice, g/1000kcal 17.9 5.3 30.6 9.1 2.5 15.8 0.199 19.1 3.951 34.3 13.8 5.3 22.2 0.253 0.299Potato, g/1000kcal 29.0 17.9 40.1 11.5 3.9 19.2 0.019 39.3 14.11 64.6 36.1 28.2 44.0 0.790 0.001High GI Fruit, % 5.1 2.9 7.4 0.9 0.2 1.6 0.002 3.7 1.835 5.6 10.4 8.0 12.7 <.0001 <.0001Medium GI Fruit, % 0.7 0.0 1.4 0.8 0.3 1.4 0.708 0.9 -0.216 2.1 0.9 0.1 1.7 0.886 0.951White Bread, g/1000kcal 25.3 10.0 40.6 4.8 2.6 7.0 0.011 14.9 7.309 22.5 7.3 4.8 9.8 0.049 0.071
Mean (95% CI) Mean (95% CI) Mean (95% CI) Mean (95% CI)Low GI Group High Fiber Group
Baseline* (N=12) Average over 3 y Baseline* (N=16) Average over 3 y
* Baseline food records of all non-substudy participants who completed the 3 year study ** Random coefficient model, average over 3 years compared to baseline, adjusted for baseline and calories *** Random coefficient model, comparing change from baseline between diet groups, adjusted for baseline and calories ¥ bread which was provided in the substudy to the low GI diet participants ⱡ bread which was provided in the substudy to the high fiber diet participants a Percentages represent the percentage of total calories b GI values are based on the bread scale (to convert to glucose scale, multiply by 0.71); Low GI ≤78, Medium GI 78-99, High GI ≥100 c GI multiplied by the mean total available carbohydrate intake per day divided by 100 CI, confidence intervals; GI, glycemic index
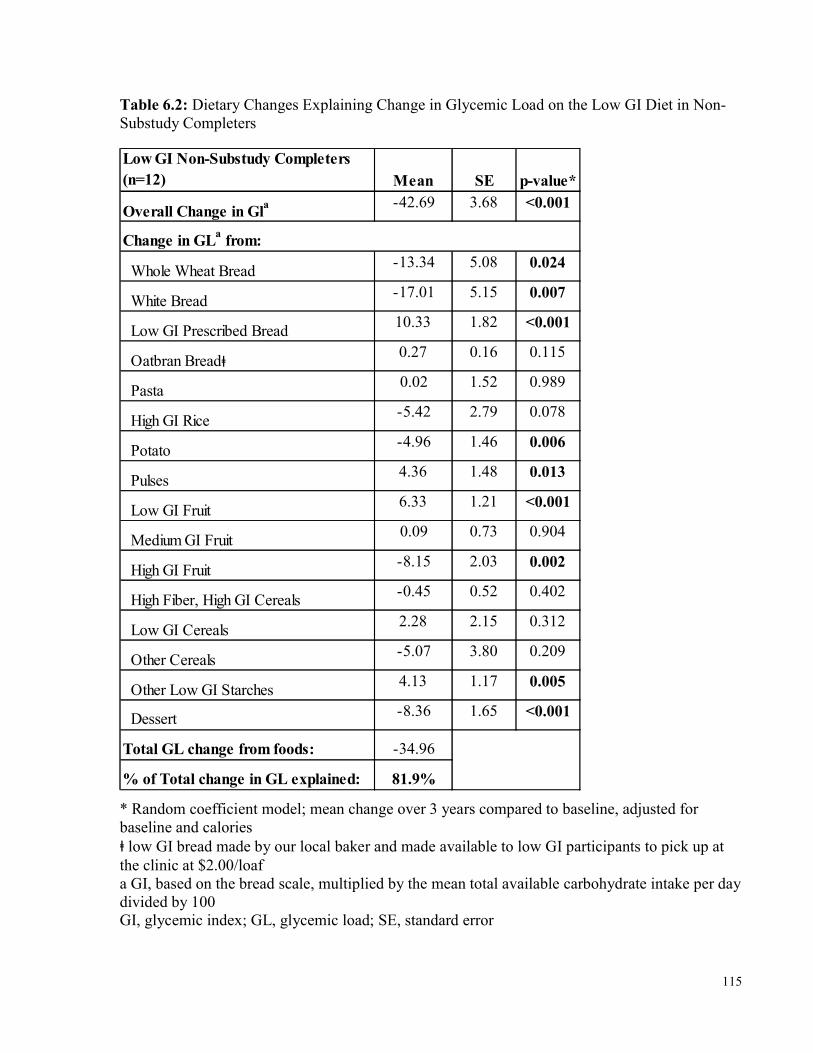
115
Table 6.2: Dietary Changes Explaining Change in Glycemic Load on the Low GI Diet in Non-Substudy Completers Low GI Non-Substudy Completers (n=12) Mean SE p-value*Overall Change in Gla -42.69 3.68 <0.001
Whole Wheat Bread -13.34 5.08 0.024 White Bread -17.01 5.15 0.007 Low GI Prescribed Bread 10.33 1.82 <0.001 Oatbran Breadⱡ 0.27 0.16 0.115 Pasta 0.02 1.52 0.989 High GI Rice -5.42 2.79 0.078 Potato -4.96 1.46 0.006 Pulses 4.36 1.48 0.013 Low GI Fruit 6.33 1.21 <0.001 Medium GI Fruit 0.09 0.73 0.904 High GI Fruit -8.15 2.03 0.002 High Fiber, High GI Cereals -0.45 0.52 0.402 Low GI Cereals 2.28 2.15 0.312 Other Cereals -5.07 3.80 0.209 Other Low GI Starches 4.13 1.17 0.005 Dessert -8.36 1.65 <0.001Total GL change from foods: -34.96% of Total change in GL explained: 81.9%
Change in GLa from:
* Random coefficient model; mean change over 3 years compared to baseline, adjusted for baseline and calories ⱡ low GI bread made by our local baker and made available to low GI participants to pick up at the clinic at $2.00/loaf a GI, based on the bread scale, multiplied by the mean total available carbohydrate intake per day divided by 100 GI, glycemic index; GL, glycemic load; SE, standard error
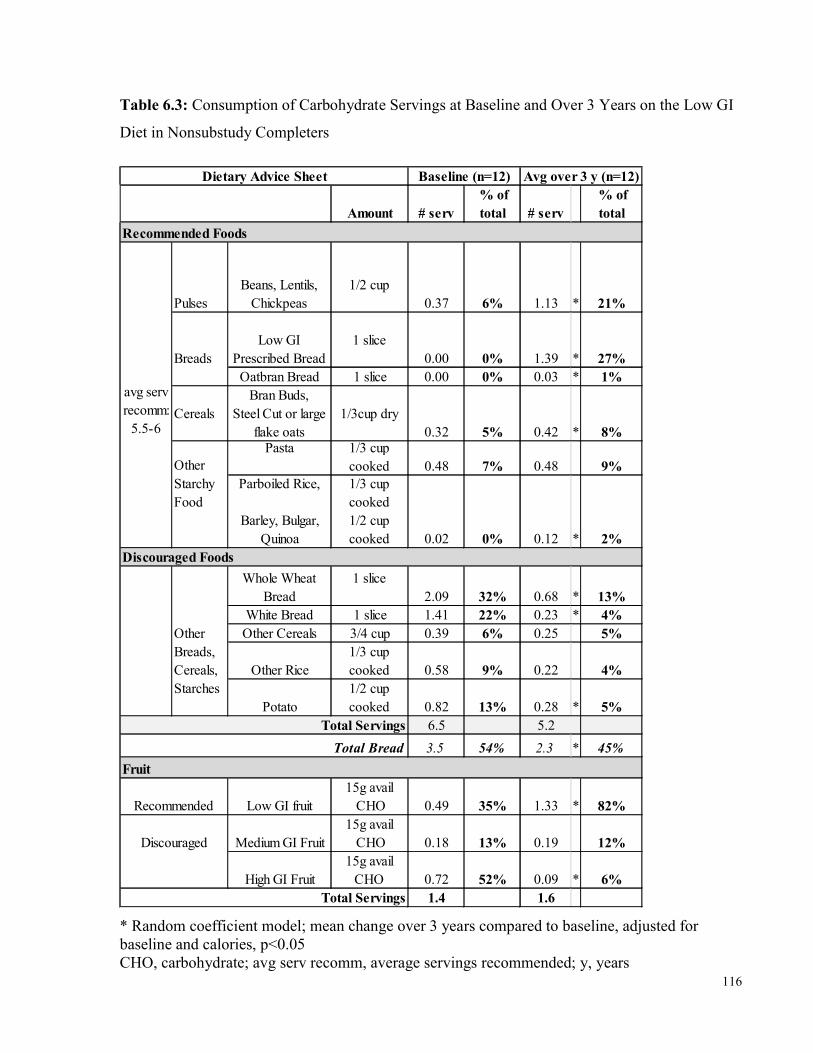
116
Table 6.3: Consumption of Carbohydrate Servings at Baseline and Over 3 Years on the Low GI Diet in Nonsubstudy Completers
Amount # serv % of total # serv
% of total
PulsesBeans, Lentils,
Chickpeas1/2 cup
0.37 6% 1.13 * 21%Low GI
Prescribed Bread1 slice
0.00 0% 1.39 * 27%Oatbran Bread 1 slice 0.00 0% 0.03 * 1%
CerealsBran Buds,
Steel Cut or large flake oats
1/3cup dry0.32 5% 0.42 * 8%Pasta 1/3 cup
cooked 0.48 7% 0.48 9%Parboiled Rice,
Barley, Bulgar,
Quinoa
1/3 cup cooked1/2 cup cooked 0.02 0% 0.12 * 2%
Whole Wheat Bread
1 slice2.09 32% 0.68 * 13%
White Bread 1 slice 1.41 22% 0.23 * 4%Other Cereals 3/4 cup 0.39 6% 0.25 5%
Other Rice1/3 cup cooked 0.58 9% 0.22 4%
Potato1/2 cup cooked 0.82 13% 0.28 * 5%
6.5 5.23.5 54% 2.3 * 45%
Low GI fruit15g avail
CHO 0.49 35% 1.33 * 82%Medium GI Fruit
15g avail CHO 0.18 13% 0.19 12%
High GI Fruit15g avail
CHO 0.72 52% 0.09 * 6%1.4 1.6
Other Breads, Cereals, Starches
Baseline (n=12) Avg over 3 y (n=12)
avg serv recomm:
5.5-6
Breads
Other Starchy Food
Recommended Foods
Dietary Advice Sheet
Discouraged Foods
Fruit
Total Servings
Total Servings
Total Bread
Recommended Discouraged
* Random coefficient model; mean change over 3 years compared to baseline, adjusted for baseline and calories, p<0.05 CHO, carbohydrate; avg serv recomm, average servings recommended; y, years
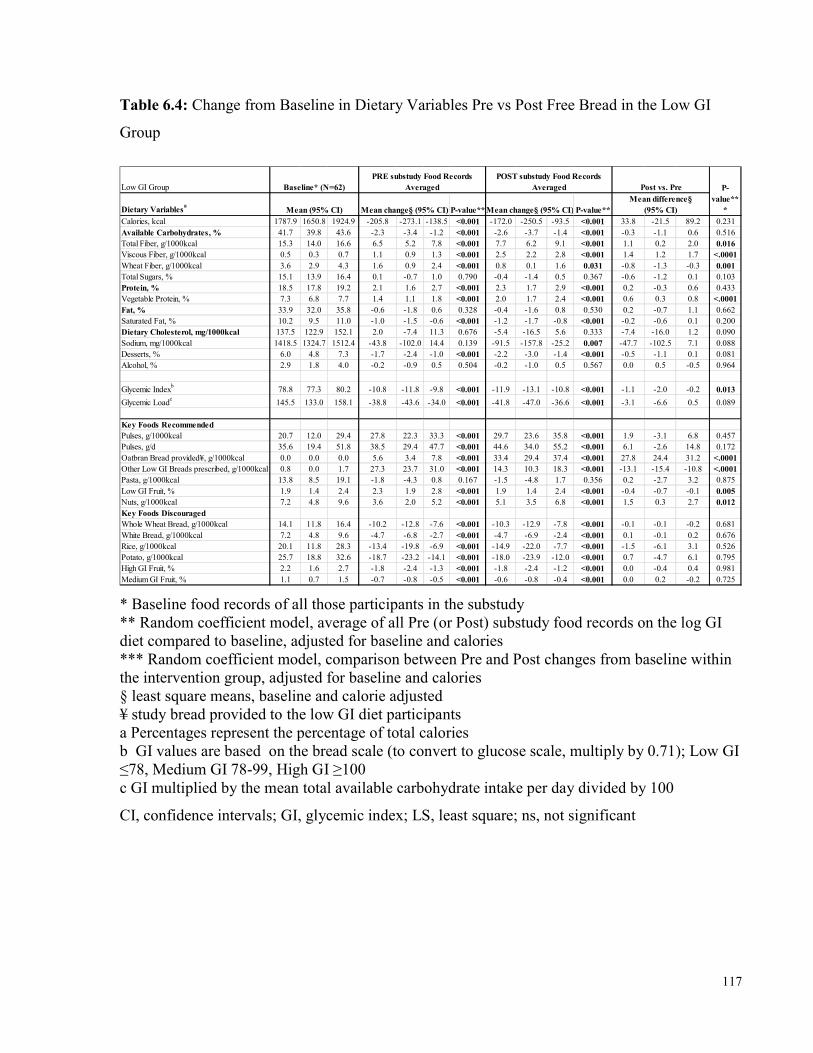
117
Table 6.4: Change from Baseline in Dietary Variables Pre vs Post Free Bread in the Low GI Group
Low GI GroupDietary Variablesa Mean (95% CI) P-value** P-value**Calories, kcal 1787.9 1650.8 1924.9 -205.8 -273.1 -138.5 <0.001 -172.0 -250.5 -93.5 <0.001 33.8 -21.5 89.2 0.231Available Carbohydrates, % 41.7 39.8 43.6 -2.3 -3.4 -1.2 <0.001 -2.6 -3.7 -1.4 <0.001 -0.3 -1.1 0.6 0.516Total Fiber, g/1000kcal 15.3 14.0 16.6 6.5 5.2 7.8 <0.001 7.7 6.2 9.1 <0.001 1.1 0.2 2.0 0.016Viscous Fiber, g/1000kcal 0.5 0.3 0.7 1.1 0.9 1.3 <0.001 2.5 2.2 2.8 <0.001 1.4 1.2 1.7 <.0001Wheat Fiber, g/1000kcal 3.6 2.9 4.3 1.6 0.9 2.4 <0.001 0.8 0.1 1.6 0.031 -0.8 -1.3 -0.3 0.001Total Sugars, % 15.1 13.9 16.4 0.1 -0.7 1.0 0.790 -0.4 -1.4 0.5 0.367 -0.6 -1.2 0.1 0.103Protein, % 18.5 17.8 19.2 2.1 1.6 2.7 <0.001 2.3 1.7 2.9 <0.001 0.2 -0.3 0.6 0.433Vegetable Protein, % 7.3 6.8 7.7 1.4 1.1 1.8 <0.001 2.0 1.7 2.4 <0.001 0.6 0.3 0.8 <.0001Fat, % 33.9 32.0 35.8 -0.6 -1.8 0.6 0.328 -0.4 -1.6 0.8 0.530 0.2 -0.7 1.1 0.662Saturated Fat, % 10.2 9.5 11.0 -1.0 -1.5 -0.6 <0.001 -1.2 -1.7 -0.8 <0.001 -0.2 -0.6 0.1 0.200Dietary Cholesterol, mg/1000kcal 137.5 122.9 152.1 2.0 -7.4 11.3 0.676 -5.4 -16.5 5.6 0.333 -7.4 -16.0 1.2 0.090Sodium, mg/1000kcal 1418.5 1324.7 1512.4 -43.8 -102.0 14.4 0.139 -91.5 -157.8 -25.2 0.007 -47.7 -102.5 7.1 0.088Desserts, % 6.0 4.8 7.3 -1.7 -2.4 -1.0 <0.001 -2.2 -3.0 -1.4 <0.001 -0.5 -1.1 0.1 0.081Alcohol, % 2.9 1.8 4.0 -0.2 -0.9 0.5 0.504 -0.2 -1.0 0.5 0.567 0.0 0.5 -0.5 0.964
Glycemic Indexb 78.8 77.3 80.2 -10.8 -11.8 -9.8 <0.001 -11.9 -13.1 -10.8 <0.001 -1.1 -2.0 -0.2 0.013Glycemic Loadc 145.5 133.0 158.1 -38.8 -43.6 -34.0 <0.001 -41.8 -47.0 -36.6 <0.001 -3.1 -6.6 0.5 0.089Key Foods RecommendedPulses, g/1000kcal 20.7 12.0 29.4 27.8 22.3 33.3 <0.001 29.7 23.6 35.8 <0.001 1.9 -3.1 6.8 0.457Pulses, g/d 35.6 19.4 51.8 38.5 29.4 47.7 <0.001 44.6 34.0 55.2 <0.001 6.1 -2.6 14.8 0.172Oatbran Bread provided¥, g/1000kcal 0.0 0.0 0.0 5.6 3.4 7.8 <0.001 33.4 29.4 37.4 <0.001 27.8 24.4 31.2 <.0001Other Low GI Breads prescribed, g/1000kcal 0.8 0.0 1.7 27.3 23.7 31.0 <0.001 14.3 10.3 18.3 <0.001 -13.1 -15.4 -10.8 <.0001Pasta, g/1000kcal 13.8 8.5 19.1 -1.8 -4.3 0.8 0.167 -1.5 -4.8 1.7 0.356 0.2 -2.7 3.2 0.875Low GI Fruit, % 1.9 1.4 2.4 2.3 1.9 2.8 <0.001 1.9 1.4 2.4 <0.001 -0.4 -0.7 -0.1 0.005Nuts, g/1000kcal 7.2 4.8 9.6 3.6 2.0 5.2 <0.001 5.1 3.5 6.8 <0.001 1.5 0.3 2.7 0.012Key Foods DiscouragedWhole Wheat Bread, g/1000kcal 14.1 11.8 16.4 -10.2 -12.8 -7.6 <0.001 -10.3 -12.9 -7.8 <0.001 -0.1 -0.1 -0.2 0.681White Bread, g/1000kcal 7.2 4.8 9.6 -4.7 -6.8 -2.7 <0.001 -4.7 -6.9 -2.4 <0.001 0.1 -0.1 0.2 0.676Rice, g/1000kcal 20.1 11.8 28.3 -13.4 -19.8 -6.9 <0.001 -14.9 -22.0 -7.7 <0.001 -1.5 -6.1 3.1 0.526Potato, g/1000kcal 25.7 18.8 32.6 -18.7 -23.2 -14.1 <0.001 -18.0 -23.9 -12.0 <0.001 0.7 -4.7 6.1 0.795High GI Fruit, % 2.2 1.6 2.7 -1.8 -2.4 -1.3 <0.001 -1.8 -2.4 -1.2 <0.001 0.0 -0.4 0.4 0.981Medium GI Fruit, % 1.1 0.7 1.5 -0.7 -0.8 -0.5 <0.001 -0.6 -0.8 -0.4 <0.001 0.0 0.2 -0.2 0.725
Mean change§ (95% CI) Mean change§ (95% CI)Mean difference§
(95% CI)Baseline* (N=62)
PRE substudy Food Records Averaged
POST substudy Food Records Averaged Post vs. Pre P-
value***
* Baseline food records of all those participants in the substudy ** Random coefficient model, average of all Pre (or Post) substudy food records on the log GI diet compared to baseline, adjusted for baseline and calories *** Random coefficient model, comparison between Pre and Post changes from baseline within the intervention group, adjusted for baseline and calories § least square means, baseline and calorie adjusted ¥ study bread provided to the low GI diet participants a Percentages represent the percentage of total calories b GI values are based on the bread scale (to convert to glucose scale, multiply by 0.71); Low GI ≤78, Medium GI 78-99, High GI ≥100 c GI multiplied by the mean total available carbohydrate intake per day divided by 100 CI, confidence intervals; GI, glycemic index; LS, least square; ns, not significant
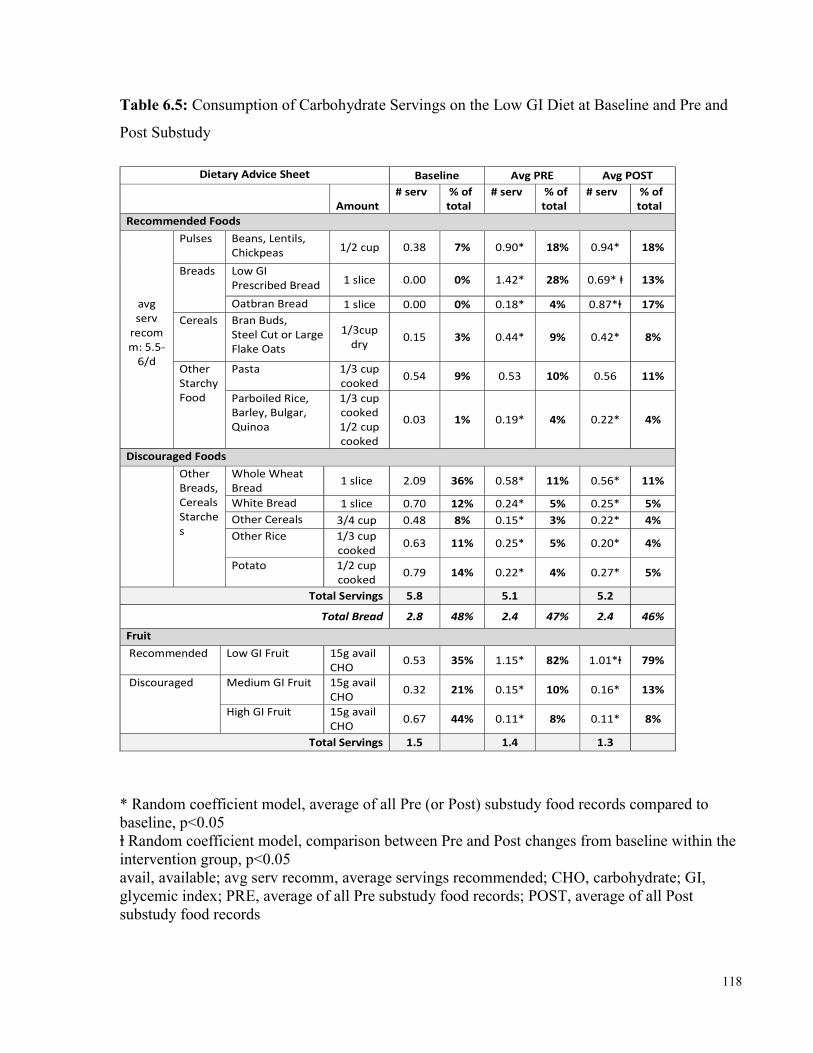
118
Table 6.5: Consumption of Carbohydrate Servings on the Low GI Diet at Baseline and Pre and Post Substudy
Dietary Advice Sheet Baseline Avg PRE Avg POST Amount # serv % of total # serv % of total # serv % of total Recommended Foods
avg serv recomm: 5.5-6/d
Pulses Beans, Lentils, Chickpeas 1/2 cup 0.38 7% 0.90* 18% 0.94* 18% Breads Low GI Prescribed Bread 1 slice 0.00 0% 1.42* 28% 0.69* ⱡ 13%
Oatbran Bread 1 slice 0.00 0% 0.18* 4% 0.87*ⱡ 17% Cereals Bran Buds, Steel Cut or Large Flake Oats
1/3cup dry 0.15 3% 0.44* 9% 0.42* 8% Other Starchy Food
Pasta 1/3 cup cooked 0.54 9% 0.53 10% 0.56 11% Parboiled Rice, Barley, Bulgar, Quinoa
1/3 cup cooked 1/2 cup cooked 0.03 1% 0.19* 4% 0.22* 4%
Discouraged Foods
Other Breads, CerealsStarches
Whole Wheat Bread 1 slice 2.09 36% 0.58* 11% 0.56* 11% White Bread 1 slice 0.70 12% 0.24* 5% 0.25* 5% Other Cereals 3/4 cup 0.48 8% 0.15* 3% 0.22* 4% Other Rice 1/3 cup cooked 0.63 11% 0.25* 5% 0.20* 4% Potato 1/2 cup cooked 0.79 14% 0.22* 4% 0.27* 5%
Total Servings 5.8 5.1 5.2 Total Bread 2.8 48% 2.4 47% 2.4 46% Fruit Recommended Low GI Fruit 15g avail CHO 0.53 35% 1.15* 82% 1.01*ⱡ 79% Discouraged Medium GI Fruit 15g avail CHO 0.32 21% 0.15* 10% 0.16* 13%
High GI Fruit 15g avail CHO 0.67 44% 0.11* 8% 0.11* 8% Total Servings 1.5 1.4 1.3
* Random coefficient model, average of all Pre (or Post) substudy food records compared to baseline, p<0.05 ⱡ Random coefficient model, comparison between Pre and Post changes from baseline within the intervention group, p<0.05 avail, available; avg serv recomm, average servings recommended; CHO, carbohydrate; GI, glycemic index; PRE, average of all Pre substudy food records; POST, average of all Post substudy food records
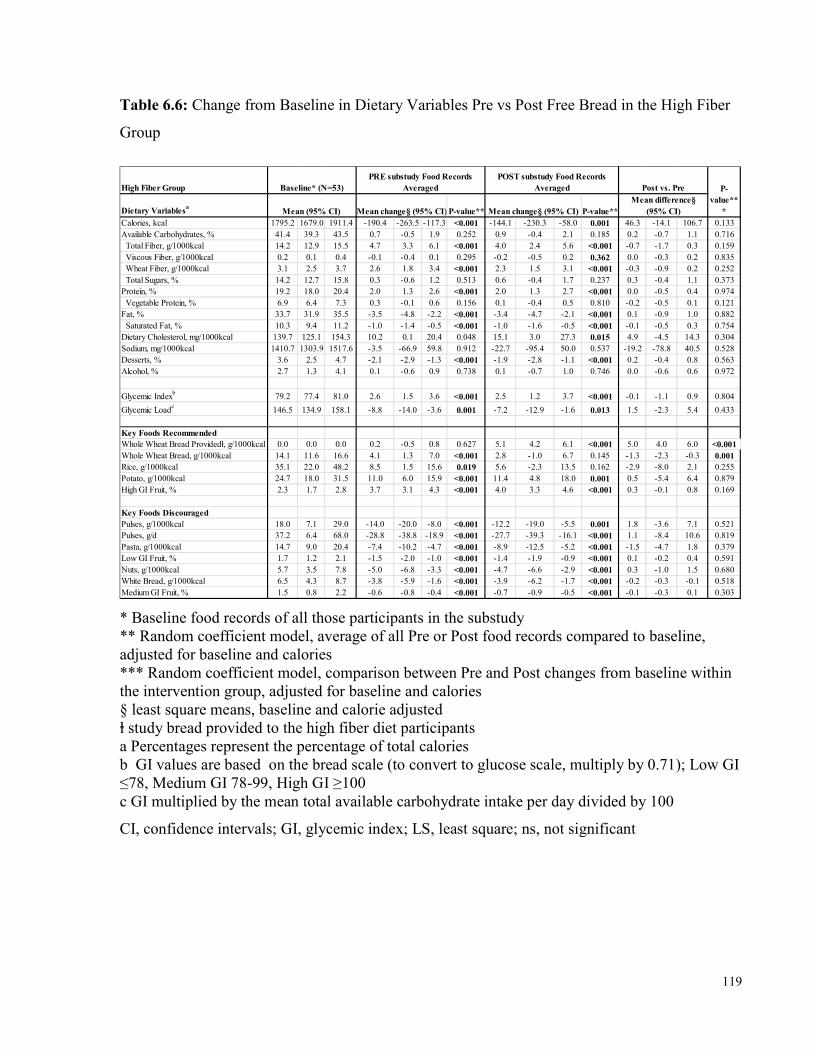
119
Table 6.6: Change from Baseline in Dietary Variables Pre vs Post Free Bread in the High Fiber Group
High Fiber GroupDietary Variablesa Mean (95% CI) P-value** P-value**Calories, kcal 1795.2 1679.0 1911.4 -190.4 -263.5 -117.3 <0.001 -144.1 -230.3 -58.0 0.001 46.3 -14.1 106.7 0.133Available Carbohydrates, % 41.4 39.3 43.5 0.7 -0.5 1.9 0.252 0.9 -0.4 2.1 0.185 0.2 -0.7 1.1 0.716 Total Fiber, g/1000kcal 14.2 12.9 15.5 4.7 3.3 6.1 <0.001 4.0 2.4 5.6 <0.001 -0.7 -1.7 0.3 0.159 Viscous Fiber, g/1000kcal 0.2 0.1 0.4 -0.1 -0.4 0.1 0.295 -0.2 -0.5 0.2 0.362 0.0 -0.3 0.2 0.835 Wheat Fiber, g/1000kcal 3.1 2.5 3.7 2.6 1.8 3.4 <0.001 2.3 1.5 3.1 <0.001 -0.3 -0.9 0.2 0.252 Total Sugars, % 14.2 12.7 15.8 0.3 -0.6 1.2 0.513 0.6 -0.4 1.7 0.237 0.3 -0.4 1.1 0.373Protein, % 19.2 18.0 20.4 2.0 1.3 2.6 <0.001 2.0 1.3 2.7 <0.001 0.0 -0.5 0.4 0.974 Vegetable Protein, % 6.9 6.4 7.3 0.3 -0.1 0.6 0.156 0.1 -0.4 0.5 0.810 -0.2 -0.5 0.1 0.121Fat, % 33.7 31.9 35.5 -3.5 -4.8 -2.2 <0.001 -3.4 -4.7 -2.1 <0.001 0.1 -0.9 1.0 0.882 Saturated Fat, % 10.3 9.4 11.2 -1.0 -1.4 -0.5 <0.001 -1.0 -1.6 -0.5 <0.001 -0.1 -0.5 0.3 0.754Dietary Cholesterol, mg/1000kcal 139.7 125.1 154.3 10.2 0.1 20.4 0.048 15.1 3.0 27.3 0.015 4.9 -4.5 14.3 0.304Sodium, mg/1000kcal 1410.7 1303.9 1517.6 -3.5 -66.9 59.8 0.912 -22.7 -95.4 50.0 0.537 -19.2 -78.8 40.5 0.528Desserts, % 3.6 2.5 4.7 -2.1 -2.9 -1.3 <0.001 -1.9 -2.8 -1.1 <0.001 0.2 -0.4 0.8 0.563Alcohol, % 2.7 1.3 4.1 0.1 -0.6 0.9 0.738 0.1 -0.7 1.0 0.746 0.0 -0.6 0.6 0.972
Glycemic Indexb 79.2 77.4 81.0 2.6 1.5 3.6 <0.001 2.5 1.2 3.7 <0.001 -0.1 -1.1 0.9 0.804Glycemic Loadc 146.5 134.9 158.1 -8.8 -14.0 -3.6 0.001 -7.2 -12.9 -1.6 0.013 1.5 -2.3 5.4 0.433Key Foods RecommendedWhole Wheat Bread Providedⱡ, g/1000kcal 0.0 0.0 0.0 0.2 -0.5 0.8 0.627 5.1 4.2 6.1 <0.001 5.0 4.0 6.0 <0.001Whole Wheat Bread, g/1000kcal 14.1 11.6 16.6 4.1 1.3 7.0 <0.001 2.8 -1.0 6.7 0.145 -1.3 -2.3 -0.3 0.001Rice, g/1000kcal 35.1 22.0 48.2 8.5 1.5 15.6 0.019 5.6 -2.3 13.5 0.162 -2.9 -8.0 2.1 0.255Potato, g/1000kcal 24.7 18.0 31.5 11.0 6.0 15.9 <0.001 11.4 4.8 18.0 0.001 0.5 -5.4 6.4 0.879High GI Fruit, % 2.3 1.7 2.8 3.7 3.1 4.3 <0.001 4.0 3.3 4.6 <0.001 0.3 -0.1 0.8 0.169Key Foods DiscouragedPulses, g/1000kcal 18.0 7.1 29.0 -14.0 -20.0 -8.0 <0.001 -12.2 -19.0 -5.5 0.001 1.8 -3.6 7.1 0.521Pulses, g/d 37.2 6.4 68.0 -28.8 -38.8 -18.9 <0.001 -27.7 -39.3 -16.1 <0.001 1.1 -8.4 10.6 0.819Pasta, g/1000kcal 14.7 9.0 20.4 -7.4 -10.2 -4.7 <0.001 -8.9 -12.5 -5.2 <0.001 -1.5 -4.7 1.8 0.379Low GI Fruit, % 1.7 1.2 2.1 -1.5 -2.0 -1.0 <0.001 -1.4 -1.9 -0.9 <0.001 0.1 -0.2 0.4 0.591Nuts, g/1000kcal 5.7 3.5 7.8 -5.0 -6.8 -3.3 <0.001 -4.7 -6.6 -2.9 <0.001 0.3 -1.0 1.5 0.680White Bread, g/1000kcal 6.5 4.3 8.7 -3.8 -5.9 -1.6 <0.001 -3.9 -6.2 -1.7 <0.001 -0.2 -0.3 -0.1 0.518Medium GI Fruit, % 1.5 0.8 2.2 -0.6 -0.8 -0.4 <0.001 -0.7 -0.9 -0.5 <0.001 -0.1 -0.3 0.1 0.303
P-value**
*Mean change§ (95% CI) Mean change§ (95% CI)Mean difference§
(95% CI)Baseline* (N=53)
PRE substudy Food Records Averaged
POST substudy Food Records Averaged Post vs. Pre
* Baseline food records of all those participants in the substudy ** Random coefficient model, average of all Pre or Post food records compared to baseline, adjusted for baseline and calories *** Random coefficient model, comparison between Pre and Post changes from baseline within the intervention group, adjusted for baseline and calories § least square means, baseline and calorie adjusted ⱡ study bread provided to the high fiber diet participants a Percentages represent the percentage of total calories b GI values are based on the bread scale (to convert to glucose scale, multiply by 0.71); Low GI ≤78, Medium GI 78-99, High GI ≥100 c GI multiplied by the mean total available carbohydrate intake per day divided by 100 CI, confidence intervals; GI, glycemic index; LS, least square; ns, not significant
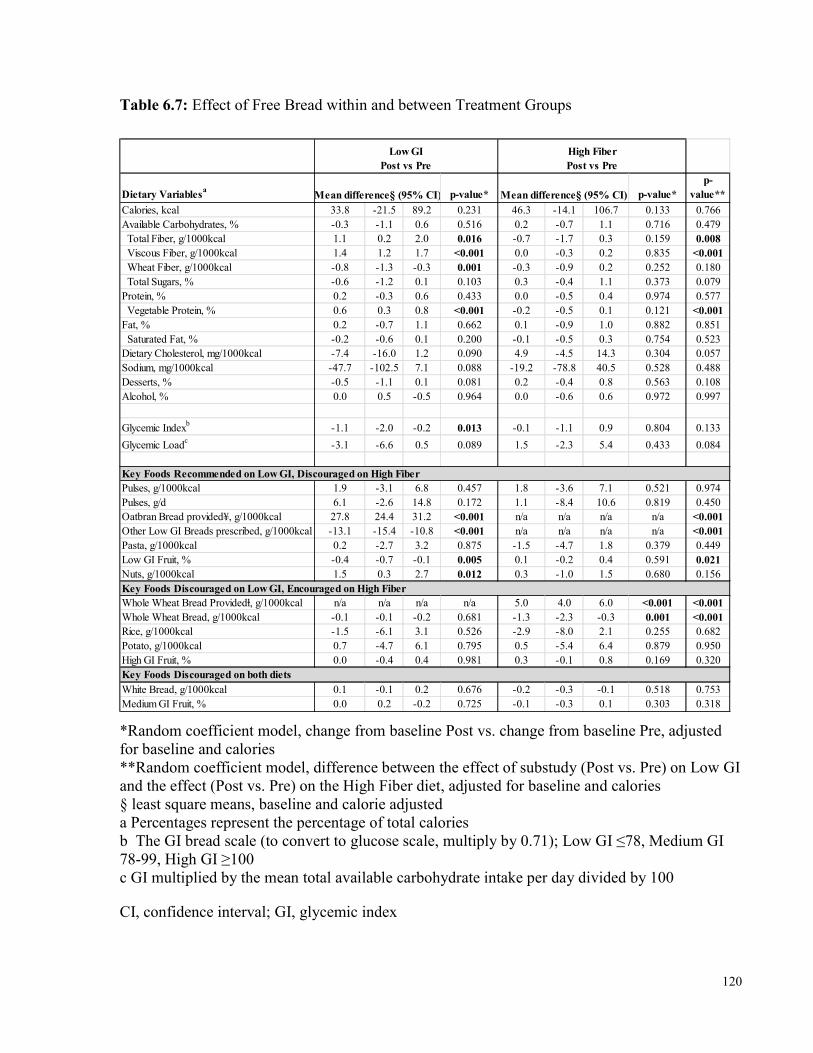
120
Table 6.7: Effect of Free Bread within and between Treatment Groups
Dietary Variablesa p-value* p-value*p-
value**Calories, kcal 33.8 -21.5 89.2 0.231 46.3 -14.1 106.7 0.133 0.766Available Carbohydrates, % -0.3 -1.1 0.6 0.516 0.2 -0.7 1.1 0.716 0.479 Total Fiber, g/1000kcal 1.1 0.2 2.0 0.016 -0.7 -1.7 0.3 0.159 0.008 Viscous Fiber, g/1000kcal 1.4 1.2 1.7 <0.001 0.0 -0.3 0.2 0.835 <0.001 Wheat Fiber, g/1000kcal -0.8 -1.3 -0.3 0.001 -0.3 -0.9 0.2 0.252 0.180 Total Sugars, % -0.6 -1.2 0.1 0.103 0.3 -0.4 1.1 0.373 0.079Protein, % 0.2 -0.3 0.6 0.433 0.0 -0.5 0.4 0.974 0.577 Vegetable Protein, % 0.6 0.3 0.8 <0.001 -0.2 -0.5 0.1 0.121 <0.001Fat, % 0.2 -0.7 1.1 0.662 0.1 -0.9 1.0 0.882 0.851 Saturated Fat, % -0.2 -0.6 0.1 0.200 -0.1 -0.5 0.3 0.754 0.523Dietary Cholesterol, mg/1000kcal -7.4 -16.0 1.2 0.090 4.9 -4.5 14.3 0.304 0.057Sodium, mg/1000kcal -47.7 -102.5 7.1 0.088 -19.2 -78.8 40.5 0.528 0.488Desserts, % -0.5 -1.1 0.1 0.081 0.2 -0.4 0.8 0.563 0.108Alcohol, % 0.0 0.5 -0.5 0.964 0.0 -0.6 0.6 0.972 0.997
Glycemic Indexb -1.1 -2.0 -0.2 0.013 -0.1 -1.1 0.9 0.804 0.133Glycemic Loadc -3.1 -6.6 0.5 0.089 1.5 -2.3 5.4 0.433 0.084Key Foods Recommended on Low GI, Discouraged on High FiberPulses, g/1000kcal 1.9 -3.1 6.8 0.457 1.8 -3.6 7.1 0.521 0.974Pulses, g/d 6.1 -2.6 14.8 0.172 1.1 -8.4 10.6 0.819 0.450Oatbran Bread provided¥, g/1000kcal 27.8 24.4 31.2 <0.001 n/a n/a n/a n/a <0.001Other Low GI Breads prescribed, g/1000kcal -13.1 -15.4 -10.8 <0.001 n/a n/a n/a n/a <0.001Pasta, g/1000kcal 0.2 -2.7 3.2 0.875 -1.5 -4.7 1.8 0.379 0.449Low GI Fruit, % -0.4 -0.7 -0.1 0.005 0.1 -0.2 0.4 0.591 0.021Nuts, g/1000kcal 1.5 0.3 2.7 0.012 0.3 -1.0 1.5 0.680 0.156Key Foods Discouraged on Low GI, Encouraged on High FiberWhole Wheat Bread Providedⱡ, g/1000kcal n/a n/a n/a n/a 5.0 4.0 6.0 <0.001 <0.001Whole Wheat Bread, g/1000kcal -0.1 -0.1 -0.2 0.681 -1.3 -2.3 -0.3 0.001 <0.001Rice, g/1000kcal -1.5 -6.1 3.1 0.526 -2.9 -8.0 2.1 0.255 0.682Potato, g/1000kcal 0.7 -4.7 6.1 0.795 0.5 -5.4 6.4 0.879 0.950High GI Fruit, % 0.0 -0.4 0.4 0.981 0.3 -0.1 0.8 0.169 0.320Key Foods Discouraged on both dietsWhite Bread, g/1000kcal 0.1 -0.1 0.2 0.676 -0.2 -0.3 -0.1 0.518 0.753Medium GI Fruit, % 0.0 0.2 -0.2 0.725 -0.1 -0.3 0.1 0.303 0.318
Mean difference§ (95% CI) Mean difference§ (95% CI)
Low GI Post vs Pre
High Fiber Post vs Pre
*Random coefficient model, change from baseline Post vs. change from baseline Pre, adjusted for baseline and calories **Random coefficient model, difference between the effect of substudy (Post vs. Pre) on Low GI and the effect (Post vs. Pre) on the High Fiber diet, adjusted for baseline and calories § least square means, baseline and calorie adjusted a Percentages represent the percentage of total calories b The GI bread scale (to convert to glucose scale, multiply by 0.71); Low GI ≤78, Medium GI 78-99, High GI ≥100 c GI multiplied by the mean total available carbohydrate intake per day divided by 100 CI, confidence interval; GI, glycemic index
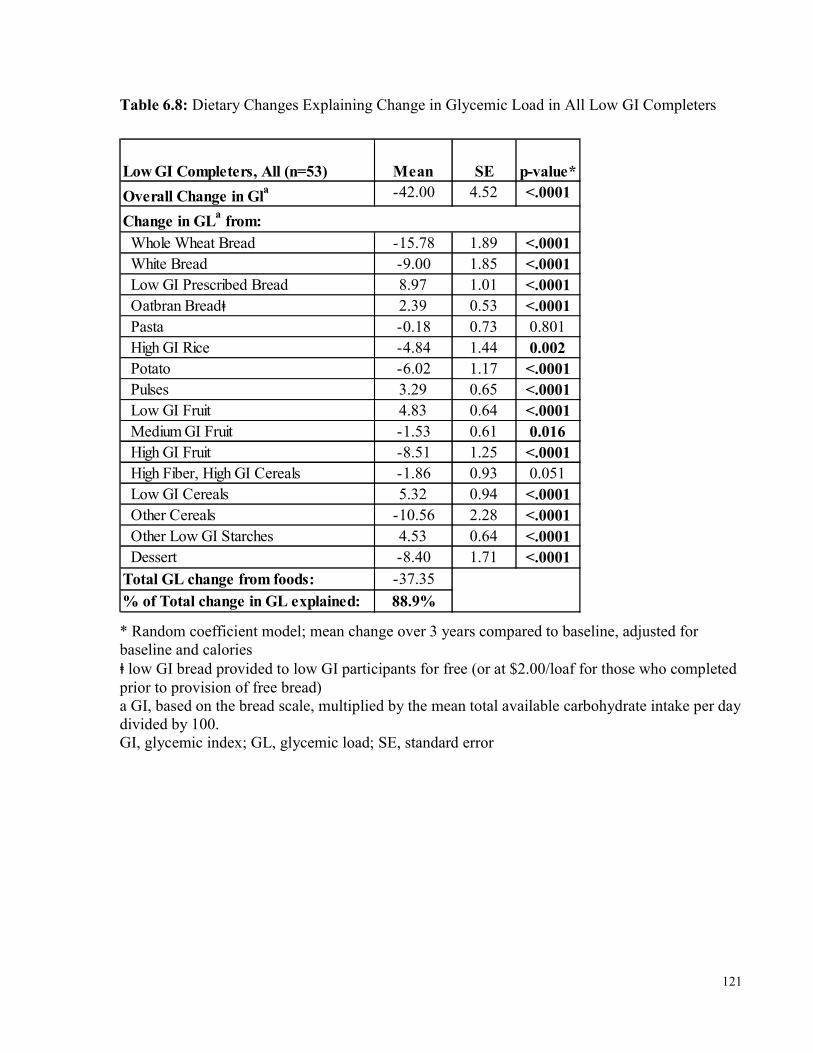
121
Table 6.8: Dietary Changes Explaining Change in Glycemic Load in All Low GI Completers
Low GI Completers, All (n=53) Mean SE p-value*Overall Change in Gla -42.00 4.52 <.0001
Whole Wheat Bread -15.78 1.89 <.0001 White Bread -9.00 1.85 <.0001 Low GI Prescribed Bread 8.97 1.01 <.0001 Oatbran Breadⱡ 2.39 0.53 <.0001 Pasta -0.18 0.73 0.801 High GI Rice -4.84 1.44 0.002 Potato -6.02 1.17 <.0001 Pulses 3.29 0.65 <.0001 Low GI Fruit 4.83 0.64 <.0001 Medium GI Fruit -1.53 0.61 0.016 High GI Fruit -8.51 1.25 <.0001 High Fiber, High GI Cereals -1.86 0.93 0.051 Low GI Cereals 5.32 0.94 <.0001 Other Cereals -10.56 2.28 <.0001 Other Low GI Starches 4.53 0.64 <.0001 Dessert -8.40 1.71 <.0001Total GL change from foods: -37.35% of Total change in GL explained: 88.9%
Change in GLa from:
* Random coefficient model; mean change over 3 years compared to baseline, adjusted for baseline and calories ⱡ low GI bread provided to low GI participants for free (or at $2.00/loaf for those who completed prior to provision of free bread) a GI, based on the bread scale, multiplied by the mean total available carbohydrate intake per day divided by 100. GI, glycemic index; GL, glycemic load; SE, standard error
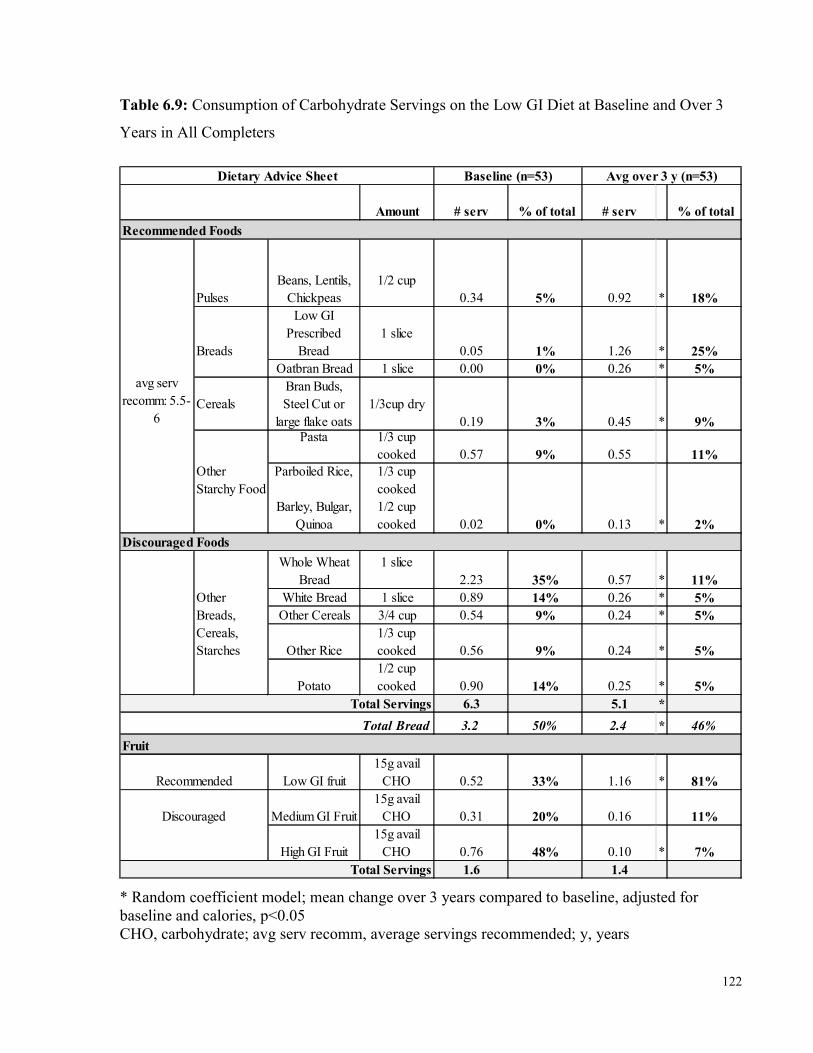
122
Table 6.9: Consumption of Carbohydrate Servings on the Low GI Diet at Baseline and Over 3 Years in All Completers
Amount # serv % of total # serv % of total
PulsesBeans, Lentils,
Chickpeas1/2 cup
0.34 5% 0.92 * 18%Low GI
Prescribed Bread
1 slice0.05 1% 1.26 * 25%
Oatbran Bread 1 slice 0.00 0% 0.26 * 5%Cereals
Bran Buds, Steel Cut or
large flake oats1/3cup dry
0.19 3% 0.45 * 9%Pasta 1/3 cup cooked 0.57 9% 0.55 11%
Parboiled Rice,
Barley, Bulgar, Quinoa
1/3 cup cooked1/2 cup cooked 0.02 0% 0.13 * 2%
Whole Wheat Bread
1 slice2.23 35% 0.57 * 11%
White Bread 1 slice 0.89 14% 0.26 * 5%Other Cereals 3/4 cup 0.54 9% 0.24 * 5%
Other Rice1/3 cup cooked 0.56 9% 0.24 * 5%
Potato1/2 cup cooked 0.90 14% 0.25 * 5%
6.3 5.1 *3.2 50% 2.4 * 46%
Low GI fruit15g avail
CHO 0.52 33% 1.16 * 81%Medium GI Fruit
15g avail CHO 0.31 20% 0.16 11%
High GI Fruit15g avail
CHO 0.76 48% 0.10 * 7%1.6 1.4
Discouraged
Total Servings
Dietary Advice Sheet Avg over 3 y (n=53)
Recommended Foods
Discouraged Foods
Total ServingsTotal Bread
Fruit
avg serv recomm: 5.5-
6
Breads
Other Starchy Food
Other Breads, Cereals, Starches
Baseline (n=53)
Recommended
* Random coefficient model; mean change over 3 years compared to baseline, adjusted for baseline and calories, p<0.05 CHO, carbohydrate; avg serv recomm, average servings recommended; y, years
123
Chapter 7 Overall Discussion & Conclusions
7 Overall Discussion & Conclusions
7.1 Overall Discussion These results are the first to assess diet and more direct measures of macrovascular disease, specifically exploring the association between glycemic index (GI) and dietary variables and newly developed 3-dimensional techniques for measuring plaque volume (vessel wall volume, VWV) by magnetic resonance imaging (MRI), in addition to assessments made through more standard 2-dimensional carotid ultrasound (CUS) scans (carotid intima media thickness, CIMT). These results are also the first to investigate long term adherence to a low GI diet, as well as the effect of the provision of a study food on low GI diet adherence, in those with type 2 diabetes.
Overall, similar results were found in the analyses of associations between GI and dietary variables and VWV and CIMT, as presented in Table 7.1. These similarities are not surprising since we found that VWV and CIMT were very strongly correlated (r=0.373, p<0.001), even in the fully adjusted model for cardiovascular disease (CVD) risk factors (r=0.366, p<0.001) (Figure 7.1). Since, there were 325 participants in the CIMT analyses, compared to 160 in the VWV analyses, this suggests that VWV may be a more sensitive measure. A recent systematic review and meta-analysis demonstrated that measurement of carotid plaque is more strongly predictive of cardiovascular events than is measurement by CIMT 362, though our measure of CIMT, unlike some methods, includes the capture of plaque since we include not only the common carotid artery, but also the bulb and internal carotid arteries, and CIMT at the bulb has been demonstrated to be predictive of CVD 363. However, it has been demonstrated that the 3-dimensional measures by MRI better measure carotid plaque than the 2-dimensional measure by CUS 33-35. Therefore, it was surprising that in terms of the associations explored with anthropometric and bloodwork measures, only sex and waist circumference was demonstrated in the VWV analyses, whereas in the CIMT analyses, systolic blood pressure, pulse pressure,
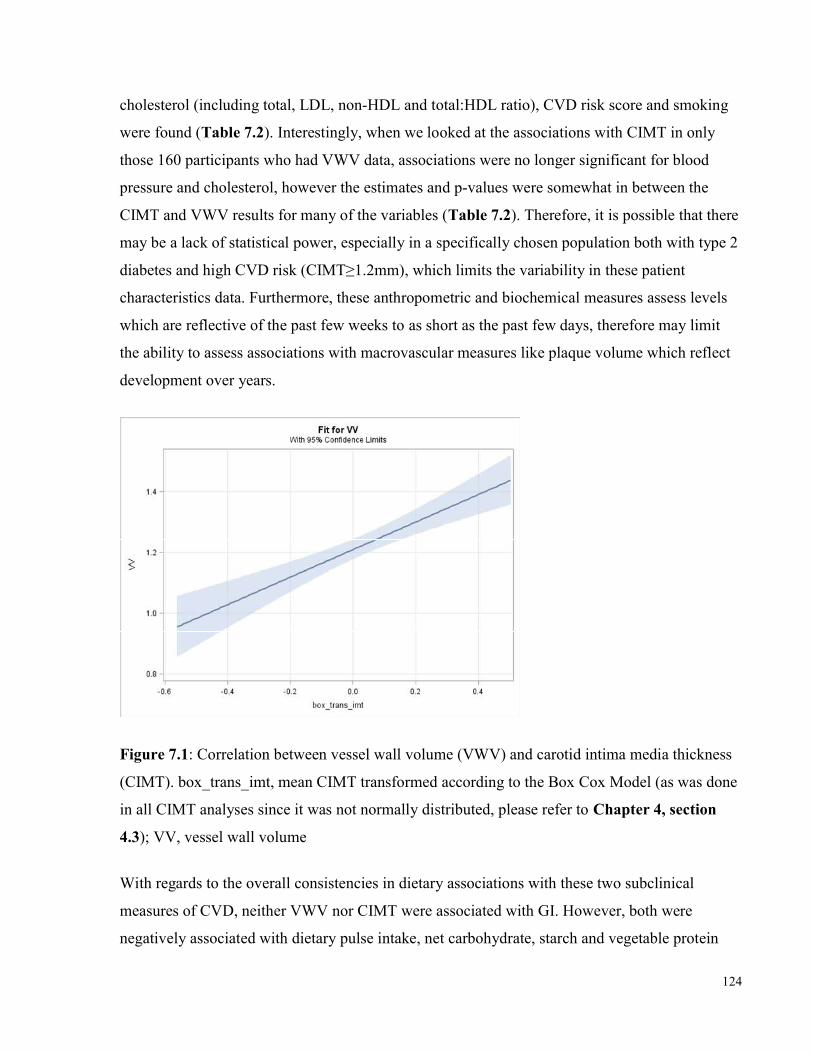
124
cholesterol (including total, LDL, non-HDL and total:HDL ratio), CVD risk score and smoking were found (Table 7.2). Interestingly, when we looked at the associations with CIMT in only those 160 participants who had VWV data, associations were no longer significant for blood pressure and cholesterol, however the estimates and p-values were somewhat in between the CIMT and VWV results for many of the variables (Table 7.2). Therefore, it is possible that there may be a lack of statistical power, especially in a specifically chosen population both with type 2 diabetes and high CVD risk (CIMT≥1.2mm), which limits the variability in these patient characteristics data. Furthermore, these anthropometric and biochemical measures assess levels which are reflective of the past few weeks to as short as the past few days, therefore may limit the ability to assess associations with macrovascular measures like plaque volume which reflect development over years.
Figure 7.1: Correlation between vessel wall volume (VWV) and carotid intima media thickness (CIMT). box_trans_imt, mean CIMT transformed according to the Box Cox Model (as was done in all CIMT analyses since it was not normally distributed, please refer to Chapter 4, section 4.3); VV, vessel wall volume
With regards to the overall consistencies in dietary associations with these two subclinical measures of CVD, neither VWV nor CIMT were associated with GI. However, both were negatively associated with dietary pulse intake, net carbohydrate, starch and vegetable protein
125
intake, and positively associated with saturated fat and red meat protein intake (Table 7.1). A positive association with dietary cholesterol was only found in the VWV analyses and the association with red meat protein was also stronger in the VWV analyses. These results are particularly interesting since the current view on dietary cholesterol is that it is not harmful, although there is literature to support a potential negative effect on carotid plaque and CVD, particularly in those with diabetes 364-366. Further trials are warranted to explore any possible negative effects of dietary cholesterol on CVD, especially in those with diabetes. Another dietary variable which was found to be associated in only one of the 2 was dietary fiber which was observed in the CIMT analyses when comparing those consuming <25g/d to those consuming >35g/d (section 4.3). However this relation has been observed in previous studies 257, therefore may need a greater sample size to be seen with VWW since there was a non-significant trend present (p=0.188).
We had hypothesized that lower GI diets would be associated with lower carotid plaque, however did not observe an association in either CIMT or VWV analyses. We believe we may not have been able to see an association because there was a lack of range of baseline GI in our population which may be because they had overall good diets at study entry. Additionally, there were no participants with a high GI diet at baseline. Although it is possible that there is no association or effect of GI on carotid plaque, since randomized controlled trials comparing low GI to higher GI diets have demonstrated benefits of low GI diets on CVD risk factors, including blood pressure 115, pulse pressure 13 and cholesterol 16, each of which we demonstrated were CVD factors associated with CIMT (Table 7.2), it is still possible that there may be an effect of GI on carotid plaque. Furthermore, the antidiabetic drug acarbose, which essentially lowers postprandial glycemia effectively converting the diet to a low GI diet, has been demonstrated in multiple trials to lower CIMT 251, 315, 316. Similarly, insulin secretagogues (e.g. nateglinide and repaglinide), which also act to reduce postprandial glycemia, have demonstrated reductions in CIMT 254, 314. Therefore, the main results of the current 3-year randomized controlled trial (as described in Chapter 2), comparing a low GI diet to a higher GI, high cereal fiber diet are greatly anticipated as they will address this question directly. Additionally supporting the potential for a benefit of low GI diets on carotid plaque is the consistent finding of a significant negative association between both VWV and CIMT with dietary pulse intake, as well as the
126
consistency in pulses being the strongest contributor to the effect observed for starch in both analyses, since pulses are particularly low GI foods.
In our 3-year analyses on dietary adherence, as predicted by our hypothesis, low GI diet advice was adopted and sustained successfully long term. We demonstrated that those given low GI dietary advice could successfully maintain over a 3-year period a significant reduction of 11 GI units, which is comparable to what we have observed in our 3 and 6-month low GI dietary trials, which ranged from 10-13 GI unit reductions with similar low GI diet advice 13, 112. With low GI diet advice, we also found a significant increase in dietary pulse intake, which were more than double the baseline intake (+50.3g/d, p<0.001), about a 20% increase in vegetable protein intake (+1.4% kcal, p<0.001), about a 28% increase in dietary fiber (+10.3g/d, p<0.001) and 10% reduction in saturated fat (-1.2%kcal, p<0.001). The changes in food choices which were adopted from low GI diet advice primarily were substitutions of breads and cereals with low GI options, of potatoes and rice with dietary pulses, and of high and medium GI fruit with low GI fruit (section 6.3). The results of the analyses on long term adherence highlight the need for accessibility to education and labelling about what foods are good low GI options, particularly breads and cereals, accessibility of these low GI foods on supermarket shelves and in restaurants, and the potential importance of public perceptions on foods like pasta which may influence use.
In the analyses on the effect of the provision of a free food, as expected in our hypothesis, in the low GI group, with the provision of a free low GI study bread, there was a significantly greater reduction in the GI of the diet (-1.14 GI units lower, p=0.013) post bread. Further improvements were also observed in vegetable protein (+0.6%kcal more, p<0.001), dietary fiber (+1.1g/1000kcal more, p=0.016), and saturated fat (-0.2% kcal lower, p=0.200) intakes post bread, as well as a non-significant improvement in dietary pulse intake (+6g/d more, p=0.172). Although these post-substudy changes are not large, they are supportive of better adherence to dietary advice, which supports our hypothesis. Therefore, the provision of a study food may help to promote adherence to dietary advice. However, great importance should be placed not only on what food is chosen, but on the way in which the food is made available to participants since we found that feedback from participants focused on inconvenience, due to time required to pick up study bread and the limitation on amount of bread one could take in a pick-up due to limited freezer space. Thus, greater improvements in adherence could have been achieved by eliminating
127
inconvenience, for example with bi-weekly delivery of study bread, however this would require a much greater budget allocation.
Overall, considering the dietary changes observed on the low GI diet over 3 years, according to the associations observed for CIMT and VWV, it is possible that improvements in carotid plaque may occur. With changes in dietary pulse intake from ~30g/d at baseline to an overall study average intake of ~81g/d on the low GI diet, according to the model based on CIMT associations with dietary pulses (Figure 4.1), advice would have predicted participants to have an ~0.014mm lower CIMT compared to those who did not increase their dietary pulse intake. If this translates to a reduction in CIMT, considering an annual progression of 0.02mm, then these participants may progress only 0.006mm compared to those who did not change their dietary pulse intake. Since low GI diet advice also reduced the participants’ saturated fat intake ~1.2% over 3 years in all completers in the study thus far, according to our model based on the association with CIMT where 1% lower saturated fat predicted a 0.022mm lower CIMT, this could translate to a 0.026mm lower CIMT. If the saturated fat and dietary pulse data are independent and additive, a 0.040mm lower CIMT could be expected and if not additive, a 0.014-0.026mm lower CIMT could be expected. Accounting for the 0.02mm annual progression, these results could mean almost no change over a year, or even a regression of CIMT. For VWV, we found not only that it was strongly correlated with CIMT (Figure 7.1), but we also found similar models with these dietary variables. For example, firstly, we demonstrated a serving of pulses corresponded to an ~8% lower VWV and for CIMT, an ~8.5% lower CIMT. Secondly, we demonstrated a 1% lower saturated fat corresponded to a 0.023cm3 lower VWV, and a 0.0218mm lower CIMT. Thus, these possible translations of reductions in CIMT could also be applied to VWV. Furthermore, considering there were also improvements in dietary fiber intake which brought levels from ~25g/d at baseline to >35g/d during the overall study period and we had seen that CIMT levels below 25g/d were significantly higher than those with fiber intakes >35g/d (difference of 0.054mm in CIMT), this may add further to the potential for improvements in CIMT over 3 years (or at least reductions in annual progression rates).These proposed reductions in CIMT and VWV as measures of carotid plaque which may result from low GI dietary changes may have the potential to reduce the risk of CVD.
128
Therefore, low GI dietary advice is sustainable over a long period of time and with dietary changes that result from low GI diet advice, improvements in subclinical arterial disease may occur. Provision of study food may assist in diet adherence, however addressing convenience could improve effectiveness. The results demonstrate that dietary pulse consumption seems particularly important in relation to carotid plaque levels. Pulses should definitely be stressed in future low GI diets and in future design, should be included in free food provisions. The end results of the 3-year trial are greatly anticipated to observe if these dietary changes resulting from low GI dietary advice correspond to reduction in annual progression, or even regression of carotid plaque or whether again, specific foods such as dietary pulses are the major determinants of VWV.
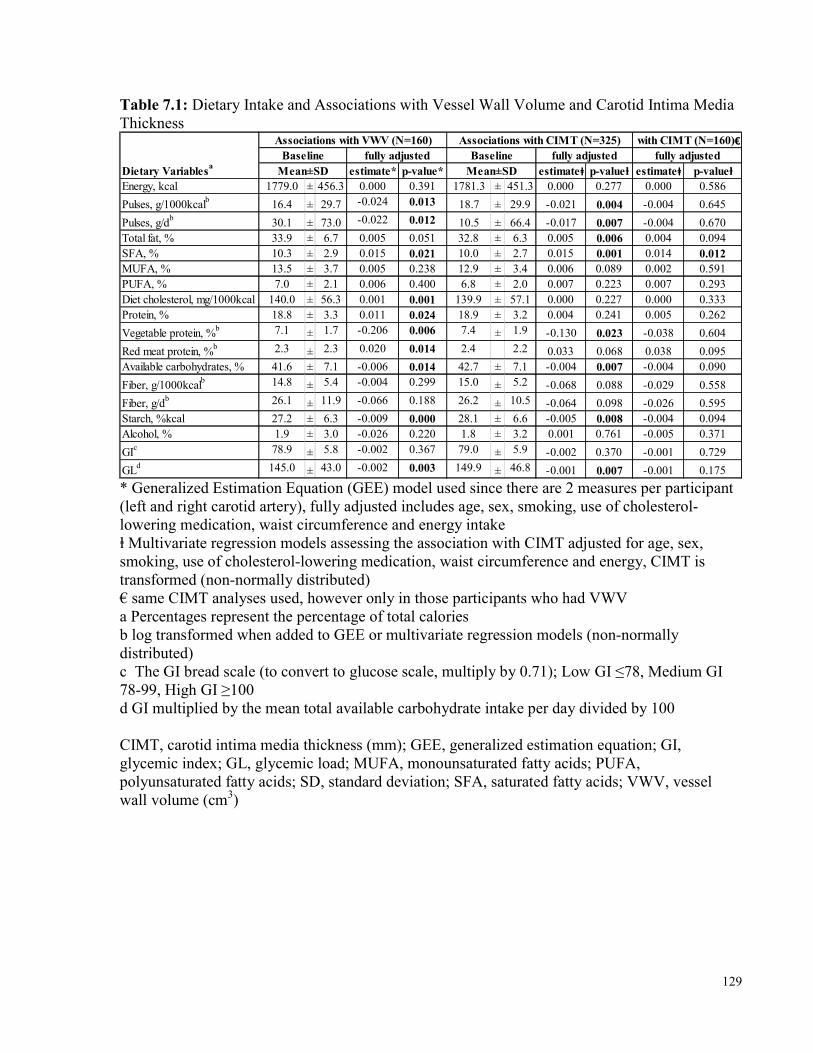
129
Table 7.1: Dietary Intake and Associations with Vessel Wall Volume and Carotid Intima Media Thickness
estimate* p-value* estimateⱡ p-valueⱡ estimateⱡ p-valueⱡEnergy, kcal 1779.0 ± 456.3 0.000 0.391 1781.3 ± 451.3 0.000 0.277 0.000 0.586Pulses, g/1000kcalb 16.4 ± 29.7 -0.024 0.013 18.7 ± 29.9 -0.021 0.004 -0.004 0.645Pulses, g/db 30.1 ± 73.0 -0.022 0.012 10.5 ± 66.4 -0.017 0.007 -0.004 0.670Total fat, % 33.9 ± 6.7 0.005 0.051 32.8 ± 6.3 0.005 0.006 0.004 0.094SFA, % 10.3 ± 2.9 0.015 0.021 10.0 ± 2.7 0.015 0.001 0.014 0.012MUFA, % 13.5 ± 3.7 0.005 0.238 12.9 ± 3.4 0.006 0.089 0.002 0.591PUFA, % 7.0 ± 2.1 0.006 0.400 6.8 ± 2.0 0.007 0.223 0.007 0.293Diet cholesterol, mg/1000kcal 140.0 ± 56.3 0.001 0.001 139.9 ± 57.1 0.000 0.227 0.000 0.333Protein, % 18.8 ± 3.3 0.011 0.024 18.9 ± 3.2 0.004 0.241 0.005 0.262Vegetable protein, %b 7.1 ± 1.7 -0.206 0.006 7.4 ± 1.9 -0.130 0.023 -0.038 0.604Red meat protein, %b 2.3 ± 2.3 0.020 0.014 2.4 2.2 0.033 0.068 0.038 0.095Available carbohydrates, % 41.6 ± 7.1 -0.006 0.014 42.7 ± 7.1 -0.004 0.007 -0.004 0.090Fiber, g/1000kcalb 14.8 ± 5.4 -0.004 0.299 15.0 ± 5.2 -0.068 0.088 -0.029 0.558Fiber, g/db 26.1 ± 11.9 -0.066 0.188 26.2 ± 10.5 -0.064 0.098 -0.026 0.595Starch, %kcal 27.2 ± 6.3 -0.009 0.000 28.1 ± 6.6 -0.005 0.008 -0.004 0.094Alcohol, % 1.9 ± 3.0 -0.026 0.220 1.8 ± 3.2 0.001 0.761 -0.005 0.371GIc 78.9 ± 5.8 -0.002 0.367 79.0 ± 5.9 -0.002 0.370 -0.001 0.729GLd 145.0 ± 43.0 -0.002 0.003 149.9 ± 46.8 -0.001 0.007 -0.001 0.175
Dietary Variablesa Mean±SD Mean±SDfully adjusted fully adjustedBaseline
Associations with CIMT (N=325)Baseline
Associations with VWV (N=160) with CIMT (N=160)€fully adjusted
* Generalized Estimation Equation (GEE) model used since there are 2 measures per participant (left and right carotid artery), fully adjusted includes age, sex, smoking, use of cholesterol-lowering medication, waist circumference and energy intake ⱡ Multivariate regression models assessing the association with CIMT adjusted for age, sex, smoking, use of cholesterol-lowering medication, waist circumference and energy, CIMT is transformed (non-normally distributed) € same CIMT analyses used, however only in those participants who had VWV a Percentages represent the percentage of total calories b log transformed when added to GEE or multivariate regression models (non-normally distributed) c The GI bread scale (to convert to glucose scale, multiply by 0.71); Low GI ≤78, Medium GI 78-99, High GI ≥100 d GI multiplied by the mean total available carbohydrate intake per day divided by 100 CIMT, carotid intima media thickness (mm); GEE, generalized estimation equation; GI, glycemic index; GL, glycemic load; MUFA, monounsaturated fatty acids; PUFA, polyunsaturated fatty acids; SD, standard deviation; SFA, saturated fatty acids; VWV, vessel wall volume (cm3)
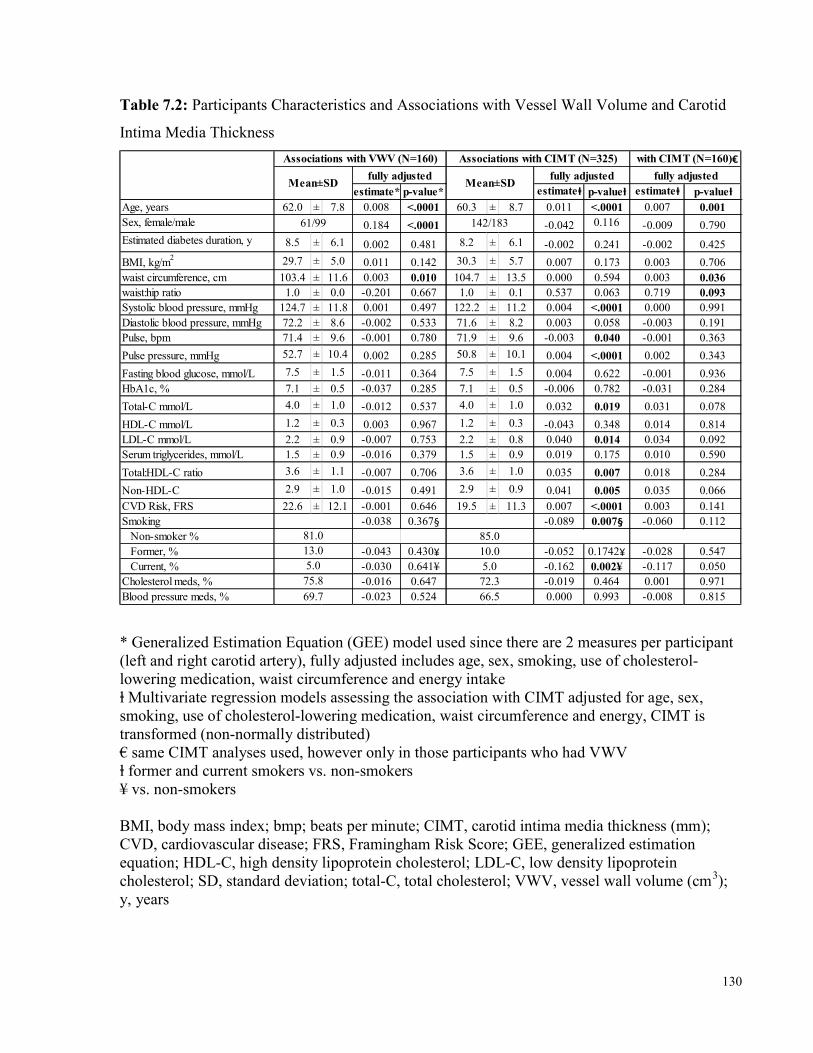
130
Table 7.2: Participants Characteristics and Associations with Vessel Wall Volume and Carotid Intima Media Thickness
estimate* p-value* estimateⱡ p-valueⱡ estimateⱡ p-valueⱡAge, years 62.0 ± 7.8 0.008 <.0001 60.3 ± 8.7 0.011 <.0001 0.007 0.001Sex, female/male 0.184 <.0001 -0.042 0.116 -0.009 0.790Estimated diabetes duration, y 8.5 ± 6.1 0.002 0.481 8.2 ± 6.1 -0.002 0.241 -0.002 0.425BMI, kg/m2 29.7 ± 5.0 0.011 0.142 30.3 ± 5.7 0.007 0.173 0.003 0.706waist circumference, cm 103.4 ± 11.6 0.003 0.010 104.7 ± 13.5 0.000 0.594 0.003 0.036waist:hip ratio 1.0 ± 0.0 -0.201 0.667 1.0 ± 0.1 0.537 0.063 0.719 0.093Systolic blood pressure, mmHg 124.7 ± 11.8 0.001 0.497 122.2 ± 11.2 0.004 <.0001 0.000 0.991Diastolic blood pressure, mmHg 72.2 ± 8.6 -0.002 0.533 71.6 ± 8.2 0.003 0.058 -0.003 0.191Pulse, bpm 71.4 ± 9.6 -0.001 0.780 71.9 ± 9.6 -0.003 0.040 -0.001 0.363Pulse pressure, mmHg 52.7 ± 10.4 0.002 0.285 50.8 ± 10.1 0.004 <.0001 0.002 0.343Fasting blood glucose, mmol/L 7.5 ± 1.5 -0.011 0.364 7.5 ± 1.5 0.004 0.622 -0.001 0.936HbA1c, % 7.1 ± 0.5 -0.037 0.285 7.1 ± 0.5 -0.006 0.782 -0.031 0.284Total-C mmol/L 4.0 ± 1.0 -0.012 0.537 4.0 ± 1.0 0.032 0.019 0.031 0.078HDL-C mmol/L 1.2 ± 0.3 0.003 0.967 1.2 ± 0.3 -0.043 0.348 0.014 0.814LDL-C mmol/L 2.2 ± 0.9 -0.007 0.753 2.2 ± 0.8 0.040 0.014 0.034 0.092Serum triglycerides, mmol/L 1.5 ± 0.9 -0.016 0.379 1.5 ± 0.9 0.019 0.175 0.010 0.590Total:HDL-C ratio 3.6 ± 1.1 -0.007 0.706 3.6 ± 1.0 0.035 0.007 0.018 0.284Non-HDL-C 2.9 ± 1.0 -0.015 0.491 2.9 ± 0.9 0.041 0.005 0.035 0.066CVD Risk, FRS 22.6 ± 12.1 -0.001 0.646 19.5 ± 11.3 0.007 <.0001 0.003 0.141Smoking -0.038 0.367§ -0.089 0.007§ -0.060 0.112 Non-smoker % Former, % -0.043 0.430¥ -0.052 0.1742¥ -0.028 0.547 Current, % -0.030 0.641¥ -0.162 0.002¥ -0.117 0.050Cholesterol meds, % -0.016 0.647 -0.019 0.464 0.001 0.971Blood pressure meds, % -0.023 0.524 0.000 0.993 -0.008 0.815
75.869.7
85.010.05.0
72.366.5
with CIMT (N=160)€fully adjusted
81.013.05.0
Mean±SDMean±SDAssociations with VWV (N=160) Associations with CIMT (N=325)
fully adjusted fully adjusted
142/18361/99
* Generalized Estimation Equation (GEE) model used since there are 2 measures per participant (left and right carotid artery), fully adjusted includes age, sex, smoking, use of cholesterol-lowering medication, waist circumference and energy intake ⱡ Multivariate regression models assessing the association with CIMT adjusted for age, sex, smoking, use of cholesterol-lowering medication, waist circumference and energy, CIMT is transformed (non-normally distributed) € same CIMT analyses used, however only in those participants who had VWV ⱡ former and current smokers vs. non-smokers ¥ vs. non-smokers BMI, body mass index; bmp; beats per minute; CIMT, carotid intima media thickness (mm); CVD, cardiovascular disease; FRS, Framingham Risk Score; GEE, generalized estimation equation; HDL-C, high density lipoprotein cholesterol; LDL-C, low density lipoprotein cholesterol; SD, standard deviation; total-C, total cholesterol; VWV, vessel wall volume (cm3); y, years
131
References 1. World Health Organization. Global Report on Diabetes. 2016. 2. CNIB. The Cost of Vision Loss in Canada. CNIB and the Canadian Ophthalmological Society. Access Economics; 2009. http://www.cnib.ca/eng/cnib%20document%20library/research/covl_full_report.pdf [Accessed July 10, 2015]. 2009. 3. Centers for Disease Control and Prevention (CDC). Vision Health Initiative. National Center for Health Statistics, Division of Health Interview Statistics, data from the National Health Interview Survey. http://www.cdc.gov/visionhealth/basic_information/eye_disorders.htm [Accessed July 10, 2015]. 2015. 4. Motilch ME, De Fronzo RA and Franz MJ. for American Diabetes Association. Diabetic Nephropathy. Diabetes Care. 2002;25:585-589. 5. Emerging Risk Factors C, Sarwar N, Gao P, Seshasai SR, Gobin R, Kaptoge S, Di Angelantonio E, Ingelsson E, Lawlor DA, Selvin E, Stampfer M, Stehouwer CD, Lewington S, Pennells L, Thompson A, Sattar N, White IR, Ray KK and Danesh J. Diabetes mellitus, fasting blood glucose concentration, and risk of vascular disease: a collaborative meta-analysis of 102 prospective studies. Lancet. 2010;375:2215-22. 6. Public Health Agency of Canada. Unpublished analysis using 2008/09 data from the Canadian Chronic Disease Surveillance System (Public Health Agency of Canada). 2011: http://www.phac-aspc.gc.ca/cd-mc/cvd-mcv/index-eng.php 7. Hemmingsen B, Lund SS, Gluud C, Vaag A, Almdal TP, Hemmingsen C and Wetterslev J. Targeting intensive glycaemic control versus targeting conventional glycaemic control for type 2 diabetes mellitus. The Cochrane database of systematic reviews. 2013;11:CD008143. 8. Fullerton B, Jeitler K, Seitz M, Horvath K, Berghold A and Siebenhofer A. Intensive glucose control versus conventional glucose control for type 1 diabetes mellitus. The Cochrane database of systematic reviews. 2014;2:CD009122. 9. Boussageon R, Bejan-Angoulvant T, Saadatian-Elahi M, Lafont S, Bergeonneau C, Kassai B, Erpeldinger S, Wright JM, Gueyffier F and Cornu C. Effect of intensive glucose lowering treatment on all cause mortality, cardiovascular death, and microvascular events in type 2 diabetes: meta-analysis of randomised controlled trials. BMJ. 2011;343:d4169. 10. Control Group, Turnbull FM, Abraira C, Anderson RJ, Byington RP, Chalmers JP, Duckworth WC, Evans GW, Gerstein HC, Holman RR, Moritz TE, Neal BC, Ninomiya T, Patel AA, Paul SK, Travert F and Woodward M. Intensive glucose control and macrovascular outcomes in type 2 diabetes. Diabetologia. 2009;52:2288-98. 11. Holman RR, Paul SK, Bethel MA, Matthews DR and Neil HA. 10-year follow-up of intensive glucose control in type 2 diabetes. N Engl J Med. 2008;359:1577-89. 12. Hayward RA, Reaven PD, Wiitala WL, Bahn GD, Reda DJ, Ge L, McCarren M, Duckworth WC, Emanuele NV and Investigators V. Follow-up of glycemic control and cardiovascular outcomes in type 2 diabetes. N Engl J Med. 2015;372:2197-206. 13. Jenkins DJ, Kendall CW, Augustin LS, Mitchell S, Sahye-Pudaruth S, Blanco Mejia S, Chiavaroli L, Mirrahimi A, Ireland C, Bashyam B, Vidgen E, de Souza RJ, Sievenpiper JL, Coveney J, Leiter LA and Josse RG. Effect of legumes as part of a low glycemic index diet on glycemic control and cardiovascular risk factors in type 2 diabetes mellitus: a randomized controlled trial. Arch Intern Med. 2012;172:1653-60. 14. Anderson TJ, Gregoire J, Hegele RA, Couture P, Mancini GB, McPherson R, Francis GA, Poirier P, Lau DC, Grover S, Genest J, Jr., Carpentier AC, Dufour R, Gupta M, Ward R,
132
Leiter LA, Lonn E, Ng DS, Pearson GJ, Yates GM, Stone JA and Ur E. 2012 update of the Canadian Cardiovascular Society guidelines for the diagnosis and treatment of dyslipidemia for the prevention of cardiovascular disease in the adult. The Canadian journal of cardiology. 2013;29:151-67. 15. Stone NJ, Robinson JG, Lichtenstein AH, Bairey Merz CN, Blum CB, Eckel RH, Goldberg AC, Gordon D, Levy D, Lloyd-Jones DM, McBride P, Schwartz JS, Shero ST, Smith SC, Jr., Watson K, Wilson PW, Eddleman KM, Jarrett NM, LaBresh K, Nevo L, Wnek J, Anderson JL, Halperin JL, Albert NM, Bozkurt B, Brindis RG, Curtis LH, DeMets D, Hochman JS, Kovacs RJ, Ohman EM, Pressler SJ, Sellke FW, Shen WK, Smith SC, Jr., Tomaselli GF and American College of Cardiology/American Heart Association Task Force on Practice Guidelines. 2013 ACC/AHA guideline on the treatment of blood cholesterol to reduce atherosclerotic cardiovascular risk in adults: a report of the American College of Cardiology/American Heart Association Task Force on Practice Guidelines. Circulation. 2014;129:S1-45. 16. Goff LM, Cowland DE, Hooper L and Frost GS. Low glycaemic index diets and blood lipids: a systematic review and meta-analysis of randomised controlled trials. Nutrition, metabolism, and cardiovascular diseases : NMCD. 2013;23:1-10. 17. Ajala O, English P and Pinkney J. Systematic review and meta-analysis of different dietary approaches to the management of type 2 diabetes. Am J Clin Nutr. 2013;97:505-16. 18. Wang Q, Xia W, Zhao Z and Zhang H. Effects comparison between low glycemic index diets and high glycemic index diets on HbA1c and fructosamine for patients with diabetes: A systematic review and meta-analysis. Primary care diabetes. 2014. 19. Thomas DE and Elliott EJ. The use of low-glycaemic index diets in diabetes control. The British journal of nutrition. 2010;104:797-802. 20. Liu S, Willett WC, Stampfer MJ, Hu FB, Franz M, Sampson L, Hennekens CH and Manson JE. A prospective study of dietary glycemic load, carbohydrate intake, and risk of coronary heart disease in US women. Am J Clin Nutr. 2000;71:1455-61. 21. Mirrahimi A, de Souza RJ, Chiavaroli L, Sievenpiper JL, Beyene J, Hanley AJ, Augustin LS, Kendall CW and Jenkins DJ. Associations of glycemic index and load with coronary heart disease events: a systematic review and meta-analysis of prospective cohorts. Journal of the American Heart Association. 2012;1:e000752. 22. Ma XY, Liu JP and Song ZY. Glycemic load, glycemic index and risk of cardiovascular diseases: meta-analyses of prospective studies. Atherosclerosis. 2012;223:491-6. 23. Chiasson JL, Josse RG, Gomis R, Hanefeld M, Karasik A, Laakso M and Group S-NTR. Acarbose treatment and the risk of cardiovascular disease and hypertension in patients with impaired glucose tolerance: the STOP-NIDDM trial. JAMA. 2003;290:486-94. 24. Riley WA, Barnes RW, Applegate WB, Dempsey R, Hartwell T, Davis VG, Bond MG and Furberg CD. Reproducibility of noninvasive ultrasonic measurement of carotid atherosclerosis. The Asymptomatic Carotid Artery Plaque Study. Stroke. 1992;23:1062-8. 25. Furberg CD, Adams HP, Jr., Applegate WB, Byington RP, Espeland MA, Hartwell T, Hunninghake DB, Lefkowitz DS, Probstfield J, Riley WA and et al. Effect of lovastatin on early carotid atherosclerosis and cardiovascular events. Asymptomatic Carotid Artery Progression Study (ACAPS) Research Group. Circulation. 1994;90:1679-87. 26. Salonen R, Nyyssonen K, Porkkala E, Rummukainen J, Belder R, Park JS and Salonen JT. Kuopio Atherosclerosis Prevention Study (KAPS). A population-based primary preventive trial of the effect of LDL lowering on atherosclerotic progression in carotid and femoral arteries. Circulation. 1995;92:1758-64.
133
27. Bots ML, Palmer MK, Dogan S, Plantinga Y, Raichlen JS, Evans GW, O'Leary DH, Grobbee DE, Crouse JR, 3rd and Group MS. Intensive lipid lowering may reduce progression of carotid atherosclerosis within 12 months of treatment: the METEOR study. Journal of internal medicine. 2009;265:698-707. 28. Hedblad B, Wikstrand J, Janzon L, Wedel H and Berglund G. Low-dose metoprolol CR/XL and fluvastatin slow progression of carotid intima-media thickness: Main results from the Beta-Blocker Cholesterol-Lowering Asymptomatic Plaque Study (BCAPS). Circulation. 2001;103:1721-6. 29. Aguilar-Shea AL, Gallardo-Mayo C, Garrido-Elustondo S, Calvo-Manuel E and Zamorano-Gomez JL. Carotid intima-media thickness as a screening tool in cardiovascular primary prevention. European journal of clinical investigation. 2011;41:521-6. 30. Costanzo P, Perrone-Filardi P, Vassallo E, Paolillo S, Cesarano P, Brevetti G and Chiariello M. Does carotid intima-media thickness regression predict reduction of cardiovascular events? A meta-analysis of 41 randomized trials. J Am Coll Cardiol. 2010;56:2006-20. 31. Lorenz MW, Polak JF, Kavousi M, Mathiesen EB, Volzke H, Tuomainen TP, Sander D, Plichart M, Catapano AL, Robertson CM, Kiechl S, Rundek T, Desvarieux M, Lind L, Schmid C, DasMahapatra P, Gao L, Ziegelbauer K, Bots ML, Thompson SG and Group P-IS. Carotid intima-media thickness progression to predict cardiovascular events in the general population (the PROG-IMT collaborative project): a meta-analysis of individual participant data. Lancet. 2012;379:2053-62. 32. Lorenz MW, Price JF, Robertson C, Bots ML, Polak JF, Poppert H, Kavousi M, Dorr M, Stensland E, Ducimetiere P, Ronkainen K, Kiechl S, Sitzer M, Rundek T, Lind L, Liu J, Bergstrom G, Grigore L, Bokemark L, Friera A, Yanez D, Bickel H, Ikram MA, Volzke H, Johnsen SH, Empana JP, Tuomainen TP, Willeit P, Steinmetz H, Desvarieux M, Xie W, Schmidt C, Norata GD, Suarez C, Sander D, Hofman A, Schminke U, Mathiesen E, Plichart M, Kauhanen J, Willeit J, Sacco RL, McLachlan S, Zhao D, Fagerberg B, Catapano AL, Gabriel R, Franco OH, Bulbul A, Scheckenbach F, Pflug A, Gao L and Thompson SG. Carotid Intima-Media Thickness Progression and Risk of Vascular Events in People With Diabetes: Results From the PROG-IMT Collaboration. Diabetes Care. 2015;38:1921-9. 33. Underhill HR and Yuan C. Carotid MRI: a tool for monitoring individual response to cardiovascular therapy? Expert review of cardiovascular therapy. 2011;9:63-80. 34. Underhill HR, Yuan C, Yarnykh VL, Chu B, Oikawa M, Polissar NL, Schwartz SM, Jarvik GP and Hatsukami TS. Arterial remodeling in [corrected] subclinical carotid artery disease. JACC Cardiovascular imaging. 2009;2:1381-9. 35. Singh N, Moody AR, Roifman I, Bluemke DA and Zavodni AE. Advanced MRI for carotid plaque imaging. The international journal of cardiovascular imaging. 2015. 36. Li F, Yarnykh VL, Hatsukami TS, Chu B, Balu N, Wang J, Underhill HR, Zhao X, Smith R and Yuan C. Scan-rescan reproducibility of carotid atherosclerotic plaque morphology and tissue composition measurements using multicontrast MRI at 3T. Journal of magnetic resonance imaging : JMRI. 2010;31:168-76. 37. Wang J, Balu N, Canton G and Yuan C. Imaging biomarkers of cardiovascular disease. Journal of magnetic resonance imaging : JMRI. 2010;32:502-15. 38. Zhang Y, Guallar E, Qiao Y and Wasserman BA. Is carotid intima-media thickness as predictive as other noninvasive techniques for the detection of coronary artery disease? Arteriosclerosis, thrombosis, and vascular biology. 2014;34:1341-5. 39. Duivenvoorden R, de Groot E, Elsen BM, Lameris JS, van der Geest RJ, Stroes ES, Kastelein JJ and Nederveen AJ. In vivo quantification of carotid artery wall dimensions: 3.0-
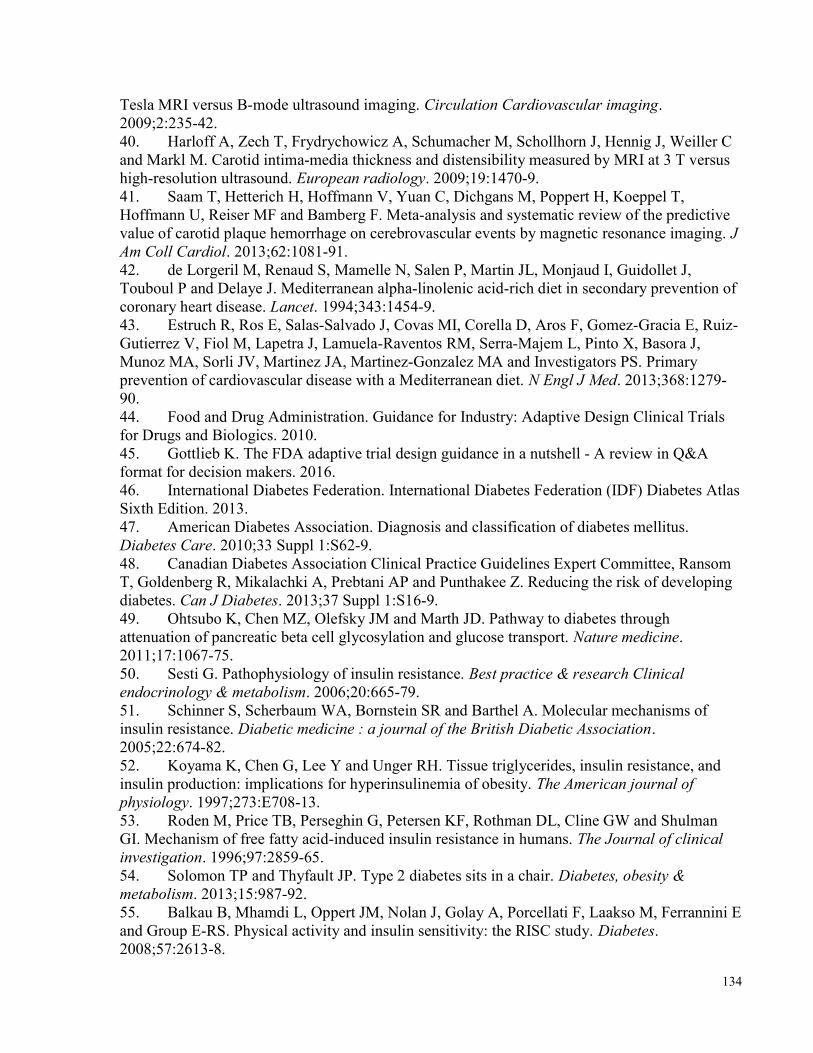
134
Tesla MRI versus B-mode ultrasound imaging. Circulation Cardiovascular imaging. 2009;2:235-42. 40. Harloff A, Zech T, Frydrychowicz A, Schumacher M, Schollhorn J, Hennig J, Weiller C and Markl M. Carotid intima-media thickness and distensibility measured by MRI at 3 T versus high-resolution ultrasound. European radiology. 2009;19:1470-9. 41. Saam T, Hetterich H, Hoffmann V, Yuan C, Dichgans M, Poppert H, Koeppel T, Hoffmann U, Reiser MF and Bamberg F. Meta-analysis and systematic review of the predictive value of carotid plaque hemorrhage on cerebrovascular events by magnetic resonance imaging. J Am Coll Cardiol. 2013;62:1081-91. 42. de Lorgeril M, Renaud S, Mamelle N, Salen P, Martin JL, Monjaud I, Guidollet J, Touboul P and Delaye J. Mediterranean alpha-linolenic acid-rich diet in secondary prevention of coronary heart disease. Lancet. 1994;343:1454-9. 43. Estruch R, Ros E, Salas-Salvado J, Covas MI, Corella D, Aros F, Gomez-Gracia E, Ruiz-Gutierrez V, Fiol M, Lapetra J, Lamuela-Raventos RM, Serra-Majem L, Pinto X, Basora J, Munoz MA, Sorli JV, Martinez JA, Martinez-Gonzalez MA and Investigators PS. Primary prevention of cardiovascular disease with a Mediterranean diet. N Engl J Med. 2013;368:1279-90. 44. Food and Drug Administration. Guidance for Industry: Adaptive Design Clinical Trials for Drugs and Biologics. 2010. 45. Gottlieb K. The FDA adaptive trial design guidance in a nutshell - A review in Q&A format for decision makers. 2016. 46. International Diabetes Federation. International Diabetes Federation (IDF) Diabetes Atlas Sixth Edition. 2013. 47. American Diabetes Association. Diagnosis and classification of diabetes mellitus. Diabetes Care. 2010;33 Suppl 1:S62-9. 48. Canadian Diabetes Association Clinical Practice Guidelines Expert Committee, Ransom T, Goldenberg R, Mikalachki A, Prebtani AP and Punthakee Z. Reducing the risk of developing diabetes. Can J Diabetes. 2013;37 Suppl 1:S16-9. 49. Ohtsubo K, Chen MZ, Olefsky JM and Marth JD. Pathway to diabetes through attenuation of pancreatic beta cell glycosylation and glucose transport. Nature medicine. 2011;17:1067-75. 50. Sesti G. Pathophysiology of insulin resistance. Best practice & research Clinical endocrinology & metabolism. 2006;20:665-79. 51. Schinner S, Scherbaum WA, Bornstein SR and Barthel A. Molecular mechanisms of insulin resistance. Diabetic medicine : a journal of the British Diabetic Association. 2005;22:674-82. 52. Koyama K, Chen G, Lee Y and Unger RH. Tissue triglycerides, insulin resistance, and insulin production: implications for hyperinsulinemia of obesity. The American journal of physiology. 1997;273:E708-13. 53. Roden M, Price TB, Perseghin G, Petersen KF, Rothman DL, Cline GW and Shulman GI. Mechanism of free fatty acid-induced insulin resistance in humans. The Journal of clinical investigation. 1996;97:2859-65. 54. Solomon TP and Thyfault JP. Type 2 diabetes sits in a chair. Diabetes, obesity & metabolism. 2013;15:987-92. 55. Balkau B, Mhamdi L, Oppert JM, Nolan J, Golay A, Porcellati F, Laakso M, Ferrannini E and Group E-RS. Physical activity and insulin sensitivity: the RISC study. Diabetes. 2008;57:2613-8.
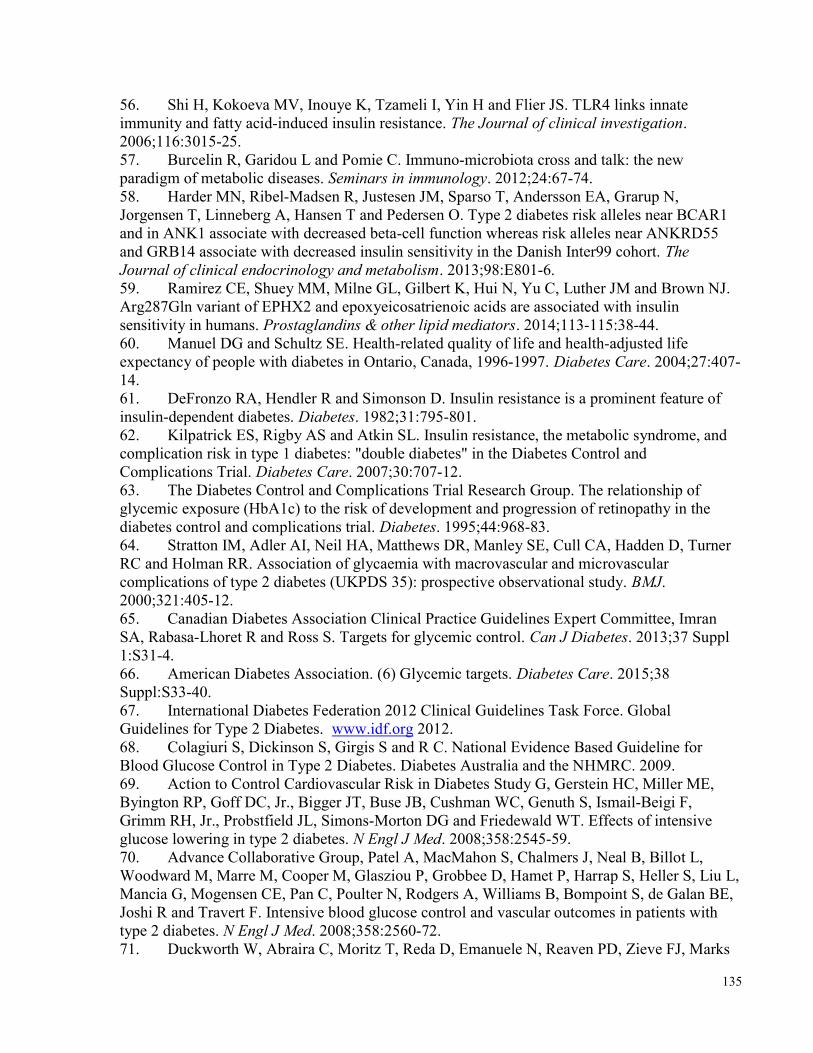
135
56. Shi H, Kokoeva MV, Inouye K, Tzameli I, Yin H and Flier JS. TLR4 links innate immunity and fatty acid-induced insulin resistance. The Journal of clinical investigation. 2006;116:3015-25. 57. Burcelin R, Garidou L and Pomie C. Immuno-microbiota cross and talk: the new paradigm of metabolic diseases. Seminars in immunology. 2012;24:67-74. 58. Harder MN, Ribel-Madsen R, Justesen JM, Sparso T, Andersson EA, Grarup N, Jorgensen T, Linneberg A, Hansen T and Pedersen O. Type 2 diabetes risk alleles near BCAR1 and in ANK1 associate with decreased beta-cell function whereas risk alleles near ANKRD55 and GRB14 associate with decreased insulin sensitivity in the Danish Inter99 cohort. The Journal of clinical endocrinology and metabolism. 2013;98:E801-6. 59. Ramirez CE, Shuey MM, Milne GL, Gilbert K, Hui N, Yu C, Luther JM and Brown NJ. Arg287Gln variant of EPHX2 and epoxyeicosatrienoic acids are associated with insulin sensitivity in humans. Prostaglandins & other lipid mediators. 2014;113-115:38-44. 60. Manuel DG and Schultz SE. Health-related quality of life and health-adjusted life expectancy of people with diabetes in Ontario, Canada, 1996-1997. Diabetes Care. 2004;27:407-14. 61. DeFronzo RA, Hendler R and Simonson D. Insulin resistance is a prominent feature of insulin-dependent diabetes. Diabetes. 1982;31:795-801. 62. Kilpatrick ES, Rigby AS and Atkin SL. Insulin resistance, the metabolic syndrome, and complication risk in type 1 diabetes: "double diabetes" in the Diabetes Control and Complications Trial. Diabetes Care. 2007;30:707-12. 63. The Diabetes Control and Complications Trial Research Group. The relationship of glycemic exposure (HbA1c) to the risk of development and progression of retinopathy in the diabetes control and complications trial. Diabetes. 1995;44:968-83. 64. Stratton IM, Adler AI, Neil HA, Matthews DR, Manley SE, Cull CA, Hadden D, Turner RC and Holman RR. Association of glycaemia with macrovascular and microvascular complications of type 2 diabetes (UKPDS 35): prospective observational study. BMJ. 2000;321:405-12. 65. Canadian Diabetes Association Clinical Practice Guidelines Expert Committee, Imran SA, Rabasa-Lhoret R and Ross S. Targets for glycemic control. Can J Diabetes. 2013;37 Suppl 1:S31-4. 66. American Diabetes Association. (6) Glycemic targets. Diabetes Care. 2015;38 Suppl:S33-40. 67. International Diabetes Federation 2012 Clinical Guidelines Task Force. Global Guidelines for Type 2 Diabetes. www.idf.org 2012. 68. Colagiuri S, Dickinson S, Girgis S and R C. National Evidence Based Guideline for Blood Glucose Control in Type 2 Diabetes. Diabetes Australia and the NHMRC. 2009. 69. Action to Control Cardiovascular Risk in Diabetes Study G, Gerstein HC, Miller ME, Byington RP, Goff DC, Jr., Bigger JT, Buse JB, Cushman WC, Genuth S, Ismail-Beigi F, Grimm RH, Jr., Probstfield JL, Simons-Morton DG and Friedewald WT. Effects of intensive glucose lowering in type 2 diabetes. N Engl J Med. 2008;358:2545-59. 70. Advance Collaborative Group, Patel A, MacMahon S, Chalmers J, Neal B, Billot L, Woodward M, Marre M, Cooper M, Glasziou P, Grobbee D, Hamet P, Harrap S, Heller S, Liu L, Mancia G, Mogensen CE, Pan C, Poulter N, Rodgers A, Williams B, Bompoint S, de Galan BE, Joshi R and Travert F. Intensive blood glucose control and vascular outcomes in patients with type 2 diabetes. N Engl J Med. 2008;358:2560-72. 71. Duckworth W, Abraira C, Moritz T, Reda D, Emanuele N, Reaven PD, Zieve FJ, Marks
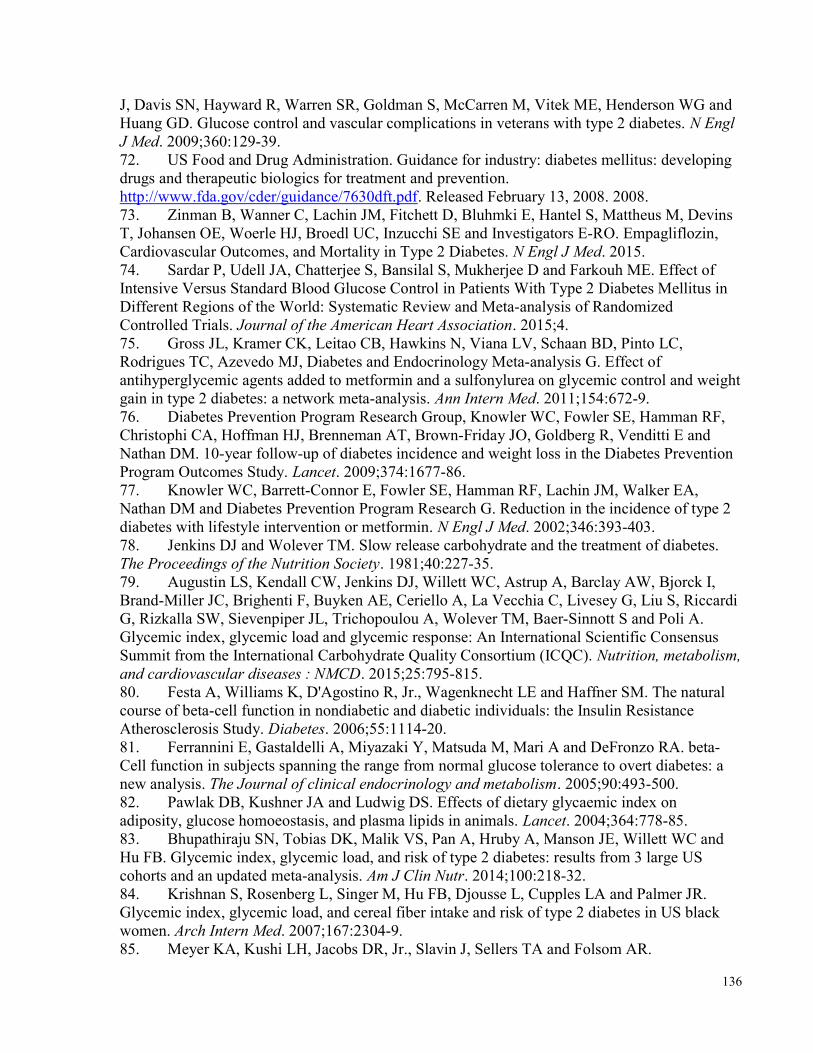
136
J, Davis SN, Hayward R, Warren SR, Goldman S, McCarren M, Vitek ME, Henderson WG and Huang GD. Glucose control and vascular complications in veterans with type 2 diabetes. N Engl J Med. 2009;360:129-39. 72. US Food and Drug Administration. Guidance for industry: diabetes mellitus: developing drugs and therapeutic biologics for treatment and prevention. http://www.fda.gov/cder/guidance/7630dft.pdf. Released February 13, 2008. 2008. 73. Zinman B, Wanner C, Lachin JM, Fitchett D, Bluhmki E, Hantel S, Mattheus M, Devins T, Johansen OE, Woerle HJ, Broedl UC, Inzucchi SE and Investigators E-RO. Empagliflozin, Cardiovascular Outcomes, and Mortality in Type 2 Diabetes. N Engl J Med. 2015. 74. Sardar P, Udell JA, Chatterjee S, Bansilal S, Mukherjee D and Farkouh ME. Effect of Intensive Versus Standard Blood Glucose Control in Patients With Type 2 Diabetes Mellitus in Different Regions of the World: Systematic Review and Meta-analysis of Randomized Controlled Trials. Journal of the American Heart Association. 2015;4. 75. Gross JL, Kramer CK, Leitao CB, Hawkins N, Viana LV, Schaan BD, Pinto LC, Rodrigues TC, Azevedo MJ, Diabetes and Endocrinology Meta-analysis G. Effect of antihyperglycemic agents added to metformin and a sulfonylurea on glycemic control and weight gain in type 2 diabetes: a network meta-analysis. Ann Intern Med. 2011;154:672-9. 76. Diabetes Prevention Program Research Group, Knowler WC, Fowler SE, Hamman RF, Christophi CA, Hoffman HJ, Brenneman AT, Brown-Friday JO, Goldberg R, Venditti E and Nathan DM. 10-year follow-up of diabetes incidence and weight loss in the Diabetes Prevention Program Outcomes Study. Lancet. 2009;374:1677-86. 77. Knowler WC, Barrett-Connor E, Fowler SE, Hamman RF, Lachin JM, Walker EA, Nathan DM and Diabetes Prevention Program Research G. Reduction in the incidence of type 2 diabetes with lifestyle intervention or metformin. N Engl J Med. 2002;346:393-403. 78. Jenkins DJ and Wolever TM. Slow release carbohydrate and the treatment of diabetes. The Proceedings of the Nutrition Society. 1981;40:227-35. 79. Augustin LS, Kendall CW, Jenkins DJ, Willett WC, Astrup A, Barclay AW, Bjorck I, Brand-Miller JC, Brighenti F, Buyken AE, Ceriello A, La Vecchia C, Livesey G, Liu S, Riccardi G, Rizkalla SW, Sievenpiper JL, Trichopoulou A, Wolever TM, Baer-Sinnott S and Poli A. Glycemic index, glycemic load and glycemic response: An International Scientific Consensus Summit from the International Carbohydrate Quality Consortium (ICQC). Nutrition, metabolism, and cardiovascular diseases : NMCD. 2015;25:795-815. 80. Festa A, Williams K, D'Agostino R, Jr., Wagenknecht LE and Haffner SM. The natural course of beta-cell function in nondiabetic and diabetic individuals: the Insulin Resistance Atherosclerosis Study. Diabetes. 2006;55:1114-20. 81. Ferrannini E, Gastaldelli A, Miyazaki Y, Matsuda M, Mari A and DeFronzo RA. beta-Cell function in subjects spanning the range from normal glucose tolerance to overt diabetes: a new analysis. The Journal of clinical endocrinology and metabolism. 2005;90:493-500. 82. Pawlak DB, Kushner JA and Ludwig DS. Effects of dietary glycaemic index on adiposity, glucose homoeostasis, and plasma lipids in animals. Lancet. 2004;364:778-85. 83. Bhupathiraju SN, Tobias DK, Malik VS, Pan A, Hruby A, Manson JE, Willett WC and Hu FB. Glycemic index, glycemic load, and risk of type 2 diabetes: results from 3 large US cohorts and an updated meta-analysis. Am J Clin Nutr. 2014;100:218-32. 84. Krishnan S, Rosenberg L, Singer M, Hu FB, Djousse L, Cupples LA and Palmer JR. Glycemic index, glycemic load, and cereal fiber intake and risk of type 2 diabetes in US black women. Arch Intern Med. 2007;167:2304-9. 85. Meyer KA, Kushi LH, Jacobs DR, Jr., Slavin J, Sellers TA and Folsom AR.
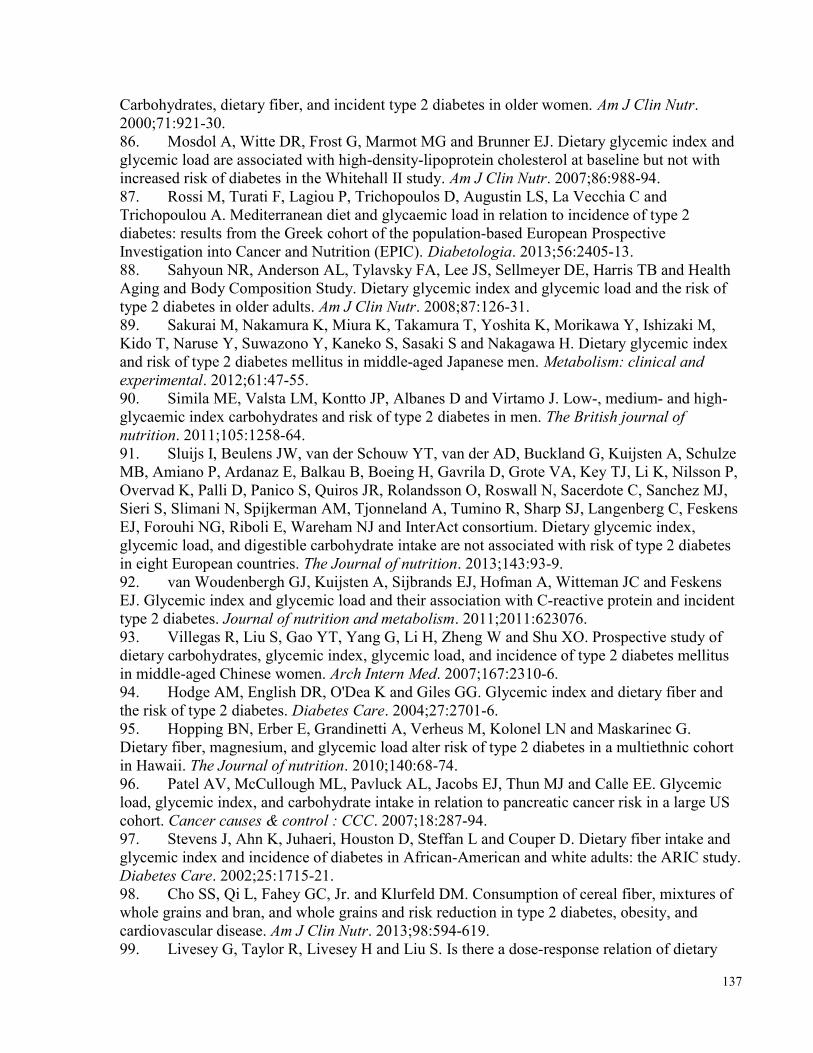
137
Carbohydrates, dietary fiber, and incident type 2 diabetes in older women. Am J Clin Nutr. 2000;71:921-30. 86. Mosdol A, Witte DR, Frost G, Marmot MG and Brunner EJ. Dietary glycemic index and glycemic load are associated with high-density-lipoprotein cholesterol at baseline but not with increased risk of diabetes in the Whitehall II study. Am J Clin Nutr. 2007;86:988-94. 87. Rossi M, Turati F, Lagiou P, Trichopoulos D, Augustin LS, La Vecchia C and Trichopoulou A. Mediterranean diet and glycaemic load in relation to incidence of type 2 diabetes: results from the Greek cohort of the population-based European Prospective Investigation into Cancer and Nutrition (EPIC). Diabetologia. 2013;56:2405-13. 88. Sahyoun NR, Anderson AL, Tylavsky FA, Lee JS, Sellmeyer DE, Harris TB and Health Aging and Body Composition Study. Dietary glycemic index and glycemic load and the risk of type 2 diabetes in older adults. Am J Clin Nutr. 2008;87:126-31. 89. Sakurai M, Nakamura K, Miura K, Takamura T, Yoshita K, Morikawa Y, Ishizaki M, Kido T, Naruse Y, Suwazono Y, Kaneko S, Sasaki S and Nakagawa H. Dietary glycemic index and risk of type 2 diabetes mellitus in middle-aged Japanese men. Metabolism: clinical and experimental. 2012;61:47-55. 90. Simila ME, Valsta LM, Kontto JP, Albanes D and Virtamo J. Low-, medium- and high-glycaemic index carbohydrates and risk of type 2 diabetes in men. The British journal of nutrition. 2011;105:1258-64. 91. Sluijs I, Beulens JW, van der Schouw YT, van der AD, Buckland G, Kuijsten A, Schulze MB, Amiano P, Ardanaz E, Balkau B, Boeing H, Gavrila D, Grote VA, Key TJ, Li K, Nilsson P, Overvad K, Palli D, Panico S, Quiros JR, Rolandsson O, Roswall N, Sacerdote C, Sanchez MJ, Sieri S, Slimani N, Spijkerman AM, Tjonneland A, Tumino R, Sharp SJ, Langenberg C, Feskens EJ, Forouhi NG, Riboli E, Wareham NJ and InterAct consortium. Dietary glycemic index, glycemic load, and digestible carbohydrate intake are not associated with risk of type 2 diabetes in eight European countries. The Journal of nutrition. 2013;143:93-9. 92. van Woudenbergh GJ, Kuijsten A, Sijbrands EJ, Hofman A, Witteman JC and Feskens EJ. Glycemic index and glycemic load and their association with C-reactive protein and incident type 2 diabetes. Journal of nutrition and metabolism. 2011;2011:623076. 93. Villegas R, Liu S, Gao YT, Yang G, Li H, Zheng W and Shu XO. Prospective study of dietary carbohydrates, glycemic index, glycemic load, and incidence of type 2 diabetes mellitus in middle-aged Chinese women. Arch Intern Med. 2007;167:2310-6. 94. Hodge AM, English DR, O'Dea K and Giles GG. Glycemic index and dietary fiber and the risk of type 2 diabetes. Diabetes Care. 2004;27:2701-6. 95. Hopping BN, Erber E, Grandinetti A, Verheus M, Kolonel LN and Maskarinec G. Dietary fiber, magnesium, and glycemic load alter risk of type 2 diabetes in a multiethnic cohort in Hawaii. The Journal of nutrition. 2010;140:68-74. 96. Patel AV, McCullough ML, Pavluck AL, Jacobs EJ, Thun MJ and Calle EE. Glycemic load, glycemic index, and carbohydrate intake in relation to pancreatic cancer risk in a large US cohort. Cancer causes & control : CCC. 2007;18:287-94. 97. Stevens J, Ahn K, Juhaeri, Houston D, Steffan L and Couper D. Dietary fiber intake and glycemic index and incidence of diabetes in African-American and white adults: the ARIC study. Diabetes Care. 2002;25:1715-21. 98. Cho SS, Qi L, Fahey GC, Jr. and Klurfeld DM. Consumption of cereal fiber, mixtures of whole grains and bran, and whole grains and risk reduction in type 2 diabetes, obesity, and cardiovascular disease. Am J Clin Nutr. 2013;98:594-619. 99. Livesey G, Taylor R, Livesey H and Liu S. Is there a dose-response relation of dietary
138
glycemic load to risk of type 2 diabetes? Meta-analysis of prospective cohort studies. Am J Clin Nutr. 2013;97:584-96. 100. Barclay AW, Petocz P, McMillan-Price J, Flood VM, Prvan T, Mitchell P and Brand-Miller JC. Glycemic index, glycemic load, and chronic disease risk--a meta-analysis of observational studies. Am J Clin Nutr. 2008;87:627-37. 101. Dong JY, Zhang L, Zhang YH and Qin LQ. Dietary glycaemic index and glycaemic load in relation to the risk of type 2 diabetes: a meta-analysis of prospective cohort studies. The British journal of nutrition. 2011;106:1649-54. 102. Chiasson JL, Josse RG, Gomis R, Hanefeld M, Karasik A, Laakso M and Group S-NTR. Acarbose for prevention of type 2 diabetes mellitus: the STOP-NIDDM randomised trial. Lancet. 2002;359:2072-7. 103. Grundy SM, Brewer HB, Jr., Cleeman JI, Smith SC, Jr., Lenfant C, American Heart A, National Heart L and Blood I. Definition of metabolic syndrome: Report of the National Heart, Lung, and Blood Institute/American Heart Association conference on scientific issues related to definition. Circulation. 2004;109:433-8. 104. Hanefeld M, Karasik A, Koehler C, Westermeier T and Chiasson JL. Metabolic syndrome and its single traits as risk factors for diabetes in people with impaired glucose tolerance: the STOP-NIDDM trial. Diabetes & vascular disease research. 2009;6:32-7. 105. Bouche C, Rizkalla SW, Luo J, Vidal H, Veronese A, Pacher N, Fouquet C, Lang V and Slama G. Five-week, low-glycemic index diet decreases total fat mass and improves plasma lipid profile in moderately overweight nondiabetic men. Diabetes Care. 2002;25:822-8. 106. Brand JC, Colagiuri S, Crossman S, Allen A, Roberts DC and Truswell AS. Low-glycemic index foods improve long-term glycemic control in NIDDM. Diabetes Care. 1991;14:95-101. 107. de Rougemont A, Normand S, Nazare JA, Skilton MR, Sothier M, Vinoy S and Laville M. Beneficial effects of a 5-week low-glycaemic index regimen on weight control and cardiovascular risk factors in overweight non-diabetic subjects. The British journal of nutrition. 2007;98:1288-98. 108. Frost G, Keogh B, Smith D, Akinsanya K and Leeds A. The effect of low-glycemic carbohydrate on insulin and glucose response in vivo and in vitro in patients with coronary heart disease. Metabolism: clinical and experimental. 1996;45:669-72. 109. Frost G, Wilding J and Beecham J. Dietary advice based on the glycaemic index improves dietary profile and metabolic control in type 2 diabetic patients. Diabetic medicine : a journal of the British Diabetic Association. 1994;11:397-401. 110. Frost GS, Brynes AE, Bovill-Taylor C and Dornhorst A. A prospective randomised trial to determine the efficacy of a low glycaemic index diet given in addition to healthy eating and weight loss advice in patients with coronary heart disease. European journal of clinical nutrition. 2004;58:121-7. 111. Heilbronn LK, Noakes M and Clifton PM. The effect of high- and low-glycemic index energy restricted diets on plasma lipid and glucose profiles in type 2 diabetic subjects with varying glycemic control. Journal of the American College of Nutrition. 2002;21:120-7. 112. Jenkins DJ, Kendall CW, McKeown-Eyssen G, Josse RG, Silverberg J, Booth GL, Vidgen E, Josse AR, Nguyen TH, Corrigan S, Banach MS, Ares S, Mitchell S, Emam A, Augustin LS, Parker TL and Leiter LA. Effect of a low-glycemic index or a high-cereal fiber diet on type 2 diabetes: a randomized trial. JAMA. 2008;300:2742-53. 113. Jimenez-Cruz A, Bacardi-Gascon M, Turnbull WH, Rosales-Garay P and Severino-Lugo I. A flexible, low-glycemic index mexican-style diet in overweight and obese subjects with type
139
2 diabetes improves metabolic parameters during a 6-week treatment period. Diabetes Care. 2003;26:1967-70. 114. Marsh KA, Steinbeck KS, Atkinson FS, Petocz P and Brand-Miller JC. Effect of a low glycemic index compared with a conventional healthy diet on polycystic ovary syndrome. Am J Clin Nutr. 2010;92:83-92. 115. Philippou E, Bovill-Taylor C, Rajkumar C, Vampa ML, Ntatsaki E, Brynes AE, Hickson M and Frost GS. Preliminary report: the effect of a 6-month dietary glycemic index manipulation in addition to healthy eating advice and weight loss on arterial compliance and 24-hour ambulatory blood pressure in men: a pilot study. Metabolism: clinical and experimental. 2009;58:1703-8. 116. Philippou E, McGowan BM, Brynes AE, Dornhorst A, Leeds AR and Frost GS. The effect of a 12-week low glycaemic index diet on heart disease risk factors and 24 h glycaemic response in healthy middle-aged volunteers at risk of heart disease: a pilot study. European journal of clinical nutrition. 2008;62:145-9. 117. Rizkalla SW, Taghrid L, Laromiguiere M, Huet D, Boillot J, Rigoir A, Elgrably F and Slama G. Improved plasma glucose control, whole-body glucose utilization, and lipid profile on a low-glycemic index diet in type 2 diabetic men: a randomized controlled trial. Diabetes Care. 2004;27:1866-72. 118. Shikany JM, Phadke RP, Redden DT and Gower BA. Effects of low- and high-glycemic index/glycemic load diets on coronary heart disease risk factors in overweight/obese men. Metabolism: clinical and experimental. 2009;58:1793-801. 119. Sichieri R, Moura AS, Genelhu V, Hu F and Willett WC. An 18-mo randomized trial of a low-glycemic-index diet and weight change in Brazilian women. Am J Clin Nutr. 2007;86:707-13. 120. Sloth B, Krog-Mikkelsen I, Flint A, Tetens I, Bjorck I, Vinoy S, Elmstahl H, Astrup A, Lang V and Raben A. No difference in body weight decrease between a low-glycemic-index and a high-glycemic-index diet but reduced LDL cholesterol after 10-wk ad libitum intake of the low-glycemic-index diet. Am J Clin Nutr. 2004;80:337-47. 121. Tsihlias EB, Gibbs AL, McBurney MI and Wolever TM. Comparison of high- and low-glycemic-index breakfast cereals with monounsaturated fat in the long-term dietary management of type 2 diabetes. Am J Clin Nutr. 2000;72:439-49. 122. Venn BJ, Perry T, Green TJ, Skeaff CM, Aitken W, Moore NJ, Mann JI, Wallace AJ, Monro J, Bradshaw A, Brown RC, Skidmore PM, Doel K, O'Brien K, Frampton C and Williams S. The effect of increasing consumption of pulses and wholegrains in obese people: a randomized controlled trial. Journal of the American College of Nutrition. 2010;29:365-72. 123. Wolever TM and Mehling C. Long-term effect of varying the source or amount of dietary carbohydrate on postprandial plasma glucose, insulin, triacylglycerol, and free fatty acid concentrations in subjects with impaired glucose tolerance. Am J Clin Nutr. 2003;77:612-21. 124. Wolever TM, Jenkins DJ, Vuksan V, Jenkins AL, Wong GS and Josse RG. Beneficial effect of low-glycemic index diet in overweight NIDDM subjects. Diabetes Care. 1992b;15:562-4. 125. Wolever TM, Gibbs AL, Mehling C, Chiasson JL, Connelly PW, Josse RG, Leiter LA, Maheux P, Rabasa-Lhoret R, Rodger NW and Ryan EA. The Canadian Trial of Carbohydrates in Diabetes (CCD), a 1-y controlled trial of low-glycemic-index dietary carbohydrate in type 2 diabetes: no effect on glycated hemoglobin but reduction in C-reactive protein. Am J Clin Nutr. 2008;87:114-25. 126. Yusof BN, Talib RA, Kamaruddin NA, Karim NA, Chinna K and Gilbertson H. A low-
140
GI diet is associated with a short-term improvement of glycaemic control in Asian patients with type 2 diabetes. Diabetes, obesity & metabolism. 2009;11:387-96. 127. Zhang Z, Lanza E, Kris-Etherton PM, Colburn NH, Bagshaw D, Rovine MJ, Ulbrecht JS, Bobe G, Chapkin RS and Hartman TJ. A high legume low glycemic index diet improves serum lipid profiles in men. Lipids. 2010;45:765-75. 128. Dattilo AM and Kris-Etherton PM. Effects of weight reduction on blood lipids and lipoproteins: a meta-analysis. Am J Clin Nutr. 1992;56:320-8. 129. Higgins JP. Cochrane Handbook for Systematic Reviews of Interventions Version 5.1.0. The Cochrane Collaboration; 2011. In: The Cochrane Collaboration 2011. 130. Wolever TM, Tosh SM, Gibbs AL, Brand-Miller J, Duncan AM, Hart V, Lamarche B, Thomson BA, Duss R and Wood PJ. Physicochemical properties of oat beta-glucan influence its ability to reduce serum LDL cholesterol in humans: a randomized clinical trial. Am J Clin Nutr. 2010;92:723-32. 131. Jenkins DJ, Wolever TM, Rao AV, Hegele RA, Mitchell SJ, Ransom TP, Boctor DL, Spadafora PJ, Jenkins AL, Mehling C and et al. Effect on blood lipids of very high intakes of fiber in diets low in saturated fat and cholesterol. N Engl J Med. 1993;329:21-6. 132. Administration UFaD. Food Labeling: Health Claims; Soluble Fiber from Certain Foods and Coronary Heart Disease. Rockville, MD. Docket No. 96P-0338. 1998. 133. Goldbourt U, Yaari S and Medalie JH. Isolated low HDL cholesterol as a risk factor for coronary heart disease mortality. A 21-year follow-up of 8000 men. Arteriosclerosis, thrombosis, and vascular biology. 1997;17:107-13. 134. Niskanen L, Turpeinen A, Penttila I and Uusitupa MI. Hyperglycemia and compositional lipoprotein abnormalities as predictors of cardiovascular mortality in type 2 diabetes: a 15-year follow-up from the time of diagnosis. Diabetes Care. 1998;21:1861-9. 135. Turner RC, Millns H, Neil HA, Stratton IM, Manley SE, Matthews DR and Holman RR. Risk factors for coronary artery disease in non-insulin dependent diabetes mellitus: United Kingdom Prospective Diabetes Study (UKPDS: 23). BMJ. 1998;316:823-8. 136. Drexel H, Aczel S, Marte T, Benzer W, Langer P, Moll W and Saely CH. Is atherosclerosis in diabetes and impaired fasting glucose driven by elevated LDL cholesterol or by decreased HDL cholesterol? Diabetes Care. 2005;28:101-7. 137. Boden WE. High-density lipoprotein cholesterol as an independent risk factor in cardiovascular disease: assessing the data from Framingham to the Veterans Affairs High--Density Lipoprotein Intervention Trial. Am J Cardiol. 2000;86:19L-22L. 138. Gordon DJ, Probstfield JL, Garrison RJ, Neaton JD, Castelli WP, Knoke JD, Jacobs DR, Jr., Bangdiwala S and Tyroler HA. High-density lipoprotein cholesterol and cardiovascular disease. Four prospective American studies. Circulation. 1989;79:8-15. 139. Gotto AM, Jr. High-density lipoprotein cholesterol and triglycerides as therapeutic targets for preventing and treating coronary artery disease. American heart journal. 2002;144:S33-42. 140. Tenenbaum A, Fisman EZ, Motro M and Adler Y. Atherogenic dyslipidemia in metabolic syndrome and type 2 diabetes: therapeutic options beyond statins. Cardiovascular diabetology. 2006;5:20. 141. Oyama T, Saiki A, Endoh K, Ban N, Nagayama D, Ohhira M, Koide N, Miyashita Y and Shirai K. Effect of acarbose, an alpha-glucosidase inhibitor, on serum lipoprotein lipase mass levels and common carotid artery intima-media thickness in type 2 diabetes mellitus treated by sulfonylurea. J Atheroscler Thromb. 2008;15:154-9. 142. Mokdad AH, Ford ES, Bowman BA, Dietz WH, Vinicor F, Bales VS and Marks JS. Prevalence of obesity, diabetes, and obesity-related health risk factors, 2001. JAMA.

141
2003;289:76-9. 143. Canadian Diabetes Association Clinical Practice Guidelines Expert Committee, Wharton S, Sharma AM and Lau DC. Weight management in diabetes. Can J Diabetes. 2013;37 Suppl 1:S82-6. 144. Thomas DE, Elliott EJ and Baur L. Low glycaemic index or low glycaemic load diets for overweight and obesity. The Cochrane database of systematic reviews. 2007:CD005105. 145. Schwingshackl L and Hoffmann G. Long-term effects of low glycemic index/load vs. high glycemic index/load diets on parameters of obesity and obesity-associated risks: a systematic review and meta-analysis. Nutrition, metabolism, and cardiovascular diseases : NMCD. 2013;23:699-706. 146. Turner-McGrievy GM, Jenkins DJ, Barnard ND, Cohen J, Gloede L and Green AA. Decreases in dietary glycemic index are related to weight loss among individuals following therapeutic diets for type 2 diabetes. The Journal of nutrition. 2011;141:1469-74. 147. Smith JD, Hou T, Ludwig DS, Rimm EB, Willett W, Hu FB and Mozaffarian D. Changes in intake of protein foods, carbohydrate amount and quality, and long-term weight change: results from 3 prospective cohorts. Am J Clin Nutr. 2015;101:1216-24. 148. Greenway FL. Physiological adaptations to weight loss and factors favouring weight regain. International journal of obesity. 2015;39:1188-96. 149. Pereira MA, Swain J, Goldfine AB, Rifai N and Ludwig DS. Effects of a low-glycemic load diet on resting energy expenditure and heart disease risk factors during weight loss. JAMA. 2004;292:2482-90. 150. Larsen TM, Dalskov SM, van Baak M, Jebb SA, Papadaki A, Pfeiffer AF, Martinez JA, Handjieva-Darlenska T, Kunesova M, Pihlsgard M, Stender S, Holst C, Saris WH, Astrup A, Diet O and Genes P. Diets with high or low protein content and glycemic index for weight-loss maintenance. N Engl J Med. 2010;363:2102-13. 151. Aller EE, Larsen TM, Claus H, Lindroos AK, Kafatos A, Pfeiffer A, Martinez JA, Handjieva-Darlenska T, Kunesova M, Stender S, Saris WH, Astrup A and van Baak MA. Weight loss maintenance in overweight subjects on ad libitum diets with high or low protein content and glycemic index: the DIOGENES trial 12-month results. International journal of obesity. 2014;38:1511-7. 152. Dansinger ML, Tatsioni A, Wong JB, Chung M and Balk EM. Meta-analysis: the effect of dietary counseling for weight loss. Ann Intern Med. 2007;147:41-50. 153. Montani JP, Viecelli AK, Prevot A and Dulloo AG. Weight cycling during growth and beyond as a risk factor for later cardiovascular diseases: the 'repeated overshoot' theory. International journal of obesity. 2006;30 Suppl 4:S58-66. 154. Delahanty LM, Pan Q, Jablonski KA, Aroda VR, Watson KE, Bray GA, Kahn SE, Florez JC, Perreault L, Franks PW and Diabetes Prevention Program Research G. Effects of weight loss, weight cycling, and weight loss maintenance on diabetes incidence and change in cardiometabolic traits in the Diabetes Prevention Program. Diabetes Care. 2014;37:2738-45. 155. Barbarroja N, Lopez-Pedrera C, Garrido-Sanchez L, Mayas MD, Oliva-Olivera W, Bernal-Lopez MR, El Bekay R and Tinahones FJ. Progression from high insulin resistance to type 2 diabetes does not entail additional visceral adipose tissue inflammation. PloS one. 2012;7:e48155. 156. Haffner S, Temprosa M, Crandall J, Fowler S, Goldberg R, Horton E, Marcovina S, Mather K, Orchard T, Ratner R, Barrett-Connor E and Diabetes Prevention Program Research G. Intensive lifestyle intervention or metformin on inflammation and coagulation in participants with impaired glucose tolerance. Diabetes. 2005;54:1566-72.
142
157. Devaraj S, Singh U and Jialal I. Human C-reactive protein and the metabolic syndrome. Current opinion in lipidology. 2009;20:182-9. 158. Ridker PM and Morrow DA. C-reactive protein, inflammation, and coronary risk. Cardiology clinics. 2003;21:315-25. 159. Buyken AE, Goletzke J, Joslowski G, Felbick A, Cheng G, Herder C and Brand-Miller JC. Association between carbohydrate quality and inflammatory markers: systematic review of observational and interventional studies. Am J Clin Nutr. 2014;99:813-33. 160. Ridker PM, Cannon CP, Morrow D, Rifai N, Rose LM, McCabe CH, Pfeffer MA, Braunwald E and Pravastatin or Atorvastatin Evaluation and Infection Therapy-Thrombolysis in Myocardial Infarction 22 (PROVE IT-TIMI 22) Investigators. C-reactive protein levels and outcomes after statin therapy. N Engl J Med. 2005;352:20-8. 161. Sommeijer DW, MacGillavry MR, Meijers JC, Van Zanten AP, Reitsma PH and Ten Cate H. Anti-inflammatory and anticoagulant effects of pravastatin in patients with type 2 diabetes. Diabetes Care. 2004;27:468-73. 162. Yamada S, Yanagawa T, Sasamoto K, Araki A, Miyao M and Yamanouchi T. Atorvastatin lowers plasma low-density lipoprotein cholesterol and C-reactive protein in Japanese type 2 diabetic patients. Metabolism: clinical and experimental. 2006;55:67-71. 163. Qi L, van Dam RM, Liu S, Franz M, Mantzoros C and Hu FB. Whole-grain, bran, and cereal fiber intakes and markers of systemic inflammation in diabetic women. Diabetes Care. 2006;29:207-11. 164. Qi L, Rimm E, Liu S, Rifai N and Hu FB. Dietary glycemic index, glycemic load, cereal fiber, and plasma adiponectin concentration in diabetic men. Diabetes Care. 2005;28:1022-8. 165. Berg AH and Scherer PE. Adipose tissue, inflammation, and cardiovascular disease. Circulation research. 2005;96:939-49. 166. Mantzoros CS, Li T, Manson JE, Meigs JB and Hu FB. Circulating adiponectin levels are associated with better glycemic control, more favorable lipid profile, and reduced inflammation in women with type 2 diabetes. The Journal of clinical endocrinology and metabolism. 2005;90:4542-8. 167. Griffith JA, Ma Y, Chasan-Taber L, Olendzki BC, Chiriboga DE, Stanek EJ, 3rd, Merriam PA and Ockene IS. Association between dietary glycemic index, glycemic load, and high-sensitivity C-reactive protein. Nutrition. 2008;24:401-6. 168. Vrolix R and Mensink RP. Effects of glycemic load on metabolic risk markers in subjects at increased risk of developing metabolic syndrome. Am J Clin Nutr. 2010;92:366-74. 169. Du H, van der AD, van Bakel MM, van der Kallen CJ, Blaak EE, van Greevenbroek MM, Jansen EH, Nijpels G, Stehouwer CD, Dekker JM and Feskens EJ. Glycemic index and glycemic load in relation to food and nutrient intake and metabolic risk factors in a Dutch population. Am J Clin Nutr. 2008;87:655-61. 170. Levitan EB, Cook NR, Stampfer MJ, Ridker PM, Rexrode KM, Buring JE, Manson JE and Liu S. Dietary glycemic index, dietary glycemic load, blood lipids, and C-reactive protein. Metabolism: clinical and experimental. 2008;57:437-43. 171. Esteve E, Ricart W and Fernandez-Real JM. Adipocytokines and insulin resistance: the possible role of lipocalin-2, retinol binding protein-4, and adiponectin. Diabetes Care. 2009;32 Suppl 2:S362-7. 172. Ouchi N, Kihara S, Arita Y, Nishida M, Matsuyama A, Okamoto Y, Ishigami M, Kuriyama H, Kishida K, Nishizawa H, Hotta K, Muraguchi M, Ohmoto Y, Yamashita S, Funahashi T and Matsuzawa Y. Adipocyte-derived plasma protein, adiponectin, suppresses lipid accumulation and class A scavenger receptor expression in human monocyte-derived
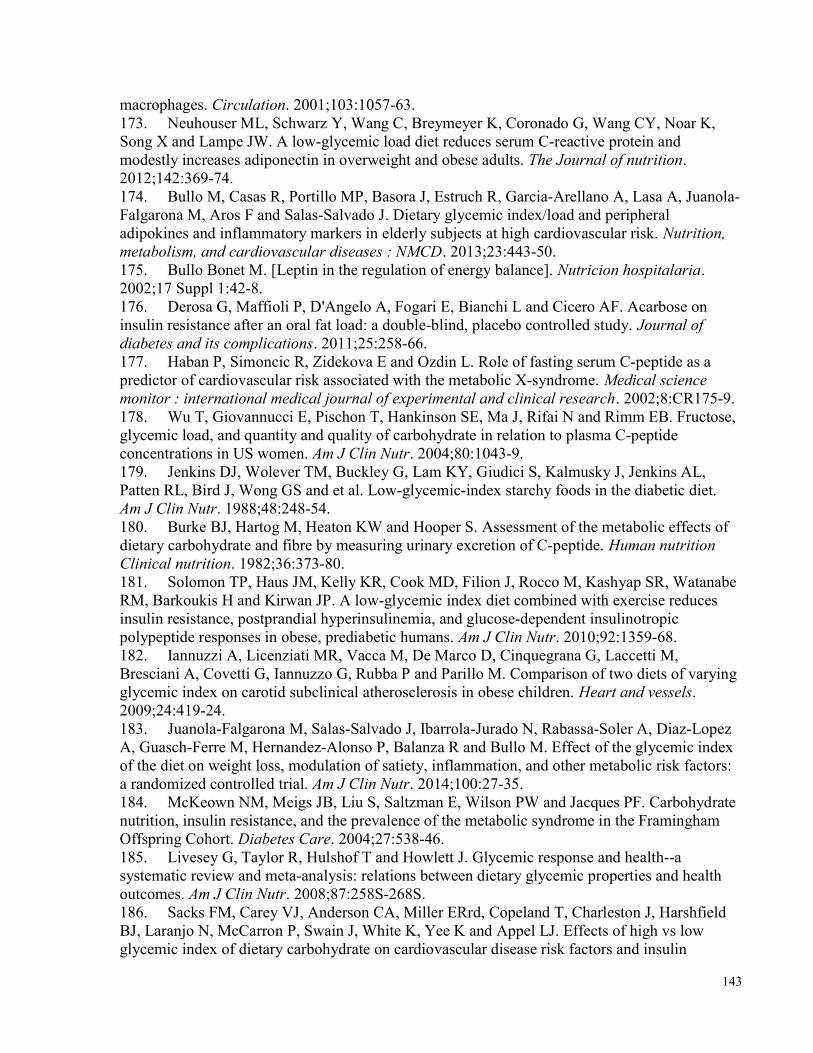
143
macrophages. Circulation. 2001;103:1057-63. 173. Neuhouser ML, Schwarz Y, Wang C, Breymeyer K, Coronado G, Wang CY, Noar K, Song X and Lampe JW. A low-glycemic load diet reduces serum C-reactive protein and modestly increases adiponectin in overweight and obese adults. The Journal of nutrition. 2012;142:369-74. 174. Bullo M, Casas R, Portillo MP, Basora J, Estruch R, Garcia-Arellano A, Lasa A, Juanola-Falgarona M, Aros F and Salas-Salvado J. Dietary glycemic index/load and peripheral adipokines and inflammatory markers in elderly subjects at high cardiovascular risk. Nutrition, metabolism, and cardiovascular diseases : NMCD. 2013;23:443-50. 175. Bullo Bonet M. [Leptin in the regulation of energy balance]. Nutricion hospitalaria. 2002;17 Suppl 1:42-8. 176. Derosa G, Maffioli P, D'Angelo A, Fogari E, Bianchi L and Cicero AF. Acarbose on insulin resistance after an oral fat load: a double-blind, placebo controlled study. Journal of diabetes and its complications. 2011;25:258-66. 177. Haban P, Simoncic R, Zidekova E and Ozdin L. Role of fasting serum C-peptide as a predictor of cardiovascular risk associated with the metabolic X-syndrome. Medical science monitor : international medical journal of experimental and clinical research. 2002;8:CR175-9. 178. Wu T, Giovannucci E, Pischon T, Hankinson SE, Ma J, Rifai N and Rimm EB. Fructose, glycemic load, and quantity and quality of carbohydrate in relation to plasma C-peptide concentrations in US women. Am J Clin Nutr. 2004;80:1043-9. 179. Jenkins DJ, Wolever TM, Buckley G, Lam KY, Giudici S, Kalmusky J, Jenkins AL, Patten RL, Bird J, Wong GS and et al. Low-glycemic-index starchy foods in the diabetic diet. Am J Clin Nutr. 1988;48:248-54. 180. Burke BJ, Hartog M, Heaton KW and Hooper S. Assessment of the metabolic effects of dietary carbohydrate and fibre by measuring urinary excretion of C-peptide. Human nutrition Clinical nutrition. 1982;36:373-80. 181. Solomon TP, Haus JM, Kelly KR, Cook MD, Filion J, Rocco M, Kashyap SR, Watanabe RM, Barkoukis H and Kirwan JP. A low-glycemic index diet combined with exercise reduces insulin resistance, postprandial hyperinsulinemia, and glucose-dependent insulinotropic polypeptide responses in obese, prediabetic humans. Am J Clin Nutr. 2010;92:1359-68. 182. Iannuzzi A, Licenziati MR, Vacca M, De Marco D, Cinquegrana G, Laccetti M, Bresciani A, Covetti G, Iannuzzo G, Rubba P and Parillo M. Comparison of two diets of varying glycemic index on carotid subclinical atherosclerosis in obese children. Heart and vessels. 2009;24:419-24. 183. Juanola-Falgarona M, Salas-Salvado J, Ibarrola-Jurado N, Rabassa-Soler A, Diaz-Lopez A, Guasch-Ferre M, Hernandez-Alonso P, Balanza R and Bullo M. Effect of the glycemic index of the diet on weight loss, modulation of satiety, inflammation, and other metabolic risk factors: a randomized controlled trial. Am J Clin Nutr. 2014;100:27-35. 184. McKeown NM, Meigs JB, Liu S, Saltzman E, Wilson PW and Jacques PF. Carbohydrate nutrition, insulin resistance, and the prevalence of the metabolic syndrome in the Framingham Offspring Cohort. Diabetes Care. 2004;27:538-46. 185. Livesey G, Taylor R, Hulshof T and Howlett J. Glycemic response and health--a systematic review and meta-analysis: relations between dietary glycemic properties and health outcomes. Am J Clin Nutr. 2008;87:258S-268S. 186. Sacks FM, Carey VJ, Anderson CA, Miller ERrd, Copeland T, Charleston J, Harshfield BJ, Laranjo N, McCarron P, Swain J, White K, Yee K and Appel LJ. Effects of high vs low glycemic index of dietary carbohydrate on cardiovascular disease risk factors and insulin
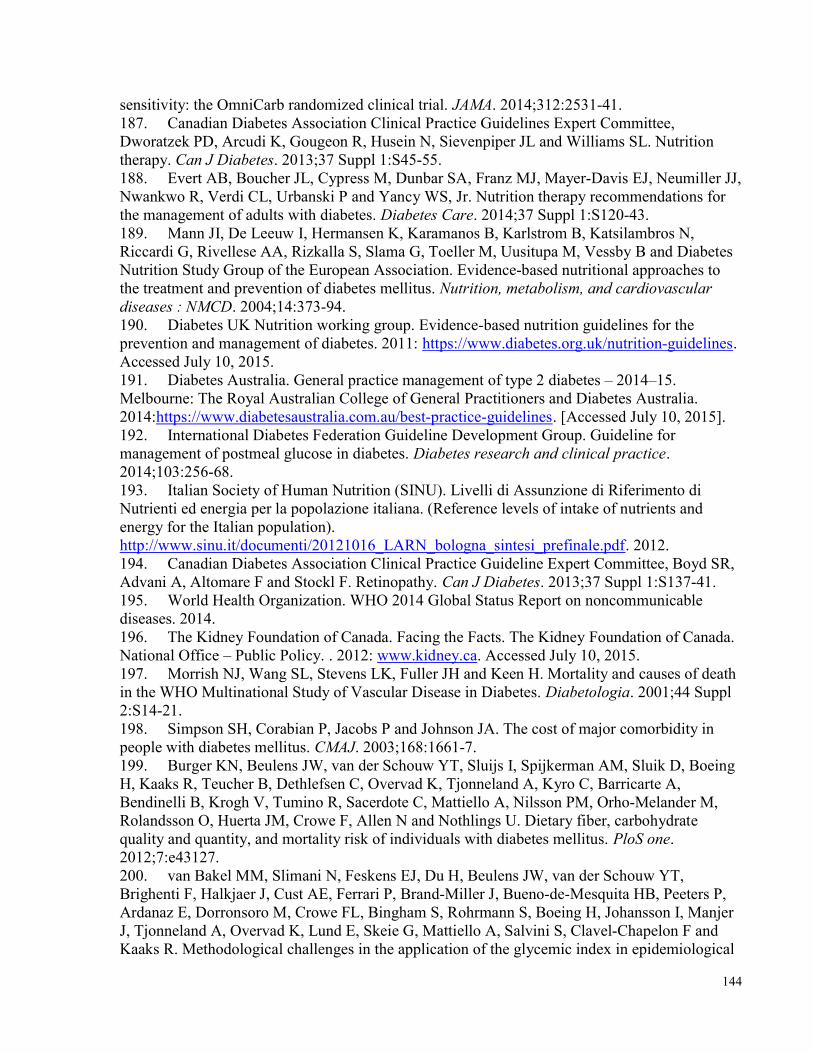
144
sensitivity: the OmniCarb randomized clinical trial. JAMA. 2014;312:2531-41. 187. Canadian Diabetes Association Clinical Practice Guidelines Expert Committee, Dworatzek PD, Arcudi K, Gougeon R, Husein N, Sievenpiper JL and Williams SL. Nutrition therapy. Can J Diabetes. 2013;37 Suppl 1:S45-55. 188. Evert AB, Boucher JL, Cypress M, Dunbar SA, Franz MJ, Mayer-Davis EJ, Neumiller JJ, Nwankwo R, Verdi CL, Urbanski P and Yancy WS, Jr. Nutrition therapy recommendations for the management of adults with diabetes. Diabetes Care. 2014;37 Suppl 1:S120-43. 189. Mann JI, De Leeuw I, Hermansen K, Karamanos B, Karlstrom B, Katsilambros N, Riccardi G, Rivellese AA, Rizkalla S, Slama G, Toeller M, Uusitupa M, Vessby B and Diabetes Nutrition Study Group of the European Association. Evidence-based nutritional approaches to the treatment and prevention of diabetes mellitus. Nutrition, metabolism, and cardiovascular diseases : NMCD. 2004;14:373-94. 190. Diabetes UK Nutrition working group. Evidence-based nutrition guidelines for the prevention and management of diabetes. 2011: https://www.diabetes.org.uk/nutrition-guidelines. Accessed July 10, 2015. 191. Diabetes Australia. General practice management of type 2 diabetes – 2014–15. Melbourne: The Royal Australian College of General Practitioners and Diabetes Australia. 2014:https://www.diabetesaustralia.com.au/best-practice-guidelines. [Accessed July 10, 2015]. 192. International Diabetes Federation Guideline Development Group. Guideline for management of postmeal glucose in diabetes. Diabetes research and clinical practice. 2014;103:256-68. 193. Italian Society of Human Nutrition (SINU). Livelli di Assunzione di Riferimento di Nutrienti ed energia per la popolazione italiana. (Reference levels of intake of nutrients and energy for the Italian population). http://www.sinu.it/documenti/20121016_LARN_bologna_sintesi_prefinale.pdf. 2012. 194. Canadian Diabetes Association Clinical Practice Guideline Expert Committee, Boyd SR, Advani A, Altomare F and Stockl F. Retinopathy. Can J Diabetes. 2013;37 Suppl 1:S137-41. 195. World Health Organization. WHO 2014 Global Status Report on noncommunicable diseases. 2014. 196. The Kidney Foundation of Canada. Facing the Facts. The Kidney Foundation of Canada. National Office – Public Policy. . 2012: www.kidney.ca. Accessed July 10, 2015. 197. Morrish NJ, Wang SL, Stevens LK, Fuller JH and Keen H. Mortality and causes of death in the WHO Multinational Study of Vascular Disease in Diabetes. Diabetologia. 2001;44 Suppl 2:S14-21. 198. Simpson SH, Corabian P, Jacobs P and Johnson JA. The cost of major comorbidity in people with diabetes mellitus. CMAJ. 2003;168:1661-7. 199. Burger KN, Beulens JW, van der Schouw YT, Sluijs I, Spijkerman AM, Sluik D, Boeing H, Kaaks R, Teucher B, Dethlefsen C, Overvad K, Tjonneland A, Kyro C, Barricarte A, Bendinelli B, Krogh V, Tumino R, Sacerdote C, Mattiello A, Nilsson PM, Orho-Melander M, Rolandsson O, Huerta JM, Crowe F, Allen N and Nothlings U. Dietary fiber, carbohydrate quality and quantity, and mortality risk of individuals with diabetes mellitus. PloS one. 2012;7:e43127. 200. van Bakel MM, Slimani N, Feskens EJ, Du H, Beulens JW, van der Schouw YT, Brighenti F, Halkjaer J, Cust AE, Ferrari P, Brand-Miller J, Bueno-de-Mesquita HB, Peeters P, Ardanaz E, Dorronsoro M, Crowe FL, Bingham S, Rohrmann S, Boeing H, Johansson I, Manjer J, Tjonneland A, Overvad K, Lund E, Skeie G, Mattiello A, Salvini S, Clavel-Chapelon F and Kaaks R. Methodological challenges in the application of the glycemic index in epidemiological
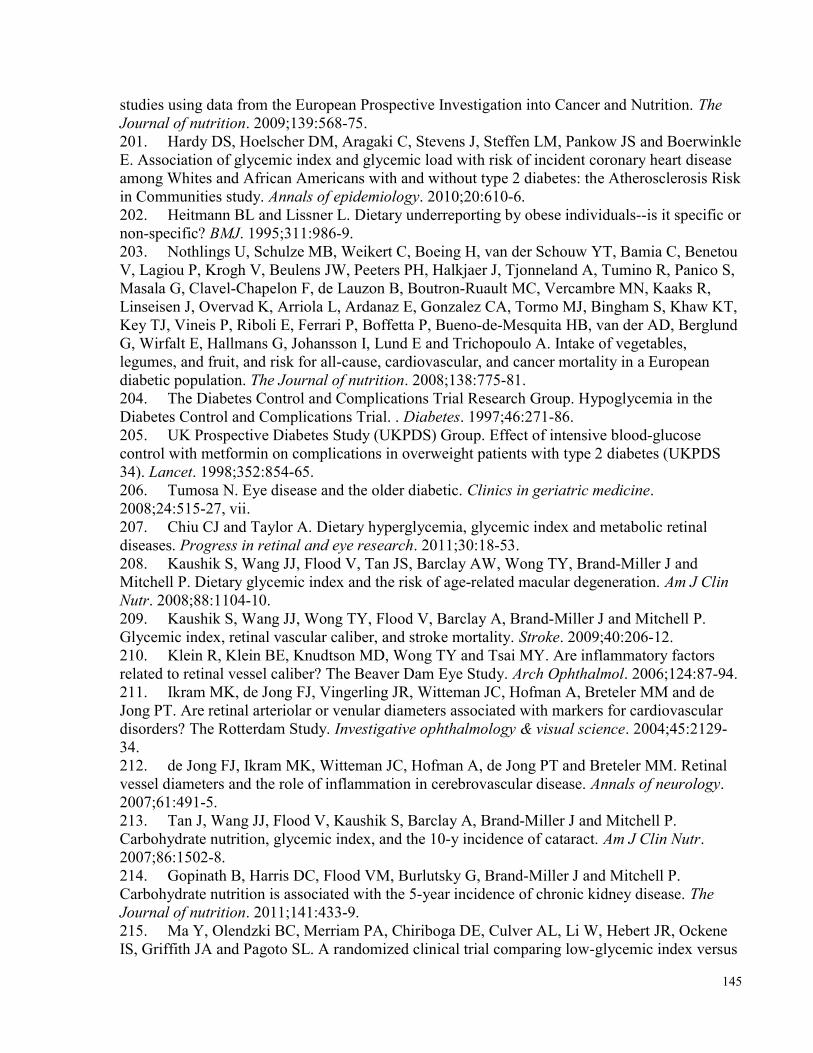
145
studies using data from the European Prospective Investigation into Cancer and Nutrition. The Journal of nutrition. 2009;139:568-75. 201. Hardy DS, Hoelscher DM, Aragaki C, Stevens J, Steffen LM, Pankow JS and Boerwinkle E. Association of glycemic index and glycemic load with risk of incident coronary heart disease among Whites and African Americans with and without type 2 diabetes: the Atherosclerosis Risk in Communities study. Annals of epidemiology. 2010;20:610-6. 202. Heitmann BL and Lissner L. Dietary underreporting by obese individuals--is it specific or non-specific? BMJ. 1995;311:986-9. 203. Nothlings U, Schulze MB, Weikert C, Boeing H, van der Schouw YT, Bamia C, Benetou V, Lagiou P, Krogh V, Beulens JW, Peeters PH, Halkjaer J, Tjonneland A, Tumino R, Panico S, Masala G, Clavel-Chapelon F, de Lauzon B, Boutron-Ruault MC, Vercambre MN, Kaaks R, Linseisen J, Overvad K, Arriola L, Ardanaz E, Gonzalez CA, Tormo MJ, Bingham S, Khaw KT, Key TJ, Vineis P, Riboli E, Ferrari P, Boffetta P, Bueno-de-Mesquita HB, van der AD, Berglund G, Wirfalt E, Hallmans G, Johansson I, Lund E and Trichopoulo A. Intake of vegetables, legumes, and fruit, and risk for all-cause, cardiovascular, and cancer mortality in a European diabetic population. The Journal of nutrition. 2008;138:775-81. 204. The Diabetes Control and Complications Trial Research Group. Hypoglycemia in the Diabetes Control and Complications Trial. . Diabetes. 1997;46:271-86. 205. UK Prospective Diabetes Study (UKPDS) Group. Effect of intensive blood-glucose control with metformin on complications in overweight patients with type 2 diabetes (UKPDS 34). Lancet. 1998;352:854-65. 206. Tumosa N. Eye disease and the older diabetic. Clinics in geriatric medicine. 2008;24:515-27, vii. 207. Chiu CJ and Taylor A. Dietary hyperglycemia, glycemic index and metabolic retinal diseases. Progress in retinal and eye research. 2011;30:18-53. 208. Kaushik S, Wang JJ, Flood V, Tan JS, Barclay AW, Wong TY, Brand-Miller J and Mitchell P. Dietary glycemic index and the risk of age-related macular degeneration. Am J Clin Nutr. 2008;88:1104-10. 209. Kaushik S, Wang JJ, Wong TY, Flood V, Barclay A, Brand-Miller J and Mitchell P. Glycemic index, retinal vascular caliber, and stroke mortality. Stroke. 2009;40:206-12. 210. Klein R, Klein BE, Knudtson MD, Wong TY and Tsai MY. Are inflammatory factors related to retinal vessel caliber? The Beaver Dam Eye Study. Arch Ophthalmol. 2006;124:87-94. 211. Ikram MK, de Jong FJ, Vingerling JR, Witteman JC, Hofman A, Breteler MM and de Jong PT. Are retinal arteriolar or venular diameters associated with markers for cardiovascular disorders? The Rotterdam Study. Investigative ophthalmology & visual science. 2004;45:2129-34. 212. de Jong FJ, Ikram MK, Witteman JC, Hofman A, de Jong PT and Breteler MM. Retinal vessel diameters and the role of inflammation in cerebrovascular disease. Annals of neurology. 2007;61:491-5. 213. Tan J, Wang JJ, Flood V, Kaushik S, Barclay A, Brand-Miller J and Mitchell P. Carbohydrate nutrition, glycemic index, and the 10-y incidence of cataract. Am J Clin Nutr. 2007;86:1502-8. 214. Gopinath B, Harris DC, Flood VM, Burlutsky G, Brand-Miller J and Mitchell P. Carbohydrate nutrition is associated with the 5-year incidence of chronic kidney disease. The Journal of nutrition. 2011;141:433-9. 215. Ma Y, Olendzki BC, Merriam PA, Chiriboga DE, Culver AL, Li W, Hebert JR, Ockene IS, Griffith JA and Pagoto SL. A randomized clinical trial comparing low-glycemic index versus
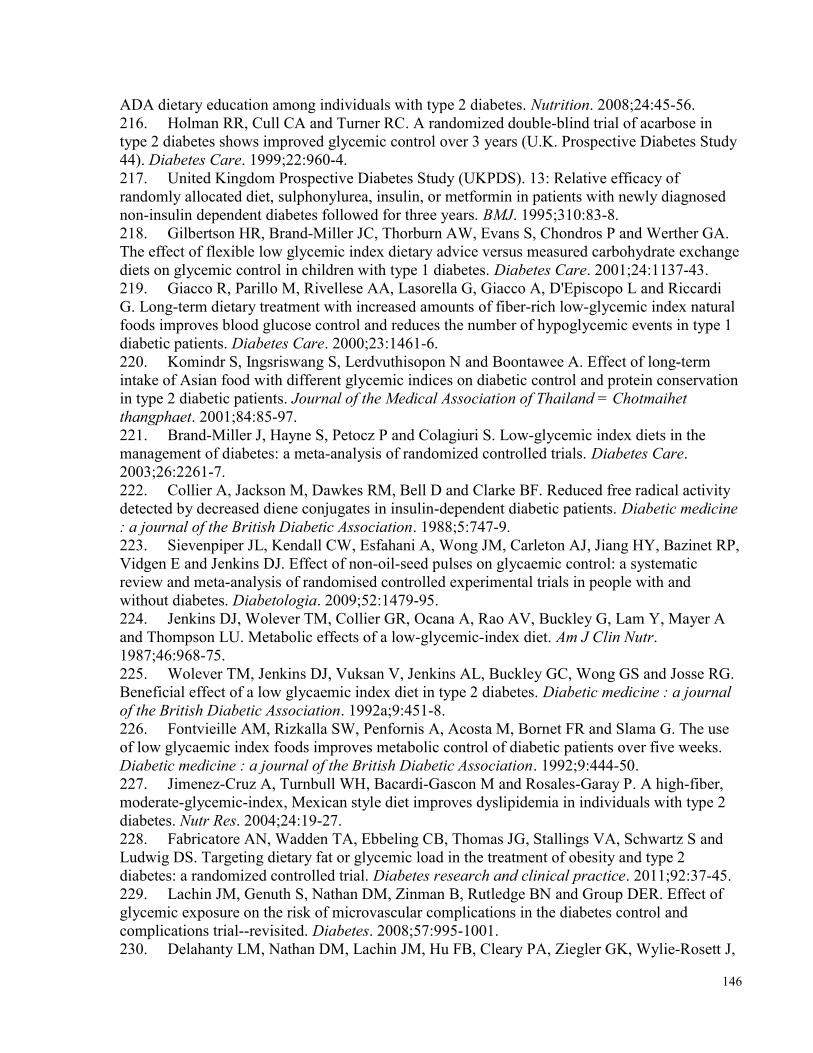
146
ADA dietary education among individuals with type 2 diabetes. Nutrition. 2008;24:45-56. 216. Holman RR, Cull CA and Turner RC. A randomized double-blind trial of acarbose in type 2 diabetes shows improved glycemic control over 3 years (U.K. Prospective Diabetes Study 44). Diabetes Care. 1999;22:960-4. 217. United Kingdom Prospective Diabetes Study (UKPDS). 13: Relative efficacy of randomly allocated diet, sulphonylurea, insulin, or metformin in patients with newly diagnosed non-insulin dependent diabetes followed for three years. BMJ. 1995;310:83-8. 218. Gilbertson HR, Brand-Miller JC, Thorburn AW, Evans S, Chondros P and Werther GA. The effect of flexible low glycemic index dietary advice versus measured carbohydrate exchange diets on glycemic control in children with type 1 diabetes. Diabetes Care. 2001;24:1137-43. 219. Giacco R, Parillo M, Rivellese AA, Lasorella G, Giacco A, D'Episcopo L and Riccardi G. Long-term dietary treatment with increased amounts of fiber-rich low-glycemic index natural foods improves blood glucose control and reduces the number of hypoglycemic events in type 1 diabetic patients. Diabetes Care. 2000;23:1461-6. 220. Komindr S, Ingsriswang S, Lerdvuthisopon N and Boontawee A. Effect of long-term intake of Asian food with different glycemic indices on diabetic control and protein conservation in type 2 diabetic patients. Journal of the Medical Association of Thailand = Chotmaihet thangphaet. 2001;84:85-97. 221. Brand-Miller J, Hayne S, Petocz P and Colagiuri S. Low-glycemic index diets in the management of diabetes: a meta-analysis of randomized controlled trials. Diabetes Care. 2003;26:2261-7. 222. Collier A, Jackson M, Dawkes RM, Bell D and Clarke BF. Reduced free radical activity detected by decreased diene conjugates in insulin-dependent diabetic patients. Diabetic medicine : a journal of the British Diabetic Association. 1988;5:747-9. 223. Sievenpiper JL, Kendall CW, Esfahani A, Wong JM, Carleton AJ, Jiang HY, Bazinet RP, Vidgen E and Jenkins DJ. Effect of non-oil-seed pulses on glycaemic control: a systematic review and meta-analysis of randomised controlled experimental trials in people with and without diabetes. Diabetologia. 2009;52:1479-95. 224. Jenkins DJ, Wolever TM, Collier GR, Ocana A, Rao AV, Buckley G, Lam Y, Mayer A and Thompson LU. Metabolic effects of a low-glycemic-index diet. Am J Clin Nutr. 1987;46:968-75. 225. Wolever TM, Jenkins DJ, Vuksan V, Jenkins AL, Buckley GC, Wong GS and Josse RG. Beneficial effect of a low glycaemic index diet in type 2 diabetes. Diabetic medicine : a journal of the British Diabetic Association. 1992a;9:451-8. 226. Fontvieille AM, Rizkalla SW, Penfornis A, Acosta M, Bornet FR and Slama G. The use of low glycaemic index foods improves metabolic control of diabetic patients over five weeks. Diabetic medicine : a journal of the British Diabetic Association. 1992;9:444-50. 227. Jimenez-Cruz A, Turnbull WH, Bacardi-Gascon M and Rosales-Garay P. A high-fiber, moderate-glycemic-index, Mexican style diet improves dyslipidemia in individuals with type 2 diabetes. Nutr Res. 2004;24:19-27. 228. Fabricatore AN, Wadden TA, Ebbeling CB, Thomas JG, Stallings VA, Schwartz S and Ludwig DS. Targeting dietary fat or glycemic load in the treatment of obesity and type 2 diabetes: a randomized controlled trial. Diabetes research and clinical practice. 2011;92:37-45. 229. Lachin JM, Genuth S, Nathan DM, Zinman B, Rutledge BN and Group DER. Effect of glycemic exposure on the risk of microvascular complications in the diabetes control and complications trial--revisited. Diabetes. 2008;57:995-1001. 230. Delahanty LM, Nathan DM, Lachin JM, Hu FB, Cleary PA, Ziegler GK, Wylie-Rosett J,
147
Wexler DJ and Diabetes Control Complications Trial/Epidemiology of Diabetes. Association of diet with glycated hemoglobin during intensive treatment of type 1 diabetes in the Diabetes Control and Complications Trial. Am J Clin Nutr. 2009;89:518-24. 231. Yeboah J, Crouse JR, Hsu FC, Burke GL and Herrington DM. Brachial flow-mediated dilation predicts incident cardiovascular events in older adults: the Cardiovascular Health Study. Circulation. 2007;115:2390-7. 232. Rossi R, Nuzzo A, Origliani G and Modena MG. Prognostic role of flow-mediated dilation and cardiac risk factors in post-menopausal women. J Am Coll Cardiol. 2008;51:997-1002. 233. Buscemi S, Cosentino L, Rosafio G, Morgana M, Mattina A, Sprini D, Verga S and Rini GB. Effects of hypocaloric diets with different glycemic indexes on endothelial function and glycemic variability in overweight and in obese adult patients at increased cardiovascular risk. Clinical nutrition. 2013;32:346-52. 234. Brillante DG, O'Sullivan AJ and Howes LG. Arterial stiffness in insulin resistance: the role of nitric oxide and angiotensin II receptors. Vascular health and risk management. 2009;5:73-8. 235. Giugliano D, Ceriello A and Paolisso G. Oxidative stress and diabetic vascular complications. Diabetes Care. 1996;19:257-67. 236. Hu Y, Block G, Norkus EP, Morrow JD, Dietrich M and Hudes M. Relations of glycemic index and glycemic load with plasma oxidative stress markers. Am J Clin Nutr. 2006;84:70-6; quiz 266-7. 237. Ceriello A and Ihnat MA. 'Glycaemic variability': a new therapeutic challenge in diabetes and the critical care setting. Diabetic medicine : a journal of the British Diabetic Association. 2010;27:862-7. 238. O'Leary DH and Bots ML. Imaging of atherosclerosis: carotid intima-media thickness. Eur Heart J. 2010;31:1682-9. 239. Polak JF, Pencina MJ, Meisner A, Pencina KM, Brown LS, Wolf PA and D'Agostino RB, Sr. Associations of carotid artery intima-media thickness (IMT) with risk factors and prevalent cardiovascular disease: comparison of mean common carotid artery IMT with maximum internal carotid artery IMT. J Ultrasound Med. 2010;29:1759-68. 240. Sehestedt T, Jeppesen J, Hansen TW, Wachtell K, Ibsen H, Torp-Pedersen C, Hildebrandt P and Olsen MH. Risk prediction is improved by adding markers of subclinical organ damage to SCORE. Eur Heart J. 2010;31:883-91. 241. Nambi V, Chambless L, Folsom AR, He M, Hu Y, Mosley T, Volcik K, Boerwinkle E and Ballantyne CM. Carotid intima-media thickness and presence or absence of plaque improves prediction of coronary heart disease risk: the ARIC (Atherosclerosis Risk In Communities) study. J Am Coll Cardiol. 2010;55:1600-7. 242. Peters SA, den Ruijter HM, Bots ML and Moons KG. Improvements in risk stratification for the occurrence of cardiovascular disease by imaging subclinical atherosclerosis: a systematic review. Heart. 2012;98:177-84. 243. Lorenz MW, Markus HS, Bots ML, Rosvall M and Sitzer M. Prediction of clinical cardiovascular events with carotid intima-media thickness: a systematic review and meta-analysis. Circulation. 2007;115:459-67. 244. Sibal L, Agarwal SC and Home PD. Carotid intima-media thickness as a surrogate marker of cardiovascular disease in diabetes. Diabetes, metabolic syndrome and obesity : targets and therapy. 2011;4:23-34. 245. Costanzo P, Cleland JG, Atkin SL, Vassallo E and Perrone-Filardi P. Use of carotid

148
intima-media thickness regression to guide therapy and management of cardiac risks. Current treatment options in cardiovascular medicine. 2012;14:50-6. 246. Perk J, De Backer G, Gohlke H, Graham I, Reiner Z, Verschuren M, Albus C, Benlian P, Boysen G, Cifkova R, Deaton C, Ebrahim S, Fisher M, Germano G, Hobbs R, Hoes A, Karadeniz S, Mezzani A, Prescott E, Ryden L, Scherer M, Syvanne M, Scholte op Reimer WJ, Vrints C, Wood D, Zamorano JL, Zannad F, European Association for Cardiovascular P, Rehabilitation and Guidelines ESCCfP. European Guidelines on cardiovascular disease prevention in clinical practice (version 2012). The Fifth Joint Task Force of the European Society of Cardiology and Other Societies on Cardiovascular Disease Prevention in Clinical Practice (constituted by representatives of nine societies and by invited experts). Eur Heart J. 2012;33:1635-701. 247. Stein JH, Korcarz CE, Hurst RT, Lonn E, Kendall CB, Mohler ER, Najjar SS, Rembold CM, Post WS and American Society of Echocardiography Carotid Intima-Media Thickness Task F. Use of carotid ultrasound to identify subclinical vascular disease and evaluate cardiovascular disease risk: a consensus statement from the American Society of Echocardiography Carotid Intima-Media Thickness Task Force. Endorsed by the Society for Vascular Medicine. Journal of the American Society of Echocardiography : official publication of the American Society of Echocardiography. 2008;21:93-111; quiz 189-90. 248. Mancia G, De Backer G, Dominiczak A, Cifkova R, Fagard R, Germano G, Grassi G, Heagerty AM, Kjeldsen SE, Laurent S, Narkiewicz K, Ruilope L, Rynkiewicz A, Schmieder RE, Boudier HA, Zanchetti A and Hypertension E-ETFotMoA. 2007 ESH-ESC Practice Guidelines for the Management of Arterial Hypertension: ESH-ESC Task Force on the Management of Arterial Hypertension. Journal of hypertension. 2007;25:1751-62. 249. Mancia G, Fagard R, Narkiewicz K, Redon J, Zanchetti A, Bohm M, Christiaens T, Cifkova R, De Backer G, Dominiczak A, Galderisi M, Grobbee DE, Jaarsma T, Kirchhof P, Kjeldsen SE, Laurent S, Manolis AJ, Nilsson PM, Ruilope LM, Schmieder RE, Sirnes PA, Sleight P, Viigimaa M, Waeber B, Zannad F, Redon J, Dominiczak A, Narkiewicz K, Nilsson PM, Burnier M, Viigimaa M, Ambrosioni E, Caufield M, Coca A, Olsen MH, Schmieder RE, Tsioufis C, van de Borne P, Zamorano JL, Achenbach S, Baumgartner H, Bax JJ, Bueno H, Dean V, Deaton C, Erol C, Fagard R, Ferrari R, Hasdai D, Hoes AW, Kirchhof P, Knuuti J, Kolh P, Lancellotti P, Linhart A, Nihoyannopoulos P, Piepoli MF, Ponikowski P, Sirnes PA, Tamargo JL, Tendera M, Torbicki A, Wijns W, Windecker S, Clement DL, Coca A, Gillebert TC, Tendera M, Rosei EA, Ambrosioni E, Anker SD, Bauersachs J, Hitij JB, Caulfield M, De Buyzere M, De Geest S, Derumeaux GA, Erdine S, Farsang C, Funck-Brentano C, Gerc V, Germano G, Gielen S, Haller H, Hoes AW, Jordan J, Kahan T, Komajda M, Lovic D, Mahrholdt H, Olsen MH, Ostergren J, Parati G, Perk J, Polonia J, Popescu BA, Reiner Z, Ryden L, Sirenko Y, Stanton A, Struijker-Boudier H, Tsioufis C, van de Borne P, Vlachopoulos C, Volpe M and Wood DA. 2013 ESH/ESC guidelines for the management of arterial hypertension: the Task Force for the Management of Arterial Hypertension of the European Society of Hypertension (ESH) and of the European Society of Cardiology (ESC). Eur Heart J. 2013;34:2159-219. 250. Touboul PJ, Hennerici MG, Meairs S, Adams H, Amarenco P, Bornstein N, Csiba L, Desvarieux M, Ebrahim S, Fatar M, Hernandez Hernandez R, Jaff M, Kownator S, Prati P, Rundek T, Sitzer M, Schminke U, Tardif JC, Taylor A, Vicaut E, Woo KS, Zannad F and Zureik M. Mannheim carotid intima-media thickness consensus (2004-2006). An update on behalf of the Advisory Board of the 3rd and 4th Watching the Risk Symposium, 13th and 15th European Stroke Conferences, Mannheim, Germany, 2004, and Brussels, Belgium, 2006. Cerebrovascular diseases. 2007;23:75-80.
149
251. Geng DF, Jin DM, Wu W, Fang C and Wang JF. Effect of alpha-glucosidase inhibitors on the progression of carotid intima-media thickness: a meta-analysis of randomized controlled trials. Atherosclerosis. 2011;218:214-9. 252. Hanefeld M, Cagatay M, Petrowitsch T, Neuser D, Petzinna D and Rupp M. Acarbose reduces the risk for myocardial infarction in type 2 diabetic patients: meta-analysis of seven long-term studies. Eur Heart J. 2004;25:10-6. 253. Mita T, Watada H, Shimizu T, Tamura Y, Sato F, Watanabe T, Choi JB, Hirose T, Tanaka Y and Kawamori R. Nateglinide reduces carotid intima-media thickening in type 2 diabetic patients under good glycemic control. Arteriosclerosis, thrombosis, and vascular biology. 2007;27:2456-62. 254. Esposito K, Giugliano D, Nappo F, Marfella R and Campanian Postprandial Hyperglycemia Study G. Regression of carotid atherosclerosis by control of postprandial hyperglycemia in type 2 diabetes mellitus. Circulation. 2004;110:214-9. 255. Ellingsen I, Seljeflot I, Arnesen H and Tonstad S. Vitamin C consumption is associated with less progression in carotid intima media thickness in elderly men: A 3-year intervention study. Nutrition, metabolism, and cardiovascular diseases : NMCD. 2009;19:8-14. 256. Murie-Fernandez M, Irimia P, Toledo E, Martinez-Vila E, Buil-Cosiales P, Serrano-Martinez M, Ruiz-Gutierrez V, Ros E, Estruch R, Martinez-Gonzalez MA and Investigators P. Carotid intima-media thickness changes with Mediterranean diet: a randomized trial (PREDIMED-Navarra). Atherosclerosis. 2011;219:158-62. 257. Buil-Cosiales P, Irimia P, Ros E, Riverol M, Gilabert R, Martinez-Vila E, Nunez I, Diez-Espino J, Martinez-Gonzalez MA and Serrano-Martinez M. Dietary fibre intake is inversely associated with carotid intima-media thickness: a cross-sectional assessment in the PREDIMED study. European journal of clinical nutrition. 2009;63:1213-9. 258. Merchant AT, Kelemen LE, de Koning L, Lonn E, Vuksan V, Jacobs R, Davis B, Teo KK, Yusuf S, Anand SS, Share and investigators S-A. Interrelation of saturated fat, trans fat, alcohol intake, and subclinical atherosclerosis. Am J Clin Nutr. 2008;87:168-74. 259. Rodriguez-Rejon AI, Castro-Quezada I, Ruano-Rodriguez C, Ruiz-Lopez MD, Sanchez-Villegas A, Toledo E, Artacho R, Estruch R, Salas-Salvado J, Covas MI, Corella D, Gomez-Gracia E, Lapetra J, Pinto X, Aros F, Fiol M, Lamuela-Raventos RM, Ruiz-Gutierrez V, Schroder H, Ros E, Martinez-Gonzalez MA and Serra-Majem L. Effect of a Mediterranean Diet Intervention on Dietary Glycemic Load and Dietary Glycemic Index: The PREDIMED Study. Journal of nutrition and metabolism. 2014;2014:985373. 260. Castro-Quezada I, Sanchez-Villegas A, Estruch R, Salas-Salvado J, Corella D, Schroder H, Alvarez-Perez J, Ruiz-Lopez MD, Artacho R, Ros E, Bullo M, Covas MI, Ruiz-Gutierrez V, Ruiz-Canela M, Buil-Cosiales P, Gomez-Gracia E, Lapetra J, Pinto X, Aros F, Fiol M, Lamuela-Raventos RM, Martinez-Gonzalez MA, Serra-Majem L and Investigators PS. A high dietary glycemic index increases total mortality in a Mediterranean population at high cardiovascular risk. PloS one. 2014;9:e107968. 261. Carpenter M, Sinclair H and Kunadian V. Carotid Intima Media Thickness and Its Utility as a Predictor of Cardiovascular Disease: A Review of Evidence. Cardiology in review. 2016;24:70-5. 262. Saam T, Kerwin WS, Chu B, Cai J, Kampschulte A, Hatsukami TS, Zhao XQ, Polissar NL, Neradilek B, Yarnykh VL, Flemming K, Huston J, 3rd, Insull W, Jr., Morrisett JD, Rand SD, DeMarco KJ and Yuan C. Sample size calculation for clinical trials using magnetic resonance imaging for the quantitative assessment of carotid atherosclerosis. Journal of cardiovascular magnetic resonance : official journal of the Society for Cardiovascular Magnetic
150
Resonance. 2005;7:799-808. 263. Kathiresan S, Larson MG, Keyes MJ, Polak JF, Wolf PA, D'Agostino RB, Jaffer FA, Clouse ME, Levy D, Manning WJ and O'Donnell CJ. Assessment by cardiovascular magnetic resonance, electron beam computed tomography, and carotid ultrasonography of the distribution of subclinical atherosclerosis across Framingham risk strata. Am J Cardiol. 2007;99:310-4. 264. Chu B, Zhao XQ, Saam T, Yarnykh VL, Kerwin WS, Flemming KD, Huston J, 3rd, Insull W, Jr., Morrisett JD, Rand SD, DeMarco KJ, Polissar NL, Balu N, Cai J, Kampschulte A, Hatsukami TS and Yuan C. Feasibility of in vivo, multicontrast-weighted MR imaging of carotid atherosclerosis for multicenter studies. Journal of magnetic resonance imaging : JMRI. 2005;21:809-17. 265. Migrino RQ, Bowers M, Harmann L, Prost R and LaDisa JF, Jr. Carotid plaque regression following 6-month statin therapy assessed by 3T cardiovascular magnetic resonance: comparison with ultrasound intima media thickness. Journal of cardiovascular magnetic resonance : official journal of the Society for Cardiovascular Magnetic Resonance. 2011;13:37. 266. Corti R, Fayad ZA, Fuster V, Worthley SG, Helft G, Chesebro J, Mercuri M and Badimon JJ. Effects of lipid-lowering by simvastatin on human atherosclerotic lesions: a longitudinal study by high-resolution, noninvasive magnetic resonance imaging. Circulation. 2001;104:249-52. 267. Fayad ZA, Mani V, Woodward M, Kallend D, Abt M, Burgess T, Fuster V, Ballantyne CM, Stein EA, Tardif JC, Rudd JH, Farkouh ME, Tawakol A and dal PI. Safety and efficacy of dalcetrapib on atherosclerotic disease using novel non-invasive multimodality imaging (dal-PLAQUE): a randomised clinical trial. Lancet. 2011;378:1547-59. 268. Lee JM, Wiesmann F, Shirodaria C, Leeson P, Petersen SE, Francis JM, Jackson CE, Robson MD, Neubauer S, Channon KM and Choudhury RP. Early changes in arterial structure and function following statin initiation: quantification by magnetic resonance imaging. Atherosclerosis. 2008;197:951-8. 269. Strang AC, van Wijk DF, Mutsaerts HJ, Stroes ES, Nederveen AJ, Rotmans JI, Rabelink TJ and Box FM. Guideline treatment results in regression of atherosclerosis in type 2 diabetes mellitus. Diabetes & vascular disease research. 2015;12:126-32. 270. Sala-Vila A, Bargallo N, Estruch R, Gilabert R, Romero-Mamani E and Ros E. Keynote: Effect of a Mediterranean diet intervention on 3T MRI-monitored carotid plaque progression and vulnerability. A sub-study of the PREDIMED trial. . Atherosclerosis. 2014;235:e23. 271. Torgerson DJ. Contamination in trials: is cluster randomisation the answer? BMJ. 2001;322:355-7. 272. Samuel VT and Shulman GI. Mechanisms for insulin resistance: common threads and missing links. Cell. 2012;148:852-71. 273. Willett W, Manson J and Liu S. Glycemic index, glycemic load, and risk of type 2 diabetes. Am J Clin Nutr. 2002;76:274S-80S. 274. Jenkins DJ, Kendall CW, Augustin LS, Franceschi S, Hamidi M, Marchie A, Jenkins AL and Axelsen M. Glycemic index: overview of implications in health and disease. Am J Clin Nutr. 2002;76:266S-73S. 275. Fabricatore AN, Ebbeling CB, Wadden TA and Ludwig DS. Continuous glucose monitoring to assess the ecologic validity of dietary glycemic index and glycemic load. Am J Clin Nutr. 2011;94:1519-24. 276. Drucker DJ. Deciphering metabolic messages from the gut drives therapeutic innovation: the 2014 Banting Lecture. Diabetes. 2015;64:317-26. 277. Jenkins DJ, Wolever TM, Ocana AM, Vuksan V, Cunnane SC, Jenkins M, Wong GS,
151
Singer W, Bloom SR, Blendis LM and et al. Metabolic effects of reducing rate of glucose ingestion by single bolus versus continuous sipping. Diabetes. 1990;39:775-81. 278. Ludwig DS. Dietary glycemic index and obesity. The Journal of nutrition. 2000;130:280S-283S. 279. Ludwig DS. The glycemic index: physiological mechanisms relating to obesity, diabetes, and cardiovascular disease. JAMA. 2002;287:2414-23. 280. Jenkins DJ, Wolever TM, Taylor RH, Griffiths C, Krzeminska K, Lawrie JA, Bennett CM, Goff DV, Sarson DL and Bloom SR. Slow release dietary carbohydrate improves second meal tolerance. Am J Clin Nutr. 1982;35:1339-46. 281. Monnier L, Mas E, Ginet C, Michel F, Villon L, Cristol JP and Colette C. Activation of oxidative stress by acute glucose fluctuations compared with sustained chronic hyperglycemia in patients with type 2 diabetes. JAMA. 2006;295:1681-7. 282. Brownlee M and Hirsch IB. Glycemic variability: a hemoglobin A1c-independent risk factor for diabetic complications. JAMA. 2006;295:1707-8. 283. Klein R, Klein BE, Moss SE, Wong TY and Sharrett AR. Retinal vascular caliber in persons with type 2 diabetes: the Wisconsin Epidemiological Study of Diabetic Retinopathy: XX. Ophthalmology. 2006;113:1488-98. 284. Jenkins DJ, Kendall CW, Vuksan V, Faulkner D, Augustin LS, Mitchell S, Ireland C, Srichaikul K, Mirrahimi A, Chiavaroli L, Blanco Mejia S, Nishi S, Sahye-Pudaruth S, Patel D, Bashyam B, Vidgen E, de Souza RJ, Sievenpiper JL, Coveney J, Josse RG and Leiter LA. Effect of lowering the glycemic load with canola oil on glycemic control and cardiovascular risk factors: a randomized controlled trial. Diabetes Care. 2014;37:1806-14. 285. Jenkins DJ, Srichaikul K, Kendall CW, Sievenpiper JL, Abdulnour S, Mirrahimi A, Meneses C, Nishi S, He X, Lee S, So YT, Esfahani A, Mitchell S, Parker TL, Vidgen E, Josse RG and Leiter LA. The relation of low glycaemic index fruit consumption to glycaemic control and risk factors for coronary heart disease in type 2 diabetes. Diabetologia. 2011;54:271-9. 286. Canadian Diabetes Association. An economic tsunami: the cost of diabetes in Canada. . 2009:1-21. 287. American Diabetes A. Economic costs of diabetes in the U.S. in 2012. Diabetes Care. 2013;36:1033-46. 288. van 't Klooster R, Truijman MT, van Dijk AC, Schreuder FH, Kooi ME, van der Lugt A and van der Geest RJ. Visualization of local changes in vessel wall morphology and plaque progression in serial carotid artery magnetic resonance imaging. Stroke. 2014;45:e160-3. 289. van 't Klooster R, Staring M, Klein S, Kwee RM, Kooi ME, Reiber JH, Lelieveldt BP and van der Geest RJ. Automated registration of multispectral MR vessel wall images of the carotid artery. Medical physics. 2013;40:121904. 290. van 't Klooster R, de Koning PJ, Dehnavi RA, Tamsma JT, de Roos A, Reiber JH and van der Geest RJ. Automatic lumen and outer wall segmentation of the carotid artery using deformable three-dimensional models in MR angiography and vessel wall images. Journal of magnetic resonance imaging : JMRI. 2012;35:156-65. 291. Tardif JC, Spence JD, Heinonen TM, Moody A, Pressacco J, Frayne R, L'Allier P, Chow BJ, Friedrich M, Black SE, Fenster A, Rutt B and Beanlands R. Atherosclerosis imaging and the Canadian Atherosclerosis Imaging Network. The Canadian journal of cardiology. 2013;29:297-303. 292. Moody AR and Singh N. Incorporating Carotid Plaque Imaging into Routine Clinical Carotid Magnetic Resonance Angiography. Neuroimaging clinics of North America. 2016;26:29-44.
152
293. Sun J, Zhao XQ, Balu N, Hippe DS, Hatsukami TS, Isquith DA, Yamada K, Neradilek MB, Canton G, Xue Y, Fleg JL, Desvigne-Nickens P, Klimas MT, Padley RJ, Vassileva MT, Wyman BT and Yuan C. Carotid magnetic resonance imaging for monitoring atherosclerotic plaque progression: a multicenter reproducibility study. The international journal of cardiovascular imaging. 2015;31:95-103. 294. Pitt B, Byington RP, Furberg CD, Hunninghake DB, Mancini GB, Miller ME and Riley W. Effect of amlodipine on the progression of atherosclerosis and the occurrence of clinical events. PREVENT Investigators. Circulation. 2000;102:1503-10. 295. Lonn EM, Yusuf S, Doris CI, Sabine MJ, Dzavik V, Hutchison K, Riley WA, Tucker J, Pogue J and Taylor W. Study design and baseline characteristics of the study to evaluate carotid ultrasound changes in patients treated with ramipril and vitamin E: SECURE. Am J Cardiol. 1996;78:914-9. 296. Lonn E, Yusuf S, Dzavik V, Doris C, Yi Q, Smith S, Moore-Cox A, Bosch J, Riley W, Teo K and Investigators S. Effects of ramipril and vitamin E on atherosclerosis: the study to evaluate carotid ultrasound changes in patients treated with ramipril and vitamin E (SECURE). Circulation. 2001;103:919-25. 297. Ismail-Beigi F, Craven T, Banerji MA, Basile J, Calles J, Cohen RM, Cuddihy R, Cushman WC, Genuth S, Grimm RH, Jr., Hamilton BP, Hoogwerf B, Karl D, Katz L, Krikorian A, O'Connor P, Pop-Busui R, Schubart U, Simmons D, Taylor H, Thomas A, Weiss D, Hramiak I and group At. Effect of intensive treatment of hyperglycaemia on microvascular outcomes in type 2 diabetes: an analysis of the ACCORD randomised trial. Lancet. 2010;376:419-30. 298. The Agricultural Research Service Composition of foods, agriculture handbook no 8. Washington; 1992. 299. Health Canada. Canadian Nutrient File. 300. Atkinson FS, Foster-Powell K and Brand-Miller JC. International tables of glycemic index and glycemic load values: 2008. Diabetes Care. 2008;31:2281-3. 301. Summary of the second report of the National Cholesterol Education Program (NCEP) Expert Panel on Detection, Evaluation, and Treatment of High Blood Cholesterol in Adults (Adult Treatment Panel II). JAMA. 1993;269:3015-23. 302. SAS Institute: SAS/STAT Proprietary Software 9.4. Cary, NC: SAS Institute; 2002-2012. 303. Intensive blood-glucose control with sulphonylureas or insulin compared with conventional treatment and risk of complications in patients with type 2 diabetes (UKPDS 33). UK Prospective Diabetes Study (UKPDS) Group. Lancet. 1998;352:837-53. 304. Mozaffarian D, Benjamin EJ, Go AS, Arnett DK, Blaha MJ, Cushman M, de Ferranti S, Despres JP, Fullerton HJ, Howard VJ, Huffman MD, Judd SE, Kissela BM, Lackland DT, Lichtman JH, Lisabeth LD, Liu S, Mackey RH, Matchar DB, McGuire DK, Mohler ER, 3rd, Moy CS, Muntner P, Mussolino ME, Nasir K, Neumar RW, Nichol G, Palaniappan L, Pandey DK, Reeves MJ, Rodriguez CJ, Sorlie PD, Stein J, Towfighi A, Turan TN, Virani SS, Willey JZ, Woo D, Yeh RW, Turner MB, American Heart Association Statistics C and Stroke Statistics S. Heart disease and stroke statistics--2015 update: a report from the American Heart Association. Circulation. 2015;131:e29-322. 305. Shah AD, Langenberg C, Rapsomaniki E, Denaxas S, Pujades-Rodriguez M, Gale CP, Deanfield J, Smeeth L, Timmis A and Hemingway H. Type 2 diabetes and incidence of cardiovascular diseases: a cohort study in 1.9 million people. The lancet Diabetes & endocrinology. 2015;3:105-13. 306. Greenland P, Alpert JS, Beller GA, Benjamin EJ, Budoff MJ, Fayad ZA, Foster E, Hlatky MA, Hodgson JM, Kushner FG, Lauer MS, Shaw LJ, Smith SC, Jr., Taylor AJ, Weintraub WS,
153
Wenger NK, Jacobs AK, Smith SC, Jr., Anderson JL, Albert N, Buller CE, Creager MA, Ettinger SM, Guyton RA, Halperin JL, Hochman JS, Kushner FG, Nishimura R, Ohman EM, Page RL, Stevenson WG, Tarkington LG, Yancy CW, American College of Cardiology F and American Heart A. 2010 ACCF/AHA guideline for assessment of cardiovascular risk in asymptomatic adults: a report of the American College of Cardiology Foundation/American Heart Association Task Force on Practice Guidelines. J Am Coll Cardiol. 2010;56:e50-103. 307. Yoshida M, Mita T, Yamamoto R, Shimizu T, Ikeda F, Ohmura C, Kanazawa A, Hirose T, Kawamori R and Watada H. Combination of the Framingham risk score and carotid intima-media thickness improves the prediction of cardiovascular events in patients with type 2 diabetes. Diabetes Care. 2012;35:178-80. 308. Okayama KI, Mita T, Gosho M, Yamamoto R, Yoshida M, Kanazawa A, Kawamori R, Fujitani Y and Watada H. Carotid intima-media thickness progression predicts cardiovascular events in Japanese patients with type 2 diabetes. Diabetes research and clinical practice. 2013;101:286-92. 309. Mostaza JM, Lahoz C, Salinero-Fort MA, de Burgos-Lunar C, Laguna F, Estirado E, Garcia-Iglesias F, Gonzalez-Alegre T, Cornejo-Del-Rio V, Sabin C, Lopez S and Group S-. Carotid atherosclerosis severity in relation to glycemic status: a cross-sectional population study. Atherosclerosis. 2015;242:377-82. 310. Marini MA, Succurro E, Castaldo E, Cufone S, Arturi F, Sciacqua A, Lauro R, Hribal ML, Perticone F and Sesti G. Cardiometabolic risk profiles and carotid atherosclerosis in individuals with prediabetes identified by fasting glucose, postchallenge glucose, and hemoglobin A1c criteria. Diabetes Care. 2012;35:1144-9. 311. Bobbert T, Mai K, Fischer-Rosinsky A, Pfeiffer AF and Spranger J. A1C is associated with intima-media thickness in individuals with normal glucose tolerance. Diabetes Care. 2010;33:203-4. 312. Mita T, Katakami N, Yoshii H, Onuma T, Kaneto H, Osonoi T, Shiraiwa T, Kosugi K, Umayahara Y, Yamamoto T, Yokoyama H, Kuribayashi N, Jinnouchi H, Gosho M, Shimomura I, Watada H and Collaborators on the Study of Preventive Effects of Alogliptin on Diabetic Atherosclerosis T. Alogliptin, a Dipeptidyl Peptidase 4 Inhibitor, Prevents the Progression of Carotid Atherosclerosis in Patients With Type 2 Diabetes: The Study of Preventive Effects of Alogliptin on Diabetic Atherosclerosis (SPEAD-A). Diabetes Care. 2016;39:139-48. 313. Sidhu JS, Kaposzta Z, Markus HS and Kaski JC. Effect of rosiglitazone on common carotid intima-media thickness progression in coronary artery disease patients without diabetes mellitus. Arteriosclerosis, thrombosis, and vascular biology. 2004;24:930-4. 314. Nissen SE and Wolski K. Effect of rosiglitazone on the risk of myocardial infarction and death from cardiovascular causes. N Engl J Med. 2007;356:2457-71. 315. Hanefeld M, Chiasson JL, Koehler C, Henkel E, Schaper F and Temelkova-Kurktschiev T. Acarbose slows progression of intima-media thickness of the carotid arteries in subjects with impaired glucose tolerance. Stroke. 2004;35:1073-8. 316. Yun P, Du AM, Chen XJ, Liu JC and Xiao H. Effect of Acarbose on Long-Term Prognosis in Acute Coronary Syndromes Patients with Newly Diagnosed Impaired Glucose Tolerance. Journal of diabetes research. 2016;2016:1602083. 317. Rodriguez-Monforte M, Flores-Mateo G and Sanchez E. Dietary patterns and CVD: a systematic review and meta-analysis of observational studies. The British journal of nutrition. 2015;114:1341-59. 318. Bazzano LA, He J, Ogden LG, Loria C, Vupputuri S, Myers L and Whelton PK. Legume consumption and risk of coronary heart disease in US men and women: NHANES I

154
Epidemiologic Follow-up Study. Arch Intern Med. 2001;161:2573-8. 319. Hutchins AM, Winham DM and Thompson SV. Phaseolus beans: impact on glycaemic response and chronic disease risk in human subjects. The British journal of nutrition. 2012;108 Suppl 1:S52-65. 320. Nouri F, Sarrafzadegan N, Mohammadifard N, Sadeghi M and Mansourian M. Intake of legumes and the risk of cardiovascular disease: frailty modeling of a prospective cohort study in the Iranian middle-aged and older population. European journal of clinical nutrition. 2016;70:217-21. 321. Afshin A, Micha R, Khatibzadeh S and Mozaffarian D. Consumption of nuts and legumes and risk of incident ischemic heart disease, stroke, and diabetes: a systematic review and meta-analysis. Am J Clin Nutr. 2014;100:278-88. 322. Jayalath VH, de Souza RJ, Sievenpiper JL, Ha V, Chiavaroli L, Mirrahimi A, Di Buono M, Bernstein AM, Leiter LA, Kris-Etherton PM, Vuksan V, Beyene J, Kendall CW and Jenkins DJ. Effect of dietary pulses on blood pressure: a systematic review and meta-analysis of controlled feeding trials. American journal of hypertension. 2014;27:56-64. 323. Ha V, Sievenpiper JL, de Souza RJ, Jayalath VH, Mirrahimi A, Agarwal A, Chiavaroli L, Mejia SB, Sacks FM, Di Buono M, Bernstein AM, Leiter LA, Kris-Etherton PM, Vuksan V, Bazinet RP, Josse RG, Beyene J, Kendall CW and Jenkins DJ. Effect of dietary pulse intake on established therapeutic lipid targets for cardiovascular risk reduction: a systematic review and meta-analysis of randomized controlled trials. CMAJ. 2014;186:E252-62. 324. Bazzano LA, Thompson AM, Tees MT, Nguyen CH and Winham DM. Non-soy legume consumption lowers cholesterol levels: a meta-analysis of randomized controlled trials. Nutrition, metabolism, and cardiovascular diseases : NMCD. 2011;21:94-103. 325. Hermsdorff HH, Zulet MA, Abete I and Martinez JA. A legume-based hypocaloric diet reduces proinflammatory status and improves metabolic features in overweight/obese subjects. European journal of nutrition. 2011;50:61-9. 326. Friedewald WT, Levy RI and Fredrickson DS. Estimation of the concentration of low-density lipoprotein cholesterol in plasma, without use of the preparative ultracentrifuge. Clinical chemistry. 1972;18:499-502. 327. World Health Organization. Tobacco Free Initiative (TFI). Fact sheet about health benefits of smoking cessation. 2016. 328. Anderson KM, Wilson PW, Odell PM and Kannel WB. An updated coronary risk profile. A statement for health professionals. Circulation. 1991;83:356-62. 329. Box GEP and Cox DR. An analysis of transformations. Journal of the Royal Statistical Society. 1964;26:211-234. 330. Health Canada. Eating Well with Canada's Food Guide. 2011. 331. Li SS, Kendall CW, de Souza RJ, Jayalath VH, Cozma AI, Ha V, Mirrahimi A, Chiavaroli L, Augustin LS, Blanco Mejia S, Leiter LA, Beyene J, Jenkins DJ and Sievenpiper JL. Dietary pulses, satiety and food intake: a systematic review and meta-analysis of acute feeding trials. Obesity. 2014;22:1773-80. 332. He J and Whelton PK. Effect of dietary fiber and protein intake on blood pressure: a review of epidemiologic evidence. Clinical and experimental hypertension. 1999;21:785-96. 333. Lee YP, Puddey IB and Hodgson JM. Protein, fibre and blood pressure: potential benefit of legumes. Clinical and experimental pharmacology & physiology. 2008;35:473-6. 334. Salehi-Abargouei A, Saraf-Bank S, Bellissimo N and Azadbakht L. Effects of non-soy legume consumption on C-reactive protein: a systematic review and meta-analysis. Nutrition. 2015;31:631-9.
155
335. Nighoghossian N, Derex L and Douek P. The vulnerable carotid artery plaque: current imaging methods and new perspectives. Stroke. 2005;36:2764-72. 336. Rajabi S, Mazloom Z, Zamani A and Tabatabaee HR. Effect of Low Glycemic Index Diet Versus Metformin on Metabolic Syndrome. International journal of endocrinology and metabolism. 2015;13:e23091. 337. Giannini C, Diesse L, D'Adamo E, Chiavaroli V, de Giorgis T, Di Iorio C, Chiarelli F and Mohn A. Influence of the Mediterranean diet on carotid intima-media thickness in hypercholesterolaemic children: a 12-month intervention study. Nutrition, metabolism, and cardiovascular diseases : NMCD. 2014;24:75-82. 338. Josse AR, Kendall CW, Augustin LS, Ellis PR and Jenkins DJ. Almonds and postprandial glycemia--a dose-response study. Metabolism: clinical and experimental. 2007;56:400-4. 339. Mena MP, Sacanella E, Vazquez-Agell M, Morales M, Fito M, Escoda R, Serrano-Martinez M, Salas-Salvado J, Benages N, Casas R, Lamuela-Raventos RM, Masanes F, Ros E and Estruch R. Inhibition of circulating immune cell activation: a molecular antiinflammatory effect of the Mediterranean diet. Am J Clin Nutr. 2009;89:248-56. 340. Jenkins DJ, Kendall CW, Josse AR, Salvatore S, Brighenti F, Augustin LS, Ellis PR, Vidgen E and Rao AV. Almonds decrease postprandial glycemia, insulinemia, and oxidative damage in healthy individuals. The Journal of nutrition. 2006;136:2987-92. 341. Satija A and Hu FB. Cardiovascular benefits of dietary fiber. Current atherosclerosis reports. 2012;14:505-14. 342. Ma J, Folsom AR, Lewis L and Eckfeldt JH. Relation of plasma phospholipid and cholesterol ester fatty acid composition to carotid artery intima-media thickness: the Atherosclerosis Risk in Communities (ARIC) Study. Am J Clin Nutr. 1997;65:551-9. 343. Zhang S, Cai J, Luo Y, Han C, Polissar NL, Hatsukami TS and Yuan C. Measurement of carotid wall volume and maximum area with contrast-enhanced 3D MR imaging: initial observations. Radiology. 2003;228:200-5. 344. Corti R, Fuster V, Fayad ZA, Worthley SG, Helft G, Chaplin WF, Muntwyler J, Viles-Gonzalez JF, Weinberger J, Smith DA, Mizsei G and Badimon JJ. Effects of aggressive versus conventional lipid-lowering therapy by simvastatin on human atherosclerotic lesions: a prospective, randomized, double-blind trial with high-resolution magnetic resonance imaging. J Am Coll Cardiol. 2005;46:106-12. 345. Underhill HR, Yuan C, Zhao XQ, Kraiss LW, Parker DL, Saam T, Chu B, Takaya N, Liu F, Polissar NL, Neradilek B, Raichlen JS, Cain VA, Waterton JC, Hamar W and Hatsukami TS. Effect of rosuvastatin therapy on carotid plaque morphology and composition in moderately hypercholesterolemic patients: a high-resolution magnetic resonance imaging trial. American heart journal. 2008;155:584 e1-8. 346. Yuan C, Mitsumori LM, Ferguson MS, Polissar NL, Echelard D, Ortiz G, Small R, Davies JW, Kerwin WS and Hatsukami TS. In vivo accuracy of multispectral magnetic resonance imaging for identifying lipid-rich necrotic cores and intraplaque hemorrhage in advanced human carotid plaques. Circulation. 2001;104:2051-6. 347. Kim SJ, de Souza RJ, Choo VLW, Ha V, Cozma AI, Chiavaroli L, Mirrahimi A, Blanco Mejia S, di Buono M, Bernstein AM, Leiter LA, Kris-Etherton PM, Vuksan V, Beyene J, Kendall CWC, Jenkins DJA and Sievenpiper JL. The effects of dietary pulse consumption on body weight: a systematic review and meta-analysis of randomized controlled trials American Journal of Clinical Nutrition. 2016:in press. 348. de Souza RJ, Mente A, Maroleanu A, Cozma AI, Ha V, Kishibe T, Uleryk E, Budylowski
156
P, Schunemann H, Beyene J and Anand SS. Intake of saturated and trans unsaturated fatty acids and risk of all cause mortality, cardiovascular disease, and type 2 diabetes: systematic review and meta-analysis of observational studies. BMJ. 2015;351:h3978. 349. Siri-Tarino PW, Sun Q, Hu FB and Krauss RM. Meta-analysis of prospective cohort studies evaluating the association of saturated fat with cardiovascular disease. Am J Clin Nutr. 2010;91:535-46. 350. Mozaffarian D, Micha R and Wallace S. Effects on coronary heart disease of increasing polyunsaturated fat in place of saturated fat: a systematic review and meta-analysis of randomized controlled trials. PLoS medicine. 2010;7:e1000252. 351. Hooper L, Martin N, Abdelhamid A and Davey Smith G. Reduction in saturated fat intake for cardiovascular disease. The Cochrane database of systematic reviews. 2015;6:CD011737. 352. Abete I, Romaguera D, Vieira AR, Lopez de Munain A and Norat T. Association between total, processed, red and white meat consumption and all-cause, CVD and IHD mortality: a meta-analysis of cohort studies. The British journal of nutrition. 2014;112:762-75. 353. Pan A, Sun Q, Bernstein AM, Schulze MB, Manson JE, Stampfer MJ, Willett WC and Hu FB. Red meat consumption and mortality: results from 2 prospective cohort studies. Arch Intern Med. 2012;172:555-63. 354. Liu L, Wang S and Liu J. Fiber consumption and all-cause, cardiovascular, and cancer mortalities: a systematic review and meta-analysis of cohort studies. Molecular nutrition & food research. 2015;59:139-46. 355. Preis SR, Stampfer MJ, Spiegelman D, Willett WC and Rimm EB. Dietary protein and risk of ischemic heart disease in middle-aged men. Am J Clin Nutr. 2010;92:1265-72. 356. Bernstein AM, Sun Q, Hu FB, Stampfer MJ, Manson JE and Willett WC. Major dietary protein sources and risk of coronary heart disease in women. Circulation. 2010;122:876-83. 357. Richter CK, Skulas-Ray AC, Champagne CM and Kris-Etherton PM. Plant protein and animal proteins: do they differentially affect cardiovascular disease risk? Advances in nutrition. 2015;6:712-28. 358. National Diet-Heart Study Research Group. The National Diet-Heart Study final report. Circulation. 1969;37:Supplement 1. 359. Del Gobbo LC, Falk MC, Feldman R, Lewis K and Mozaffarian D. Effects of tree nuts on blood lipids, apolipoproteins, and blood pressure: systematic review, meta-analysis, and dose-response of 61 controlled intervention trials. Am J Clin Nutr. 2015;102:1347-56. 360. Giacosa A and Rondanelli M. The right fiber for the right disease: an update on the psyllium seed husk and the metabolic syndrome. Journal of clinical gastroenterology. 2010;44 Suppl 1:S58-60. 361. Pal S and Radavelli-Bagatini S. Effects of psyllium on metabolic syndrome risk factors. Obesity reviews : an official journal of the International Association for the Study of Obesity. 2012;13:1034-47. 362. Inaba Y, Chen JA and Bergmann SR. Carotid plaque, compared with carotid intima-media thickness, more accurately predicts coronary artery disease events: a meta-analysis. Atherosclerosis. 2012;220:128-33. 363. Johnsen SH and Mathiesen EB. Carotid plaque compared with intima-media thickness as a predictor of coronary and cerebrovascular disease. Current cardiology reports. 2009;11:21-7. 364. Spence JD, Jenkins DJ and Davignon J. Egg yolk consumption and carotid plaque. Atherosclerosis. 2012;224:469-73. 365. Rong Y, Chen L, Zhu T, Song Y, Yu M, Shan Z, Sands A, Hu FB and Liu L. Egg

157
consumption and risk of coronary heart disease and stroke: dose-response meta-analysis of prospective cohort studies. BMJ. 2013;346:e8539. 366. Li Y, Zhou C, Zhou X and Li L. Egg consumption and risk of cardiovascular diseases and diabetes: a meta-analysis. Atherosclerosis. 2013;229:524-30.
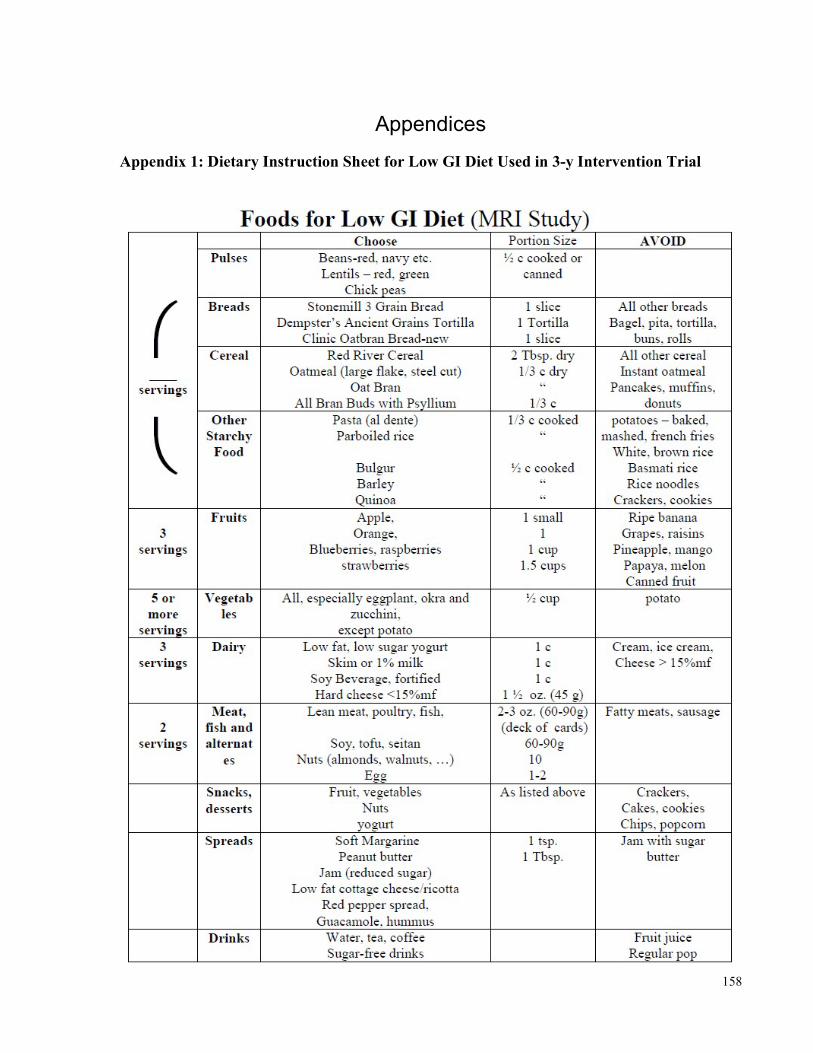
158
Appendices Appendix 1: Dietary Instruction Sheet for Low GI Diet Used in 3-y Intervention Trial
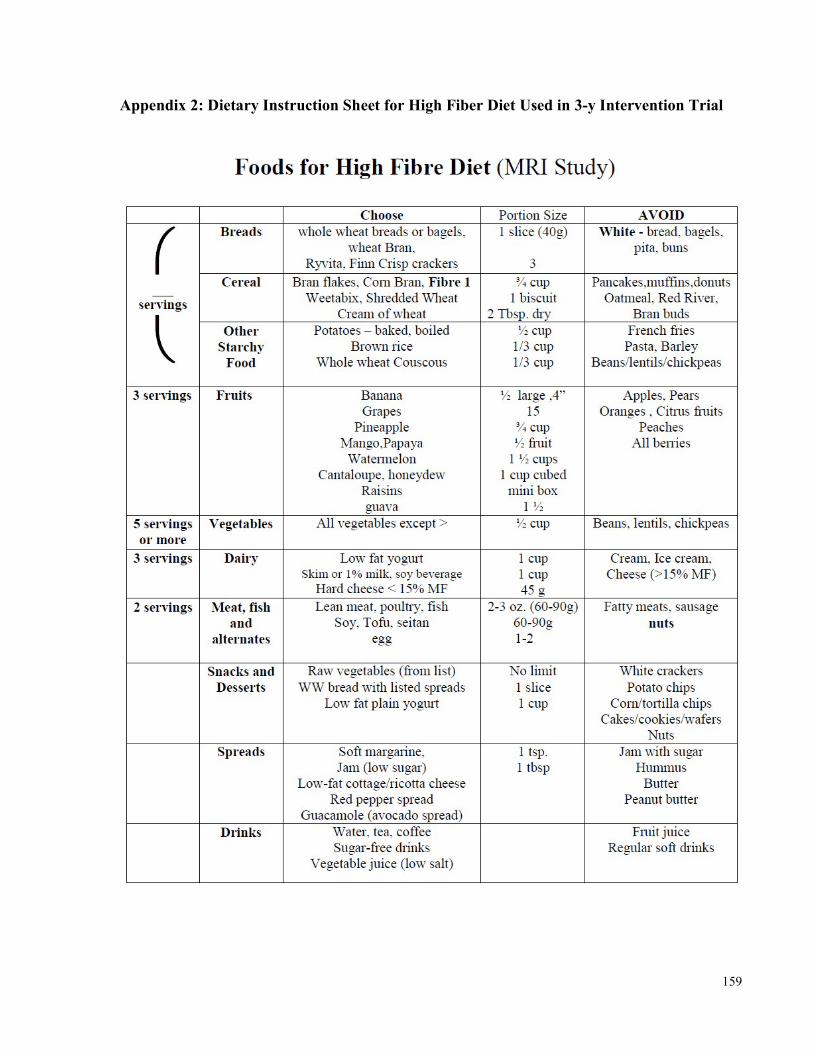
159
Appendix 2: Dietary Instruction Sheet for High Fiber Diet Used in 3-y Intervention Trial
Related Documents