Title Glucose-stimulated single pancreatic islets sustain increased cytosolic ATP levels during initial Ca(2+) influx and subsequent Ca(2+) oscillations. Author(s) Tanaka, Takashi; Nagashima, Kazuaki; Inagaki, Nobuya; Kioka, Hidetaka; Takashima, Seiji; Fukuoka, Hajime; Noji, Hiroyuki; Kakizuka, Akira; Imamura, Hiromi Citation The Journal of biological chemistry (2014), 289(4): 2205-2216 Issue Date 2014-01-24 URL http://hdl.handle.net/2433/203031 Right This research was originally published in [The Journal of Biological Chemistry, 289, 2205-2216. doi: 10.1074/jbc.M113.499111 January 24, 2014]. © the American Society for Biochemistry and Molecular Biology.; This is not the published version. Please cite only the published version. この論文は出版社版 でありません。引用の際には出版社版をご確認ご利用く ださい。 Type Journal Article Textversion author Kyoto University

Welcome message from author
This document is posted to help you gain knowledge. Please leave a comment to let me know what you think about it! Share it to your friends and learn new things together.
Transcript
TitleGlucose-stimulated single pancreatic islets sustain increasedcytosolic ATP levels during initial Ca(2+) influx andsubsequent Ca(2+) oscillations.
Author(s)Tanaka, Takashi; Nagashima, Kazuaki; Inagaki, Nobuya;Kioka, Hidetaka; Takashima, Seiji; Fukuoka, Hajime; Noji,Hiroyuki; Kakizuka, Akira; Imamura, Hiromi
Citation The Journal of biological chemistry (2014), 289(4): 2205-2216
Issue Date 2014-01-24
URL http://hdl.handle.net/2433/203031
Right
This research was originally published in [The Journal ofBiological Chemistry, 289, 2205-2216. doi:10.1074/jbc.M113.499111January 24, 2014]. © the American Society for Biochemistryand Molecular Biology.; This is not the published version.Please cite only the published version. この論文は出版社版でありません。引用の際には出版社版をご確認ご利用ください。
Type Journal Article
Textversion author
Kyoto University
Dynamics of intracellular ATP levels in pancreatic islets
1
Glucose-stimulated single pancreatic islets sustain increased cytosolic ATP levels during initial Ca2+ influx and subsequent Ca2+ oscillations. Takashi Tanaka*, Kazuaki Nagashima†, Nobuya Inagaki†, Hidetaka Kioka‡, Seiji Takashima‡, Hajime Fukuoka§, Hiroyuki Noji¶, Akira Kakizuka*, and Hiromi Imamura*, ||, 1 *Graduate School of Biostudies, Kyoto University, Kyoto, Japan †Graduate School of Medicine, Kyoto University, Kyoto, Japan ‡Graduate School of Medicine, Osaka University, Suita, Japan §Institute of Multidisciplinary Research for Advanced Materials, Tohoku University, Sendai, Japan ¶Department of Applied Chemistry, University of Tokyo, Tokyo, Japan ||The Hakubi Center for Advanced Research, Kyoto University, Kyoto, Japan. Running title: Dynamics of intracellular ATP levels in pancreatic islets 1To whom correspondence should be addressed to H.I. (Tel.: 81-75-753-7681; Fax: 81-75-753-7676; E-mail: [email protected]). Key words: ATP; calcium; energy metabolism; imaging; insulin; pancreatic islets Background: The roles of ATP in glucose-stimulated insulin secretion have not been well described. Results: After glucose stimulation, ATP levels were elevated prior to an increase in Ca2+ levels. High non-oscillatory ATP levels were sustained during Ca2+ oscillations. Conclusion: High ATP levels may be necessary for initial Ca2+ influx and subsequent Ca2+ oscillations. Significance: This adds new insight into the mechanism of insulin secretion. ABSTRACT
In pancreatic islets, insulin secretion occurs via synchronous elevation of Ca2+ levels throughout the islets during high glucose conditions. This Ca2+ elevation has two
phases; a quick increase, observed after the glucose stimulus, followed by prolonged oscillations. In these processes, the elevation of intracellular ATP levels generated from glucose is assumed to inhibit ATP-sensitive K+ channels, leading to the depolarization of membranes, which in turn induces Ca2+ elevation in the islets. However, little is known about the dynamics of intracellular ATP levels and their correlation with Ca2+ levels in the islets in response to changing glucose levels. In this study, a genetically encoded fluorescent biosensor for ATP and a fluorescent Ca2+ dye were employed to simultaneously monitor the dynamics of intracellular ATP and Ca2+ levels, respectively, inside single isolated islets. We observed rapid increases in cytosolic and mitochondrial ATP levels after stimulation with glucose, as well as
Dynamics of intracellular ATP levels in pancreatic islets
2
with methyl pyruvate or leucine/glutamine. High ATP levels were sustained as long as high glucose levels persisted. Inhibition of ATP production suppressed the initial Ca2+ increase, suggesting that enhanced energy metabolism triggers the initial phase of Ca2+ influx. On the other hand, cytosolic ATP levels did not fluctuate significantly with the
Ca2+ level in the subsequent oscillation phases. Importantly, Ca2+ oscillations stopped immediately before ATP levels decreased significantly. These results might explain how food or glucose intake evokes insulin secretion, and how the resulting decrease in plasma glucose levels leads to cessation of secretion.
Multiple hormones control blood glucose levels. Among them, insulin, which is secreted from pancreatic β-cells, is the only hormone that can reduce blood glucose levels. It is thought that intracellular ATP is implicated in glucose-stimulated insulin secretion (GSIS). Specifically, the ATP-sensitive K+ channel (KATP channel), which is closed by ATP, plays a critical role (1, 2). KATP channels in β-cells are composed of four Kir6.2 subunits, which form an inwardly rectifying K+ channel, and four sulfonylurea receptor subunits (3, 4). Transgenic mice expressing a dominant-negative form of the Kir6.2 subunit in β-cells develop hypoglycemia with hyperinsulinemia in neonates and hyperglycemia with hypoinsulinemia, as well as a decreased β-cell population in adults (5). GSIS in mammals is assumed to begin with the uptake of glucose through the glucose transporter (GLUT), with a subsequent increase in cytosolic ATP levels ([ATP]c) due to the metabolism of glucose through the glycolytic pathway and tri-carboxylic acid (TCA) cycle. Consequently, K+ permeability is lowered by the closure of the KATP channel, resulting in the depolarization of the plasma membrane, followed by the influx of Ca2+ through voltage-dependent Ca2+ channels (VDCC) and a rapid increase in cytosolic Ca2+ levels ([Ca2+]c). It is known that insulin is secreted from β-cells in a synchronized manner with [Ca2+]c (6), and that the dynamics of [Ca2+]c in β-cells drastically change during GSIS. First,
[Ca2+]c increases in response to stimulation with high levels of glucose (the initial phase), and then starts to oscillate (the second phase) (6, 7, 8). Although some studies have reported that intracellular ATP levels in β-cells do not increase upon glucose-stimulation (9, 10) and, thus, ADP or ATP/ADP ratio, rather than ATP, could be crucial for insulin secretion, there have also been many reports that support the increase in ATP (11, 12, 13). Because the turnover of intracellular ATP is quite rapid, ATP degradation could occur during extraction from the cells. Thus, ATP levels might be underestimated in the conventional ATP assay. To understand the actual dynamics of intracellular ATP during GSIS, a non-destructive method of measuring intracellular ATP is required. Recently, a genetically encoded fluorescent biosensor for the ATP/ADP ratio was employed in live pancreatic islets (14, 15). However, the dynamics of [ATP]c itself and its correlation with [Ca2+]c in the initial phase have not been well investigated. Moreover, it remains unclear how [ATP]c couples with [Ca2+]c oscillations in the second phase. We previously developed the genetically encoded fluorescent ATP biosensors ATeam (16) and GO-ATeam (17), which are based on the principle of Förster resonance energy transfer (FRET) and insensitive to the related nucleotides, namely, ADP, GTP, and dATP (16, 17). Because
Dynamics of intracellular ATP levels in pancreatic islets
3
GO-ATeam has little spectral-overlap with the Ca2+-sensitive dye fura-2, it has allowed us to monitor ATP levels and Ca2+ levels simultaneously in single living cells (17). In this paper, we visualized [ATP]c or mitochondrial ATP levels ([ATP]m) together with [Ca2+]c in each isolated islet by using GO-ATeam and fura-2, and examined how intracellular ATP dynamics regulate [Ca2+]c in GSIS. EXPERIMENTAL PROCEDURES Chemicals – Carbonylcyanide 3-chlorophenylhydrazone (CCCP), methyl pyruvate and tolbutamide were purchased from Wako Chemicals (Osaka, Japan). Oligomycin A was purchased from Fluka (St. Louis, MO, USA). Fura-2-AM and BAPTA-AM were purchased from Dojindo (Tokyo, Japan). Iodoacetate was purchased from Sigma (St. Louis, MO, USA). Other chemicals were purchased from Nacalai Tesque (Kyoto, Japan) unless otherwise noted. Isolation and culture of mouse pancreatic islets – Islets were isolated from the pancreases of C57BL/6J mice with the aid of collagenase (Roche) according to the general protocol. In brief, the pancreas was injected with a solution of 0.5 mg/mL collagenase via the bile duct. After collagenase digestion for 40 minutes at 37°C and 2 or 3 wash steps, density gradient centrifugation was performed using Ficoll. Islets were collected manually and cultured in RPMI 1640 (Nacalai Tesque) containing 11 mM glucose at 37°C in a humidified atmosphere containing 5% CO2 for 2 to 3 days. The culture medium was supplemented with 10% fetal calf serum (Nichirei Biosciences Inc, Tokyo, Japan), 100 units/mL penicillin, and 100 µg/mL streptomycin.
Culture of MIN6 cells – Cells of the mouse insulinoma cell line MIN6 (18) were cultured in DMEM (Sigma) containing 25 mM glucose supplemented with 15% fetal bovine serum (Sigma), 55 µM 2-mercaptoethanol (GIBCO, Grand Island, NY, USA), 100 units/mL penicillin and 100 µg/mL streptomycin at 37°C in a humidified atmosphere containing 5% CO2.
Generation of recombinant adenovirus - Adenovirus for the expression of GO-ATeam biosensors was generated using the ViraPowerTM
Adenoviral Expression System (Invitrogen, Carlsbad, CA, USA) according to the manufacturer’s instructions. For construction of the adenoviral vector encoding GO-ATeam, the XhoI-PmeI fragment of pcDNA-GO-ATeam1 or pcDNA-mit-GO-ATeam1 (17) was subcloned into the pENTR-1A vector (Invitrogen), digested with SalI and EcoRV, and then recombined into the pAd/CMV/V5-DEST destination vector.
Permeabilization of the plasma membrane - Plasma membranes of cells were permeabilized with 100 µg/mL α-hemolysin from Staphylococcus aureus (Sigma) for 30 minutes. After permeabilization, cells were perfused with intracellular-like medium containing 140 mM KCl, 6 mM NaCl, 1 mM MgCl2, 0.465 mM CaCl2, 2 mM EGTA and 12.5 mM HEPES (pH 7.0) and different concentrations of MgATP.
Imaging and data analysis - Islets were plated on a glass-bottom dish (Fine Plus International Ltd., Kyoto, Japan) and incubated at 37°C. For ATP imaging, ATeam1.03 (16) or a series of GO-ATeams (17) were transfected into islets using an adenoviral vector system. Before imaging, fura-2-AM was added to a final concentration of 2–5 µM for 30 minutes, and cells were preincubated in Krebs-Ringer-HEPES
Dynamics of intracellular ATP levels in pancreatic islets
4
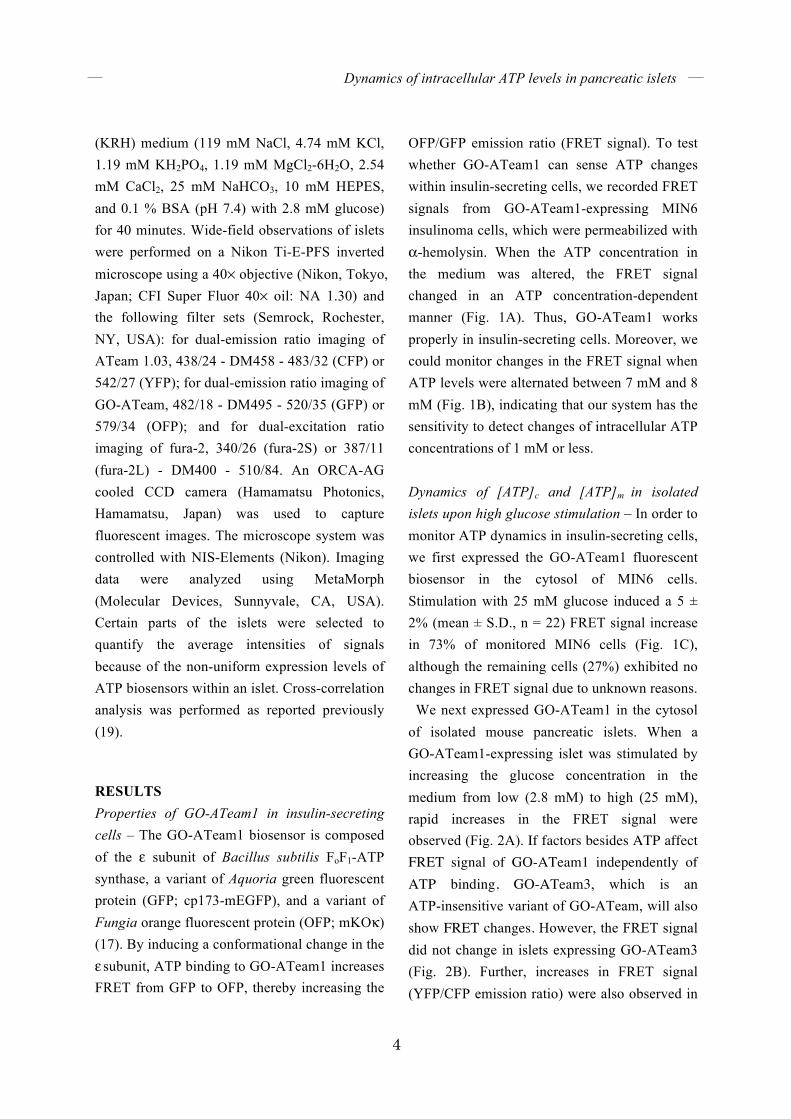
(KRH) medium (119 mM NaCl, 4.74 mM KCl, 1.19 mM KH2PO4, 1.19 mM MgCl2-6H2O, 2.54 mM CaCl2, 25 mM NaHCO3, 10 mM HEPES, and 0.1 % BSA (pH 7.4) with 2.8 mM glucose) for 40 minutes. Wide-field observations of islets were performed on a Nikon Ti-E-PFS inverted microscope using a 40× objective (Nikon, Tokyo, Japan; CFI Super Fluor 40× oil: NA 1.30) and the following filter sets (Semrock, Rochester, NY, USA): for dual-emission ratio imaging of ATeam 1.03, 438/24 - DM458 - 483/32 (CFP) or 542/27 (YFP); for dual-emission ratio imaging of GO-ATeam, 482/18 - DM495 - 520/35 (GFP) or 579/34 (OFP); and for dual-excitation ratio imaging of fura-2, 340/26 (fura-2S) or 387/11 (fura-2L) - DM400 - 510/84. An ORCA-AG cooled CCD camera (Hamamatsu Photonics, Hamamatsu, Japan) was used to capture fluorescent images. The microscope system was controlled with NIS-Elements (Nikon). Imaging data were analyzed using MetaMorph (Molecular Devices, Sunnyvale, CA, USA). Certain parts of the islets were selected to quantify the average intensities of signals because of the non-uniform expression levels of ATP biosensors within an islet. Cross-correlation analysis was performed as reported previously (19).
RESULTS Properties of GO-ATeam1 in insulin-secreting cells – The GO-ATeam1 biosensor is composed of the ε subunit of Bacillus subtilis FoF1-ATP synthase, a variant of Aquoria green fluorescent protein (GFP; cp173-mEGFP), and a variant of Fungia orange fluorescent protein (OFP; mKOκ) (17). By inducing a conformational change in the ε subunit, ATP binding to GO-ATeam1 increases FRET from GFP to OFP, thereby increasing the
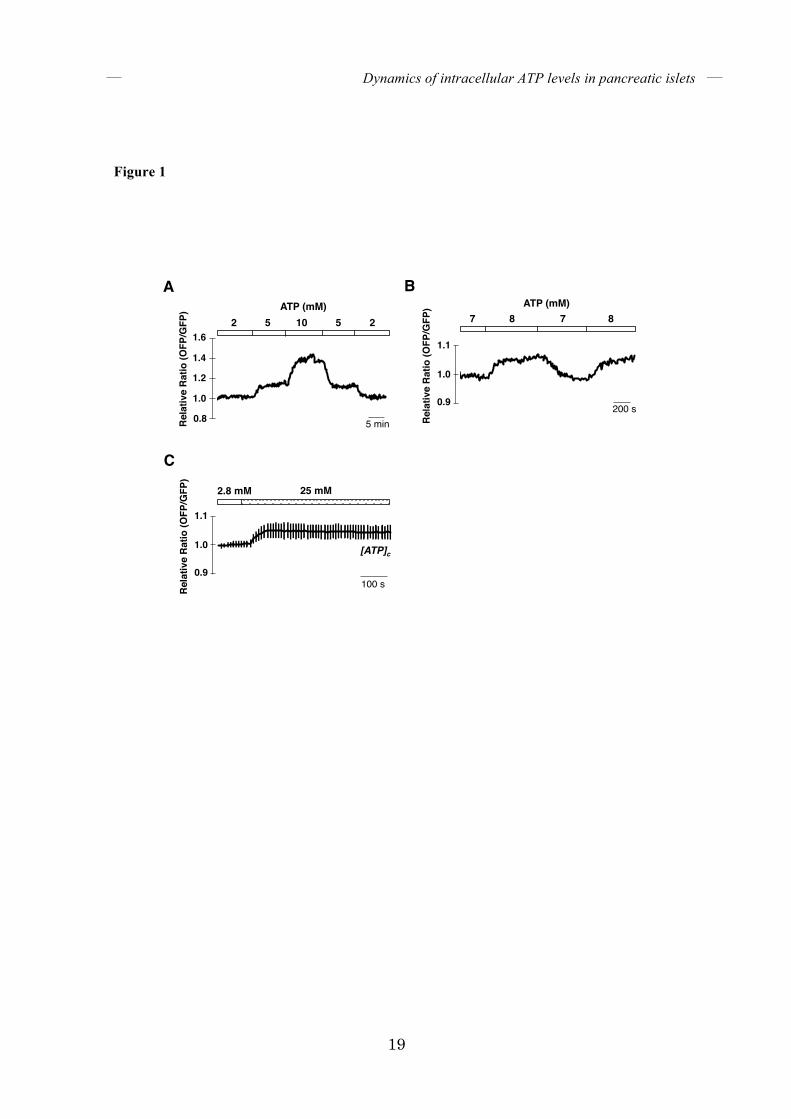
OFP/GFP emission ratio (FRET signal). To test whether GO-ATeam1 can sense ATP changes within insulin-secreting cells, we recorded FRET signals from GO-ATeam1-expressing MIN6 insulinoma cells, which were permeabilized with α-hemolysin. When the ATP concentration in the medium was altered, the FRET signal changed in an ATP concentration-dependent manner (Fig. 1A). Thus, GO-ATeam1 works properly in insulin-secreting cells. Moreover, we could monitor changes in the FRET signal when ATP levels were alternated between 7 mM and 8 mM (Fig. 1B), indicating that our system has the sensitivity to detect changes of intracellular ATP concentrations of 1 mM or less. Dynamics of [ATP]c and [ATP]m in isolated islets upon high glucose stimulation – In order to monitor ATP dynamics in insulin-secreting cells, we first expressed the GO-ATeam1 fluorescent biosensor in the cytosol of MIN6 cells. Stimulation with 25 mM glucose induced a 5 ± 2% (mean ± S.D., n = 22) FRET signal increase in 73% of monitored MIN6 cells (Fig. 1C), although the remaining cells (27%) exhibited no changes in FRET signal due to unknown reasons. We next expressed GO-ATeam1 in the cytosol of isolated mouse pancreatic islets. When a GO-ATeam1-expressing islet was stimulated by increasing the glucose concentration in the medium from low (2.8 mM) to high (25 mM), rapid increases in the FRET signal were observed (Fig. 2A). If factors besides ATP affect FRET signal of GO-ATeam1 independently of ATP binding, GO-ATeam3, which is an ATP-insensitive variant of GO-ATeam, will also show FRET changes. However, the FRET signal did not change in islets expressing GO-ATeam3 (Fig. 2B). Further, increases in FRET signal (YFP/CFP emission ratio) were also observed in
Dynamics of intracellular ATP levels in pancreatic islets
5
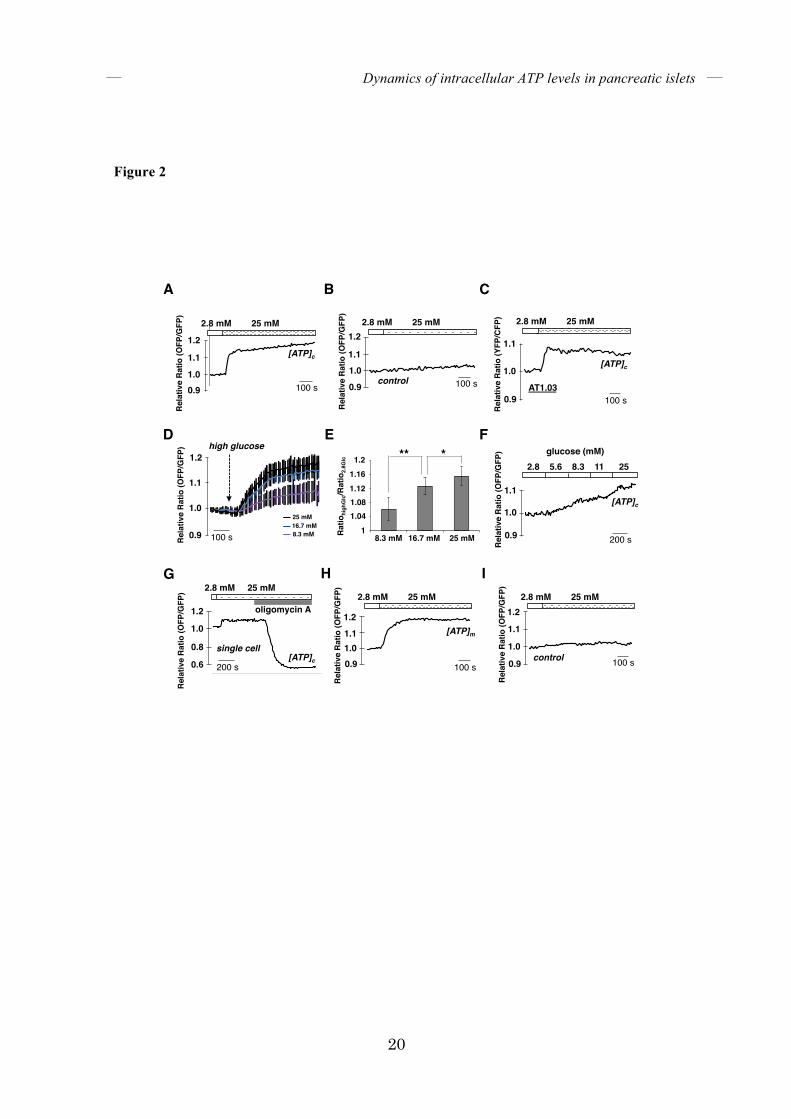
islets when ATeam1.03 was used instead of GO-ATeam1 (Fig. 2C). These results strongly suggest that the increase in FRET signal of GO-ATeam1 and ATeam1.03 after stimulation with high glucose levels is actually due to the increase in [ATP]c. The time lag between glucose stimulation and the onset of FRET signal elevation was 22 ± 6 seconds (mean ± S.D., n = 13). After the rapid increase, [ATP]c remained high. When islets were stimulated with various concentrations of glucose, [ATP]c increased rapidly in a concentration-dependent manner (Fig. 2D). We were able to observe 6 ± 3, 13 ± 2, and 15 ± 3 % (mean ± S.D., n = 10 for each) increases in FRET signals when the same islets were treated with 8.3, 16.7, and 25 mM glucose, respectively (Fig. 2E). Because 25 mM glucose stimulation, which is supra-physiological, is the most effective condition in which to observe obvious increases in FRET signals, we decided to use 25 mM glucose for high glucose stimulation. When the glucose concentration in the medium was gradually increased in a stepwise manner, rather than abruptly, [ATP]c also increased gradually (Fig. 2F). The mean amplitude of the increased FRET signal with gradually increasing glucose concentrations was not much different from that seen with an abrupt increase in glucose. FRET signals from single cells of isolated islets were also monitored (Fig. 2G). At the single cell level, 25 mM glucose stimulation caused a 11 ± 3% (mean ± S.D., n = 11) increase in FRET signal, while oligomycin A treatment caused a 40 ± 3% decrease (mean ± S.D., n = 11), compared to basal levels. Next, in order to examine whether mitochondrial energy metabolism is activated by glucose stimulation, FRET signals from a single islet expressing mitGO-ATeam1, a variant of GO-ATeam1 that is targeted to the mitochondrial
matrix, were monitored. Like [ATP]c, [ATP]m rapidly increased when islets were treated with 25 mM glucose (Fig. 2H), whereas the FRET signal of ATP-insensitive mitGO-ATeam3 did not change (Fig. 2I), indicating that mitGO-ATeam1 indeed reflected the activation of mitochondrial energy metabolism. Next, we monitored [ATP]c while decreasing the glucose concentration in the medium. Figure 3A shows a representative time course of the FRET signal in an isolated pancreatic islet alternately subjected to 2.8 and 25 mM glucose. As expected, lowering the glucose concentration decreased [ATP]c. Interestingly, the decrease in [ATP]c induced by glucose reduction was much slower than the increase in [ATP]c caused by glucose addition. This means that [ATP]c is much more responsive to an increase than a decrease in extracellular glucose. The average rate of FRET signal decline was about 6-fold slower than that of FRET signal increase (Fig. 3B). Specifically, the time required for the FRET signal to reach 50% of maximum was approximately 90 seconds after the addition of glucose, whereas approximately 340 seconds were required for the signal to fall to this level after reduction in glucose (Fig. 3C). This phenomenon is not due to the kinetic property of GO-ATeam1, because the time constants of purified GO-ATeam1 for ATP association/dissociation have been determined to be less than 10 seconds (17). Moreover, treatment with either iodoacetate, which inhibits glyceraldehyde-3-phosphate dehydrogenase in the glycolytic pathway, or oligomycin A, which inhibits FoF1-ATP synthase, rapidly reduced [ATP]c in pancreatic islets (Fig. 4), indicating that the time constants of GO-ATeam1 expressed in islets were also fast enough.
Dynamics of intracellular ATP levels in pancreatic islets
6
Dynamics of [ATP]c and [Ca2+]c in glucose-stimulated islets – The fact that ATP can block KATP channels in physiological conditions strongly suggests a scenario where the increase in [ATP]c, as a consequence of activated energy metabolism, is a first trigger of GSIS. This model assumes that [ATP]c increases prior to [Ca2+]c. In all islets investigated, elevations of [ATP]c always preceded those of [Ca2+]c when islets were treated with 25 mM glucose (Fig. 5A, B). The time lag between the onset of [ATP]c and that of [Ca2+]c increase was 96 ± 33 seconds (mean ± S.D., n = 19). This observation is consistent with two recent studies using Perceval, a genetically-encoded biosensor for the ATP/ADP ratio, in which the cytosolic ATP/ADP ratio increased prior to [Ca2+]c in the initial phase in glucose-stimulated mouse islets (14, 15). Unlike the Perceval recording, however, we did not observe a transient drop in [ATP]c
after glucose stimulation. It is noteworthy that the FRET signal of GO-ATeam is virtually unaffected by pH at physiological conditions (above pH 7), which is not the case for pH-sensitive Perceval. Moreover, although the reports using Perceval demonstrated that the ATP/ADP ratio increases prior to [Ca2+]c in GSIS, they did not address whether the initial [Ca2+]c increase can occur without the increase in ATP/ADP ratio or the actual [ATP]c. To address this question, we investigated the effects of pharmacological inhibitors of energy metabolism on [ATP]c and [Ca2+]c responses in glucose-stimulated islets. Pretreatment with either iodoacetate for about 6 minutes or oligomycin A for 1.5 to 3 minutes abrogated the glucose-induced [ATP]c increase, and, importantly, the subsequent [Ca2+]c elevation (Fig. 5C, E). On the other hand, these inhibitor treatments did not abrogate the
tolbutamide-induced elevation of [Ca2+]c (Fig. 5D, F), indicating that the cells still sustained the ability to close KATP channels and open voltage-dependent calcium channels (VDCCs) immediately after treatment with iodoacetate or oligomycin A. These results indicate that the glucose-induced increase in energy metabolism depends entirely on both glycolysis and oxidative phosphorylation activity and is most likely crucial for subsequent Ca2+ elevation. Dynamics of [ATP]c or [ATP]m together with [Ca2+]c in methyl pyruvate-stimulated islets – We next investigated whether glucose-independent insulin secretion is also mediated by the activation of energy metabolism. Pyruvate, an end product of glycolysis, enters into mitochondria and is further metabolized through the TCA cycle after conversion to acetyl-CoA. However, stimulation with pyruvate does not lead to large effects on insulin secretion in isolated β-cells, presumably due to its low membrane permeability and the low expression levels of monocarboxylate transporter in isolated β-cells (20). On the other hand, the pyruvate analog methyl pyruvate (MP) is known to induce insulin secretion from isolated β-cells. Some reports have asserted that the insulinogenic effect of MP derives from its capacity to serve as a substrate for mitochondrial energy metabolism (21, 22), but others have suggested that MP directly affects KATP channels in a metabolism-independent manner (13, 23). These conflicting reports prompted us to test whether MP has a direct effect on ATP synthesis or not. Although MP decreased the pH of the medium from 7.4 to 7.0, the FRET signal of GO-ATeam is almost unaffected in this pH range (17). We stimulated islets with MP in the absence of glucose and monitored [ATP]m or [ATP]c (Fig.
Dynamics of intracellular ATP levels in pancreatic islets
7
6A, B). MP induced rapid increases in [ATP]m and [ATP]c, prior to an increase in [Ca2+]c, even when glucose was totally depleted from the medium. Next, we investigated the effects of oligomycin A on [ATP]c and [Ca2+]c in MP-stimulated islets. Pretreatment with oligomycin A for 3 to 4 minutes abrogated the glucose-induced [ATP]c increase and the subsequent [Ca2+]c elevation (Fig. 6C). These data strongly suggest that MP induces the influx of Ca2+ by increasing energy metabolism rather than directly affecting the KATP channel. Dynamics of [ATP]c or [ATP]m together with [Ca2+]c in leucine and glutamine-stimulated islets – Genetic data indicate that a mitochondrial enzyme, glutamate dehydrogenase (GDH), is important for insulin secretion. The constitutively active form of mutated GDH leads to hyperinsulinism syndrome (24), and deletion of GDH in β-cells partly impairs the insulin secretion response (25). GDH catalyzes the reversible reaction: glutamate + NAD(P)+ ←→ α-ketoglutarate + NH4
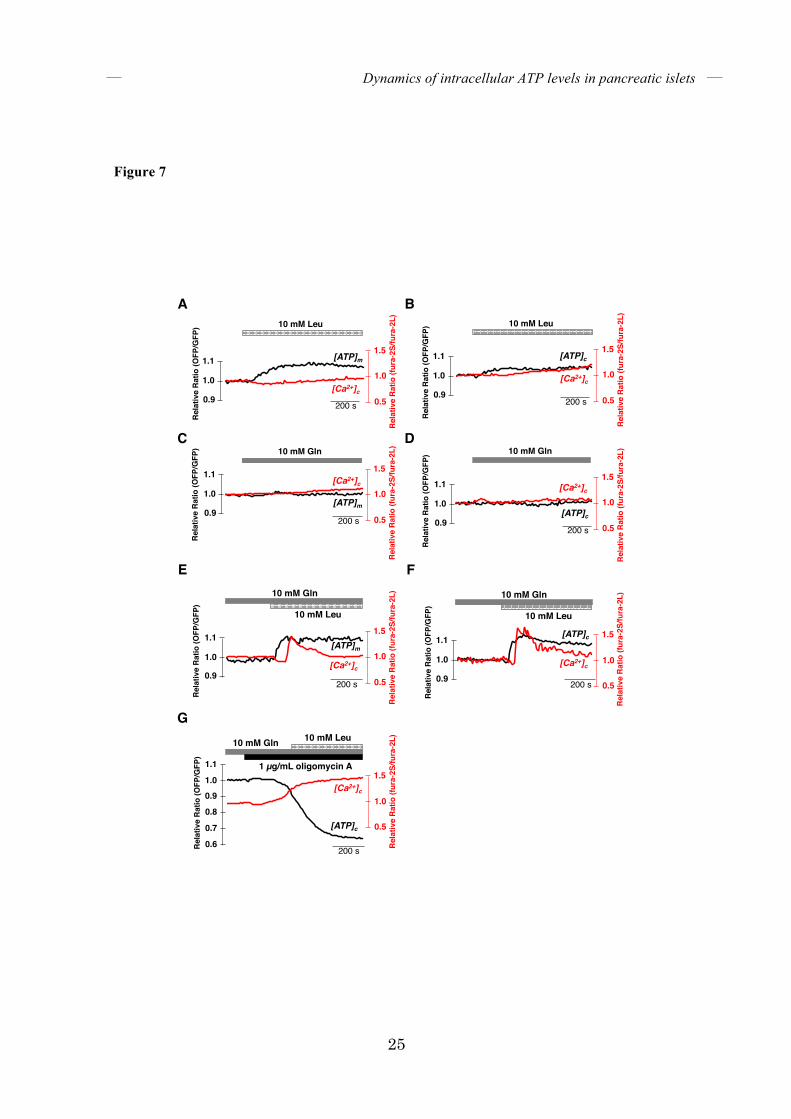
+ + NAD(P)H. It is known that leucine is an allosteric activator of GDH and an inducer of insulin secretion in pancreatic β-cells (26, 27). We hypothesized that leucine activates GDH and induces increases in ATP via the TCA cycle by conversion to α-ketoglutarate, an intermediate of the TCA cycle. Thus, we stimulated isolated islets with leucine and monitored [ATP]m and [ATP]c together with [Ca2+]c. Treatment with leucine alone induced only slight increases in both [ATP]m and [ATP]c, and did not trigger any increases in [Ca2+]c (Fig. 7A, B). Likewise, glutamine stimulation alone did not induce changes in [ATP]m and [ATP]c, or in [Ca2+]c (Fig. 7C, D). Remarkably, when islets were pretreated with glutamine, stimulation with leucine led to an increase in both [ATP]m and
[ATP]c, followed by rapid elevation of [Ca2+]c (Fig. 7E, F). Pretreatment with oligomycin A for just 3 to 5 minutes abrogated increases in [ATP]c
when glutamine-pretreated islets were stimulated with leucine. Meanwhile, [Ca2+]c gradually increased in parallel with the decrease in [ATP]c and did not rapidly increase after stimulation with leucine (Fig. 7G). These data strongly support the idea that leucine stimulation induces the activation of GDH, thereby enhancing the TCA cycle and ATP production in mitochondria, which results in Ca2+ influx in islets. Correlation between [ATP]c and oscillating [Ca2+]c in high-glucose conditions – It is well known in GSIS that [Ca2+]c, following its initial elevation, decreases and then starts to oscillate, which in turn induces oscillatory secretion of insulin (6). However, the mechanism underlying the [Ca2+] oscillation in GSIS remains controversial. One of the candidates is the oscillation of [ATP]c. In an earlier study, oscillation of [ATP]c in pancreatic islets was implied by the observation that single islets expressing firefly luciferase, which requires ATP for light emission, showed oscillatory luminescence in both low- and high-glucose conditions (28). However, in our study, as well as in other recent studies (14, 15), oscillations were not observed in low glucose conditions. Because luminescence by firefly luciferase is susceptible to various factors, including oxygen, acetyl-CoA, and availability of luciferin, it is difficult to exclude the possibility that oscillatory luminescence in luciferase-expressing islets resulted from perturbation by the above factors. A recent study showed that mitochondrial energy metabolism does not oscillate in INS-1 832/13 insulinoma cells (29). However, it is still possible that the oscillation of glycolysis drives
Dynamics of intracellular ATP levels in pancreatic islets
8
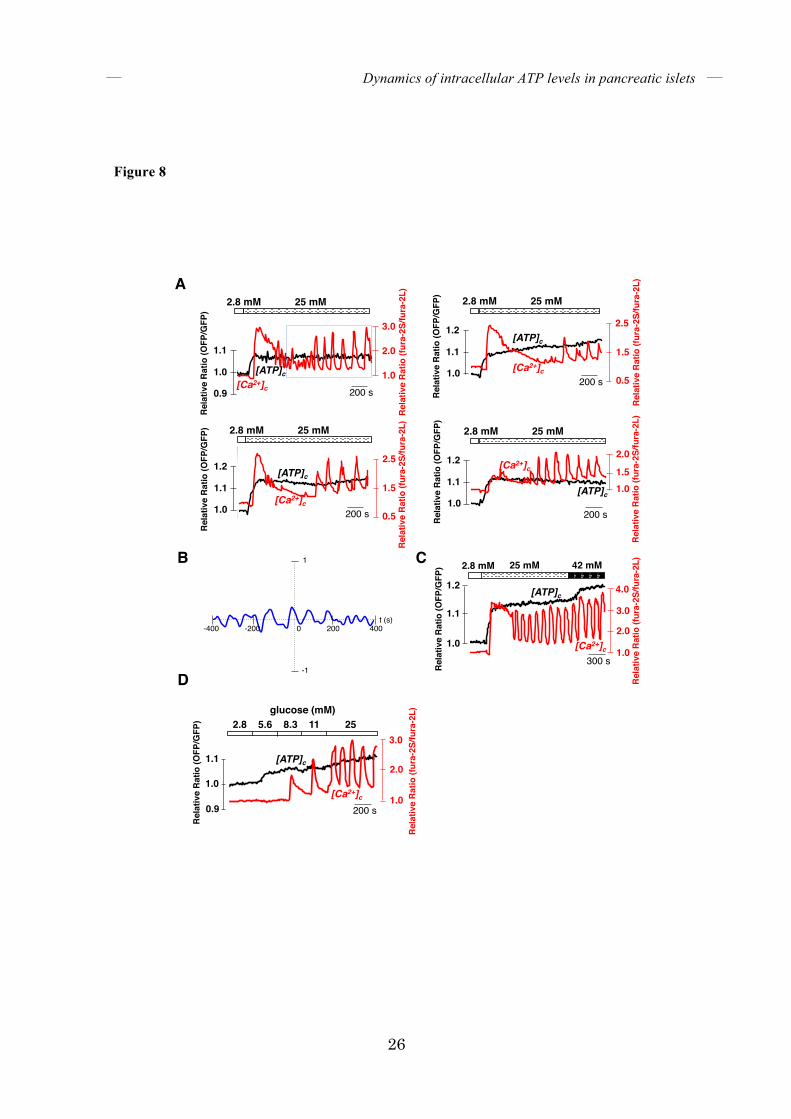
[ATP]c in pancreatic β-cells. We compared the dynamics of [ATP]c with [Ca2+]c in glucose-stimulated single islets. After stimulation with high glucose, [ATP]c increased sharply and then remained at high levels. In contrast, [Ca2+]c started to oscillate following the first burst phase. We could not observe clear oscillatory behaviors in [ATP]c even when [Ca2+]c was oscillating (Fig. 8A). At the dispersed single β-cell level, we always see that 25mM glucose caused a sustained rise in ATP levels with no clear oscillations over a period of 10 minutes (Fig. 2G); which is similar to what we observed in whole islets. Moreover, cross-correlation analyses for [ATP]c and [Ca2+]c in individual glucose-stimulated islets did not reveal any correlation between [ATP]c and [Ca2+]c dynamics during a period of Ca2+ oscillation (Fig. 8B). If the oscillation of [ATP]c occurred with the same frequency as that of [Ca2+]c, the frequency for [ATP]c should be typically less than 0.5/min. We have to note that GO-ATeam1 has enough dynamic sensitivity to detect oscillations of [ATP]c, if they were to exist (17). The FRET signal of GO-ATeam1 was not saturated in islets undergoing [Ca2+]c oscillations at 25 mM glucose because further increasing the glucose concentration to 42 mM resulted in a further elevation of the FRET signal (Fig. 8C). Next, in order to exclude the possibility that oscillation of [ATP]c is hindered by the non-physiological, abrupt increase in glucose (from 2.8 to 25 mM) in the above experiments, the glucose concentration in the medium was gradually increased in a stepwise manner. Whereas [Ca2+]c began to oscillate at 11 mM glucose, [ATP]c gradually increased with increasing glucose concentration without significant oscillations (Fig. 8D).
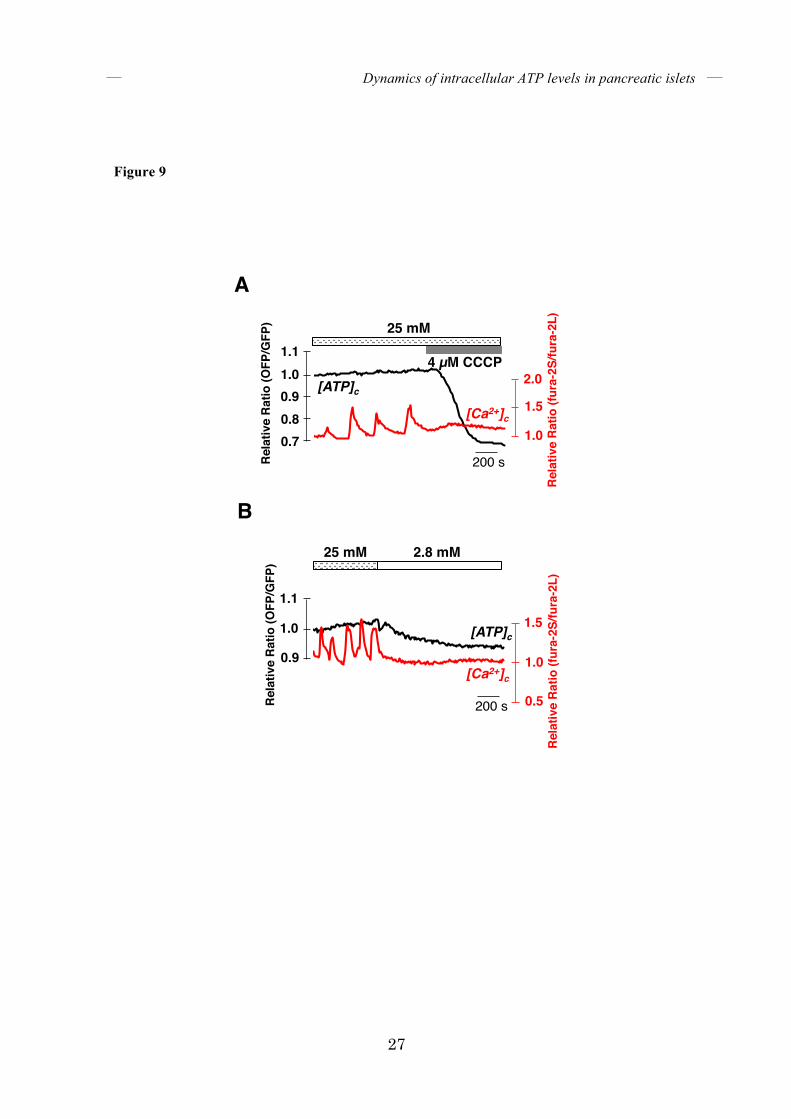
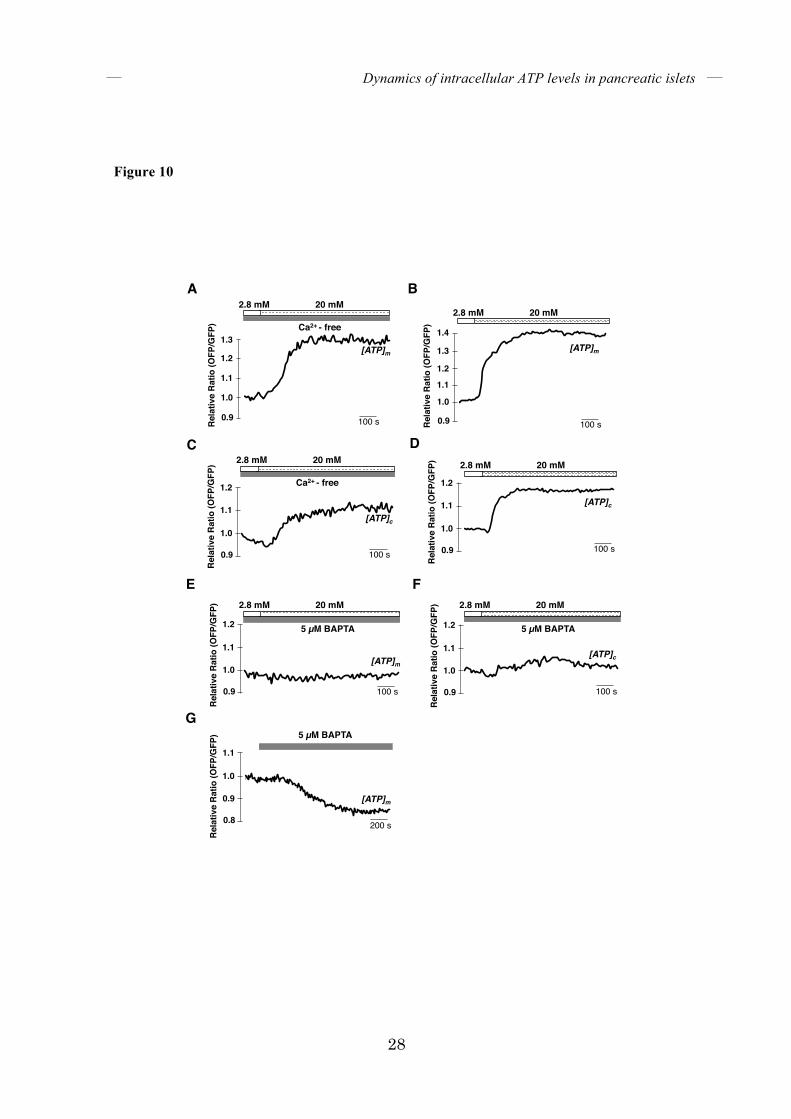
Dynamics of [ATP]c and [Ca2+]c upon arrest of energy metabolism – Whereas [Ca2+]c oscillated in the second phase of GSIS, [ATP]c was sustained at high levels. We investigated whether sustained high [ATP]c is necessary for the oscillation of [Ca2+]c. Treatment of islets that were pretreated with high glucose, with CCCP, an uncoupler of mitochondrial membrane potential, resulted in the rapid cessation of [Ca2+]c oscillation (Fig. 9A). Likewise, [Ca2+]c oscillations also stopped immediately after the glucose concentration was lowered from 25 mM to 2.8 mM (Fig. 9B). In both cases, [Ca2+]c oscillation stopped as soon as [ATP]c began to decrease. It is most likely that sustained high [ATP]c and/or high energy metabolism is required for islets to continue to exhibit [Ca2+]c oscillations in GSIS. Dynamics of [ATP]c and [ATP]m upon depletion of either extracellular or intracellular Ca2+ – Finally, we investigated the role of Ca2+ on glucose-induced intracellular ATP elevation. Ca2+ is known to enhance the activities of several mitochondrial dehydrogenases in the TCA cycle (30). Indeed, buffering of mitochondrial Ca2+ resulted in reduced insulin secretion in isolated rat islets (31). Several molecules have been implicated in Ca2+ transport to the mitochondria (32-35). Of these, a Ca2+-sensitive mitochondrial uniporter called MCU is involved in mitochondrial Ca2+ homeostasis in pancreatic islets because its silencing impairs mitochondrial Ca2+ uptake in isolated islets (9). In the particular context of glucose stimulation, however, it has been unclear where the mitochondrial Ca2+ comes from. First, we investigated the role of extracellular Ca2+. We depleted Ca2+ from the medium and monitored ATP levels. When the glucose concentration in the medium was
Dynamics of intracellular ATP levels in pancreatic islets
9
increased from 2.8 to 20 mM, the corresponding increases in both [ATP]m (Fig. 10A) and [ATP]c
(Fig. 10C) were similar to the increases in [ATP]m and [ATP]c observed in islets cultured with normal Ca2+-containing medium (Fig. 10B, D). To test the requirement of the intracellular Ca2+ pool, BAPTA-AM, a chelator of intracellular Ca2+, was added. Pretreatment of islets with BAPTA-AM almost completely suppressed the increases in both [ATP]m (Fig. 10E) and [ATP]c (Fig. 10F) after glucose stimulation. Moreover, treatment of islets cultured in low-glucose medium with BAPTA-AM decreased [ATP]m (Fig. 10G). These data indicate that intracellular Ca2+, rather than extracellular Ca2+, is required for glucose-induced ATP elevation and for maintaining basal intracellular ATP levels. DISCUSSION In this paper, we fluorescently imaged the dynamics of both [ATP]c and [Ca2+]c in single isolated mouse pancreatic islets, using a genetically encoded FRET-based ATP biosensor, GO-ATeam1, and a fluorescent Ca2+ dye, fura-2. We demonstrated that stimulation of islets with glucose, MP, or leucine/glutamine all induced rapid increase of [ATP]c, followed by that of [Ca2+]c. These results are almost consistent with a recent report that glucose-induced ATP/ADP ratio elevation is followed by depolarization of plasma membrane and [Ca2+]c rise (14). Pharmacological inhibition of energy metabolism blocked increases of both [ATP]c and [Ca2+]c in all situations, indicating that increase in ATP production or energy metabolism is the fundamental mechanism that triggers the [Ca2+]c burst in the initial phase of GSIS, as well as both MP-stimulated and leucine/glutamine-stimulated insulin secretion.
Oscillation of [Ca2+]c in the second phase of GSIS is a typical feature of islets or β-cells (6, 7, 8) and is assumed to be required for pulsatile insulin secretions (6). For the generation of such Ca2+ oscillation, oscillatory activities of the KATP channel have been implicated by the observation that islets of Kir6.2-/- mice exhibited high non-oscillatory intracellular Ca2+ levels after glucose or tolbutamide stimulation (36). To explain the oscillatory activities of the KATP channel, it has long been believed that intracellular ATP levels also oscillate during the insulin secretion. In contrast to this generally believed view, however, we did not observe any significant oscillations of [ATP]c in isolated mouse pancreatic islets and in single islet cells during GSIS. Consistent with this, it has been also shown that mitochondrial bioenergetic activities do not oscillate in glucose- or pyruvate-stimulated INS-1 832/13 cells (29). Conversely, a recent study has reported that [Ca2+] oscillation in glucose-stimulated isolated mouse islet cells induces small oscillation of ATP levels near the plasma membrane ([ATP]pm) (15). This small local oscillation of ATP level was, however, suggested to be a result of enhanced local ATP consumption by increased Ca2+ (15). It is notable that GO-ATeam1 is able to detect [ATP]c changes of approximately 1 mM in insulin-secreting cells (Fig. 1). Thus, the amplitude of [ATP]c oscillation would be much less than 1 mM, even if it exists. Given that mitochondria supply large amount of ATP to bulk cytosolic space, it is not surprising that the bulk cytosolic ATP levels inside pancreatic β-cells are almost constant in the second phase of GSIS even when [ATP]pm oscillates. Alternation of FRET signal of GO-ATeam1 by both glucose-stimulation and metabolic inhibitors indicates that [ATP]c of pancreatic
Dynamics of intracellular ATP levels in pancreatic islets
10
β-cell is within the dynamic range of the biosensor, which is about 2-20 mM (Fig. 1 and ref. 17). Apparently, this high concentration of cytosolic ATP could not regulate the KATP channel in β-cells, since the channel is blocked by the Mg2+-unbound form of ATP with an approximate Ki value of 10 µM (3, 37). However, Mg2+-unbound form of ATP exists at quite low levels inside cells, because of the high affinity of ATP to Mg2+. Indeed, the most of KATP channel activity is blocked by physiological ATP levels in the presence of Mg2+ (2). Only slight increases of ATP levels, thus, could be sufficient for switching off the activity of the KATP channel. Our data, presented in this study, collectively supported the possibility that sustained high levels of [ATP]c via energy metabolism, rather than its oscillation, are required for maintaining the oscillation of [Ca2+]c of pancreatic β-cells. However, we could not currently exclude the possibility that slight oscillation of free ATP levels is causative for the production of oscillatory KATP channel activities, and thus further examinations are required to fully answer the question as to how oscillatory KATP channel activities are created. Alternation of energy metabolism will also affect intracellular ADP level. It was reported that Mg2+-bound ADP antagonizes the ATP binding of KATP channels (38). Thus, it is also possible that not only ATP levels but also ADP levels (or ATP/ADP ratio) are involved in the regulation of KATP channels
in GSIS. However, because no technique to specifically monitor ADP in living culture cells is currently available, it is quite difficult to know ADP dynamics in islet. If a genetically encoded biosensor for ADP is established, it will contribute to more detailed understanding of the mechanism of opening and closing of KATP channels. Another notable finding is that the uncoupling of mitochondria or reduction of medium glucose levels immediately arrested oscillation of [Ca2+]c with a slight drop in [ATP]c (Fig. 9A and B), suggesting that β-cells are able to sense a small decrease in energy supply, namely a blood glucose levels, probably sensing a slight reduction in [ATP]c. This system would be suitable for maintaining the energy homeostasis of the whole body. If complete depletion of [ATP]c to the basal level were required to halt oscillation of [Ca2+]c, a significant amount of insulin would continue to be secreted even at low blood glucose levels, leading to hypoglycemia. The dysfunction of β-cells is one of the hallmarks of type 2 diabetes, in which insulin secretion is attenuated even after glucose stimulation (39-43). According to our imaging data, maintaining elevated [ATP]c must be necessary for insulin secretion, so it is conceivable that the dynamics of [ATP]c is impaired in islets of diabetic mouse models or human patients.
Dynamics of intracellular ATP levels in pancreatic islets
11
REFERENCES
1. Ashcroft, F. M., Proks, P., Smith, P. A., Ammälä, C., Bokvist, K., and Rorsman, P. (1994)
Stimulus-secretion coupling in pancreatic β-cells. J. Cell. Biochem. 55, suppl, 54-65
2. Ashcroft, F. M. (2000) ATP-sensitive potassium channelopathies: focus on insulin secretion.
J. Clin. Invest. 115, 2047-2058
3. Inagaki, N., Gonoi, T., Clement, J. P. 4th., Namba, N., Inazawa, J., Gonzalez, G.,
Aguilar-Bryan, L., Seino, S., and Bryan, J. (1995) Reconstitution of IKATP: an inward
rectifier subunit plus the sulfonylurea receptor. Science 270, 1166-1170
4. Inagaki, N., and Seino, S. (1998) ATP-sensitive potassium channels: structures, functions
and pathophysiology. Jpn. J. Physiol. 48, 397-412
5. Miki, T., Tashiro, F., Iwanaga, T., Nagashima, K., Yoshitomi, H., Aihara, H., Nitta, Y.,
Gonoi, T., Inagaki, N., Miyazaki, J., and Seino, S. (1997) Abnormalities of pancreatic islets
by targeted expression of a dominant-negative KATP channel. Proc. Natl. Acad. Sci. USA 94,
11969-11973
6. Gilon, P., Shepherd, R. M., and Henquin, J. C. (1993) Oscillations of secretion driven by
oscillations of cytoplasmic Ca2+ as evidenced in single pancreatic islets. J. Biol. Chem. 268,
22265-22268
7. Gilon, P., and Henquin, J. C. (1992) Influence of membrane potential changes on
cytoplasmic Ca2+ concentration in an electrically excitable cell, the insulin-secreting
pancreatic Β-cell. J. Biol. Chem. 267, 20713-20720
8. Tengholm, A., and Gylfe, E. (2009) Oscillatory control of insulin secretion. Mol. Cell.
Endocri. 297, 58-72
9. Ghosh, A., Ronner, P., Cheong, E., Khalid, P., and Matschinky, F. M. (1991) The role of
ATP and free ADP in metabolic coupling during fuel-stimulated insulin release from islet
β-cells in the isolated perfused rat pancreas. J. Biol. Chem. 266, 22887-22892
10. Lorenz, M. A., El Azzouny, M. A., Kennedy, R. T., and Burant, C. F. (2013) Metabolome
response to glucose in the β-cell line INS-1 832/13. J. Biol. Chem. 288, 10923-10935
11. Bo Hellman, M. D., Lars-Ake Idahl, M. K., and Ake Danielsson, M. K. (1969) Adenosine
triphosphate levels of mammalian pancreatic B cells after stimulation with glucose and
hypoglycemic sulfonylureas. Diabetes 18, 509-516
12. Ashcroft, S. J. H., Weerasinghe, L. C. C., and Randle, P. J. (1973) Interrelationship of islet
metabolism, adenosine triphosphate content and insulin release. Biochem. J. 132, 223-231
Dynamics of intracellular ATP levels in pancreatic islets
12
13. Düfer, M., Krippeit-Drews, P., Buntinas, L., Slemen, D., and Drews, G. (2002) Methyl
pyruvate stimulates pancreatic β-cells by direct effect on KATP channels, and not as a
mitochondrial substrate. Biochem. J. 368, 817-825
14. Tarasov, A. I., Semplici, F., Ravier, M. A., Bellomo, E. A., Pullen, T. J., Gilon, P., Sekler, I.,
Rizzuto, R., and Rutter, G. A. (2012) The mitochondrial Ca2+ uniporter MCU is essential
for glucose-induced ATP increases in pancreatic β-cells. PLoS ONE 7, e39722
15. Li, J., Shuai, H. Y., Gylfe, E., and Tengholm, A. (2013) Oscillations of sub-membrane ATP
in glucose-stimulated beta cells depend on negative feedback from Ca2+. Diabetologia 56,
1577-1586
16. Imamura, H., Nhat, K. P., Togawa, H., Saito, K., Iino, R., Kato-Yamada, Y., Nagai, T., and
Noji, H. (2009) Visualization of ATP levels inside single living cells with fluorescence
resonance energy transfer-based genetically encoded indicators. Proc. Natl. Acad. Sci. USA
106, 15651-15656
17. Nakano, M., Imamura, H., Nagai, T., and Noji, H. (2011) Ca2+ regulation of mitochondrial
ATP synthesis visualized at the single cell level. ACS. Chem. Biol. 6, 709-715
18. Miyazaki, J., Araki, K., Yamamoto, E., Ikegami, H., Asano, T., Shibasaki, Y., Oka, Y., and
Yamamura, K. (1990) Establishment of a pancreatic β cell line that retains
glucose-inducible insulin secretion: special reference to expression of glucose transporter
isoform. Endocrinology 127, 126-132
19. Terasawa, S., Fukuoka, H., Inoue, Y., Sagawa, T., Takahashi, H., and Ishijima, A. (2011)
Coordinated reversal of flagellar motors on a single Escherichia coli cell. Biophys. J. 100,
2193-2200
20. Pullen, T. J., da Silva Xavier, G., Kelsey, G., and Rutter, G. A. (2011) MiR-29a and
miR-29b contribute to pancreatic β-cell-specific silencing of monocarboxylate transporter 1
(Mct1). Mol. Cel. Biol. 31, 3182-3194
21. Mertz, R. J., Worley, J. F., Spencer, B., Johnson, J. H., and Dukes, I. D. (1996) Activation
of stimulus-secretion coupling in pancreatic β-cells by specific products of glucose
metabolism. J. Biol. Chem. 271, 4838-4845
22. Zawalich, W. S., and Zawalich, K. C. (1997) Influence of pyruvic acid methyl ester on rat
pancreatic islets. J. Biol. Chem. 272, 3527-3531
23. Lembert, N., Joes, H. C., Idahl, L. A., Ammon, H. P., and Wahl, M. A. (2001) Methyl
pyruvate initiates membrane depolarization and insulin release by metabolic factors other
than ATP. Biochem. J. 354, 345-350
Dynamics of intracellular ATP levels in pancreatic islets
13
24. Stanley, C. A., Lieu, Y. K., Hsu, B. Y., Burlina, A. B., Greenberg, C. R., Hopwood, N, J.,
Perlman, K., Rich, B. H., Zammarchi, E., and Poncz, M. (1998) Hyperinsulinism and
hyperammonemia in infants with regulatory mutations of the glutamate dehydrogenase gene.
N. Engl. J. Med. 338, 1352-1357
25. Carobbio, S., Frigerio, F., Rubi, B., Vetterli, L., Bloksgaard, M., Gjinoxci, A.,
Pournourmohammadi, S., Herrera, P. L., Reith, W., Mandrup, S., and Maechler, P. (2009)
Deletion of glutamate dehydrogenase in β-cells abolishes part of the insulin secretory
response not required for glucose homeostasis. J. Biol. Chem. 284, 921-929
26. Li, C., Najafi, H., Daikhin, Y., Nissim, I. B., Collins, H. W., Yudkoff, M., Matschinsky, F.
M., and Stanley, C. A. (2003) Regulation of leucine-stimulated insulin secretion and
glutamine metabolism in isolated rat islets. J. Biol. Chem. 278, 2853-2858
27. Fahien, L. A., and Macdonald, M. J. (2011) The complex mechanism of glutamate
dehydrogenase in insulin secretion. Diabetes 60, 2450-2454
28. Ainscow, E. K., and Rutter, G. A. (2002) Glucose-stimulated oscillations in free cytosolic
ATP concentration imaged in single islet β-cells: evidence for a Ca2+-dependent mechanism.
Diabetes 51, S162-S170
29. Goehring, I., Gerencser, A. A., Schmidt, S., Brand, M. D., Mulder, H., and Nicholls, D. G.
(2012) Plasma membrane potential oscillations in insulin secreting Ins-1 823/13 cells do not
require glycolysis and are not initiated by fluctuations in mitochondrial bioenergetics. J.
Biol. Chem. 287, 15706-15717
30. McCormack, J. G., Halestrap, A. P., and Denton, R. M. (1990) Role of calcium ions in
regulation of mammalian intramitochondrial metabolism. Physiol. Rev. 70, 391-425
31. Wiederkehr, A., Szanda, G., Akhmedov, D., Mataki, C., Heizmann, C. W., Schoonjans, K.,
Pozzan, T., Spät, A., and Wollheim, C. B. (2011) Mitochondrial matrix calcium is an
activating signal for hormone secretion. Cell. Metab. 13, 601-611
32. Stefani, D. D., Raffaello, A., Teardo, E., Szabo, I., and Rizzuto, R. (2011) A
forty-kilodalton protein of inner membrane is the mitochondrial calcium uniporter. Nature
476, 336-340
33. Baughman, J. M., Perocchi, F., Girgis, H. S., Plovanich, M., Belcher-Timme, C. A., Sancak,
Y., Bao, X. R., Strittmatter, L., Goldberger, O., Bogorad, R. L., Koteliansky, V., and
Mootha, V. K. (2011) Integrative genomics identifies MCU as an essential component of
mitochondrial calcium uniporter. Nature 476:341-345
34. Jiang, D., Zhao, L., and Clapham, D. E. (2009) Genome-wide RNAi screen identified
Dynamics of intracellular ATP levels in pancreatic islets
14
Letm1 as a mitochondrial Ca2+/H+ antiporter. Science 326, 144-147
35. Trenker, M., Malli, R., Fertschai, I., Levak-Frank, S., and Graier, W. F. (2007) Uncoupling
protein 2 and 3 are fundamental for mitochondrial Ca2+ uniport. Nat. Cell. Biol. 9, 445-452
36. Miki, T., Nagashima, K., Tashiro, F., Kotake, K., Yoshitomi, H., Tamamoto, A., Gonoi, T.,
Iwanaga, T., Miyazaki, J., and Seino, S. (1998) Defective insulin secretion and enhanced
insulin action in KATP channel-deficient mice. Proc. Natl. Acad. Sci. USA 95, 10402-10406
37. Gribble, F. M., Tucker, S. J., Haug, T., and Ashcroft, F. M. (1998) MgATP activates the β
cell KATP channel by interaction with its SUR1 subunit. Proc. Natl. Acad. Sci. USA 95,
7185-7190
38. Ueda, K., Inagaki, N., and Seino, S. (1997) MgADP antagonism to Mg2+-independent ATP
binding of the sulfonylurea receptor SUR1. J. Biol. Chem. 272, 22983-22986
39. Pratley, R. E., and Weyer, C. (2001) The role of impaired early insulin secretion in the
pathogenesis of TypeⅡ diabetes mellitus. Diabetaologia 44, 929-945
40. Anello, M., Lupi, R., Spampinato, D., Piro, S., Masini, M., Boggi, U., Del Prato, S.,
Rabuazzo, A. M., Purrello, F., and Marchetti, P. (2005) Functional and morphological
alterations of mitochondria in pancreatic beta cells from Type 2 diabetic patients.
Diabetologia 48, 282-289
41. Maechler, P., and Wollheim, C. B. (2001) Mitochondrial function in normal and diabetic
β-cells. Nature 414, 807-812
42. Yoshihara, E., Fujimoto, S., Inagaki, N., Okawa, K., Masaki, S., Yodoi, J., and Masutani, H.
(2010) Disruption of TBP-2 ameliorates insulin sensitivity and secretion without affecting
obesity. Nat. Commun. 1, 127
43. Ohtsubo, K., Chen, M. Z., Olefsky, J. M., and Marth, J. D. (2011) Pathway to diabetes
through attenuation of pancreatic beta cell glycosylation and glucose transport. Nat. Med.
17, 1067-1076
Acknowledgements - This work was supported in part by Grants-in-Aid for Scientific Research
22590977 (to K.N.) and by Platform for Dynamic Approaches to Living System (to T.T and
H.I.) from the Ministry of Education, Culture, Sports, Science, and Technology in Japan, as
well as by Precursory Research for Embryonic Science (to H.I.) from the Japan Science and
Technology Agency. We greatly appreciate the gifts of MIN6 cells from Dr. Jun-ichi Miyazaki
(Osaka University). We also thank Dr. James Hejna (Kyoto University) for his critical

Dynamics of intracellular ATP levels in pancreatic islets
15
assessment of this manuscript.
FIGURE LEGENDS
FIGURE 1. Validation of GO-ATeam in insulin-secreting cells. Time course of the
fluorescence emission ratio (OFP/GFP) in permeabilized MIN6 cells expressing GO-ATeam1
biosensors in the cytosol. (A) After permeabilization, cells were perfused with intracellular-like
medium including different concentrations (2–10 mM) of MgATP (n = 9). (B) After
permeabilization, cells were alternately perfused with intracellular-like medium including 7 or 8
mM MgATP (n = 10). (C) Average time course of the fluorescence emission ratio (OFP/GFP)
of MIN6 cells expressing GO-ATeam1 biosensors in the cytosol. OFP/GFP ratios were
monitored when medium glucose was increased from 2.8 to 25 mM (n = 22). Cells that did not
exhibit clear increases in response to changing glucose levels were excluded from the data
analysis. Error bars indicate the standard deviation (SD).
FIGURE 2. Glucose stimulation induces a rapid increase in cytosolic and mitochondrial
ATP levels in single isolated mouse islets. (A, B) Time course of the fluorescence emission
ratio (OFP/GFP) of isolated islets expressing GO-ATeam biosensors in the cytosol. OFP/GFP
ratios of GO-ATeam1 (A) or GO-ATeam3 (B) were monitored when medium glucose was
increased from 2.8 to 25 mM (n = 13 and 4, respectively). (C) Time course of the fluorescence
emission ratio (YFP/CFP) of isolated islets expressing ATeam1.03 (AT1.03) biosensors in the
cytosol. YFP/CFP ratios were monitored when medium glucose was increased from 2.8 to 25
mM (n = 4). (D) The average time course of OFP/GFP ratios of isolated islets expressing
GO-ATeam1. OFP/GFP ratios were monitored in the same islets when glucose was increased
from 2.8 to 8.3, 16.7, and 25 mM (n = 10). Error bars indicate standard deviation (SD). (E) The
amplitudes of OFP/GFP ratio changes were quantified in various glucose conditions shown in
(D). Error bars indicate the standard deviation (SD) and asterisks indicate significant differences.
*P < 0.05, and **P < 0.0001. (F) Time course of OFP/GFP ratios of isolated islets stimulated
with various levels of glucose. Glucose levels were increased in a stepwise manner from 2.8 to
25 mM (n = 8). (G) Time course of the fluorescence emission ratio (OFP/GFP) of single cells
isolated from islets expressing GO-ATeam1. The OFP/GFP ratio was monitored when glucose
in the medium was increased from 2.8 to 25 mM, followed by 5 µg/mL oligomycin A addition
(n = 11). (H, I) Time course of the fluorescence emission ratio (OFP/GFP) of isolated islets
expressing GO-ATeam biosensors in the mitochondrial matrix. OFP/GFP ratios of
Dynamics of intracellular ATP levels in pancreatic islets
16
mitGO-ATeam1 (H) or mitGO-ATeam3 (I) were monitored (n = 7 and 4, respectively).
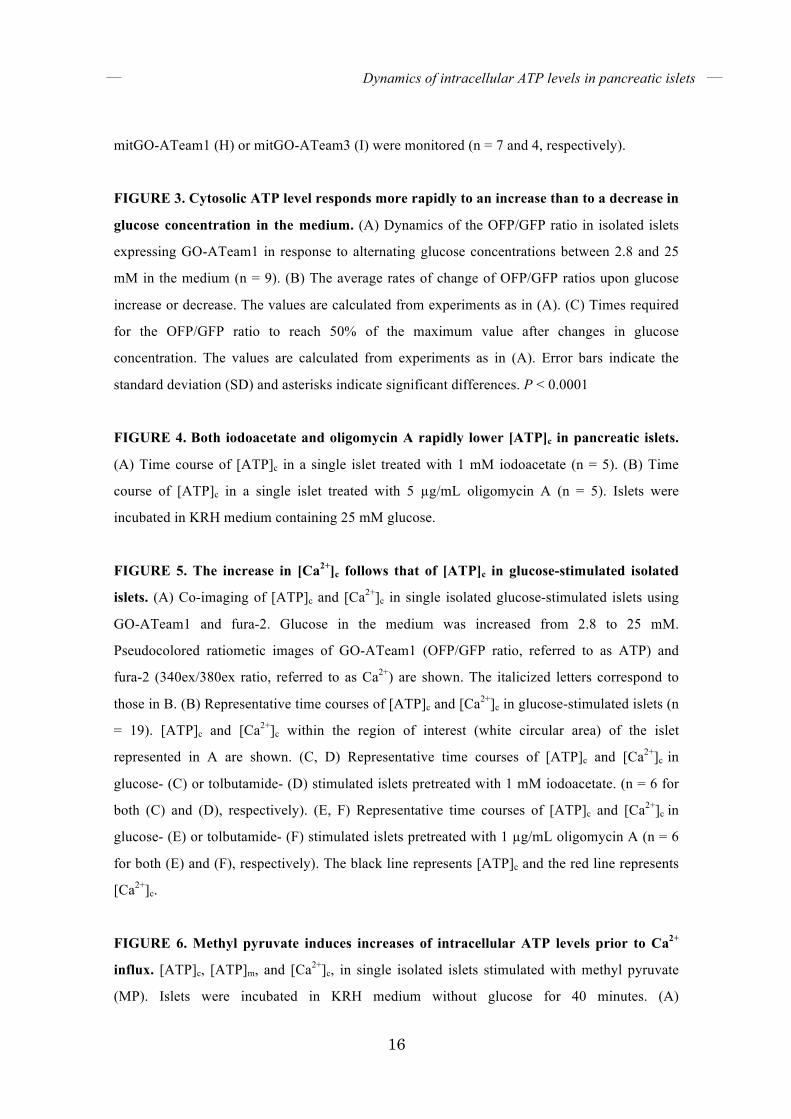
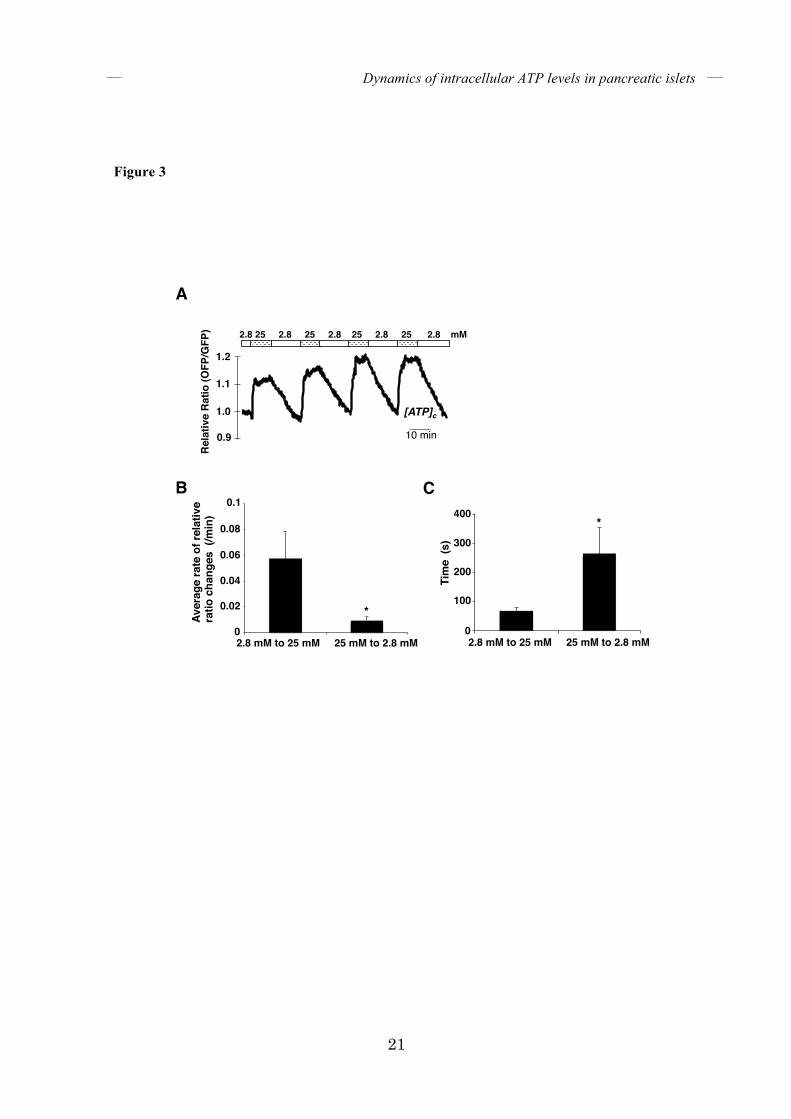
FIGURE 3. Cytosolic ATP level responds more rapidly to an increase than to a decrease in
glucose concentration in the medium. (A) Dynamics of the OFP/GFP ratio in isolated islets
expressing GO-ATeam1 in response to alternating glucose concentrations between 2.8 and 25
mM in the medium (n = 9). (B) The average rates of change of OFP/GFP ratios upon glucose
increase or decrease. The values are calculated from experiments as in (A). (C) Times required
for the OFP/GFP ratio to reach 50% of the maximum value after changes in glucose
concentration. The values are calculated from experiments as in (A). Error bars indicate the
standard deviation (SD) and asterisks indicate significant differences. P < 0.0001
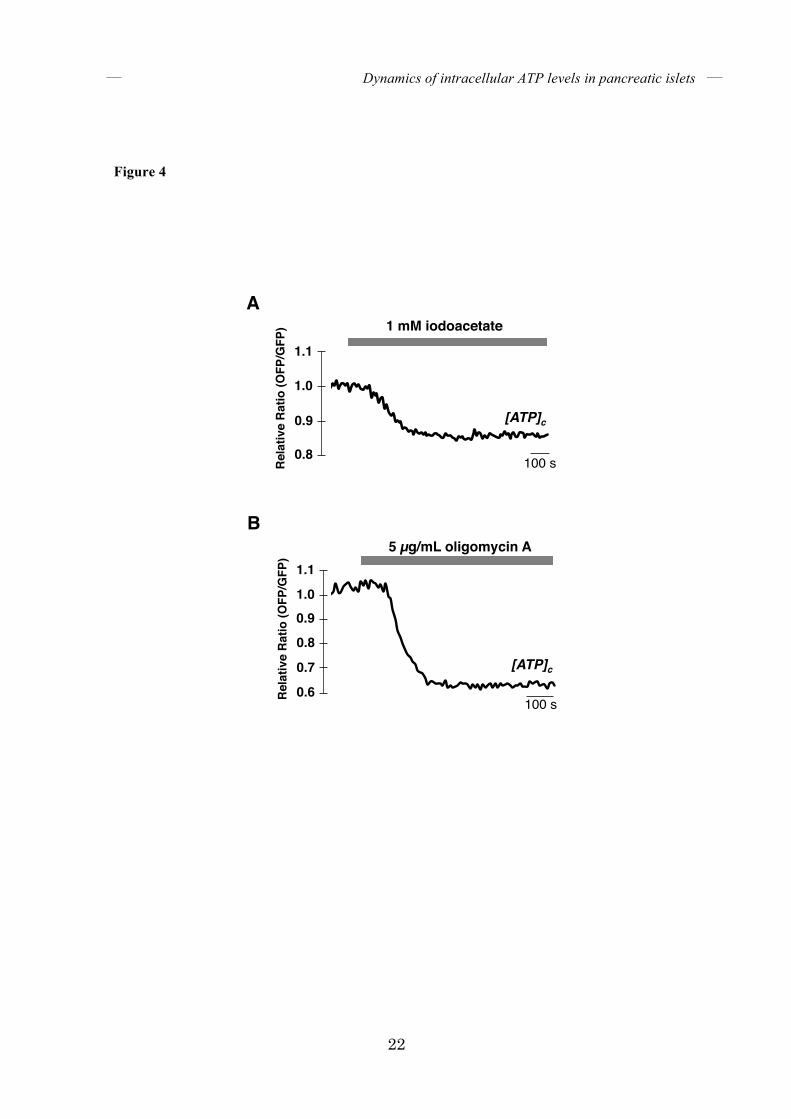
FIGURE 4. Both iodoacetate and oligomycin A rapidly lower [ATP]c in pancreatic islets.
(A) Time course of [ATP]c in a single islet treated with 1 mM iodoacetate (n = 5). (B) Time
course of [ATP]c in a single islet treated with 5 µg/mL oligomycin A (n = 5). Islets were
incubated in KRH medium containing 25 mM glucose.
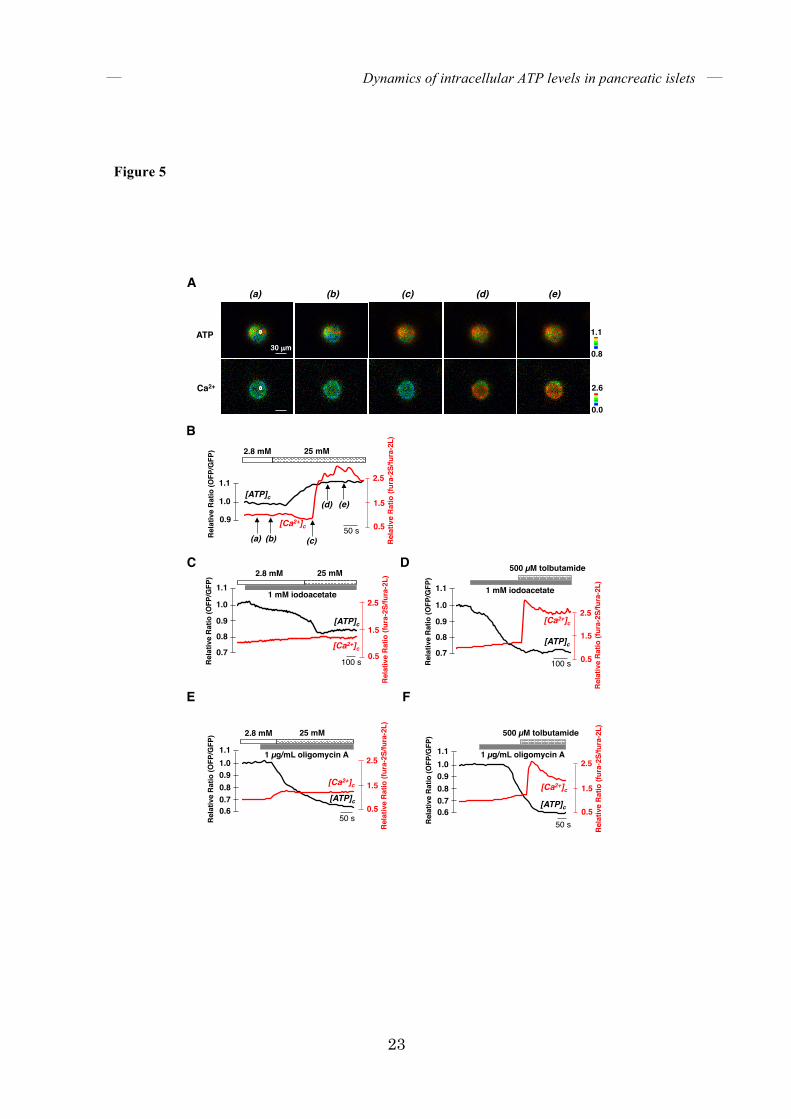
FIGURE 5. The increase in [Ca2+]c follows that of [ATP]c in glucose-stimulated isolated
islets. (A) Co-imaging of [ATP]c and [Ca2+]c in single isolated glucose-stimulated islets using
GO-ATeam1 and fura-2. Glucose in the medium was increased from 2.8 to 25 mM.
Pseudocolored ratiometic images of GO-ATeam1 (OFP/GFP ratio, referred to as ATP) and
fura-2 (340ex/380ex ratio, referred to as Ca2+) are shown. The italicized letters correspond to
those in B. (B) Representative time courses of [ATP]c and [Ca2+]c in glucose-stimulated islets (n
= 19). [ATP]c and [Ca2+]c within the region of interest (white circular area) of the islet
represented in A are shown. (C, D) Representative time courses of [ATP]c and [Ca2+]c in
glucose- (C) or tolbutamide- (D) stimulated islets pretreated with 1 mM iodoacetate. (n = 6 for
both (C) and (D), respectively). (E, F) Representative time courses of [ATP]c and [Ca2+]c in
glucose- (E) or tolbutamide- (F) stimulated islets pretreated with 1 µg/mL oligomycin A (n = 6
for both (E) and (F), respectively). The black line represents [ATP]c and the red line represents
[Ca2+]c.
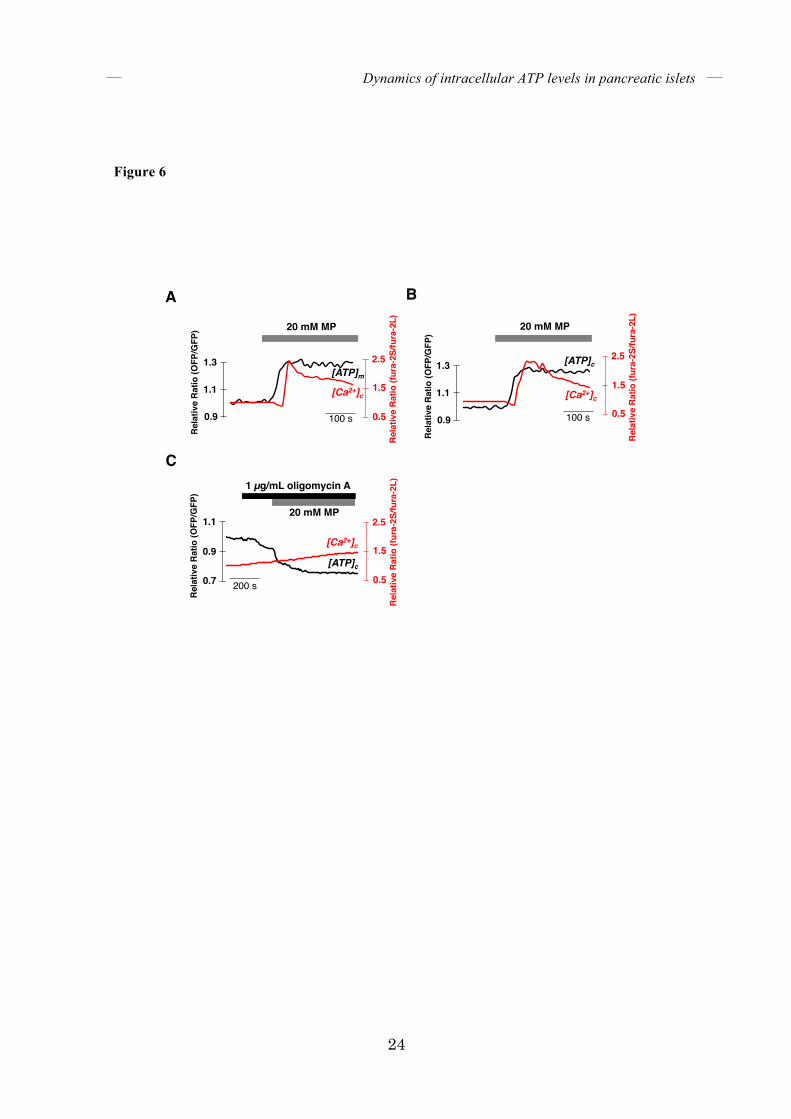
FIGURE 6. Methyl pyruvate induces increases of intracellular ATP levels prior to Ca2+
influx. [ATP]c, [ATP]m, and [Ca2+]c, in single isolated islets stimulated with methyl pyruvate
(MP). Islets were incubated in KRH medium without glucose for 40 minutes. (A)
Dynamics of intracellular ATP levels in pancreatic islets
17
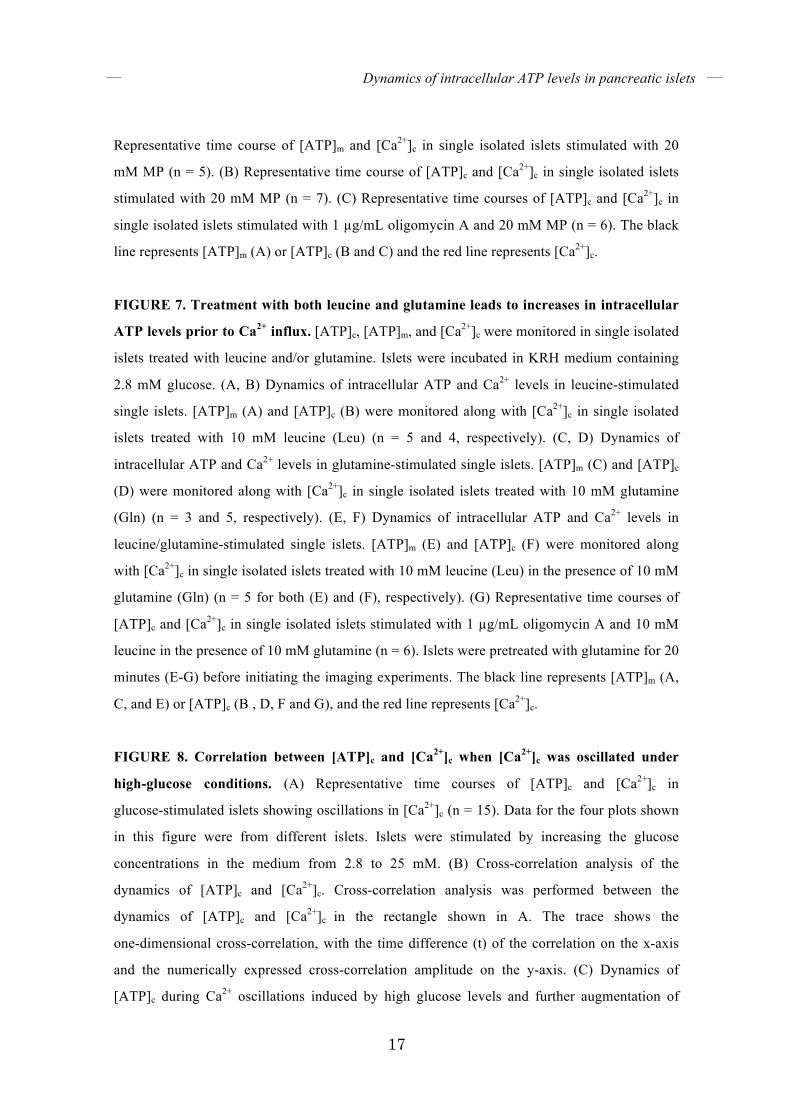
Representative time course of [ATP]m and [Ca2+]c in single isolated islets stimulated with 20
mM MP (n = 5). (B) Representative time course of [ATP]c and [Ca2+]c in single isolated islets
stimulated with 20 mM MP (n = 7). (C) Representative time courses of [ATP]c and [Ca2+]c in
single isolated islets stimulated with 1 µg/mL oligomycin A and 20 mM MP (n = 6). The black
line represents [ATP]m (A) or [ATP]c (B and C) and the red line represents [Ca2+]c.
FIGURE 7. Treatment with both leucine and glutamine leads to increases in intracellular
ATP levels prior to Ca2+ influx. [ATP]c, [ATP]m, and [Ca2+]c were monitored in single isolated
islets treated with leucine and/or glutamine. Islets were incubated in KRH medium containing
2.8 mM glucose. (A, B) Dynamics of intracellular ATP and Ca2+ levels in leucine-stimulated
single islets. [ATP]m (A) and [ATP]c (B) were monitored along with [Ca2+]c in single isolated
islets treated with 10 mM leucine (Leu) (n = 5 and 4, respectively). (C, D) Dynamics of
intracellular ATP and Ca2+ levels in glutamine-stimulated single islets. [ATP]m (C) and [ATP]c
(D) were monitored along with [Ca2+]c in single isolated islets treated with 10 mM glutamine
(Gln) (n = 3 and 5, respectively). (E, F) Dynamics of intracellular ATP and Ca2+ levels in
leucine/glutamine-stimulated single islets. [ATP]m (E) and [ATP]c (F) were monitored along
with [Ca2+]c in single isolated islets treated with 10 mM leucine (Leu) in the presence of 10 mM
glutamine (Gln) (n = 5 for both (E) and (F), respectively). (G) Representative time courses of
[ATP]c and [Ca2+]c in single isolated islets stimulated with 1 µg/mL oligomycin A and 10 mM
leucine in the presence of 10 mM glutamine (n = 6). Islets were pretreated with glutamine for 20
minutes (E-G) before initiating the imaging experiments. The black line represents [ATP]m (A,
C, and E) or [ATP]c (B , D, F and G), and the red line represents [Ca2+]c.
FIGURE 8. Correlation between [ATP]c and [Ca2+]c when [Ca2+]c was oscillated under
high-glucose conditions. (A) Representative time courses of [ATP]c and [Ca2+]c in
glucose-stimulated islets showing oscillations in [Ca2+]c (n = 15). Data for the four plots shown
in this figure were from different islets. Islets were stimulated by increasing the glucose
concentrations in the medium from 2.8 to 25 mM. (B) Cross-correlation analysis of the
dynamics of [ATP]c and [Ca2+]c. Cross-correlation analysis was performed between the
dynamics of [ATP]c and [Ca2+]c in the rectangle shown in A. The trace shows the
one-dimensional cross-correlation, with the time difference (t) of the correlation on the x-axis
and the numerically expressed cross-correlation amplitude on the y-axis. (C) Dynamics of
[ATP]c during Ca2+ oscillations induced by high glucose levels and further augmentation of
Dynamics of intracellular ATP levels in pancreatic islets
18
glucose in the medium. [ATP]c and [Ca2+]c in single islets were monitored after stimulation with
25 mM and further with 42 mM glucose (n = 6). (D) Representative time course of [ATP]c and
[Ca2+]c in an islet stimulated with various levels of glucose. Glucose levels were increased in a
stepwise manner from 2.8 to 25 mM (n = 12). The black line represents [ATP]c and the red line
represents [Ca2+]c.
FIGURE 9. Dynamics of [ATP]c and [Ca2+]c when glucose-induced [Ca2+]c oscillations were
stopped. (A) Representative time course of [ATP]c and [Ca2+]c in islets showing [Ca2+]c
oscillations, treated with 4 µM CCCP (n = 5). Islets were incubated in KRH medium containing
25 mM glucose. (B) Representative time course of [ATP]c and [Ca2+]c in islets upon reduction
of the glucose concentration (n = 5). The black line represents [ATP]c and the red line
represents [Ca2+]c.
FIGURE 10. Dependence of glucose-induced intracellular ATP elevation on intracellular
Ca2+. (A-D) The effect of Ca2+ depletion from the medium. [ATP]m (A, B) or [ATP]c (C, D) was
monitored in isolated islets when the glucose level was elevated from 2.8 to 20 mM (n = 5 for
both (A) and (C), n = 6 for both (B) and (D), respectively). Islets were pretreated with
Ca2+-depleted KRH medium (A, C) or normal Ca2+-containing KRH medium (B, D) for 40
minutes. (E, F) The effect of intracellular Ca2+ depletion. [ATP]m (E) or [ATP]c (F) were
monitored in isolated islets when the glucose level was elevated from 2.8 to 20 mM (n = 5 for
both (E) and (F), respectively). Islets were pretreated with 5 µM
1,2-bis(o-aminophenoxy)ethane-N,N,N′,N′-tetraacetic acid (BAPTA)-AM (BAPTA) for 20
minutes. (G) Depletion of intracellular Ca2+ decreases basal [ATP]m. Time course of [ATP]m in
islets treated with 5 µM BAPTA-AM (BAPTA). Islets were incubated in KRH medium
containing 2.8 mM glucose (n = 5).
Dynamics of intracellular ATP levels in pancreatic islets
19
Figure 1
0.9$
0.95$
1$
1.05$
1.1$
1.15$
1.2$
0$ 100$ 200$ 300$ 400$ 500$ 600$ 700$
0.7$0.8$0.9$1$
1.1$1.2$1.3$1.4$1.5$1.6$1.7$
0$ 5$ 10$ 15$ 20$ 25$ 30$ 35$ 40$ 45$ 50$ 55$
Ra#o
%(OFP/G
FP)�
#me%(m)�
A�
Fig. 1. �
B�
2 5 10 5 2 �
5 min�
1.4�
1.2�
1.0�
0.8�Rela
tive
Ratio
(OFP
/GFP
)�
1.6�
ATP (mM)�
0.8$
0.85$
0.9$
0.95$
1$
1.05$
1.1$
1.15$
1.2$
�� ���� ���� ��� ����� ����� ���� ����� �����Ra
#o%(O
FP/G
FP)�
#me%(s)�
200 s�
1.0�
0.9�
Rela
tive
Ratio
(OFP
/GFP
)�
1.1�
7 8 7 8 �ATP (mM)�
C�2.8 mM� 25 mM�
100 s�
1.0�
0.9�
Rela
tive
Ratio
(OFP
/GFP
)�
1.1�
[ATP]c�
Dynamics of intracellular ATP levels in pancreatic islets
20
Figure 2
0.9$
0.95$
1$
1.05$
1.1$
1.15$
1.2$
1.25$
1.3$
0$ 100$ 200$ 300$ 400$ 500$ 600$ 700$
0.8$
0.9$
1$
1.1$
1.2$
0$ 100$ 200$ 300$ 400$ 500$ 600$ 700$ 800$ 900$ 1000$
0.9$
1$
1.1$
1.2$
1.3$
0$ 100$ 200$ 300$ 400$ 500$ 600$ 700$ 800$ 900$ 1000$
0.8$
0.9$
1$
1.1$
1.2$
0$ 100$ 200$ 300$ 400$ 500$ 600$ 700$ 800$ 900$ 1000$
0.9$
1$
1.1$
1.2$
1.3$
0$ 100$ 200$ 300$ 400$ 500$ 600$ 700$ 800$ 900$ 1000$
A�
Fig. 2. �
B�
H� I�
100 s�
100 s�
2.8 mM 25 mM�
100 s�
100 s�
[ATP]c�
control�
[ATP]m�
control�
1.2�
1.1�
1.0�0.9�
Rela
tive
Ratio
(OFP
/GFP
)�
1.2�
1.1�1.0�0.9�
Rela
tive
Ratio
(OFP
/GFP
)�
1.2�1.1�1.0�0.9�
Rela
tive
Ratio
(OFP
/GFP
)�
1.2�
1.1�
1.0�
0.9�
Rela
tive
Ratio
(OFP
/GFP
)�
2.8 mM 25 mM�
C�
1.1�
1.0�
0.9�
Rela
tive
Ratio
(YFP
/CFP
)�
0.9$
1$
1.1$
1.2$
0$ 100$ 200$ 300$ 400$ 500$ 600$ 700$ 800$ 900$ 1000$100 s�
[ATP]c�
2.8 mM 25 mM�
AT1.03�
D� E�
G�2.8 mM 25 mM� 2.8 mM 25 mM�
1.2�1.16�
Ratio
high
Glc
/Rat
io2.
8Glc�
1.12�1.08�1.04�
1�8.3 mM� 16.7 mM� 25 mM�
1"
1.04"
1.08"
1.12"
1.16"
1.2"
8.3Glc" 16.7Glc" 25Glc"
[ATP
] high/[ATP
] base.
100 s�
1.2�
1.1�
1.0�
0.9�Rela
tive
Ratio
(OFP
/GFP
)�
0.9$
0.95$
1$
1.05$
1.1$
1.15$
1.2$
1.25$
1.3$
0$ 100$ 200$ 300$ 400$ 500$ 600$
8.3$mM$
16.7$mM$
25$mM$
8.3 mM�16.7 mM�25 mM�
high glucose�
0.5$
0.6$
0.7$
0.8$
0.9$
1$
1.1$
1.2$
0$ 200$ 400$ 600$ 800$ 1000$ 1200$ 1400$ 1600$
1.0�
0.8�
0.6�
Rela
tive
Ratio
(OFP
/GFP
)�
1.2�
200 s�[ATP]c�
2.8 mM 25 mM�
oligomycin A�
single cell�
**� *
0.9$
0.95$
1$
1.05$
1.1$
1.15$
1.2$
0$ 200$ 400$ 600$ 800$ 1000$ 1200$ 1400$ 1600$
F�
1.1�
1.0�
0.9�
Rela
tive
Ratio
(OFP
/GFP
)�
200 s�
glucose (mM)�2.8 5.6 8.3 11 25 �
[ATP]c�
0.9$
0.95$
1$
1.05$
1.1$
1.15$
1.2$
1.25$
1.3$
0$ 100$ 200$ 300$ 400$ 500$ 600$
8.3$mM$
16.7$mM$
25$mM$
0.9$
0.95$
1$
1.05$
1.1$
1.15$
1.2$
1.25$
1.3$
0$ 100$ 200$ 300$ 400$ 500$ 600$
8.3$mM$
16.7$mM$
25$mM$
Dynamics of intracellular ATP levels in pancreatic islets
21
Figure 3
0"
100"
200"
300"
400"
3mM"to"25mM" 25mM"to"3mM"
!me$(s)�
glucose$s!mula!on�
0"
0.02"
0.04"
0.06"
0.08"
0.1"
0.8$
0.9$
1$
1.1$
1.2$
1.3$
0$ 20$ 40$ 60$ 80$ 100$ 120$
A�
Fig. 3. �
B� C�
*�
*�
2.8 25 2.8 25 2.8 25 2.8 25 2.8 mM �
10 min�
2.8 mM to 25 mM 25 mM to 2.8 mM�
Aver
age
rate
of r
elat
ive
ratio
cha
nges
(/m
in)�
0�2.8 mM to 25 mM 25 mM to 2.8 mM�
Tim
e (s
)�
[ATP]c�
1.2�
1.1�
1.0�
0.9�
Rela
tive
Ratio
(OFP
/GFP
)�
0.02�
0.04�
0.06�
0.08�
0.1�400�
300�
200�
100�
0�
Dynamics of intracellular ATP levels in pancreatic islets
22
Figure 4
0.7$
0.75$
0.8$
0.85$
0.9$
0.95$
1$
1.05$
1.1$
0$ 200$ 400$ 600$ 800$ 1000$ 1200$ 1400$
0.5$
0.6$
0.7$
0.8$
0.9$
1$
1.1$
0$ 100$ 200$ 300$ 400$ 500$ 600$ 700$ 800$ 900$ 1000$
Fig. 4. �
5 µg/mL oligomycin A�
1 mM iodoacetate�
100 s�
100 s�
A�
B�
[ATP]c�
[ATP]c�
1.1�
1.0�
0.9�
0.8�
Rela
tive
Ratio
(OFP
/GFP
)�
1.0�0.9�0.8�
0.7�
Rela
tive
Ratio
(OFP
/GFP
)�
1.1�
0.6�
Dynamics of intracellular ATP levels in pancreatic islets
23
Figure 5
0"
0.5"
1"
1.5"
2"
2.5"
3"
0.6"
0.65"
0.7"
0.75"
0.8"
0.85"
0.9"
0.95"
1"
1.05"
1.1"
0" 200" 400" 600" 800" 1000" 1200" 1400"0"
0.5"
1"
1.5"
2"
2.5"
3"
3.5"
0.6"
0.65"
0.7"
0.75"
0.8"
0.85"
0.9"
0.95"
1"
1.05"
1.1"
0" 100" 200" 300" 400" 500" 600" 700" 800" 900" 1000"
0"
0.5"
1"
1.5"
2"
2.5"
3"
0.5"
0.6"
0.7"
0.8"
0.9"
1"
1.1"
0" 100" 200" 300" 400" 500" 600" 700"0"
0.5"
1"
1.5"
2"
2.5"
3"
0.5"
0.6"
0.7"
0.8"
0.9"
1"
1.1"
0" 100" 200" 300" 400" 500" 600" 700"
0"
0.5"
1"
1.5"
2"
2.5"
3"
0.8"
0.9"
1"
1.1"
1.2"
0" 50" 100" 150" 200" 250" 300" 350" 400" 450"
A�
B
(a) (b) (c) (d) (e)�
0.0�
Fig.5. �
2.6�
0.8�
1.1�
E�
50 s�
2.8 mM� 25 mM�
50 s�
2.5�
1.5�
0.5�
Rela
tive
Ratio
(fur
a-2S
/fura
-2L)�
2.8 mM� 25 mM�
[ATP]c�
[ATP]c�
[ATP]c�
[Ca2+]c�
[Ca2+]c�
[Ca2+]c�
(a)� (b)� (c)�
ATP�
Ca2+�
(d)� (e)�
30 µm�
1.1�
1.0�
0.9�
Rela
tive
Ratio
(OFP
/GFP
)�
2.5�
1.5�
0.5�
Rela
tive
Ratio
(fur
a-2S
/fura
-2L)�
F�
1 µg/mL oligomycin A�
50 s�
2.5�
1.5�
0.5�
Rela
tive
Ratio
(fur
a-2S
/fura
-2L)�
[ATP]c�
[Ca2+]c�
1.0�0.9�0.8�0.7�
Rela
tive
Ratio
(OFP
/GFP
)�
1.1�
0.6�
1 µg/mL oligomycin A�
500 µM tolbutamide�
1.0�0.9�0.8�0.7�
Rela
tive
Ratio
(OFP
/GFP
)�
1.1�
0.6�
C
1 mM iodoacetate�
500 µM tolbutamide�D
1.0�
0.9�
0.8�
0.7�
Rela
tive
Ratio
(OFP
/GFP
)�
1.1�
2.5�
1.5�
0.5�
Rela
tive
Ratio
(fur
a-2S
/fura
-2L)�2.8 mM� 25 mM�
1 mM iodoacetate�
[ATP]c�
1.0�
0.9�
0.8�
0.7�
Rela
tive
Ratio
(OFP
/GFP
)�
1.1�
2.5�
1.5�
0.5�
Rela
tive
Ratio
(fur
a-2S
/fura
-2L)�
100 s�100 s�
[Ca2+]c�
Dynamics of intracellular ATP levels in pancreatic islets
24
Figure 6
0"
0.5"
1"
1.5"
2"
2.5"
0.6"
0.65"
0.7"
0.75"
0.8"
0.85"
0.9"
0.95"
1"
1.05"
1.1"
0" 100" 200" 300" 400" 500" 600" 700" 800" 900" 1000"
0"
0.5"
1"
1.5"
2"
2.5"
0.8"
0.9"
1"
1.1"
1.2"
1.3"
1.4"
0" 50" 100" 150" 200" 250" 300" 350" 400" 450"
0"
0.5"
1"
1.5"
2"
2.5"
3"
0.8"
0.9"
1"
1.1"
1.2"
1.3"
1.4"
0" 50" 100" 150" 200" 250" 300" 350" 400" 450"
Fig. 6. �
A� B�
C�
100 s�
[ATP]c�[ATP]m�
[ATP]c�
[Ca2+]c�[Ca2+]c�
[Ca2+]c�
100 s�
20 mM MP�
200 s�
1.1�
0.9�
Rela
tive
Ratio
(OFP
/GFP
)�
1.3� 2.5�
1.5�
0.5�
Rela
tive
Ratio
(fur
a-2S
/fura
-2L)�
1.1�
0.9�Re
lativ
e Ra
tio (O
FP/G
FP)�
1.3�2.5�
1.5�
0.5�
Rela
tive
Ratio
(fur
a-2S
/fura
-2L)�
20 mM MP�
0.9�
0.7�
Rela
tive
Ratio
(OFP
/GFP
)�
1.1� 2.5�
1.5�
0.5�
Rela
tive
Ratio
(fur
a-2S
/fura
-2L)�
20 mM MP�
1 µg/mL oligomycin A�
Dynamics of intracellular ATP levels in pancreatic islets
25
Figure 7
0"
0.5"
1"
1.5"
2"
0.5"
0.6"
0.7"
0.8"
0.9"
1"
1.1"
1.2"
0" 100" 200" 300" 400" 500" 600" 700" 800" 900" 1000"
0"
0.5"
1"
1.5"
2"
0.8"
0.9"
1"
1.1"
1.2"
0" 100" 200" 300" 400" 500" 600" 700" 800" 900" 1000"
0"
0.5"
1"
1.5"
2"
0.8"
0.9"
1"
1.1"
1.2"
0" 100" 200" 300" 400" 500" 600" 700" 800" 900" 1000"
10 mM Leu�
10 mM Gln�
E� F�
G�
200 s� 200 s�
200 s�
Fig. 7. �
[ATP]m�[ATP]c�
[ATP]c�
[Ca2+]c�[Ca2+]c�
[Ca2+]c�
1.1�
1.0�
0.9�
Rela
tive
Ratio
(OFP
/GFP
)�
1.5�
1.0�
0.5�
Rela
tive
Ratio
(fur
a-2S
/fura
-2L)�
1.1�
1.0�
0.9�
Rela
tive
Ratio
(OFP
/GFP
)�
1.5�
1.0�
0.5�
Rela
tive
Ratio
(fur
a-2S
/fura
-2L)�10 mM Leu�
10 mM Gln�
1.5�
1.0�
0.5�
Rela
tive
Ratio
(fur
a-2S
/fura
-2L)�10 mM Leu�10 mM Gln�
0"
0.5"
1"
1.5"
2"
0.8"
0.9"
1"
1.1"
1.2"
0" 100" 200" 300" 400" 500" 600" 700" 800" 900" 1000"
0"
0.5"
1"
1.5"
2"
0.8"
0.9"
1"
1.1"
1.2"
0" 100" 200" 300" 400" 500" 600" 700" 800" 900" 1000"
0"
0.5"
1"
1.5"
2"
0.8"
0.9"
1"
1.1"
1.2"
0" 100" 200" 300" 400" 500" 600" 700" 800" 900" 1000"0"
0.5"
1"
1.5"
2"
0.8"
0.9"
1"
1.1"
1.2"
0" 100" 200" 300" 400" 500" 600" 700" 800" 900" 1000"
10 mM Leu�
10 mM Gln�
A� B�
C� D�
200 s� 200 s�
10 mM Leu�
200 s�200 s�
10 mM Gln�
[ATP]m�
[ATP]m�
[ATP]c�
[ATP]c�
[Ca2+]c�
[Ca2+]c� [Ca2+]c�
[Ca2+]c�
1.1�
1.0�
0.9�
Rela
tive
Ratio
(OFP
/GFP
)�
1.5�
1.0�
0.5�Re
lativ
e Ra
tio (f
ura-
2S/fu
ra-2
L)�
1.1�
1.0�
0.9�
Rela
tive
Ratio
(OFP
/GFP
)�
1.5�
1.0�
0.5�
Rela
tive
Ratio
(fur
a-2S
/fura
-2L)�
1.1�
1.0�
0.9�
Rela
tive
Ratio
(OFP
/GFP
)�
1.1�
1.0�
0.9�
Rela
tive
Ratio
(OFP
/GFP
)�
1.5�
1.0�
0.5�
Rela
tive
Ratio
(fur
a-2S
/fura
-2L)�
1.0�0.9�0.8�
0.7�
Rela
tive
Ratio
(OFP
/GFP
)�
1.1�
0.6�
1 µg/mL oligomycin A�
1.5�
1.0�
0.5�
Rela
tive
Ratio
(fur
a-2S
/fura
-2L)�
Dynamics of intracellular ATP levels in pancreatic islets
26
Figure 8
0"
0.5"
1"
1.5"
2"
2.5"
3"
0.8"
0.85"
0.9"
0.95"
1"
1.05"
1.1"
1.15"
1.2"
0" 200" 400" 600" 800" 1000" 1200" 1400" 1600" 1800" 2000"
Fig. 8. �
0"
0.5"
1"
1.5"
2"
2.5"
3"
3.5"
0.9"
1"
1.1"
1.2"
0" 200" 400" 600" 800" 1000" 1200" 1400" 1600"
0"
0.5"
1"
1.5"
2"
2.5"
3"
0.9"
1"
1.1"
1.2"
1.3"
0" 200" 400" 600" 800" 1000" 1200" 1400" 1600" 1800" 2000"
0"
0.5"
1"
1.5"
2"
2.5"
3"
0.9"
1"
1.1"
1.2"
1.3"
0" 200" 400" 600" 800" 1000" 1200" 1400" 1600" 1800" 2000"
0"
0.5"
1"
1.5"
2"
2.5"
0.9"
1"
1.1"
1.2"
1.3"
0" 200" 400" 600" 800" 1000" 1200" 1400" 1600" 1800" 2000"
A
[ATP]c�
[Ca2+]c�
200 s�
200 s�
2.8 mM 25 mM�
[ATP]c�[Ca2+]c�
200 s�
200 s�[Ca2+]c�
[Ca2+]c�
[ATP]c�
[ATP]c�1.2�
1.1�
1.0�
Rela
tive
Ratio
(OFP
/GFP
)�
2.0�
1.5�1.0�
Rela
tive
Ratio
(fur
a-2S
/fura
-2L)�
1.2�
1.1�
1.0�
Rela
tive
Ratio
(OFP
/GFP
)�
2.5�
1.5�
0.5�
Rela
tive
Ratio
(fur
a-2S
/fura
-2L)�
1.2�
1.1�
1.0�
Rela
tive
Ratio
(OFP
/GFP
)�
2.5�
1.5�
0.5�
Rela
tive
Ratio
(fur
a-2S
/fura
-2L)�
1.1�
1.0�
0.9�
Rela
tive
Ratio
(OFP
/GFP
)�
3.0�
2.0�
1.0�
Rela
tive
Ratio
(fur
a-2S
/fura
-2L)�
2.8 mM 25 mM�
2.8 mM 25 mM�2.8 mM 25 mM�
1.1�
1.0�
0.9�
Rela
tive
Ratio
(OFP
/GFP
)�
200 s�
3.0�
2.0�
1.0�
Rela
tive
Ratio
(fur
a-2S
/fura
-2L)�
2.8 5.6 8.3 11 25 �glucose (mM)�
[ATP]c�
[Ca2+]c�
B
D�
C�
t (s)�
1�
-1�
-400 -200 0 200 400 �
0"
0.5"
1"
1.5"
2"
2.5"
3"
3.5"
4"
4.5"
0.9"
0.95"
1"
1.05"
1.1"
1.15"
1.2"
0" 300" 600" 900" 1200" 1500" 1800" 2100" 2400" 2700" 3000"
1.1�
1.0�
1.2�
Rela
tive
Ratio
(OFP
/GFP
)�
3.0�
2.0�
1.0�
Rela
tive
Ratio
(fur
a-2S
/fura
-2L)�
4.0�
300 s�
2.8 mM� 25 mM� 42 mM�
[Ca2+]c�
[ATP]c�
Dynamics of intracellular ATP levels in pancreatic islets
27
Figure 9
Fig. 9. �
A
B
0.5$
1$
1.5$
2$
2.5$
0.6$
0.7$
0.8$
0.9$
1$
1.1$
0$ 200$ 400$ 600$ 800$ 1000$ 1200$ 1400$ 1600$
4 µM CCCP�
25 mM�
[ATP]c�[Ca2+]c�
200 s�
1.0�0.9�0.8�0.7�
Rela
tive
Ratio
(OFP
/GFP
)�
1.1�
2.0�
1.5�
1.0�
Rela
tive
Ratio
(fur
a-2S
/fura
-2L)�
0.5$
1$
1.5$
2$
0.8$
0.9$
1$
1.1$
1.2$
0$ 200$ 400$ 600$ 800$ 1000$ 1200$ 1400$ 1600$ 1800$ 2000$
25 mM 2.8 mM�
200 s�
[Ca2+]c�
[ATP]c�
1.1�
1.0�
0.9�
Rela
tive
Ratio
(OFP
/GFP
)�
1.5�
1.0�
0.5�
Rela
tive
Ratio
(fur
a-2S
/fura
-2L)�
Dynamics of intracellular ATP levels in pancreatic islets
28
Figure 10
0.9$
1$
1.1$
1.2$
1.3$
1.4$
0$ 100$ 200$ 300$ 400$ 500$ 600$ 700$ 800$ 900$ 1000$
0.8$
0.9$
1$
1.1$
1.2$
1.3$
0$ 100$ 200$ 300$ 400$ 500$ 600$ 700$ 800$ 900$ 1000$0.8$
0.9$
1$
1.1$
1.2$
1.3$
0$ 100$ 200$ 300$ 400$ 500$ 600$ 700$ 800$ 900$ 1000$
0.8$
0.9$
1$
1.1$
1.2$
1.3$
0$ 100$ 200$ 300$ 400$ 500$ 600$ 700$ 800$ 900$ 1000$
0.9$
1$
1.1$
1.2$
1.3$
1.4$
0$ 100$ 200$ 300$ 400$ 500$ 600$ 700$ 800$ 900$ 1000$
Fig. 10. �
2.8 mM 20 mM�
5 µM BAPTA�
100 s�
2.8 mM 20 mM�
5 µM BAPTA�
100 s�
100 s�
2.8 mM 20 mM�
Ca2+ - free�
A� B�
E� F�
100 s�
2.8 mM 20 mM�
Ca2+ - free�
[ATP]c�
[ATP]c�
[ATP]m�
[ATP]m�
1.2�
1.1�
1.0�
0.9�
Rela
tive
Ratio
(OFP
/GFP
)�
1.3�
1.2�
1.1�
1.0�
0.9�
Rela
tive
Ratio
(OFP
/GFP
)�
1.2�
1.1�
1.0�
0.9�
Rela
tive
Ratio
(OFP
/GFP
)�
1.2�
1.1�
1.0�
0.9�
Rela
tive
Ratio
(OFP
/GFP
)�C� D�
0.8$
0.9$
1$
1.1$
1.2$
1.3$
0$ 100$ 200$ 300$ 400$ 500$ 600$ 700$ 800$ 900$ 1000$
1.2�
1.1�
1.0�
0.9�
Rela
tive
Ratio
(OFP
/GFP
)�
100 s�
[ATP]c�
2.8 mM 20 mM�
G�
1.1�
1.0�
0.9�
0.8�
Rela
tive
Ratio
(OFP
/GFP
)�
0.7$
0.8$
0.9$
1$
1.1$
1.2$
0$ 200$ 400$ 600$ 800$ 1000$ 1200$ 1400$ 1600$ 1800$ 2000$
[ATP]m�
200 s�
5 µM BAPTA�
1.2�
1.1�
1.0�
0.9�Rela
tive
Ratio
(OFP
/GFP
)�
1.4�
1.3�
100 s�
[ATP]m�
2.8 mM 20 mM�
Related Documents


