GLUCOSE INDUCES SENSITIVITY TO OXYGEN DEPRIVATION AND ALTERS GENE EXPRESSION IN Caenorhabditis elegans Anastacia M. Garcia, B.S. Dissertation Prepared for the Degree of DOCTOR OF PHILOSOPHY UNIVERSITY OF NORTH TEXAS August 2015 APPROVED: Pamela A. Padilla, Major Professor Michael Allen, Committee Member Kent Chapman, Committee Member Shane L. Rea, Committee Member Aaron Roberts, Committee Member Art Goven, Chair of the Department of Biological Sciences Costas Tsatsoulis, Interim Dean of the Toulouse Graduate School

Welcome message from author
This document is posted to help you gain knowledge. Please leave a comment to let me know what you think about it! Share it to your friends and learn new things together.
Transcript

GLUCOSE INDUCES SENSITIVITY TO OXYGEN DEPRIVATION AND ALTERS
GENE EXPRESSION IN Caenorhabditis elegans
Anastacia M. Garcia, B.S.
Dissertation Prepared for the Degree of
DOCTOR OF PHILOSOPHY
UNIVERSITY OF NORTH TEXAS
August 2015
APPROVED:
Pamela A. Padilla, Major Professor Michael Allen, Committee Member Kent Chapman, Committee Member Shane L. Rea, Committee Member Aaron Roberts, Committee Member Art Goven, Chair of the Department of
Biological Sciences Costas Tsatsoulis, Interim Dean of the
Toulouse Graduate School

Garcia, Anastacia M., Glucose Induces Sensitivity to Oxygen Deprivation and
Alters Gene Expression in Caenorhabditis elegans. Doctor of Philosophy (Biology),
August 2015, 125 pp., 7 tables, 22 illustrations, references, 186 titles.
An organisms’ diet represents an exogenous influence that often yields colossal
effects on long-term health and disease risk. The overconsumption of dietary sugars for
example, has contributed to significant increases in obesity and type-2 diabetes; health
issues that are costly both economically and in terms of human life. Individuals who are
obese or are type-2 diabetic often have compromised oxygen delivery and an increased
vulnerability to oxygen-deprivation related complications, such as ischemic strokes,
peripheral arterial disease and myocardial infarction. Thus, it is of interest to identify the
molecular changes glucose supplementation or hyperglycemia can induce, which
ultimately compromise oxygen deprivation responses. By utilizing the Caenorhabditis
elegans genetic model system, which is anoxia tolerant, I determined that a glucose-
supplemented diet negatively impacts responses to anoxia and that the insulin-like
signaling pathway, through fatty acid and ceramide biosynthesis and antioxidant activity,
modulates anoxia survival. Additionally, a glucose-supplemented diet induces lipid
accumulation. Use of RNA-sequencing analysis to compare gene expression responses
in animals fed either a standard or glucose-supplemented diet revealed that glucose
impacts the expression of genes involved with multiple cellular processes including lipid
and carbohydrate metabolism, stress responses, cell division, and extracellular
functions. Several of the genes we identified are homologous to human genes that are
differentially regulated in response to metabolic diseases, suggesting that there may be
conserved gene expression responses between C. elegans supplemented with glucose

and a diabetic and/or obese state observed in humans. These findings support the utility
of C. elegans to model specific aspects of the T2D disease process (e.g., glucose-
induced sensitivity to oxygen deprivation) and identify potentially novel regulators of
common complications seen in hyperglycemic and T2D patients (e.g., macrovascular
complications).

Copyright 2015
by
Anastacia M. Garcia
ii

ACKNOWLEDGEMENTS
Many thanks to my primary investigator, Dr. Padilla for allowing me this
opportunity, and to Drs. A. Roberts, M. Allen, K. Chapman and S. L. Rea for serving on
my committee for all of these years. I’d also like to thank Drs. S. Brumbley, R.K. Azad
and B.K. McFarlin for valuable technical assistance and data analysis. I am also grateful
for Drs. J. Watts and S. J. Lee and the entire Caenorhabditis elegans Genetics Stock
Center (CGC), which is funded by National Institutes of Health Office of Research
Infrastructure Programs (P40 OD010440) for C. elegans or E. coli strains used in this
work. This work was supported by a grant from the National Science Foundation
(CAREER 0747391) to P.A. Padilla and by support from the University of North Texas
Office of Research and Economic Development, College of Arts and Sciences, and
Department of Biological Sciences to P.A. Padilla and R.K. Azad. I also greatly
appreciate the Toulouse Graduate School for awarding me with the Thesis and
Dissertation Fellowship, which has allowed me to complete my degree without the
added stress of teaching during my final year. Additionally, I am eternally grateful for the
many friends and colleagues that have encouraged me along the way, especially to my
colleagues in the lab, M.L. Ladage and S. D. King and principally L.S. Toni who has
kept me balanced. Ultimately I am indebted to my gracious family who has
supported and encouraged my pursuit of this dream. I love you Mom and Dad, to
the moon and back.
iii
TABLE OF CONTENTS
Page
CHAPTER 1 DIET, HUMAN HEALTH, OXYGEN DEPRIVATION AND Caenorhabditis
elegans ............................................................................................................................ 1
Diet and Human Health ............................................................................................... 1
Physiological and Metabolic Responses to Excess Sugar ........................................... 2
C. elegans as a Model to Study Oxygen Deprivation................................................... 9
History of C. elegans ................................................................................................ 9
C. elegans and Oxygen Deprivation ....................................................................... 11
Anoxia Tolerance in Wild-Type Adult C. elegans ................................................... 13
Genetic Factors Influence Anoxia Tolerance in Adult C. elegans........................... 15
Environmental Changes Influence Anoxia Tolerance in Adult C. elegans .............. 24
Research Focus......................................................................................................... 26
CHAPTER 2 GLUCOSE IMPACTS OXYGEN DEPRIVATION RESPONSE AND
SURVIVAL IN C. elegans .............................................................................................. 28
Introduction ................................................................................................................ 28
Glucose Supplementation in C. elegans ................................................................ 28
Glucose Supplementation and Oxygen Deprivation in C. elegans ......................... 30
Results ....................................................................................................................... 31
A Glucose Supplemented Diet Impacts Stress Responses .................................... 31
A Glucose Supplemented Diet Increases Whole Worm Glucose Concentrations .. 33
Glucose and Fructose Supplementation Induce Anoxia Sensitivity........................ 35
E. coli Food Source Impacts Glucose- Induced Anoxia Sensitivity ........................ 36
iv
Glucose Supplementation Induces Lipid Accumulation .......................................... 37
CHAPTER 3 GLUCOSE-INDUCED ANOXIA SENSITIVITY IS MODULATED VIA
INSULIN SIGNALING, LIPID BIOSYNTHESIS AND ANTIOXIDANT ACTIVITY ........... 39
Introduction ................................................................................................................ 39
Insulin Signaling ..................................................................................................... 39
Lipid Biosynthesis .................................................................................................. 40
ROS and Antioxidants ............................................................................................ 43
Results ....................................................................................................................... 45
Glucose-Induced Anoxia Sensitivity is Modulated by Insulin Signaling .................. 45
Glucose-Induced Anoxia Sensitivity is Modulated by Insulin Signaling via Lipid
Biosynthesis ........................................................................................................... 51
Glucose-Induced Anoxia Sensitivity is Modulated by Insulin Signaling Via
Antioxidant Activity ................................................................................................. 58
Glucose Supplementation Induces Lipid Accumulation .......................................... 58
CHAPTER 4 GLUCOSE INDUCES SIGNIFICANT GENE EXPRESSION CHANGES IN
C. elegans ..................................................................................................................... 61
Introduction ................................................................................................................ 61
Transcriptional Changes Associated With the Progression of Type 2 Diabetes ..... 61
Transcriptomics ...................................................................................................... 62
Results ....................................................................................................................... 63
Glucose Supplementation Induces Significant Transcriptional Changes ............... 63
CHAPTER 5 MATERIALS AND METHODS ................................................................. 79
C. elegans Strains and Culture Conditions ................................................................ 79
v

Bacterial Strains and Culture Conditions ................................................................... 80
Anoxia and Paraquat Exposure ................................................................................. 80
Oil Red O Staining ..................................................................................................... 81
Fatty Acid Supplementation ....................................................................................... 82
Protein Quantification ................................................................................................ 83
RNA Isolation ............................................................................................................. 83
RNA-Sequencing Analysis ......................................................................................... 84
Quantitative RT-PCR ................................................................................................. 86
Statistical Analysis ..................................................................................................... 87
CHAPTER 6 DISCUSSION ........................................................................................... 88
Glucose Induces Sensitivity to Oxygen Deprivation................................................... 89
Glucose-Induced Anoxia Sensitivity is Influenced by the Intestinal Microbiome .... 92
Glucose-Induced Anoxia Sensitivity is Modulated by Insulin Signaling via Multiple
Pathways ............................................................................................................... 94
Glucose Significantly Alters Gene Expression in C. elegans ..................................... 99
REFERENCES ............................................................................................................ 104
vi

CHAPTER 1
DIET, HUMAN HEALTH, OXYGEN DEPRIVATION AND Caenorhabditis elegans
Diet and Human Health
An organisms’ diet represents an exogenous influence that often yields colossal
effects on long-term health and disease risk. The overconsumption of dietary sugars
(and decreased caloric expenditure) that the United States has seen in recent years,
has contributed to significant increases in obesity and type-2 diabetes, health issues
that are costly both in terms of economics and human life (Koning and Malik 2011;
Ogden et al. 2014). To illustrate, approximately two-thirds of American adults are
considered overweight or obese (body mass index (BMI) of ≥ 25 or ≥30 kg/m2
respectively) and 16.9% of children and adolescents are considered obese (Frisbee
2007). Worldwide, the prevalence of obesity has nearly doubled since 1980, and in
2014, 11% of adult men and 15% of adult women were obese (World Health
Organization (WHO), Global status report on noncommunicable diseases 2014). The
accumulation of visceral adiposity is linked to several chronic health conditions such as
hyperglycemia, insulin-insensitivity and type-2 diabetes (T2D) that are becoming
increasingly more common. For example, T2D alone affects more than 29 million
Americans today, and contributes to over 230,000 deaths annually (Centers for Disease
Control (CDC), National Diabetes Statistics report 2014). This epidemic however is not
limited to the US, the WHO has recently defined T2D as a progressive worldwide
epidemic, and the global prevalence of diabetes in 2014 was estimated to be 9% (World
Health Organization (WHO), Global status report on noncommunicable diseases 2014).
Additionally, the risk of death in adults with T2D is 50% higher than in their non-diabetic
1

counterparts (CDC, 2014). In addition to the significant toll on human health and life
expectancy that T2D poses, there is also an associated economic burden. The total
estimated medical costs associated with T2D in the US for example, exceed 170 billion
USD in 2012, while indirect associated costs (disability, work loss and premature death)
totaled more than 60 billion USD (CDC 2014, American Diabetes Association (ADA)
2012). Thus, together T2D cost the US more than 245 billion dollars annually and is the
7th leading cause of death in the US (CDC 2014) and 8th leading cause of death in the
world (WHO 2014).
T2D is a well-known cause of premature death and disability, as patients with
T2D have a greater risk of vascular complications such as ischemic strokes, heart
disease, myocardial infarction and peripheral arterial diseases (Sonestedt et al. 2012;
Stratton et al. 2000). In fact, vascular diseases are the principal causes of death in
people with T2D. Moreover, the etiology of late-onset, chronic metabolic diseases such
as obesity and T2D are multifactorial and involve complex interactions between an
individual’s genetic makeup, dietary habits, activity level and fetal programming. Thus, it
is of interest to understand both the genetic and dietary factors that together, can
convert an individual’s healthy metabolism into a pathological one.
Physiological and Metabolic Responses to Excess Sugar
Metabolism involves a variety of chemical reactions that form an intricate network
of pathways and cycles necessary for an organism’s proper development, reproduction
and response to environmental cues. Metabolism generally encompasses virtually every
cellular process from DNA replication to transcription, translation and small molecule
2

reactions within each cell. The intermediate step within cells in which nutrients are
metabolized and converted into cellular energy and other vital cellular components
plays a central role in metabolic processes. The common dietary sugar, glucose for
example, is an essential component of intermediary metabolism and energy production,
and its intra- and extracellular levels are tightly regulated within an organism. In
humans, low blood glucose concentrations (hypoglycemia) can result in seizures,
weakness and death, while chronically high blood glucose levels can result in cardiac
and peripheral vascular disease. Thus, carefully regulated blood glucose levels are
optimally maintained within a narrow window, with optimal levels being at or near 90
mg/dL or 5 mM/L (Table 1.1) and seemingly minimal increases or decreases from this
optimal level can have dramatic impacts on physiology, phenotype and gene expression
(Szablewski 2011). Glucose enters the body in many forms, including
monosaccharaides, disaccharides, and polysaccharides and also via the breakdown or
of substrates stored within organs. Humans and other mammals can adjust glucose
levels by secreting two hormones, insulin and glucagon, that work in opposition to one
another. Glucose (and other monosaccharaides) are transported across the intestine
and into the liver and other organs, and pancreatic β-cells are induced to secrete
insulin. Insulin secretion in turn facilitates the import of glucose into other tissues
including muscle and adipose tissues. These simple sugars, can then be converted into
fatty acids, amino acids and glycogen, or can be oxidized by the various catabolic
pathways in cells, depending on the specific needs of an organism (Szablewski 2011;
Busik et al. 2002; Brownlee 2001).
3

A continual excess of glucose, however, can have deleterious effects on
metabolic functions, and impair the body’s ability to properly maintain glucose
homeostasis. Chronic disruptions in energy homeostasis and metabolic regulation can
elicit negative and life-long and phenotypic consequences in individuals (Brownlee
2001; Sonestedt et al. 2012). An excess of dietary sugars over time fore example, can
lead to impaired insulin secretion from pancreatic β-cells and/or a decreased biological
impact of insulin (insulin resistance) in peripheral tissues. Insulin resistance results in
decreased cellular glucose uptake, increased blood glucose levels (hyperglycemia) and
ultimately T2D (Table 1.1) (Brownlee 2001; Szablewski 2011).
Mean Blood
Glucose Normal Hyper Diabetic
mg/dL 80 115 150 180 215 250 280 315 350
mM/L 4.5 6.4 8.4 10 11.9 13.9 15.5 17.5 19.5
Table 1.1. Mean Blood Glucose Levels in Normal, Hyperglycemic (Hyper) and Diabetic Humans. Mean blood glucose levels are given in units of mg/dL of blood or mM/L of blood (American Diabetes Association).
Oxygen Deprivation
Chronic hyperglycemia and T2D often result in significant pathological changes
including vascular changes, that with time will induce kidney damage, coronary artery
disease, cerebral vascular disease, peripheral artery disease, blindness and poor
wound healing. These alterations in vascular homeostasis due to cellular dysfunction
are the main features of diabetic complications, and this pro-inflammatory state
ultimately leads to complications that over time can be life threatening (Giugliano et al.
4

1996; Creager et al. 2003; Beckman et al. 2013; Paneni et al. 2013; Stratton et al. 2000;
Vinik and Flemmer 2002; Nuzum and Merz 2009). A hallmark of diabetic macrovascular
disease is accelerated atherosclerosis (the narrowing of arterial walls) of the aorta and
other medium to large sized arteries, resulting in vascular abnormalities, vascular
dysfunction and ultimately the disruption of oxygenated blood flow to vital organs and
tissues throughout the body (Figure 1.1). Thus, the main adverse effect of vascular
disease on the body is oxygen deprivation.
It is thought that various metabolic abnormalities associated with diabetes
(hyperglycemia, increased free fatty acids and insulin resistance) further contribute to
macrovascular dysfunction. The effects of hyperglycemia on the vascular system occur
through multiple common mechanisms. For example, abnormal stimulation of the
hexosamine signaling (N-acetyl-glucosamine protein modification), protein kinase C and
polyl pathways, have been implicated in the promotion of cellular dysfunction and
damage as result of hyperglycemia. Additionally, the pathologic effects of advanced
glycation end product accumulation, nitric oxide inhibition and subsequent impaired
vasodilation, smooth muscle cell dysfunction, the overproduction of endothelial growth
factors, increased release of free fatty acids, chronic inflammation, enhanced platelet
aggregation (clotting), and enhanced reactive oxygen species generation have also
been shown to have a role in the progression of diabetic vascular disease (Cade 2008;
Yamagishi and Imaizumi 2005; Girach, Manner, and Porta 2006). Moreover, structural
changes in the vascular system also promote the progression of atherosclerosis. This
process begins with the progressive formation of plaques, via lipid accumulation.
Atherosclerosis is thought to occur more quickly as result of chronic inflammation and
5

injury to the arterial wall. In response to endothelial injury and inflammation, oxidized
lipids from low-density lipoproteins (LDLs) accumulate in the endothelial wall of
arteries. This accumulation of lipids results in a cascade of events, ultimately leading to
the formation of a lipid-rich atherosclerotic lesion with a tough fibrous cap. If a plaque
becomes unstable, it is susceptible to rupture and/or erosion, thus resulting in an acute
vascular event (Rader 2007). Thus, changes in specific genetic pathways as well as
changes in vascular structure and function contribute to the accelerated progression of
vascular disease in hyperglycemic and T2D patients.
While the progression of plaques begins early in life and precedes
hyperglycemia, T2D provides an environment particularly favorable to accelerated
atherosclerosis, given that its hallmarks include increased LDL, hypertriglyceridemia,
and reduced high-density lipoprotein (HDL) (Fowler 2008). In fact, vascular diseases
and their complications (vascular ischemic events) are the principal causes of death in
people with T2D (Figure 1.1). In T2D patients for example, macrovascular events such
as stroke, myocardial infarction, and peripheral arterial disease occur earlier than in
their non-diabetic counterparts and the underlying pathologies are often more severe
(Vinik and Flemmer 2002). Atherosclerotic peripheral arteries can compromise lower
limb function, often resulting in amputation (Frisbee 2007). In fact, 70% of all non-
traumatic lower limb amputations are in T2D patients (Jain et al. 2010). Moreover, while
hyperglycemia at the time of acute ischemia has been shown to adversely affect
prognosis, the mechanisms for the hyperglycemia-exacerbated damage are not
completely understood. Additionally, lowering the risk for macrovascular complications
is complex, and often involves more than simply decreasing glucose concentrations.
6
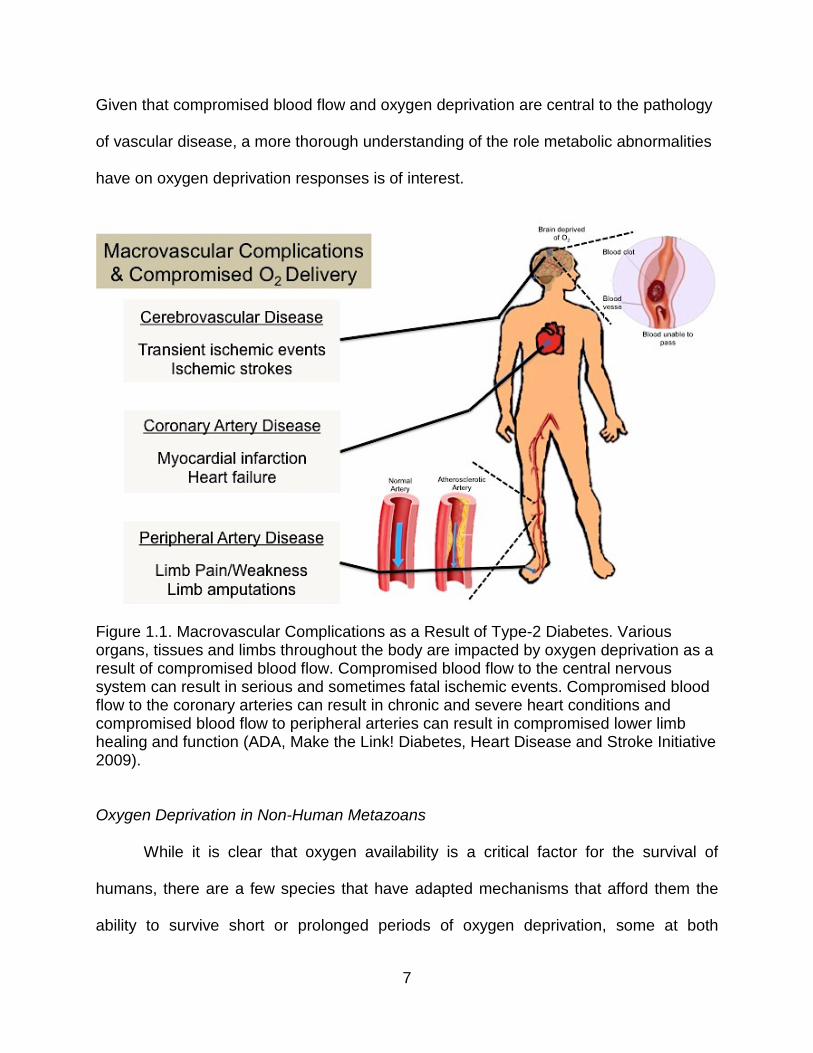
Given that compromised blood flow and oxygen deprivation are central to the pathology
of vascular disease, a more thorough understanding of the role metabolic abnormalities
have on oxygen deprivation responses is of interest.
Figure 1.1. Macrovascular Complications as a Result of Type-2 Diabetes. Various organs, tissues and limbs throughout the body are impacted by oxygen deprivation as a result of compromised blood flow. Compromised blood flow to the central nervous system can result in serious and sometimes fatal ischemic events. Compromised blood flow to the coronary arteries can result in chronic and severe heart conditions and compromised blood flow to peripheral arteries can result in compromised lower limb healing and function (ADA, Make the Link! Diabetes, Heart Disease and Stroke Initiative 2009).
Oxygen Deprivation in Non-Human Metazoans
While it is clear that oxygen availability is a critical factor for the survival of
humans, there are a few species that have adapted mechanisms that afford them the
ability to survive short or prolonged periods of oxygen deprivation, some at both
7

embryonic and adult stages. Some such organisms include, but are not limited to, the
brine shrimp (Artemia franciscana), turtle (Chrysemys picta belli), fruit fly (Drosophila
melanogaster), zebra fish (Danio rerio) soil nematode (Caenorhabditis elegans) and
killifish (Austrofundulus limnaeus) (Foe and Alberts 1985; Padilla et al. 2002; Clegg
1997; Podrabsky et al. 2007; Milton and Prentice 2007). The common responses to
oxygen deprivation among these species include a dramatic reduction in overall
metabolism, a reduction in developmental trajectory such as diapause, or entry into an
arrested state such as suspended animation.
In order to cope with low, or no oxygen (hypoxia or anoxia, respectively) in an
environment, each organism has adapted unique strategies within conserved
biochemical pathways, including a few basic adaptations that are common amongst
most oxygen-deprivation tolerant species. Physiologists Hochachka and Somero have
conducted extensive studies and outlined a biological framework for oxygen deprivation-
tolerant organisms and their conserved responses to hypoxia and anoxia at
physiological and cellular levels (Hochachka & Somero 2002). That is, initially, during
early, acute exposure to hypoxia there are three specific and profound physiological
alterations within an organism: first, a global decline in protein biosynthesis, a decline in
membrane permeability across tissues and declined firing frequency in the nervous
system, and finally, entrance into a state of altered metabolism (hypometabolic state)
allowing the demand and supply of ATP to remain in a low, steady state of flux. This is
then followed by a rescue phase in which only a subset of genes are expressed, and
others that are not involved directly with maintaining the physical integrity of the cell (i.e.
protein synthesis, anaerobic metabolism, glycogen storage, cell stabilization, hypoxia,
8
etc.) are down regulated. This model highlights the importance of a steady, low balance
of energy within an organism as well as maintenance at the cellular level of the genome,
proteome and general cell structure and function.
C. elegans as a Model to Study Oxygen Deprivation
The use of genetic model systems provides an in vivo means by which we can
experiment and elucidate specific biological phenomena that are conserved across
species, including phenomena associated with human diseases. The use of model
systems allows us to understand both normal and abnormal biological processes, and
to potentially improve the quality and duration of life in higher organisms. Model
organisms are powerful in that we can identify appropriate (not necessarily identical)
phenotypes of interest to study in a way that is ethical and feasible.
History of C. elegans
C. elegans was originally isolated in Bristol, England, and its use as a model
system was pioneered by scientist Sydney Brenner in the early 1970’s, while he
searched to find an appropriate and simple metazoan model system to study genetic
interactions, developmental biology, and neuroscience (Brenner 1974). Now, four
decades later, the microscopic nematode continues to serve as a valuable model
system and has proven useful for the examination of fundamental and complex
molecular and biological processes. Its usefulness has been thoroughly demonstrated
by numerous major discoveries and significant findings that have been the outcome of
C. elegans research, many of which resulted in Nobel Prize awards (6 C. elegans
9

related Nobel prizes were awarded in the last decade). C. elegans is a unique
multicellular model system equipped with a nearly invariable developmental program
and cell lineage (Boxem 2006). The relative timing of divisions, the orientation of
division axes, and the final cell fates are all highly reproducible, and the entire cell
lineage from a single cell embryo to the adult has been described. C. elegans was the
first metazoan model to have its genome sequenced, thus, a fully sequenced genome,
the capacity to use a wide range of molecular genetic techniques and the variety of
biological processes that can be studied has propelled the C. elegans model into the
forefront of biological research. To illustrate, many key pathways, biological phenomena
and molecular tools have been further elucidated using this model. Notably, RNA
interference to transiently knockdown gene products, the use of green fluorescent
protein to follow gene expression patterns in vivo, and discovery of the first ever
microRNA were all pioneered using C. elegans (Chalfie & Kain 2006; Fraser et al. 2000;
Jorgensen & Mango 2002; Timmons & Fire 1998). Research using this simple and well-
characterized model is convenient both in terms of time and associated cost. Wild-type
C. elegans have a short, 21-day mean lifespan, a 3-day reproductive cycle and large
brood size. They are reared in standardized and straightforward laboratory conditions
and many genetically manipulated and transgenic strains of C. elegans are available for
a nominal fee from the Caenorhabditis Genetics Center and other commercial
resources. Additionally, its transparent body allows morphological analysis of
abnormalities easily observable on a stereomicroscope, while visualization of
fluorescently tagged proteins is straightforward on a higher-powered compound
microscope.
10

C. elegans have been useful in biological research particularly because of the
overlap in conserved signaling pathways and stress response mechanisms with those in
higher organisms. The C. elegans genome for example, shares approximately 65%
identity to the human genome. C. elegans are also known to be particularly well
equipped to survive stress. In fact, C. elegans have an entire non-obligatory alternative
developmental stage called dauer, which can be induced via starvation, crowding and
other stressful conditions. Dauer larvae are characterized by a thickened cuticle, sealed
pharyngeal orifices, and resistance to desiccation, starvation and a multiple of other
stresses (Golden and Riddle 1984). Dauers enter into a reversible ageless state and
can survive for several months without food or water, and upon exposure to favorable
conditions, can exit dauer and resume normal development into adulthood virtually
indistinguishable from animals who never entered this alternative trajectory (Golden and
Riddle 1984; Cassada and Russell 1975).
C. elegans and Oxygen Deprivation
In humans and most other large animals, oxygen is delivered to cells via
oxygenated blood flow through a complex circulatory system. Thus, the oxygen
concentration at the tissue level is lower than ambient oxygen levels, and there exists
variability in oxygen levels between tissue types (Montgomery 1957; Dyson and Singer
2011). Fluctuations in the environmental availability of oxygen and the metabolic
demands of specific tissue stimulate responses to compensate and increase blood flow.
These mechanisms include vasodilation, increased respiration, and an increased
production of red blood cells. Thus it is difficult experimentally, to control the level of
11

oxygen deprivation in an intact organism. C. elegans on the other hand have several
unique characteristics, which make it a useful model in the investigation of oxygen
deprivation responses. C. elegans, for example do not have a circulatory system, and
instead they rely on diffusion for the delivery of oxygen into cells (Shen and Powell-
Coffman 2003). Therefore, using C. elegans we have a better ability to experimentally
control both genotype and cellular environment. It is important to note however, that the
specific amount of oxygen within the cells/tissues of C. elegans in hypoxic or anoxic
environments is not known, however due to the small size of the adult worm (~1mm),
the level of oxygen deprivation is likely to be more uniform, compared to more complex
vertebrates.
Additionally, C. elegans is a well-suited model for studying oxygen deprivation
since, due to its natural history it is often exposed to varying levels of oxygen. Though
often referred to as “soil-dwelling” nematodes, soil usually lacks enough organic matter
to support large, self-sustaining populations of C. elegans (Félix and Braendle 2010).
Rather, C. elegans recently have been found to prosper in rotting fruits and on rotting
herbaceous plant material in several locations in mainland France (Félix and Duveau
2012). Thus, they likely encounter microenvironments that are deprived of oxygen, and
are well adapted to survive oxygen deprivation. It has also been shown that many
mechanistic details of oxygen deprivation responses in C. elegans are common
amongst other metazoans, including humans (Powell-Coffman 2010).
In C. elegans, and in most other metazoans, a key to sensing low oxygen
concentrations within the environment is the highly conserved hypoxia-inducible factor,
HIF-1. Specific levels of oxygen in the environment however, dictate the exact
12

physiological responses to hypoxia and anoxia that the organism will utilize, and varying
oxygen levels often require specific subsets of fundamental metabolic and signaling
pathways to be active. For example, HIF-1 function in C. elegans is required for their
survival and normal development under specific hypoxic conditions (0.5% and 1%, or
0.5 and 2.0 kPa O2 respectively) however, HIF-1 is not required for the survival of anoxia
(Padilla et al. 2002). For the duration of this work I will focus on the mechanistic and
physiological responses of C. elegans to anoxia (anoxia, <0.001kPa O2, <0.0000075
mmHg).
Anoxia Tolerance in Wild-Type Adult C. elegans
Adult C. elegans, upon exposure to anoxia, enter into a reversible state of
suspended animation. In anoxia, development arrests, as does movement, eating and
reproductive processes. Wild-type (N2) C. elegans, at all stages of development, are
able to survive at least 24 hours of anoxia under standard laboratory conditions, with a
viability ≥90% (Van Voorhies & Ward 2000; Padilla et al. 2002; Hajeri et al. 2005). After
re-exposure to a normoxic environment, the nematode proceeds with normal
development, feeding behavior and reproduction and a significant majority display
normal movement and morphology, that is, they survive and recover in an unimpaired
state. Viability and recovery varies however, among developmental stages when anoxia
exposure is lengthened to 48 or 72 hours and beyond. Wild-type adult hermaphrodite
survival decreases to the point that they are almost completely non-viable when
exposed to long-term anoxia (LTA), defined as 72-hours or more of anoxia exposure
(Figure 1.3). Additionally recovery from LTA takes longer and not all physiological
13

processes appear to resume at the same rate. Moreover, animals that do survive LTA
exposure often display abnormal movement and/or morphology, that is, they survive but
display an impaired phenotype. Taken together, these data illustrate that while C.
elegans can survive some exposure to anoxia, there is an limitation to the duration in
which they can be exposed and remain viable (Padilla et al. 2002; Mendenhall et al.
2006; Mendenhall et al. 2009). Given this dose-dependent anoxia tolerance phenotype,
C. elegans can be useful in identifying factors that lead to both anoxia sensitivity
(inability to survive 24 hours of anoxia) and to anoxia tolerance (ability to survive LTA,
72 hours or more).
Figure 1.3 Viability of C. elegans exposed to anoxia. Survival of nematodes in anoxia for 24 hours (white bars), 48 hours (slashed bars), or 72 hours (black bars) was determined for all stages of development. L1 larvae were either starved or fed before placed into anoxia. Adult hermaphrodites were collected ∼24 hours after the L4 larvae stage. The data shown are representative of three independent experiments, with a total of more
14
than 400 nematodes for each of the postembryonic stages and more than 200 embryos. Error bar represents SD. All experiments were done at 20°C (Padilla et al. 2002).
Genetic Factors Influence Anoxia Tolerance in Adult C. elegans
Anoxia tolerance in C. elegans is multifactorial in nature, and to date, several
specific genes and pathways have been implicated in either conferring sensitivity to
anoxia, or as contributing to an enhanced anoxia tolerance phenotype. The pathway
best characterized in the study of anoxia tolerance in C. elegans is the insulin-signaling
pathway, a highly conserved and well-characterized signaling pathway in C. elegans
and in higher organisms.
Insulin-Signaling
Identification and characterization of the genes that function in the insulin-
signaling pathway have revealed its central roles in the regulation of metabolism,
lifespan, stress responses and dauer formation in C. elegans (Golden and Riddle 1984;
Kenyon et al. 1993; Gottlieb and Ruvkun 1994; Kimura 1997; Tissenbaum and Ruvkun
1998). Under standard laboratory conditions that support growth and development
(20°C, OP50 E. coli diet, non crowding), insulin-like ligands (e.g., ins genes & daf-28)
bind to and activate the insulin/IGF-1 receptor homolog DAF-2, which subsequently
activates a downstream AGE-1/PI3/AKT signaling cascade, which phosphorylates and
inhibits the FOXO transcription factor DAF-16 through its nuclear exclusion. In contrast,
under conditions of nutrient limitation or via a mutation in the insulin receptor daf-2,
there is an overall reduction in insulin-signaling activity, thus decreasing DAF-16
phosphorylation and allowing its translocation into the nucleus where it works together
with other nuclear factors to induce expression of a variety of genes which promote
15

dauer formation, longevity, fat metabolism, stress responses and innate immunity
(Figure 1.4) (Kenyon et al. 1993; McElwee et al. 2006; Hsu et al. 2003; Murphy et al.
2003; Oliveira et al. 2009). Reduction of insulin-signaling via a mutation in daf-2 (and
activation of DAF-16) results in several well-studied phenotypes such as increased
lifespan and resistance to heat and oxidative stress as well as resistance to a myriad of
other stresses (Gems et al. 1998). On the contrary, mutation of the transcription factor
daf-16 results in almost completely opposite phenotypes, including a shortened lifespan
and increased sensitivity to stress. It is important to note that while the human genome
encodes 10 insulin-like peptides, including insulin, insulin-like growth factors, and
relaxins, based upon bioinformatics analysis, C. elegans possess 38 genes predicted to
encode insulin-like peptides (daf-28, ins-1 through ins-37), many are divergent insulin
superfamily members, and many are clustered, indicating recent diversification of the
family (Pierce et al. 2001; Ritter et al. 2013; W. Li, Kennedy, and Ruvkun 2003; Claeys
et al. 2002). Based upon functional analysis, while the ins genes are primarily
expressed in neurons, many are also expressed in a variety of tissues including the
intestine, epidermis, vulva and pharynx. Additionally, it has been shown that some
function as daf-2 agonists (e.g., daf-28, ins-3, ins-6, ins-7, ins-33) while others function
as antagonists of daf-2 (e.g., ins-1, ins-8, ins-17, ins-18) and, based upon structural
predictions and predicted C-peptide cleavage sites typical of mammalian insulin, it is
suggested that ins-1 in C. elegans is most closely related to human insulin (Yutao Chen
and Baugh 2014; Pierce et al. 2001; Ritter et al. 2013; W. Li, Kennedy, and Ruvkun
2003; Murphy et al. 2003; Matsunaga, Nakajima, et al. 2012; Matsunaga, Gengyo-
Ando, et al. 2012; Kawano et al. 2006).
16
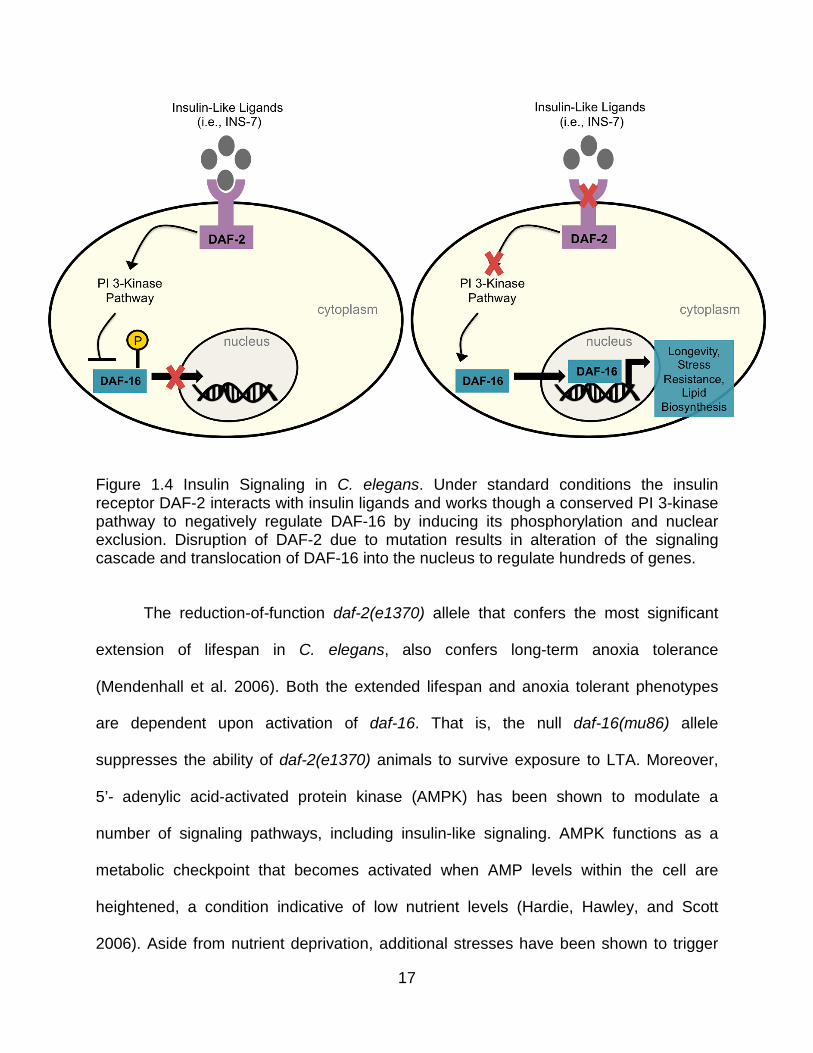
Figure 1.4 Insulin Signaling in C. elegans. Under standard conditions the insulin receptor DAF-2 interacts with insulin ligands and works though a conserved PI 3-kinase pathway to negatively regulate DAF-16 by inducing its phosphorylation and nuclear exclusion. Disruption of DAF-2 due to mutation results in alteration of the signaling cascade and translocation of DAF-16 into the nucleus to regulate hundreds of genes.
The reduction-of-function daf-2(e1370) allele that confers the most significant
extension of lifespan in C. elegans, also confers long-term anoxia tolerance
(Mendenhall et al. 2006). Both the extended lifespan and anoxia tolerant phenotypes
are dependent upon activation of daf-16. That is, the null daf-16(mu86) allele
suppresses the ability of daf-2(e1370) animals to survive exposure to LTA. Moreover,
5’- adenylic acid-activated protein kinase (AMPK) has been shown to modulate a
number of signaling pathways, including insulin-like signaling. AMPK functions as a
metabolic checkpoint that becomes activated when AMP levels within the cell are
heightened, a condition indicative of low nutrient levels (Hardie, Hawley, and Scott
2006). Aside from nutrient deprivation, additional stresses have been shown to trigger
17

AMPK activation, such as ischemia/oxygen deprivation, exercise and skeletal muscle
contraction. In C. elegans, aak-2 is one of 2 homologs of the catalytic alpha-subunit of
AMPK, which likely acts in parallel with DAF-16. While the overall rate of survival of
wild-type hermaphrodites and the anoxia-tolerance of daf-2(e1370) is not affected by
the knockdown of aak-2, daf-2(e1370) animals do display a significant increase in their
level of impairment following 72-hour anoxia exposure (LaRue & Padilla 2011). After 96-
hours of anoxia however, aak-2 knockdown suppresses the survival rate in both wild-
type animals grown at high temperature (28°C), and in daf-2(e1370) animals. These
data suggest that AMPK plays a role in anoxia tolerance and is necessary to preserve
an unimpaired, phenotype following exposure to long-term oxygen deprivation.
Metabolism
As previously mentioned, the daf-2(e1370) allele displays a LTA tolerant
phenotype, which is suppressed by mutations in daf-16 (Mendenhall et al. 2006). An
RNAi screen of genes known to be upregulated by DAF-16 led to the identification of
gpd-2 and gpd-3 as suppressors of the daf-2(e1370) anoxia tolerant phenotype. These
genes are 2 of 4 isoforms of the glycolytic enzyme glyceraldehyde-3-phosphate
dehydrogenase (GAPDH). The daf-2(e1370);gpd-2/3(RNAi) animal exposed to one day
of high-temperature anoxia (28°C) or 72 hours of long-term anoxia (at 20°C) have a
significantly reduced viability in comparison to daf-2(e1370) control animals.
Additionally, while the gpd-2/3(RNAi) animals survive short-term anoxia exposure, they
exhibit an impaired phenotype post-recovery. While a number of other glycolytic genes
were subjected to RNAi, no additional glycolytic genes resulted in anoxia sensitivity.
Together these data suggest that the anoxia sensitive phenotype induced via
18

knockdown of gpd-2/3 may be due to something other than merely a change in
glycolytic flux, and that the glycolytic enzymes gpd-2/3 are specifically required for long-
term anoxia tolerance in the context of reduced insulin signaling. It is difficult however to
assess the extent by which each glycolytic enzyme might be impacted via RNAi, thus
the specific aspects of glycolytic reduction and its impact on anoxia survival remain to
be determined.
Reproductive State/ Notch-Signaling
A number of C. elegans mutants that display an extension in lifespan also exhibit
altered rates of fecundity and increased resistance to stress (Gems et al. 1998;
Friedman & Johnson 1987). For example, a sterile germline-less genetic mutant, glp-
1(e2131), displays a significantly increased longevity phenotype. In C. elegans, glp-1
encodes an N-glycosylated transmembrane receptor within the LIN-12/Notch family.
While glp-1(e2141) mutants have a somatic gonad, they are incapable of producing
oocytes and sperm (Crittenden et al. 1994; Mendenhall, LaRue, and Padilla 2006b).
The sterile 1-day old adult glp-1(e2141) animals, similar to daf-2(e1370) animals, are
long-term anoxia tolerant, and display survival rate greater than 95% (Mendenhall et al.,
2009). Additionally, the glp-1(e2141);daf-16(mu86) double mutant survives long-term
anoxia at a high overall rate, suggesting that, unlike daf-2(e1370) animals, the glp-1
anoxia tolerant phenotype is independent of DAF-16 activity (LaRue & Padilla 2011).
However, the glp-1(e2141) tolerant phenotype can be partially suppressed when aak-2
was knocked down via RNAi in the glp-1(e2141);daf-16(mu86) double mutant, therefore
further suggesting that AMPK may play a role in anoxia tolerance, especially in the
context of insulin signaling.
19

Lipid Biosynthesis
Lipids are a diverse group of naturally occurring water-insoluble molecules. The
mammalian lipidome includes major lipid classes such as triacylglycerol, sphingolipids,
vitamins, steroids, ceramide, eicosanoids, phospholipids and glycolipids. The main
biological functions of these lipids include storing energy, signaling, and acting as
structural components of cell membranes. In C. elegans it has been shown in vitro, that
anoxia induces a significant increase in the activity of NADP-dependent isocitrate
dehydrogenase (HCDH; fatty acid oxidation). Given that The HCDH is located in the
mitochondria and is normally involved in the β-oxidation of fatty acids (an oxygen-
requiring process by which fatty acids are broken down), it was hypothesized that under
anoxic conditions, a reversal of β-oxidation results and excretory fatty acids are
synthesized to provide a sink for electrons to maintain proper redox balance for
continued glycolytic activity under anoxic conditions (Paul et al. 2000). Given that in
anoxia, C. elegans is a mixed acid fermenter, these fermentations must be redox
balanced, as their acid end products can build up over time (Butler et al. 2012). It was
later confirmed via GC-MS analysis of the C. elegans exometabolome in anoxia, that
indeed C. elegans employ short-chain unsaturated fatty acids (e.g., crotonyl-CoA, 3-
methylcrotonyl-CoA, methacryl-CoA and trans-2-methyl-but-2-enoyl-CoA) as terminal
electron acceptors to remove reducing equivalents in the form of volatile waste
products. Thus these data suggest that increased fatty acid synthesis in anoxia might
be important for anabolic activity and to regenerate reducing equivalents that are
required for continued glycolytic activity (Butler et al. 2012).
20

Moreover, in many models of anoxia and hypoxia, a link between chronic oxygen
deprivation and fat accumulation has been suggested. For example, oxygen-deprived
tumor cells display an enhanced level of de novo fatty acid biosynthesis and patients
suffering from sleep apnea or chronic cardio-pulmonary diseases (conditions in which
patients are chronically deprived of oxygen) display an increased risk for fat
accumulation (Romero-Garcia et al. 2014; Belamarich et al. 2000; Lam and Ip 2007).
Increases in fatty acid biosynthesis can impact fundamental cellular processes, signal
transduction pathways and gene expression, given the ability of lipid molecules to
modify cytosolic proteins, enzymes, and membrane proteins. Likewise, in C. elegans it
was determined that exposure to anoxia for a period of 4 or more hours, results in up
regulation of the sterol regulatory element-binding protein 1 (SREBP1) homolog sbp-1
(a transcription factor important for proper lipid homeostasis and fat accumulation).
Additionally it was shown that C. elegans display a significant accumulation of total lipid
content following a 24 hour recovery from anoxia, and this accumulation requires sbp-1
activity (Taghibiglou et al. 2009). These data suggest that SREBP1 may function as an
oxygen sensor in the regulation of lipid metabolism and likely plays a role in the
pathogenesis of lipid accumulation following oxygen deprivation. Also, it appears that
changes in lipid metabolism and lipid homeostasis are an essential component of the
response to anoxia.
Lipid Signaling
There is also evidence that lipid signaling has a critical role in oxygen deprivation
response and survival. A number of specific lipids function as known signaling
molecules, and have roles in a variety of signal transduction pathways. For example,
21

ceramide and its metabolites constitute a diverse group of lipids that have been
established as lipid second messengers or metabolic signals, and have known roles as
structural entities of biological membranes and regulators of cellular growth,
differentiation, insulin action and cell death (Goñi and Alonso 2006). Additionally,
imbalances in these lipid-signaling networks can contribute to the pathogenesis of
human diseases. Aligned with this idea is the fact that alterations of ceramide
biosynthesis in C. elegans result in altered anoxia tolerance (Menuz et al. 2009).
Moreover, in C. elegans it was recently demonstrated that worms defective in specific
ceramide and/or sphingomyelin biosynthesis are deficient in mitochondrial surveillance
(a mechanism which detects mitochondrial dysfunction), and the addition of a particular
ceramide species (C24) could rescue these defects (Liu et al. 2014a). Additionally Liu et
al. showed via immunostaining, that ceramide co-localizes with mitochondria, especially
during mitochondrial dysfunction. Thus it is likely that ceramides have a role in the early
detection of mitochondrial dysfunction and might act by marking specific dysfunctional
mitochondrial domains. While ceramides might act as either signaling molecules
themselves, or as components of cellular structures necessary for other signals to
emerge (e.g., components of lipid rafts), Liu et al. hypothesize that ceramides are likely
working as signaling molecules, since ceramide synthesis was induced by mitochondrial
insult, and ceramides were localized to the site of injury.
C. elegans possess 3 ceramide synthase genes, hyl-1, hyl-2 and lagr-1. A loss of
function hyl-2(gnv1) allele and the deletion hyl-2(tm2031) allele confer sensitivity to 48
hours of anoxia (Menuz et al. 2009). Mutation of the related ceramide synthase hyl-1,
on the other hand, confers increased LTA tolerance, and it was determined that hyl-1
22

deletion mutants display an increased level of hyl-2 mRNA (Menuz et al. 2009; Tedesco
et al. 2008b). It was also shown that HYL-1 is not a sufficient substitute for HYL-2 in hyl-
2 deficient worms, as hyl-2(gnv1);hyl-1::GFP animals remain sensitive to 48 hours of
anoxia. HYL-1 and HYL-2 have complementary specificities for fatty acyl chains, and C.
elegans lacking functional hyl-2 display fewer ceramide (Cer) and sphingomyelin (SM)
species with C20 to C22 fatty acyl chains, and more with C24 to C26 compared to wild-type
animals. By contrast hyl-1 deficient C. elegans expressed more C20 to C22 Cer and SMs
compared to wild-type worms, but a similar amount with C24 to C26 fatty acyl chains.
Thus, efficient synthesis of C20 to C22 Cer and SM species requires HYL-2 whereas
synthesis of species containing C16 to C18 and C24 to C26 fatty acid residues requires
HYL-1. Additionally, LAGR-1 (much like HYL-1) primarily contributes to the synthesis of
long-chain fatty acid containing SM and Cer species (Mosbech et al. 2013). These data
together suggest that anoxia tolerance likely requires one or more specific C20 to C22
ceramides and/or sphingomyelin species, that are either specifically or preferentially
synthesized by HYL-2 (Menuz et al. 2009). Although ceramides have been implicated in
ischemic responses in humans, the functional role that ceramides play in anoxia
survival is not well understood (Novgorodov et al. 2008). Ceramides have been reported
previously to be effectors of kinases and phosphatases in various biological processes.
It is likely that during anoxia, the role of key ceramide species is their interaction with
specific molecules integrated into other cellular pathways.
Moreover, Menuz et al. further demonstrated that hyl-2 and daf-2 might interact
genetically to influence anoxia survival. For example, daf-2(el370);hyl-2(gnv1) double
mutant worms survived 48 hours of anoxia significantly better than hyl-2(gnv1) controls,
23

but less than daf-2(e1370) controls. Thus, it appears that at least with respect to anoxia,
ceramide (HYL-2) and insulin signaling (DAF-2) are acting in parallel pathways that
mutually influence one another. Additionally, the interaction between ceramides and
insulin signaling appears to be conserved across species, given that in humans and
other mammals, it has been demonstrated that ceramides influence several distinct
intermediates in the insulin-signaling pathway and have a role in the induction of insulin
resistance (Boon et al. 2013; P. J. Larsen and Tennagels 2014; Xia, Morley, and
Scherer 2014; Holland et al. 2007; Lopez et al. 2013). Thus, the specific role of
ceramides in oxygen deprivation, mitochondrial dysfunction and insulin signaling is of
interest.
Environmental Changes Influence Anoxia Tolerance in Adult C. elegans
Among other physiological concerns, low oxygen conditions can limit available
energy stores that are necessary for metabolism and proper maintenance of
concentration gradients and critical cellular structures. In fact a great number of anoxia-
tolerant species display large reserves of glycogen that can be used during anaerobic
glycolysis for this type of maintenance. Using carminic acid, a fluorescent dye used to
detect glycogen and trehalose stores, La Rue et al. found that carbohydrate levels in C.
elegans correlated with varying levels of long-term anoxia tolerance. Additionally
animals displayed decreased carbohydrate levels following exposure to long-term
anoxia (LaRue & Padilla 2011). Thus, the level of available carbohydrates during anoxia
likely contributes to anoxia survival and post-anoxia recovery in C. elegans and these
stores are likely utilized during anoxia exposure. Along those same lines, LaRue et al.
24
provided evidence that the particular environmental conditions in which C. elegans are
exposed to preceding anoxia exposure, can precondition for an enhanced LTA survival
phenotype. For example, when animals were exposed to various environmental pre-
conditioning regimens their levels of stored carbohydrates and anoxia tolerance were
altered. Wild-type C. elegans cultured and fed under standard laboratory conditions (a
diet of OP50 E. coli and reared at 20°C) are sensitive to long-term anoxia, however,
when raised at 25°C and fed the HT115 strain of E. coli, there is a significant increase in
survival and an increase in survivors with an unimpaired phenotype. Although animals
grown at 25°C on the standard OP50 diet also survive long-term anoxia, they exhibit an
impaired phonotype upon recovery displaying both motility and tissue morphology
defects. Animals raised on HT115 bacteria at 25°C also displayed a much greater
intensity of carminic acid staining as compared to animals raised at either 20°C on
either food source or on OP50 at 25°C. Additionally, long term anoxia tolerant
genotypes, including daf-2(e1370) and glp-1(e2141), also displayed a high level of
carminic acid staining (regardless of rearing at 25°C or an HT115 food source) prior to
anoxia exposure, thus further suggesting a potential necessity of carbohydrate stores
and their utilization for proper physiological maintenance during anoxia exposure. RNAi
knockdown of a catalytic alpha-subunit of 5’-AMP-activated protein kinase (aak-2)
suppressed this high level of carbohydrate stores in daf-2(e1370) animals, and when
exposed to LTA they displayed an increased level of impaired motility compared to daf-
2(e1370) controls. Furthermore, aak-2 knockdown suppressed the daf-2(e1370) LTA
tolerant phenotype when exposed to extended anoxic stress (96 hours). These data
together suggest that the level of available carbohydrates during anoxia can influence
25

survival and recovery of normal morphology and motility. Additionally, preconditioning at
a higher temperature and feeding with HT115 E. coli may have equipped C. elegans to
better survive prolonged anoxic exposure, at least in part by increasing the amount of
stored carbohydrate available. Further evidence has been shown to support the idea
that metabolic stores are altered in C. elegans fed the HT115 E. coli strain since the
HT115 strain has a higher carbohydrate content than the OP50 strain (Brooks, Liang,
and Watts 2009). Thus, there appears to be a synergistic relationship between thermal
preconditioning and specific food source.
Research Focus
As discussed previously, individuals with obesity or T2D often have compromised
oxygen delivery and an increased vulnerability to oxygen-deprivation related vascular
complications, such as ischemic stroke, macrovascular disease and myocardial
infarction. Moreover, hyperglycemic patients are not only more susceptible to vascular
disease, damage and prognosis of patience following a vascular event is worse. It is not
well understood why, mechanistically, excess glucose increases sensitivity to ischemic
events. Thus, it is of interest to identify the molecular changes glucose supplementation
or hyperglycemia can induce, which in-turn compromise oxygen deprivation responses.
Additionally, given the implicated roles of lipid biosynthesis and signaling in the context
of oxygen deprivation and T2D, it is of particular interest to determine the interplay
between lipid homeostasis, insulin signaling and their contributions to oxygen
deprivation responses. My objective is to use the C. elegans model system to identify
genetic and cellular changes that modulate their response to glucose-supplementation,
26
oxygen deprivation and a combination of the two. To better understand the relationship
between glucose-supplementation on oxygen deprivation, I developed an assay to
analyze the impacts of glucose supplementation on anoxia response and survival in C.
elegans (Chapter 2). Additionally, in order to determine specific genetic pathways that
modulate the C. elegans response to glucose and anoxia, I evaluated the roles of
insulin signaling, fatty acid and ceramide biosynthesis as well as antioxidant activity
(Chapter 3). Finally, to determine how glucose supplementation, prior to anoxia, impacts
C. elegans, in a collaborative effort, I along with M.L. Ladage, R.K. Azad and P.A.
Padilla used RNA-sequencing to compare the gene expression profiles of wild-type
animals fed either a standard or a glucose-supplemented diet (Chapter 4). Together
these experiments suggest that C. elegans can be used as a model to identify specific
molecular mechanisms that modulate glucose-induced sensitivity to oxygen-deprivation.
27

CHAPTER 2
GLUCOSE IMPACTS OXYGEN DEPRIVATION RESPONSE AND SURVIVAL IN
C. elegans*
Introduction
Glucose Supplementation in C. elegans
Several studies have shown that a glucose supplemented diet impacts the
metabolism, development and stress responses of C. elegans, and that the underlying
identified pathways and cellular processes involving glucose metabolism are conserved
in metazoans (Choi 2011; Lee et al. 2009; Mondoux et al. 2011; Mendler et al. 2014;
Forsythe et al. 2006; Hashmi et al. 2013; Kitaoka et al. 2013). C. elegans recently has
been used as a model to evaluate the specific molecular targets affected by
pathological glucose concentrations and they have been implicated as a model to study
glucose toxicity, type-2 diabetes and obesity both inside and outside the context of
insulin signaling. For example, Lee et al. determined that supplementing C. elegans with
glucose at concentrations between 0.05 to 2.0% (2.775 to 111mM) is sufficient to
significantly decrease the lifespan of wild-type adults. They suggest that the lifespan
reduction is a result of FOXO transcription factor DAF-16 inhibition (Lee et al. 2009).
Additionally, Schlotterer et al. corroborated these data and further suggested that C.
elegans can be a suitable model to study glucose toxicity. It was determined that
*Parts of this chapter have been previously published, either in part or in full, from Garcia AM, Ladage ML, Dumesnil DR, Zaman K, Shulaev V, Azad RK, Padilla PA. Glucose Induces Sensitivity to Oxygen Deprivation and Modulates Insulin/IGF-1 Signaling and Lipid Biosynthesis in Caenorhabditis elegans. Genetics 2015. Reproduced with permission from the Genetics Society of America.
28

high glucose conditions also limit C. elegans lifespan by increasing reactive oxygen
species (ROS) formation and increasing the modification of mitochondrial proteins by
advanced glycation end products (AGEs), independent of insulin signaling. Additionally,
Schlotterer et al. found that glucose-induced lifespan reduction could be ameliorated via
up regulation of glyoxylase-1, which acts to detoxify methylglyoxal, and thus prevent
mitochondrial dysfunction (Schlotterer et al. 2009). In a later study, it was found that
human insulin was sufficient to ameliorate glucose-induced lifespan reduction in a
glyoxylase-1 dependent manner. Under high glucose conditions, human insulin reduced
the accumulation of glucose in C. elegans, reduced the formation of ROS and AGEs,
and increased the activity of superoxide dismutase (an antioxidant). The effects of
human insulin are, not surprisingly, mediated through the insulin signaling pathway and
require activity of the FOXO transcription factor daf-16 (Mendler et al. 2014). While
human insulin is an agonist of the mammalian insulin receptor, in C. elegans human
insulin has been only been shown as an antagonist of DAF-2 (Pierce et al. 2001).
Further, Mondoux et al. determined that O-linked-N-acetylglucosamine (O-GlcNAc)
cycling and insulin signaling are both essential components of the C. elegans response
to glucose toxicity under even higher concentrations of glucose (e.g., concentrations at
or above 250mM) (Mondoux et al. 2011c). It was determined that a number of insulin-
dependent processes are altered in response to high glucose, including, fertility,
reproductive timing, and dauer formation. Together these data indicate that the C.
elegans response to glucose includes mechanisms similar to those seen in mammalian
systems (e.g., involvement of the insulin signaling and O-GlcNAc cycling pathways,
induction of ROS and AGEs, and reduced lifespan and fertility), and that the C. elegans
29
model has the potential to aid in the identification of mechanistic details associated with
glucose-induced genetic, cellular and physiological changes. Additionally the potential
exists to provide a better understanding and treatment approach to type-2 diabetes and
its associated complications.
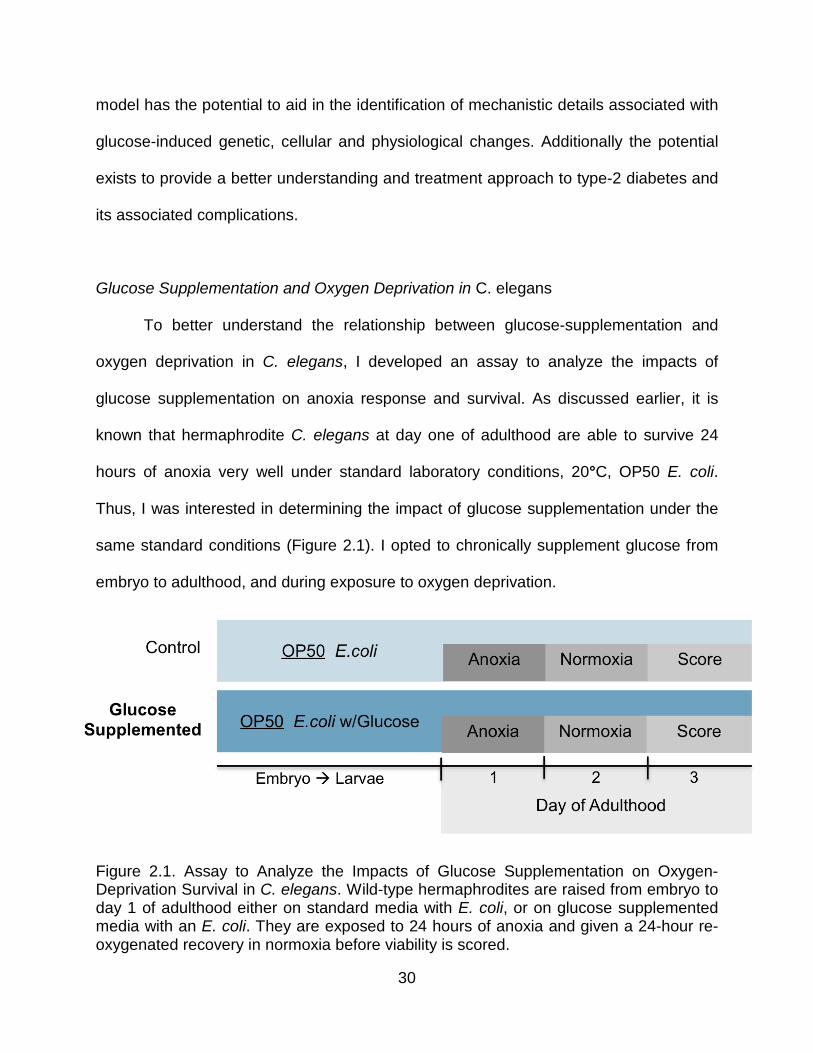
Glucose Supplementation and Oxygen Deprivation in C. elegans
To better understand the relationship between glucose-supplementation and
oxygen deprivation in C. elegans, I developed an assay to analyze the impacts of
glucose supplementation on anoxia response and survival. As discussed earlier, it is
known that hermaphrodite C. elegans at day one of adulthood are able to survive 24
hours of anoxia very well under standard laboratory conditions, 20°C, OP50 E. coli.
Thus, I was interested in determining the impact of glucose supplementation under the
same standard conditions (Figure 2.1). I opted to chronically supplement glucose from
embryo to adulthood, and during exposure to oxygen deprivation.
Figure 2.1. Assay to Analyze the Impacts of Glucose Supplementation on Oxygen-Deprivation Survival in C. elegans. Wild-type hermaphrodites are raised from embryo to day 1 of adulthood either on standard media with E. coli, or on glucose supplemented media with an E. coli. They are exposed to 24 hours of anoxia and given a 24-hour re-oxygenated recovery in normoxia before viability is scored.
30

Results
A Glucose Supplemented Diet Impacts Stress Responses
Glucose Induces Sensitivity to Oxygen Deprivation
Although it is known that both genotype and environment influence oxygen
deprivation responses, less is understood regarding the impact diet has on these
responses (LaRue and Padilla 2011; Mendenhall et al. 2009; Powell-Coffman 2010). I
determined that a glucose-supplemented diet reduces the ability of wild-type, 1 day old
adult C. elegans to survive anoxia (Figure 2.2A). Glucose induces anoxia sensitivity in a
dose dependent manner, as the concentration of glucose increases, the ability of C.
elegans to survive anoxia exposure is decreased (Figure 2.2A). While conducting the
anoxia sensitivity assays, I also examined whether the animal showed an impaired
phenotype (abnormal movement or morphology) after anoxia exposure. While a lower
concentration of glucose (0.0625%) did not reduce anoxia survival rate, it did increase
the level of impairment in animals following anoxia exposure. Since previous C. elegans
studies have shown that supplementation with 0.5% glucose (or 27.75mM) is sufficient
to significantly increase whole worm glucose concentrations and mimic human levels of
hyperglycemia, I chose to use this concentration for further analysis (Lee et al. 2009;
Schlotterer et al. 2009). Animals fed a 0.5% glucose-supplemented diet had a
decreased ability to survive even shorter bouts of anoxia (12-24 hours) (Figure 2.2B).
Glucose Induces Sensitivity to ROS
31

There is evidence that a high-glucose diet increases the level of ROS, and so we
wanted to determine if glucose supplementation increased sensitivity to paraquat-
induced oxidative stress (Schlotterer et al. 2009; Schulz et al. 2007; Mendler et al.
2014). Paraquat is a potent generator of intracellular superoxide, a reactive species of
oxygen (Hassan and Fridovich 1978). We found that adults raised on a 0.5% glucose
supplemented diet were more sensitive to paraquat (Figure 2.2C) indicating that anoxia
may not be the only stress response negatively affected by a glucose-supplemented
diet.
32

Figure 2.2. A Glucose Supplemented Diet Negatively Impacts C. elegans Ability to Survive Anoxia and Paraquat Exposure. (A) A diet supplemented with glucose (>.125%) reduces the ability of C. elegans to survive exposure to 1 day of anoxia. Bar indicates a significant decrease in the number of animals alive in comparison to animals not fed glucose prior to anoxia exposure. The * indicates that animals fed an OP50 only diet had a significant increase in unimpaired animals after anoxia treatment in comparison to all animals fed a glucose diet (1 way ANOVA, Bonferonni Multiple Comparisons, p <0.05; 3 independent experiments, with n ≥ 100, were conducted). (B) Animals fed a glucose-supplemented diet are sensitive to decreased anoxia exposures. The * indicates that there was a significant decrease in survivorship in animals fed a glucose diet prior to anoxia exposure in comparison to animals fed a glucose-supplemented diet and not exposed to anoxia. The bar indicates a significant decrease in unimpaired phenotype in comparison to control animals not fed a glucose-supplemented diet (1 way ANOVA, Bonferonni Multiple Comparisons, p<0.05; 3 independent experiments, with n ≥ 100, were conducted). (C) Animals fed a glucose-supplemented diet are sensitive to the ROS generator paraquat. 1-day old adult animals were placed on OP50 E. coli food containing paraquat or .5% glucose and paraquat. Asterisk denotes a significant difference in percent survival (two-way ANOVA, p<001). For all experiments error bar equals standard deviation.
A Glucose Supplemented Diet Increases Whole Worm Glucose Concentrations
It was my aim to reach a glucose concentration in a C. elegans whole-body
extract of 10–20 mM/L (≥180 mg/dL), resembling the glucose concentrations in diabetic
patients under poor glucose control (Table 1.1). Therefore, given that the addition of just
0.5% glucose is sufficient to induce anoxia sensitivity in wild-type worms, and previous
studies have shown that supplementation with 0.5% glucose (or 27.75mM) is sufficient
to increase whole worm glucose concentrations, I chose to use this concentration for
further analysis. For 0.5% glucose supplementation conditions, 300 μl of glucose
solution at a concentration of 925mM was added to the agar of 10mL NGM plates
(50mg/plate) prior to the addition of E. coli. The glucose was allowed to diffuse for at
least 24 hours into the media, to reach a steady state as described (Schlotterer et al.
2009). Plates were seeded with 300μL of E. coli (OD600nm, 0.6≤0.9) that was spread
evenly across the plate’s entirety. The bacteria solution was allowed to dry completely
33

before animals were placed on the media. Freshly made plates were used within a 7-
day period. To confirm that 0.5% glucose supplementation was sufficient to increase
whole worm glucose concentrations to mimic those of T2D patients, an extract of C.
elegans was prepared by sonication and glucose concentration was analyzed using a
Chemwell-T autoanalyzer. Glucose concentrations of whole worm extracts were
normalized to the amount of total protein present in each sample analyzed. In all
subsequent experiments, C. elegans cultured under glucose supplementation
conditions refers to a glucose concentration of 0.5% in the agar (unless otherwise
stated), because it resulted in a glucose concentration ≥13mmol/L in the C.
elegans whole-body extract (Figure 2.3).
Figure 2.3. A Diet Supplemented With Glucose Increases the Glucose Concentration in Whole Worm Extracts. Animals were raised from embryo to day one of adulthood on NGM plates supplemented with 0.5% glucose and seeded with OP50 E. coli. Glucose was quantified in C. elegans whole-body extracts and normalized to total protein concentration. On average, under glucose supplementation conditions, the glucose concentration in whole-worm extracts was 14 mM/L (250 mg/dL) per mg protein, mimicking blood glucose levels in hyperglycemic humans. On average, C. elegans fed a standard diet had glucose levels below 10 mM/L (174 mg/dL) per mg protein, thus in the range below T2D. (Unpaired t test, p=0.1; 3 independent experiments, with n ≥ 300, were conducted)
34

Glucose and Fructose Supplementation Induce Anoxia Sensitivity
I also determined that C. elegans are sensitive to anoxia when fed a fructose-
supplemented diet, indicating that both glucose and fructose negatively impact oxygen
deprivation responses (Figure 2.4). Since it is possible that glucose is inducing anoxia
sensitivity by altering the osmotic environment in which C. elegans are exposed, I
examined whether or not other carbohydrate molecules that likely alter the osmotic
environment in the same manner, but cannot be readily metabolized by C. elegans,
would also alter anoxia survival. I fed animals a mannitol and a sucrose-supplemented
diet (at the same concentration as glucose and fructose) and determined that animals
fed these carbohydrates are able to survive 24 hours of anoxia similar to un-
supplemented controls. These data suggest that osmotic stress per se does not alter
anoxia survival in adult animals (Figure 2.4). The metabolism of sucrose requires an
enzyme to cleave sucrose into fructose and glucose, which may be rate limiting; thus it
is possible that this is the reason sucrose supplementation did not suppress anoxia
survival.
35

Figure 2.4. A diet supplemented with fructose reduces the ability of C. elegans to survive when exposed to 1 day of anoxia. A diet supplemented with fructose (0.5%) reduces the ability of C. elegans to survive exposure to 1 day of anoxia. Bar indicates a significant decrease in the number of animals alive in comparison to animals not fed glucose prior to anoxia exposure. (1 way ANOVA, Bonferonni Multiple Comparisons, p <0.05; 3 independent experiments, with n ≥ 100, were conducted).
E. coli Food Source Impacts Glucose- Induced Anoxia Sensitivity
The specific type of bacterial food source that they consume can regulate the
lifespan and metabolism of C. elegans. The two most common E. coli strains used
to feed C. elegans are the B-derived strain, OP50, and the K12-derived strain, HT115.
Each of these strains is known to have variations in nutrient composition (Reinke et al.
2010; Brooks et al. 2009). To assess if the commonly used OP50 bacteria’s capacity to
import glucose affected the response C. elegans had to a glucose-supplemented diet,
we used the OP50 E. coli glucose-transporter mutant strain ΔPTS-OP50. The anoxia
sensitivity was not as pronounced in the animals fed 0.5% glucose with the glucose-
transporter mutant strain of E. coli (ΔPTS-OP50), thus suggesting that the uptake
and/or metabolism of glucose by the bacteria also impacts anoxia survival (Figure 2.4).
There was however, a significant decrease in anoxia survival when the animals were
fed a ΔPTS-OP50 diet supplemented with higher concentrations of glucose (2%)
(Figure 2.5). Additionally I determined that glucose had a similarly affected anoxia
survival when animals are fed with the E. coli strains OP50 or with HT115 as the food
source, both strains are able to transport and metabolize glucose (Figure 2.5). These
data indicate that a glucose-supplemented diet alters anoxia survival and that the ability
of the E. coli to transport and metabolize glucose affects this response.
36
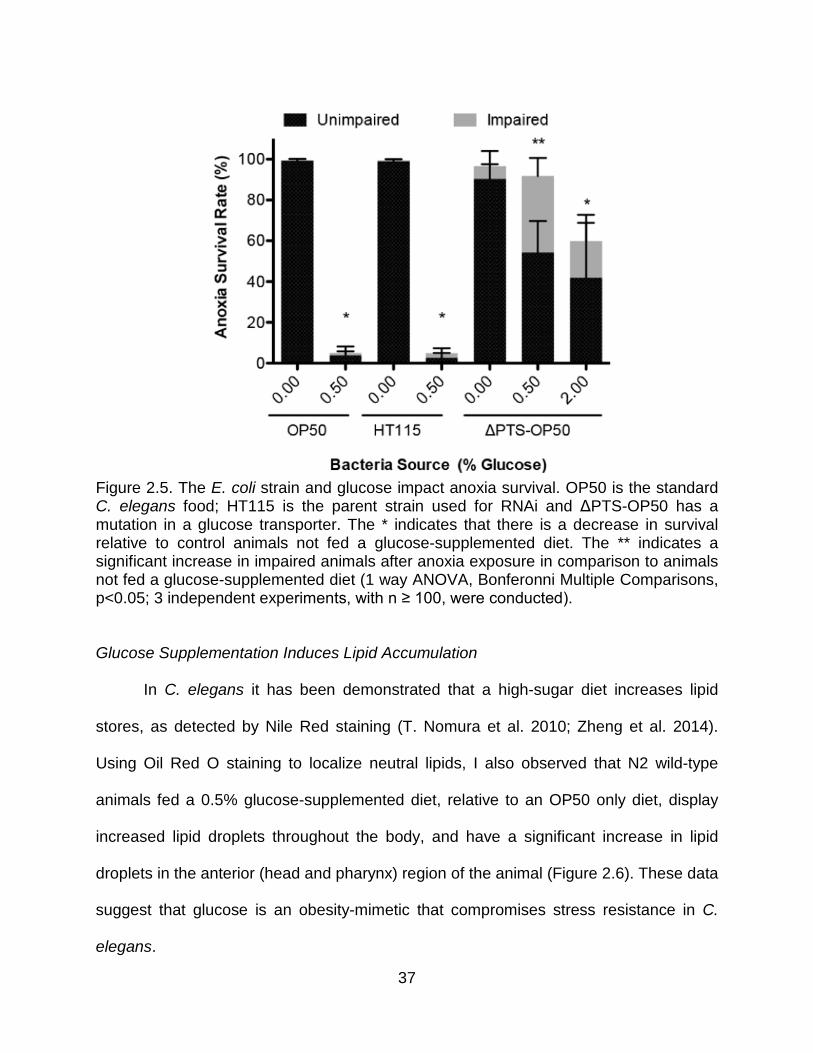
Figure 2.5. The E. coli strain and glucose impact anoxia survival. OP50 is the standard C. elegans food; HT115 is the parent strain used for RNAi and ΔPTS-OP50 has a mutation in a glucose transporter. The * indicates that there is a decrease in survival relative to control animals not fed a glucose-supplemented diet. The ** indicates a significant increase in impaired animals after anoxia exposure in comparison to animals not fed a glucose-supplemented diet (1 way ANOVA, Bonferonni Multiple Comparisons, p<0.05; 3 independent experiments, with n ≥ 100, were conducted).
Glucose Supplementation Induces Lipid Accumulation
In C. elegans it has been demonstrated that a high-sugar diet increases lipid
stores, as detected by Nile Red staining (T. Nomura et al. 2010; Zheng et al. 2014).
Using Oil Red O staining to localize neutral lipids, I also observed that N2 wild-type
animals fed a 0.5% glucose-supplemented diet, relative to an OP50 only diet, display
increased lipid droplets throughout the body, and have a significant increase in lipid
droplets in the anterior (head and pharynx) region of the animal (Figure 2.6). These data
suggest that glucose is an obesity-mimetic that compromises stress resistance in C.
elegans.
37

Figure 2.6. A glucose-supplemented diet induces lipid accumulation. Oil Red O staining was used to localize lipids within the animal. (A) Wild-type animals fed a standard diet or a glucose-supplemented diet, were stained with Oil Red O. Representative images of whole animals are shown. (B) Enlarged image of the anterior region of the animals. Lipids can be detected in the intestine, oocyte/germline and pharynx regions. Arrow points to the posterior region of the terminal bulb of the pharynx, near the pharyngeal-intestinal valve. Note that glucose fed animals contain lipid droplets in the pharynx region. There is more Oil Red O staining in glucose-fed animals relative to control-fed animals. (C) The presence or absence of lipids within the anterior region (head and pharynx) of the animal was assayed. At least 10 animals from three independent experiments were randomly imaged and assayed for the presence of lipid droplets in the anterior and pharynx regions. Error bar equals standard deviation; bar indicates there was a significant difference in glucose-fed animals in comparison to OP50 fed control animals (1 way ANOVA, Bonferonni Multiple Comparisons, p<0.05).
38

CHAPTER 3
GLUCOSE-INDUCED ANOXIA SENSITIVITY IS MODULATED VIA INSULIN
SIGNALING, LIPID BIOSYNTHESIS AND ANTIOXIDANT ACTIVITY†
Introduction
Insulin Signaling
Given the central role of insulin signaling in glucose homeostasis, I was
interested in examining the C. elegans insulin signaling pathway and its role in glucose-
induced anoxia sensitivity. As discussed previously, under conditions of nutrient
limitation or via a mutation in the insulin receptor daf-2, the transcription factor DAF-16
is activated and translocated into the nucleus where it works together with other nuclear
factors to induce expression of a variety of genes which promote stress tolerance,
longevity, fat metabolism, and innate immunity (Figure 1.4) (Kenyon et al. 1993;
McElwee et al. 2006; Hsu et al. 2003; Murphy et al. 2003; Oliveira et al. 2009;
Mendenhall et al. 2006). Insulin receptor mutants (daf-2 mutants) for example, display
several well-studied phenotypes, including increased tolerance to anoxia and oxidative
stress, higher amounts of TAG stores and a significantly increased lifespan. Additionally
it has been demonstrated that glucose shortens the lifespan of C. elegans via down
regulation of FOXO transcription factor DAF-16 (S. J. Lee, Murphy, and Kenyon 2009).
Thus, it is of interested to determine what role, if any, insulin signaling plays in the C.
elegans response to anoxia under glucose supplementation conditions.
† Parts of this chapter have been previously published, either in part or in full, from Garcia AM, Ladage ML, Dumesnil DR, Zaman K, Shulaev V, Azad RK, Padilla PA. Glucose Induces Sensitivity to Oxygen Deprivation and Modulates Insulin/IGF-1 Signaling and Lipid Biosynthesis in Caenorhabditis elegans. Genetics 2015. Reproduced with permission from the Genetics Society of America.
39

Lipid Biosynthesis
Fatty Acid Biosynthesis
Moreover, associated with the increased consumption of dietary fats and sugars
in the United States, is an increase in the rates of obesity and metabolic syndrome. Key
players in the regulation of lipid metabolism and fat storage are stearoyl-CoA
desaturases (SCD), also known as Δ9 desaturases. The Δ9 desaturase is a key
enzyme in the de novo lipid biosynthetic pathway, and human studies have identified
genetic variations in SCD1 that are associated with differential body fat distribution,
insulin sensitivity, and the development of metabolic syndrome (Gong et al. 2011;
Warensjö et al. 2007). Additionally, SCDs can also be regulated via dietary
carbohydrates and by hormones such as insulin and leptin (Ntambi 2004).
C. elegans possess three Δ9 desaturases, encoded by fat-5, fat-6 and fat-7, that
are responsible for the formation of monounsaturated fatty (MUFAs) acids from
saturated fatty acids (SFAs) (Figure 3.1) (Brock, Browse, and Watts 2007; J L Watts
and Browse 2000; Shi et al. 2013). MUFAs are the preferred substrates for the
synthesis of triacylglycerol (TAG), as well as for membrane phospholipids and
sphingolipids. Double-mutant strains that combine mutations in fat-5, fat-6, and fat-7,
display distinct fatty acid composition changes and reduced survival rates at low
temperatures. While all of the fat double mutant strains display some fatty acid
composition changes, the fat-6;fat-7 double mutants display the most severe defects in
the production of unsaturated fatty acids. The fat-6;fat-7 double mutants display
significantly reduced levels of TAG stores, significantly decreased levels of
polyunsaturated fatty acids (PUFAs) and increased levels of SFAs. Additionally in the
40
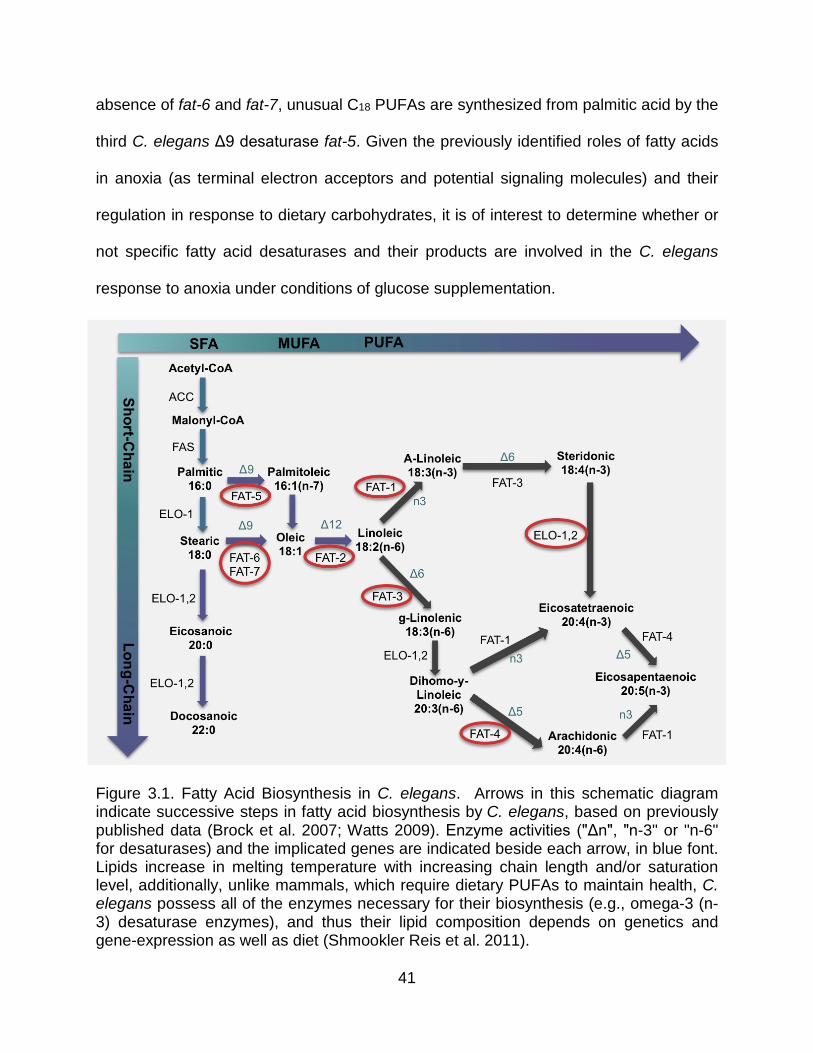
absence of fat-6 and fat-7, unusual C18 PUFAs are synthesized from palmitic acid by the
third C. elegans Δ9 desaturase fat-5. Given the previously identified roles of fatty acids
in anoxia (as terminal electron acceptors and potential signaling molecules) and their
regulation in response to dietary carbohydrates, it is of interest to determine whether or
not specific fatty acid desaturases and their products are involved in the C. elegans
response to anoxia under conditions of glucose supplementation.
Figure 3.1. Fatty Acid Biosynthesis in C. elegans. Arrows in this schematic diagram indicate successive steps in fatty acid biosynthesis by C. elegans, based on previously published data (Brock et al. 2007; Watts 2009). Enzyme activities ("Δn", "n-3" or "n-6" for desaturases) and the implicated genes are indicated beside each arrow, in blue font. Lipids increase in melting temperature with increasing chain length and/or saturation level, additionally, unlike mammals, which require dietary PUFAs to maintain health, C. elegans possess all of the enzymes necessary for their biosynthesis (e.g., omega-3 (n-3) desaturase enzymes), and thus their lipid composition depends on genetics and gene-expression as well as diet (Shmookler Reis et al. 2011).
41

Ceramide Biosynthesis
Further, imbalances in lipid-signaling networks have been implicated in the
pathogenesis of several human diseases, including T2D. In fact, recent studies have
indicated the involvement of ceramides in impaired insulin action, chronic oxidative
stress and the incidence of type 2 diabetes (Larsen and Tennagels 2014; Lopez et al.
2013; Xia et al. 2014; Fiedorowicz et al. 2014). Additionally, specific ceramide species
have been identified as protective during ischemic events (Bhuiyan et al. 2010;
Argraves et al. 2011; Chen et al. 2001). Aligned with this idea is the fact that alterations
of ceramide biosynthesis in C. elegans result in altered anoxia tolerance. As discussed
previously, C. elegans possess 3 ceramide synthase genes, hyl-1, hyl-2 and lagr-1
(Figure 3.2). The deletion hyl-2(tm2031) allele confers sensitivity to 48 hours of anoxia,
and these mutants lacking functional hyl-2 display fewer ceramide (Cer) and
sphingomyelin (SM) species with C20 to C22 fatty acyl chains. Thus, anoxia tolerance in
C. elegans likely requires one or more C20 to C22 of Cer or SM species (Menuz et al.
2009). Ceramides and their metabolites constitute a diverse group of lipids that have
been established as second messengers and metabolic signals, with known roles as
structural entities of biological membranes and regulators of insulin action and cell
death (Goñi and Alonso 2006). Given their roles in insulin resistance, type 2 diabetes
and oxygen deprivation responses, it is of interest to determine if C. elegans ceramide
synthases also have a role in glucose-induced anoxia sensitivity, especially in the
context of reduced insulin signaling.
42

Figure 3.2. Ceramide and Sphingolipid Biosynthesis in C. elegans. Arrows in this schematic diagram indicate successive steps in sphingolipid and ceramide metabolism by C. elegans, based on previously published data (Menuz et al. 2009; Mosbech et al. 2013; Liu et al. 2014a; Tedesco et al. 2008a; Y. Kim and Sun 2012; K. H. Nomura et al. 2011). The implicated proteins are indicated beside each arrow.
ROS and Antioxidants
Reactive oxygen species (ROS), such as the superoxide radical (O2−•), hydrogen
peroxide (H2O2), and the hydroxyl radical (OH•), are continuously generated via
43

metabolic reactions, and especially during mitochondrial energy production.
Additionally, many studies have shown that hyperglycemia and diabetes increase
oxidative stress, and in excess, ROS cause oxidative damage to DNA and to proteins
and have been implicated in the onset of insulin resistance, inflammation and
atherosclerosis (Giugliano et al. 1996; Jiang et al. 2013; Henry 1962; Paneni et al.
2013). Moreover, it is hypothesized that different susceptibility levels of diabetic
patients, to vascular complications, might actually be a function of their endogenous
antioxidant status.
As discussed previously, in C. elegans it was determined that
high glucose conditions limit lifespan, at least in part, by increasing ROS formation
(Schlotterer et al. 2009; Mendler et al. 2014). Additionally, under high glucose
conditions, human insulin reduces ROS formation in C. elegans, increases the activity
of superoxide dismutase, and rescues the decreased lifespan phenotype. Superoxide
dismutase (SOD) is a major antioxidant enzyme that protects against oxidative stress by
catalyzing the addition or removal of an electron from O2−•, and thus changing it into one
of two less damaging species, O2 or H2O2. In C. elegans, several genes encode SOD
enzymes, sod-1 encodes cytosolic Cu/Zn-SOD (which binds both copper and zinc), sod-
2 and sod-3 each encode mitochondrial Mn-SOD (which binds manganese; the
functional differences between these two Mn-SODs is not known), and sod-4 encodes
extracellular CuZn-SOD (Larsen 1993; Suzuki et al. 1996; Giglio et al. 1994; Hunter et
al. 1997; Fujii et al. 1998). Additionally, sod-3 mRNA levels are significantly increased in
daf-2 mutant animals, as compared to wild type, and this up regulation is dependent
upon activity of DAF-16. While daf-2 mutants are long lived and more resistant to
44

oxidative stress, it has been determined that double deletions of the two Mn-SOD
genes, sod-2 and sod-3, induce sensitivity to oxidative stress and modulate the
longevity phenotype in the daf-2 mutant background (Honda, et al. 2008). Moreover,
Honda et al. hypothesize that the Mn-SODs in C. elegans have a role in fine-tuning
insulin signaling, by acting not just as antioxidants, but as regulatory redox-signaling
molecules. Given the role of SODs in the modulation of insulin signaling and oxidative
stress, it is of interest to determine their role in anoxia with and without glucose
supplementation, especially in the context of reduced insulin signaling.
Results
Glucose-Induced Anoxia Sensitivity is Modulated by Insulin Signaling
I determined that the daf-2(e1370) allele that promotes enhanced anoxia
tolerance, also promotes anoxia tolerance in animals fed a glucose-supplemented diet.
The daf-2(e1370) animals have a higher anoxia survival rate in comparison to wild-type
animals, however their sensitivity to anoxia does increase when fed a higher
concentration of glucose (>1%) (Figure 3.3). Thus, modulation of the insulin-like
signaling pathway through the daf-2(e1370) mutation leads to anoxia resistance in
animals fed a high-glucose diet. Additionally, not surprisingly, I also determined that the
ability for daf-2(e1370) animals to survive anoxia, after being fed a glucose diet (0.5%),
is dependent upon activity of the transcription factor daf-16 (Figure 3.3).
Given that daf-2 mutant animals display increased tolerance to anoxia, I
examined whether or not general anoxia tolerance was sufficient to promote survival of
anoxia under glucose supplementation conditions. As discussed previously, the sterile
45
1-day old adult glp-1(e2141) animals, similar to daf-2(e1370) animals, are long-term
anoxia tolerant. However, their anoxia tolerance is independent of DAF-16 activity,
unlike that of daf-2(e1370) animals (LaRue and Padilla 2011; Mendenhall et al. 2009). I
determined that glp-1(e2141) animals are not resistant to anoxia when fed a glucose-
supplemented diet. Furthermore, the daf-2(e1370);glp-1(e131) double mutant fed a
glucose-supplemented diet did not have a significantly higher anoxia survival rate in
comparison to daf-2(e1370) animals (Figure 3.3). This data indicates that anoxia
resistance per se does not minimize the negative impact of a glucose-supplemented
diet.
Given the role of hypoxia-inducible factor, hif-1, in oxygen deprivation survival
across multiple species, I examined whether or not HIF-1 signaling had a role in
glucose-induced anoxia sensitivity. The highly conserved heterodimeric hypoxia-
inducible transcription factor HIF-1, regulates cellular and systemic responses to
hypoxia. When oxygen levels are normal, oxygen-dependent enzymes belonging to the
EGL-9/Prolyl hydroxylase superfamily, hydroxylate proline residues of HIF-1α. This
hydroxylation results in the targeted degradation of HIF-1 by the von Hippel-Lindau
tumor suppressor protein, VHL. In C. elegans the hif-1 and vhl-1 genes encode
homologs of the HIF-1α subunit and VHL respectively, while egl-9 encodes what is
thought to be the sole HIF prolyl hydroxylase. So, using oxygen as a substrate, EGL-9
hydroxylates HIF-1, increasing its affinity for VHL-1, which targets it for proteosomal
degradation. Thus, egl-9 deficient animals express constitutively high levels of HIF-1
(Shen and Powell-Coffman 2003; Jiang et al. 2001; Powell-Coffman 2010; Shao et al.
46
2009; Shen et al. 2005). I determined that HIF-1 stabilization via mutation of egl-9 did
not enhance anoxia survival of animals fed a glucose-supplemented diet (Figure 3.3).
Additionally it has been demonstrated that a high glucose diet (2%) shortens the
lifespan of C. elegans via ectopic apoptosis induction. Thus, I also examined whether or
not programmed cell death influences glucose-induced anoxia sensitivity. Caspases are
a family of cysteine proteases that are known to play essential roles in programmed cell
death (apoptosis) and necrosis. In C. elegans the proapoptotic caspase, CED-3, is
essential for the programmed death of all somatic cells (Kumar 2006; Mohapatra et al.
2011). The activator EGL-1 together with caspases CED-3 and CED-4 modulate all
developmentally programmed cell death in C. elegans. Thus, loss-of-function mutants
of egl-1, ced-3 and ced-4 result in the survival of cells that normally die (e.g., all 131
somatic cells that are destined to die, survive). I determined that ced-3 mutants display
anoxia survival levels similar to that of wild type under glucose supplementation
conditions (Figure 3.3). Thus, down regulation of programmed cell death is not sufficient
to suppress glucose-induced anoxia sensitivity in C. elegans. The role of apoptosis in
the context of reduced insulin signaling (in daf-2 mutants), remains to be determined.
Finally, a key sensor of nutritional status in most organisms is the hexosamine-
signaling pathway, which terminates in O-linked-N-acetylglucosamine (O-GlcNAc)
protein modification cycling. Two highly conserved enzymes regulate O-GlcNAc cycling,
O-GlcNAc transferase (OGT-1) and O-GlcNAcase (OGA-1). In C. elegans, OGT-1
catalyzes the addition of O-GlcNAc at Serine and Threonine residues of target proteins,
while OGA-1 catalyzes their removal (Hanover et al. 2005; Love and Hanover 2005;
Love et al. 2010; Mondoux et al. 2011; Mondoux et al. 2010; Forsythe et al. 2006).
47

Thus, animals with a mutation in oga-1 display increased levels of O-GlcNAc–modified
proteins, whereas null mutants of ogt-1 are unable to catalyze the modification and
display a lack of O-GlcNAc protein modification. It has been demonstrated that O-
GlcNAc cycling is genetically linked to insulin signaling in C. elegans. For example,
the oga-1(ok1207) null allele blunts signaling pathways that normally inhibit DAF-16
activity. Moreover, approximately 2–5% of all intracellular glucose is converted to UDP-
GlcNAc, the substrate for O-GlcNAc protein modification. Given that the substrate for
OGT-1, UDP-GlcNAc, is derived from glucose, the levels of glucose generally correlate
with the level of O-GlcNAc protein modification within an animal. Thus, in C. elegans,
under glucose supplementation conditions (glucose concentrations ≥250mM) it has
been demonstrated that the levels of O-GlcNAc–modified proteins are significantly
increased (Mondoux et al. 2011). Additionally it was shown that ogt-1 null mutants that
lack the ability to O-GlcNAcylate proteins are hypersensitive to glucose
supplementation, while oga-1 null mutants (with increased levels O-GlcNAc–modified
proteins) display phenotypes similar to that of wild-type animals under conditions of
glucose toxicity. Given the roles of O-GlcNAc cycling in nutrient sensing and insulin
signaling, I examined whether or not increased O-GlcNAc modification was sufficient to
rescue glucose- induced anoxia sensitivity. I determined that oga-1(ok1207) null
mutants displayed anoxia survival levels similar to that of wild type (Figure 3.3).
Additionally I assessed whether or not inhibition of O-GlcNAc protein modification was
sufficient to suppress the ability of daf-2(e1370) animals to survive anoxia under
conditions of glucose supplementation (0.5%). I determined that daf-2(e1370);ogt-
1(RNAi) animals display anoxia survival rates similar to that of daf-2(e1370) controls
48

under conditions of glucose supplementation, thus suggesting that O-GlcNAc cycling is
not sufficient to rescue glucose-induced anoxia sensitivity nor is it sufficient to suppress
the ability of daf-2 mutants to survive.
Together these data demonstrate that general anoxia tolerance does not
minimize the negative impact of a glucose-supplementation on anoxia responses.
Additionally, these data suggest that the insulin-signaling pathway, in a manner that is
independent of HIF-1, apoptosis and O-GlcNAc protein modification, modulates
glucose-induced anoxia sensitivity.
49

Figure 3.3. The insulin-signaling pathway modulates glucose-fed anoxia survival rate. (A) The daf-2(e1370) animals, in comparison to wild-type animals, survive anoxia better after being fed a glucose-supplemented diet. Bar indicates that there was a significant increase in survivorship for daf-2(e1370) animals in comparison to wild-type animals given the same diet and anoxia exposure (2 way ANOVA, Bonferonni Multiple Comparisons, p<0.05). (B) A mutation in daf-16 or knockdown via RNAi suppresses the ability of daf-2(e1370) animals to survive anoxia after being fed a glucose-supplemented diet. The * indicates a significant increase in survivorship for daf-2(e1370) animals fed a glucose-supplemented diet prior to anoxia exposure in comparison to other animals shown with the specified genotypes (1 way ANOVA, Bonferonni Multiple Comparisons, p<0.05). (C) The long-term anoxia survival mutant glp-1(e2141) is sensitive to 1 day of anoxia exposure when fed a glucose-supplemented
50

diet; daf-2(e1370) suppresses the anoxia sensitivity observed in glp-1(e2141) mutants. Note that in order to conduct these experiments the animals had to be raised at 15ºC to the L3 stage and then transferred to 25ºC. Bar indicates a significant increase in survival in comparison to N2 animals (1 way ANOVA, Bonferonni Multiple Comparisons, p<0.05). (D) The genotypes shown are not resistant to anoxia exposure when fed a glucose-supplemented diet. For all experiments shown, at least 3 independent experiments were conducted.
Glucose-Induced Anoxia Sensitivity is Modulated by Insulin Signaling via Lipid
Biosynthesis
The daf-2(e1370) allele confers increased anoxia resistance under conditions of
glucose supplementation in a daf-16 dependent manner. This suggests that glucose
induces anoxia sensitivity by preventing the FOXO transcription factor homolog DAF-16
from regulating the expression of specific target genes. To determine the specific DAF-
16 target genes that are required for glucose-fed anoxia resistance in daf-2 mutants, I
used RNA interference (RNAi) to screen through a subset of DAF-16 regulated genes. I
determined that knockdown of fat-7, which encodes a delta-9 fatty acid desaturase, was
sufficient to suppress the daf-2(e1370) glucose-fed anoxia resistance phenotype (Figure
3.4).
Fatty Acid Biosynthesis
The biosynthetic pathway responsible for the desaturation of short-chain fatty
acids to polyunsaturated fatty acids is known in C. elegans (Brock et al. 2007). By using
RNAi, I determined that knockdown of genes that encode any one of the fatty acid
desaturases or elongases in C. elegans was sufficient to suppress the daf-2(e1370)
glucose-fed anoxia resistance phenotype (Figure 3.4). Each of the three Δ9-
desaturases (fat-5, fat-6 and fat-7) have high sequence similarity, thus RNAi knockdown
for any one of them likely reduces function in the others. Similarly the elongases elo-1
51

and elo-2 also share high sequence similarity. For further genetic analysis, I chose to
focus only on the Δ9 desaturase mutants (fat-5, fat-6 and fat-7). Given that the Δ9
desaturase are redundant under standard conditions, I tested double mutants (a fat-
5;fat-6;fat-7 triple mutant is lethal). The fat-5(tm420) and fat-6(tm331) are deletion
alleles that eliminate two of the conserved histidine-rich regions and two trans-
membrane domains, these are most likely null mutations. The fat-7(wa36) strain is a
single base pair mutation that leads to a premature stop codon that eliminates two
trans-membrane domains and one of the conserved histidine boxes, this allele is at
minimum a strong reduction-of-function allele (Brock et al. 2007). Aligned with the RNAi
data, I determined that the fat-5;fat-6 or fat-6;fat-7 double mutations also suppress the
ability of daf-2(e1370) animals to survive anoxia after being fed a glucose-
supplemented diet (Figure 3.4). However, it is important to note that the long-term
anoxia resistance phenotype observed in the daf-2(e1370) mutant (fed a standard diet)
is only slightly, but not significantly suppressed by mutations in fat-6;fat-7 or fat-5;fat-6,
suggesting that in the context of reduced insulin signaling, knockdown of delta-9 fatty
acid desaturases does not confer general sensitivity to anoxia (Figure 3.5).
Given the previously identified roles of fatty acids in anoxia, as terminal electron
acceptors and as potential signaling molecules, I examined whether or not specific fatty
acid biosynthesis mutants (in a wild-type background) had an overall sensitivity to
anoxia when fed a standard OP50 diet. I determined that with the exception of the fat-
6;fat-7 double mutant, all animals survive 24 hours of anoxia when fed a normal OP50
diet (Figure 3.5). That is, the fat-6;fat-7 mutants display increased sensitivity to anoxia
even in the absence of glucose supplementation. Thus, the proper synthesis of
52
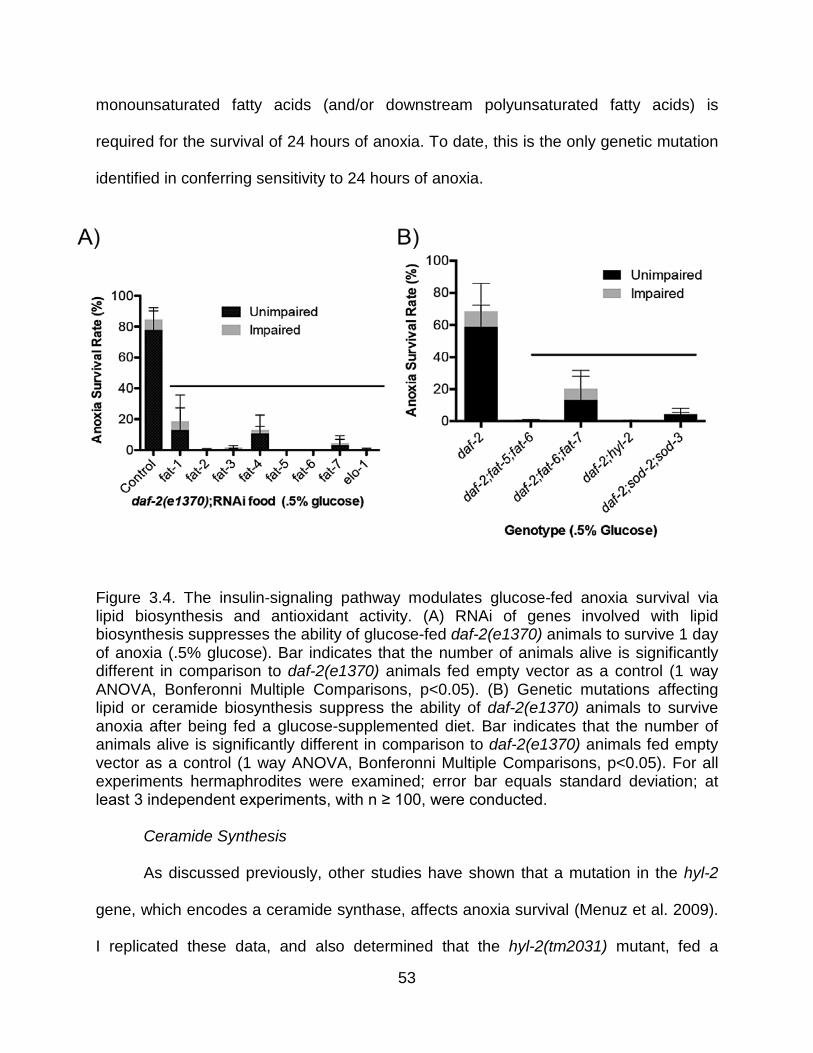
monounsaturated fatty acids (and/or downstream polyunsaturated fatty acids) is
required for the survival of 24 hours of anoxia. To date, this is the only genetic mutation
identified in conferring sensitivity to 24 hours of anoxia.
Figure 3.4. The insulin-signaling pathway modulates glucose-fed anoxia survival via lipid biosynthesis and antioxidant activity. (A) RNAi of genes involved with lipid biosynthesis suppresses the ability of glucose-fed daf-2(e1370) animals to survive 1 day of anoxia (.5% glucose). Bar indicates that the number of animals alive is significantly different in comparison to daf-2(e1370) animals fed empty vector as a control (1 way ANOVA, Bonferonni Multiple Comparisons, p<0.05). (B) Genetic mutations affecting lipid or ceramide biosynthesis suppress the ability of daf-2(e1370) animals to survive anoxia after being fed a glucose-supplemented diet. Bar indicates that the number of animals alive is significantly different in comparison to daf-2(e1370) animals fed empty vector as a control (1 way ANOVA, Bonferonni Multiple Comparisons, p<0.05). For all experiments hermaphrodites were examined; error bar equals standard deviation; at least 3 independent experiments, with n ≥ 100, were conducted.
Ceramide Synthesis
As discussed previously, other studies have shown that a mutation in the hyl-2
gene, which encodes a ceramide synthase, affects anoxia survival (Menuz et al. 2009).
I replicated these data, and also determined that the hyl-2(tm2031) mutant, fed a
53

standard OP50 diet, is sensitive to two days of anoxia exposure, but this sensitivity to
anoxia is suppressed by daf-2(e1370) (Figure 3.5 B). Additionally, while the daf-
2(e1370) mutant can survive three days of anoxia, this phenotype is suppressed by
either hyl-2(tm2031) or a glucose-supplemented diet (Figure 3.5 B). Thus, these data
suggest that hyl-2 and daf-2 are acting in parallel pathways that mutually influence one
another to modulate the response to oxygen deprivation.
I also determined that the hyl-2(tm2031) mutation suppresses the ability of
glucose-fed daf-2(e1370) animals to survive anoxia (Figure 3.4). These results indicate
that modulation of ceramide synthesis influences anoxia survival in animals fed a
glucose-supplemented diet as well. Additionally, these data suggest that both diet and
ceramide biosynthesis can alter the ability of daf-2 animals to be resistant to long bouts
of anoxia treatment but are not essential for daf-2 animals to survive shorter bouts of
anoxia.
Further, given the role of hyl-2 in general anoxia tolerance and its ability to
suppress the survival of glucose-supplemented daf-2 mutants, I wanted to determine if
hyl-2(tm2031) animals are more sensitive than wild-type animals to the effects of
glucose supplementation. I compared the anoxia survival rates of 0.0625% to 0.5%
glucose-supplemented hyl-2(tm2031) animals, and determined that hyl-2 mutant
animals display a significantly reduced ability to survive 24 hours of anoxia, as
compared to wild-type, when supplemented with just 0.0635% glucose (Figure 3.5 C).
These data suggest that the hyl-2 mutation leads to an increased sensitivity to anoxia
under glucose supplementation conditions.
54

Figure 3.5. Lipid biosynthesis impacts anoxia survival. (A) Animals of the specified genotype were fed a standard OP50 diet and exposed to 1 day of anoxia. The fat-6;fat-7 double mutant is sensitive to one day of anoxia exposure. The * indicates a significant decrease in survival compared to other genotypes (1 way ANOVA, Bonferonni Multiple Comparisons, p<0.001). (B) Animals of the specified genotype were exposed to 2 or 3 days of anoxia. All animals were fed a standard OP50 diet with the exception of daf-2(e1370) as indicated. The * indicates that hyl-2(tm2031) animals exposed to 2 days of anoxia have a significant decrease in survival. The bar indicates that hyl-2(tm2031) or a glucose-supplemented diet suppresses the ability of daf-2(e1370) animals to survive 3 days of anoxia. (1 way ANOVA, Bonferonni Multiple Comparisons, p<0.001). (C) The hyl-2(tm2031) animals, in comparison to wild-type animals, survive anoxia worse after
55

being fed a glucose-supplemented diet. Asterisk indicates that there was a significant decrease in survivorship for hyl-2(tm2031) animals in comparison to wild-type animals given the same diet and anoxia exposure (2 way ANOVA, Bonferonni Multiple Comparisons, p<0.05).
MUFA Supplementation
In order to determine if supplemental feeding of a specific fatty acid could rescue
the anoxia sensitivity induced by glucose-supplementation, animals were raised on
control media or on media supplemented with 0.3 mM oleic acid from the L1 larval stage
to 1-day old adults (Deline et al. 2013). I found that oleic acid supplementation was
sufficient to significantly rescue the anoxia sensitivity of daf-2;fat-6;fat-7 mutant animals,
and slightly but not significantly rescued the sensitivity in daf-2;fat-5;fat-6 mutants
(Figure 3.6). It has been shown previously that daf-2;fat-6;fat-7 mutant animals display
more extreme fatty acid composition changes as compared to daf-2;fat-5;fat-6 mutants,
that display relatively subtle fatty acid composition alterations under standard conditions
(Brock et al. 2007; Shi et al. 2013). Thus, I hypothesize that oleic acid or downstream
PUFAs are, at least in part, required for the anoxia survival of daf-2 mutants under
glucose supplementation conditions.
To improve uptake of the oleate, I opted to not chronically feed the animals both
glucose and oleate simultaneously, rather animals were raised on the fatty acid
supplemented media to maximize uptake, and then transferred as adults to 0.5%
glucose media and allowed to eat for 1 hour before being exposed to 24 hours of
anoxia. This difference in methodology may explain why the daf-2;fat mutants fed
glucose for one hour, as opposed to being raised on glucose, had a higher anoxia
survival rate (Figure 3.4 compared to Figure 3.6). The 1-hour feeding of glucose was
56

sufficient to induce the anoxia sensitivity in N2 and daf-2;hyl-2(tm2031) animals,
however, and the addition of oleic acid did not suppress this sensitivity (Figure 3.6). The
glucose-fed daf-2 mutant survives anoxia as expected and oleic acid supplementation
did not significantly alter survival rate (Figure 3.6). These data suggest that the hyl-2
mutation leads to an increased sensitivity to anoxia in glucose fed animals in
comparison to the fat mutants and that ceramide and fatty acid biosynthesis are likely
working in separate pathways to modulate anoxia survival in glucose-fed animals.
Figure 3.6. Fatty Acid Biosynthesis Impacts Anoxia Survival. Animals of the specified genotype were raised on a standard OP50 diet or a diet supplemented with oleate. Animals were then transferred to a glucose-supplemented diet, allowed to eat the glucose-supplemented diet for 1 hour and then exposed to 24 hours of anoxia. The * indicates a significant increase in anoxia survival when fed oleate (1 way ANOVA, Bonferonni Multiple Comparisons, p<0.001). For all experiments hermaphrodites were examined; error bar equals standard deviation; at least 3 independent experiments, with n ≥ 100, were conducted.
57

Glucose-Induced Anoxia Sensitivity is Modulated by Insulin Signaling Via Antioxidant
Activity
Given the role of SODs in the modulation of insulin signaling and oxidative
stress, I wanted to determine if the ability of daf-2 mutant animals to survive anoxia was
dependent upon their ability to detoxify ROS. As discussed previously, daf-2(e1370)
animals display a significant increase in sod-3 mRNA and are more resistant to
oxidative stress. Thus, it is of interest to determine the role of mitochondrial SODs, sod-
2 and sod-3, in anoxia response, with and without glucose supplementation. I
determined that mutation of sod-2 and sod-3 was sufficient to suppress the anoxia
survival of daf-2(e1370) animals under glucose supplementation conditions (Figure 3.4).
Additionally, while mutation of sod-2;sod-3 increases sensitivity to oxidative stress and
hyperoxia in daf-2 mutant animals, I determined that this double mutation does not
impact the ability of daf-2 mutants to survive long-term anoxia under standard
conditions, suggesting that the combinatory stress of glucose-supplementation and
anoxia exposure likely elicits an increase in oxidative stress that requires more active
oxidative stress detoxification (Figure 3.5).
Glucose Supplementation Induces Lipid Accumulation
In the previous chapter I demonstrated, using Oil Red O staining to detect lipids,
that N2 wild-type animals fed a glucose-supplemented diet, relative to an OP50 only
diet, have a significant increase in lipid droplets in the anterior (head and pharynx)
region of the animal (Figure 2.6). Additionally, I assayed whether or not the same lipid
accumulation phenomenon could be observed in daf-2 and hyl-2 mutant animals,
58

genotypes that are resistant and sensitive to anoxia, respectively. The hyl-2(tm2031)
animals fed a glucose-supplemented diet, compared to those fed a standard diet, did
not have a significant accumulation of lipid droplets in the head/pharynx region of the
animal (Figure 3.7). Also, compared to N2 animals, hyl-2(tm2031) animals appeared to
have an overall reduction in Oil Red O staining. As others have reported, daf-2(e1370)
animals have an increase in lipids (Figure 3.7). In some, but not all, of the animals
carrying the daf-2(e1370) allele and fed a standard OP50 diet, lipid droplets in the
head/pharynx region were observed (Figure 3.7). Together, these results further support
the idea that a glucose-supplemented diet acts as an obesity-mimetic in C. elegans and
that both diet and genotype affect lipid distribution within the animal. Additionally there is
a correlation between the level of fat stores and the ability of the animals to survive
prolonged anoxia exposure under standard conditions. For example, daf-2(e1370)
animals display high levels of lipid stores while hyl-2(tm2031) animals display lower
amounts. However, given that glucose significantly increases the amount of lipid
accumulation, but sensitizes animals to anoxia, it appears likely that the specific types
of lipids present in animals will have a role in determining their ability to survive anoxia.
59

Figure 3.7. Glucose supplementation induces lipid accumulation. Oil Red O staining was used to localize lipids within the animal. (A) Animals of specified genotypes fed a standard diet or a glucose-supplemented diet were stained. Representative images of whole animals are shown. (B) Enlarged image of the anterior region. Lipids can be detected in the intestine, oocyte/germline and pharynx. Arrow points to the posterior region of the terminal bulb of the pharynx. Note that glucose fed animals (N2, daf-2, daf-2;hyl-2) contain lipid droplets in the pharynx region. For each genotype, there is more staining in glucose-fed animals relative to controls. (C) The presence or absence of lipids within the anterior region of the animal was assayed. At least 10 animals from three independent experiments were randomly imaged and assayed for the presence of lipid droplets, in the anterior (head and pharynx) regions. Error bar equals standard deviation; bar indicates there was a significant difference in glucose-fed animals in comparison to controls (1 way ANOVA, Bonferonni Multiple Comparisons, p<0.05).
60

CHAPTER 4
GLUCOSE INDUCES SIGNIFICANT GENE EXPRESSION CHANGES IN C. elegans‡
Introduction
Transcriptional Changes Associated With the Progression of Type 2 Diabetes
Given the delayed onset of symptoms, and the fact that symptoms can remain
mild and are often ignored by sufferers for some time, type-2 diabetes often remains
undetected in patients for several years. Additionally, the diagnosis of type-2 diabetes is
often made incidentally via abnormally high blood or urine glucose concentrations when
tested. Consequently, at the time of detection, the disease is often at more advanced
stages, and vascular complications have already begun to occur. Moreover, in many
cases, the detrimental effects of glucose can occur, even when blood glucose levels are
still below the threshold level for the diagnosis of diabetes. Mild hyperglycemia and
fluctuations in glucose levels can have a role in the functional and structural alterations
of vessel walls, ultimately resulting in diabetic vascular complications (Paneni et al.
2013; Beckman et al. 2013). Thus, a more thorough understanding of the underlying
mechanisms in diabetic vascular disease is necessary to provide potential novel
approaches that may prevent, delay the progression of, or rescue these
complications. While multiple pathways have been implicated in the pathophysiology of
diabetes and its associated complications, and a number of studies have identified
specific gene expression signatures related to these diseases states in rodents and
‡ Parts of this chapter have been previously published, either in part or in full, from Garcia AM, Ladage ML, Dumesnil DR, Zaman K, Shulaev V, Azad RK, Padilla PA. Glucose Induces Sensitivity to Oxygen Deprivation and Modulates Insulin/IGF-1 Signaling and Lipid Biosynthesis in Caenorhabditis elegans. Genetics 2015. Reproduced with permission from the Genetics Society of America.
61
humans, there remains questions regarding the biological relevance and interactions of
each of these identified genes.
Transcriptomics
Many of the implicated genetic factors associated with type-2 diabetes and its
complications were found through genome wide association studies (GWAS) on human
subjects. While GWAS can be a powerful tool to identify genetic factors associated with
a particular trait/disease, they can also be problematic. For example, limited sample
numbers, high stochastic variation and/or patterns of correlation that lead to indirect
associations between genetic markers and traits where no causal relation actually exists
(Platt et al. 2010). In more recent years, transcriptomic approaches, such as next
generation sequencing (sometimes in conjunction with GWAS studies), have gained
traction as another tool to investigate the associations between genetic factors and
disease states. Early transcriptomic studies however, often relied on hybridization-
based microarrays that frequently were limited in their ability to fully catalog and quantify
the diversity of RNA molecules expressed. More recently, the introduction of high-
throughput next-generation sequencing technologies has transformed and
revolutionized transcriptomics approaches, by allowing RNA transcript analysis through
large-scale cDNA sequencing (Ozsolak and Milos 2011). For example, RNA sequencing
has advanced our ability to characterize transcriptomes, across multiple species, at
specific stages of development and/or under specific physiological conditions. RNA
sequencing provides an ability analyze RNA transcripts (often including mRNA, tRNA,
rRNA and other non-coding RNAs) in a specific cell type, tissue or whole animal. This
62

approach focuses on gene expression patterns at the RNA level (at the level of
transcription) and offers genome-wide information and insight into molecular
mechanisms that are involved in the regulation of specific biological processes. Thus,
using such an approach, there lies potential to better establish meaningful genetic
associations, which have causative roles in the pathology of disease states.
Results
Glucose Supplementation Induces Significant Transcriptional Changes
To identify gene expression changes associated with a glucose-supplemented
diet in C. elegans, we used RNA sequencing (RNA-Seq) to compare the transcript
profile of wild-type adults (young, non-gravid) raised on a glucose-supplemented diet
relative to those raised on an OP50 only diet (Figure 4.1). Glucose supplementation
significantly impacted the gene expression of 2,370 of the 20,375 genes analyzed;
1,850 genes were up regulated and 520 genes were downregulated (Figure 4.2, Table
4.1). The fold-increase in expression values (normalized read count, FPKM; see
Methods) for significantly upregulated genes in animals fed a glucose-supplemented
diet ranged from 1.34 to 136.99. On the other hand, the fold-decrease in expression of
downregulated genes in animals fed a glucose diet ranged from 1.34 to 9.63 (Table
4.1).
63

Figure 4.1. Workflow of RNA Sequencing Analysis. The Padilla laboratory conducted the wet lab protocol and subsequent categorization, confirmation and biological interpretation.
Genes differentially regulated by a glucose diet were classified and evaluated
using PANTHER (http://www.pantherdb.org), Wormbase annotation
(http://www.wormbase.org), and Database for Annotation and Visualization and
Integrated Discovery (DAVID) (http://david.abcc.ncifcrf.gov/home.jsp) (Dennis et al.
2003; Mi et al. 2013). The PANTHER classification system combines gene function,
ontology, and pathways to analyze large data sets (Mi et al. 2013). This classification
system can classify genes into categories based on their biological process, molecular
function, cellular component or protein class.
64
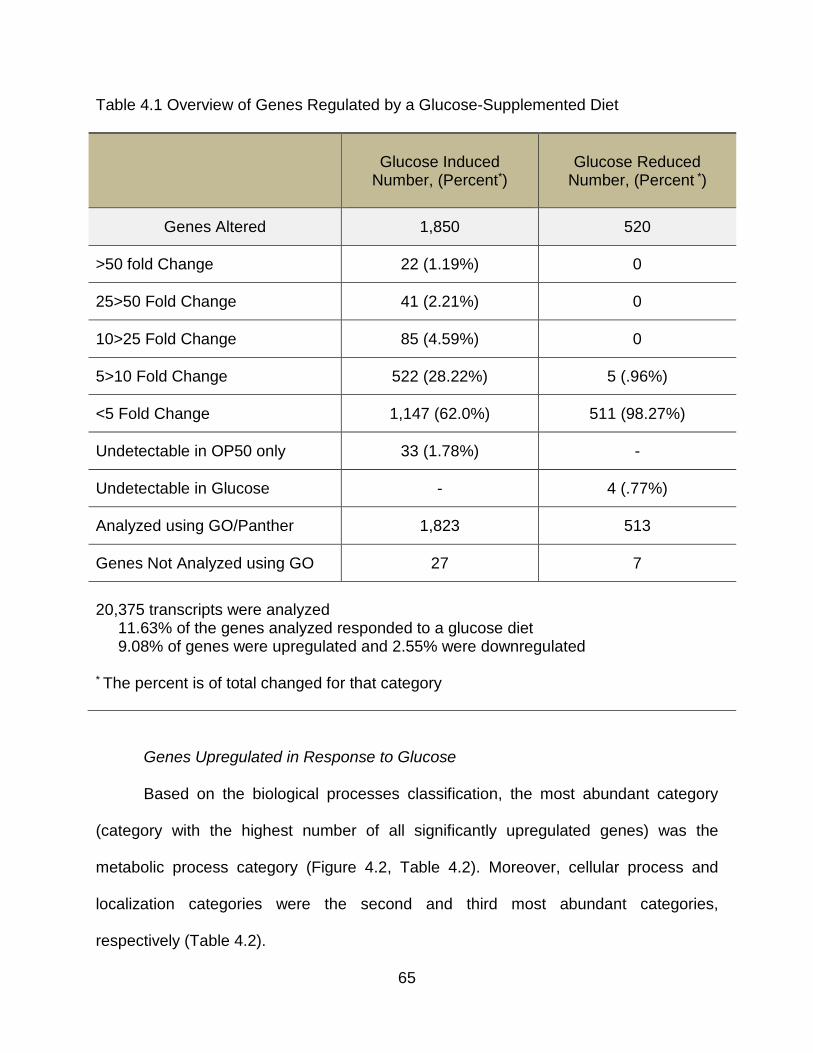
Table 4.1 Overview of Genes Regulated by a Glucose-Supplemented Diet
Glucose Induced
Number, (Percent*)
Glucose Reduced Number, (Percent *)
Genes Altered 1,850 520
>50 fold Change 22 (1.19%) 0
25>50 Fold Change 41 (2.21%) 0
10>25 Fold Change 85 (4.59%) 0
5>10 Fold Change 522 (28.22%) 5 (.96%)
<5 Fold Change 1,147 (62.0%) 511 (98.27%)
Undetectable in OP50 only 33 (1.78%) -
Undetectable in Glucose - 4 (.77%)
Analyzed using GO/Panther 1,823 513
Genes Not Analyzed using GO 27 7
20,375 transcripts were analyzed 11.63% of the genes analyzed responded to a glucose diet 9.08% of genes were upregulated and 2.55% were downregulated * The percent is of total changed for that category
Genes Upregulated in Response to Glucose
Based on the biological processes classification, the most abundant category
(category with the highest number of all significantly upregulated genes) was the
metabolic process category (Figure 4.2, Table 4.2). Moreover, cellular process and
localization categories were the second and third most abundant categories,
respectively (Table 4.2).
65

Figure 4.2. RNA-Sequencing analysis reveals differentially regulated genes in response to a glucose-supplemented diet. (A) Scatter plot shows expression values (normalized read counts, FPKM; see Methods) for transcripts in animals fed a standard OP50 E. coli diet (X-axis) versus those in a glucose-supplemented diet (Y-axis); data are shown on log scale. Transcripts that were upregulated or downregulated in response to a glucose diet are shown. (B) and (C) Genes were categorized based on Gene ontology (GO)
66

annotations for biological functions; the proportion for each category is displayed in the pie-chart; (B) shows the gene expression profile for those upregulated in glucose condition, and (C) shows the gene expression profile for those downregulated in glucose condition. For both (B) and (C), the GO classification analysis was performed using PANTHER.
Of the genes listed in the category of metabolic processes, 83% of them are
involved in primary metabolic processes (Table 4.2). Upon further sub-categorization, it
was determined that genes involved in either carbohydrate or lipid metabolism comprise
almost half of the genes involved in primary metabolic processes (lipid and
carbohydrate metabolism make up 35% of the 83% of genes involved in primary
metabolic processes, while 40% are involved in protein metabolism/modification) (Table
4.2). To illustrate, several genes that are known or predicted to be involved with lipid
biology were upregulated in response to glucose supplementation; these genes
included those that are involved with lipid processes, lipid binding or lipid transport. This
list includes genes predicted to encode stearoyl-CoA desaturase (delta-9 desaturase)
(fat-5), long-chain acyl-CoA synthetase (acs-2, acs-15, acs-18) and ceramide glycosyl
transferase (cgt-1) indicating that a glucose-supplemented diet induces genes involved
with lipid biosynthesis and modification. We found that there were 112 genes (6% of all
significantly upregulated genes) that were classified by PANTHER to be involved with
some aspect of lipid metabolism. Additionally, Zhang et al, documented a more
comprehensive list of lipid metabolic genes present in the C. elegans genome (Zhang et
al. 2013). So, we used the Gene List Venn Diagram program
(http://genevenn.sourceforge.net) to compare the genes we found upregulated by
glucose to the data set from Zhang et al and identified 57 of their documented 471
genes to be upregulated by glucose (11.9%). Additionally, I went on to compare the
67

PANTHER generated list of genes involved in lipid metabolism, to the Zhang et al. 2013
study, and compare those together with our list of glucose- induced genes, to get a
more comprehensive idea of glucose-induced genes involved in lipid metabolism.
Together, of all known C. elegans genes involved in lipid metabolism, a total of 137
(7.41% of all significantly upregulated genes) were found to be significantly upregulated
in response to glucose supplementation (Figure 4.3).
Figure 4.3. Glucose Induced the Expression of Genes Involved in Lipid Metabolism. Using the PANTHER classification of lipid metabolic genes, and a comprehensive list of C. elegans lipid genes generated through comparative genomics and functional analysis by Zhang et al. 2013, we identified that 137 of all genes found to be upregulated (7.4%) were involved in some aspect of lipid metabolism.
Further, in the same general category of metabolic processes, there were a
number of genes that are known or predicted to be involved with carbohydrate
metabolism. Not surprisingly, out of the 1,850 genes significantly induced by glucose,
91 of them (5% of all significantly upregulated genes) were involved in the metabolism
of carbohydrates. For example, glycolytic genes gpd-2, gpd-3, gluconeogenesis genes
68
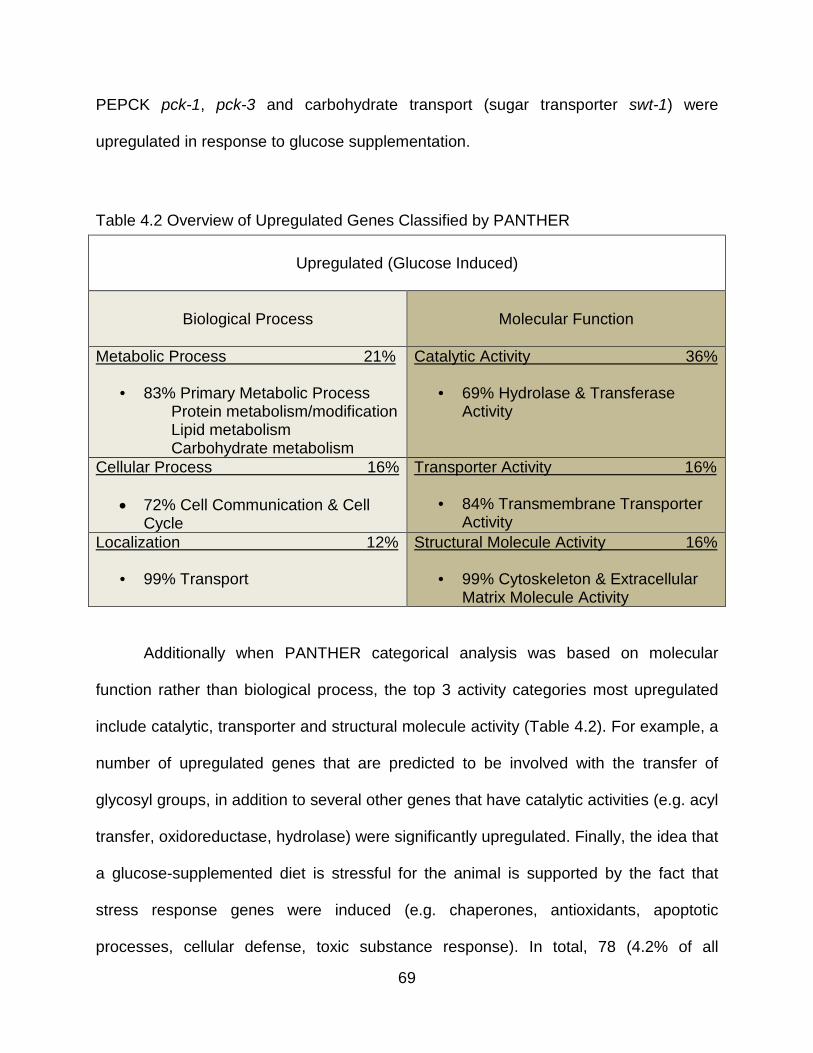
PEPCK pck-1, pck-3 and carbohydrate transport (sugar transporter swt-1) were
upregulated in response to glucose supplementation.
Table 4.2 Overview of Upregulated Genes Classified by PANTHER
Upregulated (Glucose Induced)
Biological Process
Molecular Function
Metabolic Process 21%
• 83% Primary Metabolic Process Protein metabolism/modification Lipid metabolism Carbohydrate metabolism
Catalytic Activity 36%
• 69% Hydrolase & Transferase Activity
Cellular Process 16%
• 72% Cell Communication & Cell Cycle
Transporter Activity 16%
• 84% Transmembrane Transporter Activity
Localization 12%
• 99% Transport
Structural Molecule Activity 16%
• 99% Cytoskeleton & Extracellular Matrix Molecule Activity
Additionally when PANTHER categorical analysis was based on molecular
function rather than biological process, the top 3 activity categories most upregulated
include catalytic, transporter and structural molecule activity (Table 4.2). For example, a
number of upregulated genes that are predicted to be involved with the transfer of
glycosyl groups, in addition to several other genes that have catalytic activities (e.g. acyl
transfer, oxidoreductase, hydrolase) were significantly upregulated. Finally, the idea that
a glucose-supplemented diet is stressful for the animal is supported by the fact that
stress response genes were induced (e.g. chaperones, antioxidants, apoptotic
processes, cellular defense, toxic substance response). In total, 78 (4.2% of all
69

significantly upregulated genes) stress response genes were found to be upregulated in
response to glucose supplementation.
Genes Downregulated in Response to Glucose
There are a fewer number of genes that were downregulated in response to a
glucose-supplemented diet, and a much small number of these genes are predicted to
be involved with lipid or carbohydrate biology (Table 4.1, Table 4.3). Although, two of
the genes that code for the glycolytic enzyme GPD (gpd-2, gpd-3) were upregulated in
the glucose-fed animals, the other two genes that code for the glycolytic enzyme GPD
(gpd-1; gpd-4) were downregulated in response to glucose. The mRNA expression of
daf-16 itself was not differentially regulated by a glucose diet. Additionally, genes (sod-
2/3, hyl-2) that suppress the daf-2(e1370) glucose-fed anoxia resistant phenotype were
not differentially regulated by a glucose-diet. However, there was a down-regulation of
several genes (daf-18, ins-8, daf-15, dct-16 and smg-1) involved with the insulin-like
signaling pathway indicating that a glucose diet can impact the mRNA expression of
genes involved with insulin signaling. There are many labs that have identified genes
that are potentially regulated by DAF-16 (Lee et al. 2009; Murphy 2006; Murphy et al.
2003; Riedel et al. 2013). Given that daf-2(e1370) animals survive anoxia and N2
animals do not survive anoxia, when fed a glucose- supplemented diet, it is of interest to
identify genes that are upregulated in daf-2(e1370) and downregulated by a glucose
diet. We identified 12 DAF-16 target genes to be downregulated in N2 in response to
glucose supplementation (Table 4.4).
70

Table 4.3 Overview of Downregulated Genes Classified by PANTHER
Upregulated (Glucose Induced)
Biological Process
Molecular Function
Metabolic Process 37%
• 82% Primary Metabolic Process Nucleobase-containing- compound metabolic process
Catalytic Activity 38%
• 63% Hydrolase & Transferase Activity
Cellular Process 21%
• 76% Cell Cycle & Cell Communication
Binding Activity 38%
• 87% Nucleic Acid & Protein Binding Activity
Localization 12%
• 100% Transport
Structural Molecule Activity 6%
• 99% Cytoskeleton, Extracellular Matrix & Ribosome Structural Molecule Activity
Moreover, using PANTHER to classify downregulated genes based upon
biological process, the top three most abundant categories include metabolic
processes, cellular processes and localization, respectively (Table 4.3). For example,
more than half (58%) of the genes classified as being involved in metabolic processes
were classified as nucleobase-containing compound associated with metabolic process,
this category contains genes predicted to be involved with DNA or RNA metabolic
processes (Table 4.3). Examples of genes within this classification include those known
or predicted to be involved with DNA repair, DNA replication, DNA recombination, RNA
splicing, RNA transcription, RNA processing or nucleobase metabolism. Additionally,
the most abundant category in of cellular processes were genes known or predicted to
be involved with the cell cycle (Table 4.3); many of these genes are also classified as
being in the DNA or chromosome binding protein class. Furthermore, if one looks at the
71

genes that are classified by protein class, the largest grouping was for the nucleic acid
binding protein class. Moreover, classification based upon molecular function identified
the top three most abundant functional categories as catalytic activities, binding
activities and structural molecule activities (Table 4.3).
Together, these data indicate that glucose supplementation significantly alters
many biological processes and is likely a stress for the animal. I used quantitative RT-
PCR to verify a few genes identified by the RNA-Seq approach as confirmation and
validation of the RNA sequencing data (Figure 4.3). All of the genes were similarly up or
downregulated between the two approaches.
Figure 4.3. Validation of RNA-Seq analysis by qRT-PCR for two targets that showed an up-regulation (cgt-1, ttr-22) or down-regulation (CO7G1.7, ins-8) in animals fed a glucose diet relative to a standard OP50 diet. Shown is the fold change in N2 animals fed a glucose (0.5%) diet relative to N2 animals fed a standard diet. Data shown are from 3 independent experiments. Error bars represent standard deviations. The * indicates p<.05; **** indicates p<.0001, 2 way ANOVA, Bonferroni multiple comparisons.
72

We used BLASTp analysis to identify the human proteins that have high identity
and query coverage in local alignment to the most differentially expressed C. elegans
genes (>25 fold upregulated or >2.5 fold downregulated) in glucose-fed animals. With
this classification there are 63 genes that are upregulated >25X fold; 31 of these genes
(49%) are predicted or known to encode a collagen protein. Several of these genes
(17/63; 27%) did not have a significant similarity to any human genes. The other genes
were known or predicted to be involved with various processes including metabolism or
stress responses. There were 20 genes that were >2.5X downregulated in glucose fed
animals; 4 of these genes (20%) did not have a significant similarity to any human
genes.
There were two cytochrome P450 genes (cyp-25A1 and cyp-35D1) that were
downregulated in response to a glucose diet. Evaluation of differentially expressed
genes indicates that five other cytochrome P450 genes were actually upregulated (cyp-
13B1, cyp-33C5, cyp-32A1, cyp-13A12, cyp-33C8); cyp-13A12 has been implicated in
responses to O2 deprivation and reoxygenation (Ma et al. 2013). The gene T19H12.6
that was downregulated has not been studied in C. elegans but is predicted to encode a
protein that is part of the gamma glutamyl transferase/peptidase (GGT) family and
shows identity to human GGT1. The GGT proteins cleave γ-glutamyl peptide bonds in
glutathione and transfer the γ-glutamyl moiety to acceptors; they are associated with
diseases such as diabetes and metabolic syndrome (Hong et al. 2014). A positive
association exists between insulin and GGT and GGT1 was found to be downregulated
in whole blood gene expression analysis of obese subject with type 2 diabetes after
bariatric surgery or weight loss (Kónya et al. 1990; Berisha et al. 2011). This suggests
73

that there may be some conserved genes that respond to a glucose-supplemented diet
in C. elegans and genes that are associated with metabolic diseases in humans.
Table 4.4 DAF-16 Target Genes Downregulated by Glucose
Gene/Sequence Gene Class Description
Comparison of glucose downregulated genes with genes upregulated in daf-2 mutants compared to daf-2;daf-16 double mutants (Lee et al. 2009)
spp-17 SaPosin-like Protein family cyp-25A1 CYtochrome P450 family Y4C6B.6 beta-GlucocereBrosidAse
Comparison of glucose downregulated genes with genes that code for proteins that Co-Purifying with DAF-16::GFP (Riedel et al. 2013)
cku-80 Caenorhabditis KU sas-5 Spindle ASsembly abnormal lys-7 LYSozyme npp-9 Nuclear Pore complex Protein pqn-70 Prion-like-(Q/N-rich)-domain-bearing protein
Comparison of glucose downregulated genes with genes upregualted in daf-2(RNAi) and in daf-2 mutants and downregulated in daf-16(RNAi) (Murphy et al. 2003)
lys-7 LYSozyme D1086.3 not known T23G7.3 not known
Y32H12A.8 not known
Others used microarray analysis to identify genes that are differentially regulated
when fed a 2% glucose diet (Lee et al. 2009). Of the 40 genes identified in their study,
13 of the genes were also identified by our RNA-seq analysis (Table 4.5). The
experimental procedure between our study and the Lee et al study were not identical
which may contribute to the differences in the genes identified. While Lee et al.,
identified a much smaller set of glucose responsive genes, our results share 35%
similarity, even despite different experimental conditions. In terms of experimental
conditions, our transcriptome analysis was conducted using RNA from young (non-
74

gravid) adult, wild-type worms supplemented with 0.5% glucose while their analysis was
conducted with gravid day-1 adult, wild-type worms supplemented with 2.0% glucose
(1.5x more glucose). Additionally, to reduce the potential for upregulated stress
response genes not related to glucose supplementation we chose to synchronize our
populations via egg lay rather than hypochlorite treatment before RNA isolation. Thus,
the differences in gene expression changes in response to glucose between each group
can likely be attributed to different experimental procedures, including different
transcriptome analysis procedures (microarray vs. RNAseq) different glucose
concentrations (2% vs 0.5%), different adult stages analyzed and different
synchronization methods.
Table 4.5 Genes differentially regulated by glucose- identified by two independent studies*
Gene (Sequence) Gene Class Description
Upregulated: Unknown (C53A3.2) Not known aqp-8 (K02G10.7) Aquaporin or aquaglyceroporin related comt-4 (Y40B10A.6) Catechol-O-MethylTransferase family ugt-41 (F10D2.11) UDP-glucoronosyl/glucosyl transferase col-12 (F15H10.1) Collagen nhr-43 (C29E6.5) Nuclear hormone receptor family ptr-22 (Y80D3A.7) Patched Related family Unknown (F44G3.2) Not known far-3 (F15B9.1) Fatty acid/retinol binding protein cdr-2 (C54D10.1) Cadmium responsive amt-1 (C05E11.4) Ammonium Transporter homolog Downregulated: gba-4 (Y4C6B.6) Beta-glucocerebrosidase spp-5 (T08A9.9) Saposin-like protein family *Identified by this study and (Lee et al. 2009).
75

We used BLASTp and HomoloGene analysis to identify other C. elegans genes
that are differentially regulated by a glucose diet and have similarity to human genes
that are known or thought to be involved with metabolic syndrome, obesity and/or type 2
diabetes or obesity (Table 4.6). We identified genes involved with cellular energy
metabolism, insulin or glucose regulation, and lipid biosynthesis. Additionally, we
identified human homologs, that are differentially regulated in a diabetic or obese
physiological state, for C. elegans genes that were upregulated in animals fed a
glucose-supplemented diet (e.g., asm-2; UGCG ceramide glucosyltransferase)
(Błachnio-Zabielska et al. 2012; Boini et al. 2010; X. Li, Gulbins, and Zhang 2012;
Schuchman et al. 1992). Our findings from this study indicate that there are potentially
conserved gene expression responses between C. elegans fed a glucose-
supplemented diet and a diabetic and/or obesity state observed in humans.
Table 4.6. Examples of C. elegans Glucose Responsive Genes that are Relevant to Human Metabolic Diseases
Gene Human Gene (% Identity) Brief Description Associated Disease State
T19H12.6 GGT1 (28%)
-glutamyl traspeptidase
Associated with type 2 diabetes and obesity (Berisha et al. 2011; Kónya et al. 1990).
ant-1.4 SLC25A6/ANT3 (71%)
ADP/ADT Translocator
ADP/ATP translocase family that plays a fundamental role in cellular energy metabolism; Interacts with SIRT4 to regulate insulin secretion in response to glucose; differentially expressed in diabetic mice (Ahuja et al. 2007; H. Lu et al. 2008).
aqp-7 AQP10 (36%) Aquaglyceroporin
AQP10 is expressed in human adipose tissue, functions to regulate glycerol efflux and thus a normal adiposity (protection from obesity) (Laforenza et al. 2013).
lbp-6 FABP4 (48%)
Fatty acid binding protein
FABP4 functions as an adipokine, regulates insulin secretion during obesity; associated with pathogenesis of atherosclerosis, type 2 diabetes,
76

metabolic and vascular disease (Engeli et al. 2013; Kim et al. 2014; Kralisch and Fasshauer 2013; Lamounier-Zepter et al. 2013; Wu et al. 2014).
C54E4.5 MIOX (51%) Inositol Oxygenase
Increase in MIOX activity is proportional to serum glucose concentrations; diabetic mice display increased MIOX in the cortex of the kidney (Y. Lu et al. 2009; Nayak et al. 2005; Yang et al. 2010).
poml-3 PON2 (30%) Paraxonase
encode high density lipoprotein (HDL)-related glycoproteins; PON2 has a significant protective role against macrophage triglyceride accumulation, macrophage TG biosynthesis, microsomal DGAT1 activity and macrophage oxidative stress, under high glucose concentrations in mice (Meilin et al. 2010).
pkc-2 PRKCA (69%) Protein Kinase C
type 2 diabetic rats display persistent translocation and activation of PKC in soleus muscles, and this persistent PKC activation may contribute to impaired glycogen synthesis and insulin resistance (Avignon et al. 1996).
asm-2 SMPD1 (37%)
Acid Spingomyelinase
Stress is thought to activate sphingomyelinase to generate ceramide, which serves as a second messenger in initiating the apoptotic response; Expression higher in obese diabetic patients (Błachnio-Zabielska et al. 2012; Boini et al. 2010; X. Li, Gulbins, and Zhang 2012; Schuchman et al. 1992).
cgt-1 UGCG (40%)
Ceramide glucosyltransferase
catalyzes the first glycosylation step in glycosphingolipid biosynthesis; lipid/sugar membrane components; synthase in central nervous system regulates body weight and energy homeostasis (Nordström et al. 2013).
R11F4.1 GK (50%) Glycerol Kinase
glycerol kinase deficiency has been implicated in in insulin resistance and type 2 diabetes mellitus; Enhanced adipose glycerol kinase enzymatic activity in aquaporin 7 deficient obese mice (Hibuse et al. 2005; Rahib et al. 2007).
ech-7 ECHS1 (56%)
Enoyl-Coenzye A Hydratase
catalyzes the second step in mitochondrial fatty acid beta-oxidation; downregulated in WT mouse heart tissue in response to ischemic post-conditioning following ischemia-reperfusion. This effect is not observed in diabetic mouse heart tissue (Zhu et al. 2012).
77
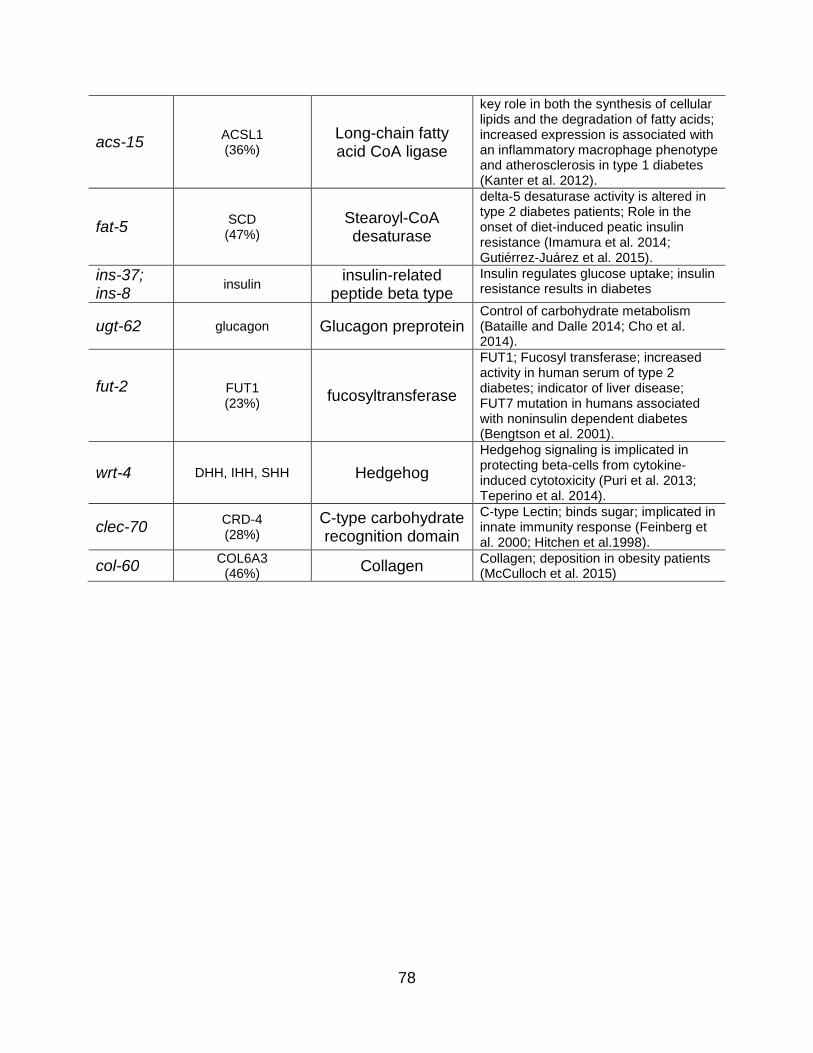
acs-15 ACSL1 (36%)
Long-chain fatty acid CoA ligase
key role in both the synthesis of cellular lipids and the degradation of fatty acids; increased expression is associated with an inflammatory macrophage phenotype and atherosclerosis in type 1 diabetes (Kanter et al. 2012).
fat-5 SCD (47%)
Stearoyl-CoA desaturase
delta-5 desaturase activity is altered in type 2 diabetes patients; Role in the onset of diet-induced peatic insulin resistance (Imamura et al. 2014; Gutiérrez-Juárez et al. 2015).
ins-37; ins-8 insulin insulin-related
peptide beta type Insulin regulates glucose uptake; insulin resistance results in diabetes
ugt-62 glucagon Glucagon preprotein Control of carbohydrate metabolism (Bataille and Dalle 2014; Cho et al. 2014).
fut-2
FUT1 (23%) fucosyltransferase
FUT1; Fucosyl transferase; increased activity in human serum of type 2 diabetes; indicator of liver disease; FUT7 mutation in humans associated with noninsulin dependent diabetes (Bengtson et al. 2001).
wrt-4 DHH, IHH, SHH Hedgehog Hedgehog signaling is implicated in protecting beta-cells from cytokine-induced cytotoxicity (Puri et al. 2013; Teperino et al. 2014).
clec-70 CRD-4 (28%)
C-type carbohydrate recognition domain
C-type Lectin; binds sugar; implicated in innate immunity response (Feinberg et al. 2000; Hitchen et al.1998).
col-60 COL6A3 (46%) Collagen Collagen; deposition in obesity patients
(McCulloch et al. 2015)
78

CHAPTER 5
MATERIALS AND METHODS
C. elegans Strains and Culture Conditions
The wild-type Bristol strain (N2) and mutant strains were cultured using
nematode growth media (NGM) plates (3g NaCl, 20.0g agar, 2.5g peptone, 975mL
diH2O, 1mL of 1M CaCl2, 1mL of 2mg/mL uracil, 1mL of 5mg/mL cholesterol, 25mL of
1M PPB, 1mL of 1M MgSO4) seeded with E. coli (OP50, HT115 or ΔPTS-OP50, as
noted in each experiment) and raised at 20ºC as described (Brenner 1974). Animals
were maintained on OP50 unless otherwise noted. Genetic mutants used for these
studies include: daf-2(e1370), daf-16(mu86), daf-2(e1370);daf-16(mu86), fat-
5(tm420);fat-6(tm331), daf-2(e1370);fat-5(tm420);fat-6(tm331), fat-6(tm331);fat-
7(wa36), daf-2(e1370);fat-6(tm331);fat-7(wa36), hyl-2(tm2031), daf-2(e1370);hyl-
2(tm2031), daf-2(e1370);sod-2(sj173);sod-3(sj134), glp-1(e2141), oga-1(ok1207), ced-
3(n717), hif-1(ia4) and egl-9(sa307). Adult hermaphrodites were allowed to lay eggs on
a plate and the subsequent offspring developed on the specified diet. Anatomical
markers used to identify developmental stage include gonad morphology or hours post
L4-adult molt. Adult animals used in the assays were collected 22-26 hours post the L4-
adult molt. To feed animals a sugar-supplemented diet, NGM plates were made
(60mmx15mm petri dishes filled with 10mL NGM); the plates were allowed to solidify for
at least one day before being seeded with 300μL of appropriate glucose (D-(+)-Glucose,
Sigma) stock solution, prepared in diH2O, to reach the final desired glucose
concentration. The concentration of glucose used depended on the specific experiment.
For example, to make the 0.5% glucose plates, 300μl of a 925 mM stock was used,
79

(50mg/plate). Glucose solution is spread evenly, fully covering the entire plate, and
allowed to dry and reach equilibrium in the media for at least 24 hours. Plates were
seeded with 300μL of E. coli (OD600nm, 0.6≤0.9) that was spread evenly, covering the
plate. The bacteria solution was allowed to dry completely before animals were placed
on the media. Freshly made plates were used within a 7-day period. It is important to
note that the bacterial lawn must be seeded to cover the entirety of the NGM plate, as
results vary when the bacterial lawn is placed to only partially cover the NGM.
Bacterial Strains and Culture Conditions
Overnight cultures of all E. coli strains (OP50, HT115 or ΔPTS-OP50, as noted in
each experiment) were grown in LB (10g Bacto-tryptone, 5g Bacto-yeast, 5g NaCl, H2 O
to 1 liter, pH to 7.0 using 1M NaOH) at 37°C (OD600nm, 0.6≤0.9). E. coli OP50 is a uracil
auxotroph whose growth is limited on NGM plates. ΔPTS-OP50 does not grow in
minimal media with glucose as the sole carbon source, but grows similarly to OP50 and
HT115 E. coli strains in an overnight culture grown in LB at 37°C. For all experiments,
bacterial strains from overnight cultures that reached an OD600nm of 0.6≤0.9 were used
for seeding NGM plates.
Anoxia and Paraquat Exposure
Animals were placed into anoxia in BD Biobag type A anaerobic environmental
chambers (BD Biosciences, Rockville MD) at 20ºC (Padilla et al. 2002; LaRue and
Padilla 2011). Anoxic conditions were verified using resazurin indicators (<.001kPa of
O2 detection limit). Any trials that failed to reach anoxic conditions within 1.5 hours
80

were nulled. After anoxia treatment, animals were allowed to recover for 1 day and the
surviving animals were examined for an unimpaired or impaired (abnormal movement or
morphology) phenotype. For oxidative stress assays using paraquat, 200 µl of a 150
mM of freshly made aqueous paraquat solution (Sigma-Aldrich) was distributed onto
small NGM breeder plates seeded with OP50 E. coli. The plates contained either 0.5%
glucose or no glucose. Media was allowed to dry before 10 synchronized 1-day old
adult hermaphrodites were transferred to each plate and kept at 20ºC. Animals were
assayed on a daily basis to examine survival rate. Five independent plates were
assayed.
Oil Red O Staining
To detect lipid levels in C. elegans of the specified genotypes, we used the Oil
Red O method as described (O’Rourke et al. 2009). Briefly, approximately 200-500
synchronized 1-day old adult animals were collected and washed 3 times with 1x PBS.
To permeabilize the cuticle, worms were resuspended in 120µL of 1X PBS to which an
equal volume of 2X MRWB buffer containing 2% paraformaldehyde was added.
Samples were rocked for 1 hour at room temperature. Animals were then allowed to
settle by gravity, supernatant was removed and animals were washed with 1X PBS to
remove paraformaldehyde. Worms were resuspended in 60% isopropanol and rocked
for 15 minutes at room temperature to dehydrate. Animals were then allowed to settle,
supernatant was removed and 1mL of 60% Oil Red O dye was added. Animals were
rocked overnight at room temperature in the dye. After allowing worms to settle, dye
was removed, samples were washed 1 time with 1x PBS and then resuspended in 200
81
µL of 1x PBS to which 0.01% Triton X-100 was added. Animals were mounted on 2%
agarose slides and imaged with a Zeiss microscope and color camera. The total
number of animals stained was N ≥200 for each of 3 independent experiments. At least
10 animals per experiment and genotype were randomly imaged and assayed for the
presence of Oil Red O in the pharynx region.
Fatty Acid Supplementation
Fatty acid supplementation was conducted as described (Deline, Vrablik, and
Watts 2013). Briefly, NGM containing 0.1% Tergitol (NP-40) was autoclaved and cooled
to 55C, after which oleic acid sodium salt (Sodium Oleate, Nu-Chek Prep, Inc) was
added to a final concentration of 300uM. The supplemented plates are allowed to dry in
the dark for 2-4 days and then seeded with 300μL of OP50 E. coli (OD600nm, 0.6≤0.9)
that was allowed to dry in the dark for an additional 1-2 day(s). Embryos were then
added to supplemented plates and incubated at 20C until they reached day-1 of
adulthood. On day-1 of adulthood, animals were transferred to glucose-supplemented
plates for 1 hour before being exposed to 24 hours of anoxia while on the glucose-
supplemented plates.
Glucose Quantification
C. elegans were raised from embryo to day one of adulthood under standard, or
under glucose supplemented conditions. For each treatment, approximately 300-2000
synchronized 1-day old adult animals were collected from 3 large NGM plates, and
washed 3 times with M9 to remove bacteria. Animals were then allowed to settle by
82

gravity, supernatant was removed, and 200uL of worm suspension was kept. A 50uL
aliquot of worm suspension was removed and frozen immediately for subsequent
protein quantification. The remaining 150uL worm suspension was sonicated on ice for
1 minute at medium speed. Glucose in lysed worm extracts was quantified using a
glucose hexokinase assay on a Unitech Chemwell-T autoanalyzer. Glucose
concentrations were normalized to the amount of total protein (mg) in each sample.
Protein Quantification
Approximately 300-2000 synchronized 1-day old adult animals were collected
from 3 large NGM plates, and washed 3 times with M9 to remove bacteria. Animals
were then allowed to settle by gravity, supernatant was removed, and 200uL of worm
suspension was kept. A 50uL aliquot of suspension was removed for protein
quantification. 50ul of tissue extraction buffer containing complete protease inhibitor was
added to the 50uL of worm suspension. Suspension was sonicated for 1-2 minutes on
ice at medium speed. Following sonication, 50uL of tissue extraction buffer with
protease inhibitor was added. The total volume of suspension was then centrifuged at
13,000 RPM for 12 minutes at 4C to remove debris. Approximately 80-100uL of
supernatant was removed for protein quantification. Protein was quantified using a
Millipore Direct Detect Spectrometer.
RNA Isolation
Young non-gravid adults were collected for mRNA isolation. We opted to collect
animals by an egg laying procedure rather than a hypochlorite protocol in order to
83

minimize potential exposure to stress (L1 starvation) or reactive oxygen species (ROS)
induction by hypochlorite solution. Thus, to grow a large population of animals, gravid
adults were allowed to lay eggs on several plates for 2-4 hours. All adults were washed
off with M9 and the embryos, which remained on the plate, were allowed to hatch. L1
animals were collected and placed on respective media plates (OP50 only or OP50
supplemented with 0.5% glucose). Approximately 10,000 animals (per trial) were grown
to young adulthood, past the L4 molt but prior to egg production, before collection by
gravity separation with M9 in 15ml conical tubes. The animals were washed 3x with M9
and allowed to settle by gravity separation to remove bacteria. Excess M9 was
removed, and 4 volumes of Trizol per volume of animals were added. The tubes were
immediately frozen in liquid nitrogen, thawed and briefly vortexed; this step was
repeated and then followed by a 5-minute incubation at room temperature. To each tube
0.2 ml of chloroform per 1 ml of Trizol was added, mixed gently, for 15 seconds,
incubated at room temperature for 2-3 minutes, and then centrifuged at 12,000g for 15
minutes at 4ºC. The colorless upper phase was transferred to an RNase free tube. RNA
was then purified using an Ambion PureLink RNA Mini Kit (Cat#12183018A). Following
RNA purification, the RNA was treated with DNase I (Life Technologies Cat#
12185010), quantified using a NanoDrop Spectrophotometer and stored at -80ºC. RNA
was isolated from three independent experiments.
RNA-Sequencing Analysis
We performed next-generation RNA sequencing (RNA-Seq) experiments and
analysis to decipher the expression pattern of genes differentially regulated by glucose
84

in wild-type C. elegans. For a reliable statistical analysis, RNA sampling was done in
three biological replicates both for wild type and glucose-fed C. elegans. The RNA
sequencing was done at the University of Texas Southwestern Genomics Core facility,
which resulted in generation of approximately 33.5M, 30.9M and 33.9M single-end
reads of length 50 bp for the three wild-type replicates (mean 32.8 million reads), and
34M, 32.5M and 32.1M single-end reads of length 50 bp for the three glucose-fed
replicates (mean 32.9 million reads). These deep sequencing raw transcriptome data
were then used for a comprehensive quantitative analysis of differential gene regulation
in glucose-fed C. elegans. We employed the frequently used, publicly available Tuxedo
suite of programs for RNA-Seq analysis, which includes the software Bowtie, Tophat
and Cufflinks (Langmead et al. 2009; Trapnell et al. 2009; Trapnell et al. 2010). Bowtie
is an ultra high-throughput sequence read aligner that takes the FASTQ files of
sequence reads as input and performs alignment of reads onto the reference genome.
Tophat utilizes the services of Bowtie to first obtain the read alignment and then parse
the alignment to infer the exon-exon splice junctions. A database of putative junctions is
built by examining the “islands” of reads aligning contiguously onto exonic locations.
The splice junctions are confirmed by aligning the reads against this database; the two
fragments of “junction” reads aligning to different genome locations provide the hints of
5’ and 3’ splice sites. Cufflinks utilizes the read alignment provided by Tophat to perform
the differential expression analysis of transcripts. We used the C. elegans genome build
WS195 at NCBI as the reference genome for obtaining the read alignment using Bowtie
and the splice junctions using Tophat. Cufflinks was used to identify the genes in
glucose-fed C. elegans with significant alteration in their expressions compared to wild-
85

type C. elegans. This is accomplished by examining the difference in their abundance
under the two conditions. The abundance of a transcript is measured in terms of
“Fragments Per Kilobase of transcript per Million fragments mapped” (FPKM),
normalized for the transcript length and total number of cDNA fragments for a sample
replicate (Trapnell et al. 2010).The difference in expression is obtained as the logarithm
of fold change in abundance between the two conditions. Cufflinks performs a statistical
significance test for differential expression of each transcript based on a negative
binomial model estimated from the data (Trapnell et al. 2010). The transcripts passing
the significance test (False discovery rate (FDR) adjusted p-value to be less than 0.05,)
were examined further for their abundance fold change between the conditions
(Trapnell et al. 2010). Custom programs were developed for further parsing of this data
and classifying the differentially expressed genes based on functional annotation at
Wormbase database (http://www.wormbase.org/). The differentially expressing genes
were further grouped into different functional classes using gene ontology based
hierarchical functional classification and the Database for Annotation, Visualization and
Integrated Discovery (DAVID) functional classification tool
http://david.abcc.ncifcrf.gov/home.jsp). We used the Gene List Venn Diagram program
(http://genevenn.sourceforge.net) to compare our RNA-seq data set with other gene
expression datasets.
Quantitative RT-PCR
Animals were collected at day-1 of adulthood for mRNA isolation. RNA extraction was
performed as described above. Reverse transcription to generate cDNA was performed
86

using SuperScript III first-strand synthesis system for RT-PCR (Invitrogen, cat #18080-
051). Quantitative RT-PCR was carried out using a ViiaTM7 Real-Time PCR system
(Applied Biosystems) and following primer validation, results were analyzed using the
comparative Ct method (Applied Biosystems ViiaTM7 Real-Time PCR system Booklet 3).
As per Hoogewijs et al. mRNA levels of Y45F10D.4 were used as an endogenous
control for normalization (Hoogewijs et al. 2008). The average of at least 2 technical
replicates was used for each independent experiment.
Statistical Analysis
All statistical analyses were performed using GraphPad Prism for Macintosh. A
one-way or two-way ANOVA followed by either a Bonferroni or Tukey’s Multiple
Comparisons Test was used to determine significance between 2 or more groups. A T-
test was used to determine significance between 2 groups. For all statistical analysis the
significance level was set at p<0.05.
87

CHAPTER 6
DISCUSSION
An individuals diet can dramatically influence one’s phenotype, physiology, long-
term health and disease risk. A prime example of such a case is the continual increase
in sugar consumption within the human diet and the associated increases in chronic and
severe health issues such as obesity and T2D. Additionally, accompanying these
chronic illnesses are often severe metabolic and vascular dysfunctions (e.g.
cardiovascular disease, insulin resistance, hyperglycemia, hypertriglyceridemia) that
over time lead to detrimental and often fatal complications. Dietary-induced
hyperglycemia can disrupt the auto-regulation of blood flow resulting in oxygen
deprivation in different organs and tissues, and can also result in a decreased ability for
the body to effectively respond to ischemic events (e.g. stroke and myocardial
infarction) (Trayhurn 2013). Furthermore, microvascular and macrovascular dysfunction
can lead to multi-organ and tissue damage, blindness and amputations (Beckman et al.
2013; Creager et al. 2003; Paneni et al. 2013). In fact, as discussed in chapter 1,
vascular diseases are the principal causes of death in people with T2D, and 70% of all
lower limb amputations are a result of T2D complications (Frisbee; Jain et al. 2010;
Vinik and Flemmer 2002). Therefore, a thorough understanding of the impact that
metabolic abnormalities associated with T2D can have on oxygen deprivation
responses is necessary for a more complete understanding of the T2D disease process.
It is not well understood why chronic hyperglycemia (as is the case in T2D patients)
increases sensitivity to ischemic events.
88

Glucose Induces Sensitivity to Oxygen Deprivation
Oxygen deprivation occurs when oxygen levels drop below what is considered as
a normal concentration for the organism, and in many cases is detrimental to survival.
However, some organisms are able to survive and mitigate the temporary loss of normal
oxygen tension however. Many hypoxia and anoxia tolerant organisms utilize
mechanisms such as a dramatic reduction in metabolism (hypometabolism), increased
buffering capacity, excess macromolecule stores and up-regulation of specific genes to
promote survival upon exposure to oxygen deprivation. The vast majority of vertebrates,
however, lack the ability to utilize such mechanisms, and thus are less tolerant of
oxygen deprivation stress. For these organisms survival in the face of oxygen
deprivation often comes in the form of stress-response proteins (heat shock proteins,
antioxidants, cytochrome P40s, etc.) or transcription factors (FOXO, HIF-1, etc.), which
can temporarily promote survival under such stress. Humans with compromised
metabolic homeostasis however, are more susceptible to ischemic events and these
events often lead to significant morbidity and mortality in T2D patients. Thus, their
capacity to tolerate even transient ischemia is significantly impacted. While many of the
signaling cascades and structural changes that promote the early onset of vascular
diseases are well characterized, the mechanisms regulating the increased trauma and
decreased survival seen in T2D patients following an ischemic event are not well
understood.
Given the relative ease of environmental and genetic manipulation, the C.
elegans model is frequently used to explore how exogenous factors influence
phenotypes. Thus, using this well characterized and simple genetic model system that
89

is tolerant of oxygen deprivation exposure, we set out to identify genetic pathways by
which added glucose might impact oxygen deprivation responses. Glucose-
supplementation negatively impacts oxygen deprivation survival in wild-type C. elegans,
increases the amount of stored lipids, and increases sensitivity to the induction of
oxidative stress. Additionally, supplementation with 0.5% (27.75mM) glucose is
sufficient to increase whole worm glucose levels comparable to those seen in T2D
patients. While the difference in whole worm glucose levels between non-supplemented
and 0.5% supplemented C. elegans failed to meet statistical significance (p=0.1), it is
important to note that in mammalian systems, the levels of glucose are maintained
within a narrow window, and seemingly minimal increases or decreases from this
optimal blood glucose level (90 mg/dL or 5mM/L) can have dramatic impacts on
physiology, phenotype and gene expression (Table 1.1) (Szablewski 2011). Since
glucose concentration was measured in whole worm extracts, it remains to be
determined where in the body of C. elegans the excess glucose is stored (e.g., in
specific tissues, cell types or intracellular vs. extracellular). Furthermore, the specific
effects of glucose supplementation on oxygen deprivation response and survival are
partially modulated by other dietary factors (e.g., the specific bacterial food source).
Together these glucose-induced phenotypes demonstrated in C. elegans closely mimic
those seen in hyperglycemic mammalian models. Thus, these data further suggest that
C. elegans can be used to gain mechanistic insight regarding the regulation of the
combinatory stress of glucose supplementation and oxygen deprivation.
Moreover, while some of the mechanisms by which C. elegans survive anoxia
are well characterized (e.g., hypometabolism, fermentation, alternative electron
90

acceptors, etc.) a complete understanding of what is required for proper cellular
maintenance during prolonged anoxia exposure is lacking. N2 animals fed a glucose
diet can survive 6 hours of anoxia, but not 24 hours of anoxia. This suggests that these
anoxia sensitive animals arrest properly (e.g., enter into suspended animation), but
likely cannot properly maintain an anoxia resistant phenotype over time. As discussed in
chapter 1, conserved mechanisms for the survival of oxygen deprivation across species
include decreased protein biosynthesis, a decline in membrane permeability across
tissues, declined firing frequency in the nervous system, and entrance into a state
hypometabolism, which allows the demand and supply of ATP to remain in a low,
steady state of flux. Thus, survival of oxygen deprivation requires not only a steady, low
balance of energy, but also the right cellular milieu of proteins to maintain proper cell
structure and function. During anoxia, for example, it has been shown that the
metabolism of C. elegans is depressed to just 3–4% of aerobic values (Föll et al. 1999).
Thus, it is plausible that glucose supplementation or a hyperglycemic state disrupts the
ability of cells to properly maintain this steady state of hypometabolism. Additionally
proper cellular maintenance during oxygen deprivation requires a specific subset of
genes to be expressed (e.g., genes required for anaerobic metabolism, cell stabilization,
oxygen sensing, etc.) while others that are not involved directly with maintaining the
physical integrity of the cell are typically downregulated. Thus, it is also likely that
glucose might impact the expression of genes required to maintain a hypometabolic
state or to maintain cellular integrity. For example, the accumulation of advanced
glycation end products, ROS and post-translationally modified proteins (hallmarks of
hyperglycemia and T2D) can alter the expression and/or functional activity of such
91
required genes or proteins. Moreover the metabolism of glucose immediately preceding
anoxia exposure, and its abundance during anoxia might alter the ability of C. elegans
to re-route metabolites and properly utilize non-oxygen requiring metabolic pathways of
energy productions such as fermentation reactions.
Glucose-Induced Anoxia Sensitivity is Influenced by the Intestinal Microbiome
Given the results obtained by feeding C. elegans either OP50 or the ΔPTS-OP50
E. coli strain, I hypothesize that both glucose and the metabolism of glucose by the
bacteria impact the stress responses of C. elegans and that the specific repertoire of gut
bacteria in the worm during anoxia is likely important. While glucose induces sensitivity
to anoxia in all cases, the specific concentration of glucose required to elicit significantly
reduced survival is dependent upon the ability of the bacteria to transport and
metabolize glucose (Figure 2.5). In recent years, the nematode has emerged as a
proposed model for understanding, at least in part, the influence of the gut microbiome
on host metabolism, health and ageing (Cabreiro et al. 2013; Cabreiro and Gems 2013).
In a controlled laboratory setting, C. elegans are seemingly germ-free, apart from the
bacteria on which they feed (Montalvo-Katz et al. 2013). In the lab, C. elegans are
reared most often on a single bacterial source, the OP50 strain of E. coli (a uracil
auxotroph). C. elegans crush bacteria with their pharyngeal grinder, and are known to
crush the standard OP50 E. coli strain very efficiently (Avery and Thomas 1997). Adult
C. elegans contain a gut composed of 20 epithelial cells, arranged to form a tube with a
central lumen, thus they can (and have been shown to) harbor fairly large bacterial
populations (Portal-Celhay and Blaser 2012). Considering the natural habitat of
92

C.elegans, their evolution likely occurred in the constant presence of intestinal
microbes, thus it is plausible that many aspects of biological function in the worm
evolved to operate in conjunction with and assisted by gut microbes (Cabreiro and
Gems 2013; Félix and Braendle 2010). For example, a variety of bacterial strains, used
as food sources, have been implicated to have a causal role in C. elegans lifespan,
development, gene expression, fat storage and stress response (MacNeil et al. 2013;
Brooks, Liang, and Watts 2009; Watson et al. 2013; Reinke et al. 2010; LaRue and
Padilla 2011). Additionally, similar to higher-organisms, even in a laboratory setting C.
elegans rely on their gut microbiota to provide essential micronutrients (e.g., folates)
and adult worms harbor 10 times more bacterial cells than their own somatic cells
(Nguyen and Clarke 2012; Cabreiro and Gems 2013). These findings underscore the
idea that bacteria can modulate C. elegans physiology and that the bacteria might
function as more than just a food source. Moreover, it has been shown that gut
microbiota in humans can impact metabolism and energy storage and is likely involved
in the development and control of obesity and inflammation, conditions strongly
associated with T2D (Patrice D. Cani and Delzenne 2009; van Olden, Groen, and
Nieuwdorp 2015; Hartstra et al. 2014; Delzenne and Cani 2010; Allin, Nielsen, and
Pedersen 2014; Cabreiro et al. 2013). Additionally, changes in diet can dramatically
impact gut microbiota and these changes in bacterial populations can impact the
permeability of the gut (Cani et al. 2008). Decreased membrane permeability is an
important feature of anoxia tolerance. Thus, it is likely that the ability of OP50 E. coli to
metabolize glucose might impact the microbiome of C. elegans in such a way that it is
detrimental under anoxic conditions. It is also worth noting that it was determined that E.
93

coli is at least partly alive in the gut of the animals during anoxia exposure (Föll et al.
1999). It is also likely that the potentially toxic byproducts produced by the E. coli play a
role in the induction of anoxia sensitivity in glucose-supplemented animals. E. coli
(including OP50 and HT115 derivatives) for example preferentially utilize glucose as a
carbon source, and E. coli cells produce acetate as an extracellular byproduct of
aerobic cultivations under excess-glucose conditions (De Mey et al. 2007). While high
quantities of acetate have been shown to significantly alter pH, retard growth and inhibit
protein synthesis, its affect on C. elegans physiology and stress responses remains to
be determined. It is also important to note that in anoxia, C. elegans utilized mixed acid
fermentation, which produces multiple acidic end products. Thus, the combination and
possible over-accumulation of acidic byproducts from both E. coli and C. elegans might
be detrimental. Targeted manipulation of the gut microbiota (in humans and in simple
model organisms) could be an interesting approach in understanding the complex
relationship between diet, metabolic disease and stress sensitivity.
Glucose-Induced Anoxia Sensitivity is Modulated by Insulin Signaling via Multiple
Pathways
I determined that the insulin-signaling pathway modulates glucose-induced
anoxia sensitivity in C. elegans, and that daf-2(e1370) resistance under these
conditions requires the activity of multiple pathways. A mutation in the daf-2 insulin/IGF-
1 receptor led to anoxia resistance even when fed a glucose-supplemented diet, which
is not surprising given that the daf-2 animal is known to be resistant to stress in general.
Many of the phenotypes associated with the daf-2(e1370) mutant are mediated through
94

the activation of the FOXO/forkhead transcription factor DAF-16; and a mutation in daf-
16 did indeed suppress the daf-2(e1370) glucose-fed anoxia survival phenotype. Using
a genetic approach I identified some downstream targets of DAF-16 (fat and sod genes)
and a DAF-16 independent gene (hyl-2) that are required for the glucose-fed anoxia
resistant phenotype exhibited by the daf-2(e1370) mutant (summarized in Figures 6.1
and 6.2).
Since excess glucose is thought to increase ROS levels, it seems appropriate
that antioxidant genes such as sod-2/3, which are activated in the daf-2(e1370) animal,
will protect against the effects of a glucose-supplemented diet. Moreover, the response
of mitochondria to oxygen deprivation is particularly critical given their role in energy
production. Additionally, it has been demonstrated that C. elegans mitochondrial (Mit)
mutants are resistant to oxygen deprivation. These mutants utilize a novel metabolism
that allows supplementation of their mitochondrial ETC with non-oxygen requiring
energy generating pathways, and thus they can prolong anoxia tolerance (Butler et al.
2010). It has also been recently demonstrated in C. elegans that cells adapts to oxygen
deprivation, at least in part, via regulated mitochondrial dynamics (Ghose et al. 2013).
Thus, there is a clear role for proper mitochondrial function as a profound effector of
anoxia response and tolerance.
It is not clear what the protective role fatty acid and ceramide biosynthesis plays
in the daf-2(e1370) animal fed a glucose-supplemented diet and exposed to anoxia.
However, consideration of the phenotypes exhibited by the mutations that suppress the
daf-2(e1370) glucose-fed anoxia resistant phenotype may shed some light on the
mechanisms required for anoxia survival. The fat and elo mutants have distinct fatty
95

acid composition changes, with the fat-6;fat-7 double mutant displaying the most
significant alterations in the production of unsaturated fatty acids (Brock, Browse, and
Watts 2007; Shi et al. 2013). Moreover, all of the Δ9 fatty acid desaturase mutants
display decreased cold tolerance and increased endurance to heat stress (Horikawa
and Sakamoto 2009; Savory et al. 2011; Horikawa et al. 2008). The preservation of cell
membrane fluidity is thought to be important for cold tolerance in some organisms, as
an increase in temperature leads to weakened interactions among acyl chains, and
membranes tend to prefer a more fluid state. Thus it is not surprising that fatty acid
biosynthesis in C. elegans has an important role in the alteration of membrane
phospholipids to promote survival during cold stress (unsaturated fatty acids are
required to increase membrane fluidity). Moreover, as phospholipid bilayers experience
environmental fluctuations rendering them more fluid, changes in membrane
permeability occur (increased leackage) (Hochachka & Somero 2001). Thus, given the
importance of membrane permeability in terms of anoxia survival, a decreased
abundance of unsaturated fatty acids might be detrimental to anoxia survival by altering
the rigidity, and thus permeability of membranes in such a way that is not conducive for
the survival of oxygen deprivation. Further, since fat-2, fat-6 and fat-7 mutants display
strong sensitivity to oxidative stress, it seems likely that fatty acids in C. elegans are
important for the survival of oxidative stress, however the mechanistic action of these
fatty acids during oxidative stress is not known (Horikawa and Sakamoto 2009). It is
also thought that one of the primary causes of anoxia- induced death in mammals is
brain dysfunction and cardiac arrhythmias due to a loss of ionic integrity of cell
membranes (Boutilier 2001). Taken together these data highlight the importance of
96

membrane stability, fluidity and permeability in the survival of stress. It appears likely
that alterations in fatty acid composition can negatively impact the adaptability of
membranes under stressful conditions, and thus compromise an organism’s ability to
survive. Additionally, while fatty acids are important structural components of cell
membranes, they also have functional roles in energy storage and as signaling
molecules. It has been determined that dietary fats influence the onset of insulin
resistance through an unknown mechanism, and hyperglycemia-induced increases in
circulating free fatty acids can lead to their accumulation in specific cell types (e.g., lipid
accumulation inside the muscle cell) which in turn can promote insulin resistance by
reducing insulin stimulated glucose uptake (Medina-Urrutia et al. 2015). Further, C.
elegans utilize mixed acid fermentation during anoxia, and these reactions are typically
redox balanced by short-chain unsaturated fatty acids (Butler et al. 2012). Thus, it is
plausible that alterations in fatty acid biosynthesis might negatively impact the ability of
C. elegans to properly make these particular short-chain fatty acids that are likely
important for their ability to maintain an anoxia tolerant state (e.g., continue fermentation
and glycolysis reactions by utilizing these alternative electron acceptors). While it
remains to be determined what specific role(s) fatty acid molecules play in terms of
anoxia survival in C. elegans, it is possible that in the daf-2(e1370) mutant the lipid
profile is altered in such a way that is conducive for maintenance of cellular structures
and function during anoxia stress, and that knock-down of genes involved with lipid
biosynthesis disrupts this lipid profile. For example, it is possible that a change in the
fatty acid composition of cell membranes influences receptor binding or activity, as well
as ion permeability and cell signaling. Additionally, fatty acids have the potential to act
97
as ligands and can modulate the expression of downstream targets. It will be interesting
to tease apart the specific protective role of fatty acids in oxygen deprivation stress,
especially since dietary supplementation of the polyunsaturated fatty acid, oleic acid, is
sufficient to rescue glucose-induced anoxia sensitivity in daf-2;fat-6;fat-7 mutants.
It has recently been shown that ceramides are involved with a surveillance
system that detects mitochondrial defects thus, it is possible that the daf-2(e1370)
animal requires specific ceramides to aid in the defense against the toxic effects that
glucose supplementation has on mitochondria (Liu et al. 2014b). It remains to be
determined if the sod-2/3 antioxidant system will function independently or in
conjunction with ceramide and fatty acid molecules in promoting glucose-fed anoxia
survival in the daf-2(e1370) animal. The recent finding that specific ceramide species
are associated with type 2 diabetes, further implicates the role these lipid molecules
may have in metabolic dysfunction (Lopez et al. 2013; Larsen and Tennagels 2014; Xia
et al. 2014; Boon et al. 2013). Together these data suggest that a combination of
cellular changes ultimately contributes to anoxia sensitivity. We hypothesize that a
disruption in ceramide and fatty acid homeostasis might result in aberrations in
metabolic processes and/or stress response pathways that are required for the proper
maintenance of suspended animation, and thus survival of oxygen deprivation
(Summarized in Figure 6.2).
98
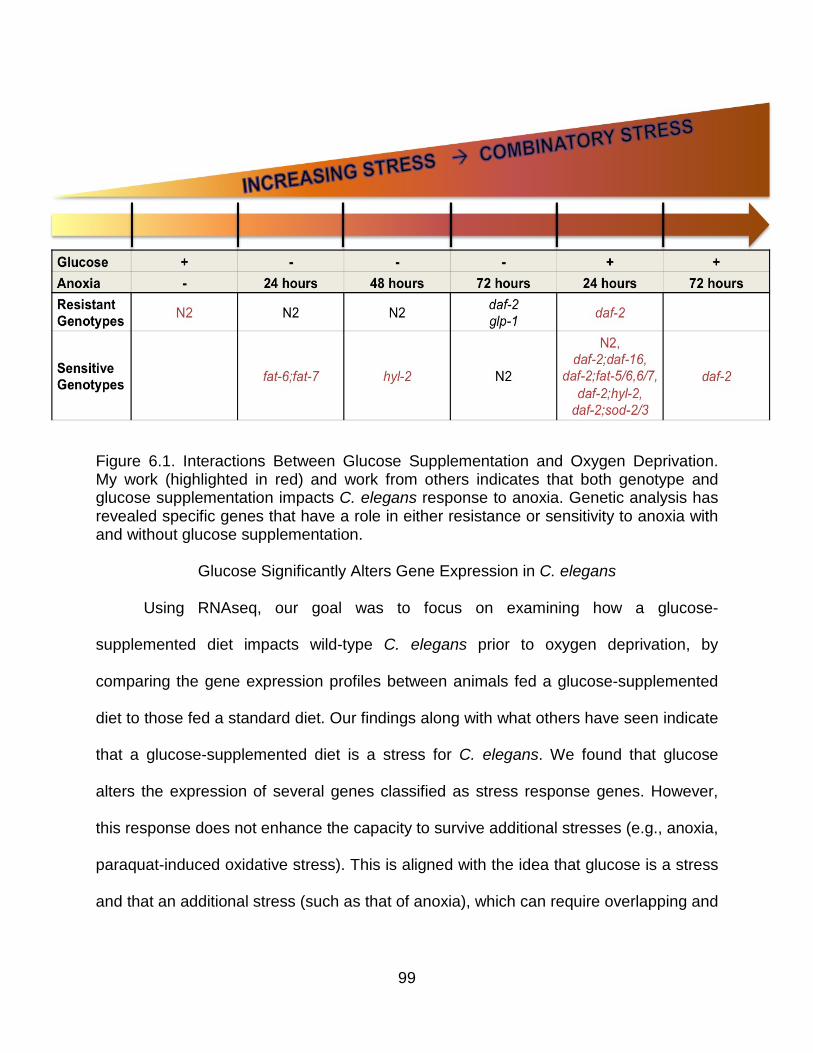
Figure 6.1. Interactions Between Glucose Supplementation and Oxygen Deprivation. My work (highlighted in red) and work from others indicates that both genotype and glucose supplementation impacts C. elegans response to anoxia. Genetic analysis has revealed specific genes that have a role in either resistance or sensitivity to anoxia with and without glucose supplementation.
Glucose Significantly Alters Gene Expression in C. elegans
Using RNAseq, our goal was to focus on examining how a glucose-
supplemented diet impacts wild-type C. elegans prior to oxygen deprivation, by
comparing the gene expression profiles between animals fed a glucose-supplemented
diet to those fed a standard diet. Our findings along with what others have seen indicate
that a glucose-supplemented diet is a stress for C. elegans. We found that glucose
alters the expression of several genes classified as stress response genes. However,
this response does not enhance the capacity to survive additional stresses (e.g., anoxia,
paraquat-induced oxidative stress). This is aligned with the idea that glucose is a stress
and that an additional stress (such as that of anoxia), which can require overlapping and
99

distinct mechanisms for survival, overwhelms the system and leads to compromised
viability.
The differential expression of specific genes, in response to different
environments, does not necessarily imply functional relevance or essential function of
the genes relative to the environmental change. However, aligned with the genetic
mutant analysis data, we did identify differentially expressed genes that are compatible
with the notion that a glucose-supplemented diet alters many cellular functions, notably
metabolism (glycolysis, gluconeogenesis, lipid biosynthesis), stress responses
(chaperons, cytochrome P450 genes), protein modifications (protein glycosylation) and
cellular structure (collagen). Tightly aligned with the findings that glucose induces
significant lipid accumulation in C. elegans, a glucose-supplemented diet also induced
gene expression changes in many genes predicted to be involved with lipid metabolism
or function.
In wild-type animals, the mRNA expression of daf-16 or sod-2/3 was not
differentially regulated by a glucose-supplemented diet. However, there was a down-
regulation of daf-18, ins-8, and daf-15 which are involved in the insulin/insulin-like
signaling pathway but not necessarily directly regulated by DAF-16 (Murphy and Hu
2013). We identified 11 genes that are downregulated by a glucose diet and found by
others to be regulated in a DAF-16 dependent manner (Lee et al. 2009). Further
analysis of these genes would be helpful to determine if they have a role in the daf-
2(e1370) glucose-fed anoxia resistance phenotype. The idea that a glucose-
supplemented diet impacts insulin signaling is in line with the finding by others that
dauer formation (which is regulated by insulin signaling) is suppressed in animals fed a
100

glucose diet (Mondoux et al. 2011). Regulation of the insulin-signaling pathway is
mediated through DAF-2 and DAF-18 with a down-stream affect being the activation or
deactivation of DAF-16 via post-translational phosphorylation/dephosphorylation. DAF-
18, the human PTEN tumor suppressor homolog, negatively regulates insulin-like
signaling by dephosphorylation of AGE-1-generated PIP3 which impacts AKT-1/AKT-2
kinase activity thus regulating DAF-16 (Ogg and Ruvkun 1998). Mutations in daf-18 can
suppress the dauer constitutive and longevity phenotype in daf-2 mutants. However, it is
important to recognize that a daf-18 allele may not impact an organism in the same
manner as a decrease in the expression of daf-18.
Moreover, to our surprise, RNAseq analysis revealed that nearly half (49%) of
the most differentially upregulated C. elegans genes (>25 fold upregulated) in glucose-
fed animals are predicted or known to encode a collagen protein. Interestingly, one
common mechanistic link between hyperglycemia and macrovascular disease is the
modification of collagen (thickening) and the endothelium via AGE induced protein
modification (Stitt, Jenkins, and Cooper 2002). Further, a recent study demonstrated an
important role for collagens in the increased lifespan phenotype of daf-2 mutant
animals. These mutants display significant upregulation of many collagens, some of
which are important for lifespan extension (Ewald et al. 2014). While there is some
overlap between these collagens and the ones identified by our RNAseq experiment,
particularly col-10, col-13 and col-120, we did not conduct RNAseq on daf-2 mutants,
and thus do not know if these collagens are altered in response to glucose feeding in
these mutants. Glucose- induced upregulation of these collagens in wild type animals
however, is not sufficient to confer anoxia survival. It will be interesting to investigate the
101

role of specific collagens and extracellular matrix remodeling in glucose-induced anoxia
sensitivity, especially in the context of reduced insulin signaling.
Together these data show that a glucose-supplemented diet negatively impacts
oxygen deprivation survival and significantly alters gene expression profiles in C.
elegans. Additionally these data suggest that C. elegans share conserved biological
mechanisms in response to glucose- supplementation as those seen in higher
organisms. Thus, we hypothesize that by using C. elegans we can identify novel
mediators in hyperglycemia induced oxygen deprivation sensitivity and further elucidate
the mechanistic action of known mediators. For example, genetic suppression analysis
of the insulin signaling pathway (via mutation of daf-2) revealed that antioxidant activity,
fatty acid and ceramide biosynthesis are essential for the survival of anoxia during
conditions of glucose supplementation. Since, in wild-type animals, many genes were
upregulated in response to a glucose-supplemented diet and a large number of these
genes are known or predicted to be involved with metabolism, we suggest that many
processes (e.g. metabolism, cell signaling, stress responses) are altered in animals fed
a high-glucose diet and that central to glucose-induced anoxia sensitivity is
mitochondrial dysfunction via the disruption of lipid metabolism, ceramide homeostasis,
protein modifications and changes in ROS (summarized in Figure 6.2).
Lastly, it is important to note that while the overall applicability of the study of
complex diseases such as T2D using C. elegans is sometimes limited due to their lack
of complex organs and a circulatory system, studies such as this, utilizing C. elegans to
study specific events associated with such a disease is feasible. The utilization of high-
throughput sequencing, for example, can provide an important foundation for the
102

discovery of potential therapeutic targets or dietary supplements that are conserved
between worms and humans. Additionally, using gene-silencing approaches (such as
RNAi) to explore the biological role of candidate genes that have been identified is more
straightforward and less costly to carry out in C. elegans compared with mammalian
models. Thus, while C. elegans may not be the best model to study T2D per se, we can
model specific aspects of the disease process (e.g., glucose-induced sensitivity to
oxygen deprivation) and identify potentially novel regulators of common complications
seen in hyperglycemic and T2D patients (e.g., macrovascular complications, ischemia).
Figure 6.2. Potential Impacts of Pathways Implicated in Glucose-Induced Anoxia Sensitivity. Genes involved in fatty acid (fat-5, fat-6, fat-7) and ceramide biosynthesis (hyl-2) and antioxidant activity (sod-2, sod-3) is required for resistance to glucose-induced anoxia sensitivity in the context of reduced insulin signaling (daf-2 mutants). Glucose-induced alterations in these implicated pathways (and possibly other pathways) can potentially impact mitochondrial function, gene expression, protein function and membrane fluidity, stability and permeability, thus resulting in a reduced ability to maintain an anoxia tolerant state.
103
REFERENCES
Ahuja, Nidhi, Bjoern Schwer, Stefania Carobbio, David Waltregny, Brian J North, Vincenzo Castronovo, Pierre Maechler, and Eric Verdin. 2007. “Regulation of Insulin Secretion by SIRT4, a Mitochondrial ADP-Ribosyltransferase.” The Journal of Biological Chemistry 282 (46): 33583–92. doi:10.1074/jbc.M705488200.
Allin, K. H., T. Nielsen, and O. Pedersen. 2014. “MECHANISMS IN ENDOCRINOLOGY: Gut Microbiota in Patients with Type 2 Diabetes Mellitus.” European Journal of Endocrinology 172 (4): R167–77. doi:10.1530/EJE-14-0874.
Argraves, Kelley M, Amar A Sethi, Patrick J Gazzolo, Brent A Wilkerson, Alan T Remaley, Anne Tybjaerg-Hansen, Børge G Nordestgaard, et al. 2011. “S1P, Dihydro-S1P and C24:1-Ceramide Levels in the HDL-Containing Fraction of Serum Inversely Correlate with Occurrence of Ischemic Heart Disease.” Lipids in Health and Disease 10 (January): 70. doi:10.1186/1476-511X-10-70.
Avery, Leon, and James H Thomas. 1997. “Feeding and Defecation.” Cold Spring Harbor Laboratory Press. http://www.ncbi.nlm.nih.gov/books/NBK20138/.
Avignon, A., K. Yamada, X. Zhou, B. Spencer, O. Cardona, S. Saba-Siddique, L. Galloway, M. L. Standaert, and R. V. Farese. 1996. “Chronic Activation of Protein Kinase C in Soleus Muscles and Other Tissues of Insulin-Resistant Type II Diabetic Goto-Kakizaki (GK), Obese/Aged, and Obese/Zucker Rats: A Mechanism For Inhibiting Glycogen Synthesis.” Diabetes 45 (10): 1396–1404. doi:10.2337/diab.45.10.1396.
Bataille, Dominique, and Stéphane Dalle. 2014. “The Forgotten Members of the Glucagon Family.” Diabetes Research and Clinical Practice 106 (1). Elsevier: 1–10. doi:10.1016/j.diabres.2014.06.010.
Beckman, Joshua A, Francesco Paneni, Francesco Cosentino, and Mark A Creager. 2013. “Diabetes and Vascular Disease: Pathophysiology, Clinical Consequences, and Medical Therapy: Part II.” European Heart Journal 34 (31): 2444–52. doi:10.1093/eurheartj/eht142.
Belamarich, P F, E Luder, M Kattan, H Mitchell, S Islam, H Lynn, and E F Crain. 2000. “Do Obese Inner-City Children with Asthma Have More Symptoms than Nonobese Children with Asthma?” Pediatrics 106 (6): 1436–41. http://www.ncbi.nlm.nih.gov/pubmed/11099600.
Bengtson, P, C Larson, A Lundblad, G Larson, and P Påhlsson. 2001. “Identification of a Missense Mutation (G329A;Arg(110)--> GLN) in the Human FUT7 Gene.” The Journal of Biological Chemistry 276 (34): 31575–82. doi:10.1074/jbc.M104165200.
104

Berisha, Stela Z, David Serre, Philip Schauer, Sangeeta R Kashyap, and Jonathan D Smith. 2011. “Changes in Whole Blood Gene Expression in Obese Subjects with Type 2 Diabetes Following Bariatric Surgery: A Pilot Study.” PloS One 6 (3): e16729. doi:10.1371/journal.pone.0016729.
Bhuiyan, Mohammad Iqbal Hossain, Mohammad Nurul Islam, Seo Yun Jung, Hye Hyun Yoo, Yong Sup Lee, and Changbae Jin. 2010. “Involvement of Ceramide in Ischemic Tolerance Induced by Preconditioning with Sublethal Oxygen-Glucose Deprivation in Primary Cultured Cortical Neurons of Rats.” Biological & Pharmaceutical Bulletin 33 (1): 11–17. http://www.ncbi.nlm.nih.gov/pubmed/20045928.
Błachnio-Zabielska, A U, M Pułka, M Baranowski, A Nikołajuk, P Zabielski, M Górska, and J Górski. 2012. “Ceramide Metabolism Is Affected by Obesity and Diabetes in Human Adipose Tissue.” Journal of Cellular Physiology 227 (2): 550–57. doi:10.1002/jcp.22745.
Boini, Krishna M, Chun Zhang, Min Xia, Justin L Poklis, and Pin-Lan Li. 2010. “Role of Sphingolipid Mediator Ceramide in Obesity and Renal Injury in Mice Fed a High-Fat Diet.” The Journal of Pharmacology and Experimental Therapeutics 334 (3): 839–46. doi:10.1124/jpet.110.168815.
Boon, James, Andrew J. Hoy, Romana Stark, Russell D. Brown, Ruth C. Meex, Darren C. Henstridge, Simon Schenk, et al. 2013. “Ceramides Contained in LDL Are Elevated in Type 2 Diabetes and Promote Inflammation and Skeletal Muscle Insulin Resistance.” Diabetes 62 (2): 401–10. doi:10.2337/db12-0686.
Boutilier, R G. 2001. “Mechanisms of Cell Survival in Hypoxia and Hypothermia.” The Journal of Experimental Biology 204 (Pt 18): 3171–81.
Boxem, Mike. 2006. “Cyclin-Dependent Kinases in C. Elegans.” Cell Division 1 (January): 6. doi:10.1186/1747-1028-1-6.
Brenner, S. 1974.“The Genetics of Caenorhabditis Elegans.” Methods 77 (1): 71–94. doi:10.1111/j.1749-6632.1999.tb07894.x.
Brock, Trisha J., John Browse, and Jennifer L. Watts. 2007. “Fatty Acid Desaturation and the Regulation of Adiposity in Caenorhabditis Elegans.” Genetics 176 (2): 865–75. doi:10.1534/genetics.107.071860.
Brooks, Kyleann K, Bin Liang, and Jennifer L Watts. 2009. “The Influence of Bacterial Diet on Fat Storage in C. Elegans.” PloS One 4 (10): e7545. doi:10.1371/journal.pone.0007545.
Brownlee, Michael. 2001. “Biology of Diabetic Complications.” Nature 414 (December): 813–20. doi:10.1038/414813a.
105

Busik, Julia V, L Karl Olson, Maria B Grant, and Douglas N Henry. 2002. “Glucose-Induced Activation of Glucose Uptake in Cells from the Inner and Outer Blood-Retinal Barrier.” Investigative Ophthalmology & Visual Science 43 (7): 2356–63. http://www.ncbi.nlm.nih.gov/pubmed/12091438.
Butler, Jeffrey A, Robert J Mishur, Alex F Bokov, Kevin W Hakala, Susan T Weintraub, and Shane L Rea. 2012. “Profiling the Anaerobic Response of C. Elegans Using GC-MS.” PloS One 7 (9): e46140. doi:10.1371/journal.pone.0046140.
Butler, Jeffrey a, Natascia Ventura, Thomas E Johnson, and Shane L Rea. 2010. “Long-Lived Mitochondrial (Mit) Mutants of Caenorhabditis Elegans Utilize a Novel Metabolism.” The FASEB Journal : Official Publication of the Federation of American Societies for Experimental Biology 24 (12): 4977–88. doi:10.1096/fj.10-162941.
Cabreiro, Filipe, Catherine Au, Kit Yi Leung, Nuria Vergara-Irigaray, Helena M. Cochemé, Tahereh Noori, David Weinkove, Eugene Schuster, Nicholas D E Greene, and David Gems. 2013. “Metformin Retards Aging in C. Elegans by Altering Microbial Folate and Methionine Metabolism.” Cell 153 (1): 228–39. doi:10.1016/j.cell.2013.02.035.
Cabreiro, Filipe, and David Gems. 2013. “Worms Need Microbes Too: Microbiota, Health and Aging in Caenorhabditis Elegans.” EMBO Molecular Medicine 5 (9): 1300–1310. doi:10.1002/emmm.201100972.
Cade, W Todd. 2008. “Diabetes-Related Microvascular and Macrovascular Diseases in the Physical Therapy Setting.” Physical Therapy 88 (11): 1322–35. doi:10.2522/ptj.20080008.
Cani, P. D., N. M. Delzenne, J. Amar, and R. Burcelin. 2008. “Role of Gut Microflora in the Development of Obesity and Insulin Resistance Following High-Fat Diet Feeding.” Pathologie Biologie 56 (5): 305–9. doi:10.1016/j.patbio.2007.09.008.
Cani, Patrice D., and Nathalie M. Delzenne. 2009. “Interplay between Obesity and Associated Metabolic Disorders: New Insights into the Gut Microbiota.” Current Opinion in Pharmacology 9 (6): 737–43. doi:10.1016/j.coph.2009.06.016.
Cassada, Randall C, and Richard L Russell. 1975. “The Dauerlarva , a Post-Embryonic Nematode Developmental Elegans Variant of the Caenorhabditis.” Wild 342: 326–42.
Chen, Y, I Ginis, and J M Hallenbeck. 2001. “The Protective Effect of Ceramide in Immature Rat Brain Hypoxia-Ischemia Involves up-Regulation of Bcl-2 and Reduction of TUNEL-Positive Cells.” Journal of Cerebral Blood Flow and Metabolism : Official Journal of the International Society of Cerebral Blood Flow and Metabolism 21 (1): 34–40. doi:10.1097/00004647-200101000-00005.
106

Chen, Yutao, and L Ryan Baugh. 2014. “Ins-4 and Daf-28 Function Redundantly to Regulate C. Elegans L1 Arrest.” Developmental Biology 394 (2): 314–26. doi:10.1016/j.ydbio.2014.08.002.
Cho, Young Min, Yukihiro Fujita, and Timothy J Kieffer. 2014. “Glucagon-like Peptide-1: Glucose Homeostasis and Beyond.” Annual Review of Physiology 76 (January). Annual Reviews: 535–59. doi:10.1146/annurev-physiol-021113-170315.
Choi, Shin Sik. 2011. “High Glucose Diets Shorten Lifespan of Caenorhabditis Elegans via Ectopic Apoptosis Induction.” Nutrition Research and Practice 5 (3): 214–18. doi:10.4162/nrp.2011.5.3.214.
Claeys, Ilse, Gert Simonet, Jeroen Poels, Tom Van Loy, Linda Vercammen, Arnold De Loof, and Jozef Vanden Broeck. 2002. “Insulin-Related Peptides and Their Conserved Signal Transduction Pathway.” Peptides 23 (4): 807–16. http://www.ncbi.nlm.nih.gov/pubmed/11897402.
Clegg, J S. 1997. “Embryos of Artemia Franciscana Survive Four Years of Continuous Anoxia: The Case for Complete Metabolic Rate Depression.” J. Exp. Biol. 200: 467–75.
Creager, Mark A, Thomas F Lüscher, Francesco Cosentino, and Joshua A Beckman. 2003. “Diabetes and Vascular Disease: Pathophysiology, Clinical Consequences, and Medical Therapy: Part I.” Circulation 108 (12): 1527–32. doi:10.1161/01.CIR.0000091257.27563.32.
Crittenden, Sarah L, Emily R Troemel, Thomas C Evans, and Judith Kimble. 1994. “GLP-1 Is Localized to the Mitotic Region of the C . Elegans Germ Line.” Molecular Biology 2911: 2901–11.
De Mey, Marjan, Gaspard J Lequeux, Joeri J Beauprez, Jo Maertens, Ellen Van Horen, Wim K Soetaert, Peter a Vanrolleghem, and Erick J Vandamme. 2007. “Comparison of Different Strategies to Reduce Acetate Formation in Escherichia Coli.” Biotechnology Progress 23 (5): 1053–63.
Deline, Marshall L, Tracy L Vrablik, and Jennifer L Watts. 2013. “Dietary Supplementation of Polyunsaturated Fatty Acids in Caenorhabditis Elegans.” Journal of Visualized Experiments : JoVE, no. 81 (January). doi:10.3791/50879.
Delzenne, Nathalie M., and Patrice D. Cani. 2010. “Nutritional Modulation of Gut Microbiota in the Context of Obesity and Insulin Resistance: Potential Interest of Prebiotics.” International Dairy Journal 20 (4). Elsevier Ltd: 277–80. doi:10.1016/j.idairyj.2009.11.006.
Dennis, Glynn, Brad T Sherman, Douglas A Hosack, Jun Yang, Wei Gao, H Clifford Lane, and Richard A Lempicki. 2003. “DAVID: Database for Annotation,
107

Visualization, and Integrated Discovery.” Genome Biology 4 (5): P3. http://www.ncbi.nlm.nih.gov/pubmed/12734009.
Dyson, Alex, and Mervyn Singer. 2011. “Tissue Oxygen Tension Monitoring: Will It Fill the Void?” Current Opinion in Critical Care 17 (3): 281–89. doi:10.1097/MCC.0b013e328344f1dc.
Engeli, Stefan, Wolfgang Utz, Sven Haufe, Valéria Lamounier-Zepter, Martin Pofahl, Julius Traber, Jürgen Janke, et al. 2013. “Fatty Acid Binding Protein 4 Predicts Left Ventricular Mass and Longitudinal Function in Overweight and Obese Women.” Heart (British Cardiac Society) 99 (13): 944–48. doi:10.1136/heartjnl-2013-303735.
Ewald, Collin Y., Jess N. Landis, Jess Porter Abate, Coleen T. Murphy, and T. Keith Blackwell. 2014. “Dauer-Independent insulin/IGF-1-Signalling Implicates Collagen Remodelling in Longevity.” Nature 519 (7541): 97–101. doi:10.1038/nature14021.
Feinberg, H, S Park-Snyder, A R Kolatkar, C T Heise, M E Taylor, and W I Weis. 2000. “Structure of a C-Type Carbohydrate Recognition Domain from the Macrophage Mannose Receptor.” The Journal of Biological Chemistry 275 (28): 21539–48. doi:10.1074/jbc.M002366200.
Félix, Marie-Anne, and Christian Braendle. 2010. “The Natural History of Caenorhabditis Elegans.” Current Biology : CB 20 (22): R965–69. doi:10.1016/j.cub.2010.09.050.
Félix, Marie-Anne, and Fabien Duveau. 2012. “Population Dynamics and Habitat Sharing of Natural Populations of Caenorhabditis Elegans and C. Briggsae.” BMC Biology 10 (January): 59. doi:10.1186/1741-7007-10-59.
Fiedorowicz, a., S. Prokopiuk, M. Zendzian-Piotrowska, a. Chabowski, and H. Car. 2014. “Sphingolipid Profiles Are Altered in Prefrontal Cortex of Rats under Acute Hyperglycemia.” Neuroscience 256 (November): 282–91. doi:10.1016/j.neuroscience.2013.10.022.
Foe, Victoria E, and Bruce M Alberts. 1985. “In Drosophila Embryos by Anoxia : Visualization of Interphase Nuclear Organization.” Biochemistry.
Föll, R L, A Pleyers, G J Lewandovski, C Wermter, V Hegemann, and R J Paul. 1999. “Anaerobiosis in the Nematode Caenorhabditis Elegans.” Comparative Biochemistry and Physiology. Part B, Biochemistry & Molecular Biology 124 (3): 269–80. http://www.ncbi.nlm.nih.gov/pubmed/10631804.
Forsythe, Michele E, Dona C Love, Brooke D Lazarus, Eun Ju Kim, William a Prinz, Gilbert Ashwell, Michael W Krause, and John a Hanover. 2006. “Caenorhabditis Elegans Ortholog of a Diabetes Susceptibility Locus: Oga-1 (O-GlcNAcase) Knockout Impacts O-GlcNAc Cycling, Metabolism, and Dauer.” Proceedings of the
108

National Academy of Sciences of the United States of America 103 (32): 11952–57. doi:10.1073/pnas.0601931103.
Fowler, M. J. 2008. “Microvascular and Macrovascular Complications of Diabetes.” Clinical Diabetes 26 (2): 77–82. doi:10.2337/diaclin.26.2.77.
Fraser, a G, R S Kamath, P Zipperlen, M Martinez-Campos, M Sohrmann, and J Ahringer. 2000. “Functional Genomic Analysis of C. Elegans Chromosome I by Systematic RNA Interference.” Nature 408 (6810): 325–30. doi:10.1038/35042517.
Friedman, David, and Thomas Johnson. 1987. “A Mutation in the Age-1 Gene.” Genetics, no. 118 (February): 75–86. doi:10.1016/0022-2836(78)90268-1.
Frisbee, Jefferson C. “Obesity, Insulin Resistance, and Microvessel Density.” Microcirculation (New York, N.Y. : 1994) 14 (4-5): 289–98. doi:10.1080/10739680701282945.
Fujii, M, N Ishii, A Joguchi, K Yasuda, and D Ayusawa. 1998. “A Novel Superoxide Dismutase Gene Encoding Membrane-Bound and Extracellular Isoforms by Alternative Splicing in Caenorhabditis Elegans.” DNA Research : An International Journal for Rapid Publication of Reports on Genes and Genomes 5 (1): 25–30. http://www.ncbi.nlm.nih.gov/pubmed/9628580.
Gems, D, a J Sutton, M L Sundermeyer, P S Albert, K V King, M L Edgley, P L Larsen, and D L Riddle. 1998. “Two Pleiotropic Classes of Daf-2 Mutation Affect Larval Arrest, Adult Behavior, Reproduction and Longevity in Caenorhabditis Elegans.” Genetics 150 (1): 129–55. http://www.pubmedcentral.nih.gov/articlerender.fcgi?artid=1460297&tool=pmcentrez&rendertype=abstract.
Ghose, Piya, Eun Chan Park, Alexandra Tabakin, Nathaly Salazar-Vasquez, and Christopher Rongo. 2013. “Anoxia-Reoxygenation Regulates Mitochondrial Dynamics through the Hypoxia Response Pathway, SKN-1/Nrf, and Stomatin-like Protein STL-1/SLP-2.” PLoS Genetics 9 (12): e1004063. doi:10.1371/journal.pgen.1004063.
Giglio, M P, T Hunter, J V Bannister, W H Bannister, and G J Hunter. 1994. “The Manganese Superoxide Dismutase Gene of Caenorhabditis Elegans.” Biochemistry and Molecular Biology International 33 (1): 37–40. http://www.ncbi.nlm.nih.gov/pubmed/8081211.
Girach, A, D Manner, and M Porta. 2006. “Diabetic Microvascular Complications: Can Patients at Risk Be Identified? A Review.” International Journal of Clinical Practice 60 (11): 1471–83. doi:10.1111/j.1742-1241.2006.01175.x.
109

Giugliano, D, A Ceriello, and G Paolisso. 1996. “Oxidative Stress and Diabetic Vascular Complications.” Diabetes Care 19 (3): 257–67. http://www.ncbi.nlm.nih.gov/pubmed/8742574.
Golden, J W, and D L Riddle. 1984. “The Caenorhabditis Elegans Dauer Larva: Developmental Effects of Pheromone, Food, and Temperature.” Developmental Biology 102 (2): 368–78. http://www.ncbi.nlm.nih.gov/pubmed/6706004.
Gong, Jian, Hannia Campos, Stephen McGarvey, Zhijin Wu, Robert Goldberg, and Ana Baylin. 2011. “Genetic Variation in Stearoyl-CoA Desaturase 1 Is Associated with Metabolic Syndrome Prevalence in Costa Rican Adults.” The Journal of Nutrition 141 (12): 2211–18. doi:10.3945/jn.111.143503.
Goñi, Félix M, and Alicia Alonso. 2006. “Biophysics of Sphingolipids I. Membrane Properties of Sphingosine, Ceramides and Other Simple Sphingolipids.” Biochimica et Biophysica Acta 1758 (12): 1902–21. doi:10.1016/j.bbamem.2006.09.011.
Gottlieb, Shoshanna, and Gary Ruvkun. 1994. “Daf-2, Daf-16.” Animals 120 (1988): 107–20.
Hajeri, Vinita a, Jesus Trejo, and Pamela a Padilla. 2005. “Characterization of Sub-Nuclear Changes in Caenorhabditis Elegans Embryos Exposed to Brief, Intermediate and Long-Term Anoxia to Analyze Anoxia-Induced Cell Cycle Arrest.” BMC Cell Biology 6 (January): 47. doi:10.1186/1471-2121-6-47.
Hanover, John a, Michele E Forsythe, Patrick T Hennessey, Thomas M Brodigan, Dona C Love, Gilbert Ashwell, and Michael Krause. 2005. “A Caenorhabditis Elegans Model of Insulin Resistance: Altered Macronutrient Storage and Dauer Formation in an OGT-1 Knockout.” Proceedings of the National Academy of Sciences of the United States of America 102 (32): 11266–71. doi:10.1073/pnas.0408771102.
Hardie, D Grahame, Simon a Hawley, and John W Scott. 2006. “AMP-Activated Protein Kinase--Development of the Energy Sensor Concept.” The Journal of Physiology 574 (Pt 1): 7–15. doi:10.1113/jphysiol.2006.108944.
Hartstra, A. V., K. E. C. Bouter, F. Backhed, and M. Nieuwdorp. 2014. “Insights Into the Role of the Microbiome in Obesity and Type 2 Diabetes.” Diabetes Care 38 (1): 159–65. doi:10.2337/dc14-0769.
Hashmi, Sarwar, Yi Wang, Ranjit S Parhar, Kate S Collison, Walter Conca, Futwan Al-Mohanna, and Randy Gaugler. 2013. “A C. Elegans Model to Study Human Metabolic Regulation.” Nutr. Metab.[Lond.] 10: 31. http://www.biomedcentral.com/content/pdf/1743-7075-10-31.pdf\npapers2://publication/uuid/FD91D905-53B2-4108-97A7-CA8499D5D422.
110
Hassan, H M, and I Fridovich. 1978. “Superoxide Radical and the Oxygen Enhancement of the Toxicity of Paraquat in Escherichia Coli.” The Journal of Biological Chemistry 253 (22): 8143–48. http://www.ncbi.nlm.nih.gov/pubmed/213429.
Henry, W L. 1962. “Perspectives in Diabetes.” Journal of the National Medical Association 54: 476–78. doi:10.2337/diabetes.52.1.1.
Hibuse, Toshiyuki, Norikazu Maeda, Tohru Funahashi, Kaori Yamamoto, Azumi Nagasawa, Wataru Mizunoya, Ken Kishida, et al. 2005. “Aquaporin 7 Deficiency Is Associated with Development of Obesity through Activation of Adipose Glycerol Kinase.” Proceedings of the National Academy of Sciences of the United States of America 102 (31): 10993–98. doi:10.1073/pnas.0503291102.
Hitchen, P G, N P Mullin, and M E Taylor. 1998. “Orientation of Sugars Bound to the Principal C-Type Carbohydrate-Recognition Domain of the Macrophage Mannose Receptor.” The Biochemical Journal 333 ( Pt 3 (August): 601–8. http://www.pubmedcentral.nih.gov/articlerender.fcgi?artid=1219622&tool=pmcentrez&rendertype=abstract.
Holland, William L., Joseph T. Brozinick, Li Ping Wang, Eric D. Hawkins, Katherine M. Sargent, Yanqi Liu, Krishna Narra, et al. 2007. “Inhibition of Ceramide Synthesis Ameliorates Glucocorticoid-, Saturated-Fat-, and Obesity-Induced Insulin Resistance.” Cell Metabolism 5 (3): 167–79. doi:10.1016/j.cmet.2007.01.002.
Honda, Yoko, Masashi Tanaka, and Shuji Honda. 2008. “Modulation of Longevity and Diapause by Redox Regulation Mechanisms under the Insulin-like Signaling Control in Caenorhabditis Elegans.” Experimental Gerontology 43 (6): 520–29. doi:10.1016/j.exger.2008.02.009.
Hong, Sun-pyo, Tae Soo Noh, Seung-Hwan Moon, Young Seok Cho, Eun Jeong Lee, Joon Young Choi, Byung-Tae Kim, and Kyung-Han Lee. 2014. “Hepatic Glucose Uptake Is Increased in Association with Elevated Serum Γ-Glutamyl Transpeptidase and Triglyceride.” Digestive Diseases and Sciences 59 (3): 607–13. doi:10.1007/s10620-013-2957-6.
Hoogewijs, David, Koen Houthoofd, Filip Matthijssens, Jo Vandesompele, and Jacques R Vanfleteren. 2008. “Selection and Validation of a Set of Reliable Reference Genes for Quantitative Sod Gene Expression Analysis in C. Elegans.” BMC Molecular Biology 9 (January): 9. doi:10.1186/1471-2199-9-9.
Horikawa, Makoto, Toshihisa Nomura, Teppei Hashimoto, and Kazuichi Sakamoto. 2008. “Elongation and Desaturation of Fatty Acids Are Critical in Growth, Lipid Metabolism and Ontogeny of Caenorhabditis Elegans.” Journal of Biochemistry 144 (2): 149–58. doi:10.1093/jb/mvn055.
111

Horikawa, Makoto, and Kazuichi Sakamoto. 2009. “Fatty-Acid Metabolism Is Involved in Stress-Resistance Mechanisms of Caenorhabditis Elegans.” Biochemical and Biophysical Research Communications 390 (4). Elsevier Inc.: 1402–7. doi:10.1016/j.bbrc.2009.11.006.
Hsu, Ao-Lin, Coleen T Murphy, and Cynthia Kenyon. 2003. “Regulation of Aging and Age-Related Disease by DAF-16 and Heat-Shock Factor.” Science (New York, N.Y.) 300 (5622): 1142–45. doi:10.1126/science.1083701.
Hunter, T, W H Bannister, and G J Hunter. 1997. “Cloning, Expression, and Characterization of Two Manganese Superoxide Dismutases from Caenorhabditis Elegans.” The Journal of Biological Chemistry 272 (45): 28652–59. http://www.ncbi.nlm.nih.gov/pubmed/9353332.
Imamura, Satoshi, Tomoaki Morioka, Yuko Yamazaki, Ryutaro Numaguchi, Hiromi Urata, Koka Motoyama, Katsuhito Mori, et al. 2014. “Plasma Polyunsaturated Fatty Acid Profile and Delta-5 Desaturase Activity Are Altered in Patients with Type 2 Diabetes.” Metabolism: Clinical and Experimental 63 (11). Elsevier: 1432–38. doi:10.1016/j.metabol.2014.08.003.
Jain, Amit Kumar, Ajit Kumar Varma, Rejitha Mol K.S, Mangalanandan, Arun Bal, and Harish Kumar. 2010. “Digital Amputations in the Diabetic Foot.” The Journal of Diabetic Foot Complications 2 (1): 12–17.
Jiang, H, R Guo, and J a Powell-Coffman. 2001. “The Caenorhabditis Elegans Hif-1 Gene Encodes a bHLH-PAS Protein That Is Required for Adaptation to Hypoxia.” Proceedings of the National Academy of Sciences of the United States of America 98 (14): 7916–21. doi:10.1073/pnas.141234698.
Jiang, Xiao Yan, De Bin Lu, You Zhao Jiang, Li Na Zhou, Li Qing Cheng, and Bing Chen. 2013. “PGC-1?? Prevents Apoptosis in Adipose-Derived Stem Cells by Reducing Reactive Oxygen Species Production in a Diabetic Microenvironment.” Diabetes Research and Clinical Practice 100 (3). Elsevier Ireland Ltd: 368–75. doi:10.1016/j.diabres.2013.03.036.
Jorgensen, Erik M, and Susan E Mango. 2002. “The Art and Design of Genetic Screens: Caenorhabditis Elegans.” Nature Reviews. Genetics 3 (5): 356–69. doi:10.1038/nrg794.
Kanter, Jenny E, Farah Kramer, Shelley Barnhart, Michelle M Averill, Anuradha Vivekanandan-Giri, Thad Vickery, Lei O Li, et al. 2012. “Diabetes Promotes an Inflammatory Macrophage Phenotype and Atherosclerosis through Acyl-CoA Synthetase 1.” Proceedings of the National Academy of Sciences of the United States of America 109 (12): E715–24. doi:10.1073/pnas.1111600109.
112

Kawano, Tsuyoshi, Ryosuke Nagatomo, Yasuo Kimura, Keiko Gengyo-Ando, and Shohei Mitani. 2006. “Disruption of Ins-11, a Caenorhabditis Elegans Insulin-like Gene, and Phenotypic Analyses of the Gene-Disrupted Animal.” Bioscience, Biotechnology, and Biochemistry 70 (12): 3084–87. doi:10.1271/bbb.60472.
Kenyon, Cynthia, Jean Chang, Erin Gensch, Adam Rudner, and Ramon Tabtiang. 1993. “C.elegans Mutant That Lives Twice as Long.” Letters to Nature.
Kim, Su-Jin, Sehyun Chae, Hokeun Kim, Dong-Gi Mun, Seunghoon Back, Hye Yeon Choi, Kyong Soo Park, Daehee Hwang, Sung Hee Choi, and Sang-Won Lee. 2014. “A Protein Profile of Visceral Adipose Tissues Linked to Early Pathogenesis of Type 2 Diabetes Mellitus.” Molecular & Cellular Proteomics : MCP 13 (3): 811–22. doi:10.1074/mcp.M113.035501.
Kim, Yongsoon, and Hong Sun. 2012. “ASM-3 Acid Sphingomyelinase Functions as a Positive Regulator of the DAF-2/AGE-1 Signaling Pathway and Serves as a Novel Anti-Aging Target.” PLoS ONE 7 (9). doi:10.1371/journal.pone.0045890.
Kimura, K. D. 1997. “Daf-2, an Insulin Receptor-Like Gene That Regulates Longevity and Diapause in Caenorhabditis Elegans.” Science 277 (5328): 942–46. doi:10.1126/science.277.5328.942.
Kitaoka, Shun, Anthony D. Morielli, and Feng Qi Zhao. 2013. “FGT-1 Is a Mammalian GLUT2-Like Facilitative Glucose Transporter in Caenorhabditis Elegans Whose Malfunction Induces Fat Accumulation in Intestinal Cells.” PLoS ONE 8 (6): 1–13. doi:10.1371/journal.pone.0068475.
Koning, Lawrence De, and Vs Malik. 2011. “Sugar-Sweetened and Artificially Sweetened Beverage Consumption and Risk of Type 2 Diabetes in Men.” Am J Clin Nutr 93 (3): 1321–27. doi:10.3945/ajcn.110.007922.INTRODUCTION.
Kónya, L, P Bencsáth, G Szénási, L Takács, Z Schaff, A Vereckei, and J Fehér. 1990. “Effect of Free Radicals in Ischaemic Renal Failure in the Dog.” Acta Physiologica Hungarica 76 (4): 319–31. http://europepmc.org/abstract/med/2104499.
Kralisch, S, and M Fasshauer. 2013. “Adipocyte Fatty Acid Binding Protein: A Novel Adipokine Involved in the Pathogenesis of Metabolic and Vascular Disease?” Diabetologia 56 (1): 10–21. doi:10.1007/s00125-012-2737-4.
Kumar, S. 2006. “Caspase Function in Programmed Cell Death.” Cell Death and Differentiation 14 (1): 32–43. doi:10.1038/sj.cdd.4402060.
Laforenza, Umberto, Manuela F Scaffino, and Giulia Gastaldi. 2013. “Aquaporin-10 Represents an Alternative Pathway for Glycerol Efflux from Human Adipocytes.” PloS One 8 (1): e54474. doi:10.1371/journal.pone.0054474.
113

Lam, Jamie C M, and Mary S M Ip. 2007. “An Update on Obstructive Sleep Apnea and the Metabolic Syndrome.” Current Opinion in Pulmonary Medicine 13 (6): 484–89. doi:10.1097/MCP.0b013e3282efae9c.
Lamounier-Zepter, V, C Look, M Ehrhart-Bornstein, S R Bornstein, S Fischer, and U Julius. 2013. “Lipoprotein Apheresis Reduces Adipocyte Fatty Acid-Binding Protein Serum Levels.” Atherosclerosis. Supplements 14 (1): 129–34. doi:10.1016/j.atherosclerosissup.2012.10.010.
Langmead, Ben, Cole Trapnell, Mihai Pop, and Steven L Salzberg. 2009. “Ultrafast and Memory-Efficient Alignment of Short DNA Sequences to the Human Genome.” Genome Biology 10 (3): R25. doi:10.1186/gb-2009-10-3-r25.
Larsen, P L. 1993. “Aging and Resistance to Oxidative Damage in Caenorhabditis Elegans.” Proceedings of the National Academy of Sciences of the United States of America 90 (19): 8905–9. http://www.pubmedcentral.nih.gov/articlerender.fcgi?artid=47469&tool=pmcentrez&rendertype=abstract.
Larsen, Philip J., and Norbert Tennagels. 2014. “On Ceramides, Other Sphingolipids and Impaired Glucose Homeostasis.” Molecular Metabolism 3 (3). Elsevier: 252–60. doi:10.1016/j.molmet.2014.01.011.
LaRue, Bobby, and Pamela Padilla. 2011. “Environmental and Genetic Preconditioning for Long-Term Anoxia Responses Requires AMPK in Caenorhabditis Elegans.” Edited by Anne Hart. PLoS ONE 6 (2): e16790. doi:10.1371/journal.pone.0016790.
Lee, Seung Jae, Coleen T. Murphy, and Cynthia Kenyon. 2009. “Glucose Shortens the Life Span of C. Elegans by Downregulating DAF-16/FOXO Activity and Aquaporin Gene Expression.” Cell Metabolism 10 (5). Elsevier Ltd: 379–91. doi:10.1016/j.cmet.2009.10.003.
Lee, Seung-Jae, Coleen T Murphy, and Cynthia Kenyon. 2009. “Glucose Shortens the Life Span of C. Elegans by Downregulating DAF-16/FOXO Activity and Aquaporin Gene Expression.” Cell Metabolism 10 (5): 379–91. doi:10.1016/j.cmet.2009.10.003.
Li, Weiqing, Scott G Kennedy, and Gary Ruvkun. 2003. “Daf-28 Encodes a C. Elegans Insulin Superfamily Member That Is Regulated by Environmental Cues and Acts in the DAF-2 Signaling Pathway.” Genes & Development 17 (7): 844–58. doi:10.1101/gad.1066503.
Li, Xiang, Erich Gulbins, and Yang Zhang. 2012. “Oxidative Stress Triggers Ca-Dependent Lysosome Trafficking and Activation of Acid Sphingomyelinase.” Cellular Physiology and Biochemistry : International Journal of Experimental
114

Cellular Physiology, Biochemistry, and Pharmacology 30 (4). Karger Publishers: 815–26. doi:10.1159/000341460.
Liu, Ying, Buck S Samuel, Peter C Breen, and Gary Ruvkun. 2014. “Caenorhabditis Elegans Pathways That Surveil and Defend Mitochondria.” Nature 508 (7496). Nature Publishing Group: 406–10. doi:10.1038/nature13204.
Lopez, Ximena, Allison B. Goldfine, William L. Holland, Ruth Gordillo, and Philipp E. Scherer. 2013. “Plasma Ceramides Are Elevated in Female Children and Adolescents with Type 2 Diabetes.” Journal of Pediatric Endocrinology and Metabolism 26 (9-10): 995–98. doi:10.1515/jpem-2012-0407.
Love, Dona C, Salil Ghosh, Michelle a Mondoux, Tetsunari Fukushige, Peng Wang, Mark a Wilson, Wendy B Iser, Catherine a Wolkow, Michael W Krause, and John a Hanover. 2010. “Dynamic O-GlcNAc Cycling at Promoters of Caenorhabditis Elegans Genes Regulating Longevity, Stress, and Immunity.” Proceedings of the National Academy of Sciences of the United States of America 107 (16): 7413–18. doi:10.1073/pnas.0911857107.
Love, Dona C, and John a Hanover. 2005. “The Hexosamine Signaling Pathway: Deciphering the ‘O-GlcNAc Code’.” Science’s STKE : Signal Transduction Knowledge Environment 2005 (312): re13. doi:10.1126/stke.3122005re13.
Lu, Hongfang, Ying Yang, Emma M Allister, Nadeeja Wijesekara, and Michael B Wheeler. 2008. “The Identification of Potential Factors Associated with the Development of Type 2 Diabetes: A Quantitative Proteomics Approach.” Molecular & Cellular Proteomics : MCP 7 (8): 1434–51. doi:10.1074/mcp.M700478-MCP200.
Lu, Y, C Liu, X Miao, K Xu, and X Wu. 2009. “Increased Expression of Myo-Inositol Oxygenase Is Involved in the Tubulointerstitial Injury of Diabetic Nephropathy.” Experimental and Clinical Endocrinology & Diabetes : Official Journal, German Society of Endocrinology [and] German Diabetes Association 117 (6). © J. A. Barth Verlag in Georg Thieme Verlag KG Stuttgart · New York: 257–65. doi:10.1055/s-2008-1081212.
Ma, Dengke K, Michael Rothe, Shu Zheng, Nikhil Bhatla, Corinne L Pender, Ralph Menzel, and H Robert Horvitz. 2013. “Cytochrome P450 Drives a HIF-Regulated Behavioral Response to Reoxygenation by C. Elegans.” Science (New York, N.Y.) 341 (6145): 554–58. doi:10.1126/science.1235753.
MacNeil, Lesley T, Emma Watson, H Efsun Arda, Lihua Julie Zhu, and Albertha J M Walhout. 2013. “Diet-Induced Developmental Acceleration Independent of TOR and Insulin in C. Elegans.” Cell 153 (1): 240–52. doi:10.1016/j.cell.2013.02.049.
Matsunaga, Yohei, Keiko Gengyo-Ando, Shohei Mitani, Takashi Iwasaki, and Tsuyoshi Kawano. 2012. “Physiological Function, Expression Pattern, and Transcriptional
115

Regulation of a Caenorhabditis Elegans Insulin-like Peptide, INS-18.” Biochemical and Biophysical Research Communications 423 (3): 478–83. doi:10.1016/j.bbrc.2012.05.145.
Matsunaga, Yohei, Kensuke Nakajima, Keiko Gengyo-Ando, Shohei Mitani, Takashi Iwasaki, and Tsuyoshi Kawano. 2012. “A Caenorhabditis Elegans Insulin-like Peptide, INS-17: Its Physiological Function and Expression Pattern.” Bioscience, Biotechnology, and Biochemistry 76 (11): 2168–72. doi:10.1271/bbb.120540.
McCulloch, Laura J, Tom J Rawling, Kajsa Sjöholm, Niclas Franck, Simon N Dankel, Emily J Price, Bridget Knight, et al. 2015. “COL6A3 Is Regulated by Leptin in Human Adipose Tissue and Reduced in Obesity.” Endocrinology 156 (1). Endocrine Society Chevy Chase, MD: 134–46. doi:10.1210/en.2014-1042.
McElwee, Joshua J, Eugene Schuster, Eric Blanc, Janet Thornton, and David Gems. 2006. “Diapause-Associated Metabolic Traits Reiterated in Long-Lived Daf-2 Mutants in the Nematode Caenorhabditis Elegans.” Mechanisms of Ageing and Development 127 (5): 458–72. doi:10.1016/j.mad.2006.01.006.
Medina-Urrutia, Aida, Carlos Posadas-Romero, Rosalinda Posadas-Sánchez, Esteban Jorge-Galarza, Teresa Villarreal-Molina, María del Carmen González-Salazar, Guillermo Cardoso-Saldaña, Gilberto Vargas-Alarcón, Margarita Torres-Tamayo, and Juan Gabriel Juárez-Rojas. 2015. “Role of Adiponectin and Free Fatty Acids on the Association between Abdominal Visceral Fat and Insulin Resistance.” Cardiovascular Diabetology 14 (1): 20. doi:10.1186/s12933-015-0184-5.
Meilin, Edna, Michael Aviram, and Tony Hayek. 2010. “Paraoxonase 2 (PON2) Decreases High Glucose-Induced Macrophage Triglycerides (TG) Accumulation, via Inhibition of NADPH-Oxidase and DGAT1 Activity: Studies in PON2-Deficient Mice.” Atherosclerosis 208 (2): 390–95. doi:10.1016/j.atherosclerosis.2009.07.057.
Mendenhall, Alexander R, Bobby LaRue, and Pamela a Padilla. 2006a. “Glyceraldehyde-3-Phosphate Dehydrogenase Mediates Anoxia Response and Survival in Caenorhabditis Elegans.” Genetics 174 (3): 1173–87. doi:10.1534/genetics.106.061390.
Mendenhall, Alexander R, Bobby LaRue, and Pamela A Padilla. 2006b. “Glyceraldehyde-3-Phosphate Dehydrogenase Mediates Anoxia Response and Survival in Caenorhabditis Elegans.” Genetics 174 (3): 1173–87. doi:10.1534/genetics.106.061390.
Mendenhall, Alexander R, Michelle G LeBlanc, Desh P Mohan, and Pamela a Padilla. 2009. “Reduction in Ovulation or Male Sex Phenotype Increases Long-Term Anoxia Survival in a Daf-16-Independent Manner in Caenorhabditis Elegans.” Physiological Genomics 36 (3): 167–78. doi:10.1152/physiolgenomics.90278.2008.
116

Mendler, Michael, Andreas Schlotterer, Youssef Ibrahim, Georgi Kukudov, Thomas Fleming, Angelika Bierhaus, Christin Riedinger, et al. 2014. “Daf-16/FOXO and Glod-4/glyoxalase-1 Are Required for the Life-Prolonging Effect of Human Insulin under High Glucose Conditions in Caenorhabditis Elegans.” Diabetologia 58 (2): 393–401. doi:10.1007/s00125-014-3415-5.
Menuz, Vincent, Kate S Howell, Sébastien Gentina, Sharon Epstein, Isabelle Riezman, Monique Fornallaz-Mulhauser, Michael O Hengartner, Marie Gomez, Howard Riezman, and Jean-Claude Martinou. 2009. “Protection of C. Elegans from Anoxia by HYL-2 Ceramide Synthase.” Science (New York, N.Y.) 324 (5925): 381–84. doi:10.1126/science.1168532.
Mi, Huaiyu, Anushya Muruganujan, John T Casagrande, and Paul D Thomas. 2013. “Large-Scale Gene Function Analysis with the PANTHER Classification System.” Nature Protocols 8 (8): 1551–66. doi:10.1038/nprot.2013.092.
Milton, Sarah L, and Howard M Prentice. 2007. “Beyond Anoxia: The Physiology of Metabolic Downregulation and Recovery in the Anoxia-Tolerant Turtle.” Comparative Biochemistry and Physiology. Part A, Molecular & Integrative Physiology 147 (2): 277–90. doi:10.1016/j.cbpa.2006.08.041.
Mohapatra, Alok Das, Sunil Kumar, Ashok Kumar Satapathy, and Balachandran Ravindran. 2011. “Caspase Dependent Programmed Cell Death in Developing Embryos: A Potential Target for Therapeutic Intervention against Pathogenic Nematodes.” PLoS Neglected Tropical Diseases 5 (9). doi:10.1371/journal.pntd.0001306.
Mondoux, Michelle a, Dona C Love, Salil K Ghosh, Tetsunari Fukushige, Michelle Bond, Gayani R Weerasinghe, John a Hanover, and Michael W Krause. 2011. “O-GlcNAc Cycling and Insulin Signaling Are Required for the Glucose Stress Response in Caenorhabditis Elegans.” Genetics, March. doi:10.1534/genetics.111.126490.
Mondoux, Michelle a., Michael W. Krause, and John a. Hanover. 2010. “C. Elegans Genetic Networks Predict Roles for O-GlcNAc Cycling in Key Signaling Pathways.” Current Signal Transduction Therapy 5 (1): 60–73. doi:10.2174/157436210790226456.
Montalvo-Katz, Sirena, Hao Huang, Michael David Appel, Maureen Berg, and Michael Shapira. 2013. “Association with Soil Bacteria Enhances p38-Dependent Infection Resistance in Caenorhabditis Elegans.” Infection and Immunity 81 (2): 514–20. doi:10.1128/IAI.00653-12.
Montgomery, H. 1957. “George E. Brown Memorial Lecture: Oxygen Tension of Tissues in Vivo.” Circulation 15 (5): 646–60. doi:10.1161/01.CIR.15.5.646.
117

Mosbech, Mai Britt, Rikke Kruse, Eva Bang Harvald, Anne Sofie Braun Olsen, Sandra Fernandez Gallego, Hans Kristian Hannibal-Bach, Christer S. Ejsing, and Nils J. Færgeman. 2013. “Functional Loss of Two Ceramide Synthases Elicits Autophagy-Dependent Lifespan Extension in C. Elegans.” PLoS ONE 8 (7). doi:10.1371/journal.pone.0070087.
Murphy, Coleen T. 2006. “The Search for DAF-16/FOXO Transcriptional Targets: Approaches and Discoveries.” Experimental Gerontology 41 (10): 910–21. doi:10.1016/j.exger.2006.06.040.
Murphy, Coleen T, Steven a McCarroll, Cornelia I Bargmann, Andrew Fraser, Ravi S Kamath, Julie Ahringer, Hao Li, and Cynthia Kenyon. 2003. “Genes That Act Downstream of DAF-16 to Influence the Lifespan of Caenorhabditis Elegans.” Nature 424 (6946): 277–83. doi:10.1038/nature01789.
Nayak, Baibaswata, Ping Xie, Shigeru Akagi, Qiwei Yang, Lin Sun, Jun Wada, Arun Thakur, Farhad R Danesh, Sumant S Chugh, and Yashpal S Kanwar. 2005. “Modulation of Renal-Specific Oxidoreductase/myo-Inositol Oxygenase by High-Glucose Ambience.” Proceedings of the National Academy of Sciences of the United States of America 102 (50): 17952–57. doi:10.1073/pnas.0509089102.
Nguyen, Theresa P T, and Catherine F Clarke. 2012. “Folate Status of Gut Microbiome Affects Caenorhabditis Elegans Lifespan.” BMC Biology 10 (January): 66. doi:10.1186/1741-7007-10-66.
Nomura, Kazuko H, Daisuke Murata, Yasuhiro Hayashi, Katsufumi Dejima, Souhei Mizuguchi, Eriko Kage-Nakadai, Keiko Gengyo-Ando, et al. 2011. “Ceramide Glucosyltransferase of the Nematode Caenorhabditis Elegans Is Involved in Oocyte Formation and in Early Embryonic Cell Division.” Glycobiology, February, 1–48. doi:10.1093/glycob/cwr019.
Nomura, Toshihisa, Makoto Horikawa, Satoru Shimamura, Teppei Hashimoto, and Kazuichi Sakamoto. 2010. “Fat Accumulation in Caenorhabditis Elegans Is Mediated by SREBP Homolog SBP-1.” Genes and Nutrition 5 (1): 17–27. doi:10.1007/s12263-009-0157-y.
Nordström, Viola, Monja Willershäuser, Silke Herzer, Jan Rozman, Oliver von Bohlen Und Halbach, Sascha Meldner, Ulrike Rothermel, et al. 2013. “Neuronal Expression of Glucosylceramide Synthase in Central Nervous System Regulates Body Weight and Energy Homeostasis.” PLoS Biology 11 (3): e1001506. doi:10.1371/journal.pbio.1001506.
Novgorodov, Sergei a, Tatyana I Gudz, and Lina M Obeid. 2008. “Long-Chain Ceramide Is a Potent Inhibitor of the Mitochondrial Permeability Transition Pore.” The Journal of Biological Chemistry 283 (36): 24707–17. doi:10.1074/jbc.M801810200.
118
Ntambi, J. 2004. “Regulation of Stearoyl-CoA Desaturases and Role in Metabolism.” Progress in Lipid Research 43 (2): 91–104. doi:10.1016/S0163-7827(03)00039-0.
Nuzum, D. S., and T. Merz. 2009. “Macrovascular Complications of Diabetes Mellitus.” Journal of Pharmacy Practice 22 (2): 135–48. doi:10.1177/0897190008326444.
O’Rourke, Eyleen J, Alexander A Soukas, Christopher E Carr, and Gary Ruvkun. 2009. “C. Elegans Major Fats Are Stored in Vesicles Distinct from Lysosome-Related Organelles.” Cell Metabolism 10 (5): 430–35. doi:10.1016/j.cmet.2009.10.002.
Ogden, C L, M D Carroll, B K Kit, and K M Flegal. 2014. “Prevalence of Childhood and Adult Obesity in the United States, 2011-2012.” Jama 311 (8): 806–14. doi:10.1001/jama.2014.732.
Ogg, S, and G Ruvkun. 1998. “The C. Elegans PTEN Homolog, DAF-18, Acts in the Insulin Receptor-like Metabolic Signaling Pathway.” Molecular Cell 2 (6): 887–93. http://www.ncbi.nlm.nih.gov/pubmed/9885576.
Oliveira, Riva P., Jess Porter Abate, Kieran Dilks, Jessica Landis, Jasmine Ashraf, Coleen T. Murphy, and T. Keith Blackwell. 2009. “Condition-Adapted Stress and Longevity Gene Regulation by Caenorhabditis Elegans SKN-1/Nrf.” Aging Cell 8 (5): 524–41. doi:10.1111/j.1474-9726.2009.00501.x.
Ozsolak, Fatih, and Patrice M Milos. 2011. “RNA Sequencing: Advances, Challenges and Opportunities.” Nature Reviews. Genetics 12 (2): 87–98. doi:10.1038/nrg2934.
Padilla, Pamela A, Todd G Nystul, Richard A Zager, Ali C M Johnson, and Mark B Roth. 2002. “Dephosphorylation of Cell Cycle – Regulated Proteins Correlates with Anoxia-Induced Suspended Animation in Caenorhabditis Elegans.” Molecular Biology of the Cell 13 (May): 1473–83. doi:10.1091/mbc.01.
Padilla, Pamela, Todd G Nystul, Richard A Zager, Ali C M Johnson, and Mark B Roth. 2002. “Dephosphorylation of Cell Cycle – Regulated Proteins Correlates with Anoxia-Induced Suspended Animation in Caenorhabditis Elegans.” Molecular Biology of the Cell 13 (May): 1473–83. doi:10.1091/mbc.01.
Paneni, Francesco, Joshua A Beckman, Mark A Creager, and Francesco Cosentino. 2013. “Diabetes and Vascular Disease: Pathophysiology, Clinical Consequences, and Medical Therapy: Part I.” European Heart Journal 34 (31): 2436–43. doi:10.1093/eurheartj/eht149.
Paul, Rüdiger J, Jan Gohla, Roman Föll, and H Schneckenburger. 2000. “Metabolic Adaptations to Environmental Changes in Caenorhabditis Elegans.” Comparative Biochemistry and Physiology Part B: Biochemistry and Molecular Biology 127 (4): 469–79. doi:10.1016/S0305-0491(00)00284-4.
119

Peter W. Hochachka, George N. Somero. 2001. Biochemical Adaptation : Mechanism and Process in Physiological Evolution: Mechanism and Process in Physiological Evolution. Oxford University Press, USA. https://books.google.com/books/about/Biochemical_Adaptation_Mechanism_and_Pro.html?id=gNkL_un9644C&pgis=1.
Pierce, S B, M Costa, R Wisotzkey, S Devadhar, S a Homburger, a R Buchman, K C Ferguson, et al. 2001. “Regulation of DAF-2 Receptor Signaling by Human Insulin and Ins-1, a Member of the Unusually Large and Diverse C. Elegans Insulin Gene Family.” Genes & Development 15 (6): 672–86. doi:10.1101/gad.867301.
Platt, Alexander, Bjarni J Vilhjálmsson, and Magnus Nordborg. 2010. “Conditions under Which Genome-Wide Association Studies Will Be Positively Misleading.” Genetics 186 (3): 1045–52. doi:10.1534/genetics.110.121665.
Podrabsky, Jason E, James P Lopez, Teresa W M Fan, Richard Higashi, and George N Somero. 2007. “Extreme Anoxia Tolerance in Embryos of the Annual Killifish Austrofundulus Limnaeus: Insights from a Metabolomics Analysis.” The Journal of Experimental Biology 210 (Pt 13): 2253–66. doi:10.1242/jeb.005116.
Portal-Celhay, Cynthia, and Martin J Blaser. 2012. “Competition and Resilience between Founder and Introduced Bacteria in the Caenorhabditis Elegans Gut.” Infection and Immunity 80 (3): 1288–99. doi:10.1128/IAI.05522-11.
Powell-Coffman, Jo Anne. 2010. “Hypoxia Signaling and Resistance in C. Elegans.” Trends in Endocrinology and Metabolism 21 (7). Elsevier Ltd: 435–40. doi:10.1016/j.tem.2010.02.006.
Puri, Sapna, Haruhiko Akiyama, and Matthias Hebrok. 2013. “VHL-Mediated Disruption of Sox9 Activity Compromises Β-Cell Identity and Results in Diabetes Mellitus.” Genes & Development 27 (23): 2563–75. doi:10.1101/gad.227785.113.
Rader, Daniel J. 2007. “Effect of Insulin Resistance, Dyslipidemia, and Intra-Abdominal Adiposity on the Development of Cardiovascular Disease and Diabetes Mellitus.” The American Journal of Medicine 120 (3 Suppl 1): S12–18. doi:10.1016/j.amjmed.2007.01.003.
Rahib, Lola, Nicole K MacLennan, Steve Horvath, James C Liao, and Katrina M Dipple. 2007. “Glycerol Kinase Deficiency Alters Expression of Genes Involved in Lipid Metabolism, Carbohydrate Metabolism, and Insulin Signaling.” European Journal of Human Genetics : EJHG 15 (6): 646–57. doi:10.1038/sj.ejhg.5201801.
Reinke, S. N., X. Hu, B. D. Sykes, and B. D. Lemire. 2010. “Caenorhabditis Elegans Diet Significantly Affects Metabolic Profile, Mitochondrial DNA Levels, Lifespan and Brood Size.” Molecular Genetics and Metabolism 100 (3). Elsevier Inc.: 274–82. doi:10.1016/j.ymgme.2010.03.013.
120

Riedel, Christian G, Robert H Dowen, Guinevere F Lourenco, Natalia V Kirienko, Thomas Heimbucher, Jason A West, Sarah K Bowman, et al. 2013. “DAF-16 Employs the Chromatin Remodeller SWI/SNF to Promote Stress Resistance and Longevity.” Nature Cell Biology 15 (5): 491–501. doi:10.1038/ncb2720.
Ritter, Ashlyn D, Yuan Shen, Juan Fuxman Bass, Sankarganesh Jeyaraj, Bart Deplancke, Arnab Mukhopadhyay, Jian Xu, Monica Driscoll, Heidi A Tissenbaum, and Albertha J M Walhout. 2013. “Complex Expression Dynamics and Robustness in C. Elegans Insulin Networks.” Genome Research 23 (6): 954–65. doi:10.1101/gr.150466.112.
Roger Gutiérrez-Juárez, Alessandro Pocai, Claudia Mulas, Hiraku Ono, Sanjay Bhanot, Brett P. Monia, and Luciano Rossetti1. 2015. “JCI - Critical Role of Stearoyl-CoA desaturase–1 (SCD1) in the Onset of Diet-Induced Hepatic Insulin Resistance.” Accessed May 20. http://www.jci.org/articles/view/26991.
Romero-Garcia, Susana, Jose Sullivan Lopez-Gonzalez, José Luis B´ez-Viveros, Dolores Aguilar-Cazares, and Heriberto Prado-Garcia. 2014. “Tumor Cell Metabolism.” Cancer Biology & Therapy 12 (11). Taylor & Francis: 939–48. doi:10.4161/cbt.12.11.18140.
Savory, Fiona R., Steven M. Sait, and Ian a. Hope. 2011. “DAF-16 and ?? 9 Desaturase Genes Promote Cold Tolerance in Long-Lived Caenorhabditis Elegans Age-1 Mutants.” PLoS ONE 6 (9). doi:10.1371/journal.pone.0024550.
Schlotterer, Andreas, Georgi Kukudov, Farastuk Bozorgmehr, Harald Hutter, Xueliang Du, Dimitrios Oikonomou, Youssef Ibrahim, et al. 2009. “C. Elegans as Model for the Study of High Glucose- Mediated Life Span Reduction.” Diabetes 58 (11): 2450–56. doi:10.2337/db09-0567.
Schuchman, Edward H., Orna Levran, Lygia V. Pereira, and Robert J. Desnick. 1992. “Structural Organization and Complete Nucleotide Sequence of the Gene Encoding Human Acid Sphingomyelinase (SMPD1).” Genomics 12 (2): 197–205. doi:10.1016/0888-7543(92)90366-Z.
Schulz, Tim J, Kim Zarse, Anja Voigt, Nadine Urban, Marc Birringer, and Michael Ristow. 2007. “Glucose Restriction Extends Caenorhabditis Elegans Life Span by Inducing Mitochondrial Respiration and Increasing Oxidative Stress.” Cell Metabolism 6 (4): 280–93. doi:10.1016/j.cmet.2007.08.011.
Shao, Zhiyong, Yi Zhang, and Jo Anne Powell-Coffman. 2009. “Two Distinct Roles for EGL-9 in the Regulation of HIF-1-Mediated Gene Expression in Caenorhabditis Elegans.” Genetics 183 (3): 821–29. doi:10.1534/genetics.109.107284.
Shen, Chuan, Daniel Nettleton, Min Jiang, Stuart K. Kim, and Jo Anne Powell-Coffman. 2005. “Roles of the HIF-1 Hypoxia-Inducible Factor during Hypoxia Response in
121
Caenorhabditis Elegans.” Journal of Biological Chemistry 280 (21): 20580–88. doi:10.1074/jbc.M501894200.
Shen, Chuan, and Jo Anne Powell-Coffman. 2003. “Genetic Analysis of Hypoxia Signaling and Response in C Elegans.” Annals of the New York Academy of Sciences 995: 191–99.
Shi, Xun, Juan Li, Xiaoju Zou, Joel Greggain, Steven V Rødkær, Nils J Færgeman, Bin Liang, and Jennifer L Watts. 2013. “Regulation of Lipid Droplet Size and Phospholipid Composition by Stearoyl-CoA Desaturase.” Journal of Lipid Research 54 (9): 2504–14. doi:10.1194/jlr.M039669.
Shmookler Reis, Robert J, Lulu Xu, Hoonyong Lee, Minho Chae, John J Thaden, Puneet Bharill, Cagdas Tazearslan, et al. 2011. “Modulation of Lipid Biosynthesis Contributes to Stress Resistance and Longevity of C. Elegans Mutants.” Aging 3 (2): 125–47. http://www.pubmedcentral.nih.gov/articlerender.fcgi?artid=3082008&tool=pmcentrez&rendertype=abstract.
Sonestedt, Emily, Nina Cecilie Overby, David E Laaksonen, and Bryndis Eva Birgisdottir. 2012. “Does High Sugar Consumption Exacerbate Cardiometabolic Risk Factors and Increase the Risk of Type 2 Diabetes and Cardiovascular Disease?” Food & Nutrition Research 56. doi:10.3402/fnr.v56i0.19104.
Stitt, Alan W, Alicia J Jenkins, and Mark E Cooper. 2002. “Advanced Glycation End Products and Diabetic Complications.” Expert Opinion on Investigational Drugs 11 (9): 1205–23. doi:10.1517/13543784.11.9.1205.
Stratton, I M, a I Adler, H a Neil, D R Matthews, S E Manley, C a Cull, D Hadden, R C Turner, and R R Holman. 2000. “Association of Glycaemia with Macrovascular and Microvascular Complications of Type 2 Diabetes (UKPDS 35): Prospective Observational Study.” BMJ (Clinical Research Ed.) 321 (7258): 405–12. doi:10.1136/bmj.321.7258.405.
Suzuki, N, K Inokuma, K Yasuda, and N Ishii. 1996. “Cloning, Sequencing and Mapping of a Manganese Superoxide Dismutase Gene of the Nematode Caenorhabditis Elegans.” DNA Research : An International Journal for Rapid Publication of Reports on Genes and Genomes 3 (3): 171–74. http://www.ncbi.nlm.nih.gov/pubmed/8905235.
Szablewski, Leszek. 2011. Glucose Homeostasis and Insulin Resistance. Bentham Science Publishers. http://books.google.com/books/about/Glucose_Homeostasis_and_Insulin_Resistan.html?id=Dw3vfMM3wiIC.
122

Taghibiglou, Changiz, Henry G S Martin, Jacqueline K. Rose, Nadia Ivanova, Conny H C Lin, H. Lee Lau, Susan Rai, Yu Tian Wang, and Catharine H. Rankin. 2009. “Essential Role of SBP-1 Activation in Oxygen Deprivation Induced Lipid Accumulation and Increase in Body Width/length Ratio in Caenorhabditis Elegans.” FEBS Letters 583 (4). Federation of European Biochemical Societies: 831–34. doi:10.1016/j.febslet.2009.01.045.
Tedesco, Patricia, James Jiang, Jinqing Wang, S Michal Jazwinski, and Thomas E Johnson. 2008a. “Genetic Analysis of Hyl-1, the C. Elegans Homolog of LAG1/LASS1.” Age (Dordrecht, Netherlands) 30 (1): 43–52. doi:10.1007/s11357-008-9046-3.
Tedesco, Patricia, James Jiang, Jinqing Wang, S. Michal Jazwinski, and Thomas E. Johnson. 2008b. “Genetic Analysis of Hyl-1, the C. Elegans Homolog of LAG1/LASS1.” Age 30 (1): 1–10. doi:10.1007/s11357-007-9042-z.
Teperino, Raffaele, Fritz Aberger, Harald Esterbauer, Natalia Riobo, and John Andrew Pospisilik. 2014. “Canonical and Non-Canonical Hedgehog Signalling and the Control of Metabolism.” Seminars in Cell & Developmental Biology 33 (September): 81–92. doi:10.1016/j.semcdb.2014.05.007.
Timmons, L, and a Fire. 1998. “Specific Interference by Ingested dsRNA.” Nature 395 (6705): 854. doi:10.1038/27579.
Tissenbaum, H a, and G Ruvkun. 1998. “An Insulin-like Signaling Pathway Affects Both Longevity and Reproduction in Caenorhabditis Elegans.” Genetics 148 (2): 703–17. http://www.pubmedcentral.nih.gov/articlerender.fcgi?artid=1459840&tool=pmcentrez&rendertype=abstract.
Trapnell, Cole, Lior Pachter, and Steven L Salzberg. 2009. “TopHat: Discovering Splice Junctions with RNA-Seq.” Bioinformatics (Oxford, England) 25 (9): 1105–11. doi:10.1093/bioinformatics/btp120.
Trapnell, Cole, Brian A Williams, Geo Pertea, Ali Mortazavi, Gordon Kwan, Marijke J van Baren, Steven L Salzberg, Barbara J Wold, and Lior Pachter. 2010. “Transcript Assembly and Quantification by RNA-Seq Reveals Unannotated Transcripts and Isoform Switching during Cell Differentiation.” Nature Biotechnology 28 (5): 511–15. doi:10.1038/nbt.1621.
Trayhurn, Paul. 2013. “Hypoxia and Adipose Tissue Function and Dysfunction in Obesity.” Physiological Reviews 93 (1): 1–21. doi:10.1152/physrev.00017.2012.
Van Olden, Casper, Albert K Groen, and Max Nieuwdorp. 2015. “Role of Intestinal Microbiome in Lipid and Glucose Metabolism in Diabetes Mellitus.” Clinical Therapeutics, April. doi:10.1016/j.clinthera.2015.03.008.
123
Van Voorhies, W a, and S Ward. 2000. “Broad Oxygen Tolerance in the Nematode Caenorhabditis Elegans.” The Journal of Experimental Biology 203 (Pt 16): 2467–78. http://www.ncbi.nlm.nih.gov/pubmed/10903161.
Vinik, Aaron, and Mark Flemmer. 2002. “Diabetes and Macrovascular Disease.” Journal of Diabetes and Its Complications 16 (3): 235–45. doi:10.1016/S1056-8727(01)00212-4.
Warensjö, Eva, Erik Ingelsson, Per Lundmark, Lars Lannfelt, Ann-Christine Syvänen, Bengt Vessby, and Ulf Risérus. 2007. “Polymorphisms in the SCD1 Gene: Associations with Body Fat Distribution and Insulin Sensitivity.” Obesity (Silver Spring, Md.) 15 (7): 1732–40. doi:10.1038/oby.2007.206.
Watson, Emma, Lesley T MacNeil, H Efsun Arda, Lihua Julie Zhu, and Albertha J M Walhout. 2013. “Integration of Metabolic and Gene Regulatory Networks Modulates the C. Elegans Dietary Response.” Cell 153 (1): 253–66. doi:10.1016/j.cell.2013.02.050.
Watts, J L, and J Browse. 2000. “A Palmitoyl-CoA-Specific delta9 Fatty Acid Desaturase from Caenorhabditis Elegans.” Biochemical and Biophysical Research Communications 272 (1): 263–69. doi:10.1006/bbrc.2000.2772.
Watts, Jennifer L. 2009. “Fat Synthesis and Adiposity Regulation in Caenorhabditis Elegans.” Trends in Endocrinology and Metabolism: TEM 20 (2): 58–65. doi:10.1016/j.tem.2008.11.002.
Wu, Lindsay E, Dorit Samocha-Bonet, P Tess Whitworth, Daniel J Fazakerley, Nigel Turner, Trevor J Biden, David E James, and James Cantley. 2014. “Identification of Fatty Acid Binding Protein 4 as an Adipokine That Regulates Insulin Secretion during Obesity.” Molecular Metabolism 3 (4): 465–73. doi:10.1016/j.molmet.2014.02.005.
Xia, Jonathan Y., Thomas S. Morley, and Philipp E. Scherer. 2014. “The Adipokine/ceramide Axis: Key Aspects of Insulin Sensitization.” Biochimie 96 (1). Elsevier Masson SAS: 130–39. doi:10.1016/j.biochi.2013.08.013.
Yamagishi, Sho-ichi, and Tsutomu Imaizumi. 2005. “Diabetic Vascular Complications: Pathophysiology, Biochemical Basis and Potential Therapeutic Strategy.” Current Pharmaceutical Design 11 (18): 2279–99. http://www.ncbi.nlm.nih.gov/pubmed/16022668.
Yang, Bingmei, Andrea Hodgkinson, Beverley A Millward, and Andrew G Demaine. 2010. “Polymorphisms of Myo-Inositol Oxygenase Gene Are Associated with Type 1 Diabetes Mellitus.” Journal of Diabetes and Its Complications 24 (6). Elsevier: 404–8. doi:10.1016/j.jdiacomp.2009.09.005.
124

Zhang, Yuru, Xiaoju Zou, Yihong Ding, Haizhen Wang, Xiaoyun Wu, and Bin Liang. 2013. “Comparative Genomics and Functional Study of Lipid Metabolic Genes in Caenorhabditis Elegans.” BMC Genomics 14 (1). BMC Genomics: 164. doi:10.1186/1471-2164-14-164.
Zheng, Jolene, Frank L Greenway, Steven B Heymsfield, William D Johnson, Jason F King, Michael J King, Chenfei Gao, Yi-Fang Chu, and John W Finley. 2014. “Effects of Three Intense Sweeteners on Fat Storage in the C. Elegans Model.” Chemico-Biological Interactions 215 (May): 1–6. doi:10.1016/j.cbi.2014.02.016.
Zhu, Shu-Guang, Lei Xi, and Rakesh C Kukreja. 2012. “Type 2 Diabetic Obese Db/db Mice Are Refractory to Myocardial Ischaemic Post-Conditioning in Vivo: Potential Role for Hsp20, F1-ATPase Δ and Echs1.” Journal of Cellular and Molecular Medicine 16 (4): 950–58. doi:10.1111/j.1582-4934.2011.01376.x.
125
Related Documents