1 Global Mergers and Acquisitions Analysis: Impact of Firm Size on Deal Success By Maryna Nazarian Submitted to Central European University Department of Economics In partial fulfilment of the requirements for the degree of Master of Arts in Economics Supervisor: Professor Robert Pal Lieli Budapest, Hungary 2017 CEU eTD Collection

Welcome message from author
This document is posted to help you gain knowledge. Please leave a comment to let me know what you think about it! Share it to your friends and learn new things together.
Transcript
1
Global Mergers and Acquisitions Analysis: Impact of Firm Size on Deal Success
By
Maryna Nazarian
Submitted to
Central European University
Department of Economics
In partial fulfilment of the requirements for the degree of Master of Arts in Economics
Supervisor: Professor Robert Pal Lieli
Budapest, Hungary
2017
CE
UeT
DC
olle
ctio
n

2
Contents
Abstract ...................................................................................................................... 3
1. Introduction and Literature Overview ................................................................ 3
2. Data and Method .............................................................................................. 8
3. Empirical Results ............................................................................................ 13
4. Conclusions .................................................................................................... 18
5. References ..................................................................................................... 20
Appendix .................................................................................................................. 22
List of Tables
Table 1. List of Variables .......................................................................................... 10
Table 2. Summary of the Explanatory Variables, EU, Whole Sample ...................... 12
Table 3. Summary of the Explanatory Variables, North America, Whole Sample .... 12
Table 4. Summary of the Explanatory Variables, Asia, Whole Sample .................... 12
Table 5. Summary of Regression Results for the EU region .................................... 14
Table 6. Summary of Regression Results for the NA region .................................... 15
Table 7. Summary of Regression Results for the Asian region ................................ 16
Table 9. Top M&A Industries Asia ............................................................................ 22
Table 10. M&A Summary EU ................................................................................... 23
Table 11. Top M&A Industries EU ............................................................................ 23
Table 12. M&A Summary North America ................................................................. 24
Table 13. Top M&A Industries North America .......................................................... 24
List of Figures
Figure 1. Number of M&A deals in 2012-2016 ........................................................... 6
Figure 2. Aggregate deal sizes per region, 2012-2016, $ mln .................................... 7
Figure 3. Average Acquirer Firm Size, Asia ............................................................. 17
Figure 4. Average Target Firm Size, Asia ................................................................ 18
CE
UeT
DC
olle
ctio
n

3
Abstract
In this thesis I research Mergers and Acquisitions and what makes
them successful. This is a vast topic so I concentrate on the
relationship between the participants’ size and how it influences the
success of the deal. I am defining success as a short-term market
reaction, that is an increase in stock price of the acquirer firm after
the announcement of the deal. The theory I am testing is that bigger
target and acquirer corporations increase the probability of a
successful deal. In order to check this assumption, I am using the
linear probability model on a population split into three geographic
samples. I find mixed support for this theory, depending on the
sample, with stronger evidence in the samples of mergers and
acquisitions of majority assets in Europe and North America, and
acquisitions of assets below 50% in Asia. In contradiction with
findings from two other regions, in Asia bigger target company size
has negative impact on the probability of success.
1. Introduction and Literature Overview
Mergers and Acquisitions (M&A) represent significant impact on the overall social
welfare and major fields of economics: financial markets, labor, antitrust policy, trade
etc. The detailed analysis of M&As holds high relevance, particularly in present time,
when all the major investment banks report considerable changes and shifts in the
business of M&As.
Mergers and Acquisitions is a significant topic that I chose to research because of
its crucial impact on social and economic welfare of the global world. Studies show
that M&As have considerable effect on market efficiency and productivity; on the social
CE
UeT
DC
olle
ctio
n
4
level, they boost labor force professionalism (Blonigen & Pierce, August 2015). M&As
contribute to the economic growth, particularly in the services sector (Doytch & Cakan,
2011).
The fact that business of mergers and acquisitions has such a big impact on global
economics and finance derives a natural necessity to research and study this field.
Thus, a question arises: what comprises a good M&A? The modern research supports
the idea that there is a relationship between various size measures and the success
of a deal. A large number of studies view how size of the deal, size of the merging
firms influence the success of an M&A transaction. The debate in literature does not
have a consensus: research by Fuller et al. in 2002 showed that the business success
of the company after the takeover is better if the target company is smaller than
acquirer (Fuller, Netter, & Stegemoller, August 2002). In their study, Moeller et al.
concluded that the size of acquirers and financial returns in the process of mergers
and acquisitions are inversely related and relatively smaller acquirers often generate
higher returns than larger acquirers (Moeller, Schlingemann, & Stulz, January 2004);
while Humphery-Jenner and Powell, on the contrary, find that lager acquirers generate
higher stock returns and increase post-takeover operating performance (Humphrey-
Jenner & Powell, June 2006).
In this thesis I am using the following definitions of the deal types (Machiraju,
2003):
Merger: is a broad term that denotes the combination of two or more companies
in such a way that only one survives while others are dissolved.
Acquisition: a situation where one firm acquires another and the latter ceases to
exist. Basically, one company takes controlling interest in another firm or its legal
CE
UeT
DC
olle
ctio
n
5
subsidiary or its selected assets. Sometimes only the part of the other firm is acquired
in which case the company survives.
Exchange offer: acquirer offers securities to the selling shareholders rather than
cash.
Buy-back: purchase by the company of some fraction of its outstanding shares.
Buy-backs are normally used to protect the management against takeovers.
In the text of the thesis, I will be using the terms “merger”, “deal”, “transaction”,
“M&A” interchangeably.
Before starting to analyze how counterparties’ size influences the success of an
M&A deal I will review the approaches to defining what success is in this context. A
merger may have multiple purposes: creating synergies, expanding presence in new
markets, strengthen operations, restructuring, debt repayment, getting rid of
unprofitable branches of business etc. (Eikon). Thus, each purpose has its own
corresponding measure of success. In my analysis I need a measure that is more
general and the most commonly used such indicator is shareholder value.
Shareholder value maximization is proved to be the measure of M&A success by
many empirical studies (Cybo-Ottone & Murgia, 2000). To measure the shareholder
value researchers use capital market approach that consists in relying on stock market
data for estimating success of an M&A (Cummis, Weiss, & Klumpes, April 2008).
Lubatkin and Shrieves (Lubatkin & Shrieves, 1983) say that “Share price movements
represent the only direct measure of shareholder value”. Jensen claims: “Financial
markets are telling companies when they are wrong…the stock prices will be low”[
(Jensen, 1998). Finally, short-term market reactions, like share price movements of
the bidder firm after the announcement of the deal, historically, have been a good
indicator of long-term value creation through M&A (Rehm & Buch-Sivertsen, 2010).
CE
UeT
DC
olle
ctio
n
6
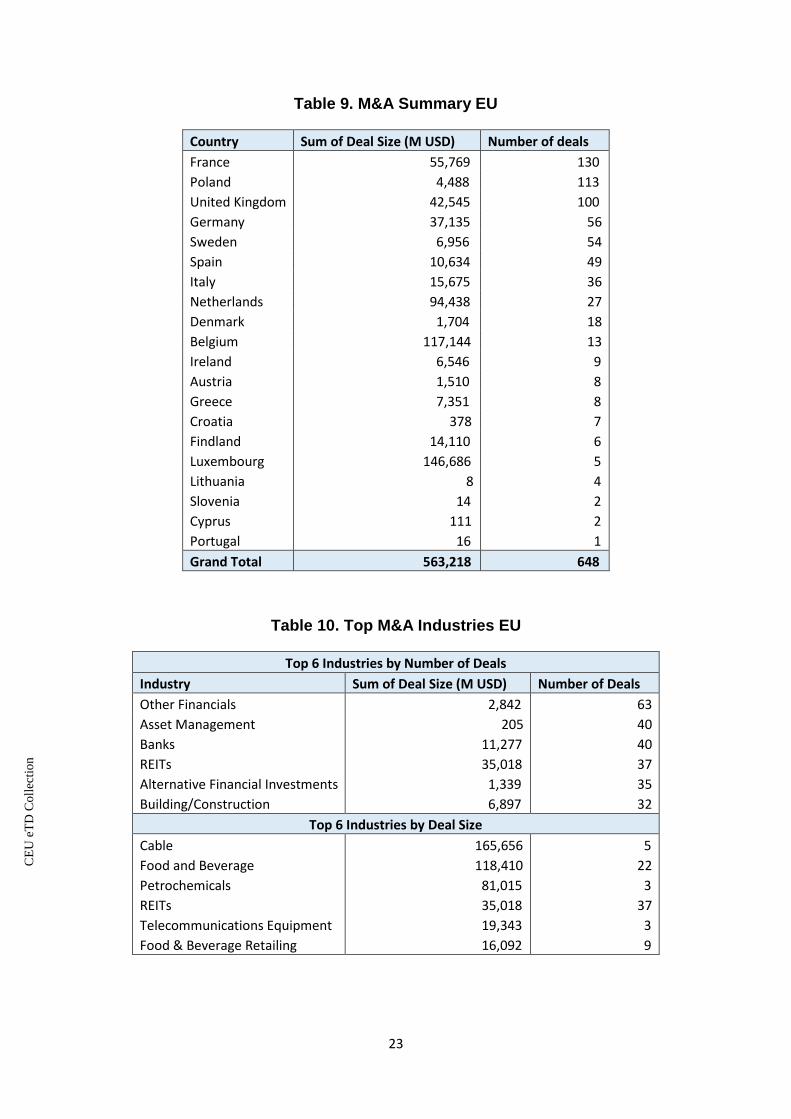
To further illustrate the importance of the topic, I highlight the global nature and
significant scale of the M&A business in Tables 7-12 of the Appendix, that illustrate
trends in mergers and acquisitions in 3 regions: Asia, North America and the EU in
2012-2016. The main industries are finance, banking, asset management and
food&beverages in Europe; banking, oil&gas and pharmaceuticals in North America;
semi-conductors, electronics and real estate in Asia. The biggest amount of deals
occurred in North America.
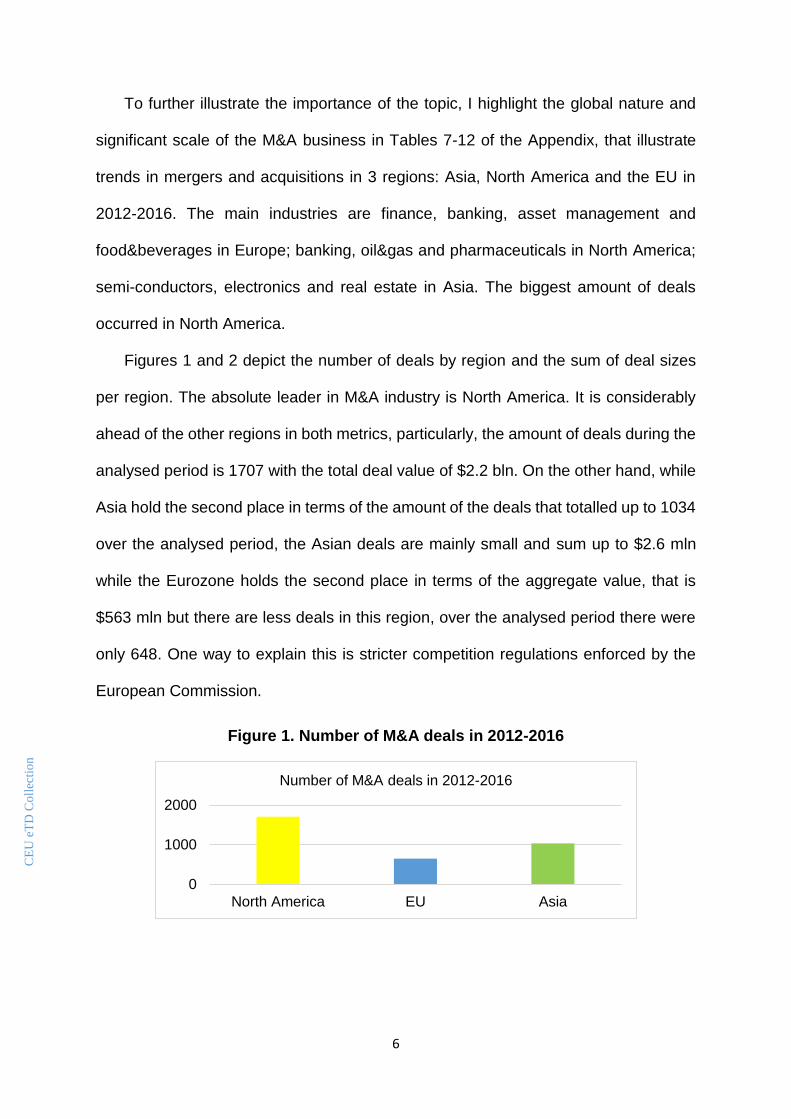
Figures 1 and 2 depict the number of deals by region and the sum of deal sizes
per region. The absolute leader in M&A industry is North America. It is considerably
ahead of the other regions in both metrics, particularly, the amount of deals during the
analysed period is 1707 with the total deal value of $2.2 bln. On the other hand, while
Asia hold the second place in terms of the amount of the deals that totalled up to 1034
over the analysed period, the Asian deals are mainly small and sum up to $2.6 mln
while the Eurozone holds the second place in terms of the aggregate value, that is
$563 mln but there are less deals in this region, over the analysed period there were
only 648. One way to explain this is stricter competition regulations enforced by the
European Commission.
Figure 1. Number of M&A deals in 2012-2016
0
1000
2000
North America EU Asia
Number of M&A deals in 2012-2016
CE
UeT
DC
olle
ctio
n

7
Figure 2. Aggregate deal sizes per region, 2012-2016, $ mln
After analyzing existing research and statistical data, I have decided to set the
following tasks of this thesis:
- use 3 samples of public firms that have exercised a merger or an acquisition
of majority assets/partial interest/remaining interest between 2012-2016
broken down by geographic regions Asia, North America and the European
Union (both the target and the acquirer belong to the same region);
- consider a successful deal the one in which the share price of the acquirer
went up after the announcement of the deal and find out how success is
influenced by the size of the target and the size of the acquirer.
- Divide the samples into subsamples above and below 50% of assets
acquired to see if the relationship between size and success is different in
different samples.
As I have mentioned above, so far, the literature had no consensus on what the
relationship between the company size and success is. In my thesis, I test the theory
that the bigger is the size of both the acquirer and the target, the higher the probability
of success is. In addition, I compare the data in 3 different geographic regions claiming
that the particularities of doing business in North America, Asia and EU influence the
size-success relationship in the M&A deals. My finding is that there is a positive
relationship between the size of the participating firms and the success of the deal,
0
2000000
4000000
North America EU Asia
Aggregate deal sizes per region, 2012-2016, $ mln
CE
UeT
DC
olle
ctio
n

8
particularly in the European region. In the North America and Asia, the significance of
impact of the company size on the probability of M&A success depends on the type of
the deal, namely whether it is an acquisition of majority assets, an acquisition of assets
below 50% or a merger.
2. Data and Method
The data set I am using has been manually created by using the Thomson Reuters
Eikon database, particularly, the Investment Banking application. This database
provides access to data from more than 400 exchanges and OTC-traded markets and
over 70 direct exchange feeds, delivered via Thomson Reuters Elektron low latency
data feeds, and covering 22,000+ companies (Eikon). I have manually customized the
variables of interest, downloaded them from Eikon separately for different years and
countries and compiled the data files using Microsoft Excel. All the companies under
review are privately held and all the deals are completed.
To be able to make comparison of results based on the geographical region, I
have 3 data samples that would allow me to account for the specifics of doing business
in different parts of the world potentially influencing the results:
1. North America. 1707 observations of mergers and acquisitions in the USA and
Canada completed between 2012 and 2016.
2. European union. 648 observations of M&A deals in 19 Eurozone countries and
the United Kingdom.
3. Asia with 1434 observations in 10 Asian countries the most involved in the
M&A business: Japan, South Korea, Taiwan, Mainland China, Malaysia,
Singapore, Hong Kong, Thailand, Philippines, Indonesia.
CE
UeT
DC
olle
ctio
n
9
I additionally break each geographic sample into sub-samples based on whether
the percent of the target acquired is more or less than 50% to see how results differ
when it comes to the transaction size.
It is important to choose the appropriate approximation for the size of the target
and acquirer companies. Studies traditionally use total sales revenue, total assets,
book value equity or market value equity as proxy for the size of the firm. [Atiase, R.
Predisclosure Information, Firm Capitalization, and Security Price Reaction around
Earnings Announcement, Journal of Accounting Research, Vol. 23, No. 1, pp. 21-36].
Due to the accessibility of the data, I am using the total assets of the firm as a proxy
for the firm size in this thesis.
The variables used are described in the table below. Total assets of the firm are
calculated as the balance sheet total assets, including current assets and long term
investments and funds, net fixed assets, intangible assets, deferred charges taken at
the date of the most recent financial statements before the announcement of the deal.
Both stock prices of the acquirer before and after the transaction are taken as a closing
stock price on a primary stock exchange on the original announcement date of the
deal/1 day after the announcement of the deal. Like this, the short-term market
reaction is accurately captured. The value of the deal is often included as an
explanatory variable along with the size of the company in the studies that analyze
mergers and market reactions (Boubakri, Dionne, & Triki, May 2006).
CE
UeT
DC
olle
ctio
n

10
Table 1. List of Variables
Variable Description
Stock Price Closing stock price of acquirer/target common stock on primary stock exchange on original
announcement day/1day after the announcement of the deal
Total
Assets
Acquirers/Targets total balance sheet assets including, current assets and long term investments
and funds, net fixed assets, intangible assets, deferred charges as of the date of most current
financial information prior to the announcement of the deal.
Deal Size Total value of consideration paid by the acquirer, excluding fees and expenses, includes the amount
paid for all common stock, common stock equivalents, preferred stock debt, options, assets,
warrants and stake purchases made within 6 months of the announcement date of the transaction.
Liabilities assumed are included if they are publicly disclosed. Preferred stock is only included if it is
being acquired as part of a 100% transaction, the number of shares at date of announcement is
used.
Industry The industry of acquirer/target
I have already mentioned that Mergers and Acquisitions can vary in the purpose
the participants pursue. They may enter into a deal to create synergies, expand
presence in new markets, strengthen operations, perform a restructuring, repay debt
etc. The majority of the deals in my sample pursue a goal of value creation because
they are all mergers and acquisitions. It should be noted that the initial sample
contained as well the buy-backs and exchange offers but these deals were deleted
from the sample because I test the theory that concerns exclusively mergers and
acquisitions as more straightforward deals in terms of ownership.
My expectation is that larger acquirers and larger targets increase the probability
of a deal success. The explanatory variable is binary so the appropriate model to use
here is a linear probability model (LPM). In LPM, beta represents the change in
probability associated with a one unit change in explanatory variable. The problem
with LPM is that it contains heteroscedastic error term that appears due to the different
possible values of the explanatory variable. For example, given the linear regression:
𝑦 = 𝛽0 + 𝛽𝑖𝑥𝑖 + 𝜀𝑖
Then,
CE
UeT
DC
olle
ctio
n
11
𝜀𝑖 = −𝛽𝑖𝑥𝑖, 𝑦 = 0
and
𝜀𝑖 = 1 − 𝛽𝑖𝑥𝑖, 𝑦 = 1
Thus, 𝜀𝑖is not a constant but a function of 𝑥𝑖. I address this issue by using the log
of the explanatory variable, this transformation removes systemic change in the
spread of residuals. Secondly, I use the robust standard errors and as a result, LPM
will give an efficient estimator (White & Lu, June 2010).
The benefit of the chosen model is that it gives accurate errors and is
straightforward to interpret: 1% increase in the explanatory variable will increase the
probability of Y by beta/100 (Benoit, 2011).
I capture the above expectation that larger acquirers and larger targets increase
the probability of a deal success in the following model specification:
Success = α + β1ln(TAA) + β2ln(TAT) + ε
In some cases, I additionally run the following additional specifications as a
robustness check of my “core” coefficients, i.e. to check if the main variables of interest
are still significant when I add additional variables:
Success = α + β1ln(TAA) + β2ln(TAT) + β3DealSize + ε
And
Success = α + β1ln(TAA) + β2ln(TAT) + β3𝑆𝑎𝑚𝑒 𝐼𝑛𝑑𝑢𝑠𝑡𝑟𝑦 + ε
Where:
Success = 1 if the share price of the acquirer went up after the announcement
and 0 otherwise. The variable obtained by setting the expression (Stock Price
of Acquirer 1 Day after the Announcement - Stock Price of Acquirer on the Day
of Announcement) > 0 to 1.
TAA = Total Assets of Acquirer
CE
UeT
DC
olle
ctio
n

12
TAT = Total Assets of the Target
DealSize = Size of the Deal in millions USD
SameIndustry = 1 if the target and acquirer companies belong to the same
industry and 0 otherwise.
Below in Tables 2-4 are the summary statistics of the explanatory variables:
Table 2. Summary of the Explanatory Variables, EU, Whole Sample
Table 3. Summary of the Explanatory Variables, North America, Whole Sample
Table 4. Summary of the Explanatory Variables, Asia, Whole Sample
CE
UeT
DC
olle
ctio
n

13
3. Empirical Results
As mentioned in the previous section, to check the theory that the firm size of
both the target and the acquirer matter for the success of an M&A deal I use the
following main specification:
Success = α + β1ln(TAA) + β2ln(TAT) + ε
First, I will run the regressions and analyse the results for each of the three
regions separately and then I will provide the comparative analysis.
First region is the European Union, it is divided into four subsamples, namely
Whole Population, Acquisitions below 50%, Acquisitions above 50% and Mergers. The
table below summarizes the main and the additional specifications. In total, there are
seven variations on the main model, cells colored in orange indicate the highly
significant models where P > F = 0.000, gray cells are for P > F = 0.005 and green
cells are for P > F = 0.01. The results are mixed depending on the specification. As for
the main specification, the theory is confirmed at the sample of acquisitions above
50%, the size of the acquirer is significant and positive, which means that the bigger
the acquiring company, the bigger is the probability of the deal success. The sign of
the variable for the size of the target firm is also positive but the variable itself is not
significant in the main specification, nevertheless, in the additional specifications in
models 6 and 7, this variable is significant and positive. In the sample of acquisitions
below 50%, there is no significance found which means that in the European region
the theory only holds true for the acquisitions of majority assets (over 50%). The
additional observation that is not related to the main tested theory is that in some
specifications the deal size also has a positive significant effect on the probability of a
deal success.
CE
UeT
DC
olle
ctio
n

14
Table 5. Summary of Regression Results for the EU region
EU Whole Population Acquisitions below 50%
Acquisitions above 50%
Mergers
1 success logTAT
logTAA Not significant
Not significant
logTAA significant positive;
Not significant
2 success logTAT
logTAA DealSizeMUSD
Deal Size positive significant
Not significant
Not significant
Deal Size positive
significant, log TAT positive
significant
3 success logTAT
logTAA SameIndustry
coefficients aren't significant but the
positive signs favor my theory
Not significant
Not significant Not significant
4 success logTAA DealSizeMUSD
logTAA significant positive; Deal Size: significant positive
Not significant
logTAA significant positive;
Deal Size positive
significant
5 success logTAA
SameIndustry
logTAA significant positive; Same
Industry: significant positive
Not significant
logTAA significant positive;
Not significant
6 success logTAT DealSizeMUSD
logTAT significant positive; Deal Size: significant positive
Not significant
logTAT significant positive;
Deal Size positive
significant
7 success logTAT SameIndustry
Not significant Not
significant logTAT significant
positive; Not significant
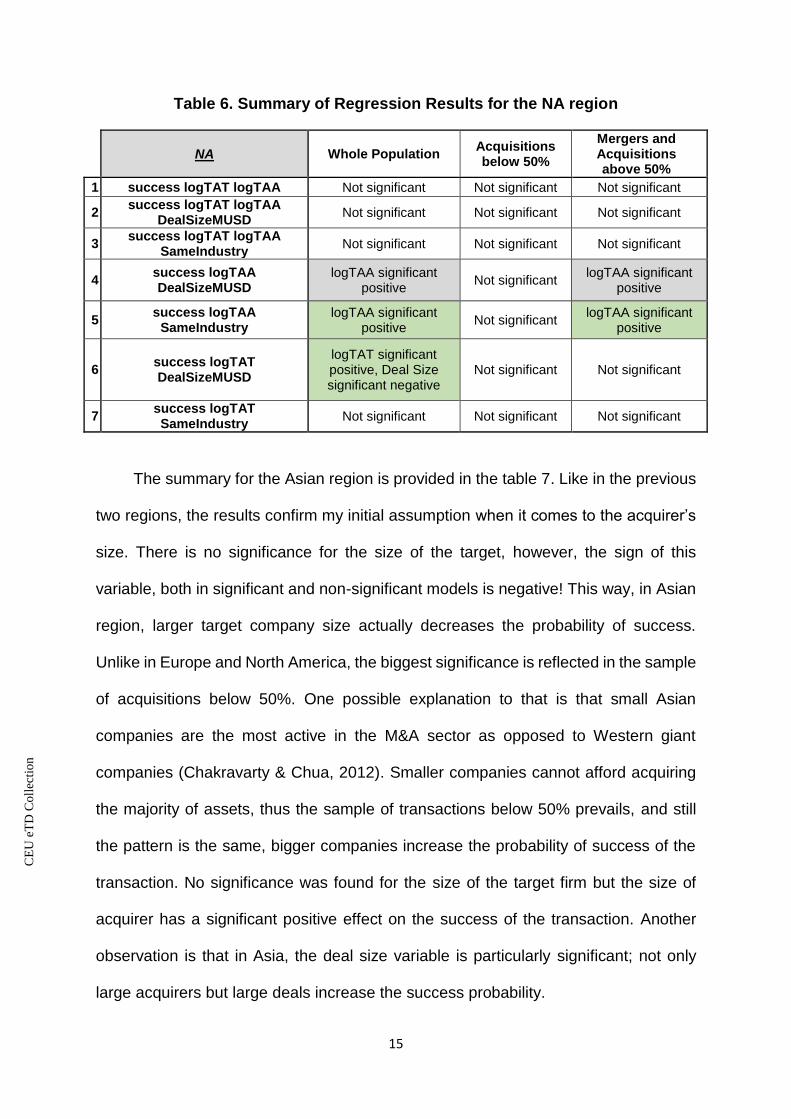
Table 6 summarizes the results for the North American region. The color-coding
described above is the same for the significance levels in all the regions. As compared
to the EU, we see less significance, however, even in the non-significant models, the
signs of coefficients are in line with the assumption that there is a positive relationship
between the firm size and the success of a deal. Models 4, 5 and 6 give significant
results for the positive influence of both the target and the acquirer firms. Similar to the
European region, there is no significance in the sample of acquisitions below 50%
which means that the company size only matters for the success of the acquisition of
a majority interest or a merger. It should be noted that North America, particularly the
United States, is a leading region for the global M&A business, there are many big
multinational corporations and as a consequence there is immense competition
between the acquirers that might have an influence on my results.
CE
UeT
DC
olle
ctio
n
15
Table 6. Summary of Regression Results for the NA region
NA Whole Population Acquisitions below 50%
Mergers and Acquisitions above 50%
1 success logTAT logTAA Not significant Not significant Not significant
2 success logTAT logTAA
DealSizeMUSD Not significant Not significant Not significant
3 success logTAT logTAA
SameIndustry Not significant Not significant Not significant
4 success logTAA DealSizeMUSD
logTAA significant positive
Not significant logTAA significant
positive
5 success logTAA
SameIndustry logTAA significant
positive Not significant
logTAA significant positive
6 success logTAT DealSizeMUSD
logTAT significant positive, Deal Size significant negative
Not significant Not significant
7 success logTAT SameIndustry
Not significant Not significant Not significant
The summary for the Asian region is provided in the table 7. Like in the previous
two regions, the results confirm my initial assumption when it comes to the acquirer’s
size. There is no significance for the size of the target, however, the sign of this
variable, both in significant and non-significant models is negative! This way, in Asian
region, larger target company size actually decreases the probability of success.
Unlike in Europe and North America, the biggest significance is reflected in the sample
of acquisitions below 50%. One possible explanation to that is that small Asian
companies are the most active in the M&A sector as opposed to Western giant
companies (Chakravarty & Chua, 2012). Smaller companies cannot afford acquiring
the majority of assets, thus the sample of transactions below 50% prevails, and still
the pattern is the same, bigger companies increase the probability of success of the
transaction. No significance was found for the size of the target firm but the size of
acquirer has a significant positive effect on the success of the transaction. Another
observation is that in Asia, the deal size variable is particularly significant; not only
large acquirers but large deals increase the success probability.
CE
UeT
DC
olle
ctio
n

16
Table 7. Summary of Regression Results for the Asian region
Asia Whole Population Acquisitions below 50%
Mergers and Acquisitions above
50%
1 success logTAT logTAA Not significant logTAA positive
significant Not significant
2 success logTAT logTAA
DealSizeMUSD logTAA and DealSize are
positive and significant Not significant Not significant
3 success logTAT logTAA
SameIndustry Not significant Not significant
DealSize positive significant
4 success logTAA DealSizeMUSD logTAA and DealSize are
positive and significant logTAA positive
significant Not significant
5 success logTAA SameIndustry logTAA positive and
significant logTAA positive
significant Not significant
6 success logTAT DealSizeMUSD DealSize positive
significant Not significant
DealSize positive significant
7 success logTAT SameIndustry Not significant Not significant Not significant
The above analysis has shown mixed evidence for the theory that the size of the
acquiring firm and the size of the target firm has a positive impact on the merger
success. I found that the European and American patterns are very close, particularly,
the firm size matters the most in the deals that are majority assets acquisitions (above
50%) or mergers. There was no supporting evidence found for the samples that
contain acquisitions below 50%. On the contrary, in Asia, due to the regional specifics
of doing business, there is more evidence supporting my assumption in the sample of
transactions below 50%.
I consider the most interesting the findings for the Asian region. European and
American data shows significance of the acquirer’s size in the sample of acquisitions
above 50% and it makes perfect sense that larger companies can afford to purchase
a stake above 50% of target’s assets. On the other hand, it is not so trivial when it
comes to smaller acquisitions because more companies can afford to acquire minority
interest stakes. To check if there really is a size bias in the large acquisitions I
constructed the charts below that show the average company size in the samples of
CE
UeT
DC
olle
ctio
n
17
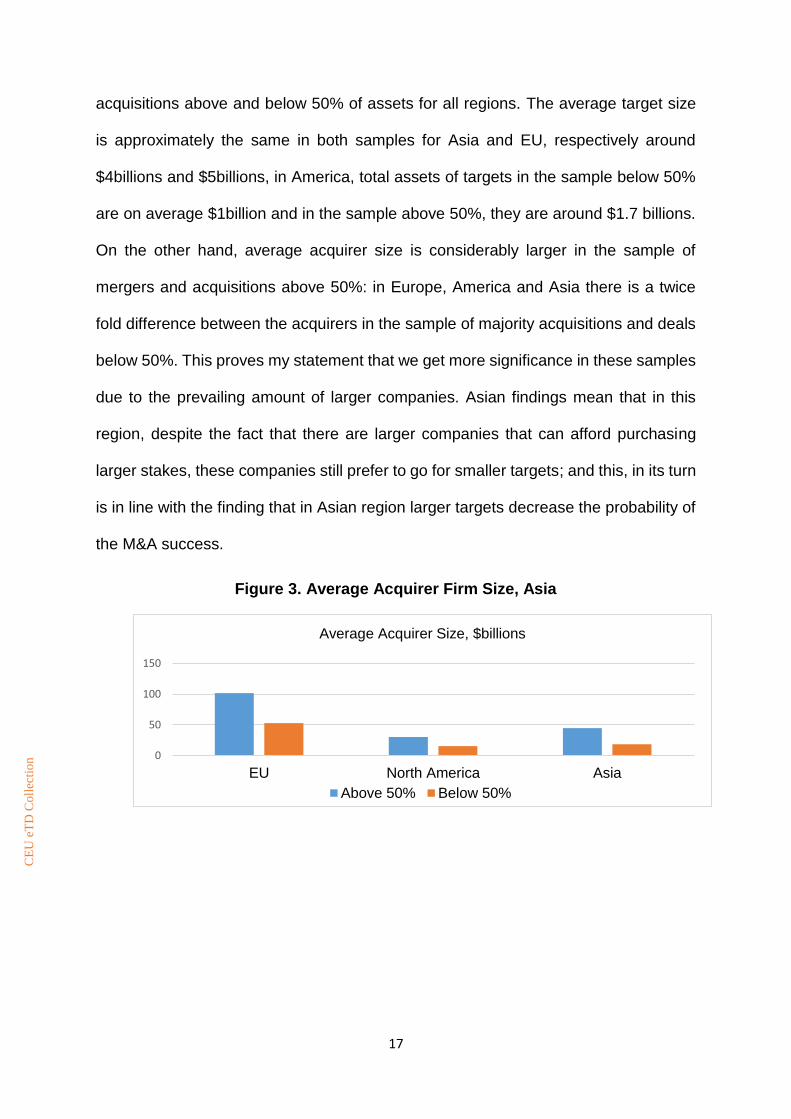
acquisitions above and below 50% of assets for all regions. The average target size
is approximately the same in both samples for Asia and EU, respectively around
$4billions and $5billions, in America, total assets of targets in the sample below 50%
are on average $1billion and in the sample above 50%, they are around $1.7 billions.
On the other hand, average acquirer size is considerably larger in the sample of
mergers and acquisitions above 50%: in Europe, America and Asia there is a twice
fold difference between the acquirers in the sample of majority acquisitions and deals
below 50%. This proves my statement that we get more significance in these samples
due to the prevailing amount of larger companies. Asian findings mean that in this
region, despite the fact that there are larger companies that can afford purchasing
larger stakes, these companies still prefer to go for smaller targets; and this, in its turn
is in line with the finding that in Asian region larger targets decrease the probability of
the M&A success.
Figure 3. Average Acquirer Firm Size, Asia
0
50
100
150
EU North America Asia
Average Acquirer Size, $billions
Above 50% Below 50%
CE
UeT
DC
olle
ctio
n

18
Figure 4. Average Target Firm Size, Asia
4. Conclusions
Mergers and Acquisitions represent one of the leading global business areas and
a popular topic for academic research.
So far, the literature has shown controversial results, researchers have not
reached the consensus in the matter of whether the firm size influences the transaction
success. Some studies say that target firm’s size has positive effect on the M&A
success, some studies say that it is negative, a large variety of papers support the
idea that the size of the acquirer contributes to the deal success, others say that it is
only true for some industries and does not always hold. I have used the total of 10
samples and 7 different specifications to answer a question of whether the size of the
acquiring and target firms increases the probability of the Merger and Acquisition
transaction success.
There are almost no studies that give large geographic comparisons while
examining this issue. I have used the high quality data from the Thomson Reuters
Eikon database in 3 different geographic regions, namely North America, Europe and
Asia, covering 3789 transactions in 31 countries over a 5-year period from 2012 to
2016. The indication of success was a short term market reaction, particularly, the
increase in stock price of the acquirer after the deal announcement. I used the linear
probability model to establish the relationship between the variables of interest.
0
2
4
6
EU North America Asia
Average Target Size, $billions
Above 50% Below 50%
CE
UeT
DC
olle
ctio
n

19
The results of my analysis are somewhat mixed, nevertheless, there is
considerable evidence that the firm size of both target and acquirer increase the
probability of a deal being successful in some specifications. Results vary from sample
to sample as well as from region to region. For instance, in Europe and America the
larger evidence is found for the transactions above 50% of assets acquired. In Asia
the theory that acquirer size increases the probability of success is supported by the
regression analysis using the sample of transactions below 50%. Unlike the two other
regions, here the target company size has a negative impact on the acquisition
success, however, the effect of this variable is not significant.
I have conducted a study that processed latest and most accurate data available
based on good quality academic literature and holding econometric analysis.
However, this research has a potential of further development using the data that
contains long-term M&A success indicators, for example, using the samples where the
stock price is available for weeks and months after the deal announcement, as well as
for various dates after the deal completion. It is definitely worth experimenting using
other indications of success than market reaction, for instance, taking the increase in
firm assets after the deal completion as a success indicator. This would demand a
different analysis approach like breaking samples based on the deal purpose etc. Such
analysis could not be conducted in the framework of my thesis due to the fact that
obtaining firm level data is rather costly and there is much more time required for this
sort of research.
CE
UeT
DC
olle
ctio
n

20
5. References
Benoit, K. (2011). Linear Regression Models with Logarithmic Transformations.
London School of Economics.
Blonigen, B. A., & Pierce, J. R. (August 2015). The effect of mergers and
acquisitions on market power and efficiency. National Beureau of Economic
Research.
Boubakri, N., Dionne, G., & Triki, T. (May 2006). Consolidation and Value Creation in
the Insurance Industry: the Role of Governance. Wharton Business School.
Chakravarty, V., & Chua, S. G. (2012). Asian Mergers and Acquisitions: Riding the
Wave. ISBN: 978-1-118-24709-9.
Cummis, D. J., Weiss, M. A., & Klumpes, P. J. (April 2008). Mergers and
Acquisitions in the European and U.S. Insurance Industries: Information
Assymetry and Valuation Effects. Laboratoire d'Economie des Ressources
Naturelles.
Cybo-Ottone, A., & Murgia, M. (2000). Mergers andShareholder Wealth in the
European Banking. Journal of Banking and Finance, 831-859.
Doytch, N., & Cakan, E. (2011). Growth Effects of Mergers and Acquisitions: A
Sector-level Study of OECD countries. University of New Haven.
Eikon, T. R. (n.d.). Financial Analysis Tool. Retrieved from
http://eikon.thomsonreuters.com
Fuller, K., Netter, J., & Stegemoller, M. (August 2002). What Do Returns to Acquirig
Firms Tell Us? Evidence from Firms that Make Many Acquisitions. The
Journal of Finance, 1763-1793.
Humphrey-Jenner, M., & Powell, R. (June 2006). Firm Siye, Takeover Profitability,
and the Effectiveness of the Market for Corporate Control: Does the Absence
CE
UeT
DC
olle
ctio
n
21
of Anti-Takeover Provisions make a Difference? Journal of Corporate
Finance, 418-437.
Jensen, M. (1998). Takeovers, their Causes and Consequences. Journal of
Economic Perspectives, 21-48.
Lubatkin, M., & Shrieves, R. E. (1983). An Evaluation of Some Biases in Merger
Related Performance Analysis. The Financial Review.
Machiraju, H. R. (2003). Mergers, Acquisitions and Takeovers. New Deli.
Moeller, S. B., Schlingemann, F. P., & Stulz, R. M. (January 2004). Wealth
Destruction on a Massive Scale? A Study of Acuiring Firm Returns in thze
Recent Merger Wave. National Bereau of Economic Research.
Rehm, W., & Buch-Sivertsen, C. (2010, January). A Strong Foundation for M&A in
2010. McKinsey on Finance.
White, H., & Lu, X. (June 2010). Robustness Checks and Robustness Tests.
University of California, San Diego.
CE
UeT
DC
olle
ctio
n

22
Appendix
Table 8. M&A Summary Asia
Country Sum of Deal Size (M USD) Number of Deals
Japan 61,998 468
South Korea 76,941 409
Taiwan 12,894 326
China (Mainland) 33,642 68
Malaysia 3,802 36
Singapore 10,420 35
Hong Kong 48,591 30
Thailand 10,359 27
Philippines 4,267 25
Indonesia 1,703 10
Grand Total 264,617 1,434
Table 8. Top M&A Industries Asia
Top 6 Industries by Number of Deals
Industry Sum of Deal Size (M USD) Number of Deals
Semiconductors 6,659 119
Electronics 1,913 100
Brokerage 7,090 69
Machinery 1,413 61
Other Industrials 5,524 54
Building/Construction 13,093 50
Top 6 Industries by Deal Size
Other Real Estate 50,706 34
IT Consulting & Services 25,608 42
Banks 23,170 43
Metals & Mining 15,214 48
Building/Construction 13,093 50
Telecommunications 11,624 12
CE
UeT
DC
olle
ctio
n
23
Table 9. M&A Summary EU
Country Sum of Deal Size (M USD) Number of deals
France 55,769 130
Poland 4,488 113
United Kingdom 42,545 100
Germany 37,135 56
Sweden 6,956 54
Spain 10,634 49
Italy 15,675 36
Netherlands 94,438 27
Denmark 1,704 18
Belgium 117,144 13
Ireland 6,546 9
Austria 1,510 8
Greece 7,351 8
Croatia 378 7
Findland 14,110 6
Luxembourg 146,686 5
Lithuania 8 4
Slovenia 14 2
Cyprus 111 2
Portugal 16 1
Grand Total 563,218 648
Table 10. Top M&A Industries EU
Top 6 Industries by Number of Deals
Industry Sum of Deal Size (M USD) Number of Deals
Other Financials 2,842 63
Asset Management 205 40
Banks 11,277 40
REITs 35,018 37
Alternative Financial Investments 1,339 35
Building/Construction 6,897 32
Top 6 Industries by Deal Size
Cable 165,656 5
Food and Beverage 118,410 22
Petrochemicals 81,015 3
REITs 35,018 37
Telecommunications Equipment 19,343 3
Food & Beverage Retailing 16,092 9
CE
UeT
DC
olle
ctio
n

24
Table 11. M&A Summary North America
Country Sum of Deal Size (M USD) Number of Deals
United States 2,059,439 1,236
Canada 108,037 471
Grand Total 2,167,476 1,707
Table 12. Top M&A Industries North America
Top 6 Industries by Number of Deals
Industry Sum of Deal Size (M USD) Number of Deals
Banks 60,504 274
Metals & Mining 50,876 271
Oil & Gas 248,140 120
Other Financials 15,720 108
REITs 82,897 52
Professional Services 36,521 48
Top 6 Industries by Deal Size
Pharmaceuticals 256,955 45
Oil & Gas 248,140 120
Cable 115,503 12
Semiconductors 113,520 48
Wireless 93,378 11
REITs 82,897 52
CE
UeT
DC
olle
ctio
n
Related Documents