Macro Strategy | 29 May 2020 Global Market Outlook Valuation conundrum Early indicators after economic re- openings have been positive and policymakers remain very supportive. However, risks of a second pandemic wave and US- China tensions mean an equity and credit market pullback over the summer is probable. Longer term, we remain positive on equities and corporate bonds. Low and capped bond yields are likely to be a key source of support for both. We favour US and Asia ex- Japan equities and EM USD government and Asia USD bonds. Over a three-month horizon, gold is likely to face a period of consolidation while the USD remains supported. Longer term, though, gold remains our favoured diversifier, while the AUD, GBP and EUR remain our preferred routes to express a bearish USD view. Also find out... Should investors chase the equity market rally? Are valuations and market breadth a concern? Are capped bond yields positive for income strategies? This commentary reflects the views of the Wealth Management Group of Standard Chartered Bank

Welcome message from author
This document is posted to help you gain knowledge. Please leave a comment to let me know what you think about it! Share it to your friends and learn new things together.
Transcript

Macro Strategy | 29 May 2020
Global Market Outlook
Valuation conundrum
Early indicators after economic re-
openings have been positive and
policymakers remain very
supportive. However, risks of a
second pandemic wave and US-
China tensions mean an equity and
credit market pullback over the
summer is probable.
Longer term, we remain positive on
equities and corporate bonds. Low
and capped bond yields are likely
to be a key source of support for
both. We favour US and Asia ex-
Japan equities and EM USD
government and Asia USD bonds.
Over a three-month horizon, gold is
likely to face a period of
consolidation while the USD
remains supported. Longer term,
though, gold remains our favoured
diversifier, while the AUD, GBP
and EUR remain our preferred
routes to express a bearish USD
view.
Also find out...
Should investors chase
the equity market rally?
Are valuations and market
breadth a concern?
Are capped bond yields
positive for income
strategies?
This commentary reflects the views of the Wealth Management Group of Standard Chartered Bank
Global Market Outlook 2
01 Highlights
01 Valuation conundrum
02 Strategy
03 Investment strategy
06 Major brokers’ and investors’ views
03 Perspectives
07 Perspectives on key client questions
09 Macro overview
04 Asset Classes
10 Bonds 13 Technicals
11 Equity 14 Tracking market diversity
12 Foreign exchange
05 Asset Allocation
15 Our recommended allocations
16 Asset allocation summary
06 Performance Review
17 Market performance summary
18 Events calendar
19 Wealth management advisory publications
21 Disclosures
2 Contents
Global Market Outlook 3
IMPLICATIONS
FOR INVESTORS
• Global equities, credit and
multi-asset income
strategies likely to
outperform government
bonds and cash over a 12-
month horizon
• Gold remains a preferred
diversifier while the USD is
likely to weaken
• However, a pullback or
consolidation in equity and
credit markets remains
probable over a three-
month horizon
• Within bonds, we believe
Emerging Market (EM)
USD and Asia USD bonds
are most attractive
• Within equities, we have a
preference for Asia ex-
Japan and US equities
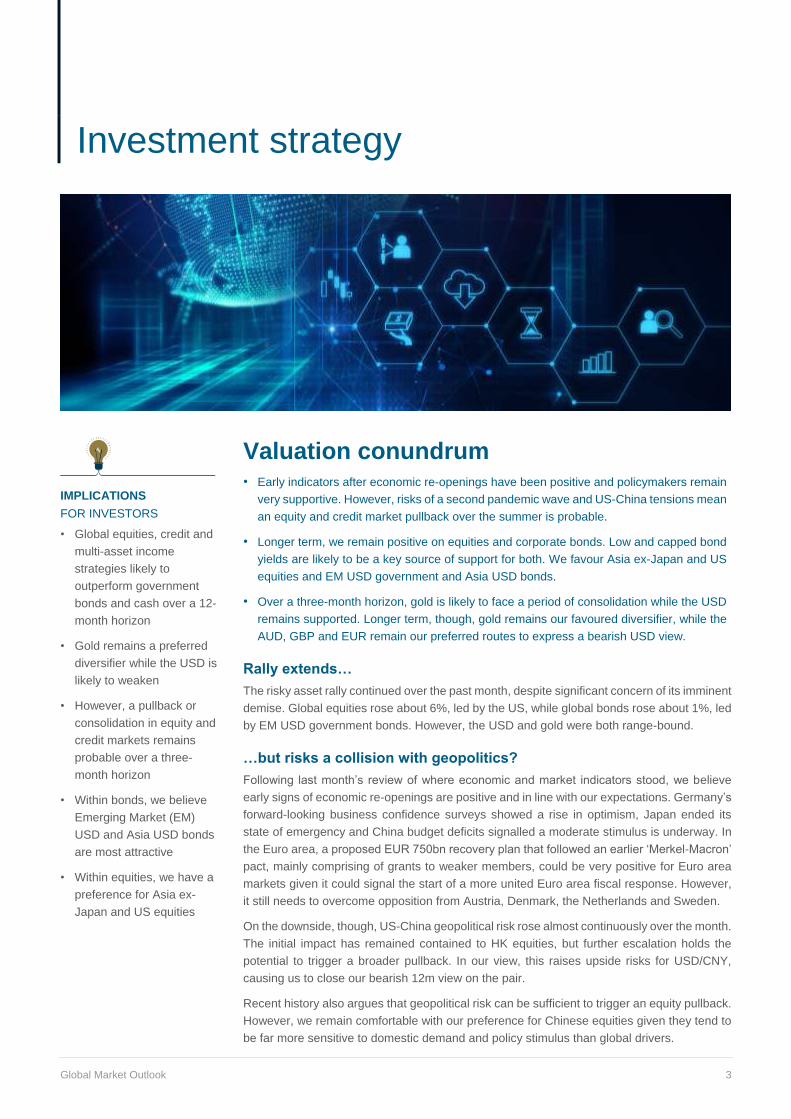
Valuation conundrum • Early indicators after economic re-openings have been positive and policymakers remain
very supportive. However, risks of a second pandemic wave and US-China tensions mean
an equity and credit market pullback over the summer is probable.
• Longer term, we remain positive on equities and corporate bonds. Low and capped bond
yields are likely to be a key source of support for both. We favour Asia ex-Japan and US
equities and EM USD government and Asia USD bonds.
• Over a three-month horizon, gold is likely to face a period of consolidation while the USD
remains supported. Longer term, though, gold remains our favoured diversifier, while the
AUD, GBP and EUR remain our preferred routes to express a bearish USD view.
Rally extends…
The risky asset rally continued over the past month, despite significant concern of its imminent
demise. Global equities rose about 6%, led by the US, while global bonds rose about 1%, led
by EM USD government bonds. However, the USD and gold were both range-bound.
…but risks a collision with geopolitics?
Following last month’s review of where economic and market indicators stood, we believe
early signs of economic re-openings are positive and in line with our expectations. Germany’s
forward-looking business confidence surveys showed a rise in optimism, Japan ended its
state of emergency and China budget deficits signalled a moderate stimulus is underway. In
the Euro area, a proposed EUR 750bn recovery plan that followed an earlier ‘Merkel-Macron’
pact, mainly comprising of grants to weaker members, could be very positive for Euro area
markets given it could signal the start of a more united Euro area fiscal response. However,
it still needs to overcome opposition from Austria, Denmark, the Netherlands and Sweden.
On the downside, though, US-China geopolitical risk rose almost continuously over the month.
The initial impact has remained contained to HK equities, but further escalation holds the
potential to trigger a broader pullback. In our view, this raises upside risks for USD/CNY,
causing us to close our bearish 12m view on the pair.
Recent history also argues that geopolitical risk can be sufficient to trigger an equity pullback.
However, we remain comfortable with our preference for Chinese equities given they tend to
be far more sensitive to domestic demand and policy stimulus than global drivers.
2 Investment strategy
Global Market Outlook 4
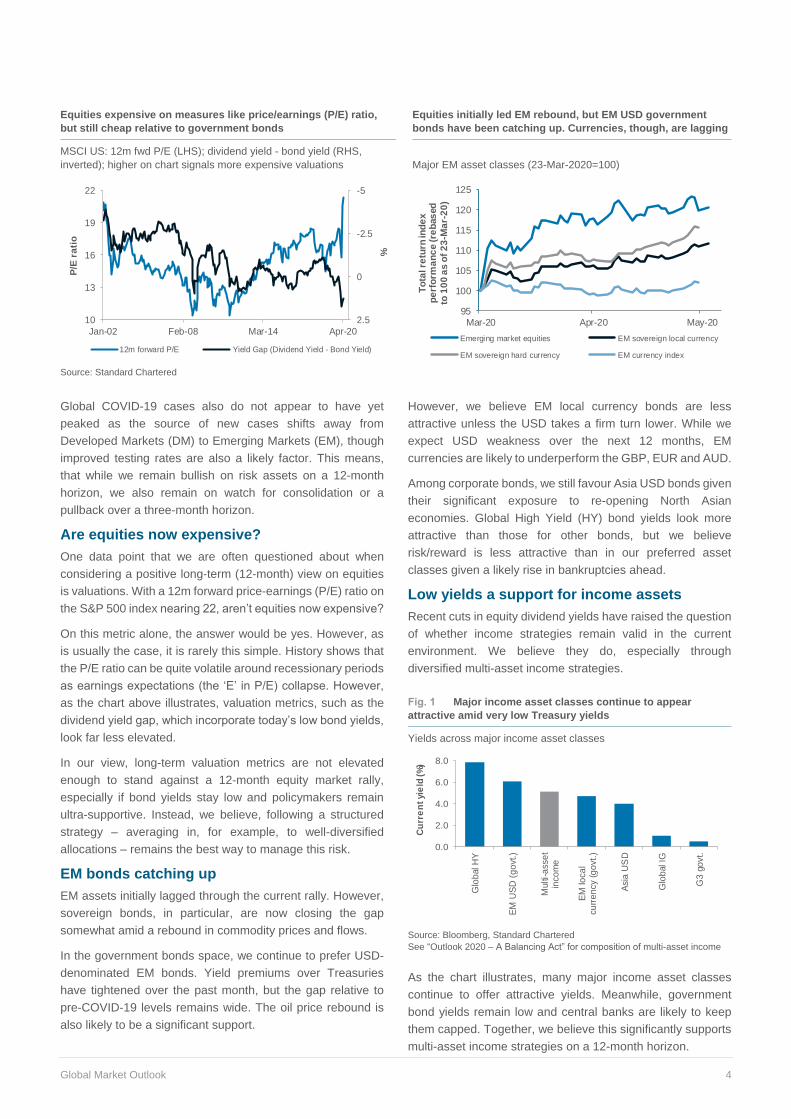
Equities expensive on measures like price/earnings (P/E) ratio,
but still cheap relative to government bonds
Equities initially led EM rebound, but EM USD government
bonds have been catching up. Currencies, though, are lagging
MSCI US: 12m fwd P/E (LHS); dividend yield - bond yield (RHS,
inverted); higher on chart signals more expensive valuations Major EM asset classes (23-Mar-2020=100)
Source: Standard Chartered
Global COVID-19 cases also do not appear to have yet
peaked as the source of new cases shifts away from
Developed Markets (DM) to Emerging Markets (EM), though
improved testing rates are also a likely factor. This means,
that while we remain bullish on risk assets on a 12-month
horizon, we also remain on watch for consolidation or a
pullback over a three-month horizon.
Are equities now expensive?
One data point that we are often questioned about when
considering a positive long-term (12-month) view on equities
is valuations. With a 12m forward price-earnings (P/E) ratio on
the S&P 500 index nearing 22, aren’t equities now expensive?
On this metric alone, the answer would be yes. However, as
is usually the case, it is rarely this simple. History shows that
the P/E ratio can be quite volatile around recessionary periods
as earnings expectations (the ‘E’ in P/E) collapse. However,
as the chart above illustrates, valuation metrics, such as the
dividend yield gap, which incorporate today’s low bond yields,
look far less elevated.
In our view, long-term valuation metrics are not elevated
enough to stand against a 12-month equity market rally,
especially if bond yields stay low and policymakers remain
ultra-supportive. Instead, we believe, following a structured
strategy – averaging in, for example, to well-diversified
allocations – remains the best way to manage this risk.
EM bonds catching up
EM assets initially lagged through the current rally. However,
sovereign bonds, in particular, are now closing the gap
somewhat amid a rebound in commodity prices and flows.
In the government bonds space, we continue to prefer USD-
denominated EM bonds. Yield premiums over Treasuries
have tightened over the past month, but the gap relative to
pre-COVID-19 levels remains wide. The oil price rebound is
also likely to be a significant support.
However, we believe EM local currency bonds are less
attractive unless the USD takes a firm turn lower. While we
expect USD weakness over the next 12 months, EM
currencies are likely to underperform the GBP, EUR and AUD.
Among corporate bonds, we still favour Asia USD bonds given
their significant exposure to re-opening North Asian
economies. Global High Yield (HY) bond yields look more
attractive than those for other bonds, but we believe
risk/reward is less attractive than in our preferred asset
classes given a likely rise in bankruptcies ahead.
Low yields a support for income assets
Recent cuts in equity dividend yields have raised the question
of whether income strategies remain valid in the current
environment. We believe they do, especially through
diversified multi-asset income strategies.
Fig. 1 Major income asset classes continue to appear
attractive amid very low Treasury yields
Yields across major income asset classes
Source: Bloomberg, Standard Chartered
See “Outlook 2020 – A Balancing Act” for composition of multi-asset income
As the chart illustrates, many major income asset classes
continue to offer attractive yields. Meanwhile, government
bond yields remain low and central banks are likely to keep
them capped. Together, we believe this significantly supports
multi-asset income strategies on a 12-month horizon.
-5
-2.5
0
2.510
13
16
19
22
Jan-02 Feb-08 Mar-14 Apr-20
%
P/E
ra
tio
12m forward P/E Yield Gap (Dividend Yield - Bond Yield)
95
100
105
110
115
120
125
Mar-20 Apr-20 May-20
To
tal re
turn
ind
ex
p
erf
orm
an
ce
(re
bas
ed
to
10
0 a
s o
f 2
3-M
ar-
20
)
Emerging market equities EM sovereign local currency
EM sovereign hard currency EM currency index
0.0
2.0
4.0
6.0
8.0
Glo
bal H
Y
EM
US
D (
go
vt.)
Multi-
asse
tin
co
me
EM
lo
ca
lcu
rre
ncy (
go
vt.
)
Asia
US
D
Glo
bal IG
G3
go
vt.
Cu
rre
nt
yie
ld (
%)
2
Global Market Outlook 5
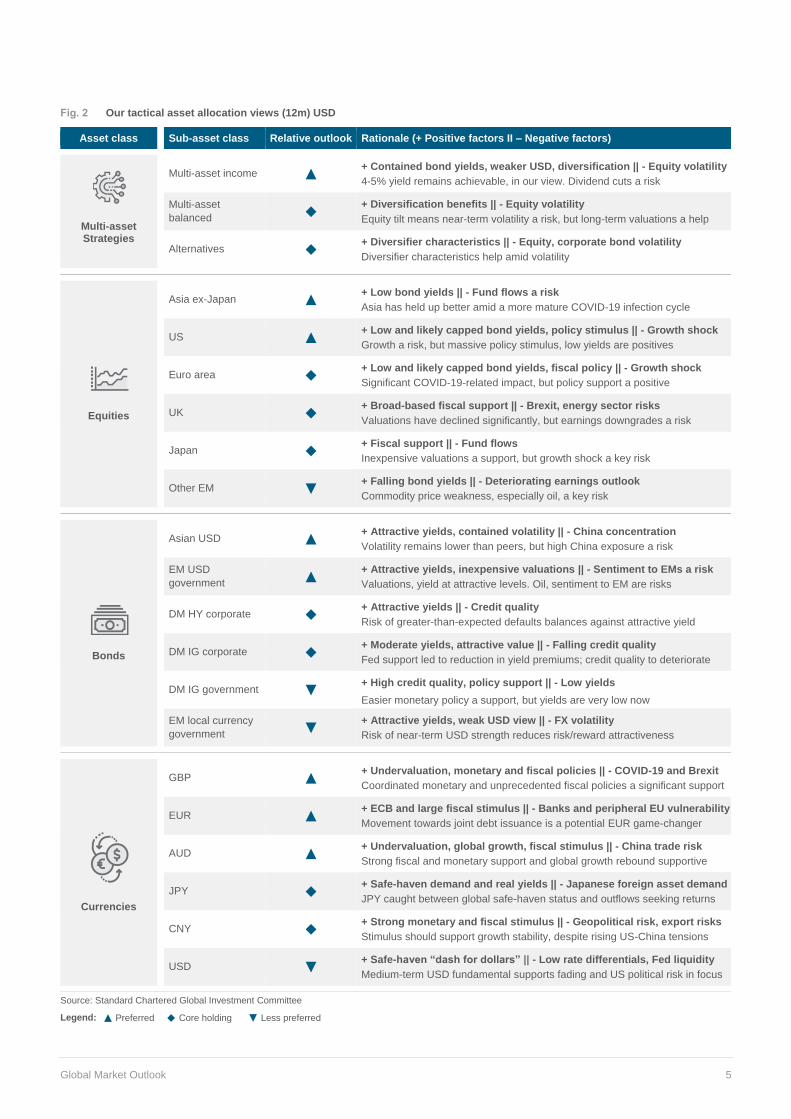
Fig. 2 Our tactical asset allocation views (12m) USD
Asset class Sub-asset class Relative outlook Rationale (+ Positive factors II – Negative factors)
Multi-asset Strategies
Multi-asset income ▲
+ Contained bond yields, weaker USD, diversification || - Equity volatility
4-5% yield remains achievable, in our view. Dividend cuts a risk
Multi-asset
balanced ◆ + Diversification benefits || - Equity volatility
Equity tilt means near-term volatility a risk, but long-term valuations a help
Alternatives ◆ + Diversifier characteristics || - Equity, corporate bond volatility
Diversifier characteristics help amid volatility
Equities
Asia ex-Japan ▲
+ Low bond yields || - Fund flows a risk
Asia has held up better amid a more mature COVID-19 infection cycle
US ▲
+ Low and likely capped bond yields, policy stimulus || - Growth shock
Growth a risk, but massive policy stimulus, low yields are positives
Euro area ◆
+ Low and likely capped bond yields, fiscal policy || - Growth shock
Significant COVID-19-related impact, but policy support a positive
UK ◆
+ Broad-based fiscal support || - Brexit, energy sector risks
Valuations have declined significantly, but earnings downgrades a risk
Japan ◆
+ Fiscal support || - Fund flows
Inexpensive valuations a support, but growth shock a key risk
Other EM ▼
+ Falling bond yields || - Deteriorating earnings outlook
Commodity price weakness, especially oil, a key risk
Bonds
Asian USD ▲
+ Attractive yields, contained volatility || - China concentration
Volatility remains lower than peers, but high China exposure a risk
EM USD
government ▲ + Attractive yields, inexpensive valuations || - Sentiment to EMs a risk
Valuations, yield at attractive levels. Oil, sentiment to EM are risks
DM HY corporate ◆
+ Attractive yields || - Credit quality
Risk of greater-than-expected defaults balances against attractive yield
DM IG corporate ◆
+ Moderate yields, attractive value || - Falling credit quality
Fed support led to reduction in yield premiums; credit quality to deteriorate
DM IG government ▼
+ High credit quality, policy support || - Low yields
Easier monetary policy a support, but yields are very low now
EM local currency
government ▼ + Attractive yields, weak USD view || - FX volatility
Risk of near-term USD strength reduces risk/reward attractiveness
Currencies
GBP ▲
+ Undervaluation, monetary and fiscal policies || - COVID-19 and Brexit
Coordinated monetary and unprecedented fiscal policies a significant support
EUR ▲
+ ECB and large fiscal stimulus || - Banks and peripheral EU vulnerability
Movement towards joint debt issuance is a potential EUR game-changer
AUD ▲
+ Undervaluation, global growth, fiscal stimulus || - China trade risk
Strong fiscal and monetary support and global growth rebound supportive
JPY ◆
+ Safe-haven demand and real yields || - Japanese foreign asset demand
JPY caught between global safe-haven status and outflows seeking returns
CNY ◆
+ Strong monetary and fiscal stimulus || - Geopolitical risk, export risks
Stimulus should support growth stability, despite rising US-China tensions
USD ▼
+ Safe-haven “dash for dollars” || - Low rate differentials, Fed liquidity
Medium-term USD fundamental supports fading and US political risk in focus
Source: Standard Chartered Global Investment Committee
Legend: ▲ Preferred ◆ Core holding ▼ Less preferred
2
Global Market Outlook 6
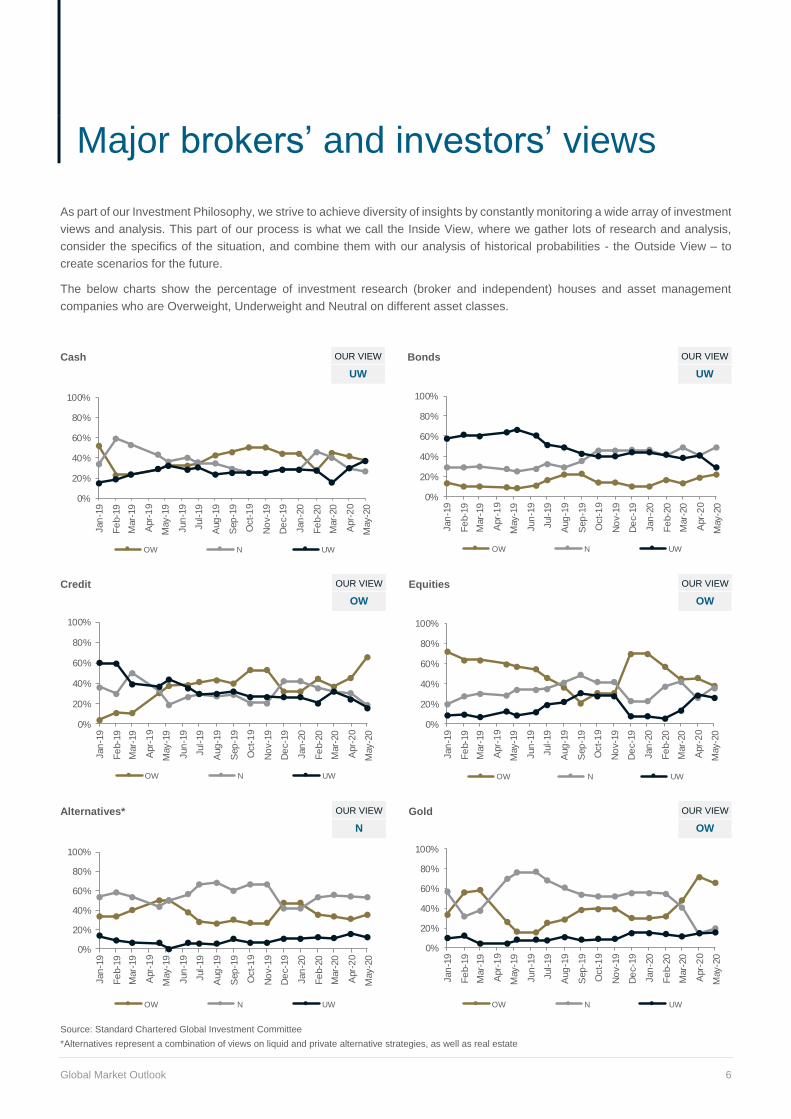
As part of our Investment Philosophy, we strive to achieve diversity of insights by constantly monitoring a wide array of investment
views and analysis. This part of our process is what we call the Inside View, where we gather lots of research and analysis,
consider the specifics of the situation, and combine them with our analysis of historical probabilities - the Outside View – to
create scenarios for the future.
The below charts show the percentage of investment research (broker and independent) houses and asset management
companies who are Overweight, Underweight and Neutral on different asset classes.
Cash OUR VIEW Bonds OUR VIEW
UW UW
Credit OUR VIEW Equities OUR VIEW
OW OW
Alternatives* OUR VIEW Gold OUR VIEW
N OW
Source: Standard Chartered Global Investment Committee
*Alternatives represent a combination of views on liquid and private alternative strategies, as well as real estate
0%
20%
40%
60%
80%
100%
Jan
-19
Fe
b-1
9
Mar-
19
Apr-
19
May-1
9
Jun
-19
Jul-
19
Aug
-19
Sep
-19
Oct-
19
No
v-1
9
De
c-1
9
Jan
-20
Fe
b-2
0
Mar-
20
Apr-
20
May-2
0
OW N UW
0%
20%
40%
60%
80%
100%
Jan
-19
Fe
b-1
9
Mar-
19
Apr-
19
May-1
9
Jun
-19
Jul-
19
Aug
-19
Sep
-19
Oct-
19
No
v-1
9
De
c-1
9
Jan
-20
Fe
b-2
0
Mar-
20
Apr-
20
May-2
0
OW N UW
0%
20%
40%
60%
80%
100%
Jan
-19
Fe
b-1
9
Mar-
19
Apr-
19
May-1
9
Jun
-19
Jul-
19
Aug
-19
Sep
-19
Oct-
19
No
v-1
9
De
c-1
9
Jan
-20
Fe
b-2
0
Mar-
20
Apr-
20
May-2
0
OW N UW
0%
20%
40%
60%
80%
100%
Jan
-19
Fe
b-1
9
Mar-
19
Apr-
19
May-1
9
Jun
-19
Jul-
19
Aug
-19
Sep
-19
Oct-
19
No
v-1
9
De
c-1
9
Jan
-20
Fe
b-2
0
Mar-
20
Apr-
20
May-2
0
OW N UW
0%
20%
40%
60%
80%
100%
Jan
-19
Fe
b-1
9
Mar-
19
Apr-
19
May-1
9
Jun
-19
Jul-
19
Aug
-19
Sep
-19
Oct-
19
No
v-1
9
De
c-1
9
Jan
-20
Fe
b-2
0
Mar-
20
Apr-
20
May-2
0
OW N UW
0%
20%
40%
60%
80%
100%
Jan
-19
Fe
b-1
9
Mar-
19
Apr-
19
May-1
9
Jun
-19
Jul-
19
Aug
-19
Sep
-19
Oct-
19
No
v-1
9
De
c-1
9
Jan
-20
Fe
b-2
0
Mar-
20
Apr-
20
May-2
0
OW N UW
4 Major brokers’ and investors’ views
Global Market Outlook 7
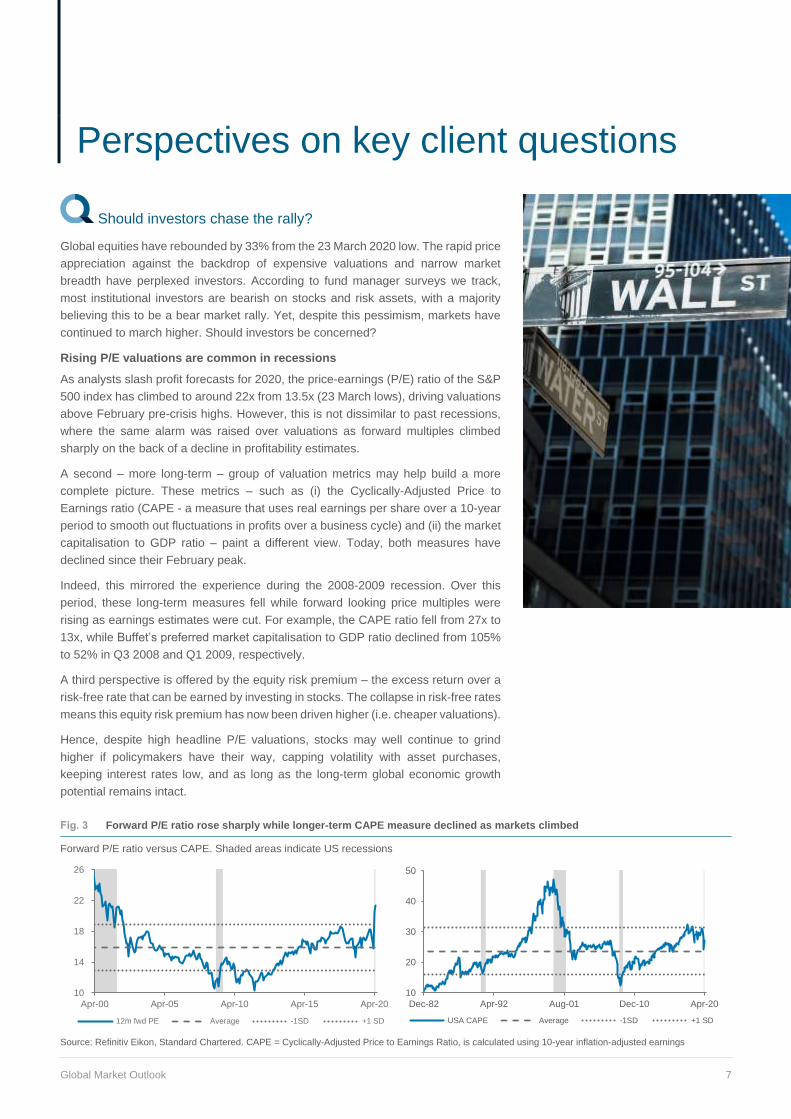
Should investors chase the rally?
Global equities have rebounded by 33% from the 23 March 2020 low. The rapid price
appreciation against the backdrop of expensive valuations and narrow market
breadth have perplexed investors. According to fund manager surveys we track,
most institutional investors are bearish on stocks and risk assets, with a majority
believing this to be a bear market rally. Yet, despite this pessimism, markets have
continued to march higher. Should investors be concerned?
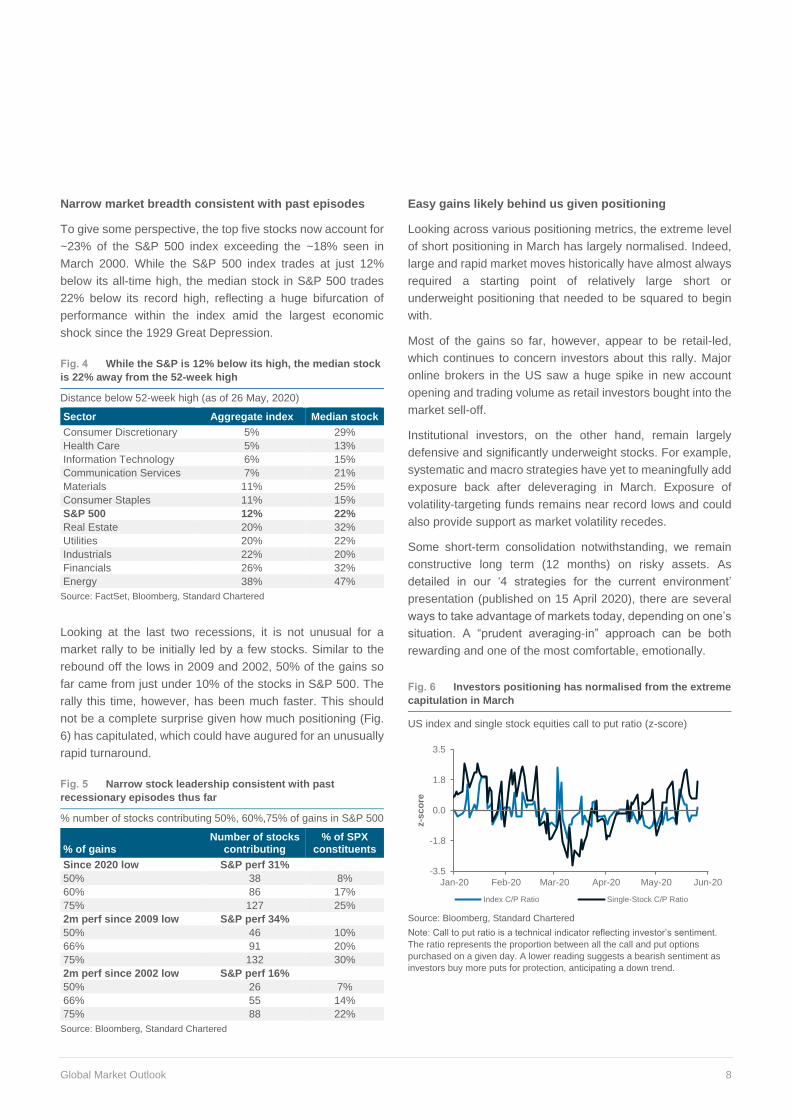
Rising P/E valuations are common in recessions
As analysts slash profit forecasts for 2020, the price-earnings (P/E) ratio of the S&P
500 index has climbed to around 22x from 13.5x (23 March lows), driving valuations
above February pre-crisis highs. However, this is not dissimilar to past recessions,
where the same alarm was raised over valuations as forward multiples climbed
sharply on the back of a decline in profitability estimates.
A second – more long-term – group of valuation metrics may help build a more
complete picture. These metrics – such as (i) the Cyclically-Adjusted Price to
Earnings ratio (CAPE - a measure that uses real earnings per share over a 10-year
period to smooth out fluctuations in profits over a business cycle) and (ii) the market
capitalisation to GDP ratio – paint a different view. Today, both measures have
declined since their February peak.
Indeed, this mirrored the experience during the 2008-2009 recession. Over this
period, these long-term measures fell while forward looking price multiples were
rising as earnings estimates were cut. For example, the CAPE ratio fell from 27x to
13x, while Buffet’s preferred market capitalisation to GDP ratio declined from 105%
to 52% in Q3 2008 and Q1 2009, respectively.
A third perspective is offered by the equity risk premium – the excess return over a
risk-free rate that can be earned by investing in stocks. The collapse in risk-free rates
means this equity risk premium has now been driven higher (i.e. cheaper valuations).
Hence, despite high headline P/E valuations, stocks may well continue to grind
higher if policymakers have their way, capping volatility with asset purchases,
keeping interest rates low, and as long as the long-term global economic growth
potential remains intact.
Fig. 3 Forward P/E ratio rose sharply while longer-term CAPE measure declined as markets climbed
Forward P/E ratio versus CAPE. Shaded areas indicate US recessions
Source: Refinitiv Eikon, Standard Chartered. CAPE = Cyclically-Adjusted Price to Earnings Ratio, is calculated using 10-year inflation-adjusted earnings
10
14
18
22
26
Apr-00 Apr-05 Apr-10 Apr-15 Apr-20
12m fwd PE Average -1SD +1 SD
10
20
30
40
50
Dec-82 Apr-92 Aug-01 Dec-10 Apr-20
USA CAPE Average -1SD +1 SD
3 Perspectives on key client questions
Global Market Outlook 8
Narrow market breadth consistent with past episodes
To give some perspective, the top five stocks now account for
~23% of the S&P 500 index exceeding the ~18% seen in
March 2000. While the S&P 500 index trades at just 12%
below its all-time high, the median stock in S&P 500 trades
22% below its record high, reflecting a huge bifurcation of
performance within the index amid the largest economic
shock since the 1929 Great Depression.
Fig. 4 While the S&P is 12% below its high, the median stock
is 22% away from the 52-week high
Distance below 52-week high (as of 26 May, 2020)
Sector Aggregate index Median stock
Consumer Discretionary 5% 29%
Health Care 5% 13%
Information Technology 6% 15%
Communication Services 7% 21%
Materials 11% 25%
Consumer Staples 11% 15%
S&P 500 12% 22%
Real Estate 20% 32%
Utilities 20% 22%
Industrials 22% 20%
Financials 26% 32%
Energy 38% 47%
Source: FactSet, Bloomberg, Standard Chartered
Looking at the last two recessions, it is not unusual for a
market rally to be initially led by a few stocks. Similar to the
rebound off the lows in 2009 and 2002, 50% of the gains so
far came from just under 10% of the stocks in S&P 500. The
rally this time, however, has been much faster. This should
not be a complete surprise given how much positioning (Fig.
6) has capitulated, which could have augured for an unusually
rapid turnaround.
Fig. 5 Narrow stock leadership consistent with past
recessionary episodes thus far
% number of stocks contributing 50%, 60%,75% of gains in S&P 500
% of gains Number of stocks
contributing % of SPX
constituents
Since 2020 low S&P perf 31%
50% 38 8%
60% 86 17%
75% 127 25%
2m perf since 2009 low S&P perf 34%
50% 46 10%
66% 91 20%
75% 132 30%
2m perf since 2002 low S&P perf 16%
50% 26 7%
66% 55 14%
75% 88 22%
Source: Bloomberg, Standard Chartered
Easy gains likely behind us given positioning
Looking across various positioning metrics, the extreme level
of short positioning in March has largely normalised. Indeed,
large and rapid market moves historically have almost always
required a starting point of relatively large short or
underweight positioning that needed to be squared to begin
with.
Most of the gains so far, however, appear to be retail-led,
which continues to concern investors about this rally. Major
online brokers in the US saw a huge spike in new account
opening and trading volume as retail investors bought into the
market sell-off.
Institutional investors, on the other hand, remain largely
defensive and significantly underweight stocks. For example,
systematic and macro strategies have yet to meaningfully add
exposure back after deleveraging in March. Exposure of
volatility-targeting funds remains near record lows and could
also provide support as market volatility recedes.
Some short-term consolidation notwithstanding, we remain
constructive long term (12 months) on risky assets. As
detailed in our ‘4 strategies for the current environment’
presentation (published on 15 April 2020), there are several
ways to take advantage of markets today, depending on one’s
situation. A “prudent averaging-in” approach can be both
rewarding and one of the most comfortable, emotionally.
Fig. 6 Investors positioning has normalised from the extreme
capitulation in March
US index and single stock equities call to put ratio (z-score)
Source: Bloomberg, Standard Chartered
Note: Call to put ratio is a technical indicator reflecting investor’s sentiment.
The ratio represents the proportion between all the call and put options
purchased on a given day. A lower reading suggests a bearish sentiment as
investors buy more puts for protection, anticipating a down trend.
-3.5
-1.8
0.0
1.8
3.5
Jan-20 Feb-20 Mar-20 Apr-20 May-20 Jun-20
z-s
co
re
Index C/P Ratio Single-Stock C/P Ratio
2
Global Market Outlook 9
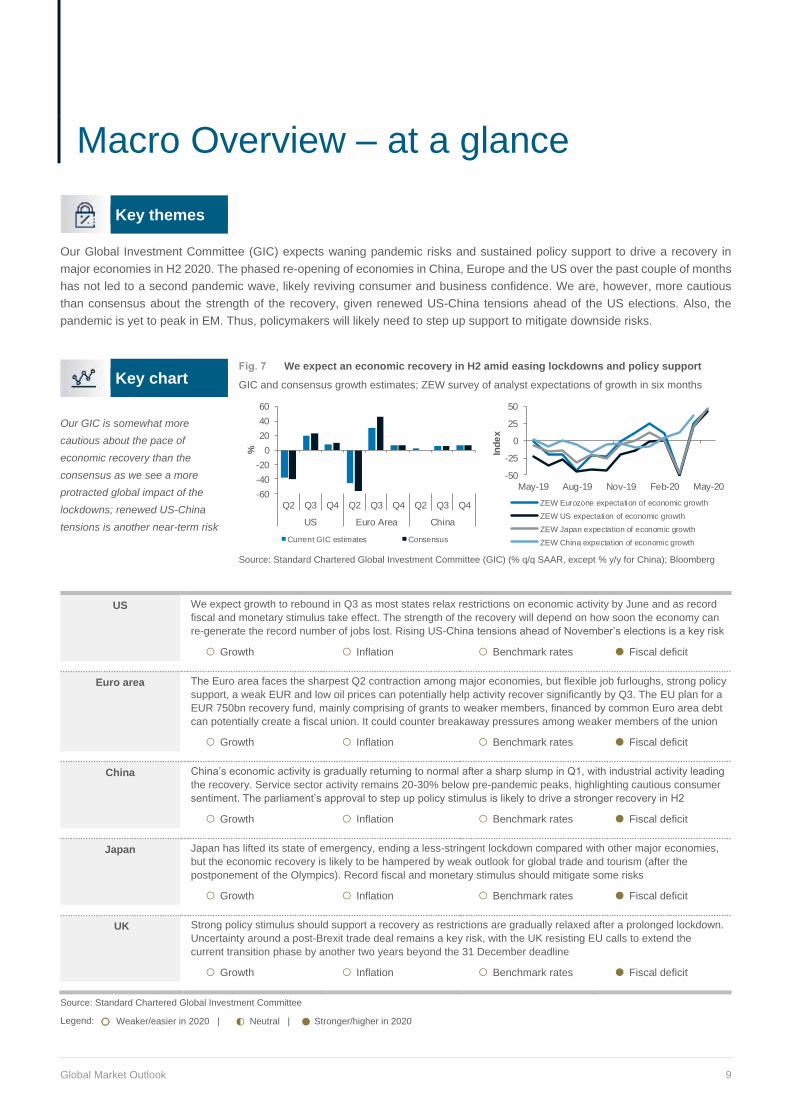
Key themes
Our Global Investment Committee (GIC) expects waning pandemic risks and sustained policy support to drive a recovery in
major economies in H2 2020. The phased re-opening of economies in China, Europe and the US over the past couple of months
has not led to a second pandemic wave, likely reviving consumer and business confidence. We are, however, more cautious
than consensus about the strength of the recovery, given renewed US-China tensions ahead of the US elections. Also, the
pandemic is yet to peak in EM. Thus, policymakers will likely need to step up support to mitigate downside risks.
Key chart
Fig. 7 We expect an economic recovery in H2 amid easing lockdowns and policy support
GIC and consensus growth estimates; ZEW survey of analyst expectations of growth in six months
Our GIC is somewhat more
cautious about the pace of
economic recovery than the
consensus as we see a more
protracted global impact of the
lockdowns; renewed US-China
tensions is another near-term risk
Source: Standard Chartered Global Investment Committee (GIC) (% q/q SAAR, except % y/y for China); Bloomberg
US We expect growth to rebound in Q3 as most states relax restrictions on economic activity by June and as record
fiscal and monetary stimulus take effect. The strength of the recovery will depend on how soon the economy can
re-generate the record number of jobs lost. Rising US-China tensions ahead of November’s elections is a key risk
○ Growth ○ Inflation ○ Benchmark rates ● Fiscal deficit
Euro area The Euro area faces the sharpest Q2 contraction among major economies, but flexible job furloughs, strong policy
support, a weak EUR and low oil prices can potentially help activity recover significantly by Q3. The EU plan for a
EUR 750bn recovery fund, mainly comprising of grants to weaker members, financed by common Euro area debt
can potentially create a fiscal union. It could counter breakaway pressures among weaker members of the union
○ Growth ○ Inflation ○ Benchmark rates ● Fiscal deficit
China China’s economic activity is gradually returning to normal after a sharp slump in Q1, with industrial activity leading
the recovery. Service sector activity remains 20-30% below pre-pandemic peaks, highlighting cautious consumer
sentiment. The parliament’s approval to step up policy stimulus is likely to drive a stronger recovery in H2
○ Growth ○ Inflation ○ Benchmark rates ● Fiscal deficit
Japan
Japan has lifted its state of emergency, ending a less-stringent lockdown compared with other major economies,
but the economic recovery is likely to be hampered by weak outlook for global trade and tourism (after the
postponement of the Olympics). Record fiscal and monetary stimulus should mitigate some risks
○ Growth ○ Inflation ○ Benchmark rates ● Fiscal deficit
UK
Strong policy stimulus should support a recovery as restrictions are gradually relaxed after a prolonged lockdown.
Uncertainty around a post-Brexit trade deal remains a key risk, with the UK resisting EU calls to extend the
current transition phase by another two years beyond the 31 December deadline
○ Growth ○ Inflation ○ Benchmark rates ● Fiscal deficit
Source: Standard Chartered Global Investment Committee
Legend: ○ Weaker/easier in 2020 | ◐ Neutral | ● Stronger/higher in 2020
-50
-25
0
25
50
May-19 Aug-19 Nov-19 Feb-20 May-20In
de
xZEW Eurozone expectation of economic growth
ZEW US expectation of economic growth
ZEW Japan expectation of economic growth
ZEW China expectation of economic growth
-60
-40
-20
0
20
40
60
Q2 Q3 Q4 Q2 Q3 Q4 Q2 Q3 Q4
US Euro Area China
%
Current GIC estimates Consensus
4 Macro Overview – at a glance
Global Market Outlook 10
Key themes
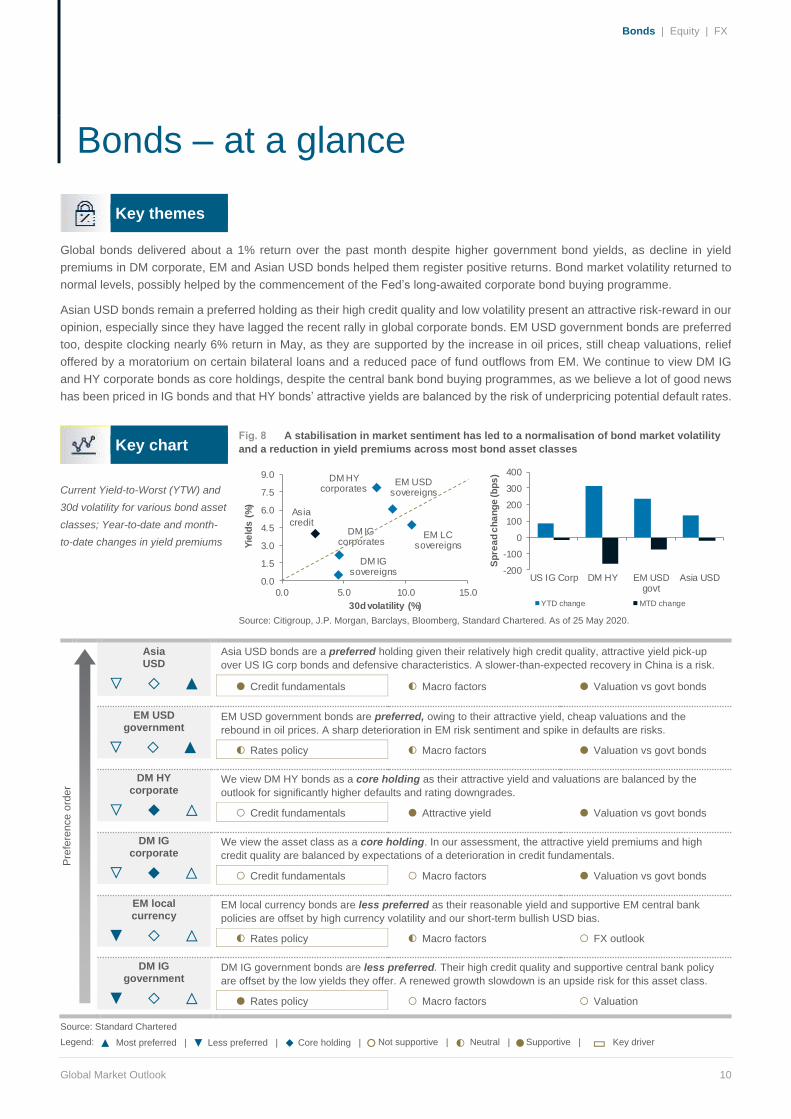
Global bonds delivered about a 1% return over the past month despite higher government bond yields, as decline in yield
premiums in DM corporate, EM and Asian USD bonds helped them register positive returns. Bond market volatility returned to
normal levels, possibly helped by the commencement of the Fed’s long-awaited corporate bond buying programme.
Asian USD bonds remain a preferred holding as their high credit quality and low volatility present an attractive risk-reward in our
opinion, especially since they have lagged the recent rally in global corporate bonds. EM USD government bonds are preferred
too, despite clocking nearly 6% return in May, as they are supported by the increase in oil prices, still cheap valuations, relief
offered by a moratorium on certain bilateral loans and a reduced pace of fund outflows from EM. We continue to view DM IG
and HY corporate bonds as core holdings, despite the central bank bond buying programmes, as we believe a lot of good news
has been priced in IG bonds and that HY bonds’ attractive yields are balanced by the risk of underpricing potential default rates.
Key chart
Fig. 8 A stabilisation in market sentiment has led to a normalisation of bond market volatility
and a reduction in yield premiums across most bond asset classes
Current Yield-to-Worst (YTW) and
30d volatility for various bond asset
classes; Year-to-date and month-
to-date changes in yield premiums
Source: Citigroup, J.P. Morgan, Barclays, Bloomberg, Standard Chartered. As of 25 May 2020.
Pre
fere
nce o
rder
Asia USD
▽ ◇ ▲
Asia USD bonds are a preferred holding given their relatively high credit quality, attractive yield pick-up
over US IG corp bonds and defensive characteristics. A slower-than-expected recovery in China is a risk.
● Credit fundamentals ◐ Macro factors ● Valuation vs govt bonds
EM USD government
▽ ◇ ▲ ▲
EM USD government bonds are preferred, owing to their attractive yield, cheap valuations and the
rebound in oil prices. A sharp deterioration in EM risk sentiment and spike in defaults are risks.
◐ Rates policy ◐ Macro factors ● Valuation vs govt bonds
DM HY corporate
▽ ◆ △
We view DM HY bonds as a core holding as their attractive yield and valuations are balanced by the
outlook for significantly higher defaults and rating downgrades.
○ Credit fundamentals ● Attractive yield ● Valuation vs govt bonds
DM IG corporate
▽ ◆ △ △
We view the asset class as a core holding. In our assessment, the attractive yield premiums and high
credit quality are balanced by expectations of a deterioration in credit fundamentals.
○ Credit fundamentals ○ Macro factors ● Valuation vs govt bonds
EM local currency
▼ ◇ △
EM local currency bonds are less preferred as their reasonable yield and supportive EM central bank
policies are offset by high currency volatility and our short-term bullish USD bias.
◐ Rates policy ◐ Macro factors ○ FX outlook
DM IG government
▼ ◇ △
DM IG government bonds are less preferred. Their high credit quality and supportive central bank policy
are offset by the low yields they offer. A renewed growth slowdown is an upside risk for this asset class.
● Rates policy ○ Macro factors ○ Valuation
Source: Standard Chartered
Legend: ▲ Most preferred | ▼ Less preferred | ◆ Core holding | ○ Not supportive | ◐ Neutral | ● Supportive | ▭ Key driver
DM IG sovereigns
EM USD sovereigns
EM LC sovereigns
DM IG corporates
DM HY corporates
Asia credit
0.0
1.5
3.0
4.5
6.0
7.5
9.0
0.0 5.0 10.0 15.0
Yie
lds
(%
)
30d volatility (%)
-200
-100
0
100
200
300
400
US IG Corp DM HY EM USDgovt
Asia USD
Sp
rea
d c
ha
ng
e (b
ps
)
YTD change MTD change
Bonds | Equity | FX
5 Bonds – at a glance
Global Market Outlook 11
Key themes
The outlook for global equities remains uncertain in the near term due in part to US-China tensions. Risks related to COVID-19
appear to be diminishing as economies re-open without a significant second wave of infections. Changes to analysts earnings
forecasts are becoming less negative as they increasingly focus on the prospects for a rebound in 2021. Risks include a second
wave of infections and US-China relations.
Asia ex-Japan equities are preferred. In China, the National People’s Congress has emphasised job creation as a central goal,
which in combination with reopening of the economy, will boost investment, consumption and earnings. US equities are
preferred, with a focus on technology and healthcare. Euro area equities are a core holding amid an uncertain path to recovery.
Key chart
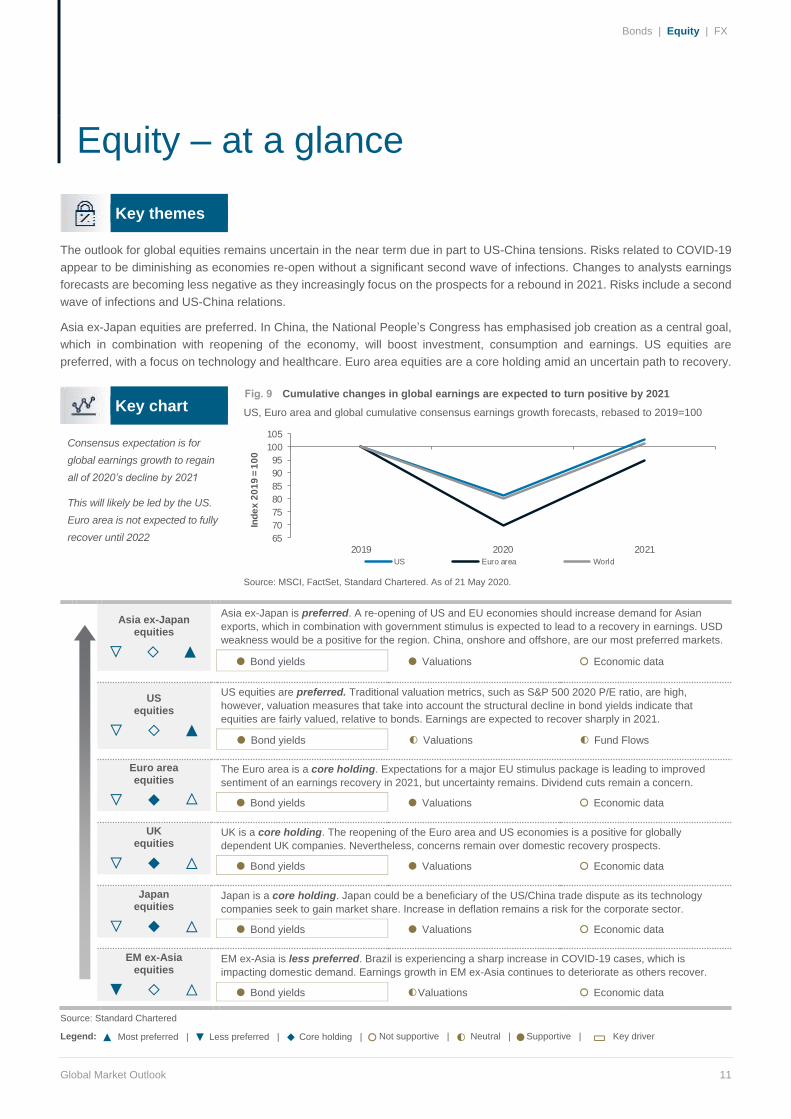
Fig. 9 Cumulative changes in global earnings are expected to turn positive by 2021
US, Euro area and global cumulative consensus earnings growth forecasts, rebased to 2019=100
Consensus expectation is for
global earnings growth to regain
all of 2020’s decline by 2021
This will likely be led by the US.
Euro area is not expected to fully
recover until 2022
Source: MSCI, FactSet, Standard Chartered. As of 21 May 2020.
Asia ex-Japan equities
▽ ◇ ▲ ▲
Asia ex-Japan is preferred. A re-opening of US and EU economies should increase demand for Asian
exports, which in combination with government stimulus is expected to lead to a recovery in earnings. USD
weakness would be a positive for the region. China, onshore and offshore, are our most preferred markets.
● Bond yields ● Valuations ○ Economic data
US equities
▽ ◇ ▲
US equities are preferred. Traditional valuation metrics, such as S&P 500 2020 P/E ratio, are high,
however, valuation measures that take into account the structural decline in bond yields indicate that
equities are fairly valued, relative to bonds. Earnings are expected to recover sharply in 2021.
● Bond yields ◐ Valuations ◐ Fund Flows
Euro area equities
▽ ◆ △ △
The Euro area is a core holding. Expectations for a major EU stimulus package is leading to improved
sentiment of an earnings recovery in 2021, but uncertainty remains. Dividend cuts remain a concern.
● Bond yields ● Valuations ○ Economic data
UK equities
▽ ◆ △
UK is a core holding. The reopening of the Euro area and US economies is a positive for globally
dependent UK companies. Nevertheless, concerns remain over domestic recovery prospects.
● Bond yields ● Valuations ○ Economic data
Japan equities
▽ ◆ △
Japan is a core holding. Japan could be a beneficiary of the US/China trade dispute as its technology
companies seek to gain market share. Increase in deflation remains a risk for the corporate sector.
● Bond yields ● Valuations ○ Economic data
EM ex-Asia equities
▼ ◇ △
EM ex-Asia is less preferred. Brazil is experiencing a sharp increase in COVID-19 cases, which is
impacting domestic demand. Earnings growth in EM ex-Asia continues to deteriorate as others recover.
● Bond yields ◐Valuations ○ Economic data
Source: Standard Chartered
Legend: ▲ Most preferred | ▼ Less preferred | ◆ Core holding | ○ Not supportive | ◐ Neutral | ● Supportive | ▭ Key driver
65
70
75
80
85
90
95
100
105
2019 2020 2021
Ind
ex
20
19
= 1
00
US Euro area World
Bonds | Equity | FX
6 Equity – at a glance
Global Market Outlook 12
Key themes
Near term, the USD is likely to remain range-bound and potentially volatile if geopolitical tensions continue to rise. There is a
risk of a final USD spike before the long-lasting USD uptrend reverses. The EU faces a critical period of talks around the funding
and distribution of stimulus for the pan-EU COVID-19 recovery plan and the GBP may weaken as the June Brexit deadline nears.
Consensus around the Franco-German recovery proposal would be strongly EUR-supportive, whereas failure to agree would
exacerbate doubts over the common-currency’s longevity. We expect a positive resolution. Narrowing interest rate and growth
differentials and a more positive risk sentiment support our bearish medium-term USD view. EUR, GBP and AUD are preferred.
Key chart
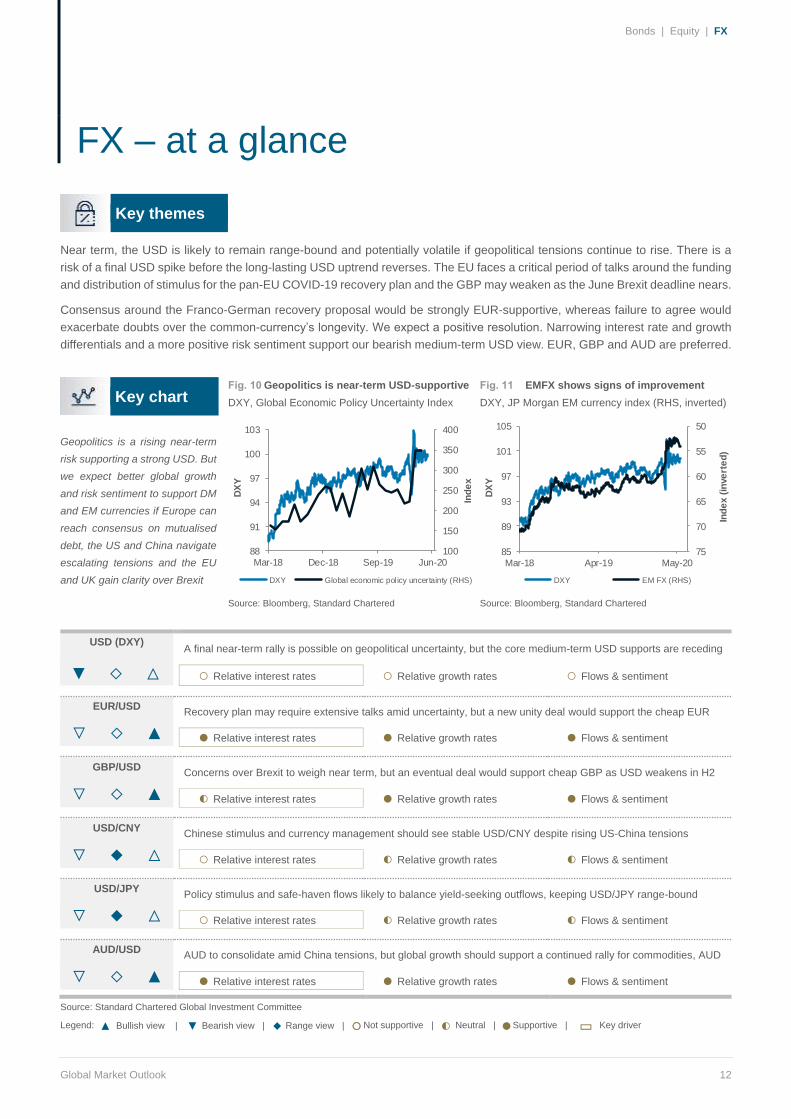
Fig. 10 Geopolitics is near-term USD-supportive
DXY, Global Economic Policy Uncertainty Index
Fig. 11 EMFX shows signs of improvement
DXY, JP Morgan EM currency index (RHS, inverted)
Geopolitics is a rising near-term
risk supporting a strong USD. But
we expect better global growth
and risk sentiment to support DM
and EM currencies if Europe can
reach consensus on mutualised
debt, the US and China navigate
escalating tensions and the EU
and UK gain clarity over Brexit
Source: Bloomberg, Standard Chartered Source: Bloomberg, Standard Chartered
USD (DXY)
▼ ◇ △ ▲
A final near-term rally is possible on geopolitical uncertainty, but the core medium-term USD supports are receding
○ Relative interest rates ○ Relative growth rates ○ Flows & sentiment
EUR/USD
▽ ◇ ▲
Recovery plan may require extensive talks amid uncertainty, but a new unity deal would support the cheap EUR
● Relative interest rates ● Relative growth rates ● Flows & sentiment
GBP/USD
▽ ◇ ▲
Concerns over Brexit to weigh near term, but an eventual deal would support cheap GBP as USD weakens in H2
◐ Relative interest rates ● Relative growth rates ● Flows & sentiment
USD/CNY
▽ ◆ △
Chinese stimulus and currency management should see stable USD/CNY despite rising US-China tensions
○ Relative interest rates ◐ Relative growth rates ◐ Flows & sentiment
USD/JPY
▽ ◆ △
Policy stimulus and safe-haven flows likely to balance yield-seeking outflows, keeping USD/JPY range-bound
○ Relative interest rates ◐ Relative growth rates ◐ Flows & sentiment
AUD/USD
▽ ◇ ▲
AUD to consolidate amid China tensions, but global growth should support a continued rally for commodities, AUD
● Relative interest rates ● Relative growth rates ● Flows & sentiment
Source: Standard Chartered Global Investment Committee
Legend: ▲ Bullish view | ▼ Bearish view | ◆ Range view | ○ Not supportive | ◐ Neutral | ● Supportive | ▭ Key driver
100
150
200
250
300
350
400
88
91
94
97
100
103
Mar-18 Dec-18 Sep-19 Jun-20
Ind
ex
DX
Y
DXY Global economic policy uncertainty (RHS)
50
55
60
65
70
7585
89
93
97
101
105
Mar-18 Apr-19 May-20
Ind
ex
(in
ve
rte
d)
DX
Y
DXY EM FX (RHS)
Bonds | Equity | FX
9 FX – at a glance
Global Market Outlook 13
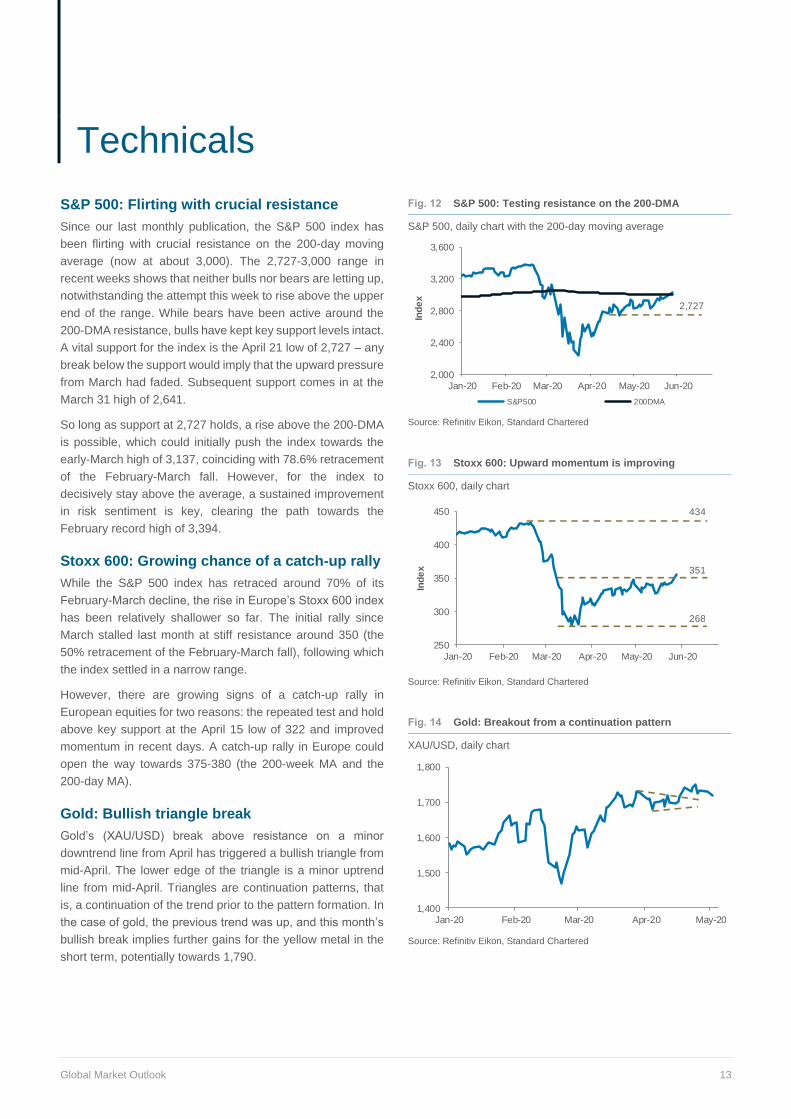
S&P 500: Flirting with crucial resistance
Since our last monthly publication, the S&P 500 index has
been flirting with crucial resistance on the 200-day moving
average (now at about 3,000). The 2,727-3,000 range in
recent weeks shows that neither bulls nor bears are letting up,
notwithstanding the attempt this week to rise above the upper
end of the range. While bears have been active around the
200-DMA resistance, bulls have kept key support levels intact.
A vital support for the index is the April 21 low of 2,727 – any
break below the support would imply that the upward pressure
from March had faded. Subsequent support comes in at the
March 31 high of 2,641.
So long as support at 2,727 holds, a rise above the 200-DMA
is possible, which could initially push the index towards the
early-March high of 3,137, coinciding with 78.6% retracement
of the February-March fall. However, for the index to
decisively stay above the average, a sustained improvement
in risk sentiment is key, clearing the path towards the
February record high of 3,394.
Stoxx 600: Growing chance of a catch-up rally
While the S&P 500 index has retraced around 70% of its
February-March decline, the rise in Europe’s Stoxx 600 index
has been relatively shallower so far. The initial rally since
March stalled last month at stiff resistance around 350 (the
50% retracement of the February-March fall), following which
the index settled in a narrow range.
However, there are growing signs of a catch-up rally in
European equities for two reasons: the repeated test and hold
above key support at the April 15 low of 322 and improved
momentum in recent days. A catch-up rally in Europe could
open the way towards 375-380 (the 200-week MA and the
200-day MA).
Gold: Bullish triangle break
Gold’s (XAU/USD) break above resistance on a minor
downtrend line from April has triggered a bullish triangle from
mid-April. The lower edge of the triangle is a minor uptrend
line from mid-April. Triangles are continuation patterns, that
is, a continuation of the trend prior to the pattern formation. In
the case of gold, the previous trend was up, and this month’s
bullish break implies further gains for the yellow metal in the
short term, potentially towards 1,790.
Fig. 12 S&P 500: Testing resistance on the 200-DMA
S&P 500, daily chart with the 200-day moving average
Source: Refinitiv Eikon, Standard Chartered
Fig. 13 Stoxx 600: Upward momentum is improving
Stoxx 600, daily chart
Source: Refinitiv Eikon, Standard Chartered
Fig. 14 Gold: Breakout from a continuation pattern
XAU/USD, daily chart
Source: Refinitiv Eikon, Standard Chartered
2,000
2,400
2,800
3,200
3,600
Jan-20 Feb-20 Mar-20 Apr-20 May-20 Jun-20
Ind
ex
S&P500 200DMA
2,727
250
300
350
400
450
Jan-20 Feb-20 Mar-20 Apr-20 May-20 Jun-20
Ind
ex 351
434
268
1,400
1,500
1,600
1,700
1,800
Jan-20 Feb-20 Mar-20 Apr-20 May-20
10 Technicals
Global Market Outlook 14
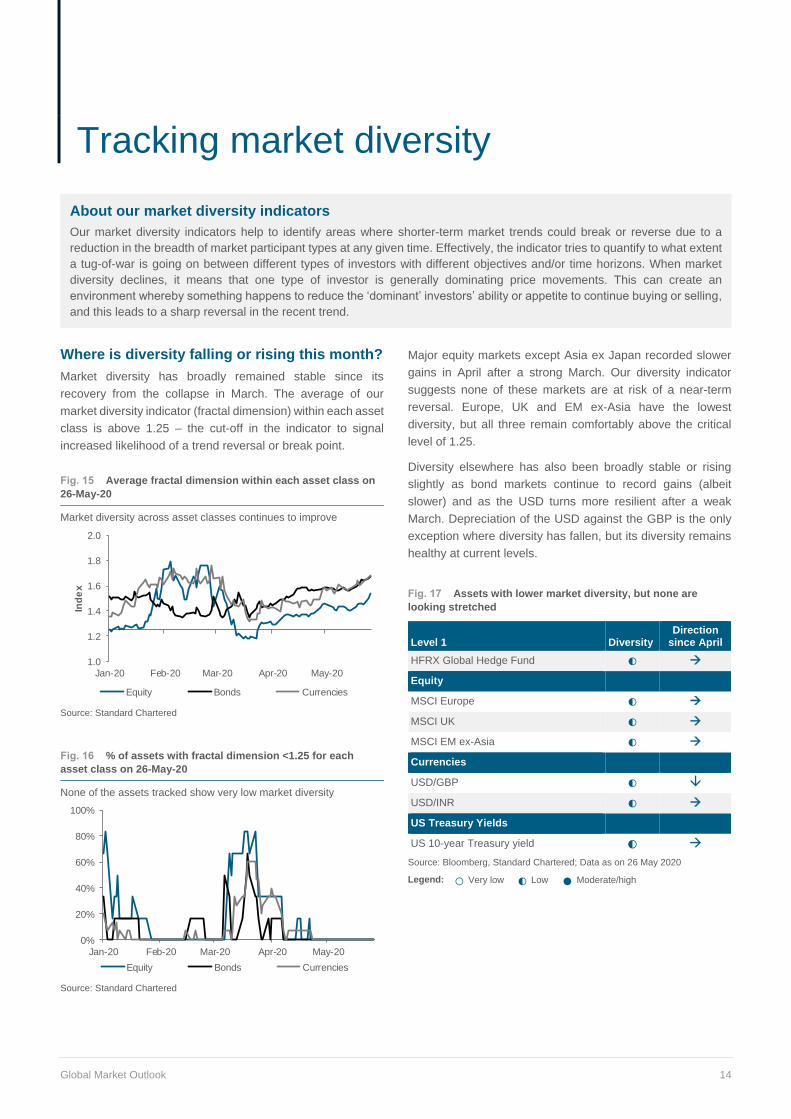
About our market diversity indicators
Our market diversity indicators help to identify areas where shorter-term market trends could break or reverse due to a
reduction in the breadth of market participant types at any given time. Effectively, the indicator tries to quantify to what extent
a tug-of-war is going on between different types of investors with different objectives and/or time horizons. When market
diversity declines, it means that one type of investor is generally dominating price movements. This can create an
environment whereby something happens to reduce the ‘dominant’ investors’ ability or appetite to continue buying or selling,
and this leads to a sharp reversal in the recent trend.
Where is diversity falling or rising this month?
Market diversity has broadly remained stable since its
recovery from the collapse in March. The average of our
market diversity indicator (fractal dimension) within each asset
class is above 1.25 – the cut-off in the indicator to signal
increased likelihood of a trend reversal or break point.
Fig. 15 Average fractal dimension within each asset class on
26-May-20
Market diversity across asset classes continues to improve
Source: Standard Chartered
Fig. 16 % of assets with fractal dimension <1.25 for each
asset class on 26-May-20
None of the assets tracked show very low market diversity
Source: Standard Chartered
Major equity markets except Asia ex Japan recorded slower
gains in April after a strong March. Our diversity indicator
suggests none of these markets are at risk of a near-term
reversal. Europe, UK and EM ex-Asia have the lowest
diversity, but all three remain comfortably above the critical
level of 1.25.
Diversity elsewhere has also been broadly stable or rising
slightly as bond markets continue to record gains (albeit
slower) and as the USD turns more resilient after a weak
March. Depreciation of the USD against the GBP is the only
exception where diversity has fallen, but its diversity remains
healthy at current levels.
Fig. 17 Assets with lower market diversity, but none are
looking stretched
Level 1 Diversity Direction
since April
HFRX Global Hedge Fund ◐
Equity
MSCI Europe ◐
MSCI UK ◐
MSCI EM ex-Asia ◐
Currencies
USD/GBP ◐
USD/INR ◐
US Treasury Yields
US 10-year Treasury yield ◐
Source: Bloomberg, Standard Chartered; Data as on 26 May 2020
Legend: ○Very low ◐Low ●Moderate/high
1.0
1.2
1.4
1.6
1.8
2.0
Jan-20 Feb-20 Mar-20 Apr-20 May-20
Ind
ex
Equity Bonds Currencies
0%
20%
40%
60%
80%
100%
Jan-20 Feb-20 Mar-20 Apr-20 May-20
Equity Bonds Currencies
11 Tracking market diversity
Global Market Outlook 15
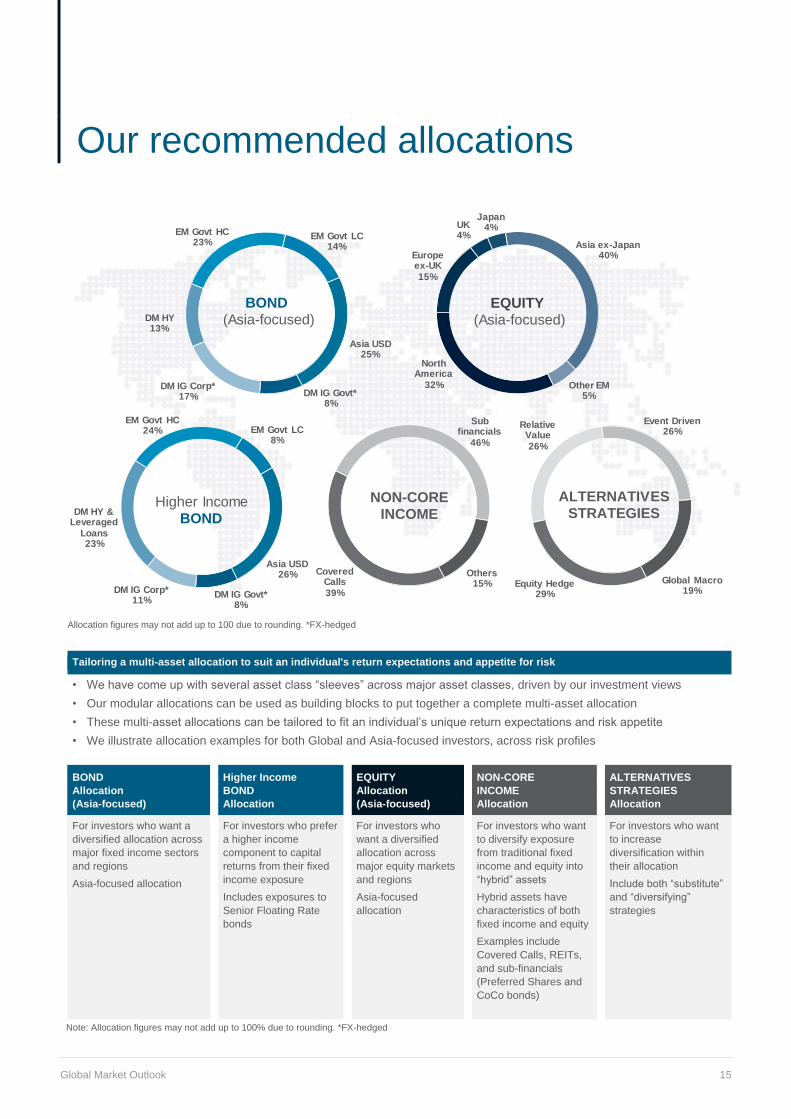
Allocation figures may not add up to 100 due to rounding. *FX-hedged
Tailoring a multi-asset allocation to suit an individual's return expectations and appetite for risk
• We have come up with several asset class “sleeves” across major asset classes, driven by our investment views
• Our modular allocations can be used as building blocks to put together a complete multi-asset allocation
• These multi-asset allocations can be tailored to fit an individual’s unique return expectations and risk appetite
• We illustrate allocation examples for both Global and Asia-focused investors, across risk profiles
BOND
Allocation
(Asia-focused)
Higher Income
BOND
Allocation
EQUITY
Allocation
(Asia-focused)
NON-CORE
INCOME
Allocation
ALTERNATIVES
STRATEGIES
Allocation
For investors who want a
diversified allocation across
major fixed income sectors
and regions
Asia-focused allocation
For investors who prefer
a higher income
component to capital
returns from their fixed
income exposure
Includes exposures to
Senior Floating Rate
bonds
For investors who
want a diversified
allocation across
major equity markets
and regions
Asia-focused
allocation
For investors who want
to diversify exposure
from traditional fixed
income and equity into
“hybrid” assets
Hybrid assets have
characteristics of both
fixed income and equity
Examples include
Covered Calls, REITs,
and sub-financials
(Preferred Shares and
CoCo bonds)
For investors who want
to increase
diversification within
their allocation
Include both “substitute”
and “diversifying”
strategies
Note: Allocation figures may not add up to 100% due to rounding. *FX-hedged
DM IG Govt*8%
DM IG Corp*17%
DM HY13%
EM Govt HC23%
EM Govt LC14%
Asia USD25%
BOND (Asia-focused)
North America
32%
Europe ex-UK15%
UK4%
Japan4%
Asia ex-Japan40%
Other EM5%
EQUITY (Asia-focused)
DM IG Govt*8%
DM IG Corp*11%
DM HY & Leveraged
Loans23%
EM Govt HC24% EM Govt LC
8%
Asia USD26%
Higher IncomeBOND
Covered Calls39%
Sub financials
46%
Others15%
NON-COREINCOME
Equity Hedge29%
Relative Value26%
Event Driven26%
Global Macro19%
ALTERNATIVESSTRATEGIES
13 Our recommended allocations
Global Market Outlook 16
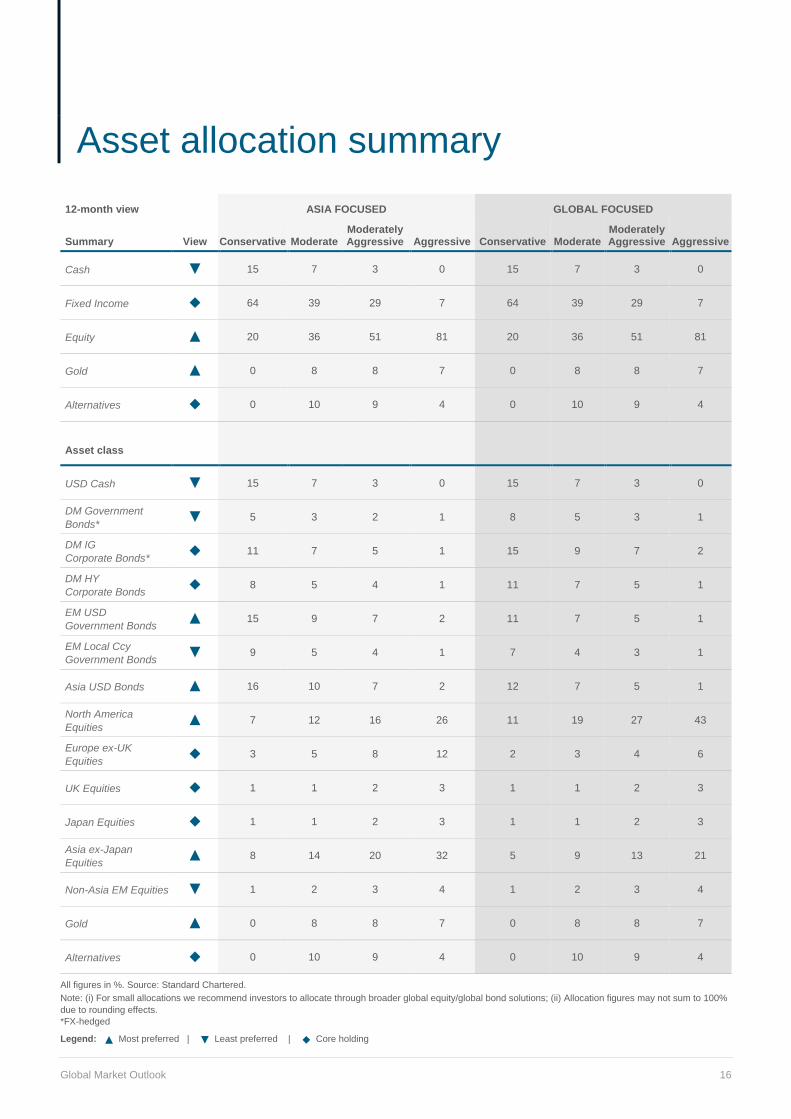
12-month view ASIA FOCUSED GLOBAL FOCUSED
Summary View Conservative Moderate Moderately Aggressive Aggressive Conservative Moderate
Moderately Aggressive Aggressive
Cash ▼ 15 7 3 0 15 7 3 0
Fixed Income ◆ 64 39 29 7 64 39 29 7
Equity ▲ 20 36 51 81 20 36 51 81
Gold ▲ 0 8 8 7 0 8 8 7
Alternatives ◆ 0 10 9 4 0 10 9 4
Asset class
USD Cash ▼ 15 7 3 0 15 7 3 0
DM Government
Bonds* ▼ 5 3 2 1 8 5 3 1
DM IG
Corporate Bonds* ◆ 11 7 5 1 15 9 7 2
DM HY
Corporate Bonds ◆ 8 5 4 1 11 7 5 1
EM USD
Government Bonds ▲ 15 9 7 2 11 7 5 1
EM Local Ccy
Government Bonds ▼ 9 5 4 1 7 4 3 1
Asia USD Bonds ▲ 16 10 7 2 12 7 5 1
North America
Equities ▲ 7 12 16 26 11 19 27 43
Europe ex-UK
Equities ◆ 3 5 8 12 2 3 4 6
UK Equities ◆ 1 1 2 3 1 1 2 3
Japan Equities ◆ 1 1 2 3 1 1 2 3
Asia ex-Japan
Equities ▲ 8 14 20 32 5 9 13 21
Non-Asia EM Equities ▼ 1 2 3 4 1 2 3 4
Gold ▲ 0 8 8 7 0 8 8 7
Alternatives ◆ 0 10 9 4 0 10 9 4
All figures in %. Source: Standard Chartered.
Note: (i) For small allocations we recommend investors to allocate through broader global equity/global bond solutions; (ii) Allocation figures may not sum to 100%
due to rounding effects.
*FX-hedged
Legend: ▲ Most preferred | ▼ Least preferred | ◆ Core holding
14 Asset allocation summary
Global Market Outlook 17
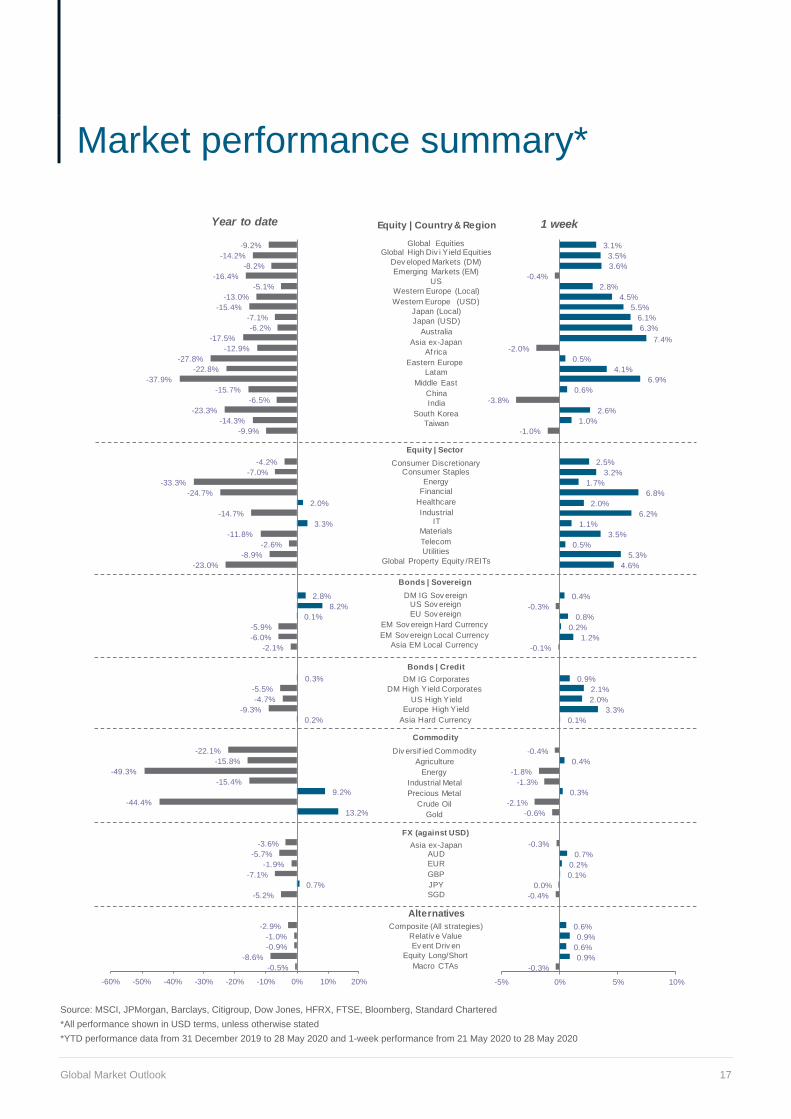
Source: MSCI, JPMorgan, Barclays, Citigroup, Dow Jones, HFRX, FTSE, Bloomberg, Standard Chartered
*All performance shown in USD terms, unless otherwise stated
*YTD performance data from 31 December 2019 to 28 May 2020 and 1-week performance from 21 May 2020 to 28 May 2020
-0.5%
-8.6%
-0.9%
-1.0%
-2.9%
-5.2%
0.7%
-7.1%
-1.9%
-5.7%
-3.6%
13.2%
-44.4%
9.2%
-15.4%
-49.3%
-15.8%
-22.1%
0.2%
-9.3%
-4.7%
-5.5%
0.3%
-2.1%
-6.0%
-5.9%
0.1%
8.2%
2.8%
-23.0%
-8.9%
-2.6%
-11.8%
3.3%
-14.7%
2.0%
-24.7%
-33.3%
-7.0%
-4.2%
-9.9%
-14.3%
-23.3%
-6.5%
-15.7%
-37.9%
-22.8%
-27.8%
-12.9%
-17.5%
-6.2%
-7.1%
-15.4%
-13.0%
-5.1%
-16.4%
-8.2%
-14.2%
-9.2%
-60% -50% -40% -30% -20% -10% 0% 10% 20%
Year to date
-0.3%
0.9%
0.6%
0.9%
0.6%
-0.4%
0.0%
0.1%
0.2%
0.7%
-0.3%
-0.6%
-2.1%
0.3%
-1.3%
-1.8%
0.4%
-0.4%
0.1%
3.3%
2.0%
2.1%
0.9%
-0.1%
1.2%
0.2%
0.8%
-0.3%
0.4%
4.6%
5.3%
0.5%
3.5%
1.1%
6.2%
2.0%
6.8%
1.7%
3.2%
2.5%
-1.0%
1.0%
2.6%
-3.8%
0.6%
6.9%
4.1%
0.5%
-2.0%7.4%
6.3%
6.1%
5.5%
4.5%
2.8%
-0.4%
3.6%
3.5%
3.1%
-5% 0% 5% 10%
1 week
Global EquitiesGlobal High Div i Y ield Equities
Dev eloped Markets (DM)
Emerging Markets (EM)
US
Western Europe (Local)
Western Europe (USD)
Japan (Local)
Japan (USD)
Australia
Asia ex-Japan
Af rica
Eastern Europe
Latam
Middle East
China
India
South Korea
Taiwan
Alternatives
FX (against USD)
Commodity
Bonds | Credit
Equity | Country & Region
Equity | Sector
Bonds | Sovereign
Consumer DiscretionaryConsumer Staples
Energy
Financial
Healthcare
IndustrialIT
Materials
Telecom
Utilities
Global Property Equity /REITs
DM IG Sov ereignUS Sov ereign
EU Sov ereign
EM Sov ereign Hard Currency
EM Sov ereign Local Currency
Asia EM Local Currency
DM IG Corporates
DM High Yield Corporates
US High Yield
Europe High Yield
Asia Hard Currency
Asia ex-JapanAUD
EUR
GBP
JPY
SGD
Composite (All strategies)
Relativ e Value
Ev ent Driv en
Equity Long/Short
Macro CTAs
Div ersif ied Commodity
Agriculture
Energy
Industrial Metal
Precious Metal
Crude Oil
Gold
15 Market performance summary*
Global Market Outlook 18
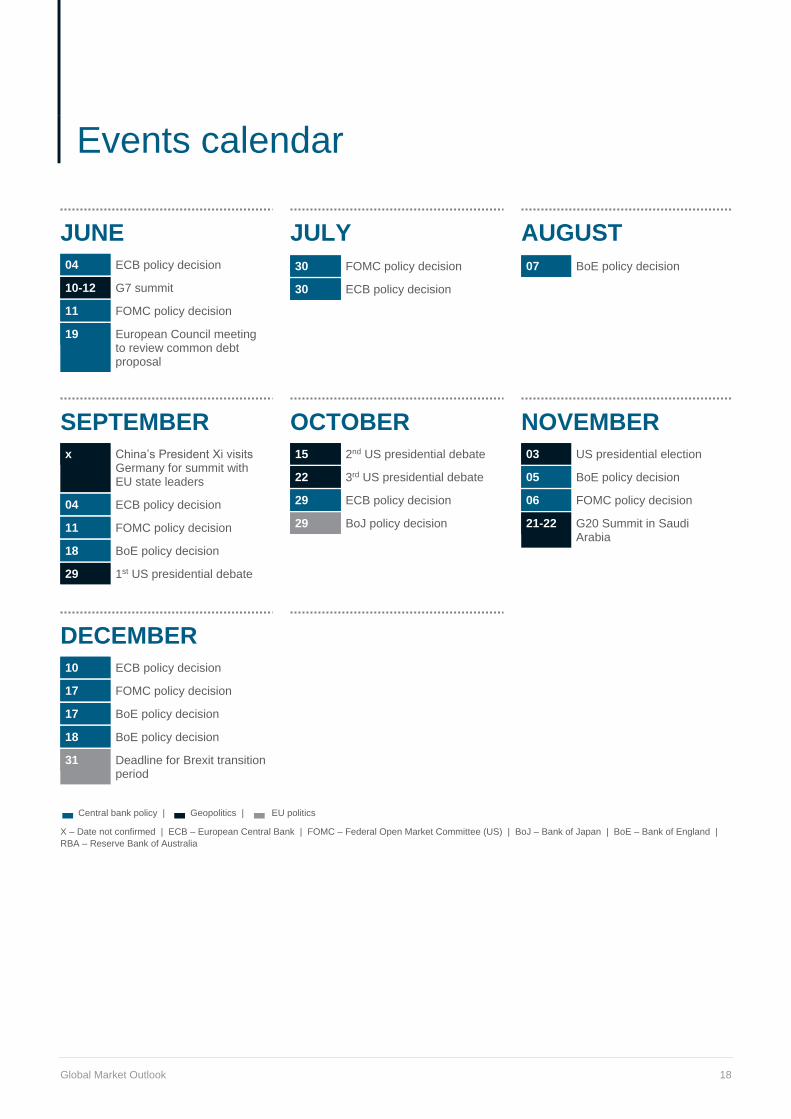
JUNE
04 ECB policy decision
10-12 G7 summit
11 FOMC policy decision
19 European Council meeting to review common debt proposal
JULY
30 FOMC policy decision
30 ECB policy decision
AUGUST
07 BoE policy decision
SEPTEMBER
x China’s President Xi visits Germany for summit with EU state leaders
04 ECB policy decision
11 FOMC policy decision
18 BoE policy decision
29 1st US presidential debate
OCTOBER
15 2nd US presidential debate
22 3rd US presidential debate
29 ECB policy decision
29 BoJ policy decision
NOVEMBER
03 US presidential election
05 BoE policy decision
06 FOMC policy decision
21-22 G20 Summit in Saudi Arabia
DECEMBER
10 ECB policy decision
17 FOMC policy decision
17 BoE policy decision
18 BoE policy decision
31 Deadline for Brexit transition period
▬ Central bank policy | ▬
Geopolitics | ▬ EU politics
X – Date not confirmed | ECB – European Central Bank | FOMC – Federal Open Market Committee (US) | BoJ – Bank of Japan | BoE – Bank of England |
RBA – Reserve Bank of Australia
16 Events calendar
Global Market Outlook 19
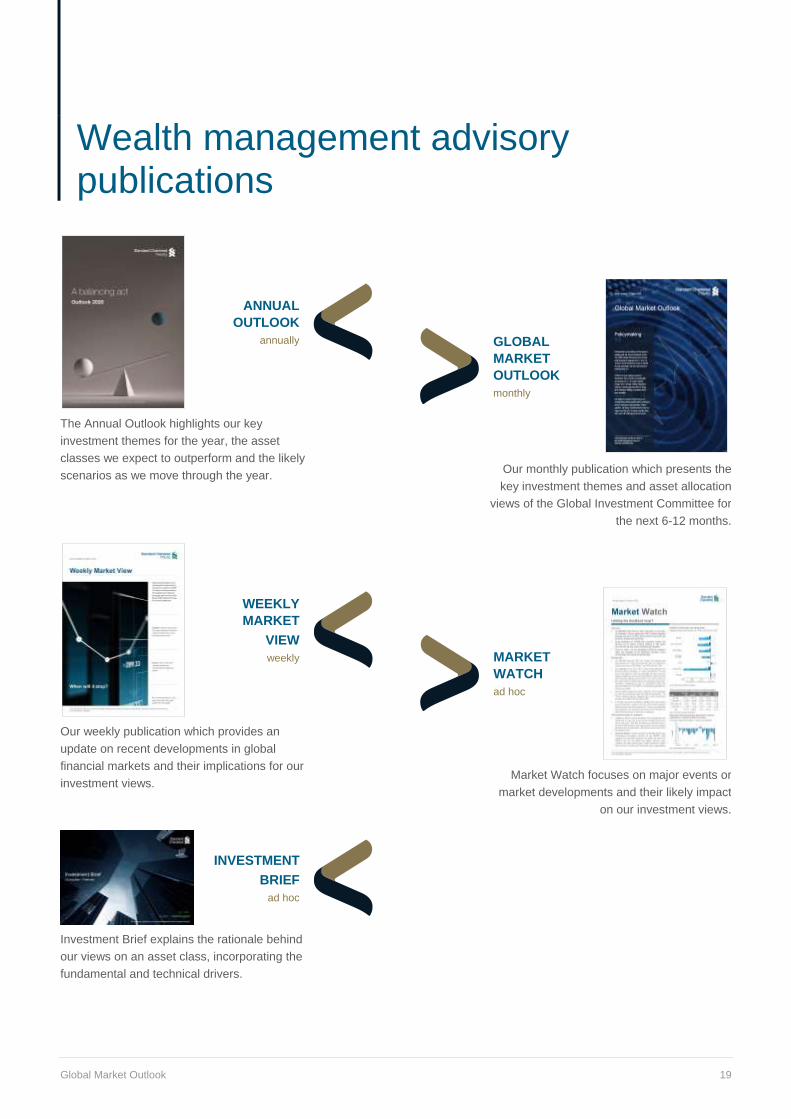
ANNUAL
OUTLOOK
annually
GLOBAL
MARKET
OUTLOOK
monthly
The Annual Outlook highlights our key
investment themes for the year, the asset
classes we expect to outperform and the likely
scenarios as we move through the year.
Our monthly publication which presents the
key investment themes and asset allocation
views of the Global Investment Committee for
the next 6-12 months.
WEEKLY
MARKET
VIEW
weekly
MARKET
WATCH
ad hoc
Our weekly publication which provides an
update on recent developments in global
financial markets and their implications for our
investment views.
Market Watch focuses on major events or
market developments and their likely impact
on our investment views.
INVESTMENT
BRIEF
ad hoc
Investment Brief explains the rationale behind
our views on an asset class, incorporating the
fundamental and technical drivers.
17 Wealth management advisory publications

Global Market Outlook 20
Our experience and expertise help you navigate markets and provide actionable insights to reach your investment goals.
Alexis Calla
Chief Investment Officer
Chair of the Global Investment
Committee
Manish Jaradi
Senior Investment Strategist
Francis Lim
Senior Investment Strategist
Ajay Saratchandran
Senior Portfolio Manager
Steve Brice
Chief Investment Strategist
Belle Chan
Senior Investment Strategist
Fook Hien Yap
Senior Investment Strategist
Samuel Seah, CFA
Senior Portfolio Manager
Christian Abuide
Head
Discretionary Portfolio
Management
Daniel Lam, CFA
Senior Cross-asset Strategist
Abhilash Narayan
Investment Strategist
Thursten Cheok, CFA
Senior Portfolio Strategist
Clive McDonnell
Head
Equity Investment Strategy
Rajat Bhattacharya
Senior Investment Strategist
DJ Cheong, CFA
Investment Strategist
Trang Nguyen
Portfolio Strategist
Manpreet Gill
Head
FICC Investment Strategy
Audrey Goh, CFA
Senior Cross-asset Strategist
Cedric Lam
Investment Strategist
Marco Iachini, CFA
Cross-asset Strategist
Sean Pang
Investment Strategist
The team
21
This document is confidential and may also be privileged. If you are not the intended recipient, please destroy all copies and
notify the sender immediately. This document is being distributed for general information only and is subject to the relevant
disclaimers available at https://www.sc.com/en/regulatory-disclosures/#market-commentary-disclaimer. It is not and does not
constitute research material, independent research, an offer, recommendation or solicitation to enter into any transaction or
adopt any hedging, trading or investment strategy, in relation to any securities or other financial instruments. This document is
for general evaluation only. It does not take into account the specific investment objectives, financial situation or particular needs
of any particular person or class of persons and it has not been prepared for any particular person or class of persons. You
should not rely on any contents of this document in making any investment decisions. Before making any investment, you should
carefully read the relevant offering documents and seek independent legal, tax and regulatory advice. In particular, we
recommend you to seek advice regarding the suitability of the investment product, taking into account your specific investment
objectives, financial situation or particular needs, before you make a commitment to purchase the investment product. Opinions,
projections and estimates are solely those of SCB at the date of this document and subject to change without notice. Past
performance is not indicative of future results and no representation or warranty is made regarding future performance. Any
forecast contained herein as to likely future movements in rates or prices or likely future events or occurrences constitutes an
opinion only and is not indicative of actual future movements in rates or prices or actual future events or occurrences (as the
case may be). This document must not be forwarded or otherwise made available to any other person without the express written
consent of the Standard Chartered Group (as defined below). Standard Chartered Bank is incorporated in England with limited
liability by Royal Charter 1853 Reference Number ZC18. The Principal Office of the Company is situated in England at 1
Basinghall Avenue, London, EC2V 5DD. Standard Chartered Bank is authorised by the Prudential Regulation Authority and
regulated by the Financial Conduct Authority and Prudential Regulation Authority. Standard Chartered PLC, the ultimate parent
company of Standard Chartered Bank, together with its subsidiaries and affiliates (including each branch or representative office),
form the Standard Chartered Group. Standard Chartered Private Bank is the private banking division of Standard Chartered.
Private banking activities may be carried out internationally by different legal entities and affiliates within the Standard Chartered
Group (each an “SC Group Entity”) according to local regulatory requirements. Not all products and services are provided by all
branches, subsidiaries and affiliates within the Standard Chartered Group. Some of the SC Group Entities only act as
representatives of Standard Chartered Private Bank, and may not be able to offer products and services, or offer advice to
clients. They serve as points of contact only. ESG data has been provided by Refinitiv. Refer to
https://www.refinitiv.com/en/financial-data/company-data/esg-research-data.
Market Abuse Regulation (MAR) Disclaimer
Banking activities may be carried out internationally by different branches, subsidiaries and affiliates within the Standard
Chartered Group according to local regulatory requirements. Opinions may contain outright “buy”, “sell”, “hold” or other opinions.
The time horizon of this opinion is dependent on prevailing market conditions and there is no planned frequency for updates to
the opinion. This opinion is not independent of Standard Chartered Group’s trading strategies or positions. Standard Chartered
Group and/or its affiliates or its respective officers, directors, employee benefit programmes or employees, including persons
involved in the preparation or issuance of this document may at any time, to the extent permitted by applicable law and/or
regulation, be long or short any securities or financial instruments referred to in this document or have material interest in any
such securities or related investments. Therefore, it is possible, and you should assume, that Standard Chartered Group has a
material interest in one or more of the financial instruments mentioned herein. Please refer to https://www.sc.com/en/banking-
services/market-disclaimer.html for more detailed disclosures, including past opinions/recommendations in the last 12 months
and conflict of interests, as well as disclaimers. A covering strategist may have a financial interest in the debt or equity securities
of this company/issuer. This document must not be forwarded or otherwise made available to any other person without the
express written consent of Standard Chartered Group.
Country/Market Specific Disclosures
Botswana: This document is being distributed in Botswana by, and is attributable to, Standard Chartered Bank Botswana Limited
which is a financial institution licensed under the Section 6 of the Banking Act CAP 46.04 and is listed in the Botswana Stock
Exchange. Brunei Darussalam: This document is being distributed in Brunei Darussalam by, and is attributable to, Standard
Chartered Bank (Brunei Branch) | Registration Number RFC/61. Standard Chartered Bank is incorporated in England with limited
liability by Royal Charter 1853 Reference Number ZC18 and Standard Chartered Securities (B) Sdn Bhd, which is a limited
liability company registered with the Registry of Companies with Registration Number RC20001003 and licensed by Autoriti
Monetari Brunei Darussalam as a Capital Markets Service License Holder with License Number AMBD/R/CMU/S3-CL. China
Mainland: This document is being distributed in China by, and is attributable to, Standard Chartered Bank (China) Limited which
is mainly regulated by China Banking and Insurance Regulatory Commission (CBIRC), State Administration of Foreign Exchange
18 Disclosures
22
(SAFE), and People’s Bank of China (PBOC). Hong Kong: In Hong Kong, this document, except for any portion advising on or
facilitating any decision on futures contracts trading, is distributed by Standard Chartered Bank (Hong Kong) Limited (“SCBHK”),
a subsidiary of Standard Chartered PLC. SCBHK has its registered address at 32/F, Standard Chartered Bank Building, 4-4A
Des Voeux Road Central, Hong Kong and is regulated by the Hong Kong Monetary Authority and registered with the Securities
and Futures Commission (“SFC”) to carry on Type 1 (dealing in securities), Type 4 (advising on securities), Type 6 (advising on
corporate finance) and Type 9 (asset management) regulated activity under the Securities and Futures Ordinance (Cap. 571)
(“SFO”) (CE No. AJI614). The contents of this document have not been reviewed by any regulatory authority in Hong Kong and
you are advised to exercise caution in relation to any offer set out herein. If you are in doubt about any of the contents of this
document, you should obtain independent professional advice. Any product named herein may not be offered or sold in Hong
Kong by means of any document at any time other than to “professional investors” as defined in the SFO and any rules made
under that ordinance. In addition, this document may not be issued or possessed for the purposes of issue, whether in Hong
Kong or elsewhere, and any interests may not be disposed of, to any person unless such person is outside Hong Kong or is a
“professional investor” as defined in the SFO and any rules made under that ordinance, or as otherwise may be permitted by
that ordinance. In Hong Kong, Standard Chartered Private Bank is the private banking division of Standard Chartered Bank
(Hong Kong) Limited. Ghana: Standard Chartered Bank Ghana Limited accepts no liability and will not be liable for any loss or
damage arising directly or indirectly (including special, incidental or consequential loss or damage) from your use of these
documents. Past performance is not indicative of future results and no representation or warranty is made regarding future
performance. You should seek advice from a financial adviser on the suitability of an investment for you, taking into account
these factors before making a commitment to invest in an investment. To unsubscribe from receiving further updates, please
click here. Please do not reply to this email. Call our Priority Banking on 0302610750 for any questions or service queries. You
are advised not to send any confidential and/or important information to the Bank via e-mail, as the Bank makes no
representations or warranties as to the security or accuracy of any information transmitted via e-mail. The Bank shall not be
responsible for any loss or damage suffered by you arising from your decision to use e-mail to communicate with the Bank.
India: This document is being distributed in India by Standard Chartered Bank in its capacity as a distributor of mutual funds and
referrer of any other third party financial products. Standard Chartered Bank does not offer any ‘Investment Advice’ as defined
in the Securities and Exchange Board of India (Investment Advisers) Regulations, 2013 or otherwise. Services/products related
securities business offered by Standard Charted Bank are not intended for any person, who is a resident of any jurisdiction, the
laws of which imposes prohibition on soliciting the securities business in that jurisdiction without going through the registration
requirements and/or prohibit the use of any information contained in this document. Indonesia: This document is being
distributed in Indonesia by Standard Chartered Bank, Indonesia branch, which is a financial institution licensed, registered and
supervised by Otoritas Jasa Keuangan (Financial Service Authority). Jersey: In Jersey, Standard Chartered Private Bank is the
Registered Business Name of the Jersey Branch of Standard Chartered Bank. The Jersey Branch of Standard Chartered Bank
is regulated by the Jersey Financial Services Commission. Copies of the latest audited accounts of Standard Chartered Bank
are available from its principal place of business in Jersey: PO Box 80, 15 Castle Street, St Helier, Jersey JE4 8PT. Standard
Chartered Bank is incorporated in England with limited liability by Royal Charter in 1853 Reference Number ZC 18. The Principal
Office of the Company is situated in England at 1 Basinghall Avenue, London, EC2V 5DD. Standard Chartered Bank is authorised
by the Prudential Regulation Authority and regulated by the Financial Conduct Authority and Prudential Regulation Authority.
The Jersey Branch of Standard Chartered Bank is also an authorised financial services provider under license number 44946
issued by the Financial Sector Conduct Authority of the Republic of South Africa. Jersey is not part of the United Kingdom and
all business transacted with Standard Chartered Bank, Jersey Branch and other SC Group Entity outside of the United Kingdom,
are not subject to some or any of the investor protection and compensation schemes available under United Kingdom law.
Kenya: This document is being distributed in Kenya by, and is attributable to Standard Chartered Bank Kenya Limited.
Investment Products and Services are distributed by Standard Chartered Investment Services Limited, a wholly owned subsidiary
of Standard Chartered Bank Kenya Limited (Standard Chartered Bank/the Bank) that is licensed by the Capital Markets Authority
as a Fund Manager. Standard Chartered Bank Kenya Limited is regulated by the Central Bank of Kenya. Malaysia: This
document is being distributed in Malaysia by Standard Chartered Bank Malaysia Berhad. Recipients in Malaysia should contact
Standard Chartered Bank Malaysia Berhad in relation to any matters arising from, or in connection with, this document. Nigeria:
This document is being distributed in Nigeria by Standard Chartered Bank Nigeria Limited, a bank duly licensed and regulated
by the Central Bank of Nigeria. Pakistan: This document is being distributed in Pakistan by, and attributable to Standard
Chartered Bank (Pakistan) Limited having its registered office at PO Box 5556, I.I Chundrigar Road Karachi, which is a banking
company registered with State Bank of Pakistan under Banking Companies Ordinance 1962 and is also having licensed issued
by Securities & Exchange Commission of Pakistan for Security Advisors. Standard Chartered Bank (Pakistan) Limited acts as a
distributor of mutual funds and referrer of other third party financial products.
Singapore: This document is being distributed in Singapore by, and is attributable to, Standard Chartered Bank (Singapore)
Limited (Registration No. 201224747C/ GST Group Registration No. MR-8500053-0, “SCBSL”). Recipients in Singapore should
contact SCBSL in relation to any matters arising from, or in connection with, this document. SCBSL is an indirect wholly-owned
subsidiary of Standard Chartered Bank and is licensed to conduct banking business in Singapore under the Singapore Banking
Act, Chapter 19. Standard Chartered Private Bank is the private banking division of SCBSL. IN RELATION TO ANY SECURITY
23
OR SECURITIES-BASED DERIVATIVES CONTRACT REFERRED TO IN THIS DOCUMENT, THIS DOCUMENT, TOGETHER
WITH THE ISSUER DOCUMENTATION, SHALL BE DEEMED AN INFORMATION MEMORANDUM (AS DEFINED IN
SECTION 275 OF THE SECURITIES AND FUTURES ACT, CHAPTER 289 (“SFA”)). THIS DOCUMENT IS INTENDED FOR
DISTRIBUTION TO ACCREDITED INVESTORS, AS DEFINED IN SECTION 4A(1)(a) OF THE SFA, OR ON THE BASIS THAT
THE SECURITY OR SECURITIES-BASED DERIVATIVES CONTRACT MAY ONLY BE ACQUIRED AT A CONSIDERATION
OF NOT LESS THAN S$200,000 (OR ITS EQUIVALENT IN A FOREIGN CURRENCY) FOR EACH TRANSACTION. Further,
in relation to any security or securities-based derivatives contract, neither this document nor the Issuer Documentation has been
registered as a prospectus with the Monetary Authority of Singapore under the SFA. Accordingly, this document and any other
document or material in connection with the offer or sale, or invitation for subscription or purchase, of the product may not be
circulated or distributed, nor may the product be offered or sold, or be made the subject of an invitation for subscription or
purchase, whether directly or indirectly, to persons other than a relevant person pursuant to section 275(1) of the SFA, or any
person pursuant to section 275(1A) of the SFA, and in accordance with the conditions specified in section 275 of the SFA, or
pursuant to, and in accordance with the conditions of, any other applicable provision of the SFA. In relation to any collective
investment schemes referred to in this document, this document is for general information purposes only and is not an offering
document or prospectus (as defined in the SFA). This document is not, nor is it intended to be (i) an offer or solicitation of an
offer to buy or sell any capital markets product; or (ii) an advertisement of an offer or intended offer of any capital markets product.
Deposit Insurance Scheme: Singapore dollar deposits of non-bank depositors are insured by the Singapore Deposit Insurance
Corporation, for up to S$75,000 in aggregate per depositor per Scheme member by law. Foreign currency deposits, dual currency
investments, structured deposits and other investment products are not insured. Taiwan: Standard Chartered Bank (“SCB”) or
Standard Chartered Bank (Taiwan) Limited (“SCB (Taiwan)”) may be involved in the financial instruments contained herein or
other related financial instruments. The author of this document may have discussed the information contained herein with other
employees or agents of SCB or SCB (Taiwan). The author and the above-mentioned employees of SCB or SCB (Taiwan) may
have taken related actions in respect of the information involved (including communication with customers of SCB or SCB
(Taiwan) as to the information contained herein). The opinions contained in this document may change, or differ from the opinions
of employees of SCB or SCB (Taiwan). SCB and SCB (Taiwan) will not provide any notice of any changes to or differences
between the above-mentioned opinions. This document may cover companies with which SCB or SCB (Taiwan) seeks to do
business at times and issuers of financial instruments. Therefore, investors should understand that the information contained
herein may serve as specific purposes as a result of conflict of interests of SCB or SCB (Taiwan). SCB, SCB (Taiwan), the
employees (including those who have discussions with the author) or customers of SCB or SCB (Taiwan) may have an interest
in the products, related financial instruments or related derivative financial products contained herein; invest in those products at
various prices and on different market conditions; have different or conflicting interests in those products. The potential impacts
include market makers’ related activities, such as dealing, investment, acting as agents, or performing financial or consulting
services in relation to any of the products referred to in this document. UAE: DIFC - Standard Chartered Bank is incorporated in
England with limited liability by Royal Charter 1853 Reference Number ZC18.The Principal Office of the Company is situated in
England at 1 Basinghall Avenue, London, EC2V 5DD. Standard Chartered Bank is authorised by the Prudential Regulation
Authority and regulated by the Financial Conduct Authority and Prudential Regulation Authority. Standard Chartered Bank, Dubai
International Financial Centre having its offices at Dubai International Financial Centre, Building 1, Gate Precinct, P.O. Box 999,
Dubai, UAE is a branch of Standard Chartered Bank and is regulated by the Dubai Financial Services Authority (“DFSA”). This
document is intended for use only by Professional Clients and is not directed at Retail Clients as defined by the DFSA Rulebook.
In the DIFC we are authorised to provide financial services only to clients who qualify as Professional Clients and Market
Counterparties and not to Retail Clients. As a Professional Client you will not be given the higher retail client protection and
compensation rights and if you use your right to be classified as a Retail Client we will be unable to provide financial services
and products to you as we do not hold the required license to undertake such activities. For Islamic transactions, we are acting
under the supervision of our Shariah Supervisory Committee. Relevant information on our Shariah Supervisory Committee is
currently available on the Standard Chartered Bank website in the Islamic banking section at:
https://www.sc.com/en/banking/islamic-banking/http://www.standardchartered.com/en/banking-services/islamic-
banking/shariah-supervisory-committee.html. UAE: For residents of the UAE – Standard Chartered Bank UAE does not provide
financial analysis or consultation services in or into the UAE within the meaning of UAE Securities and Commodities Authority
Decision No. 48/r of 2008 concerning financial consultation and financial analysis. Uganda: Our Investment products and
services are distributed by Standard Chartered Bank Uganda Limited, which is licensed by the Capital Markets Authority as an
investment adviser. United Kingdom: Standard Chartered Bank (trading as Standard Chartered Private Bank) is an authorised
financial services provider (license number 45747) in terms of the South African Financial Advisory and Intermediary Services
Act, 2002. Vietnam: This document is being distributed in Vietnam by, and is attributable to, Standard Chartered Bank (Vietnam)
Limited which is mainly regulated by State Bank of Vietnam (SBV). Recipients in Vietnam should contact Standard Chartered
Bank (Vietnam) Limited for any queries regarding any content of this document. Zambia: This document is distributed by
Standard Chartered Bank Zambia Plc, a company incorporated in Zambia and registered as a commercial bank and licensed by
the Bank of Zambia under the Banking and Financial Services Act Chapter 387 of the Laws of Zambia.
Related Documents