Wealth Management Advisory Global Market Outlook | 31 August 2017 This reflects the views of the Wealth Management Group 1 Fundamentals over event risks Any equity market pullback in the coming months is likely to be limited in size and length. While near-term technical indicators are soft and event risks loom, fundamentals remain strong. We continue to expect a gradual pivot to reflation where growth remains robust and inflation pressures rise only slowly. We prefer Euro area and Asia ex-Japan markets. We prefer a balanced multi-asset strategy that favours equities over corporate bonds. However, limited inflation and capped bond yields mean the environment also remains supportive of multi-asset income strategies. Temporary USD bounce expected. The USD looks oversold and could bounce in the short term. However, longer-term drivers argue for a range- bound to bearish USD outlook. This view is key to our preference for Emerging Market government bonds (USD and local currency) and Asia ex- Japan equities. Global Market Outlook

Welcome message from author
This document is posted to help you gain knowledge. Please leave a comment to let me know what you think about it! Share it to your friends and learn new things together.
Transcript

Wealth Management Advisory
Global Market Outlook | 31 August 2017
This reflects the views of the Wealth Management Group 1
Fundamentals over
event risks
Any equity market pullback in the
coming months is likely to be
limited in size and length. While
near-term technical indicators are soft
and event risks loom, fundamentals
remain strong. We continue to expect a
gradual pivot to reflation where growth
remains robust and inflation pressures
rise only slowly. We prefer Euro area
and Asia ex-Japan markets.
We prefer a balanced multi-asset
strategy that favours equities over
corporate bonds. However, limited
inflation and capped bond yields
mean the environment also remains
supportive of multi-asset income
strategies.
Temporary USD bounce expected.
The USD looks oversold and could
bounce in the short term. However,
longer-term drivers argue for a range-
bound to bearish USD outlook. This
view is key to our preference for
Emerging Market government bonds
(USD and local currency) and Asia ex-
Japan equities.
Global Market Outlook

This reflects the views of the Wealth Management Group 2
Standard Chartered Bank
Global Market Outlook | 31 August 2017
Contents
Highlights
p1
Fundamentals over event risks
Strategy
p3
Investment strategy
Perspectives
p7 p10
Perspectives on key client questions Macro overview
Asset classes
p13 p20 p22 p25
Bonds ESG Investing Commodities Foreign exchange
p16 p21 p24 p28
Equities Equity derivatives Alternative strategies Multi-asset
Performance review
p31 p32
Market performance summary Events calendar
Performance review
p33 p35
Wealth management advisory publications Disclosure appendix
p34
The team
This reflects the views of the Wealth Management Group 3
Standard Chartered Bank
Global Market Outlook | 31 August 2017
Investment strategy
Prefer equities
over bonds,
including corporate
bonds
Prefer Euro area,
Asia ex-Japan
equities and EM
government bonds
Balanced
strategies are likely
to offer the most
attractive
risk/reward
Fundamentals over event risks
• Any equity market pullback in the coming months is likely to be limited in size and
length. Near-term technical indicators are soft and event risks loom, but
fundamentals remain strong. We expect a gradual pivot to reflation where growth
remains robust and inflation pressures rise slowly. We prefer Euro area and Asia
ex-Japan markets.
• We prefer a balanced multi-asset strategy that favours equities over corporate
bonds. However, limited inflation and capped bond yields mean the environment
also remains supportive of multi-asset income strategies.
• Temporary USD bounce expected. The USD looks oversold and could bounce in
the short term. However, longer-term drivers argue for a range-bound to bearish
USD outlook. This is key to our preference for Emerging Market (EM) government
bonds (USD and local currency) and Asia ex-Japan equities.
Volatility increases, especially in Developed Markets
A modest turn higher in volatility across equity, bond and FX markets characterised the
past month. This was more pronounced in Developed Markets (DMs), with US and Euro
area equities falling modestly ahead of key central bank events. However, EM equities
continued to deliver quite strong returns, both in Asia and elsewhere.
This mixed market performance comes against an unchanged macro backdrop, in our
view. Conversations regarding central banks continue to centre around reducing
accommodative policies (how much in the US, when to start in the Euro area). However,
given still-modest inflation, we expect this process to remain gradual.
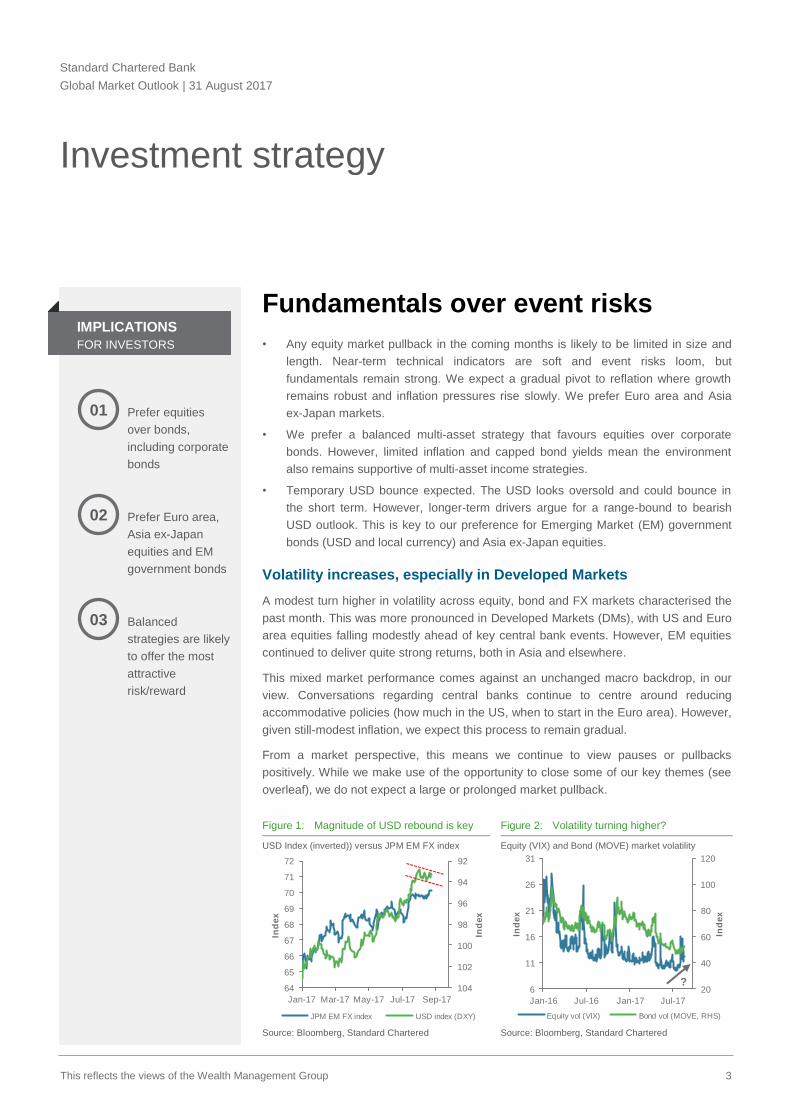
From a market perspective, this means we continue to view pauses or pullbacks
positively. While we make use of the opportunity to close some of our key themes (see
overleaf), we do not expect a large or prolonged market pullback.
Figure 1: Magnitude of USD rebound is key Figure 2: Volatility turning higher?
USD Index (inverted)) versus JPM EM FX index Equity (VIX) and Bond (MOVE) market volatility
Source: Bloomberg, Standard Chartered Source: Bloomberg, Standard Chartered
92
94
96
98
100
102
10464
65
66
67
68
69
70
71
72
Jan-17 Mar-17 May-17 Jul-17 Sep-17
Ind
ex
Ind
ex
JPM EM FX index USD index (DXY)
20
40
60
80
100
120
6
11
16
21
26
31
Jan-16 Jul-16 Jan-17 Jul-17
Ind
ex
Ind
ex
Equity vol (VIX) Bond vol (MOVE, RHS)
?
03
02
01
IMPLICATIONS
FOR INVESTORS

This reflects the views of the Wealth Management Group 4
Standard Chartered Bank
Global Market Outlook | 31 August 2017
Are we set for an equity market correction?
A search for potential sources of a deeper correction throws
up three candidates. First, near-term technical indicators are
tepid at best. The S&P 500 is still attempting to rebound back
above its 50-day moving average while the Euro Stoxx 600
(in EUR terms) has tentatively dipped below its 200-day
moving average, a key technical support. Second, several
event risks loom – the possibility that the ECB will start
ending ultra-loose policy, Trump’s renewed trade war
threats, the US debt ceiling stand-off, and rising geopolitical
threats (eg, Korea). Third, a gradual revival of inflation
expectations, especially in the US, could drive bond yields
higher, making them more competitive versus equities. This
could also revive the USD, posing a threat to EM inflows.
However, the positive case remains strong. Revenue and
earnings growth continues to surprise positively in major
markets, supporting high market valuations. Capped bond
yields and only gradual policy tightening have provided a
favourable backdrop and market momentum remains strong,
particularly in EMs.
We remain of the view that any pullback is likely to be limited
in magnitude and length. It would likely take a significant
escalation of risk events to pull equity markets sharply lower
against what are still extremely supportive fundamentals, in
our opinion. From a multi-asset perspective, this is also why
we continue to favour balanced strategies over income
strategies from a total return perspective.
Figure 3: EM equity market momentum strong, but some DMs,
especially Euro area, testing key support
Major equity indices, distance from 200-day moving average (%)
Source: Bloomberg, Standard Chartered
USD rebound a risk to EM assets
An excessively oversold USD means a modest rebound is
possible in the short term. A larger-than-expected extension
of such a rebound poses a risk to our positive views on EM
USD and local currency bonds, our two most preferred
areas. However, we do not believe this is likely, especially
given our range-bound to bearish long-term view on the USD
amid a lack of further domestic catalysts.
More broadly, we are mindful that income strategies have
also pulled back previously during periods of risk aversion.
However, as with equities, we believe the fundamental
environment remains supportive of income assets. While an
equity market pullback would have a negative impact on
returns in the equity component of multi-asset income
strategies, we continue to believe that limited inflation and a
gradual approach to raising policy rates in the US, and
eventually in the Euro area, are likely to provide a supportive
backdrop for multi-asset income strategies.
Closing three views
First, we have closed our bullish EUR/USD view. This has
delivered over 8% absolute returns since we initiated in April.
We maintain our positive long-term view on the EUR, given
that we expect the ECB to initiate the end of ultra-loose
policy soon. However, limited room for near-term surprises
and rising technical headwinds mean this is a good time to
lock in profit, while potentially awaiting a better entry level.
Second, we have closed our view expecting the BRL, RUB,
INR and IDR to collectively outperform the broader EM
currency universe. While this has done well in delivering
positive absolute returns, the broader EM basket continues
to do better still. Our comfort level with EM currencies
remains intact, but we are increasingly of the view that EM
local currency bonds offer a better way to gain exposure than
a simple currency basket.
Third, we have closed our bullish macro view on Brent crude
oil. To be clear, this does not mean we are turning bearish;
indeed, our view remains one of flat-to-gradually-higher
prices over time. However, the process of rebalancing is
taking longer than we expected; hence, we are taking
advantage of recent higher prices to close it at a small ‘loss’.
-2%
0%
2%
4%
6%
8%
10%
12%
MSCI EM MSCI World
(DM)
S&P500 MSCI Japan Euro Stoxx
600
200DMA

This reflects the views of the Wealth Management Group 5
Standard Chartered Bank
Global Market Outlook | 31 August 2017
Figure 4: Our Tactical Asset Allocation views (12M) USD
Asset class Sub-asset class Relative outlook Rationale
Multi-asset Strategies
Multi-asset Income Low policy rates, low absolute yields expected to remain a support
Multi-asset Macro Reduced need for insurance-like assets amid continued growth
Equities
Euro area
Earnings expectations soften, but from strong levels; Valuations modest; Currency gains not a major risk yet
Asia ex-Japan Earnings uptick positive; Valuations reasonable; Trade tensions long-term risk
Non-Asia EM Commodities key to earnings; Valuations mixed; Flows positive; Politics a risk
Japan JPY key to earnings; Valuations reasonable, but risk of extreme move is high
US Earnings focus shifts to potential tax reforms; Margins and valuations are risks
UK Brexit talks cloud earnings outlook; Full valuations; GBP rebound a risk
Bonds
EM government (USD) Attractive yield; Reasonable valuations; High rate sensitivity, USD are risks
EM government (local currency) Attractive yield; USD less of a headwind; Currency volatility is a risk
Asian USD bonds Moderate yield; Reasonable valuations; Demand/supply favourable
DM HY corporate Attractive yield; Declining default rates; Expensive valuation
DM IG corporate Moderate yield; Full valuations; Defensive characteristics
DM government Low yield; Full valuations; Fed policy, higher inflation, yield rebound are risks
Currencies
EUR Economic momentum supports ECB stimulus withdrawal
USD Policy divergence diminishing; other central banks turning more hawkish
GBP Political and policy uncertainty to weigh in; likely to remain range-bound
EM currencies Low volatility, range-bound USD and stable China to remain supportive
AUD Central bank likely to maintain policy for now, but risk sentiment supportive
JPY USD/JPY remains tied to US 10-year yields, which we expect to rise gradually
Source: Standard Chartered Global Investment Committee
Legend: Overweight Neutral Underweight

This reflects the views of the Wealth Management Group 6
Standard Chartered Bank
Global Market Outlook | 31 August 2017
Figure 5: Performance of key #pivot? themes since Outlook 2017
Key themes (12 months) Date open Absolute Relative
Balanced allocation to outperform multi-asset income allocation[6]
15-Dec-16 ‒
Multi-asset income allocation to deliver positive absolute return[5]
15-Dec-16 ‒
Alternative strategies allocation to deliver positive absolute returns[3]
15-Dec-16 ‒
Key Asset Allocation Calls (12 months) Date open Absolute Relative
Corporate Bonds to outperform Government Bonds[1]
15-Dec-16 ‒
EM USD government bonds to outperform broader bond universe 26-May-17 ‒
EM LC government bonds to outperform broader bond universe 23-Jun-17 ‒
Europe ex UK to outperform global equities 24-Feb-17 ‒
Asia ex-Japan to outperform global equities 30-Mar-17 ‒
China to outperform Asia ex Japan equities 24-Feb-17 ‒
Korea to outperform Asia ex Japan equities 23-Jun-17 ‒
Absolute return calls (Less than 12 months) Date open Absolute Relative
Bullish USD/JPY 30-Jun-17 ‒
Bullish Euro area bank sector equities 28-Apr-17 ‒
Bullish US floating rate senior loans 15-Dec-16 ‒
Closed calls (Less than 12 months) Date open Absolute Relative
BRL, RUB, IDR and INR basket[4]
to outperform EM FX Index (as of 24-08-2017) 15-Dec-16 ‒
Bullish EUR/USD (as of 24-08-2017) 28-Apr-17 ‒
Bullish Brent crude oil price (as of 24-08-2017) 15-Dec-16 ‒
Bullish Korea equities (as of 10-08-2017) 5-May-17 NA
Bearish AUD/USD (as of 21-07-2017) 30-Jun-17 NA
US Technology to deliver positive returns and outperform US equities (as of 23-06-2017) 15-Dec-16
‘New China’ equities to deliver positive returns (as of 09-06-2017) [2]
15-Dec-16 NA
Positive USD/CNY (as of 02-06-2017) 15-Dec-16 NA
DM HY Bonds to outperform broader bond universe (as of 25-05-2017) 15-Dec-16 NA
India to deliver positive returns and outperform Asia ex Japan equities (as of 25-05-2017) 15-Dec-16
Japan (FX-hedged) to deliver positive returns and outperform global equities (as of 27-04-2017) 15-Dec-16
US Small Cap to deliver positive returns and outperform US equities (as of 27-04-2017) 15-Dec-16
Indonesia to deliver positive returns and outperform Asia ex Japan equities (as of 27-04-2017) 15-Dec-16
US equities to deliver positive returns and outperform global equities (as of 30-03-2017) 15-Dec-16
Negative EUR/USD (as of 17-02-2017) 15-Dec-16 NA
Positive AUD/USD (as of 17-02-2017) 15-Dec-16 NA
Source: Bloomberg, Standard Chartered
Performance measured from date of view being opened to 30 August 2017 or when the view was closed [1] A custom-made composite of 44% Citi WorldBIG Corp Index Currency
Hedged USD and 56% Bloomberg Barclays Global High Yield Total Return Index [2] ‘New China’ index is a custom-made market-cap-weighted index of the following MSCI
China industry groups: pharmaceuticals, biotech and life sciences, healthcare equipment and services, software and services, retailing, telco services and consumer services
[3] Alternative strategies allocation is described in ‘Outlook 2017: #pivot’, Figure 13, page 36 [4] A custom-made equally weighted index of the BRL, RUB, IDR and INR currencies
[5] Income allocation is as described in our H2 Outlook, Should I stay, or…?, 30 June 2017, page30
[6] Balanced allocation as described our Global Market Outlook, Fresh opportunities to pivot, 31 March 2017, page 28
- Correct call; - Missed call; NA - Not Applicable
Past performance is not an indication of future performance. There is no assurance, representation or prediction given as to any results or returns that would actually be achieved in a transaction based on any historical data.

This reflects the views of the Wealth Management Group 7
Standard Chartered Bank
Global Market Outlook | 31 August 2017
Perspectives
on key client questions
How are your economic scenarios evolving?
We have not made major changes to our economic scenarios since our Outlook 2017
was released in December last year. If anything, the outlook has slightly improved, with
inflation being weaker than expected amid acceleration in growth – the so-called
‘Goldilocks’ pivot, or transition, from ‘muddle-through’ to ‘reflation’.
Looking forward, we still
expect a modest pick-up
in inflation. While the
Phillips curve – the
theoretical relationship
between falling
unemployment and
rising wage pressures –
is clearly not a precise
tool when forecasting
future inflation, we do
believe the underlying
theory behind the
relationship is valid. As
unemployment falls, the
risk of inflation picking up increases, although the timing and extent of this acceleration
remains highly uncertain.
Therefore, we expect more and more central banks to focus on removing some of the
monetary accommodation that has been in place following the global financial crisis of
2007-2008. The central scenario is that this is likely to be a gradual process that gives
ample time to markets to digest with limited volatility. However, there are always risks to
this scenario.
Will equity markets continue to rally from here?
We have become a little less constructive on the near-term outlook for equity markets.
Following are the three main reasons for this:
1. Inflation expectations to rise: We expect inflation expectations to rise somewhat in
the coming months. At some level, this may be reassuring, but it is also likely to put
gradual upward pressure on bond yields, increasing their competitive positioning
relative to equities.
Figure 6: Economic outlook remains constructive
Goldilocks has been the best of both worlds – accelerating growth and declining inflation expectations
Source: Bloomberg, Standard Chartered
Muddle-through
10% 40% 10%35%
Gro
wth
Go
ldilo
ck
s
Too cold Reflation Too hot

This reflects the views of the Wealth Management Group 8
Standard Chartered Bank
Global Market Outlook | 31 August 2017
2. Increasing event risks: We are seeing an increase in
possible event risks, such as the tensions between the
US and North Korea, the US debt ceiling debate and the
US’s more confrontational approach on trade issues with
China and Mexico.
3. Technical picture: The technical picture for US equities
has deteriorated. While other markets have held up so
far, including Euro area equities in USD terms, should
the US see a further break lower, it will become
increasingly difficult for other markets to shrug off this
negative performance.
The above factors may cause some indigestion for equity
markets in the coming 1-3 months. However, we do not
believe they will be sufficient to derail the bull market for
global equities. Moreover, we doubt that any pullback will be
prolonged. Therefore, we prefer to ride out the potential
volatility and, for those who are under-exposed to equities,
we would take a dollar-cost averaging approach to equity
investments, accelerating purchases on any weakness.
Are Euro area equities likely to outperform?
Euro area equities have held up well in USD terms in recent
times with EUR strength offsetting recent weakness in the
equity market’s local currency performance. Given that we
have closed our bullish EUR stance (see the next question),
this naturally leads to the question of whether this situation
will reverse and, if so, will EUR weakness or local currency
price appreciation dominate.
Over the longer term, we expect Euro area equities to
continue outperforming. While earnings expectations have
been undermined slightly by EUR strength in the past 2-3
months (see page 17), we see the longer-term drivers as
being supportive, especially if the EUR does not strengthen
too dramatically. The domestic earnings drivers remain
strong and the recovery in Emerging Market (EM)
economies are also supportive of Euro area exports.
From a short-term perspective, it is interesting to note that
Euro area stock market indices are sitting just above key
supports. Therefore, absent a significant shake out in US
markets, we could see the situation of the past few months
reverse, with equity market gains being mitigated somewhat
by EUR losses.
Figure 7: Euro area equities close to key support in EUR terms
MSCI Europe ex-UK index in EUR and USD terms
Source: Bloomberg, Standard Chartered
Do you expect further EUR strength?
Since we initiated our bullish EUR/USD call (28 April 2017),
the currency pair rallied 8.5% before we closed it (25 August
2017). There are three reasons why we closed the trade.
1. Central bank expectations: While monetary policy
divergence has become too extreme over the longer
term, we believe, in the short term the market may be
pricing in too little tightening from the Fed and too much
from the ECB.
For the latter, the EUR strength itself could be a factor to
delay any tapering of quantitative easing. As this
adjusts, it could put downward pressure on EUR/USD.
This is supported by the fact that US economic surprises
are recovering sharply from low levels.
2. Technicals – The USD (DXY) index is close to a key
support. Given the EUR’s high weight in this index, it is
difficult to see the EUR weakening significantly if the
USD were to bounce temporarily.
3. Positioning – Speculators already have huge long EUR
positions, which means the risk-reward is skewed
towards more selling interest should Euro area data or
the ECB disappoints (on rolling back its monetary
stimulus).
90
95
100
105
110
115
120
125
Aug-16 Oct-16 Dec-16 Feb-17 Apr-17 Jun-17 Aug-17
Ind
exe
d (1
00 =
Au
gu
st
201
6)
EUR USD

This reflects the views of the Wealth Management Group 9
Standard Chartered Bank
Global Market Outlook | 31 August 2017
As you can see, the above are short-term factors that could
undermine the EUR’s performance in the coming 1-3
months. Over a longer-time horizon, we continue to believe
that the EUR/USD cross will not revisit its lows (sub-1.05)
and is likely to ultimately break higher still.
Are you worried about the US debt ceiling debate?
There are three main scenarios regarding the debt ceiling:
1. The ceiling is raised without an interruption to
government services or a technical default on the
government’s obligations.
2. A short-lived government shutdown, but no technical
default on the government’s obligations. It is estimated
that this would occur at the end of September, should no
deal be reached by then.
3. A government shutdown is followed by a technical
default on the government’s obligations, but this is
quickly rectified. According to estimates, in the absence
of a deal, the government will run out of money to pay its
obligations sometime between the middle and end of
October.
We would rank the likelihood of these scenarios playing out
in the above order, with the central scenario being that a
deal is reached prior to the government shutting down. With
the White House, House of Representatives and the Senate
all being controlled by the Republicans, it would be
politically damaging for the ruling party not to reach an
agreement that avoids the last two scenarios, especially the
last.
That said, there is still likely to be some brinkmanship and
‘#twittership’ before a deal is reached, with the president
unlikely to quietly accept he is not going to get the money to
‘build that wall’. This could prove critical when it comes to
short-term market implications.
While we have seen some increase in market volatility
recently, a government shutdown is likely not priced in. The
global equity market and the S&P 500 are approximately
just 1% from their recent highs.
This is because almost everybody’s central scenario is a
deal will be reached. However, with posturing and rhetoric
likely to become more extreme before a deal is reached, it
would be normal for markets to get nervous about the
outcome in the coming weeks. This is one potential source
of short-term market weakness, but we view this as a
buying opportunity for investors who are still under-exposed
to global equities, particularly the Euro area and the Asia
ex-Japan region.
Figure 8: DXY approaching key support
EUR/USD and the USD (DXY) index (inverted)
Source: Bloomberg, Standard Chartered
1.0
1.0
1.1
1.1
1.2
1.2
86
88
90
92
94
96
98
100
102
104
Jan-15 Sep-15 May-16 Jan-17 Sep-17
EU
R/U
SD
Ind
ex
USD index EUR/USD (RHS, inverted)

This reflects the views of the Wealth Management Group 10
Standard Chartered Bank
Global Market Outlook | 31 August 2017
Macro overview
The Fed is likely to
raise rates two
more times over
the next 12 months
The ECB is likely
to taper policy
stimulus in the next
12 months; the
BoJ to stay on hold
for now
China could tighten
monetary policy
further and use
fiscal/credit
stimulus to support
growth
Broadening growth
• Core scenario: A pick-up in economic activity in the US, Euro area and Japan is
setting the stage for a synchronised global expansion, initially driven by Asia ex-
Japan and some Emerging Markets. Inflation is likely to rise only gradually.
• Policy outlook: We expect the Fed to gradually tighten monetary policy, including
starting to reduce its balance sheet in Q3 17. The ECB is likely to start withdrawing
stimulus in 2018, while China gradually tightens monetary policy.
• Key risks: a) Tighter monetary policy caused by an inflation surprise (in the US and
the Euro area) or greater focus on financial stability (in China); b) US/Euro area
politics, geopolitics in North Asia; c) deflation shock from a slowdown in China.
Synchronised expansion
We continue to assign a 75% probability to either ‘reflation’ or ‘muddle-through’
scenarios over the next 12 months. For the first time since the 2008 financial crisis, we
are seeing broad-based expansion in economic activity across the Developed (DMs)
and Emerging Markets (EMs). This, combined with continued benign inflation, has raised
the prospects of a longer-than-usual business cycle. Inflationary or deflationary
downside remains outside risks (at 15% and 10%, respectively) to this scenario, given
tightening job markets in DMs and China’s increased focus on financial stability. Politics
in the US and Europe (especially in Italy) and geopolitical and trade tensions around
North Asia are other risks.
Figure 9: Euro area and Japan joined the US and EMs in lifting global growth outlook
Region Growth Inflation
Benchmark
rates
Fiscal
deficit Comments
US
Strong job market continues to fuel growth, but
fails to lift inflation. Focus now shifts to tax
reforms. The Fed to gradually tighten policy
Euro
area
Growth expectations continue to be revised
higher, although inflation remains tepid. The
ECB may start withdrawing stimulus in 2018
UK
Growth outlook weakens as rising inflation,
slowing wages hurt consumption. Brexit talks
remain a key risk. The BoE may tolerate inflation
Japan
Growth upgrades continue as consumption
emerged as a growth driver. BoJ to maintain easy
monetary policy as deflationary pressures remain
Asia ex-
Japan
After a strong H1, China to balance growth
agenda with greater focus on financial stability
EM ex-
Asia
Brazil and Russia emerge from recession
although politics remains a risk in Brazil. Falling
inflation supports further central bank easing
Source: SCB Global Investment Committee
Legend: Supportive of risk assets Neutral Not supportive of risk assets
03
02
01
IMPLICATIONS
FOR INVESTORS

This reflects the views of the Wealth Management Group 11
Standard Chartered Bank
Global Market Outlook | 31 August 2017
US – focus turns to tax cut, Fed balance sheet
Tax reforms to drive growth/policy agenda near term. US
economic growth appears to have modestly accelerated from
its post-crisis trend and economic surprises are turning less
negative as a tight job market continues to fuel consumption.
President Trump’s renewed focus on tax reforms (we expect
modest tax cuts), if successful, could lift consumption further,
potentially extending the business cycle. We expect the US
debt ceiling to be raised, despite the current partisan debate.
Fed to start tightening balance sheet. The inflation outlook
has weakened further, but we expect it to rise modestly in
the coming months. The Fed is likely to continue with its plan
to gradually tighten monetary policy as it seeks to pre-empt
financial stability risks caused by easy financial conditions.
We expect it to start reducing its balance sheet this year.
Euro area – growth upgrades continue
Growth picks up in southern Europe. The Euro area has
seen broad-based growth upgrades, with economic activity
accelerating in Italy in the recent months. While German
economic activity appears to have peaked, a substantial
slack remains across southern Europe, which should keep
wages and inflation subdued.
Gradual withdrawal of ECB stimulus. We expect the ECB
to start tapering its bond purchases in 2018, given still-low
inflation and the slack in southern Europe (a plan may be
unveiled this year). The ECB is likely to weigh against
excessive EUR strength as that could undermine the
recovery to some extent.
UK – inflation hurting purchasing power
Consumption takes a hit. UK growth expectations
continued to be downgraded as the consumer-driven
economy faces headwinds from slowing wage growth and
rising inflation. The slow-paced, ongoing Brexit talks are also
likely to weigh on business confidence in the coming months,
hurting growth.
BoE on hold for now. The central bank is likely to look
through the rise in near-term inflation as it expects growth to
slow down amid falling real income and Brexit-related risks.
Figure 10: US activity indicators appear to have peaked; tax cuts
could help extend the ongoing expansion
US manufacturing and services sector indicators; core personal consumption expenditure deflator, %, y/y (RHS)
Source: Bloomberg, Standard Chartered
Figure 11: Euro area growth expectations continue to be revised
higher, helped by growth upgrades across the region
Euro area consensus GDP growth expectations for 2017 and 2018, %, y/y
Source: Bloomberg, Standard Chartered
Figure 12: UK’s consumption and business sentiment have started
to trend lower amid growing Brexit-related risks
UK business barometer; retail sales growth, ex-auto fuel, % y/y (RHS)
Source: Bloomberg, Standard Chartered
0.0
0.5
1.0
1.5
2.0
2.5
45
50
55
60
Aug-11 Feb-13 Aug-14 Feb-16 Aug-17
% y
/y
Ind
ex
ISM manufacturing ISM non-manufacturing
Core PCE deflator (RHS)
1.0
1.2
1.4
1.6
1.8
2.0
2.2
Aug-16 Oct-16 Dec-16 Feb-17 Apr-17 Jun-17 Aug-17
% y
/y
Consensus GDP 2017 Consensus GDP 2018
-4
-2
0
2
4
6
8
10
-20
0
20
40
60
80
Aug-11 Feb-13 Aug-14 Feb-16 Aug-17
Ind
ex
% y
/y
Lloyds Bank Business Barometer Retail sales ex-auto fuel (RHS)

This reflects the views of the Wealth Management Group 12
Standard Chartered Bank
Global Market Outlook | 31 August 2017
Japan – domestic consumption picks up
Consumers fuel growth. Japan recorded the fastest growth
among G7 economies in Q2 as consumption and investment
emerged as drivers of growth amid record low borrowing
costs, low oil prices and the impact of last year’s fiscal
stimulus. While growth should taper off in H2 due to base
effects, a more balanced growth could make the expansion,
already the longest in a decade, more sustainable.
BoJ likely to stay accommodative. Japan’s core inflation
remains close to 0%, highlighting the structural deflationary
challenges facing the economy despite the pick-up in
economic activity. Thus we expect the central bank to
maintain its accommodative policy over the next 12 months.
China – focus shifts to financial stability
Growth slows after strong H1. China’s economic activity
showed modest, but broad-based slowdown in July as tighter
credit policies and controls over the property sector hurt
investment. With H1 growth (6.9%) significantly exceeding
2017’s 6.5% target, authorities have some latitude in
moderating growth, as they focus on financial stability.
Balancing act to continue. We expect this swing between
tighter credit and monetary policy and targeted fiscal easing
to continue, at least until the Communist Party Congress in
Q4, when a new batch of leaders takes charge. The renewed
focus on curbing financial and corporate sector leverage is
positive for the economy’s long-term sustainability.
Emerging Markets – looser monetary policies
Low inflation enabling easier monetary policies in Asia.
Inflation has fallen across most of Asia, enabling central
banks to cut interest rates or, at least, stay accommodative.
Indonesia is the latest central bank to cut rates; India could
follow later this year as inflation-adjusted rates remain high
and its currency strong.
Brazil, Russia, Mexico may cut rates: Brazil and Russia
continue to see falling inflation, which has left inflation-
adjusted rates too high. This is likely to drive more rate cuts.
Meanwhile, inflation expectations may have peaked in
Mexico, which should allow the central bank to halt rate hikes
and start easing policy.
Figure 13: Japan’s economy outpaced other major developed
economies in Q2 as domestic consumption drove faster growth
Economic growth trends in Japan, the US and Euro area; q/q SAAR
Source: Bloomberg, Standard Chartered
Figure 14: China’s economic activity indicators showed modest
slowdown in July, but overall growth remains resilient
China’s fixed asset investment (YTD), retail sales and industrial production growth; % y/y
Source: Bloomberg, Standard Chartered
Figure 15: Brazil’s inflation-adjusted rates remain high, boosting
chances of further rate cuts
Brazil’s consumer inflation and benchmark Selic rate; % y/y
Source: Bloomberg, Standard Chartered
-20
-15
-10
-5
0
5
10
15
Sep-02 Aug-07 Jul-12 Jun-17
% q
/q S
AA
R
Japan US Euro area
0
5
10
15
20
25
Aug-12 Jun-13 Apr-14 Feb-15 Dec-15 Oct-16 Aug-17
% y
/y
Fixed asset investment YTD Retail sales Industrial production
0
2
4
6
8
10
12
14
16
Aug-11 Aug-12 Aug-13 Aug-14 Aug-15 Aug-16 Aug-17
%
Consumer inflation Selic rate

This reflects the views of the Wealth Management Group 13
Standard Chartered Bank
Global Market Outlook | 31 August 2017
Bonds Equities Commodities Alternative
Strategies
FX Multi-asset
Bonds
Favour EM USD and local currency government bonds
Prefer corporate
bonds over
government bonds
within DMs
DM HY and Asia
USD remain core
holdings
Figure 16: Where markets are today
Bonds Yield 1-month
return
DM IG government 1.2% 1.4%
EM USD government
5.2% 1.6%
DM IG corporates 2.4% 0.9%
DM HY corporates 5.2% 0.6%
Asia USD 3.7% 1.1%
EM local currency government
6.1% 1.5%
Source: Bloomberg, JPMorgan, Barclays,
Citigroup, Standard Chartered
*As of 31 July 2017
Maintaining tilt towards EM
• We believe Emerging Market (EM) bonds, both USD and local currency, offer the
best potential returns for the risk within bonds, given our outlook for robust global
growth, constructive sentiment towards risk assets and a rangebound to bearish
USD view. We continue to see Asia USD corporate bonds as a core holding.
• Within Developed Markets (DMs), we continue to favour corporate bonds over
government bonds. US High Yield (HY) debt remains an important source of yield
pick-up when part of a broader diversified income allocation.
• DM Investment Grade (IG) government bonds remain our least preferred segment
given low absolute yield levels with potential for capital losses as both the Fed and
the ECB normalise monetary policy.
Figure 17: Bond sub-asset classes in order of preference
Bond asset
class View
Rates
policy
Macro
factors
Valua-
tions FX Comments
EM USD
government NAAttractive yields, inexpensive
valuations, positive EM sentiment
EM local
currency Attractive yields amid reduced
currency risk and positive EM outlook
Asian USD NADefensive allocation. Influenced by
China domestic credit fundamentals
DM HY
corporate
Attractive yields on offer offset by
somewhat expensive valuations
DM IG
corporate
Likely to outperform DM IG govt
bonds. Yield premium relatively low
DM IG
government NAReturns challenged by normalising
Fed and ECB monetary policy
Source: Standard Chartered Global Investment Committee
Legend: Supportive Neutral Not Supportive Preferred Less Preferred Core
Developed Market Investment Grade government bonds
– Less preferred
We maintain a cautious stance towards DM IG government bonds amid expectations for
higher Treasury and Bund yield as both the Fed and the ECB move towards policy
normalisation. The recent decline in US Treasury yields has likely been a result of a
scale back in inflation expectations. Part of this may have been due to only a modest
rebound in commodity prices and reduced expectations of US fiscal stimulus.
Nonetheless, we do not see this trend continuing and, ultimately, higher growth
expectations amid an improving labour market are likely to drive inflation higher.
Moreover, positioning on US 10-year Treasuries remains at extreme net-long levels,
creating the risk of a quick pick-up in yields.
03
02
01
IMPLICATIONS
FOR INVESTORS

This reflects the views of the Wealth Management Group 14
Standard Chartered Bank
Global Market Outlook | 31 August 2017
Bonds Equities Commodities Alternative
Strategies
FX Multi-asset
Figure 18: EM USD and LC sovereigns, DM HY and Asia USD credit
offer better than DM IG corporate and sovereigns
Yield-to-Worst and 30-day volatility of various bond sub-asset classes
Source: Bloomberg, Standard Chartered
We expect the US 10-year yield to gradually move higher
towards 2.50% over the next 12 months and its spread with
the 2-year yield to narrow further. Therefore, the 5-7 years
maturity bucket, on average, offers the best trade-off
between yields on offer and interest rate sensitivity, in our
view. We also expect German Bund yields to rise towards
1% over the next 12 months, though this may be partially
offset by a stronger EUR (see the FX section for details).
Figure 19: Gradual creep higher in both Treasury and Bund yields
US 10-year Treasury yields and German 10-year Bund yields
Source: Bloomberg, Standard Chartered
Emerging Market USD government bonds –
Preferred
EM USD government bonds are one of our preferred bond
sub-assets. We believe investor appetite towards EM in
general is a key consideration in this outlook (see figure 20).
Our constructive outlook on EM is based on the following
expectations: 1) stable China growth and smooth
deleveraging, 2) a gradual rise in US interest rates, and 3) a
limited downside to commodity prices.
Against this backdrop, EM USD bonds offer an attractive
yield of approximately 5%, and remain one of the few areas
where valuations are not expensive relative to history. As a
result, we are likely to see further gains as we move deeper
into the global recovery. Key risks to our view include a
significant slowdown in global growth, a sharp deceleration in
China growth and/or significant debt concerns, and a major
change in US tax policy/protectionist measures.
Figure 20: EM USD sovereign spreads have been closely tied to EM
risk sentiment (proxy through EM FX volatility) in the recent past
EM USD Sovereign credit spreads and EM FX volatility
Source: Barclays, Bloomberg, Standard Chartered
Developed Market Investment Grade
corporate bonds – Core holding
DM IG corporate bonds are a core holding, in our view, amid
their reasonable premium over government bonds and
comparatively less sensitivity to rising interest rates.
Credit quality in DM IG bonds remains mixed. In the US, it
has started to deteriorate while in Europe it continues to
improve. While valuations are expensive relative to history,
we believe a scarcity of high quality assets in a low yield
environment is likely to allow further modest gains.
G3 Sovereigns
EM USD Sovereigns
EM LC Sovereigns
DM IG Corporates
DM HY Corporates
Asia Credit
0.0
1.0
2.0
3.0
4.0
5.0
6.0
7.0
0.0 1.0 2.0 3.0 4.0 5.0 6.0
Yie
lds (%
)
30d volatility (%)
-0.5
0.0
0.5
1.0
1.5
2.0
2.5
0.0
0.5
1.0
1.5
2.0
2.5
3.0
3.5
Jun-14 Jul-15 Aug-16 Sep-17
%%
US 10y yields German 10y yields (RHS)
220
270
320
370
420
470
520
570
5
6
7
8
9
10
11
12
13
14
Jun-12 Mar-14 Dec-15 Sep-17%%
JPMorgan Emerging Market FX volatility
JPMorgan Emerging Market (USD) bond spreads (RHS)

This reflects the views of the Wealth Management Group 15
Standard Chartered Bank
Global Market Outlook | 31 August 2017
Bonds Equities Commodities Alternative
Strategies
FX Multi-asset
Figure 21: DM HY spreads close to post crisis lows, but still above
pre-crisis extremes
DM HY historical spreads
Source: Bloomberg, Standard Chartered
Developed Market High Yield corporate bonds
– Core holding
We view DM HY corporate bonds as a core holding. While
HY bonds also offer an attractive yield of approximately 5%,
we do not believe the asset class can deliver returns similar
to the recent past. Nonetheless, HY bonds remain an
important part of a diversified income allocation.
While valuations appear stretched, we are still some distance
from levels seen prior to the 2008 crisis. Furthermore, default
rates have been falling, suggesting credit risk may be on an
improving trend. HY credit spreads would likely widen if we
were to see a period of risk aversion. However, we see these
bouts of volatility as opportunities to tactically add exposure.
US floating rate senior loans remain an attractive alternative
to HY bonds due to their lower interest rate sensitivity.
Asia USD bonds – Core holding
Asia USD corporate bonds are a core holding as we continue
to view them as a defensive allocation within EM bonds. The
asset class is less sensitive to shifts in EM risk sentiment
compared with EM bonds. Thus, despite a lower yield (about
4%), Asia USD bonds are considerably less volatile.
Moreover, credit quality remains high with IG bonds
accounting for 78% of the universe. Valuations of high grade
issuers have been extremely stable amid a positive
macroeconomic backdrop and limited issuance.
On the downside, valuations are not cheap with limited room
for a decline in yield premiums. Moreover, with China
accounting for over 50% of the market, any major
deterioration in corporate health there would have a
disproportionate impact on returns. While the pace of China’s
onshore defaults has slowed dramatically, we are not
comfortable with high debt metrics of local property
developers. As a result, we would limit our exposure in the
HY segment.
Emerging Market local currency bonds
– Preferred
Despite recent outperformance, we like EM local currency
bonds as these continue to offer attractive yields of over 6%
with contained downside risks, in our opinion. We believe the
current environment of modest global growth, low volatility
and high interest rate differentials between EMs and DMs is
supportive of carry trades (investing in high yielding assets
through low cost borrowing). We believe our overweight call
on EM local currency bonds is one way to express this view
(see figure 22). While most of the returns this year have
been explained by currency gains, we believe, going forward,
there is considerable potential for carry and capital gains
(through domestic rate cuts).
However, we would highlight that this asset class is among
the most volatile in the bond market and can be
disproportionately affected by a major EM sell-off (although
we attach a low probability to such an outcome).
Figure 22: EM Local currency bonds a reasonable proxy to EM FX
carry trades
EM local currency bond index and Bloomberg FX carry index
Source: Bloomberg, Standard Chartered
200
500
800
1,100
1,400
1,700
2,000
Jan-00 Jul-02 Jan-05 Jul-07 Jan-10 Jul-12 Jan-15 Jul-17
Sp
read
(b
ps)
US HY corporate spread 10y average
+1 Std dev -1 Std dev
220
240
260
280
300
205
225
245
265
285
305
Jun-12 Mar-14 Dec-15 Sep-17
%%
JPMorgan EM local currency bond index
Bloomberg EM FX carry trade index (RHS)

This reflects the views of the Wealth Management Group 16
Standard Chartered Bank
Global Market Outlook | 31 August 2017
Bonds Equities Commodities Alternative
Strategies
FX Multi-asset
Equities
Global equities
remain our
preferred asset
class
Euro area and Asia
ex-Japan are our
preferred regional
markets
Positive on China
and Korea within
Asia ex-Japan
Figure 23: Where markets are today
Market
Index Level
P/E ratio P/B EPS
US (S&P 500)
18x 2.9x 11% 2,458
Euro area (Stoxx 50)
15x 1.5x 14% 3,404
Japan (Nikkei 225)
14x 1.2x 10% 19,507
UK (FTSE 100)
14x 1.8x 12% 7,365
MSCI Asia ex-Japan
13x 1.5x 14% 663
MSCI EM ex-Asia
12x 1.5x 16% 1,481
Source: FactSet, MSCI, Standard
Chartered
Note: Valuation and earnings data refer to
MSCI indices, as of 30 August 2017
A wait-and-see approach
• Global equities remain our preferred asset class. Equity investors have recently
become more cautious due to uncertainty over the outlook for US and Euro area
monetary and fiscal policy.
• Euro area equities remain one of our preferred markets. We are focused on an
improvement in corporate earnings and margins and a recovery in domestic
demand. We take note of the near-term weakness in technical indicators, which is
weighing on Euro area indices.
• Asia ex-Japan equities are also preferred. A strong earnings season in sectors with
high valuations, including China technology and real estate, has settled some
concerns about the sustainability of the region’s YTD performance. China and
Korea remain our preferred markets.
• Emerging Markets (EMs) ex-Asia is a core holding. The recent recovery in industrial
metal prices has lifted sentiment towards Brazil and Chile, where this is a driver.
Japan, also a core holding, is performing well, despite recent JPY strength.
• With the Q2 earnings season behind us, monetary and fiscal policies are likely to be
the primary focus for equity investors in the months ahead. Fed balance sheet
reduction and ECB tapering have the potential to tighten financial conditions,
weighing on equity markets. We remain positive on a 12-month basis.
• Risks to our equity preferred view include high valuations and policy surprises.
Figure 24: Euro area and AxJ are our preferred regions; the UK is the least preferred
Equity View
Earnings
revision Earnings
Return on
equity
Economic
data
Bond
yields Comments
Euro
area Lead indicators for earnings falling from elevated levels
Asia
ex-
Japan
Earnings outlook is improving and a weak USD a positive
EM ex-
Asia
Weak commodity prices are acting as a drag on equities in EM ex-Asia
Japan
Corporate tax reforms needed to trigger further re-rating.
US Focus turning to tax reforms once again
UK
Plans for remaining in the EU customs area positive for UK businesses
Source: Standard Chartered Global Investment Committee
Legend: Supportive Neutral Not Supportive Preferred Less Preferred Core Holding
03
02
01
IMPLICATIONS
FOR INVESTORS

This reflects the views of the Wealth Management Group 17
Standard Chartered Bank
Global Market Outlook | 31 August 2017
Bonds Equities Commodities Alternative
Strategies
FX Multi-asset
Euro area equities – Preferred
Euro area equities remain a preferred equity market. The
region has continued to trade sideways over the past two
months, despite a positive earnings season for Euro area
companies. Euro strength has remained a drag on equity
investor sentiment, but we focus on widening corporate
margins and improving domestic demand as factors to
support our preferred view.
Consensus expectations for Euro area Q2 corporate
earnings surged from 10% at the start of July to 15%
currently, with the financial sector witnessing particularly
strong upgrades. Earnings revisions have recently
weakened, but the fundamental outlook remains solid.
Expectations for Euro area non-financial margins have
increased from 6.4% to 7.8% over the past 12 months,
reinforcing the improving fundamental outlook.
The combined effect of EUR strength and tightening financial
conditions and concerns over ECB tapering are current
headwinds. However, greater clarity on the path of ECB
tapering and a continued improvement in the outlook for
corporate earnings could help improve sentiment and
contribute to a re-rating of the market, which has witnessed a
drop in valuations over the past three months.
Figure 25: Euro area earnings expectations decline, but remain
robust
Earnings revisions and consensus 12-month forward earnings growth forecast
Source: FactSet, MSCI, Standard Chartered
Asia ex-Japan equities – Preferred
Asia ex-Japan equities are also a preferred holding. We see
favourable risk-reward for this market, underpinned by the
expectations of a range-bound USD with a downward bias
and the resilience of Asian economies, particularly China.
We also continue to see a significant upswing in Asia ex-
Japan corporate earnings – the consensus is for 20% growth
for 2017 and 11% for 2018. While the earnings momentum
may slow down in 2018 given a higher base, we expect
steady demand and good cost discipline to support corporate
margins and improve return on equity over the longer term.
Valuations for Asia ex-Japan equities also remain relatively
attractive, at a 12-month forward P/E of 13x, making it the
second-cheapest market among the six major regions. We
expect solid earnings growth and attractive valuations to
drive increased foreign buying, which could trigger a further
market re-rating.
China remains our preferred market within Asia ex-Japan.
Drivers include a stronger CNY, domestic consumption
strength and sustained liquidity support from Hong Kong’s
increasingly successful Stock Connect programmes.
We also reiterate our positive view on Korea equities.
Valuations are compelling, with the 12-month forward P/E at
a 33% discount to the region’s. Although geopolitical
tensions are a concern, strong upward earnings revisions
and exposure to high-demand tech products are expected to
enable valuation multiples to re-rate higher.
Figure 26: Asia ex-Japan’s earnings growth above historical average
Consensus earnings growth expectations
Source: FactSet, MSCI, Standard Chartered
-10
0
10
20
30
40
50
-1.0
-0.8
-0.6
-0.4
-0.2
0.0
0.2
0.4
0.6
0.8
Jan-02 Dec-05 Nov-09 Oct-13 Sep-17
%ER
I
ERI at -0.1 MSCI EMU at 13.3% 12m fwd EPSg (RHS)
-5
0
5
10
15
20
25
2012 2013 2014 2015 2016 2017 2018
EP
S y
/y %
EPSg (%) Historical 5y average

This reflects the views of the Wealth Management Group 18
Standard Chartered Bank
Global Market Outlook | 31 August 2017
Bonds Equities Commodities Alternative
Strategies
FX Multi-asset
EM ex-Asia equities – Core holding
We see EM ex-Asia equities as a core holding. An improving
EM GDP growth differential (versus Developed Markets
[DMs]) and expectations of a range-bound to weak USD
should support EM capital inflows and support EM ex-Asia
valuations.
In addition, consensus earnings growth of 23% in 2017 is
robust and above the five-year average of 4.9%. The recent
moderation in EM ex-Asia earnings growth momentum could
be offset by a recovery in commodity prices, particularly
crude oil and iron ore. Such an outturn could lift margins and
return on equity, which could help to narrow the current P/E
valuation discount of 25% between EM ex-Asia and DMs.
Nevertheless, we remain cautious about the ongoing political
risks in EM ex-Asia – in particular, the leadership election of
South Africa’s ruling African National Congress (ANC) party
in December 2017. Concerns about policy stagnation and a
shift towards populist initiatives could cap upside to South
Africa equities. Trading at a P/E of 16x on 2017E, with
downside earnings risk, South Africa equities are expensive.
Investors are also worried about Brazil’s weak government,
which had to postpone a plan to roll back payroll tax cuts that
would have increased revenues by about BRL 4.8bn this
year and BRL 13bn next year. Brazil is trading at an 8%
discount to the historical average, but the 2018 presidential
election remains a concern. Within EM ex-Asia, Brazil is our
preferred market while South Africa is the least preferred.
Figure 27: EM ex-Asia’s margins and commodity prices
EM ex-Asia’s margins versus CRB index
Source: FactSet, MSCI, Standard Chartered
Japan equities – Core holding
Japan equities remain a core holding, with the corporate
earnings outlook likely to be the key focus. The consensus is
for 18% earnings growth in 2017 and 6.7% growth in 2018.
Net profit margins have improved due to companies’ cost-
cutting efforts and a weaker JPY, which has been positive for
exporters. Although the JPY has strengthened over the past
two months, we expect this to be short-lived.
We also see prospects of an upturn in equity returns, mainly
driven by increasing share buybacks, which rose to a record
JPY 5.5trn in 2016. We see room for further upside surprises
this year, given ample cash holdings among Japan’s
companies (at JPY 112trn as of March 2017). Further
improvement in corporate governance at Japanese
companies could be positive for Japan equities.
However, political uncertainty could hinder the rollout of
economic policies. The loss of Prime Minister Shinzo Abe’s
Liberal Democratic Party in the recent Tokyo assembly
elections means that a significant policy action ahead of the
impending Japan’s general election is less likely.
Overall, we retain Japan equities as a core holding. The
positives from healthy EPS growth and further share
buybacks could be partly mitigated by the lack of strong
policy support. Trading at a P/E ratio of 14x, valuations are
attractive compared with the long-term average of 17x.
Figure 28: Japan’s EPS growth trend remains a driver
Japan’s EPS growth trend
Source: FactSet, MSCI, Standard Chartered
250
300
350
400
450
500
550
600
5
7
9
11
13
15
17
Aug-05 Aug-07 Aug-09 Aug-11 Aug-13 Aug-15 Aug-17
CR
B in
dex
12m
fw
d n
et
marg
in (%
)
MSCI EM ex-Asia CRB index (RHS)
0
5
10
15
20
Dec-13 Nov-14 Oct-15 Sep-16 Aug-17
EP
S g
row
th (
%)
2016 2017 2018

This reflects the views of the Wealth Management Group 19
Standard Chartered Bank
Global Market Outlook | 31 August 2017
Bonds Equities Commodities Alternative
Strategies
FX Multi-asset
US equities – Core holding
We continue to be more optimistic than the consensus
towards US equities, viewing it as a core holding. While the
S&P 500’s technical picture has weakened in recent weeks,
breaking below the closely watched 50-day moving average,
a positive earnings season and a benign US rate outlook
provide support for the market.
The Q2 US corporate earnings season was positive with
consensus earnings expectations rising from 8% earnings
growth at the start of July to 12% by the end. Companies in
the industrials and financial sectors saw the biggest jump in
earnings forecasts for the Q2 period.
Tax reforms appear to be back on the White House agenda.
The treasury secretary believes that proposals for tax
reforms will be agreed on before the end of the year, which
would be very positive for US equities. However, a more
likely scenario is unfunded corporate and income tax cuts,
which may lead to a faster-than-expected rise in bond yields,
putting equity valuations under pressure.
The decline in S&P 500 sector correlations has been positive
for fund managers as it allows them to add value via stock
selection (for example, by differentiating between higher and
lower quality companies with similar valuations).
S&P 500 valuations remain high, both absolute and relative
to the MSCI World. This reinforces the need to be prudent
when deciding on the size of investments in the US market.
Figure 29: US valuations trade at a premium to MSCI World
US P/E ratio relative to MSCI World
Source: FactSet, MSCI, Standard Chartered
UK equities – Less preferred
We view UK equities as the least preferred among the six
key regions/markets. Negotiators recently kicked off the third
round of Brexit negotiations. The pre-meeting announcement
that the UK wants to remain in the EU customs union for a
‘transition period’ after Brexit is significant. An agreement on
this would reduce the ‘cliff edge’ risk that companies face if
no trade deal is in place after Brexit.
The recent drop in the GBP and the recovery in commodity
prices have helped the performance of the UK index, which
is up 2% in the Q3 period in GBP terms. Consensus
expectations for corporate earnings in 2017 are for 21%
growth. However, in domestic demand orientated sectors
there has been a series of profit warnings during the Q2
earnings season. This reflects weak household spending
trends due to low wage growth and rising inflation.
UK market valuations are high despite the uncertain outlook.
The market is trading at a 12-month forward P/E ratio of 15x
consensus earnings expectations, which is significantly
above the 10-year average P/E of 12x.
Focusing on other measures of market valuations, we note
that the UK yield gap—the difference between benchmark
bond yields and the equity market dividend yield—continues
to widen. This is primarily driven by falling bond yields. While
the equity dividend yield of 4.5% is attractive by global
standards, there is some uncertainty about its sustainability,
which is in part driving the widening dividend yield gap.
Figure 30: UK yield gap
UK benchmark bond yields less equity dividend yield
Source: FactSet, Standard Chartered
-5
0
5
10
15
20
Jan-02 Mar-05 May-08 Jul-11 Sep-14 Nov-17
Dis
co
un
t/p
rem
ium
%
Relative P/E of US/AC World Mean
-4
-2
0
2
4
Jan-02 Jan-06 Jan-10 Jan-14 Jan-18
Bo
nd
yie
ld -
div
yie
ld (
%)
UK - yield gap Mean

This reflects the views of the Wealth Management Group 20
Standard Chartered Bank
Global Market Outlook | 31 August 2017
Bonds Equities Commodities Alternative
Strategies
FX Multi-asset
ESG investing
What is the rationale for ESG investing?
ESG (Environmental, Social, Governance) investing is the
application of a set of agreed criteria (either positive or
negative) to screen companies based on corporate
sustainability and making the link to investment decisions.
Examples of common criteria include those agreed at the UN
Global Compact, the UN Principles for Responsible Investing
or the Sustainability Accounting and Standards Board.
The reasons for adopting a ‘sustainable’ investment
approach can vary, and this may not be performance-
oriented alone. We believe there are three main reasons:
1. Specific types of outperformance
The evidence on whether an ESG-based investment strategy
can outperform a global equities benchmark is mixed. While
a majority of studies appear to point to a reasonably high
likelihood of outperformance, this is also often sensitive to
the way in which ESG is incorporated into an investment
process. However, there is much stronger evidence that it
does not impose a drag on returns.
Figure 31: Little difference between global ESG and all equities in
recent past; EM ESG catching up rapidly
MSCI AC World TR, MSCI World ESG Leaders Index, MSCI EM Leaders Index
Source: Bloomberg, Standard Chartered
Where the evidence appears more compelling is that the
incorporation of sustainability appears to support improved
corporate performance in specific parts of the market.
Studies argue that the positive correlation between
investment performance and ESG factors was stronger in
bonds and real estate asset classes. Regionally, studies
show the biggest benefits from incorporating ESG factors
came from Emerging Markets (EMs).
2. Better risk management
Regardless of one’s view on ESG’s contribution to
outperformance, there is less doubt over the view that the
incorporation of sustainability factors leads to improved risk
management. Studies suggest ESG-compliant firms face
lower costs of capital and a low risk premium due to greater
transparency; such firms tend to face a lower risk that their
assets become ‘stranded assets’ and worthless.
For an investor, this means that even if returns with and
without ESG factors are similar, the same return may be
obtained with less risk.
Figure 32: Considerable room for sustainable investing in Asia
Socially responsible assets by region, USD bn
Source: Global Sustainable Investment Alliance, Standard Chartered
3. Achieve sustainability goals
The above means there is a high likelihood that investors
keen on having a positive sustainability impact are able to
achieve this goal via ESG strategies without having to take
on financial costs in terms of lower investment returns.
75
85
95
105
115
125
135
Oct-14 Mar-15 Aug-15 Jan-16 Jun-16 Nov-16 Apr-17
Global equit ies Global ESG EM ESG
0
2,000
4,000
6,000
8,000
10,000
12,000
14,000
Europe US Canada Australia/NZ Japan Asia

This reflects the views of the Wealth Management Group 21
Standard Chartered Bank
Global Market Outlook | 31 August 2017
Bonds Equities Commodities Alternative
Strategies
FX Multi-asset
Equity derivatives
Ways to monetise our “neutral” macro
recommendations
In the last Global Market Outlook, we discussed potential
opportunities for investors to consider selling put options in
China’s insurance and property sectors. Helped by a
stronger CNY versus USD, the more asset-heavy, old
economy sectors in China have done well over the past few
weeks.
As we approach an event-heavy September, such as the
ECB meeting on 7 September and the likely announcement
of Fed balance sheet reduction on 19-20 September, we
believe volatility could return to equity markets in the short
term. A potential pullback in spot prices, as well as the
associated rise in volatility, may provide interesting
opportunities to sell put options to generate income.
1. Euro area banks
Euro area banks are ‘strong EUR beneficiaries’. We have
closed our bullish EUR/USD view, because we believe most
of the short-term positive drivers of EUR gains have already
been factored in. Having said that, we remain constructive on
the EUR over the medium term, as the Euro area economy
recovers and the ECB is expected to reduce bond purchases
in 2018, if not sooner. If the EUR falls towards 1.15, we
believe selling puts on Euro area banks could be an
interesting strategy for those seeking to generate attractive
yields.
Figure 33: Six-month implied volatility 8ppt higher than the broad
benchmark’s volatility
Six-month implied volatility spread: Euro Stoxx 50 Banks versus Euro Stoxx 50
Source: Bloomberg, Standard Chartered
As of 24 August 2017
Currently, the six-month implied volatility spread of European
banks over Euro Stoxx 50 is at 8ppt, which is the average
spread since January 2014. However, if the EUR were to
pullback to 1.15, we would expect more attractive
opportunities for selling put options on European banks.
2. Oil companies
We have closed our bullish oil view, but continue to expect
the market to rebalance, putting gradual upward pressure on
oil prices over the coming 6-12 months. Demand growth
remains in place, and US shale producers may not be able to
sustain continued output gains without significant capital
investments at some point.
However, this rebalancing has taken longer than we
expected and OPEC is struggling to restrain the output of
some members. Meanwhile, US shale producer costs fell
more sharply than expected, although there are some signs
that this is starting to reverse slightly.
Figure 34: Rebalancing happening, but slower than expected
US crude inventories, compared to 5y figures
Source: Bloomberg, Standard Chartered
As of 24 August 2017
On balance, we see a relatively small probability, at 25%, for
crude oil to drop below USD 45/bbl over a 12-month horizon.
In the short term, weak technical indicators mean a move
towards USD 45/bbl is, however, possible. Should this
happen, it could provide an opportunity to sell put options on
oil companies for income.
0
5
10
15
20
Jan-14 Dec-14 Nov-15 Oct-16 Sep-17
Vo
l sp
rea
d
Bank - Euro Stoxx 50
300
350
400
450
500
550
Jan-17 Mar-17 May-17 Jul-17 Sep-17 Nov-17 Jan-18
mb
bl
US crude inventories 5y high
5y low 5y average

This reflects the views of the Wealth Management Group 22
Standard Chartered Bank
Global Market Outlook | 31 August 2017
Bonds Equities Commodities Alternative
Strategies
FX Multi-asset
Commodities
Oil prices to trade
within USD 45-
55/bbl range
Gold to remain range-bound
Modest
retracement of
base metal prices
likely
Figure 35: Where markets are today
Commodity Current
level 1-month
return
Gold (USD/oz) 1309 3.1%
Crude Oil (USD/bbl) 50.9 -2.6%
Base Metals (index) 129 9.0%
Source: Bloomberg, Standard Chartered
Focus on fundamentals
• We expect commodities to rise modestly amid continued strength in global growth.
Although any slowdown in China’s growth remains the key risk.
• We retain our neutral view on oil as risks become more balanced; expect prices to
remain largely contained within the USD 45-55/bbl range.
• Gold likely to return to USD 1,200-1,300/oz range, suggesting downside risk from
here. Further USD weakness, though, would place this view at risk.
Figure 36: Commodities: key driving factors and outlook
Commodity View Inventory Production Demand
Real
interest
rates USD
Risk
sentiment Comments
Oil NA
OPEC cuts and
slowing US
shale production
to support prices
Gold
Gradually rising
yields to weigh
on gold
Metals NA
Further
retracement
likely as supply
headwinds
persist
Source: Standard Chartered Global Investment Committee
Legend: Supportive Neutral Not Supportive Preferred Less Preferred Neutral
Keeping an eye on risks
We retain our modestly constructive view on commodities on the back of an improving
global backdrop and supportive demand-supply factors. Although the commodities
complex remains centred around China’s demand outlook, there is a risk of disruption if
efforts to maintain China's growth slow after the Party Congress later this year.
Geopolitical tensions (particularly in the Korean Peninsula), major weather events (such
as Hurricane Harvey) and US politics are key risks, even though the impact on individual
commodities would likely differ.
Oil markets have adjusted higher to several fundamental developments – namely, the
recent strong run of demand data in Q2 and a reiteration of OPEC production cuts. We
believe the bigger picture continues to be dominated by supportive short-term
developments on supply and demand fronts. Supply-side factors, specifically relating to
China’s production restrictions, have likely been largely responsible for the
outperformance of industrial metals of late, in our opinion. We remain cautious about
chasing the rally as a meaningful pick-up in demand remains elusive, in our view.
03
02
01
IMPLICATIONS
FOR INVESTORS

This reflects the views of the Wealth Management Group 23
Standard Chartered Bank
Global Market Outlook | 31 August 2017
Bonds Equities Commodities Alternative
Strategies
FX Multi-asset
Crude oil – slower-than-expected rebalancing
Oil prices have remained relatively resilient amid strong
seasonal demand, which has reduced US crude inventories.
We expect oil prices to remain range-bound, albeit with a
positive bias. Nigerian and Libyan output have undermined
OPEC production cuts, complicating producers’ efforts to
convince markets of its long-term commitment to support
prices. However, Saudi Arabia’s decision to reduce
allocations to refiners (likely directed at US refiners) should
support the continued draws in oil stocks.
Given where oil prices are today, a significant upside
appears less likely as prices are close to the top of our
expected range. Our long-term view remains one of flat-to-
gradually higher oil prices over time, based on slowing
supply growth and continued demand growth.
Gold – range-bound still a likely outcome
Geopolitical tensions in the Korean Peninsula continued to
support gold prices and have also helped gains in gold
mining sector equities. The metal has broken just above our
expected USD 1,200-1,300/oz range, suggesting prices
could be on a strong uptrend.
However, we are mindful that this jump mirrored the move
lower in the USD, which, as we discuss elsewhere, is at risk
of rebounding and potentially pushing gold lower. A rebound
in US Treasury yields would also pose downside risks.
On balance, we continue to believe there is high likelihood of
gold turning lower to its prior USD 1,200-1,300/oz range.
However, gold would likely have to return to this range fairly
quickly for the technical outlook to not improve significantly.
Industrial metals – remain cautious
Industrial metals’ performance has held up. While each metal
has its own idiosyncratic factors, we believe the narrative will
converge in the latter half of the year. Copper prices rallied
significantly recently, sparked by news of a potential ban on
scrap imports by China, attributable largely to a renewed
focus on environmental policies. However, we believe base
metal prices may retrace modestly as demand has not
improved meaningfully and the recent attrition in supplies is
likely transitory.
Figure 37: Excessive net-long positioning highlights risk of pullback
NYME crude oil net positioning (000s)
Source: Bloomberg, Standard Chartered
Figure 39: What has changed – Oil
Factor Recent moves
Supply OPEC production continues to decline;
US crude oil inventories decreased
Demand Leading economic indicators in the US
and China continue to expand
USD Close to a one-year low; rebound a risk
Source: Standard Chartered
Figure 40: What has changed – Gold
Factor Recent moves
Interest rate
expectations
US yields have declined on the back of
weaker-than-expected inflation data
Inflation expectations Marginal decline in the US
USD Close to a one-year low; rebound a risk
Source: Standard Chartered
0
100
200
300
400
500
600
Jan-12 Jun-13 Nov-14 Apr-16 Sep-17
Po
sit
ion
ing
(000s
)
Figure 38: Industrial metals (iron ore an exception) have held up
Copper, Aluminium, Zinc, Iron ore prices (indexed as of 1 January 2017)
Source: Bloomberg, Standard Chartered
50
60
70
80
90
100
110
120
130
Jan-17 Mar-17 May-17 Jul-17 Sep-17
Ind
ex
Copper Aluminium Zinc Iron ore

This reflects the views of the Wealth Management Group 24
Standard Chartered Bank
Global Market Outlook | 31 August 2017
Bonds Equities Commodities Alternative
Strategies
FX Multi-asset
Alternative strategies
Actively use both
substitutes and
diversifiers
Equity Hedge
(most preferred)
and Event Driven
are long equity
substitutes
Scenarios drive
our allocation
Figure 41: Where markets are today
Alternatives Since
outlook Since last
publication
Equity Long/Short 3.9% -0.6%
Relative Value 2.6% -0.1%
Event Driven 6.3% -0.4%
Macro CTAs 1.0% 0.8%
Alternatives Allocation
3.6% -0.2%
Source: Bloomberg, Standard Chartered
Diversifiers act as a buffer
• We continue to favour Equity Hedge as our preferred strategy, given positively
trending equity markets and a reflationary or muddle-through economic outlook.
• Credit spreads continue to trade at narrower levels, potentially improving the cost of
funding and performance for leveraged Relative Value strategies.
• Equity Hedge, Event Driven and Relative Value delivered negative performance
over the past month while Global Macro, a diversifying strategy, acted as a buffer;
our alternative strategies allocation is up 3.6% since our Outlook 2017.
Following a framework for alternative strategies
When looking towards positioning alternative strategies within an investment allocation,
we advocate using a ‘substitutes’ and ‘diversifiers’ approach. Substitutes have higher
correlations to traditional asset classes (such as bond and equity), while diversifiers, with
their lower correlations, could potentially provide insurance-like characteristics during
market downturns. Using quantitative analysis together with qualitative inputs, we
identified potential performance drivers for alternative strategies in our mid-year Outlook
– see our framework provided below.
Relative Value strategies can often employ leverage to magnify returns from trading
opportunities. As such, funding costs and consequently narrow credit spreads can
impact the relative performance of their trading activity. Given current narrow credit
spreads, funding costs may be more favourable when employing leveraged trades,
potentially supporting Relative Value strategies.
Equity Hedge remains preferred, with an alternatives allocation as follows: Equity Hedge
34%, Event Driven 26%, Global Macro 16% and Relative Value 24%. For information on
how to build an alternatives allocation, please refer to the Outlook 2017 report.
Figure 42: Framework for alternative strategies
Description Key Drivers
SU
BS
TIT
UT
ES
Equity
Hedge
In essence buying undervalued
stocks and selling overvalued stocks
• Positively trending equity markets
• Rising equity market dispersion
Event
Driven
Taking positions based on an event
such as a merger or acquisition
• Positively trending equity markets
• Rising mergers and acquisitions
Relative
Value
Looking to take advantage of
differences in pricing of related
financial instruments
• Lower interest rate levels
• Cost of funding, narrowing credit
spreads
DIV
ER
SIF
IER
Global
Macro
Looking to exploit themes, trends and
asset class relationships
(correlations) at a global level,
generally with leverage
• Increasing volatility, rising credit
spreads
• Increasing cross asset dispersion
• Clear market trends (up/down)
Source: Standard Chartered Global Investment Committee
03
02
01
IMPLICATIONS
FOR INVESTORS

This reflects the views of the Wealth Management Group 25
Standard Chartered Bank
Global Market Outlook | 31 August 2017
Bonds Equities Commodities Alternative
Strategies
FX Multi-asset
FX
We remain positive
on the EUR over
the medium term
Expect the JPY to
weaken
Close conviction
for the INR, IDR,
BRL and RUB
versus the EM FX
index
Figure 43: Where markets are today
FX (against USD) Current
Level 1-month change
Asia ex-Japan 108 0.9%
AUD 0.79 -1.0%
EUR 1.19 1.1%
GBP 1.29 -1.6%
JPY 110 0.4%
SGD 1.36 -0.1%
Source: Bloomberg, Standard Chartered
USD to rebound near term
• The USD index is likely to rebound in the near term, but is likely to remain range-
bound over the medium term, with a slight downside bias.
• We retain our medium-term bullish bias on the EUR, but use the recent strength to
lock in gains as we expect near-term consolidation due to stretched positioning.
• Retain bearish bias on the JPY owing to our expectations of higher US Treasury
yields and a continued accommodative policy from the BoJ.
• Emerging Market (EM) currencies to remain broadly stable versus the USD amid
improving fundamentals and reduced external vulnerability. We no longer have the
conviction that a basket of the INR, IDR, BRL and RUB will outperform the broader
EM FX index.
Figure 44: Foreign exchange; key driving factors and outlook
Currency View
Real Interest
Rate
Differentials
Risk
Sentiment
Commodity
Prices
Broad
USD
Strength Comments
USD NA NA
Monetary policy
divergence with rest of
the world is eroding
EUR NA
Economic momentum
argues for ECB
stimulus withdrawal
JPY NA
Remains tied to US 10-
year yields
GBP NA Political and policy
uncertainty to weigh in
AUD
NZD
Central banks likely to
maintain policy for now
EM FX NA
Low volatility and
limited USD strength to
remain supportive
Source: Bloomberg, Standard Chartered Global Investment Committee
Legend: Supportive Neutral Not Supportive Preferred Less Preferred Neutral
Looking for a short-term rebound in USD
• USD (DXY index) has declined over 8% YTD, owing to a material drop in real
interest rate differentials and a reversal in investor positioning. Investor positioning
data indicates markets are most bearish on the USD since 2013. Even a minor
reversal in sentiment from the current extreme levels could support a near-term
USD rebound. A rebound in 10-year US Treasury yields could be USD-supportive.
• Over the medium term, we maintain a modest bearish bias as the USD faces a
number of headwinds. Several major central banks, including the ECB, the BoE and
the BoC, are likely to reduce their accommodative policy, which would begin to
move interest rate differentials against the USD.
03
02
01
IMPLICATIONS
FOR INVESTORS

This reflects the views of the Wealth Management Group 26
Standard Chartered Bank
Global Market Outlook | 31 August 2017
Bonds Equities Commodities Alternative
Strategies
FX Multi-asset
EUR – remain constructive longer term
We have closed our bullish EUR view. The strength of the
recent rally means the currency has become mildly
expensive based on interest rate differentials and
speculative long positioning is also high. Therefore, we
believe we will see a period of consolidation or even a mild
pullback. Recent EUR strength after the Jackson Hole
meeting provides a better profit taking opportunity for clients
who have not done so.
Over the medium term, we remain bullish EUR as most of
the supportive drivers remain in place. We expect a
reduction in ECB bond purchases to lead to narrowing of
interest rate differentials and lower bond outflows. While
Italian and Austrian elections remain a risk, overall political
risks have receded significantly, in our opinion.
JPY – maintain bearish bias
We retain our bearish bias on the JPY and believe that its
recent strength driven by lower US Treasury yields and safe-
haven demand as transitory. Given the persistent challenge
in spurring inflation, the BoJ is likely to retain its
accommodative policy bias and continue with its yield curve
control policy. This central bank policy divergence is likely to
drive interest rate differentials between the US and Japan
higher, leading to a weaker JPY.
The recent drop in the Abe administration’s approval ratings,
which could cause the continuity of Abenomics to be
questioned, and safe-haven demand are key upside risks.
GBP – mired by uncertainty
The GBP is caught in the tug-of-war between the politics of
Brexit negotiations and the recent hawkish rhetoric from the
BoE. Given the contrasting forces, we believe the GBP is
likely to remain range-bound over the medium term.
We believe the BoE will look through near-term inflation
since a premature rate hike could end up hurting the
economy more than higher inflation. In our opinion, two
tailwinds for the UK economy—strong foreign direct
investment inflows and consumer spending—are likely to
wane. Thus, we believe the GBP is likely to be range-bound,
until we see a significant catalyst from Brexit negotiations.
Figure 45: What has changed – G3 currencies
Factor Recent moves
Real interest rate
differentials
Moderately moved against the EUR. Moved in
favour of the JPY and the GBP at the
expense of the USD
Risk sentiment Equity and FX volatility has risen from the
lows of the past month. Still at a low level
compared with historical averages
Speculator
positioning
USD positioning remains net-short while EUR
positioning is near extreme net long. JPY
positioning remains significantly net-short
while GBP positioning has normalised
Source: Bloomberg, Standard Chartered
Figure 46: Recent EUR strength has diverged from interest rate
differentials
EUR/USD and real interest rate (interest rate net of inflation) differential
Source: Bloomberg, Standard Chartered
Figure 47: US Treasury yields remain the key driver for USDJPY
US-10year Treasury yields and USD/JPY
Source: Bloomberg, Standard Chartered
-1.8
-1.6
-1.4
-1.2
-1.0
-0.8
-0.6
-0.4
-0.2
0.0
1.00
1.05
1.10
1.15
1.20
1.25
1.30
1.35
1.40
1.45
Jan-14 Dec-14 Nov-15 Oct-16 Sep-17D
iffe
ren
tial
EU
R/U
SD
EUR/USD Germany-US real interest rate differential (RHS)
1.6
1.8
2.0
2.2
2.4
2.6
2.8
3.0
100
105
110
115
120
125
Nov-16 Jan-17 Mar-17 May-17 Jul-17 Sep-17
US
Tre
as
ury
yie
ld (%
)
US
D/J
PY
USD/JPY 10y US Treasury yield (RHS)

This reflects the views of the Wealth Management Group 27
Standard Chartered Bank
Global Market Outlook | 31 August 2017
Bonds Equities Commodities Alternative
Strategies
FX Multi-asset
AUD – expect modest downside
The AUD has struggled to strengthen meaningfully after
breaking out of its long-term range (0.784) last month. This
validates our view last month that despite the technical break
above the key resistance of 0.784, fundamentals did not
warrant a sustained rally in the currency. We broadly
maintain a range-bound stance, with a slight downside bias
following the strong rally over the past two months.
We believe the RBA is unlikely to hike rates anytime soon.
Given our expectations of higher US yields, we believe the
interest rate differential between the US and Australia is
likely to drop, reducing support for the AUD. Higher iron ore
prices have been a key driver of the recent AUD rally.
However, China’s iron ore inventories stand close to record
highs and demand from the real estate sector is likely to
moderate on recent cooling measures, weakening the AUD.
Emerging Market currencies – fundamentals
still supportive
The broader environment remains supportive of EM
currencies. Major EM countries continue to grow at a healthy
pace while their external vulnerabilities are declining.
That said, we have changed our view that a basket of the
INR, IDR, BRL and RUB will outperform the broader EM FX
index. Our original thesis that higher-yielding currencies with
strong external positions would do well did work out, as the
basket delivered positive returns. However, the call did not
outperform on a relative basis as (i) a significant build-up of
FX reserves in the four countries limited their currency
strength and (ii) several idiosyncratic factors led to strength
in other EM currencies. We remain positive on EM
currencies broadly on a 12-month basis, but prefer to take a
diversified exposure through EM local currency bonds.
Within Asian currencies, we expect a broadly stable CNY.
While valuations are not demanding, we believe the
authorities would prefer to maintain a stable USD/CNY to
support exports and capital flows ahead of the key Party
Congress later in November. The INR stands out as mildly
expensive and could see reduced inflows into bonds due to
nearly full utilisation of foreigner buying limits. In 2017,
USD/SGD has shown a strong correlation to the broad USD
index, something we expect to continue going forward.
Figure 48: Reversal in the recent iron ore rally could pose
challenges for the AUD
AUD/USD and iron ore prices
Source: Bloomberg, Standard Chartered
Figure 49: What has changed in Emerging Market currencies
Factor Recent moves
USD The USD has extended its weakness. Near-term
rebound likely
China risks China remains stable. The real estate sector is
showing signs of a minor slowdown
Risk
sentiment
EM USD government bond spreads remain
range-bound
Source: Standard Chartered
Figure 50: FX reserve accumulation has coincided with weakness in
the INR, IDR, BRL and RUB currency basket
INR, IDR, BRL, RUB basket and combined FX reserves from the four countries
Source: Bloomberg, Standard Chartered
0
20
40
60
80
100
120
140
160
180
0.6
0.7
0.8
0.9
1.0
1.1
Jan-13 Dec-13 Nov-14 Oct-15 Sep-16 Aug-17
Iro
n o
re p
rice/t
on
ne
AU
D/U
SD
AUD/USD Iron ore (RHS)
720
730
740
750
760
770
780
99
100
101
102
103
104
105
106
Dec-16 Feb-17 Apr-17 Jun-17
US
D b
n
Reb
ase
d to
100
on
30 D
ec
20
16
INR, IDR, BRL, RUB basket FX reserves

This reflects the views of the Wealth Management Group 28
Standard Chartered Bank
Global Market Outlook | 31 August 2017
Bonds Equities Commodities Alternative
Strategies
FX Multi-asset
Multi-asset
Focus on EM
sovereign bonds
for income
investors
Asia ex-Japan
equities a key
component of
growth-focused
allocation
Risk management
via high quality
assets provide
stability to
allocation
Figure 51: Key multi-asset views
Allocation Performance
Since Outlook
Since last publication
Balanced 11.5% 0.6%
Multi-asset Income 9.7% 0.6%
Source: Bloomberg, Standard Chartered
Good risk management rewarded
• A strong risk management framework should provide an element of stability against
any short-term bouts of volatility.
• Risk management does not equate to the absence of risk in the allocation. Rather, it
advocates a balanced approach with some exposure to high-quality assets such as
Investment Grade (IG) fixed income.
• Broadening global growth has created opportunities within Emerging Market (EM)
assets. Yield-focused investors can look to EM bonds while growth-focused
investors can look to Asia ex-Japan equities.
In our last Global Market Outlook, we discussed the importance of fixed income as a risk
management tool within an investor’s allocation. Specifically, we wrote ‘For equity
investors enjoying the gains of the last few months, an allocation to fixed income should
act as a good risk management tool and help preserve some of the profit in the event of
market uncertainty’. This approach helped both our balanced and multi-asset income
allocations over the past month. While Developed Market (DM) equities witnessed a bit
of a wobble (EM equities delivered positive returns), positive returns from high quality
fixed income helped our allocations deliver a one-month return that was slightly positive.
The recent market experience reinforces the importance of strong risk management.
Aside from periods of significant rise in yields, an allocation to quality fixed income could
buffer against short bouts of volatility as we move further along in the economic cycle.
However, good risk management does not equal the absence of risk in the allocation.
This is especially relevant given the broader macro backdrop. We continue to see
fundamentals as supportive of risk assets and thus retain our conviction that a balanced
(growth-focused) allocation, which favours equities over corporate bonds, should
outperform a multi-asset income focused allocation.
Figure 52: Allocation to quality fixed income could buffer against short bouts of volatility
Monthly returns of Multi-asset Income components vs. global equity (January 2016 to August 2017)
Source: Bloomberg, Standard Chartered; Quality FI includes G3 Sov, TIPS, DM IG Corp, EM HC Sov IG, Asia
IG Corp. Non-quality FI includes Leveraged loans, US HY, EM HC Sov HY, EM LC Sov.
-7%-6%-5%-4%-3%-2%-1%0%1%2%3%4%5%6%7%8%
Dec-1
5
Ja
n-1
6
Feb
-16
Mar-
16
Ap
r-1
6
May-1
6
Ju
n-1
6
Ju
l-16
Au
g-1
6
Se
p-1
6
Oct-
16
Nov-1
6
Dec-1
6
Ja
n-1
7
Feb
-17
Mar-
17
Ap
r-1
7
May-1
7
Ju
n-1
7
Ju
l-17
Au
g-1
7
Non-core Equity Quality FI Non-quality FI Global Equity
Significant rise in yield
03
02
01
IMPLICATIONS
FOR INVESTORS

This reflects the views of the Wealth Management Group 29
Standard Chartered Bank
Global Market Outlook | 31 August 2017
Bonds Equities Commodities Alternative
Strategies
FX Multi-asset
Make space for Emerging Markets
EM assets have climbed up the rankings within our
investment views, from both equity and fixed income
perspectives, over the course of 2017. EM USD government
and EM local currency government bonds are the two
preferred holdings within fixed income, while Asia ex-Japan
and non-Asia EM are our second and third most-preferred
equity markets, after the Euro area.
With the spotlight (and significant outperformance) focused
on DM assets for the past eight years, investors may well
still be under-exposed to EM assets within their allocation.
Multi-asset income investors could look to add EM
sovereign bonds that offer an attractive yield (5-6%) amid
improving fundamentals of the underlying nations. Growth-
focused investors can look to Asia ex-Japan equities to
capture the benefits of improving growth prospects in EMs
as well as improving corporate earnings.
EM assets generally carry a higher risk than their DM
counterparts and could suffer in the event of a USD
rebound. However, it is important to look at these assets as
part of a diversified allocation rather than on a standalone
basis.
An allocation to these assets could boost the yield profile for
an income investor and add to the capital appreciation
potential for a growth-focused investor. Our suggested
allocations below and on page 31 can serve as a guideline.
Broad exposure to EM local currency bonds
We close our position in INR bonds and roll the proceeds
into the EM local currency bond allocation. Our INR bond
allocation (3%) was initiated in December 2014 within the
multi-asset income strategy. It has performed admirably
since then, delivering 29% in cumulative returns versus the
broader EM local currency bond index, which returned 11%
over the same period.
However, given the strong run we have seen in INR bonds,
we prefer to take a diversified approach to investing in this
asset class going forward. We give up about 1% in yield
based on this switch, but believe the risk-reward is more
balanced as a result of this diversified approach. This further
adds to our EM local currency bond allocation, where we
first initiated an allocation in our mid-year Outlook on 30
June 2017.
Figure 53: Revised multi-asset income allocation and balanced allocation (asset class weight in %)
Source: Standard Chartered
Fixed Income
Long Mat (20+ yrs) 2%Mid Mat (5-7yrs) 3%
TIPS 3%
EM HC Sov IG 4%DM IG Corp 8%
Asia IG Corp 7%Leveraged Loans 9%
US HY 10%EM LC Sov 8%
EM HC Sov HY 4%
Non-core Income
Contigent Convertibles 3%Preferred Equity 3%Real Estate 2%Convertibles 4%Covered Call Strategy 5%
Asia Divi Equity 8%Europe Divi Equity 12%US Divi Equity 5%
Equity Income
Multi-assetIncome
Allocation
Euro ex-UK20%
US20%
DM IG Corp 8%
DM IG Sov 25%
Asia ex-Japan10%
DM HY 10%
Balanced Allocation
Senior Loans 7%

This reflects the views of the Wealth Management Group 30
Standard Chartered Bank
Global Market Outlook | 31 August 2017
Bonds Equities Commodities Alternative
Strategies
FX Multi-asset
Figure 54: A three-pronged approach to assessing income assets
Income potential, capital growth and risk of pullback
Asset Classes Yield
Income
potential
Capital
growth
Risk of
pullback Comments
Fixed Income 4.3 Portfolio anchor; source of yield; some pockets of value, but not
without risks
Leveraged Loans 5.1
Attractive alternative to traditional HY exposure; senior in capital structure to
simple HY bonds; small yield penalty in return; returns positively correlated
to short-term US interest rates, but loan callability a risk
Corporate - US HY 5.7 Valuations remain elevated; attractive yields; default rates contained
EM HC Sovereign Debt 5.2
Need to be selective given diverse risk/reward in IG, HY bonds; high
sensitivity to a rise in US interest rates a risk; commodity exposure may be a
support; valuations reasonable
EM LC Sovereign Debt 6.1 Carry play; policy rates mostly flat or falling; foreign demand a recent risk.
FX stability a positive
Investment Grade* 2.4 Portfolio anchor, structural carry; some interesting ideas, but interest rate
sensitivity a risk
Corporate - DM IG* 2.4 Yield premiums have narrowed, but prices fair; long-term US corporate
bonds look appealing if Fed hiking cycle muted
Corporate - Asia IG 3.4 Cautiously positive. Fairly valued, marginally improving credit quality; key
risks include concentration risk from Chinese issuers and risk of lower
regional demand
TIPS 1.6 Offers value as an alternative to nominal sovereign bonds; impact of a rate
rise similar to G3 sovereigns, but offers exposure to a further rise in US
inflation
Sovereign* 1.4 QE offers strong anchors for sovereign yields, but little, if any, value is left.
Risks include rate hikes and higher inflation. Prefer higher-yielding/high-
quality markets (US, AU, NZ)
Equity Income 4.6 Key source of income and modest upside from capital growth
North America 3.2 Fair to slightly rich valuations; low yields; some sectors attractive
Europe 5.7 Fair valuations; attractive yields; overhang from political risk, mitigated by
improving global growth outlook; improving momentum
Asia ex-Japan 4.0 Good payouts; selectively attractive valuations, but pullback a risk from
challenges in China/US growth, earnings, Fed and leverage.
Non-core Income 4.3 Useful diversifier for income and growth
Preferred 5.4 Attractive yields and exposure to financials; risk from higher rates may not
be completely offset by improvement in banks’ underlying credit
Convertibles 3.6 Moderate economic expansion and gradual pace of rate hikes should be
good for converts. Risk: policy mistake
Property 3.9 Yield diversifier; stable real estate market; risk from higher rates, valuations
stretched in some regions. Potential for large pullbacks
Covered Calls 3.9 Useful income enhancer assuming limited equity upside
Cocos 4.9 Yields have fallen sharply; relatively low sensitivity to rising yields and
improving bank credit quality over the past few years
Source: Bloomberg, Standard Chartered Global Investment Committee; Yield data as of 29 August 2017; *Yield data as of 31 July 2017
For indices used, refer to the end note at the conclusion of this section
Please note: The Financial Conduct Authority (FCA) has introduced Permanent Marketing Restrictions on the sale of CoCos to residents of the EEA
Legend: Attractive potential/low risk Moderate potential/medium risk Unattractive potential/high risk

This reflects the views of the Wealth Management Group 31
Standard Chartered Bank
Global Market Outlook | 31 August 2017
Market performance summary*
Source: MSCI, JPMorgan, Barclays, Citigroup, Dow Jones, HFRX, FTSE,
Bloomberg, Standard Chartered
*All performance shown in USD terms, unless otherwise stated
*YTD performance data from 31 December 2016 to 30 August 2017 and
1-month performance from 30 July 2017 to 30 August 2017
Equity
Year to date 1 month
Global Equities 14.4% -0.1%
Global High Dividend Yield Equities 12.5% 0.2%
Developed Markets (DM) 12.8% -0.4%
Emerging Markets (EM) 28.2% 2.5%
BY COUNTRY
US 11.0% -0.4%
Western Europe (Local) 7.9% -0.8%
Western Europe (USD) 18.2% -0.2%
Japan (Local) 5.1% -1.2%
Japan (USD) 11.2% -0.5%
Australia 12.3% -1.2%
Asia ex- Japan 31.1% 1.9%
Africa 19.4% 1.6%
Eastern Europe 9.2% 6.9%
Latam 24.5% 4.6%
Middle East 6.2% 1.3%
China 41.6% 4.9%
India 28.3% -0.7%
South Korea 30.5% -1.2%
Taiwan 26.9% 1.9%
BY SECTOR
Consumer Discretionary 13.3% -1.4%
Consumer Staples 12.0% -0.5%
Energy -6.0% -2.2%
Financial 13.3% -1.1%
Healthcare 15.3% -0.5%
Industrial 14.3% 0.0%
IT 28.7% 2.0%
Materials 17.9% 2.2%
Telecom 7.0% -0.7%
Utilities 16.7% 3.2%
Global Property Equity/REITS 9.8% -0.2%
Bonds
Year to date 1 month
SOVEREIGN
Global IG Sovereign 7.8% 1.4%
US Sovereign 3.0% 0.9%
EU Sovereign 12.8% 2.6%
EM Sovereign Hard Currency 8.7% 1.6%
EM Sovereign Local Currency 13.5% 1.5%
Asia EM Local Currency 9.2% 0.7%
CREDIT
Global IG Corporates 7.8% 0.9%
Global HY Corporates 8.6% 0.6%
US High Yield 5.9% -0.2%
Europe High Yield 17.8% 1.3%
Asia High Yield Corporates 5.4% 1.1%
Commodity
Year to date 1 month
Diversified Commodity -4.5% -1.6%
Agriculture -11.4% -8.9%
Energy -18.8% -2.8%
Industrial Metal 19.5% 9.0%
Precious Metal 11.2% 3.4%
Crude Oil -13.5% -2.6%
Gold 13.6% 3.1%
FX (against USD)
Year to date 1 month
Asia ex- Japan 4.8% 0.9%
AUD 9.7% -1.0%
EUR 13.0% 1.1%
GBP 4.7% -1.6%
JPY 6.1% 0.4%
SGD 6.6% -0.1%
Alternatives
Year to date 1 month
Composite (All strategies) 3.4% -0.1%
Relative Value 2.4% -0.1%
Event Driven 5.3% -0.3%
Equity Long/Short 4.2% -0.5%
Macro CTAs 0.8% 0.7%

This reflects the views of the Wealth Management Group 32
Standard Chartered Bank
Global Market Outlook | 31 August 2017
Events calendar
Legend: X – Date not confirmed | ECB – European Central Bank | FOMC – Federal Open Market Committee | BoJ – Bank of Japan
JULY
AUGUST
SEPTEMBER
OCTOBER
NOVEMBER
DECEMBER
JANUARY
FEBRUARY
MARCH
APRIL
MAY
JUNE
01 India rolls out nationwide Goods
and Services Tax (GST)
07-08 G20 Summit in Germany
20 BoJ policy decision
20 ECB policy decision
27 FOMC policy decision
NA
24 Germany's General
Elections
07 ECB policy decision
21 FOMC policy decision
21 BoJ policy decision
X China's 19th National Party
Congress
26 ECB policy decision
31 BoJ policy decision
02 FOMC policy decision
14 ECB meeting
14 FOMC policy decision
21 BoJ policy decision
23 BoJ policy decision
25 ECB policy decision
01 FOMC policy decision
X Italy general elections
08 ECB policy decision
09 BoJ policy decision
22 FOMC policy decision
26 ECB policy decision
27 BoJ policy decision
03 FOMC policy decision
14 FOMC policy decision
14 ECB policy decision
15 BoJ policy decision

This reflects the views of the Wealth Management Group 33
Standard Chartered Bank
Global Market Outlook | 31 August 2017
Wealth management advisory publications
An
nu
al
Mo
nth
ly
Annual Outlook
Highlights our key investment
themes for the year, the asset
classes we expect to outperform
and the likely scenarios as we
move through the year.
We
ek
ly
Weekly Market View
Update on recent developments in
global financial markets and their
implications for our investment views.
Global Market Outlook
Our monthly publication captures the
key investment themes and asset
allocation views of the Global
Investment Committee.
Market Watch
Analyses key market developments
and their likely impacts on our
investment views.
FX Strategy
Weekly update on our currency market
views, predominantly from a technical
standpoint.
We
ek
ly
Ad
ho
c
Investment Brief
Highlights our key investment themes for
the year, the asset classes we expect to
outperform and the likely scenarios as we
move through the year.
Ad
ho
c

This reflects the views of the Wealth Management Group 34
Standard Chartered Bank
Global Market Outlook | 31 August 2017
The team
Our experience and expertise help you navigate markets and provide actionable insights to reach your investment goals.
Alexis Calla*
Global Head, Investment Advisory
and Strategy,
Chair of the Global Investment Council
Steve Brice* Chief Investment Strategist
Aditya Monappa*, CFA Head, Asset Allocation and
Portfolio Solutions
Clive McDonnell* Head, Equity
Investment Strategy
Audrey Goh, CFA Director, Asset Allocation and
Portfolio Solutions
Manpreet Gill* Head, FICC
Investment Strategy
Rajat Bhattacharya Investment Strategist
Arun Kelshiker*, CFA Executive Director,
Asset Allocation and Portfolio Solutions
Tariq Ali, CFA Investment Strategist
Abhilash Narayan Investment Strategist
Trang Nguyen Analyst, Asset Allocation and
Portfolio Solutions
Jeff Chen Analyst, Asset Allocation and
Portfolio Solutions
DJ Cheong Investment Strategist
Jill Yip, CFA Investment Strategist
* Core Global Investment Council voting members

Standard Chartered Bank
Global Market Outlook | 31 August 2017
Disclosure appendix
THIS IS NOT A RESEARCH REPORT AND HAS NOT BEEN PRODUCED BY A RESEARCH UNIT.
This document is not research material and it has not been prepared in accordance with legal requirements designed to
promote the independence of investment research and is not subject to any prohibition on dealing ahead of the dissemination
of investment research. This document does not necessarily represent the views of every function within Standard Chartered
Bank, particularly those of the Global Research function.
Standard Chartered Bank is incorporated in England with limited liability by Royal Charter 1853 Reference Number ZC18. The
Principal Office of the Company is situated in England at 1 Basinghall Avenue, London, EC2V 5DD. Standard Chartered Bank
is authorised by the Prudential Regulation Authority and regulated by the Financial Conduct Authority and Prudential
Regulation Authority.
Banking activities may be carried out internationally by different Standard Chartered Bank branches, subsidiaries and affiliates
(collectively “SCB”) according to local regulatory requirements. With respect to any jurisdiction in which there is a SCB ent ity,
this document is distributed in such jurisdiction by, and is attributable to, such local SCB entity. Recipients in any jurisdiction
should contact the local SCB entity in relation to any matters arising from, or in connection with, this document. Not all
products and services are provided by all SCB entities.
This document is being distributed for general information only and it does not constitute an offer, recommendation or
solicitation to enter into any transaction or adopt any hedging, trading or investment strategy, in relation to any securities or
other financial instruments. This document is for general evaluation only, it does not take into account the specific investment
objectives, financial situation or particular needs of any particular person or class of persons and it has not been prepared for
any particular person or class of persons.
Investment involves risks. The prices of investment products fluctuate, sometimes dramatically. The price of investment
products may move up or down, and may become valueless. It is as likely that losses will be incurred rather than profit made
as a result of buying and selling investment products. You should not rely on any contents of this document in making any
investment decisions. Before making any investment, you should carefully read the relevant offering documents and seek
independent legal, tax and regulatory advice. In particular, we recommend you to seek advice regarding the suitability of the
investment product, taking into account your specific investment objectives, financial situation or particular needs, before you
make a commitment to purchase the investment product.
Opinions, projections and estimates are solely those of SCB at the date of this document and subject to change without notice.
Past performance is not indicative of future results and no representation or warranty is made regarding future performance.
Any forecast contained herein as to likely future movements in rates or prices or likely future events or occurrences constitutes
an opinion only and is not indicative of actual future movements in rates or prices or actual future events or occurrences (as
the case may be). This document has not been and will not be registered as a prospectus in any jurisdiction and it is not
authorised by any regulatory authority under any regulations.
SCB makes no representation or warranty of any kind, express, implied or statutory regarding, but not limited to, the accuracy
of this document or the completeness of any information contained or referred to in this document. This document is
distributed on the express understanding that, whilst the information in it is believed to be reliable, it has not been
independently verified by us. SCB accepts no liability and will not be liable for any loss or damage arising directly or indirectly
(including special, incidental or consequential loss or damage) from your use of this document, howsoever arising, and
including any loss, damage or expense arising from, but not limited to, any defect, error, imperfection, fault, mistake or
inaccuracy with this document, its contents or associated services, or due to any unavailability of the document or any part
thereof or any contents.
SCB, and/or a connected company, may at any time, to the extent permitted by applicable law and/or regulation, be long or
short any securities, currencies or financial instruments referred to on this document or have a material interest in any such
securities or related investment, or may be the only market maker in relation to such investments, or provide, or have provided
advice, investment banking or other services, to issuers of such investments. Accordingly, SCB, its affiliates and/or
subsidiaries may have a conflict of interest that could affect the objectivity of this document. This document must not be
reproduced, forwarded or otherwise made available to any other person without the express written consent of SCB, nor

Standard Chartered Bank
Global Market Outlook | 31 August 2017
should it be distributed into any other jurisdiction unless permitted by the local laws and regulations of that jurisdiction. Neither
SCB nor any of its directors, employees or agents accept any liability whatsoever for the actions of third parties in this respect.
Copyright: Standard Chartered Bank 2017. Copyright in all materials, text, articles and information contained herein is the
property of, and may only be reproduced with permission of an authorised signatory of, Standard Chartered Bank. Copyright in
materials created by third parties and the rights under copyright of such parties are hereby acknowledged. Copyright in all
other materials not belonging to third parties and copyright in these materials as a compilation vests and shall remain at all
times copyright of Standard Chartered Bank and should not be reproduced or used except for business purposes on behalf of
Standard Chartered Bank or save with the express prior written consent of an authorised signatory of Standard Chartered
Bank. All rights reserved. © Standard Chartered Bank 2017.
Standard Chartered Private Bank is the private banking division of SCB. Private banking activities may be carried out
internationally by different SCB legal entities and affiliates according to local regulatory requirements. Not all products and
services are provided by all SCB branches, subsidiaries and affiliates. Some of the SCB entities and affiliates only act as
representatives of the Standard Chartered Private Bank, and may not be able to offer products and services, or offer advice to
clients. They serve as points of contact only.
This document is being distributed in China by, and is attributable to, Standard Chartered Bank (China) Limited which is mainly
regulated by China Banking Regulatory Commission (CBRC), State Administration of Foreign Exchange (SAFE), and People’s
Bank of China (PBOC).
Market Abuse Regulation (MAR) Disclaimer
Standard Chartered Bank is incorporated in England with limited liability by Royal Charter 1853 Reference Number ZC18. The
Principal Office of the Company is situated in England at 1 Basinghall Avenue, London, EC2V 5DD. Standard Chartered Bank
is authorised by the Prudential Regulation Authority and regulated by the Financial Conduct Authority and Prudential
Regulation Authority. Banking activities may be carried out internationally by different Standard Chartered Bank branches,
subsidiaries and affiliates (collectively “SCB”) according to local regulatory requirements. Opinions may contain outright "buy",
"sell", "hold" or other opinions. The time horizon of this opinion is dependent on prevailing market conditions and there is no
planned frequency for updates to the opinion.
This opinion is not independent of SCB’s own trading strategies or positions. SCB and/or its affiliates or its respective officers,
directors, employee benefit programmes or employees, including persons involved in the preparation or issuance of this
document may at any time, to the extent permitted by applicable law and/or regulation, be long or short any securities or
financial instruments referred to in this document or have material interest in any such securities or related investments.
Therefore, it is possible, and you should assume, that SCB has a material interest in one or more of the financial instruments
mentioned herein. If specific companies are mentioned in this communication, please note that SCB may at times do business
or seek to do business with the companies covered in this communication; hold a position in, or have economic exposure to,
such companies; and/or invest in the financial products issued by these companies. Further, SCB may be involved in activities
such as dealing in, holding, acting as market makers or liquidity providers, or performing financial or advisory services
including but not limited to, lead manager or co-lead manager in relation to any of the products referred to in this
communication. SCB may have received compensation for these services and activities. Accordingly, SCB may have a
conflict of interest that could affect the objectivity of this communication.
SCB has in place policies and procedures, logical access controls and physical information walls to help ensure confidential
information, including material non-public or inside information is not disclosed unless in line with its policies and procedures
and the rules of its regulators.
Please refer to https://www.sc.com/en/banking-services/market-disclaimer.html for more detailed disclosures, including past
opinions in the last 12 months and conflict of interests, as well as disclaimers. This document must not be forwarded or
otherwise made available to any other person without the express written consent of SCB.
THIS IS NOT A RESEARCH REPORT AND HAS NOT BEEN PRODUCED BY A RESEARCH UNIT.
Related Documents