Anton Löf Senior Iron Ore Analyst COO, Raw Materials Group [email protected] Global iron ore: new import areas and the Chinese slowdown? Mining on top: Stockholm

Global iron ore: new import areas and Chinese slowdown?
Aug 20, 2015
Welcome message from author
This document is posted to help you gain knowledge. Please leave a comment to let me know what you think about it! Share it to your friends and learn new things together.
Transcript

Anton Löf
Senior Iron Ore Analyst COO, Raw Materials Group
Global iron ore: new import areas and the
Chinese slowdown?
Mining on top: Stockholm

• The Iron ore industry
• China
• New import areas?
• China today
• New export areas?
• Iron ore prices
• Summary
Outline
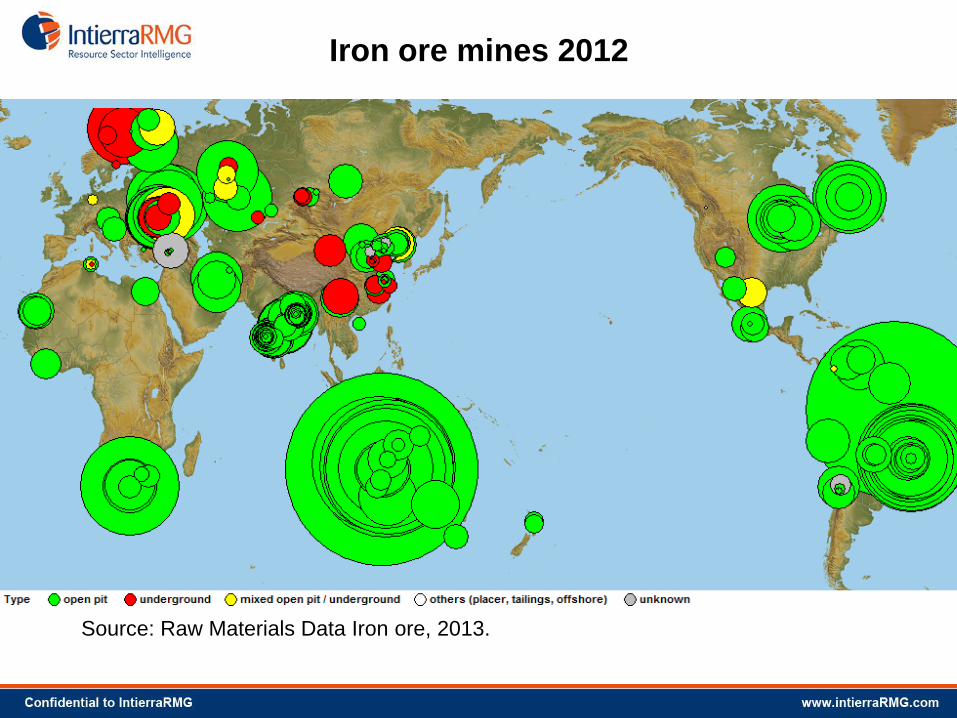
Iron ore mines 2012
Source: Raw Materials Data Iron ore, 2013.
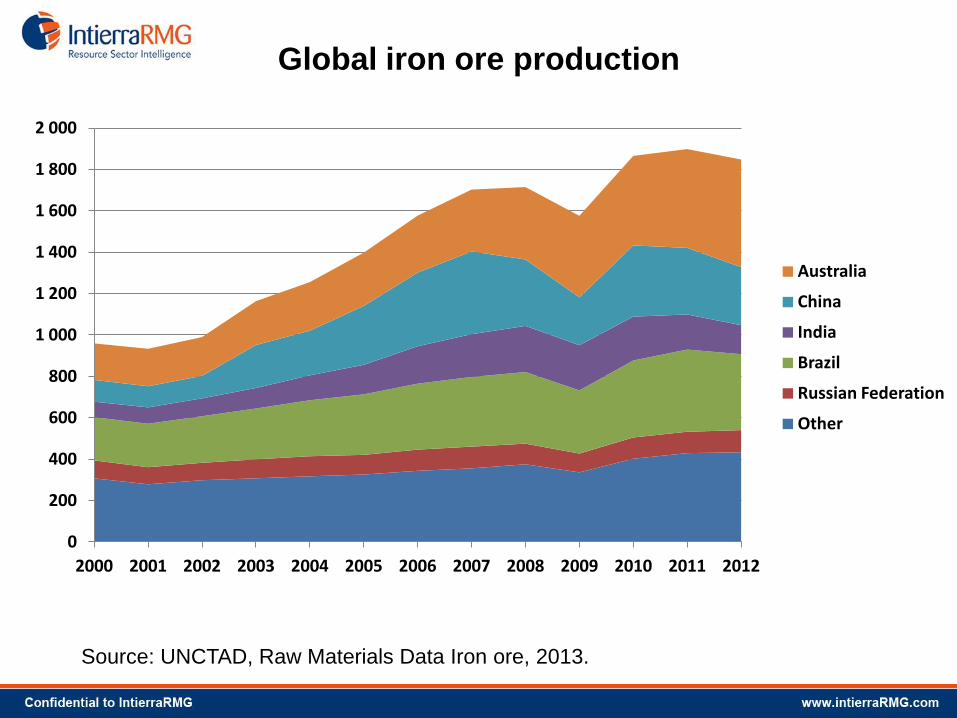
Global iron ore production
Source: UNCTAD, Raw Materials Data Iron ore, 2013.
0
200
400
600
800
1 000
1 200
1 400
1 600
1 800
2 000
2000 2001 2002 2003 2004 2005 2006 2007 2008 2009 2010 2011 2012
Australia
China
India
Brazil
Russian Federation
Other
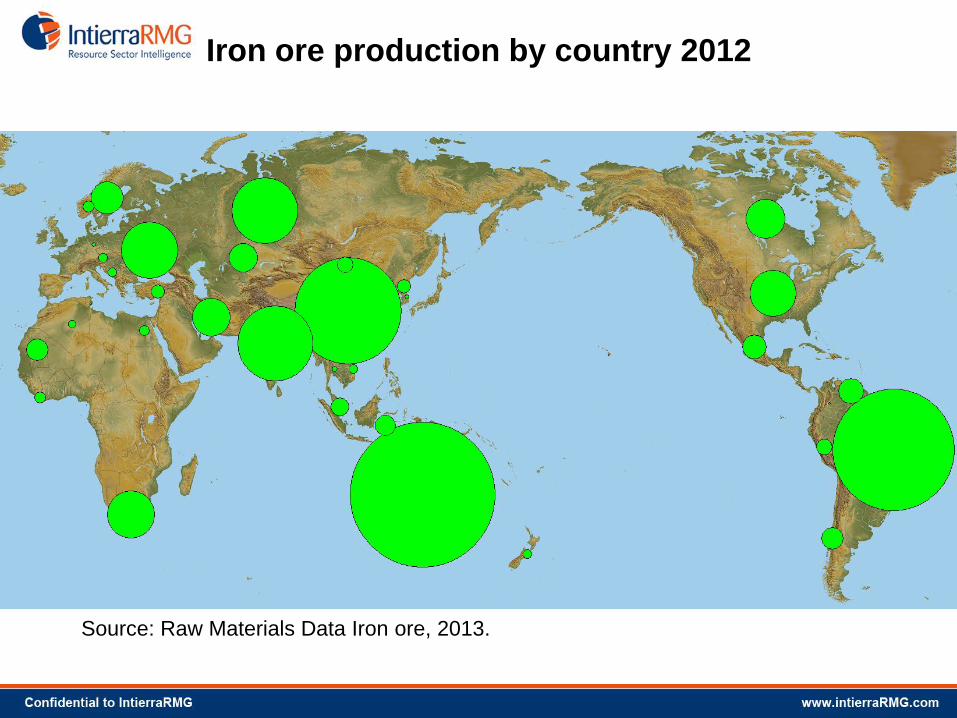
Iron ore production by country 2012
Source: Raw Materials Data Iron ore, 2013.

Crude steel production
0
200 000
400 000
600 000
800 000
1 000 000
1 200 000
1 400 000
1 600 000
1 800 000
kt
Total world crude steel production

Crude steel production
0
200 000
400 000
600 000
800 000
1 000 000
1 200 000
1 400 000
1 600 000
1 800 000
19
93
19
94
19
95
19
96
19
97
19
98
19
99
20
00
20
01
20
02
20
03
20
04
20
05
20
06
20
07
20
08
20
09
20
10
20
11
20
12
kt
Chinese influence on total crude steel production
China
Rest of the world
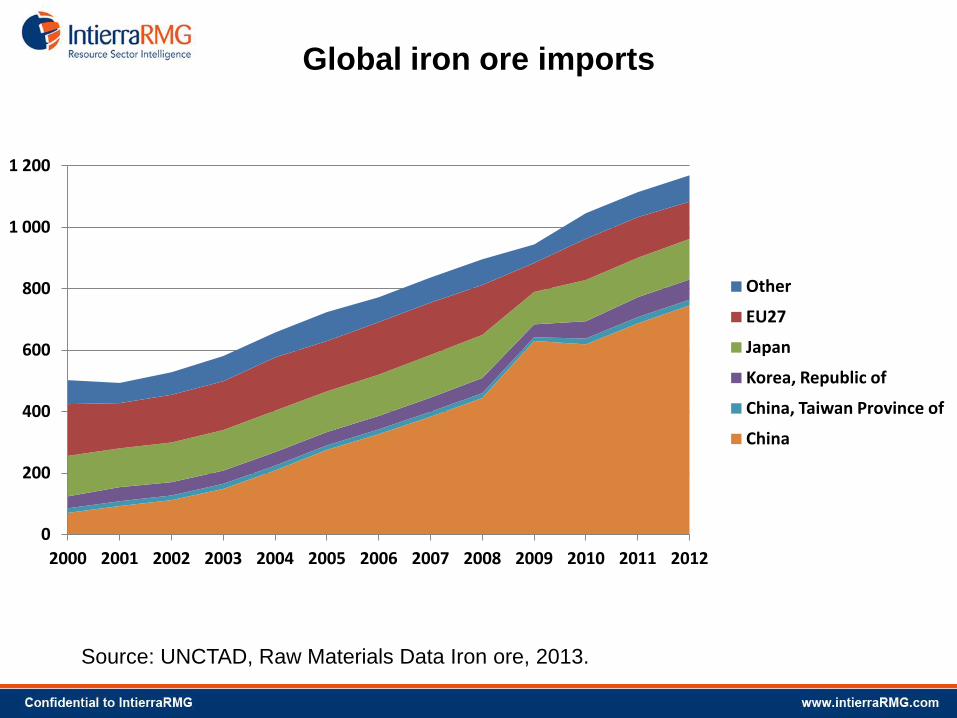
Global iron ore imports
Source: UNCTAD, Raw Materials Data Iron ore, 2013.
0
200
400
600
800
1 000
1 200
2000 2001 2002 2003 2004 2005 2006 2007 2008 2009 2010 2011 2012
Other
EU27
Japan
Korea, Republic of
China, Taiwan Province of
China
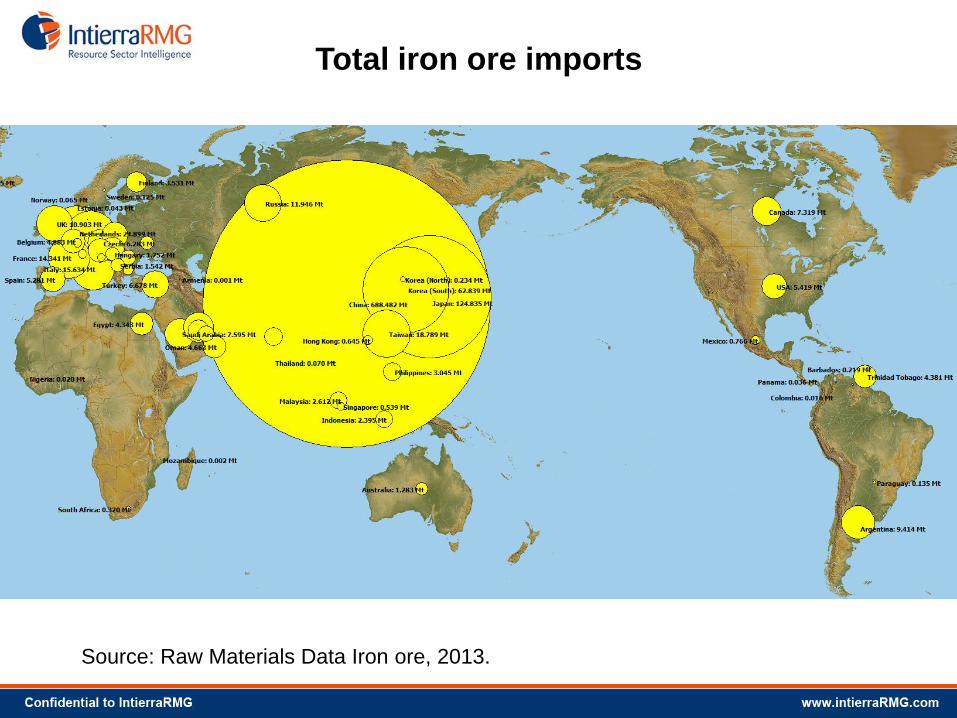
Total iron ore imports
Source: Raw Materials Data Iron ore, 2013.

Chinese population
—
10.0
20.0
30.0
40.0
50.0
60.0
70.0
80.0
—
200 000
400 000
600 000
800 000
1 000 000
1 200 000
1 400 000
1 600 000
1990 1995 2000 2005 2010 2015 2020 2025 2030
Chinese population
China urban population
Proportion urban population

WORLD MINING to 2030
0
10
20
30
40
50
60
70
1850 1870 1890 1910 1930 1950 1970 1990 2010 2030
Europe
USA
China
USSR/CIS
Australia/Canada
6 resource rich developing
countries
Sources: Raw Materials Data, Stockholm and Sames.
% of global mining

World population
—
10.0
20.0
30.0
40.0
50.0
60.0
70.0
—
1 000 000
2 000 000
3 000 000
4 000 000
5 000 000
6 000 000
7 000 000
8 000 000
9 000 000
1990 1995 2000 2005 2010 2015 2020 2025 2030
Chart Title
total population
total urbanised population
proportion urban

Potential new importers, population
—
200 000
400 000
600 000
800 000
1 000 000
1 200 000
1 400 000
1 600 000
19
90
19
95
20
00
20
05
20
10
20
15
20
20
20
25
20
30
India
MENA
Indonesia
—
10
20
30
40
50
60
70
19
90
19
95
20
00
20
05
20
10
20
15
20
20
20
25
20
30
India
MENA
Indonesia
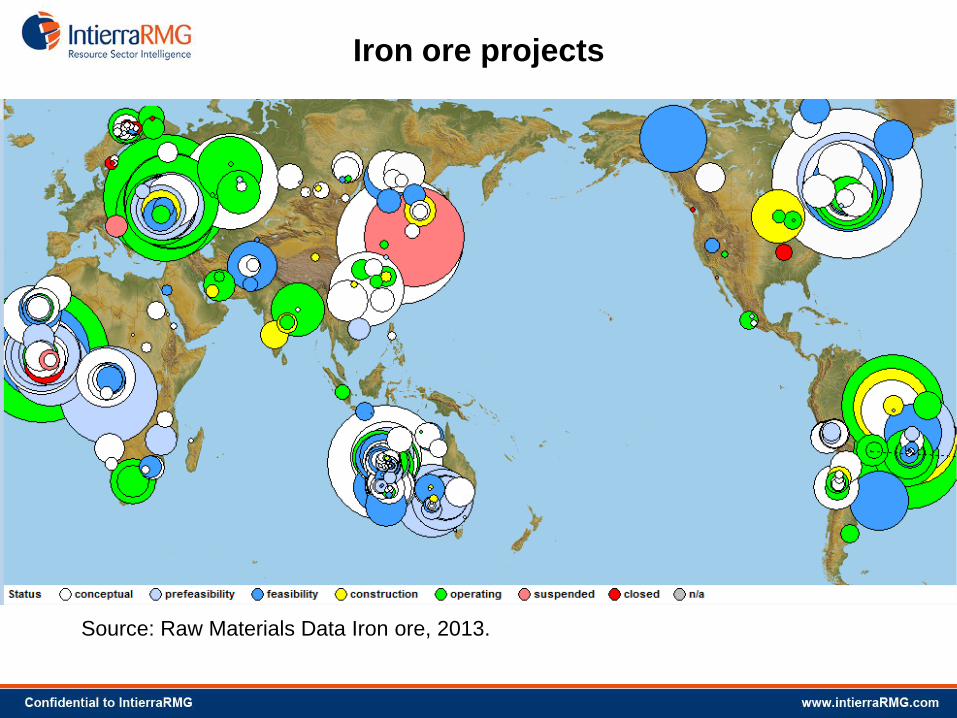
Iron ore projects
Source: Raw Materials Data Iron ore, 2013.

Chinese crude steel production
0
10000
20000
30000
40000
50000
60000
70000
80000
Jan Feb Mar Apr May Jun Jul Aug Sep Oct Nov Dec
kt
2009
2010
2011
2012
2013
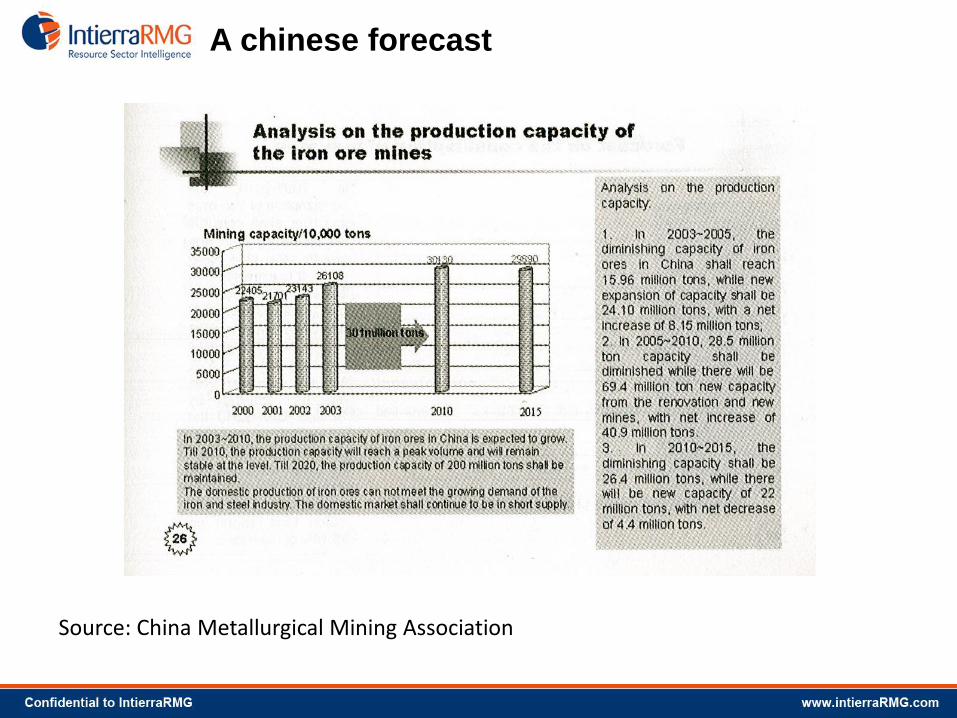
A chinese forecast
Source: China Metallurgical Mining Association
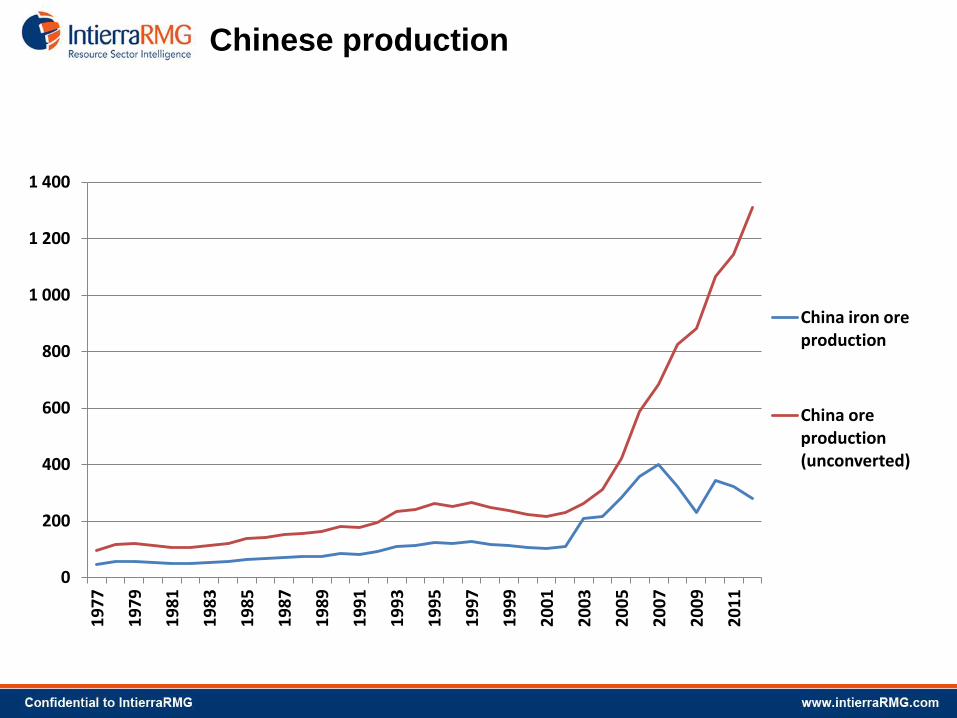
Chinese production
0
200
400
600
800
1 000
1 200
1 400
19
77
19
79
19
81
19
83
19
85
19
87
19
89
19
91
19
93
19
95
19
97
19
99
20
01
20
03
20
05
20
07
20
09
20
11
China iron ore production
China ore production (unconverted)

World iron ore demand
0
500
1000
1500
2000
2500
2000 2001 2002 2003 2004 2005 2006 2007 2008 2009 2010 2011 2012 2013 2014 2015
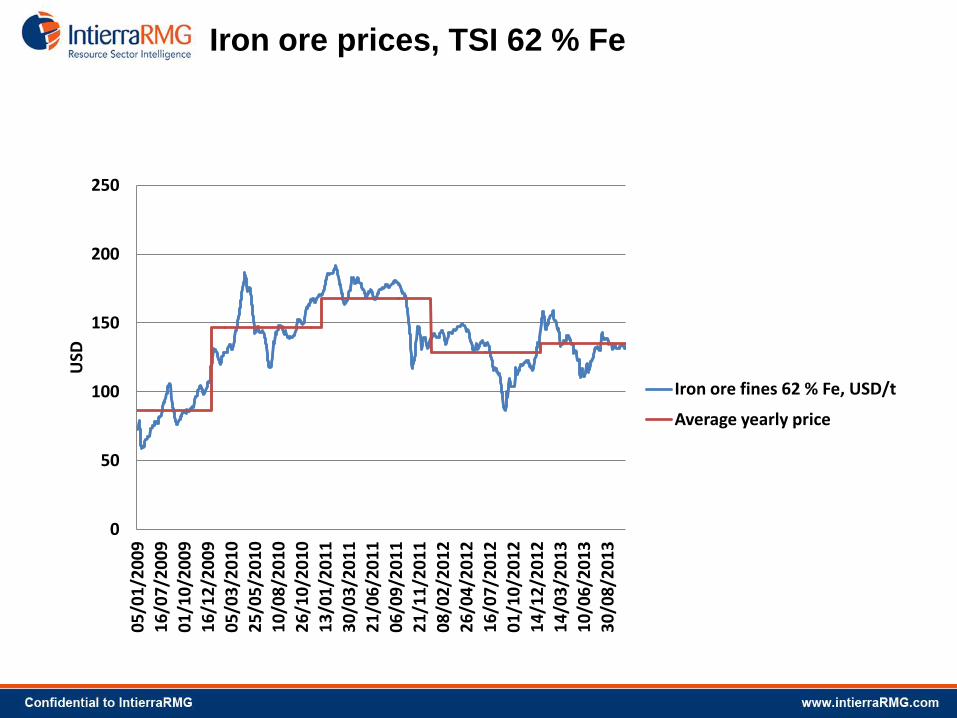
Iron ore prices, TSI 62 % Fe
0
50
100
150
200
250
05
/01
/20
09
16
/07
/20
09
01
/10
/20
09
16
/12
/20
09
05
/03
/20
10
25
/05
/20
10
10
/08
/20
10
26
/10
/20
10
13
/01
/20
11
30
/03
/20
11
21
/06
/20
11
06
/09
/20
11
21
/11
/20
11
08
/02
/20
12
26
/04
/20
12
16
/07
/20
12
01
/10
/20
12
14
/12
/20
12
14
/03
/20
13
10
/06
/20
13
30
/08
/20
13
USD
Iron ore fines 62 % Fe, USD/t
Average yearly price
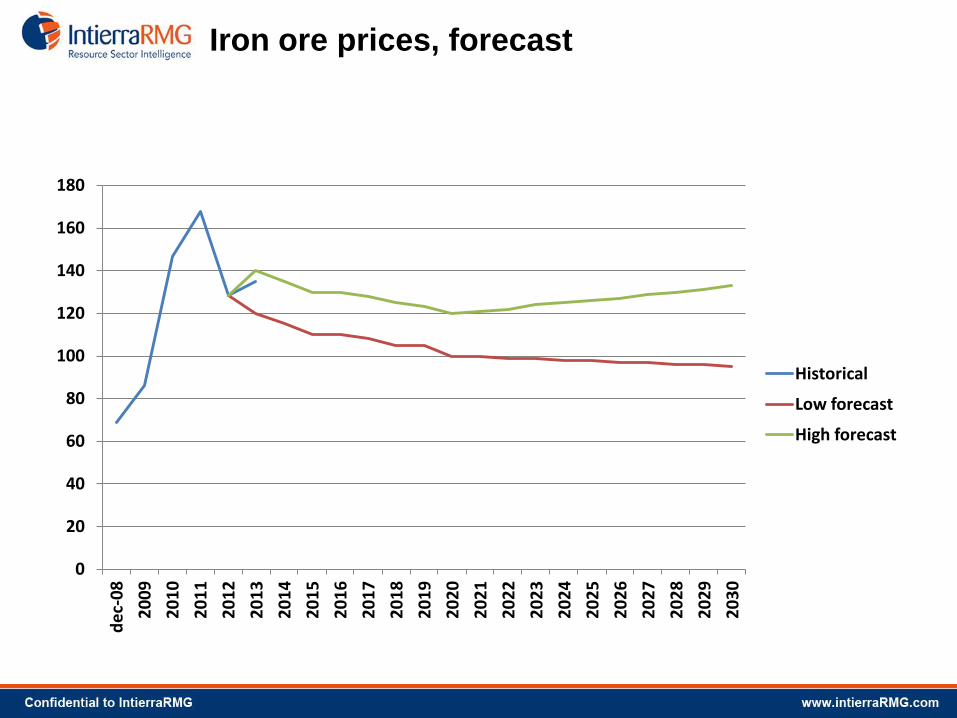
Iron ore prices, forecast
0
20
40
60
80
100
120
140
160
180
de
c-0
8
20
09
20
10
20
11
20
12
20
13
20
14
20
15
20
16
20
17
20
18
20
19
20
20
20
21
20
22
20
23
20
24
20
25
20
26
20
27
20
28
20
29
20
30
Historical
Low forecast
High forecast

Conclusions
Summary
Molybdenum drawing: Kaianders Sempler.
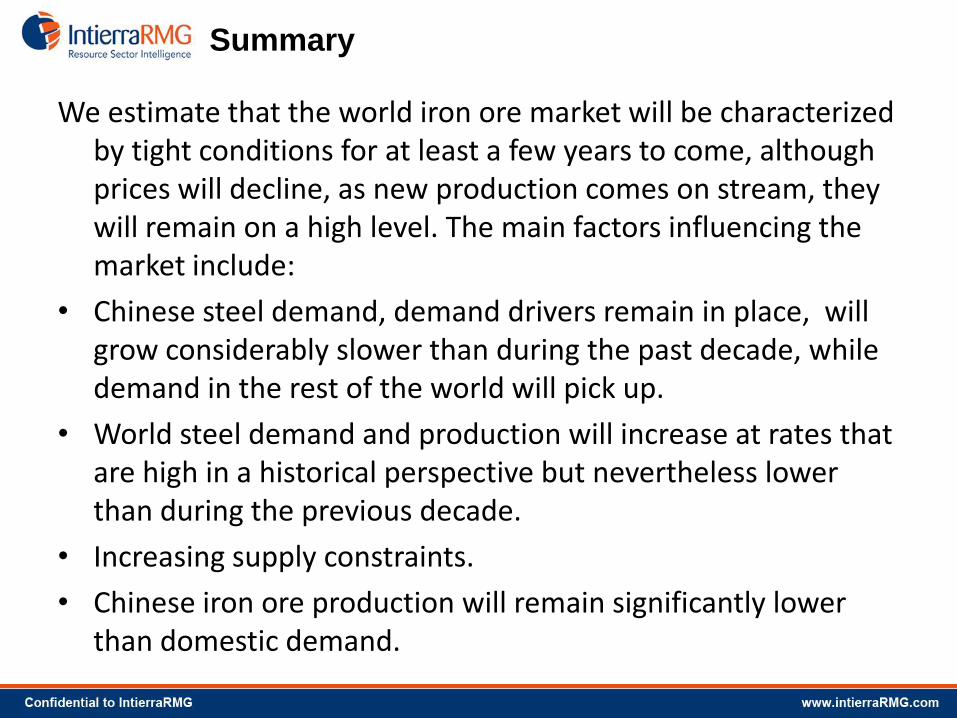
Summary
We estimate that the world iron ore market will be characterized by tight conditions for at least a few years to come, although prices will decline, as new production comes on stream, they will remain on a high level. The main factors influencing the market include:
• Chinese steel demand, demand drivers remain in place, will grow considerably slower than during the past decade, while demand in the rest of the world will pick up.
• World steel demand and production will increase at rates that are high in a historical perspective but nevertheless lower than during the previous decade.
• Increasing supply constraints.
• Chinese iron ore production will remain significantly lower than domestic demand.
Anton Löf PO Box 3127 SE-169 03 Solna, Sweden [email protected] Tel: +46-8-744 00 65 Fax: +46-8-744 0066
www.rmg.se www.intierrarmg.se
Thank you !
NIckel drawing: Kaianders Sempler.

Metals first isolated in
Sweden/Finland
Please visit www.rmg.se
Related Documents