WP/14/47 Disentangling India’s Investment Slowdown Rahul Anand and Volodymyr Tulin

Welcome message from author
This document is posted to help you gain knowledge. Please leave a comment to let me know what you think about it! Share it to your friends and learn new things together.
Transcript
WP/14/47
Disentangling India’s Investment Slowdown
Rahul Anand and Volodymyr Tulin
© 2014 International Monetary Fund WP/14/47
IMF Working Paper
Asia and Pacific Department
Disentangling India’s Investment Slowdown1
Prepared by Rahul Anand and Volodymyr Tulin
Authorized for distribution by Paul Cashin
March 2014
Abstract
This paper documents the recent slowdown in investment in India and explores its underlying causes. The sharp investment deceleration has sparked an intense debate about the role of interest rates, as well as business confidence and economic policy uncertainty. Our results suggest that while explaining aggregate investment activity better than nominal interest rates, real interest rates account for only one quarter of the explained investment downturn. In addition, standard macro-financial variables do not fully explain the recent investment slump. Using a new measure of economic policy uncertainty, the results suggest that heightened uncertainty and deteriorating business confidence have played a key role in the recent investment slowdown.
JEL Classification Numbers: D80, D81, E22, E44, D80, G18, L50
Keywords: Investments; India; Policy Uncertainty.
Authors’ E-Mail Addresses: [email protected]; [email protected]
1 We are grateful to Paul Cashin, Laura Papi, Thomas Richardson, and our colleagues in the Asia and Pacific Department for helpful comments and discussions. We benefited from the feedback received from seminar participants at the NIPFP-DEA Annual Research Conference, Ministry of Finance, Government of India, and the Reserve Bank of India. We thank Scott Baker, Nicholas Bloom, and Steven Davis for constructing and sharing the India Economic Policy Uncertainty Index data. Errors and omissions are the authors’ sole responsibility.
This Working Paper should not be reported as representing the views of the IMF. The views expressed in this Working Paper are those of the author(s) and do not necessarily represent those of the IMF or IMF policy. Working Papers describe research in progress by the author(s) and are published to elicit comments and to further debate.
2
Contents Page
I. Introduction ..........................................................................................................................3
II. Background ..........................................................................................................................4A. The Recent Investment Slowdown in India: Some Facts ..............................................4 B. What Caused the Investment Slowdown? ......................................................................5 C. Where are Interest Rates in India? .................................................................................6 D. Measuring Economic Policy Uncertainty ......................................................................7
III. The Role of Interest Rates in the Investment Slowdown .....................................................9
IV. The Role of Uncertainty .....................................................................................................12A. Extending the Basic Investment Model .......................................................................12 B. Refining the Link between Uncertainty and Investment Flows ...................................13
V. Conclusions and Policy Implications ..................................................................................15
Appendix I. Measuring Economic Policy Uncertainty ............................................................17
Figures 1. GDP Growth and Capital Formation ...................................................................................42. Shelved and New Investment Projects .................................................................................53. Nominal Interest Rates .........................................................................................................74. Real Interest Rates ...............................................................................................................75. Inflation and Fiscal Balance .................................................................................................76. Components of Policy Uncertainty Index ............................................................................87. Overall Business Confidence and Economic Policy Uncertainty ........................................88. Economic Policy Uncertainty and New Investment Projects ..............................................89. Relative Costs of Investment Goods ....................................................................................910. Fixed Investments Growth: Explained vs. Actual .............................................................12
Tables 1. Regression Analysis of Investments: Basic Model ............................................................112. Regression Analysis of Investments: Adding Policy Uncertainty .....................................133. Regression Analysis of New Investments..........................................................................144. Regression Analysis of Shelved Investments ....................................................................14
References ................................................................................................................................16
3
I. INTRODUCTION
India’s growth has slowed substantially, after being strong both before and after the global financial crisis (GFC). Real GDP growth fell to 4¾ percent in the second quarter of 2013/14, from an average of 9½ percent during 2009/10–2010/11. Weak private investment is the main culprit. Gross fixed capital formation, which grew by over 15 percent annually before the 2008 and buoyed growth to an annual average of 8⅔ percent in 2003/04–2007/08, increased only by 1¾ percent in 2012/13. Furthermore, forward-looking data on investment project announcements suggests anemic new capital investment and surging delays in implementation of ongoing investment projects, thus pointing to a subdued near-term investment outlook.
The recent investment slowdown has sparked an intense debate in India about the role of interest rates and the role of policy uncertainty and business confidence in slowing investments. Economists typically argue that real interest rates have been low, even though nominal rates have gradually risen after the substantial easing of 2008/09. On the other hand, some representatives of the business community maintain that high nominal lending interest rates have played a key role in the current investment slump. Not surprisingly, the two groups have argued for different monetary policy actions to respond to this situation. The objective of this paper is to ascertain the determinants of the current investment slowdown. In this paper, we try to answer the following questions:
- Which interest rate matters for investment – real or nominal? - How much of the investment slowdown could be attributed to higher interest rates? - To what extent could the investment slowdown be due to policy and regulatory
uncertainty? This paper makes three contributions. First, the paper exploits a newly created economic policy uncertainty index by Baker and others (2013) to study the impact of economic policy and regulatory uncertainty on the recent investment slowdown in India. To the best of our knowledge, this is the first such attempt to quantify the impact of uncertainty on the investment slowdown in India. Second, we find that real interest rates explain investment activity better than nominal interest rates. Our results suggest that real interest rates account for only one quarter of the explained investment downturn. However, we find that standard macro-financial variables (interest rates, external demand, relative prices, global financial market volatility and others) do not fully explain the recent investment slump. Finally, using the new measure of economic policy uncertainty, the results suggest that heightened uncertainty and deteriorating business confidence have played a key role in the recent investment slowdown. The paper is organized as follows. In Section II, we present some stylized facts to further motivate the analysis. Section III presents the results of our simple econometric models to
4
answer whether nominal or real rates matter for investment, and estimates the role of various factors in explaining the investment slowdown. In Section IV, we discuss the role of policy uncertainty in the current investment slowdown. Section V concludes.
II. BACKGROUND
We begin by presenting some stylized facts about the recent investment slowdown in India. Next, we present some key explanations offered to explain this slowdown. As the debate is centered on the role of interest rates in the recent slowdown, we also illustrate the evolution of different interest rates over time. Finally, we present the measure of India’s economic policy uncertainty developed and constructed by Baker, Bloom, and Davis (Baker and others, 2013) in the context of India’s investment activity.
A. The Recent Investment Slowdown in India: Some Facts
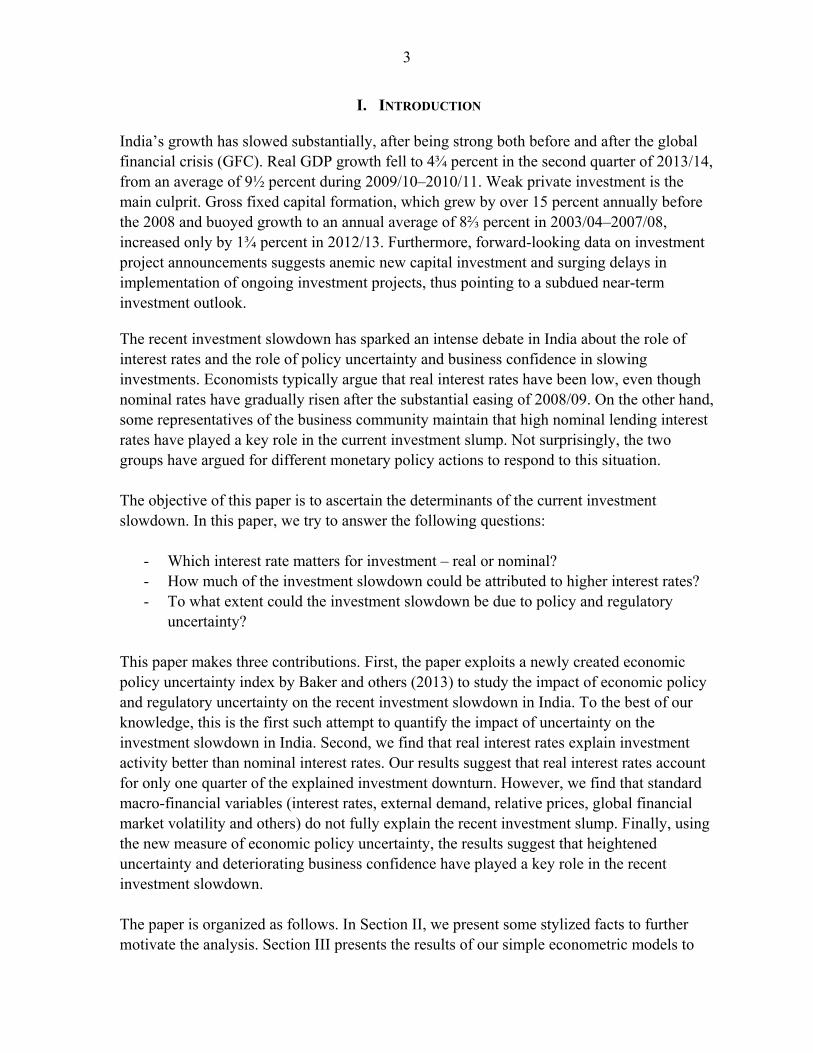
The marked accelaration in economic growth experienced in the years preceding the global financial crisis was tied to a surge in investment activity. Gross fixed investments as a share of GDP rose from an average of about 24 percent during 1996/97–2003/04 to a peak of nearly 34 percent in 2008Q2. Also, economic growth in non-agricultural sectors of the economy picked up from an average of about 6¾ percent during 1996/97–2003/04 to nearly 10½ percent during 2004/05–2007/08 (Figure 1).
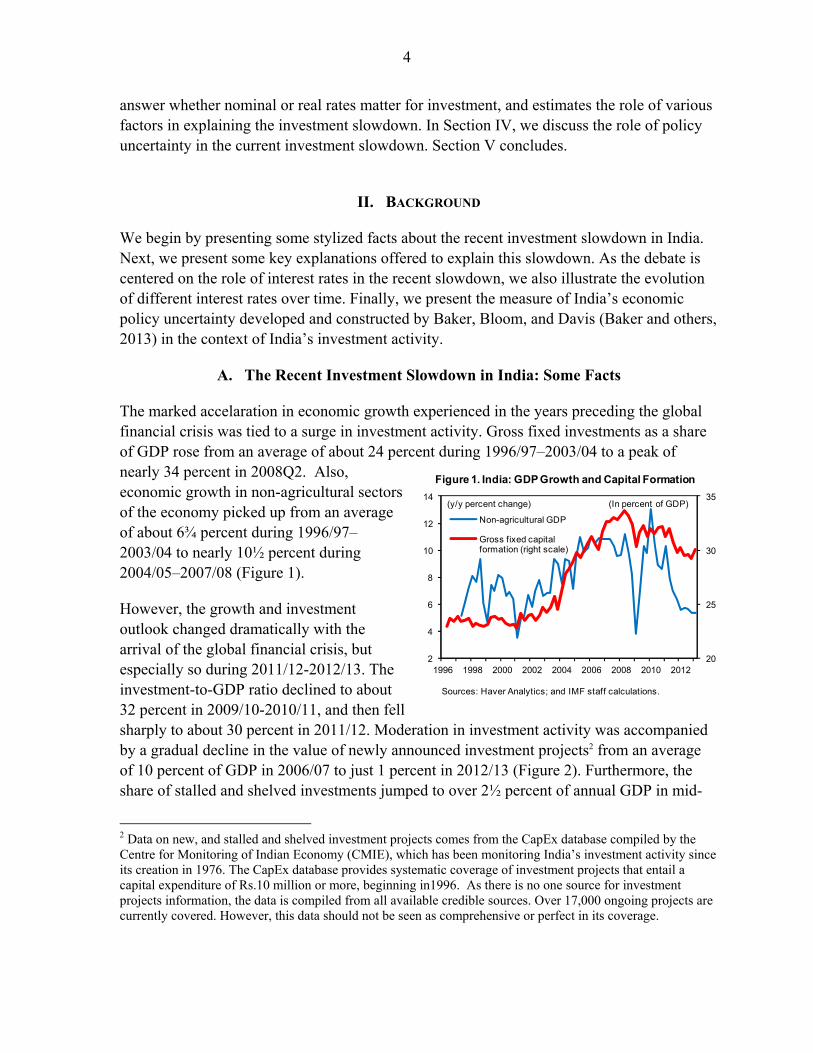
However, the growth and investment outlook changed dramatically with the arrival of the global financial crisis, but especially so during 2011/12-2012/13. The investment-to-GDP ratio declined to about 32 percent in 2009/10-2010/11, and then fell sharply to about 30 percent in 2011/12. Moderation in investment activity was accompanied by a gradual decline in the value of newly announced investment projects2 from an average of 10 percent of GDP in 2006/07 to just 1 percent in 2012/13 (Figure 2). Furthermore, the share of stalled and shelved investments jumped to over 2½ percent of annual GDP in mid-
2 Data on new, and stalled and shelved investment projects comes from the CapEx database compiled by the Centre for Monitoring of Indian Economy (CMIE), which has been monitoring India’s investment activity since its creation in 1976. The CapEx database provides systematic coverage of investment projects that entail a capital expenditure of Rs.10 million or more, beginning in1996. As there is no one source for investment projects information, the data is compiled from all available credible sources. Over 17,000 ongoing projects are currently covered. However, this data should not be seen as comprehensive or perfect in its coverage.
Figure 1. India: GDP Growth and Capital Formation
Sources: Haver Analytics; and IMF staff calculations.
20
25
30
35
2
4
6
8
10
12
14
1996 1998 2000 2002 2004 2006 2008 2010 2012
Non-agricultural GDP
Gross fixed capital formation (right scale)
(y/y percent change) (In percent of GDP)
5
2011 after moderating slightly following a spike in early-2009. A similar trend is also apparent in the number of stalled mega and major investment projects3, as recorded in the Central Sector Projects database. As the share of stalled projects remains elevated, and the pipeline of new projects is exceptionally thin, concerns about India’s growth outlook remain. Acknowledging this issue, the Government of India set up a Cabinet Committee on Investment (CCI) as well as a Project Monitoring Group (PMG), to fast track stalled large-scale investment projects. In this regard, the fact that the CCI has cleared investment projects worth about 5 percent of GDP since its inception in January 2013 is an encouraging development, which will likely lead to a pick up in investment activity as cleared projects are implemented.
B. What Caused the Investment Slowdown?
The investment slowdown has sparked an intense debate in India about its contributing factors, particularly whether a rise in interest rates is the dominant factor. However, a study by the Reserve Bank of India (RBI) concluded that interest rates are only partly responsible for the current weak level of investments (RBI, 2013). According to the study, a monetary tightening (375 basis points between early 2010 and late 2011) is only one of several factors that has dampened economic growth, and alone cannot explain the current investment slowdown. Furthermore, the RBI report suggests that the real lending interest rate was about 300 basis points lower than the average during the high investment growth period of 2003/04–2007/08.
Tokuoka (2012) finds that high and volatile inflation and heightened global uncertainty may have contributed significantly to the slowdown in corporate investment. While monetary easing since the GFC supported corporate investment, monetary tightening since early 2010 may have hurt corporate investments only marginally. Looking at the determinants of the decline in corporate investment since the GFC in India, Tokuoka (2012) finds that structural factors, such as those related to the business environment, have an important role in explaining corporate investment activity in India. He concludes that standard macroeconomic
3 The Central Sector Projects database that follows large scale projects worth Rs. 200 million and above indicates a rise in the share of delayed projects starting around 2009. As well, the number of major development project proposals granted environmental clearances declined from about 800 in 2009/10 to 470 in 2011/12.
Figure 2. India: Shelved and New Investment Projects
Sources: CAPEX Database; and IMF staff calculations.
0
1
2
3
4
0
2
4
6
8
10
12
14
16
18
1996 1998 2000 2002 2004 2006 2008 2010 2012
New
Stalled and shelved (right scale)
(In percent of annual GDP)
6
factors alone (growth, interest rates, global growth, and global financial market volatility) fail to fully explain the recent investment deceleration. He further concludes that while the importance of structural factors in explaining the recent weakening of aggregate investment is not entirely clear, at the micro level, panel data analysis suggests that improving the business environment by reducing costs of doing business, deepening the financial system, and developing infrastructure, could stimulate corporate investment.
The IMF’s (2013a) recent staff report on India argues that several causes of weaker growth seem to be of a supply-side nature. The following key factors are listed as possible contributors to the recent investment slowdown:
Rising policy uncertainty. In particular, high profile tax policy decisions announced in the 2012/13 Budget have reduced foreign investors’ interest in India, while the increasing difficulty of obtaining land use and environmental permits have raised regulatory uncertainty for infrastructure and other large-scale projects.4
Delayed project approvals and implementation. As a reaction to high-profile governance scandals, project approvals, clearances, and implementation have slowed sharply.
Supply bottlenecks are particularly pronounced in mining and power, with attendant consequences for the broader economy, especially manufacturing.
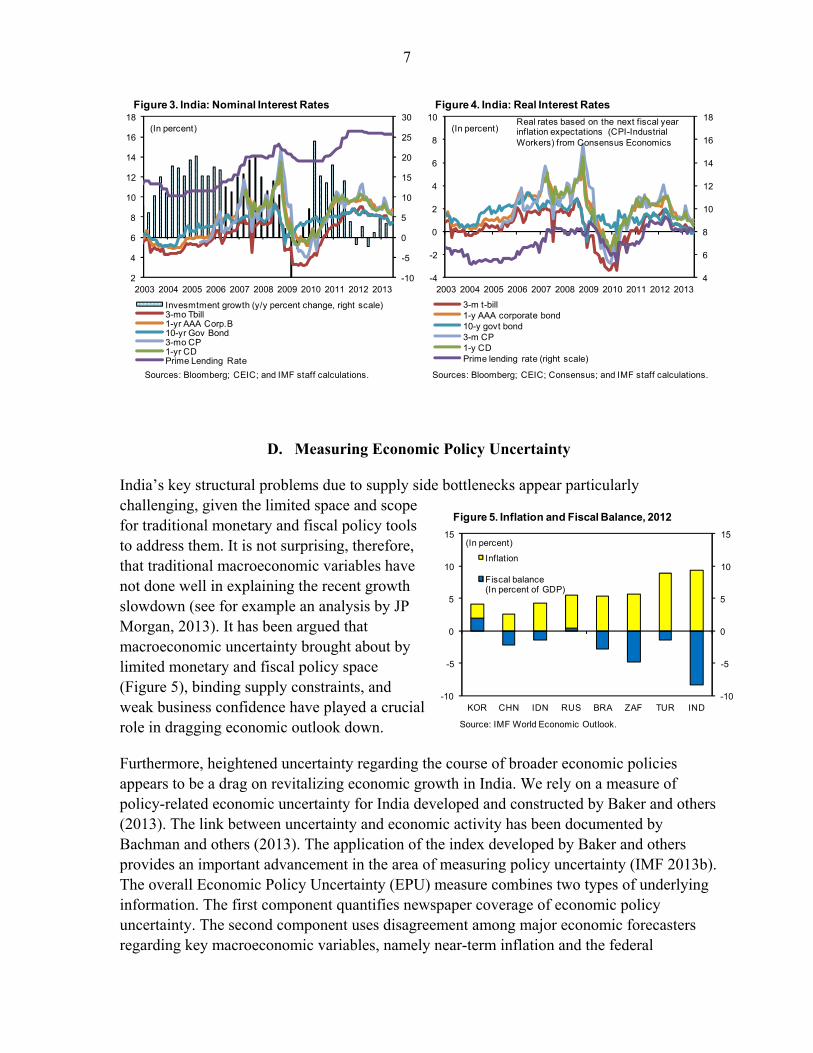
C. Where are Interest Rates in India?
Money market interest rates – bank certificates of deposit (CD), yields on government bonds and highly-rated corporate bonds, and commercial paper (CP) – since the onset of investment slowdown have been only about 100–200 basis points above the interest rates prevalent during the period of high investment growth (Figure 3). Similarly, real bank prime lending rates, which provide a ceiling for corporate lending interest rates, also appear to have been somewhat higher more recently (Figure 4).5 Furthermore, real weighted average lending rates, deflated by WPI inflation, appear to have declined by as much as 300 basis points during 2010/11–2012/13 in comparison to their average level during 2003/04 to 2007/08 when investment boomed (Mohanty, 2013). Nevertheless, for certain sectors of the economy, where structural or cyclical factors impede output price adjustment or productivity growth expectations, sector-specific real interest rates may exceed real interest rates based on aggregate inflation expectations. 4 Observers interpreted these tax measures as bringing certain activities into the tax net that were previously considered offshore, with some retroactive elements.
5 This is based on the prime lending rate. This is the longest data series available, and these rates are higher than the upper end of median lending rates.
7
D. Measuring Economic Policy Uncertainty
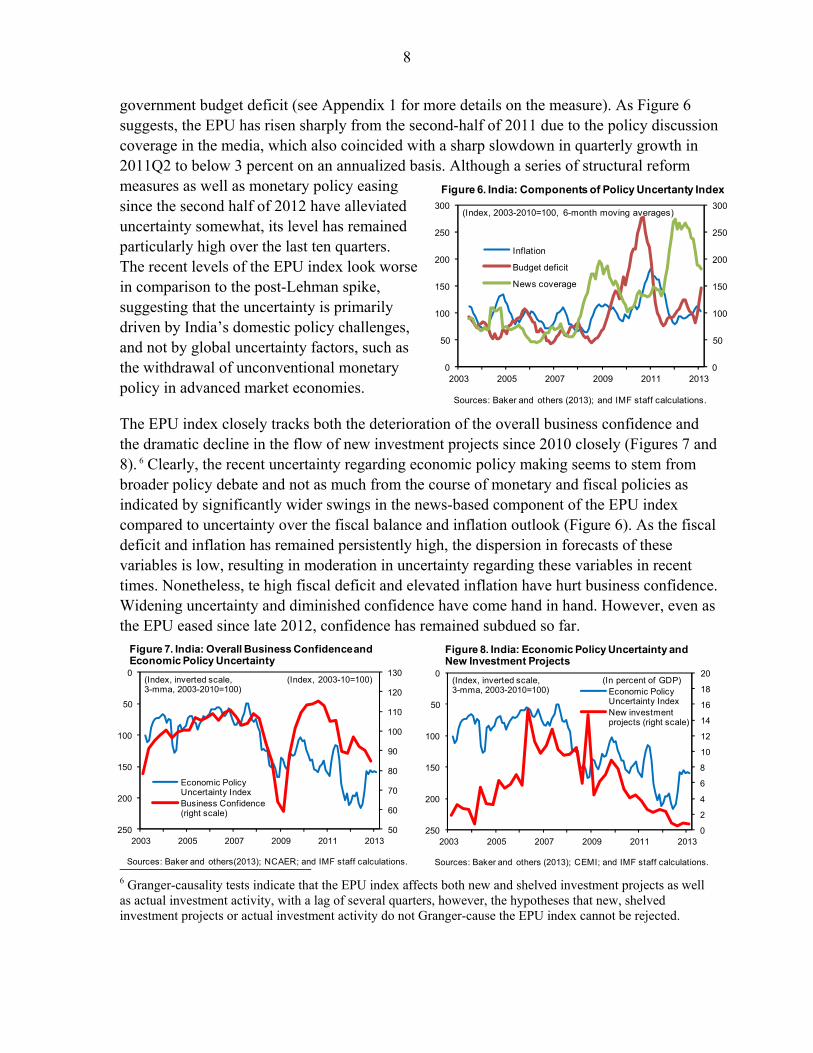
India’s key structural problems due to supply side bottlenecks appear particularly challenging, given the limited space and scope for traditional monetary and fiscal policy tools to address them. It is not surprising, therefore, that traditional macroeconomic variables have not done well in explaining the recent growth slowdown (see for example an analysis by JP Morgan, 2013). It has been argued that macroeconomic uncertainty brought about by limited monetary and fiscal policy space (Figure 5), binding supply constraints, and weak business confidence have played a crucial role in dragging economic outlook down.
Furthermore, heightened uncertainty regarding the course of broader economic policies appears to be a drag on revitalizing economic growth in India. We rely on a measure of policy-related economic uncertainty for India developed and constructed by Baker and others (2013). The link between uncertainty and economic activity has been documented by Bachman and others (2013). The application of the index developed by Baker and others provides an important advancement in the area of measuring policy uncertainty (IMF 2013b). The overall Economic Policy Uncertainty (EPU) measure combines two types of underlying information. The first component quantifies newspaper coverage of economic policy uncertainty. The second component uses disagreement among major economic forecasters regarding key macroeconomic variables, namely near-term inflation and the federal
4
6
8
10
12
14
16
18
-4
-2
0
2
4
6
8
10
2003 2004 2005 2006 2007 2008 2009 2010 2011 2012 2013
3-m t-bill1-y AAA corporate bond10-y govt bond3-m CP1-y CDPrime lending rate (right scale)
(In percent)Real rates based on the next fiscal year inflation expectations (CPI-Industrial Workers) from Consensus Economics
Figure 4. India: Real Interest Rates
Sources: Bloomberg; CEIC; Consensus; and IMF staff calculations.
-10
-5
0
5
10
15
20
25
30
2
4
6
8
10
12
14
16
18
2003 2004 2005 2006 2007 2008 2009 2010 2011 2012 2013
Invesmtment growth (y/y percent change, right scale)3-mo Tbill1-yr AAA Corp.B10-yr Gov Bond3-mo CP1-yr CDPrime Lending Rate
(In percent)
Figure 3. India: Nominal Interest Rates
Sources: Bloomberg; CEIC; and IMF staff calculations.
Figure 5. Inflation and Fiscal Balance, 2012
Source: IMF World Economic Outlook.
-10
-5
0
5
10
15
-10
-5
0
5
10
15
KOR CHN IDN RUS BRA ZAF TUR IND
Inflation
Fiscal balance (In percent of GDP)
(In percent)
8
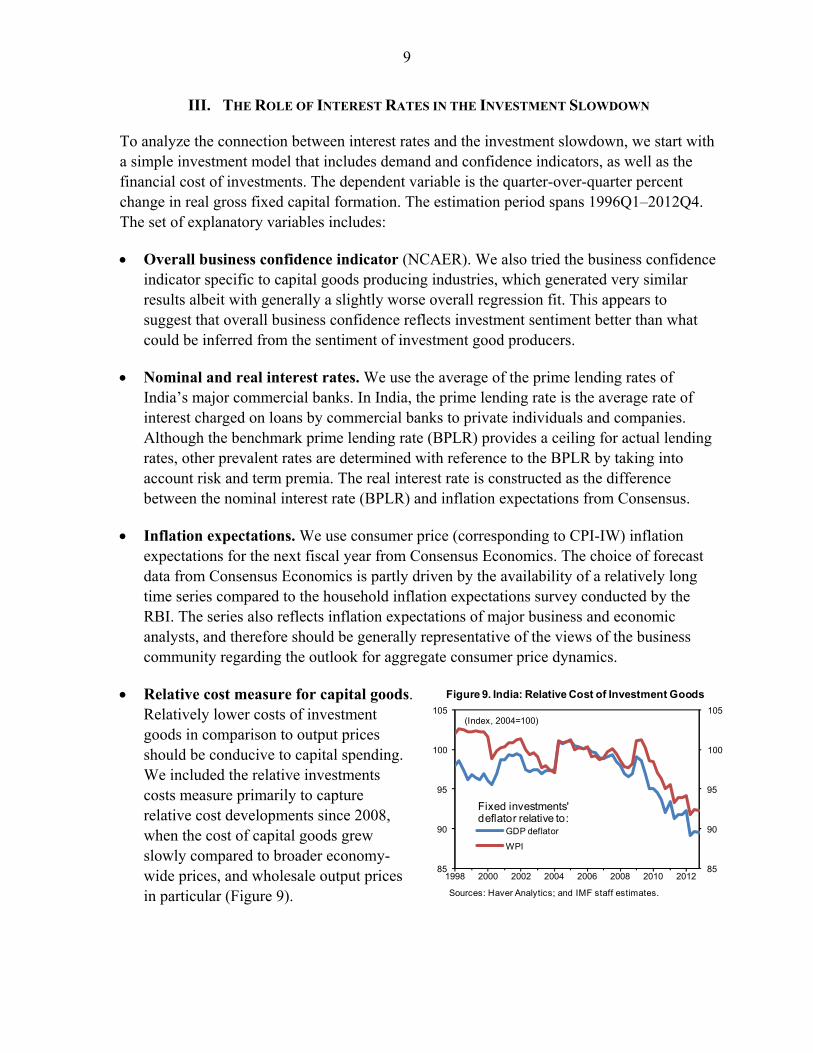
government budget deficit (see Appendix 1 for more details on the measure). As Figure 6 suggests, the EPU has risen sharply from the second-half of 2011 due to the policy discussion coverage in the media, which also coincided with a sharp slowdown in quarterly growth in 2011Q2 to below 3 percent on an annualized basis. Although a series of structural reform measures as well as monetary policy easing since the second half of 2012 have alleviated uncertainty somewhat, its level has remained particularly high over the last ten quarters. The recent levels of the EPU index look worse in comparison to the post-Lehman spike, suggesting that the uncertainty is primarily driven by India’s domestic policy challenges, and not by global uncertainty factors, such as the withdrawal of unconventional monetary policy in advanced market economies.
The EPU index closely tracks both the deterioration of the overall business confidence and the dramatic decline in the flow of new investment projects since 2010 closely (Figures 7 and 8). 6 Clearly, the recent uncertainty regarding economic policy making seems to stem from broader policy debate and not as much from the course of monetary and fiscal policies as indicated by significantly wider swings in the news-based component of the EPU index compared to uncertainty over the fiscal balance and inflation outlook (Figure 6). As the fiscal deficit and inflation has remained persistently high, the dispersion in forecasts of these variables is low, resulting in moderation in uncertainty regarding these variables in recent times. Nonetheless, te high fiscal deficit and elevated inflation have hurt business confidence. Widening uncertainty and diminished confidence have come hand in hand. However, even as the EPU eased since late 2012, confidence has remained subdued so far.
6 Granger-causality tests indicate that the EPU index affects both new and shelved investment projects as well as actual investment activity, with a lag of several quarters, however, the hypotheses that new, shelved investment projects or actual investment activity do not Granger-cause the EPU index cannot be rejected.
Figure 6. India: Components of Policy Uncertanty Index
Sources: Baker and others (2013); and IMF staff calculations.
0
50
100
150
200
250
300
0
50
100
150
200
250
300
2003 2005 2007 2009 2011 2013
Inflation
Budget deficit
News coverage
(Index, 2003-2010=100, 6-month moving averages)
Sources: Baker and others (2013); CEMI; and IMF staff calculations.
0
2
4
6
8
10
12
14
16
18
200
50
100
150
200
2502003 2005 2007 2009 2011 2013
Economic Policy Uncertainty IndexNew investment projects (right scale)
(Index, inverted scale, (In percent of GDP)3-mma, 2003-2010=100)
Figure 7. India: Overall Business Confidence and Economic Policy Uncertainty
Sources: Baker and others(2013); NCAER; and IMF staff calculations.
50
60
70
80
90
100
110
120
1300
50
100
150
200
2502003 2005 2007 2009 2011 2013
Economic Policy Uncertainty IndexBusiness Confidence (right scale)
(Index, inverted scale, (Index, 2003-10=100)3-mma, 2003-2010=100)
Figure 8. India: Economic Policy Uncertainty and New Investment Projects
9
III. THE ROLE OF INTEREST RATES IN THE INVESTMENT SLOWDOWN
To analyze the connection between interest rates and the investment slowdown, we start with a simple investment model that includes demand and confidence indicators, as well as the financial cost of investments. The dependent variable is the quarter-over-quarter percent change in real gross fixed capital formation. The estimation period spans 1996Q1–2012Q4. The set of explanatory variables includes:
Overall business confidence indicator (NCAER). We also tried the business confidence indicator specific to capital goods producing industries, which generated very similar results albeit with generally a slightly worse overall regression fit. This appears to suggest that overall business confidence reflects investment sentiment better than what could be inferred from the sentiment of investment good producers.
Nominal and real interest rates. We use the average of the prime lending rates of India’s major commercial banks. In India, the prime lending rate is the average rate of interest charged on loans by commercial banks to private individuals and companies. Although the benchmark prime lending rate (BPLR) provides a ceiling for actual lending rates, other prevalent rates are determined with reference to the BPLR by taking into account risk and term premia. The real interest rate is constructed as the difference between the nominal interest rate (BPLR) and inflation expectations from Consensus.
Inflation expectations. We use consumer price (corresponding to CPI-IW) inflation expectations for the next fiscal year from Consensus Economics. The choice of forecast data from Consensus Economics is partly driven by the availability of a relatively long time series compared to the household inflation expectations survey conducted by the RBI. The series also reflects inflation expectations of major business and economic analysts, and therefore should be generally representative of the views of the business community regarding the outlook for aggregate consumer price dynamics.
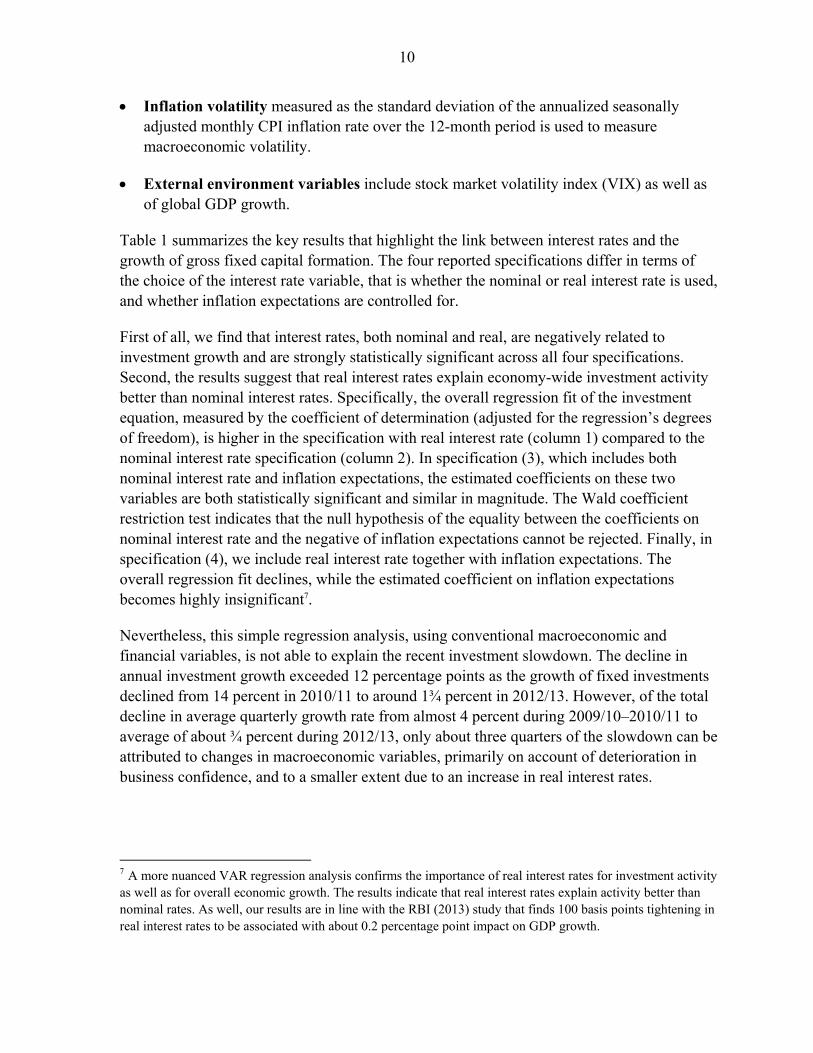
Relative cost measure for capital goods. Relatively lower costs of investment goods in comparison to output prices should be conducive to capital spending. We included the relative investments costs measure primarily to capture relative cost developments since 2008, when the cost of capital goods grew slowly compared to broader economy-wide prices, and wholesale output prices in particular (Figure 9).
85
90
95
100
105
85
90
95
100
105
1998 2000 2002 2004 2006 2008 2010 2012
GDP deflator
WPI
(Index, 2004=100)
Fixed investments' deflator relative to:
Figure 9. India: Relative Cost of Investment Goods
Sources: Haver Analytics; and IMF staff estimates.
10
Inflation volatility measured as the standard deviation of the annualized seasonally adjusted monthly CPI inflation rate over the 12-month period is used to measure macroeconomic volatility.
External environment variables include stock market volatility index (VIX) as well as of global GDP growth.
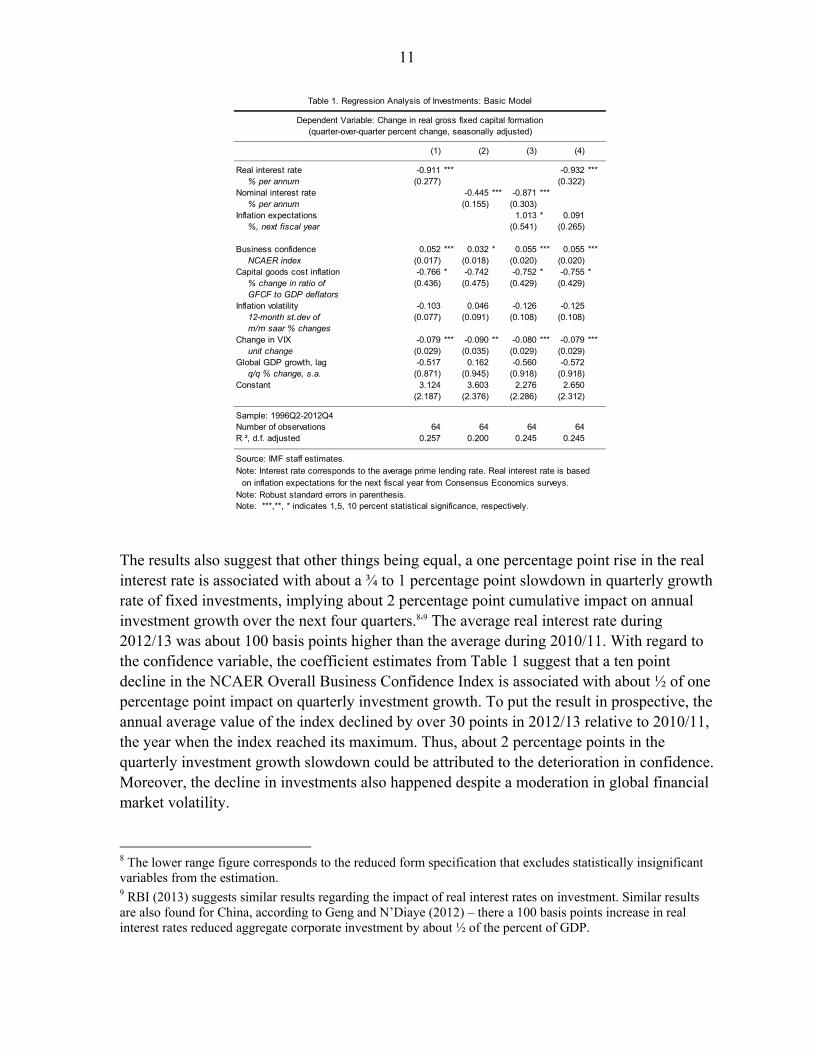
Table 1 summarizes the key results that highlight the link between interest rates and the growth of gross fixed capital formation. The four reported specifications differ in terms of the choice of the interest rate variable, that is whether the nominal or real interest rate is used, and whether inflation expectations are controlled for.
First of all, we find that interest rates, both nominal and real, are negatively related to investment growth and are strongly statistically significant across all four specifications. Second, the results suggest that real interest rates explain economy-wide investment activity better than nominal interest rates. Specifically, the overall regression fit of the investment equation, measured by the coefficient of determination (adjusted for the regression’s degrees of freedom), is higher in the specification with real interest rate (column 1) compared to the nominal interest rate specification (column 2). In specification (3), which includes both nominal interest rate and inflation expectations, the estimated coefficients on these two variables are both statistically significant and similar in magnitude. The Wald coefficient restriction test indicates that the null hypothesis of the equality between the coefficients on nominal interest rate and the negative of inflation expectations cannot be rejected. Finally, in specification (4), we include real interest rate together with inflation expectations. The overall regression fit declines, while the estimated coefficient on inflation expectations becomes highly insignificant7.
Nevertheless, this simple regression analysis, using conventional macroeconomic and financial variables, is not able to explain the recent investment slowdown. The decline in annual investment growth exceeded 12 percentage points as the growth of fixed investments declined from 14 percent in 2010/11 to around 1¾ percent in 2012/13. However, of the total decline in average quarterly growth rate from almost 4 percent during 2009/10–2010/11 to average of about ¾ percent during 2012/13, only about three quarters of the slowdown can be attributed to changes in macroeconomic variables, primarily on account of deterioration in business confidence, and to a smaller extent due to an increase in real interest rates.
7 A more nuanced VAR regression analysis confirms the importance of real interest rates for investment activity as well as for overall economic growth. The results indicate that real interest rates explain activity better than nominal rates. As well, our results are in line with the RBI (2013) study that finds 100 basis points tightening in real interest rates to be associated with about 0.2 percentage point impact on GDP growth.
11
The results also suggest that other things being equal, a one percentage point rise in the real interest rate is associated with about a ¾ to 1 percentage point slowdown in quarterly growth rate of fixed investments, implying about 2 percentage point cumulative impact on annual investment growth over the next four quarters.8,9 The average real interest rate during 2012/13 was about 100 basis points higher than the average during 2010/11. With regard to the confidence variable, the coefficient estimates from Table 1 suggest that a ten point decline in the NCAER Overall Business Confidence Index is associated with about ½ of one percentage point impact on quarterly investment growth. To put the result in prospective, the annual average value of the index declined by over 30 points in 2012/13 relative to 2010/11, the year when the index reached its maximum. Thus, about 2 percentage points in the quarterly investment growth slowdown could be attributed to the deterioration in confidence. Moreover, the decline in investments also happened despite a moderation in global financial market volatility.
8 The lower range figure corresponds to the reduced form specification that excludes statistically insignificant variables from the estimation. 9 RBI (2013) suggests similar results regarding the impact of real interest rates on investment. Similar results are also found for China, according to Geng and N’Diaye (2012) – there a 100 basis points increase in real interest rates reduced aggregate corporate investment by about ½ of the percent of GDP.
(1) (2) (3) (4)
Real interest rate -0.911 *** -0.932 ***% per annum (0.277) (0.322)
Nominal interest rate -0.445 *** -0.871 ***% per annum (0.155) (0.303)
Inflation expectations 1.013 * 0.091%, next fiscal year (0.541) (0.265)
Business confidence 0.052 *** 0.032 * 0.055 *** 0.055 ***NCAER index (0.017) (0.018) (0.020) (0.020)
Capital goods cost inflation -0.766 * -0.742 -0.752 * -0.755 *% change in ratio of (0.436) (0.475) (0.429) (0.429)GFCF to GDP deflators
Inflation volatility -0.103 0.046 -0.126 -0.12512-month st.dev of (0.077) (0.091) (0.108) (0.108)m/m saar % changes
Change in VIX -0.079 *** -0.090 ** -0.080 *** -0.079 ***unit change (0.029) (0.035) (0.029) (0.029)
Global GDP growth, lag -0.517 0.162 -0.560 -0.572q/q % change, s.a. (0.871) (0.945) (0.918) (0.918)
Constant 3.124 3.603 2.276 2.650(2.187) (2.376) (2.286) (2.312)
Sample: 1996Q2-2012Q4Number of observations 64 64 64 64R ², d.f. adjusted 0.257 0.200 0.245 0.245
Source: IMF staff estimates.Note: Interest rate corresponds to the average prime lending rate. Real interest rate is based
on inflation expectations for the next fiscal year from Consensus Economics surveys.Note: Robust standard errors in parenthesis. Note: ***,**, * indicates 1,5, 10 percent statistical significance, respectively.
(quarter-over-quarter percent change, seasonally adjusted)
Table 1. Regression Analysis of Investments: Basic Model
Dependent Variable: Change in real gross fixed capital formation
12
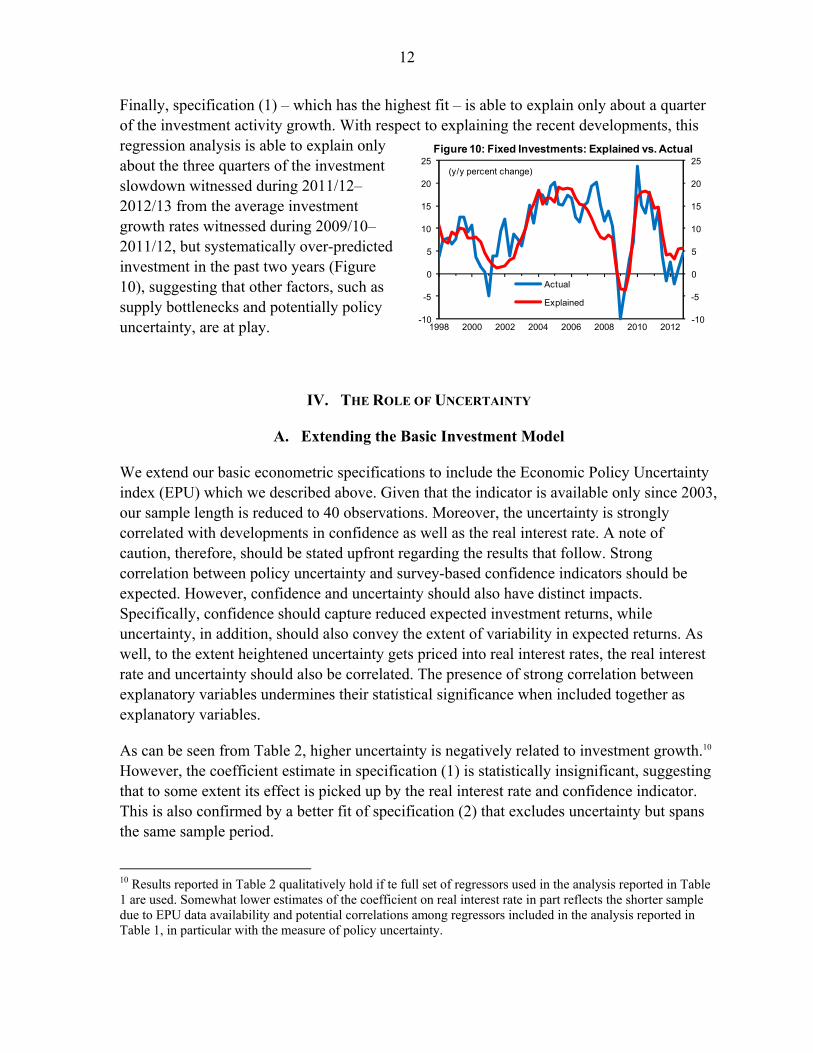
Finally, specification (1) – which has the highest fit – is able to explain only about a quarter of the investment activity growth. With respect to explaining the recent developments, this regression analysis is able to explain only about the three quarters of the investment slowdown witnessed during 2011/12–2012/13 from the average investment growth rates witnessed during 2009/10–2011/12, but systematically over-predicted investment in the past two years (Figure 10), suggesting that other factors, such as supply bottlenecks and potentially policy uncertainty, are at play.
IV. THE ROLE OF UNCERTAINTY
A. Extending the Basic Investment Model
We extend our basic econometric specifications to include the Economic Policy Uncertainty index (EPU) which we described above. Given that the indicator is available only since 2003, our sample length is reduced to 40 observations. Moreover, the uncertainty is strongly correlated with developments in confidence as well as the real interest rate. A note of caution, therefore, should be stated upfront regarding the results that follow. Strong correlation between policy uncertainty and survey-based confidence indicators should be expected. However, confidence and uncertainty should also have distinct impacts. Specifically, confidence should capture reduced expected investment returns, while uncertainty, in addition, should also convey the extent of variability in expected returns. As well, to the extent heightened uncertainty gets priced into real interest rates, the real interest rate and uncertainty should also be correlated. The presence of strong correlation between explanatory variables undermines their statistical significance when included together as explanatory variables.
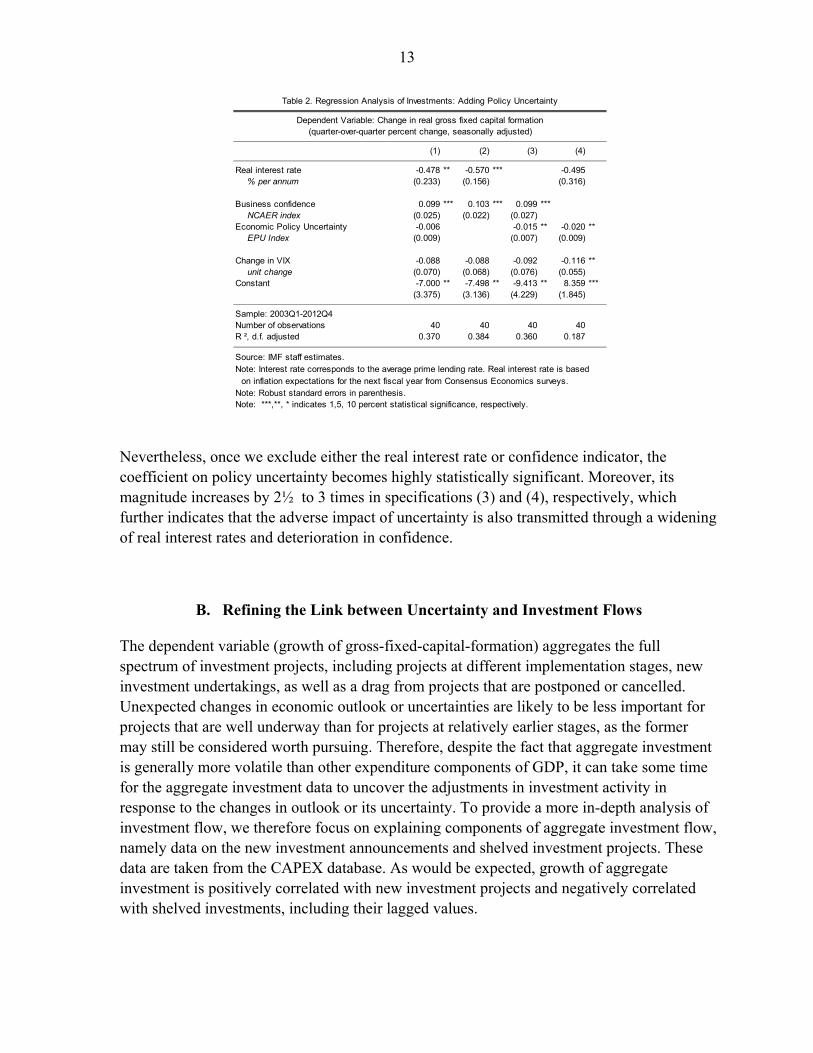
As can be seen from Table 2, higher uncertainty is negatively related to investment growth.10 However, the coefficient estimate in specification (1) is statistically insignificant, suggesting that to some extent its effect is picked up by the real interest rate and confidence indicator. This is also confirmed by a better fit of specification (2) that excludes uncertainty but spans the same sample period.
10 Results reported in Table 2 qualitatively hold if te full set of regressors used in the analysis reported in Table 1 are used. Somewhat lower estimates of the coefficient on real interest rate in part reflects the shorter sample due to EPU data availability and potential correlations among regressors included in the analysis reported in Table 1, in particular with the measure of policy uncertainty.
-10
-5
0
5
10
15
20
25
-10
-5
0
5
10
15
20
25
1998 2000 2002 2004 2006 2008 2010 2012
Actual
Explained
(y/y percent change)
Figure 10: Fixed Investments: Explained vs. Actual
13
Nevertheless, once we exclude either the real interest rate or confidence indicator, the coefficient on policy uncertainty becomes highly statistically significant. Moreover, its magnitude increases by 2½ to 3 times in specifications (3) and (4), respectively, which further indicates that the adverse impact of uncertainty is also transmitted through a widening of real interest rates and deterioration in confidence.
B. Refining the Link between Uncertainty and Investment Flows
The dependent variable (growth of gross-fixed-capital-formation) aggregates the full spectrum of investment projects, including projects at different implementation stages, new investment undertakings, as well as a drag from projects that are postponed or cancelled. Unexpected changes in economic outlook or uncertainties are likely to be less important for projects that are well underway than for projects at relatively earlier stages, as the former may still be considered worth pursuing. Therefore, despite the fact that aggregate investment is generally more volatile than other expenditure components of GDP, it can take some time for the aggregate investment data to uncover the adjustments in investment activity in response to the changes in outlook or its uncertainty. To provide a more in-depth analysis of investment flow, we therefore focus on explaining components of aggregate investment flow, namely data on the new investment announcements and shelved investment projects. These data are taken from the CAPEX database. As would be expected, growth of aggregate investment is positively correlated with new investment projects and negatively correlated with shelved investments, including their lagged values.
(1) (2) (3) (4)
Real interest rate -0.478 ** -0.570 *** -0.495% per annum (0.233) (0.156) (0.316)
Business confidence 0.099 *** 0.103 *** 0.099 ***NCAER index (0.025) (0.022) (0.027)
Economic Policy Uncertainty -0.006 -0.015 ** -0.020 **EPU Index (0.009) (0.007) (0.009)
Change in VIX -0.088 -0.088 -0.092 -0.116 **unit change (0.070) (0.068) (0.076) (0.055)
Constant -7.000 ** -7.498 ** -9.413 ** 8.359 ***(3.375) (3.136) (4.229) (1.845)
Sample: 2003Q1-2012Q4Number of observations 40 40 40 40R ², d.f. adjusted 0.370 0.384 0.360 0.187
Source: IMF staff estimates.Note: Interest rate corresponds to the average prime lending rate. Real interest rate is based
on inflation expectations for the next fiscal year from Consensus Economics surveys.Note: Robust standard errors in parenthesis. Note: ***,**, * indicates 1,5, 10 percent statistical significance, respectively.
(quarter-over-quarter percent change, seasonally adjusted)
Table 2. Regression Analysis of Investments: Adding Policy Uncertainty
Dependent Variable: Change in real gross fixed capital formation
14
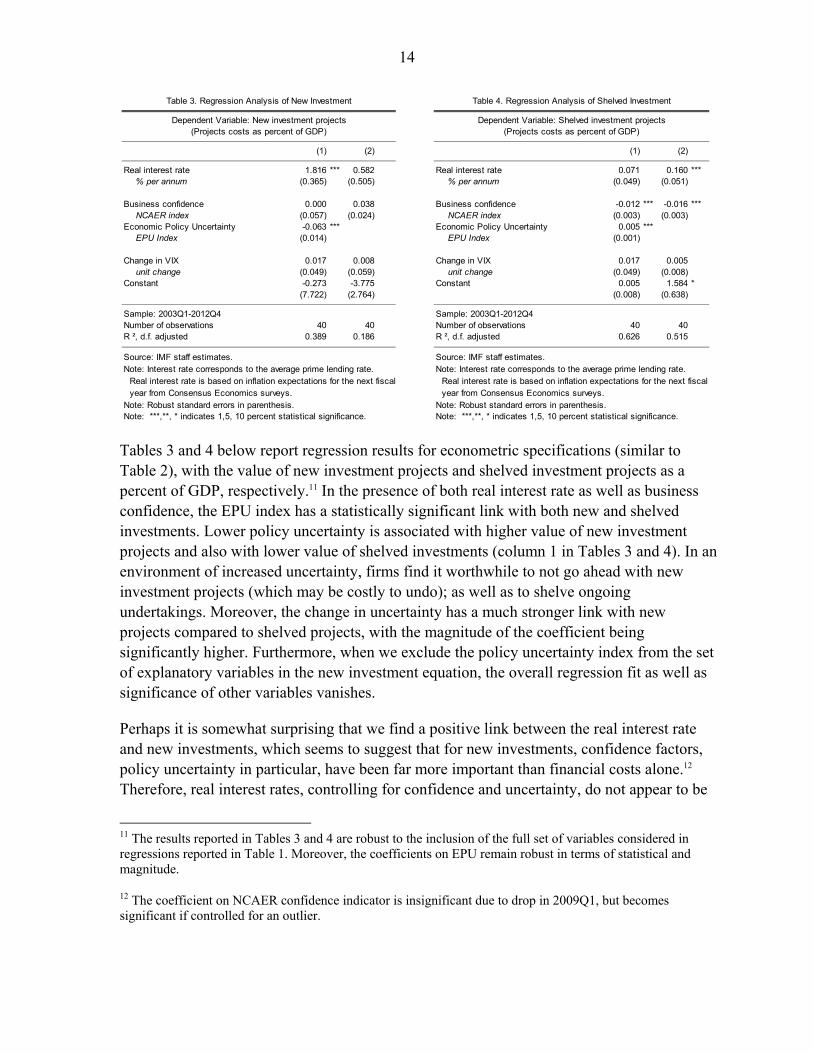
Tables 3 and 4 below report regression results for econometric specifications (similar to Table 2), with the value of new investment projects and shelved investment projects as a percent of GDP, respectively.11 In the presence of both real interest rate as well as business confidence, the EPU index has a statistically significant link with both new and shelved investments. Lower policy uncertainty is associated with higher value of new investment projects and also with lower value of shelved investments (column 1 in Tables 3 and 4). In an environment of increased uncertainty, firms find it worthwhile to not go ahead with new investment projects (which may be costly to undo); as well as to shelve ongoing undertakings. Moreover, the change in uncertainty has a much stronger link with new projects compared to shelved projects, with the magnitude of the coefficient being significantly higher. Furthermore, when we exclude the policy uncertainty index from the set of explanatory variables in the new investment equation, the overall regression fit as well as significance of other variables vanishes.
Perhaps it is somewhat surprising that we find a positive link between the real interest rate and new investments, which seems to suggest that for new investments, confidence factors, policy uncertainty in particular, have been far more important than financial costs alone.12 Therefore, real interest rates, controlling for confidence and uncertainty, do not appear to be
11 The results reported in Tables 3 and 4 are robust to the inclusion of the full set of variables considered in regressions reported in Table 1. Moreover, the coefficients on EPU remain robust in terms of statistical and magnitude.
12 The coefficient on NCAER confidence indicator is insignificant due to drop in 2009Q1, but becomes significant if controlled for an outlier.
(1) (2)
Real interest rate 1.816 *** 0.582% per annum (0.365) (0.505)
Business confidence 0.000 0.038NCAER index (0.057) (0.024)
Economic Policy Uncertainty -0.063 ***EPU Index (0.014)
Change in VIX 0.017 0.008unit change (0.049) (0.059)
Constant -0.273 -3.775(7.722) (2.764)
Sample: 2003Q1-2012Q4Number of observations 40 40R ², d.f. adjusted 0.389 0.186
Source: IMF staff estimates.Note: Interest rate corresponds to the average prime lending rate.
Real interest rate is based on inflation expectations for the next fiscalyear from Consensus Economics surveys.
Note: Robust standard errors in parenthesis. Note: ***,**, * indicates 1,5, 10 percent statistical significance.
(Projects costs as percent of GDP)
Table 3. Regression Analysis of New Investment
Dependent Variable: New investment projects
(1) (2)
Real interest rate 0.071 0.160 ***% per annum (0.049) (0.051)
Business confidence -0.012 *** -0.016 ***NCAER index (0.003) (0.003)
Economic Policy Uncertainty 0.005 ***EPU Index (0.001)
Change in VIX 0.017 0.005unit change (0.049) (0.008)
Constant 0.005 1.584 *(0.008) (0.638)
Sample: 2003Q1-2012Q4Number of observations 40 40R ², d.f. adjusted 0.626 0.515
Source: IMF staff estimates.Note: Interest rate corresponds to the average prime lending rate.
Real interest rate is based on inflation expectations for the next fiscalyear from Consensus Economics surveys.
Note: Robust standard errors in parenthesis. Note: ***,**, * indicates 1,5, 10 percent statistical significance.
Table 4. Regression Analysis of Shelved Investment
Dependent Variable: Shelved investment projects(Projects costs as percent of GDP)
15
a deterrent to new investment undertakings. A potential interpretation, yet untested in this context, may be that higher real interest rates, controlling for confidence and uncertainty, may be associated with higher expected investment returns as well as with higher demand for investment financing. Nevertheless, the analysis of the shelved projects reveals that the coefficient on real interest rate is positively signed, suggesting that real interest rates continue to matter for projects that were in the pipeline. As well, confidence, and policy clarity in particular, are crucial for ensuring that projects underway are completed.
V. CONCLUSIONS AND POLICY IMPLICATIONS
The recent Indian investment slowdown has been, to a large extent, reflective of deteriorating confidence and rising policy uncertainty. Some widening of interest rates has accompanied these developments; however, only a portion of the investment slowdown can be attributed to the increase in financing costs. Furthermore, a simple regression analysis that builds on the conventional macroeconomic variables over-predicts investments in the past two years, suggesting that other factors, such as supply bottlenecks have been at play.
We find that heightened policy uncertainty has had a particularly pronounced link with the decline in new investments as well as with the rising value of investments that were postponed or cancelled. After controlling for these factors, financing costs do not appear to be a critical factor in explaining the decline in new investments.
Therefore, it appears that the current Indian investment slowdown is primarily driven by weak business confidence and policy uncertainty, though factors not explicitly captured in the regression analysis, for example supply bottlenecks, are also at play. In the short term, lowering nominal interest rates may provide some relief in terms of a reduced interest burden, especially to corporates with high leverage. However, in the medium term, lower rates with little slack in the economy would stoke inflation further and exacerbate inflation trends across sectors, hurting investment. In addition, simply lowering nominal rates without tackling deep structural issues is unlikely to lead to a sustainable revival of investments. Continued progress on structural reforms and resolving supply side bottlenecks, therefore, remain critical to shore up confidence and revitalize investments and economic growth.
16
REFERENCES
Baker S.R., N. Bloom, and S.J. Davis, 2013, “Measuring Economic Policy Uncertainty,” Chicago Booth Research Paper No. 13-02.
Bachman R., S. Elstner, and E. Sims, 2010, “Uncertainty and Economic Activity: Evidence from Business Survey Data,” NBER Working Paper 16143.
Geng, N., and P. N’Diaye, 2012, “Determinants of Corporate Investment in China: Evidence from Cross-Country Firm Level Data,” IMF Working Paper 12/80 (Washington: International Monetary Fund).
International Monetary Fund, 2013a, India: 2013 Article IV Consultation, IMF Country Report 13/37 (Washington: International Monetary Fund).
International Monetary Fund, 2013b, Germany: 2013 Article IV Consultation, IMF Country Report 13/255 (Washington: International Monetary Fund).
Mohanty, D., 2013, “Interest Rates and Economic Activity”, Speech to the Association of Financial Professionals of India, Pune, India, August 23, 2013.
J.P. Morgan, 2013, “Why is India’s Growth Rate at a 10-year low?” by S.Chinoi and J. Aziz. June 10, 2013.
Reserve Bank of India, 2013, “Real Interest Rate Impact on Investment and Growth – What the Empirical Evidence for India Suggests” August (2013).
Tokuoka K., 2012, “Does the Business Environment Affect Corporate Investment in India?”, IMF Working Paper 12/70 (Washington: International Monetary Fund).
17
APPENDIX I. MEASURING ECONOMIC POLICY UNCERTAINTY
The Economic Policy Uncertainty Index (EPU) has been developed and constructed by Baker, Bloom, and Davis, and available at the EPU website13. The methodology description and updated index, as well as its components are also available online. The outline provided below is based on the online description. The index combines two types of information regarding uncertainty of economic policies and outlook. The first component quantifies media coverage of topical issues in major Indian newspapers. The included newspapers are: The Economic Times, the Times of India, the Hindustan Times, the Hindu, the Statesman, the Indian Express, and the Financial Express. For each paper, the number of news articles containing at least one term from each of three term sets is counted. The first set is uncertain, uncertainties, or uncertainty. The second set is economic or economy. The third set consists of policy relevant terms such as “regulation”, “central bank”, “monetary policy”, “policymakers”, “deficit”, “legislation”, and “fiscal policy”.
A second component uses disagreement among economic forecasters as a proxy for policy uncertainty. The Consensus Economics forecasts serve as a source of professional forecaster data. It provides monthly data on individual forecasts of the consumer price index and federal government budget balance for the following year. The choice of these two variables intends to capture uncertainty regarding the key policies: monetary policy and fiscal policy. Using these variables, the measures of forecast dispersion are constructed. This approach builds on a long tradition of using forecaster disagreement to proxy for economic uncertainty.
To obtain our overall EPU index for India, each component is normalized to have a standard deviation of one prior to January 2011. Then the index components are aggregated, using weights of 2/3 on news-based policy uncertainty index and 1/6 on each forecast dispersion measure. The resulting weighted average is then rebased to 100 prior to 2011.
13 http://www.policyuncertainty.com/india_monthly.html
Related Documents