Monitoring: Opportunities to Apply the NACP Multi- tier Approach to UNFCCC Reporting and REDD Requirements Richard Birdsey, Yude Pan, Werner Kurz, Craig Wayson, Gregorio Angeles-Perez Includes contributions from Ben DeJong, Jing Chen, and Fangmin Zhang North American Carbon Program All-Investigator Meeting New Orleans, Louisiana 3 February, 2011

Global Forest Carbon Monitoring: Opportunities to Apply the NACP Multi- tier Approach to UNFCCC Reporting and REDD Requirements Richard Birdsey, Yude Pan,
Dec 21, 2015
Welcome message from author
This document is posted to help you gain knowledge. Please leave a comment to let me know what you think about it! Share it to your friends and learn new things together.
Transcript
Global Forest Carbon Monitoring: Opportunities to Apply the NACP Multi-tier Approach to UNFCCC Reporting and
REDD Requirements Richard Birdsey, Yude Pan, Werner Kurz,
Craig Wayson, Gregorio Angeles-Perez
Includes contributions from Ben DeJong, Jing Chen, and Fangmin Zhang
North American Carbon Program
All-Investigator MeetingNew Orleans, Louisiana
3 February, 2011

Overview
• NACP multi-tier land monitoring approach• UNFCCC GHG inventory reporting by Canada,
U.S., and Mexico• REDD requirements, data needs, and
approaches• What next for NACP multi-tier approach?

NACP Hierarchical Land Surface Measurement Program (from NACP Science Plan)
• Tier One – Remote Sensing and Mapping Wall-to-wall coverage; stratification Temporal resolution = high or low
• Tier Two – Extensive Inventories and Surveys Representative regional statistical sample Temporal resolution = low
• Tier Three – Condition Sample (new) Representative of specified condition classes Temporal resolution = medium
• Tier Four –Intensive Areas Relatively small number of specific sites Temporal resolution = high
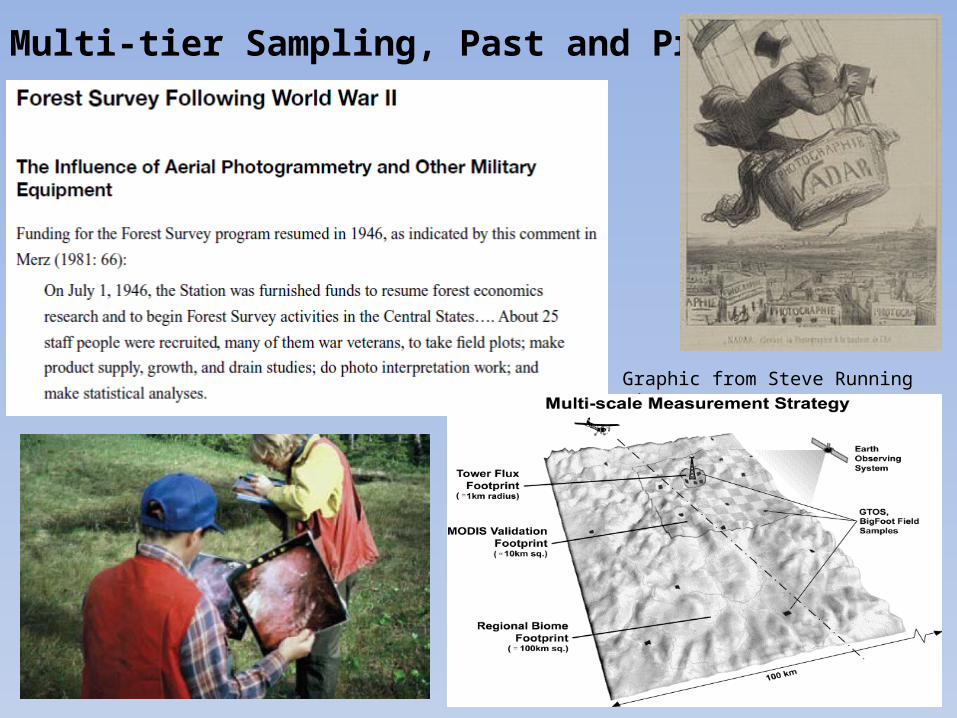
Multi-tier Sampling, Past and Present
Graphic from Steve Running circa 2001
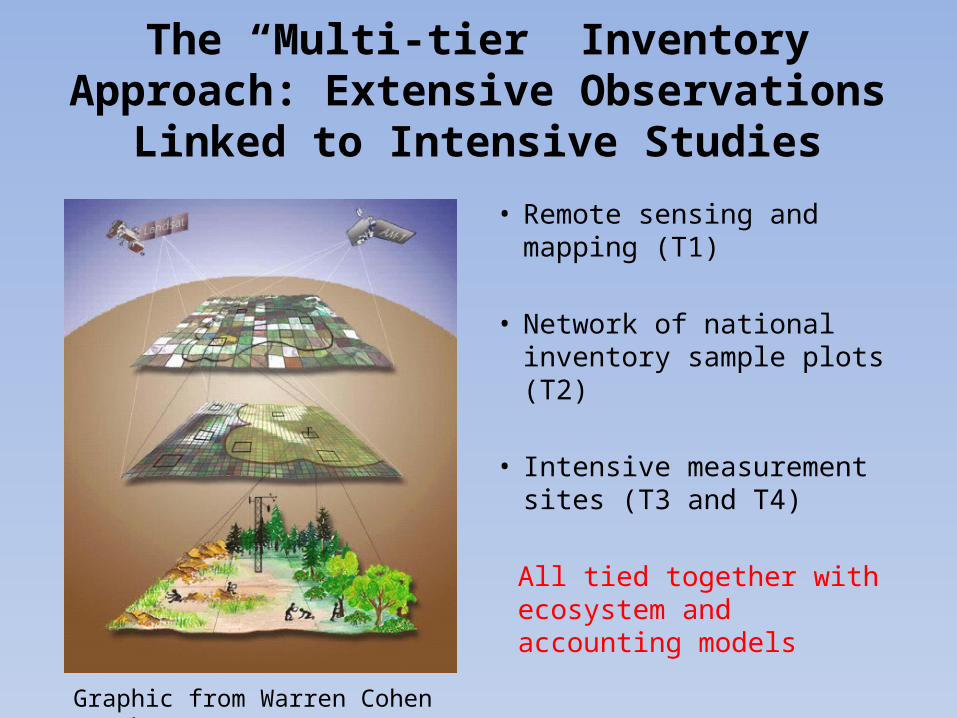
The “Multi-tier” Inventory Approach: Extensive Observations Linked to Intensive Studies
• Remote sensing and mapping (T1)
• Network of national inventory sample plots (T2)
• Intensive measurement sites (T3 and T4)
All tied together with ecosystem and accounting models
Graphic from Warren Cohen (maybe)
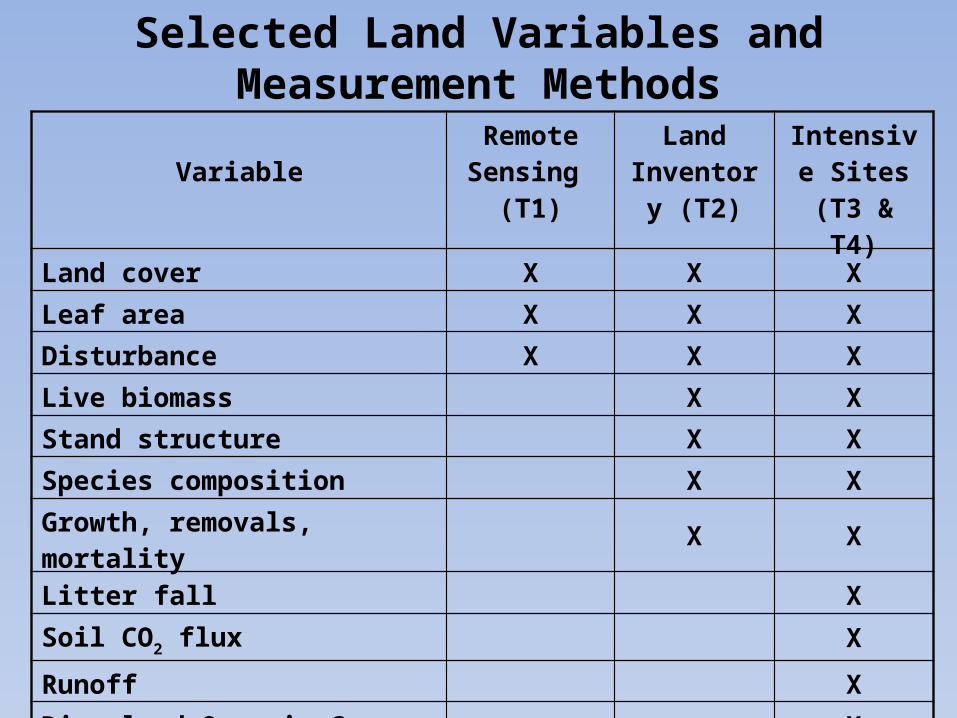
Selected Land Variables and Measurement Methods
VariableRemote Sensing
(T1)
Land Inventory
(T2)
Intensive Sites
(T3 & T4)
Land cover X X X
Leaf area X X X
Disturbance X X X
Live biomass X X
Stand structure X X
Species composition X X
Growth, removals, mortality X X
Litter fall X
Soil CO2 flux X
Runoff X
Dissolved Organic C X
Net Ecosystem Exchange of CO2 X
UNFCCC Reporting
• Canada, the U.S.A., and Mexico all report greenhouse gas inventories following standard IPCC methodologies and reporting requirements (Mexico reports are voluntary).
• Despite rather different national circumstances, reported estimates are reasonably consistent.
• The 3 countries collaborate on methods development and application, share data to improve estimates, and produce joint reports (e.g., SOCCR).
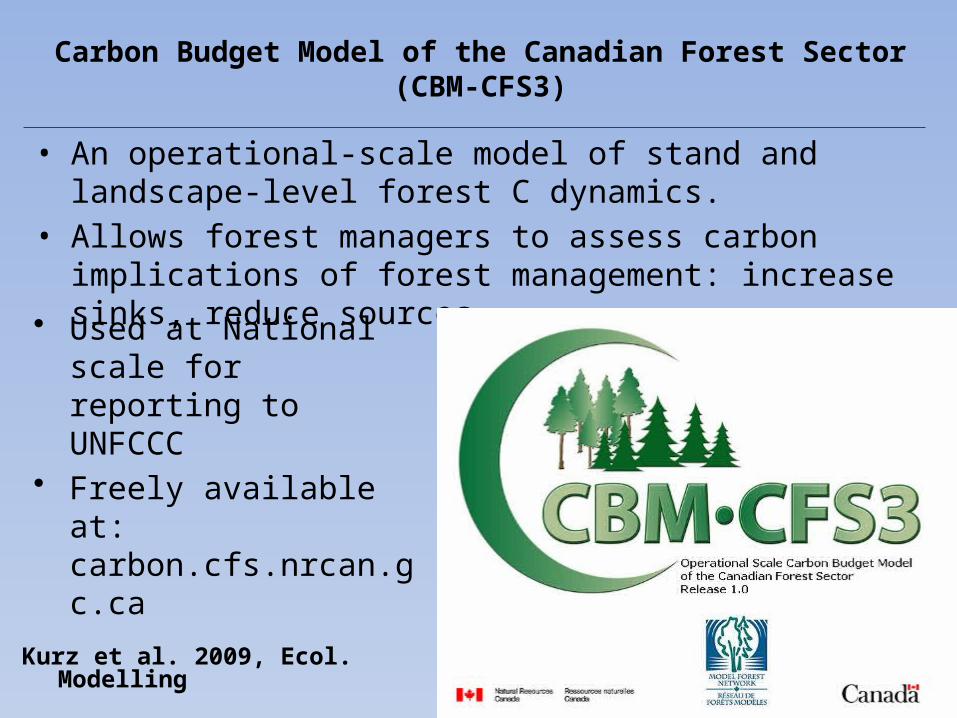
Carbon Budget Model of the Canadian Forest Sector (CBM-CFS3)
• An operational-scale model of stand and landscape-level forest C dynamics.
• Allows forest managers to assess carbon implications of forest management: increase sinks, reduce sources
• Used at National scale for reporting to UNFCCC
• Freely available at: carbon.cfs.nrcan.gc.ca
Kurz et al. 2009, Ecol. Modelling
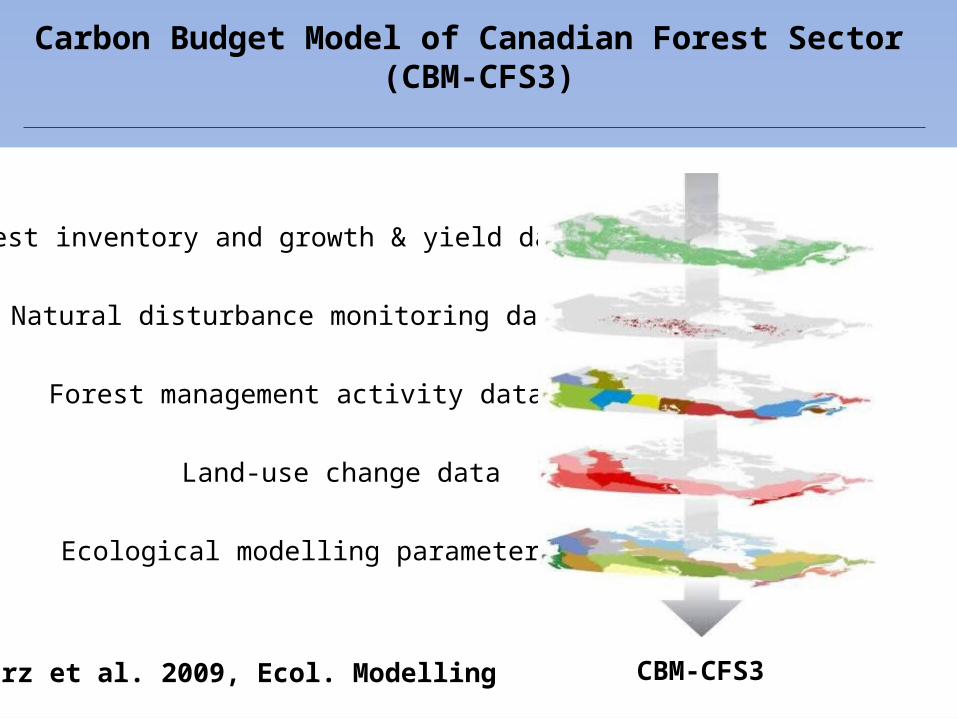
Carbon Budget Model of Canadian Forest Sector (CBM-CFS3)
Land-use change data
Forest inventory and growth & yield data
Natural disturbance monitoring data
Forest management activity data
Ecological modelling parameters
CBM-CFS3Kurz et al. 2009, Ecol. Modelling
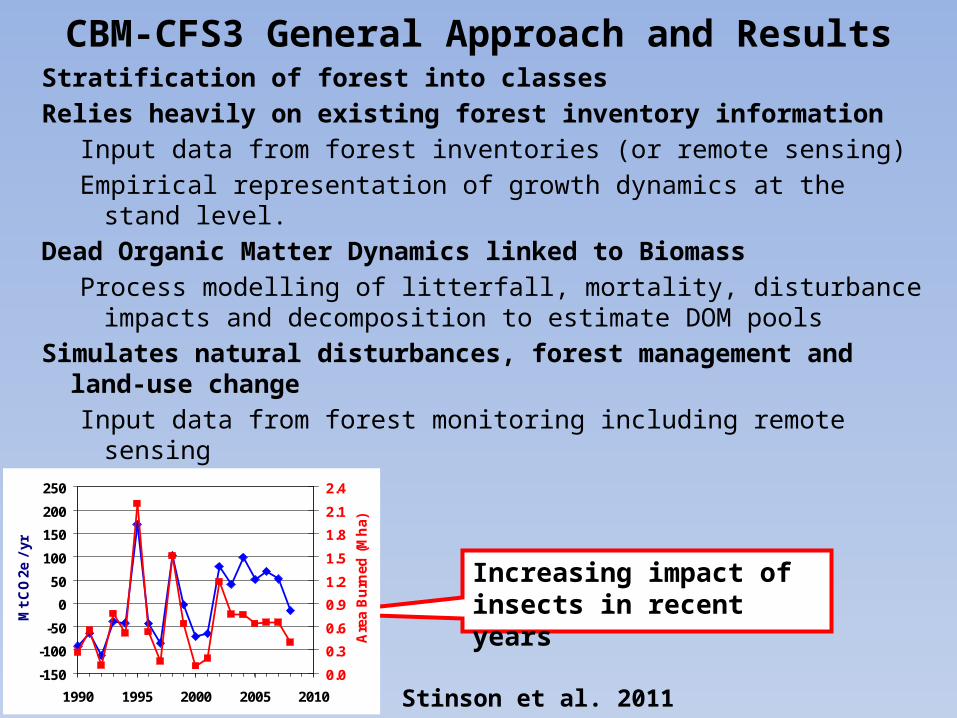
CBM-CFS3 General Approach and ResultsStratification of forest into classes Relies heavily on existing forest inventory information
Input data from forest inventories (or remote sensing)Empirical representation of growth dynamics at the stand level.
Dead Organic Matter Dynamics linked to BiomassProcess modelling of litterfall, mortality, disturbance impacts and
decomposition to estimate DOM poolsSimulates natural disturbances, forest management and land-use
changeInput data from forest monitoring including remote sensing
-150
-100
-50
0
50
100
150
200
250
1990 1995 2000 2005 2010
Mt
CO
2e /
yr
0.0
0.3
0.6
0.9
1.2
1.5
1.8
2.1
2.4
Are
a B
urn
ed (
Mh
a)
Increasing impact of insects in recent years
Stinson et al. 2011
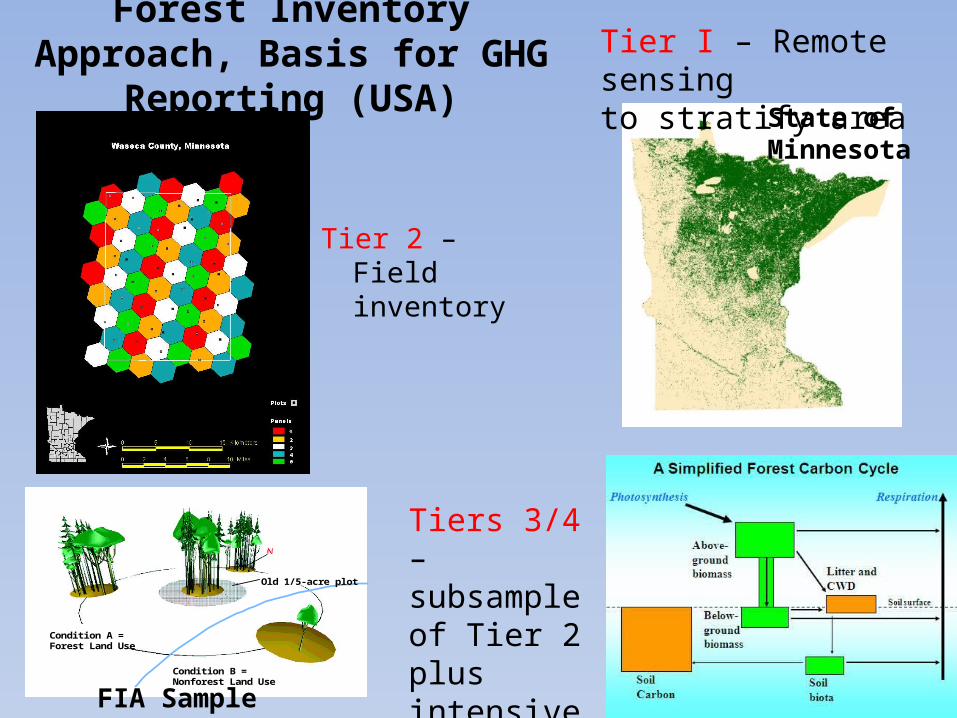
Forest Inventory Approach, Basis for GHG Reporting (USA)
Tier 2 – Field inventory
State of Minnesota
Condition B = Nonforest Land Use
Condition A =Forest Land Use
Old 1/5-acre plot
FIA Sample Plot
Tiers 3/4 – subsample of Tier 2 plus intensive site data
Tier I – Remote sensing to stratify area
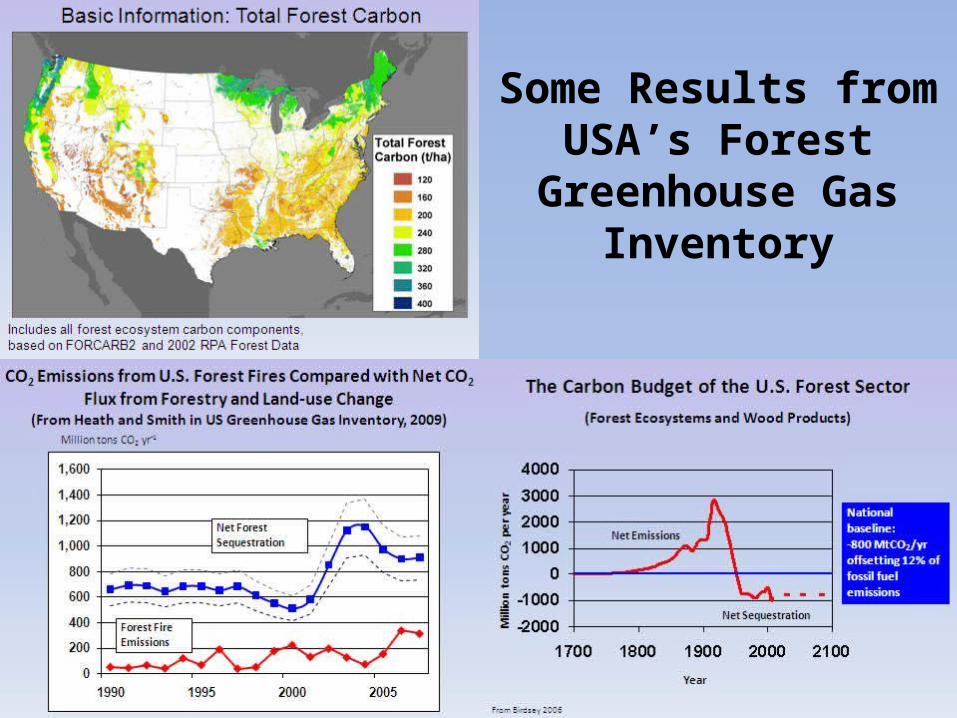
Some Results from USA’s Forest
Greenhouse Gas Inventory
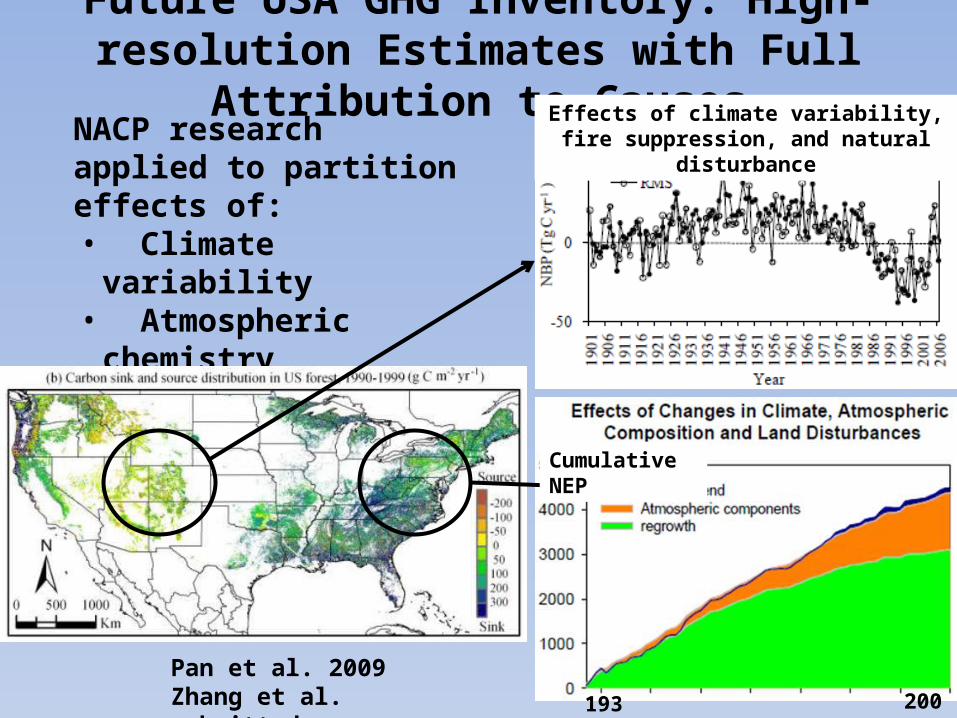
Future USA GHG Inventory: High-resolution Estimates with Full Attribution to Causes
NACP research applied to partition effects of:• Climate variability• Atmospheric chemistry• Natural disturbances• Human actions
1930 2000
Pan et al. 2009Zhang et al. submitted
Effects of climate variability, fire suppression, and natural disturbance
Cumulative NEP

Evolving Methods for Mexico’s Greenhouse Gas Inventory of Forests
• The first two inventories used IPCC default emission factors and FAO area statistics
• The third inventory in 2006 was based on national inventory data and some default emission factors
• The fourth inventory in 2009 was based on the new national inventory, land-cover change maps, and some country specific emission factors
• Future inventories will include all C pools and analysis using CBM-CFS3
Adapted from Ben de Jong
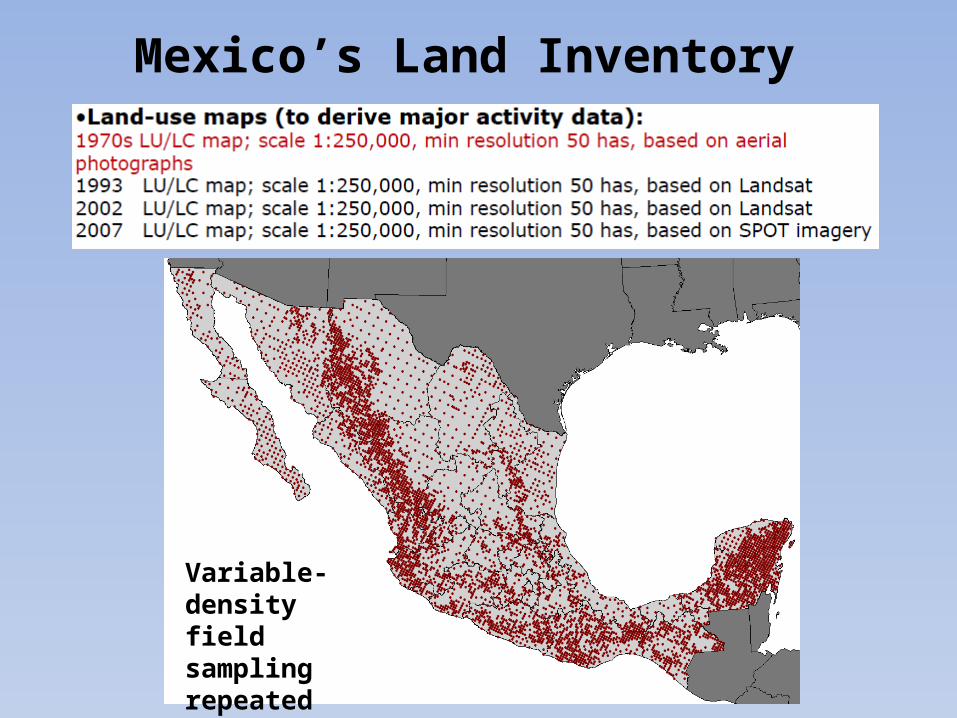
Mexico’s Land Inventory
Variable-density field sampling repeated every 5 years
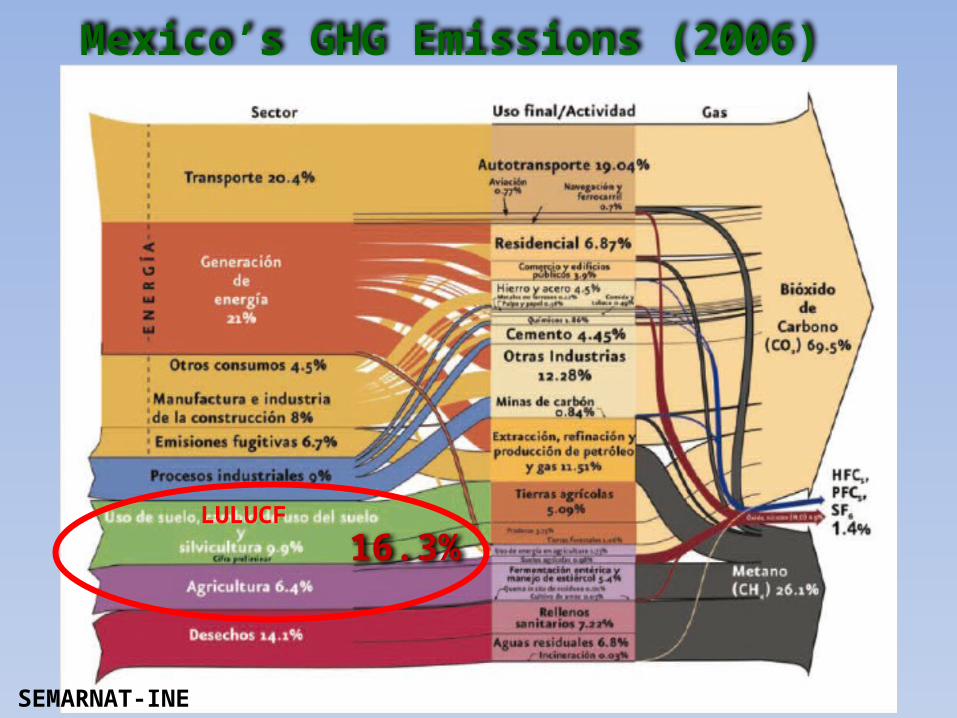
Mexico’s GHG Emissions (2006)
16.3%
SEMARNAT-INE (2009)
LULUCF

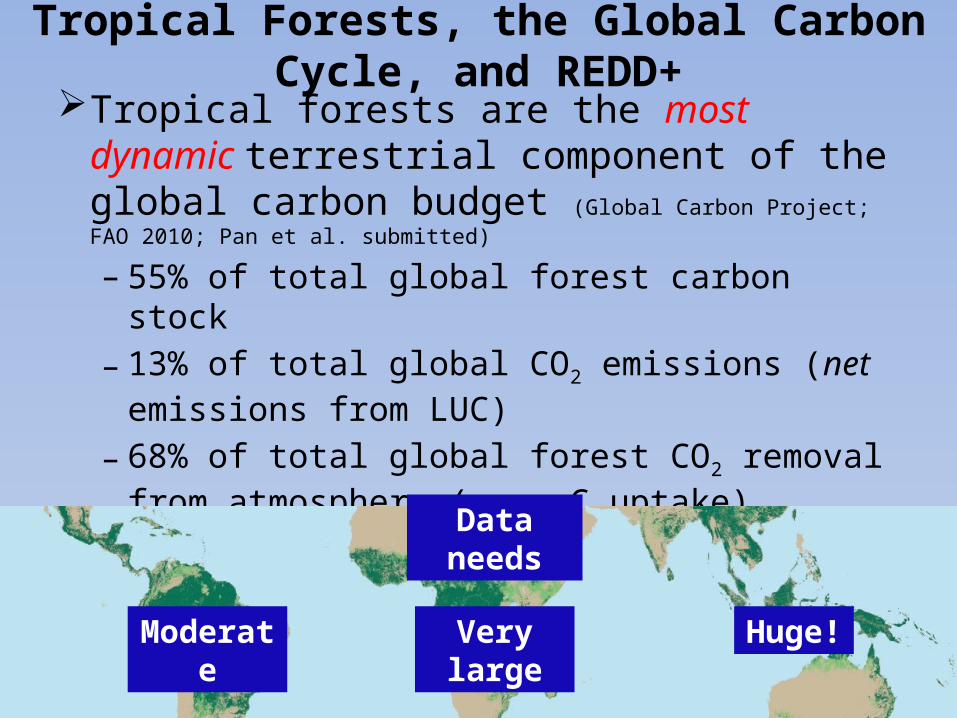
Tropical Forests, the Global Carbon Cycle, and REDD+Tropical forests are the most dynamic
terrestrial component of the global carbon budget (Global Carbon Project; FAO 2010; Pan et al. submitted)
– 55% of total global forest carbon stock– 13% of total global CO2 emissions (net emissions
from LUC)– 68% of total global forest CO2 removal from
atmosphere (gross C uptake)
Tropical Forests, the Global Carbon Cycle, and REDD+Tropical forests are the most dynamic
terrestrial component of the global carbon budget (Global Carbon Project; FAO 2010; Pan et al. submitted)
– 55% of total global forest carbon stock– 13% of total global CO2 emissions (net emissions
from LUC)– 68% of total global forest CO2 removal from
atmosphere (gross C uptake)Data needs
Moderate Very large Huge!
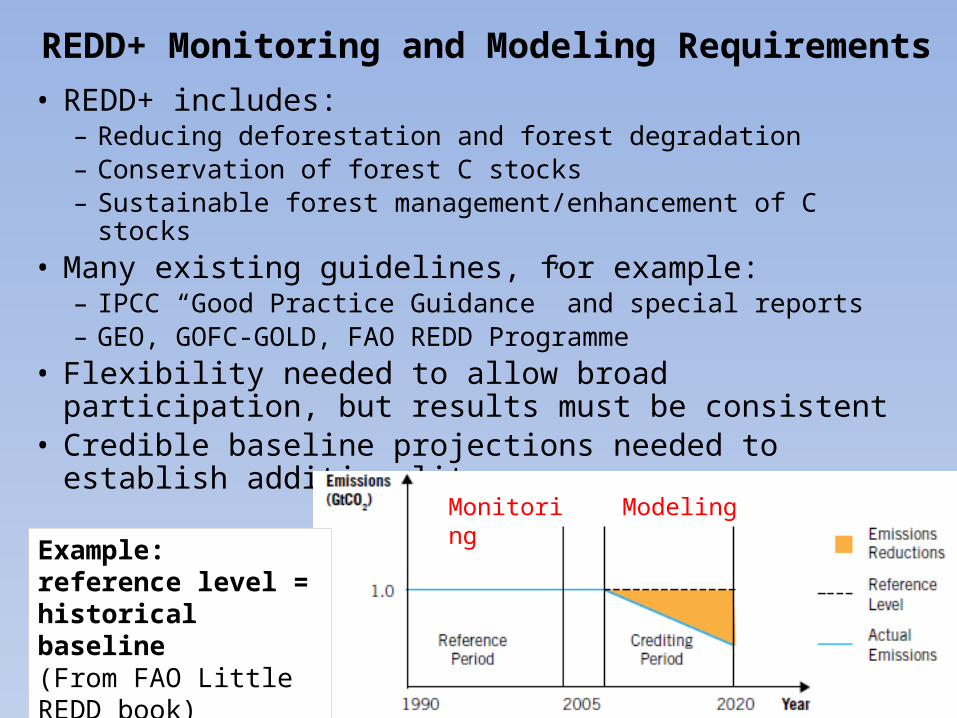
REDD+ Monitoring and Modeling Requirements• REDD+ includes:
– Reducing deforestation and forest degradation– Conservation of forest C stocks– Sustainable forest management/enhancement of C stocks
• Many existing guidelines, for example:– IPCC “Good Practice Guidance” and special reports– GEO, GOFC-GOLD, FAO REDD Programme
• Flexibility needed to allow broad participation, but results must be consistent
• Credible baseline projections needed to establish additionality:
Example: reference level = historical baseline (From FAO Little REDD book)
Monitoring Modeling
Examples of NACP/CarboNA Technical Support for REDD+ and Tropical Forest Monitoring
• Canada: working with Mexico and other tropical countries to implement the CBM-CFS3 approach
• U.S.A.: working with Mexico and other countries in forest inventory, remote sensing, and intensive-site measurements
• Mexico: demonstrator country under GEO-FCT and leading example of implementing monitoring for REDD
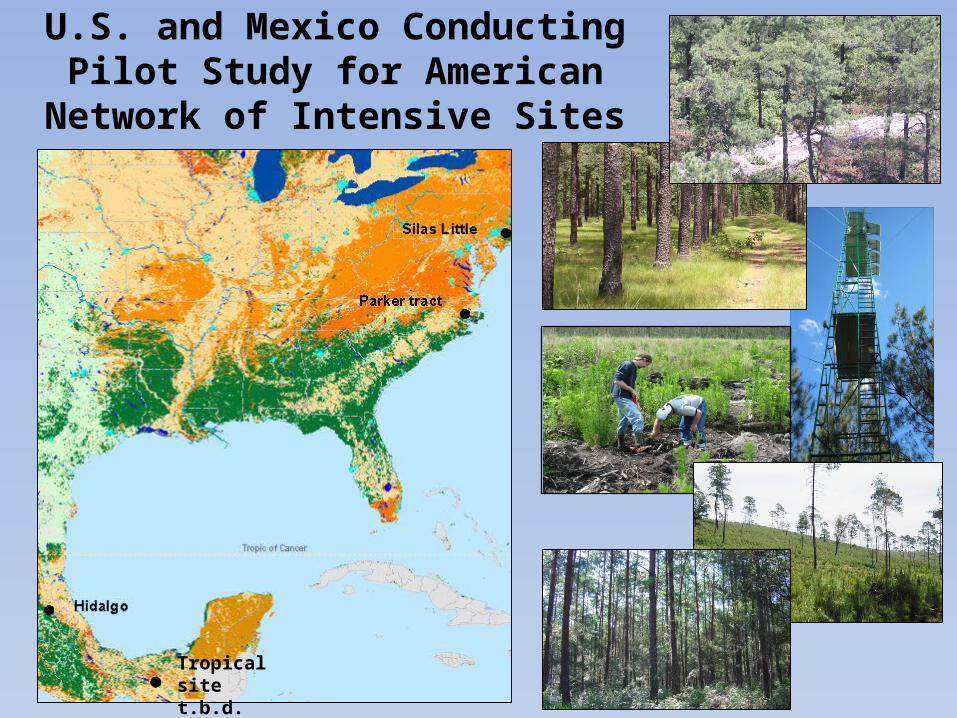
U.S. and Mexico Conducting Pilot Study for American Network of
Intensive Sites
Tropical site t.b.d.
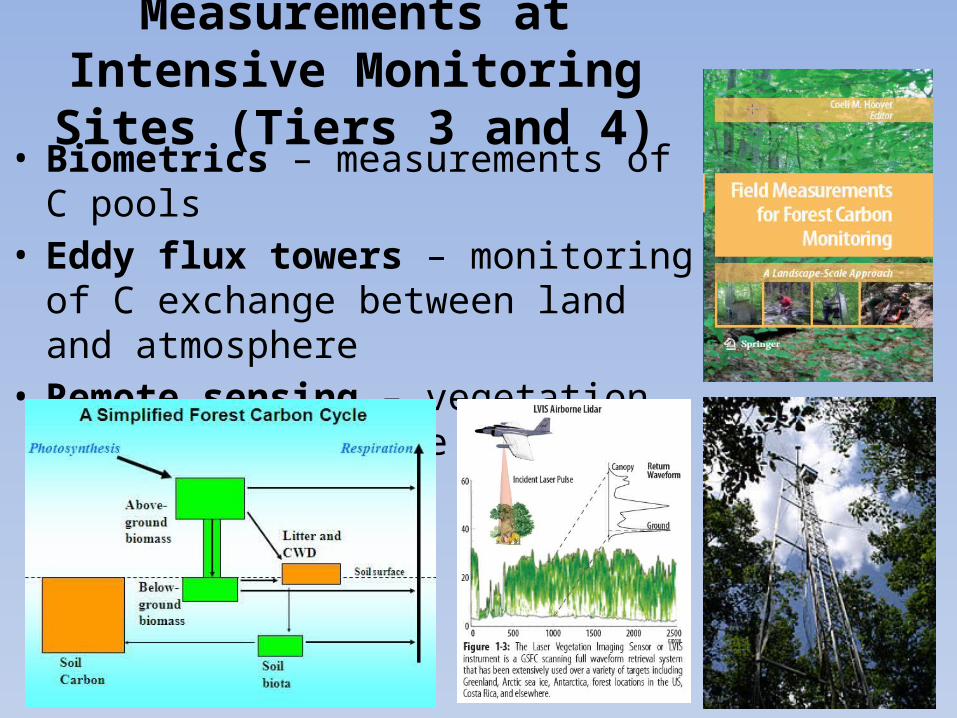
Measurements at Intensive Monitoring Sites (Tiers 3 and 4)
• Biometrics – measurements of C pools• Eddy flux towers – monitoring of C
exchange between land and atmosphere• Remote sensing – vegetation density and
change
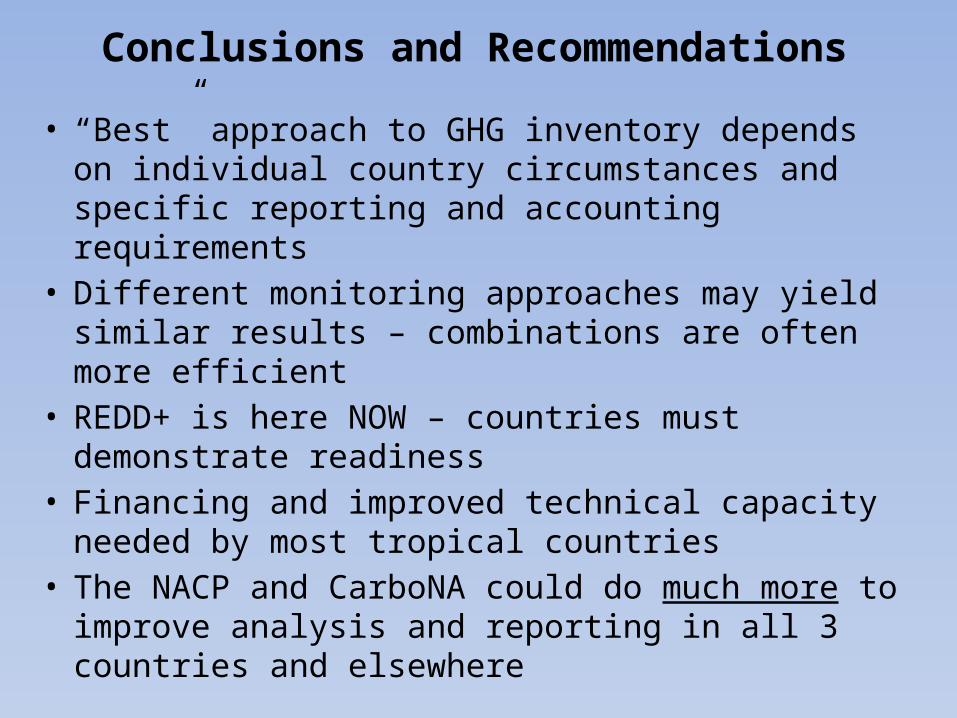
Conclusions and Recommendations
• “Best” approach to GHG inventory depends on individual country circumstances and specific reporting and accounting requirements
• Different monitoring approaches may yield similar results – combinations are often more efficient
• REDD+ is here NOW – countries must demonstrate readiness
• Financing and improved technical capacity needed by most tropical countries
• The NACP and CarboNA could do much more to improve analysis and reporting in all 3 countries and elsewhere
Thanks!
Related Documents