Global and regional burden of stroke during 1990–2010: findings from the Global Burden of Disease Study 2010 Valery L Feigin, Mohammad H Forouzanfar, Rita Krishnamurthi, George A Mensah, Myles Connor, Derrick A Bennett, Andrew E Moran, Ralph L Sacco, Laurie Anderson, Thomas Truelsen, Martin O’Donnell, Narayanaswamy Venketasubramanian, Suzanne Barker-Collo, Carlene M M Lawes, Wenzhi Wang, Yukito Shinohara, Emma Witt, Majid Ezzati, Mohsen Naghavi, and Christopher Murray * on behalf of the Global Burden of Diseases, Injuries, and Risk Factors Study 2010 (GBD 2010) and the GBD Stroke Experts Group National Institute for Stroke and Applied Neurosciences, Faculty of Health and Environmental Studies, Auckland Uwniversity of Technology, Auckland, New Zealand (Prof V L Feigin MD, R Krishnamurthi PhD, E Witt MSc); Institute for Health Metrics and Evaluation, Department of Global Health, University of Washington, Seattle, WA, USA (Prof M H Forouzanfar MD, Prof M Naghavi MD, Prof C Murray MD); National Institutes of Health Heart, Lung, and Blood Institute, Bethesda, MD, USA (G A Mensah, MD); Consultant Neurologist, National Health Service Borders, Melrose, UK (M Connor MBBCh); Division of Clinical Neurosciences, University of Edinburgh, UK (M Connor); Bute Medical School, University of St Andrews, UK (M Connor); School of Public Health, University of the Witwatersrand, South Africa (M Connor); Clinical Trial Service Unit and Epidemiological Studies Unit, Nuffield Department of Population Health, University of Oxford, Oxford, UK (D A Bennett PhD); Division of General Medicine, Columbia University Medical Center, NY, USA (Prof A E Moran MD); Miller School of Medicine, University of Miami, Miami, FL, USA (Prof R L Sacco MD); Department of Epidemiology, School of Public Health, University of Washington, and Washington State Institute for Public Policy, WA, USA (Prof L M Anderson); Department of Neurology, Copenhagen University Hospital Herlev, Herlev, Denmark (T Truelsen MD); MRC-HPA Centre for Environment and Health, Department of Epidemiology and Biostatistics, School of Public Health, Imperial College London, London, UK (Prof M Ezzati PhD); National University of Ireland, Galway, Ireland (Prof M O’Donnell PhD); Division of Neurology, University Medicine Cluster, Yong Loo Lin School of Medicine, and Saw Swee Hock School of Public Health, National University of Singapore, Singapore (N Venketasubramanian MBBS); School of Psychology (Prof S Barker-Collo PhD) and National Institute for Health Innovation (C M M Lawes MBChB), University of Auckland, Auckland, New Correspondence to: Prof Valery L Feigin, National Institute for Stroke and Applied Neurosciences, School of Rehabilitation and Occupation Studies, School of Public Health and Psychosocial Studies, Faculty of Health and Environmental Studies, Auckland University of Technology University, Auckland 1142, New Zealand, [email protected]. * Members of the GBD Stroke Expert Group listed at end of paper Contributors VLF, AEM, GM, and ME developed the study concept and oversaw the research. VLF, RK, EW, LA, MC, DB undertook reviews of studies. VLF, RK, EM, and SB-C extracted data from retrieved articles and, together with MHF and MN, managed databases. MHF and MN undertook statistical analysis of the data and produced graphs. VLF wrote the first draft of the report. MHF, MN, and CM developed the statistical model and wrote a section on statistical analysis and DALYs estimates. All authors contributed to the critical revision of the manuscript for important intellectual content. Conflicts of interest We declare that we have no conflicts of interest. NIH Public Access Author Manuscript Lancet. Author manuscript; available in PMC 2014 October 01. Published in final edited form as: Lancet. 2014 January 18; 383(9913): 245–254. NIH-PA Author Manuscript NIH-PA Author Manuscript NIH-PA Author Manuscript

Welcome message from author
This document is posted to help you gain knowledge. Please leave a comment to let me know what you think about it! Share it to your friends and learn new things together.
Transcript
Global and regional burden of stroke during 1990–2010: findingsfrom the Global Burden of Disease Study 2010
Valery L Feigin, Mohammad H Forouzanfar, Rita Krishnamurthi, George A Mensah, MylesConnor, Derrick A Bennett, Andrew E Moran, Ralph L Sacco, Laurie Anderson, ThomasTruelsen, Martin O’Donnell, Narayanaswamy Venketasubramanian, Suzanne Barker-Collo,Carlene M M Lawes, Wenzhi Wang, Yukito Shinohara, Emma Witt, Majid Ezzati, MohsenNaghavi, and Christopher Murray* on behalf of the Global Burden of Diseases, Injuries, andRisk Factors Study 2010 (GBD 2010) and the GBD Stroke Experts GroupNational Institute for Stroke and Applied Neurosciences, Faculty of Health and EnvironmentalStudies, Auckland Uwniversity of Technology, Auckland, New Zealand (Prof V L Feigin MD, RKrishnamurthi PhD, E Witt MSc); Institute for Health Metrics and Evaluation, Department ofGlobal Health, University of Washington, Seattle, WA, USA (Prof M H Forouzanfar MD, Prof MNaghavi MD, Prof C Murray MD); National Institutes of Health Heart, Lung, and Blood Institute,Bethesda, MD, USA (G A Mensah, MD); Consultant Neurologist, National Health ServiceBorders, Melrose, UK (M Connor MBBCh); Division of Clinical Neurosciences, University ofEdinburgh, UK (M Connor); Bute Medical School, University of St Andrews, UK (M Connor);School of Public Health, University of the Witwatersrand, South Africa (M Connor); Clinical TrialService Unit and Epidemiological Studies Unit, Nuffield Department of Population Health,University of Oxford, Oxford, UK (D A Bennett PhD); Division of General Medicine, ColumbiaUniversity Medical Center, NY, USA (Prof A E Moran MD); Miller School of Medicine, Universityof Miami, Miami, FL, USA (Prof R L Sacco MD); Department of Epidemiology, School of PublicHealth, University of Washington, and Washington State Institute for Public Policy, WA, USA(Prof L M Anderson); Department of Neurology, Copenhagen University Hospital Herlev, Herlev,Denmark (T Truelsen MD); MRC-HPA Centre for Environment and Health, Department ofEpidemiology and Biostatistics, School of Public Health, Imperial College London, London, UK(Prof M Ezzati PhD); National University of Ireland, Galway, Ireland (Prof M O’Donnell PhD);Division of Neurology, University Medicine Cluster, Yong Loo Lin School of Medicine, and SawSwee Hock School of Public Health, National University of Singapore, Singapore (NVenketasubramanian MBBS); School of Psychology (Prof S Barker-Collo PhD) and NationalInstitute for Health Innovation (C M M Lawes MBChB), University of Auckland, Auckland, New
Correspondence to: Prof Valery L Feigin, National Institute for Stroke and Applied Neurosciences, School of Rehabilitation andOccupation Studies, School of Public Health and Psychosocial Studies, Faculty of Health and Environmental Studies, AucklandUniversity of Technology University, Auckland 1142, New Zealand, [email protected].*Members of the GBD Stroke Expert Group listed at end of paper
ContributorsVLF, AEM, GM, and ME developed the study concept and oversaw the research. VLF, RK, EW, LA, MC, DB undertook reviews ofstudies. VLF, RK, EM, and SB-C extracted data from retrieved articles and, together with MHF and MN, managed databases. MHFand MN undertook statistical analysis of the data and produced graphs. VLF wrote the first draft of the report. MHF, MN, and CMdeveloped the statistical model and wrote a section on statistical analysis and DALYs estimates. All authors contributed to the criticalrevision of the manuscript for important intellectual content.
Conflicts of interestWe declare that we have no conflicts of interest.
NIH Public AccessAuthor ManuscriptLancet. Author manuscript; available in PMC 2014 October 01.
Published in final edited form as:Lancet. 2014 January 18; 383(9913): 245–254.
NIH
-PA
Author M
anuscriptN
IH-P
A A
uthor Manuscript
NIH
-PA
Author M
anuscript
Zealand; Beijing Neurosurgical Institute, Capital Medical University, Beijing, China (Prof W WangPhD); and Federation of National Public Service Personnel Mutual Aid Associations TachikawaHospital, Tachikawa, Tokyo, Japan (Y Shinohara, MD)
Summary
Background—Although stroke is the second leading cause of death worldwide, no
comprehensive and comparable assessment of incidence, prevalence, mortality, disability, and
epidemiological trends has been estimated for most regions. We used data from the Global Burden
of Diseases, Injuries, and Risk Factors Study 2010 (GBD 2010) to estimate the global and regional
burden of stroke during 1990–2010.
Methods—We searched Medline, Embase, LILACS, Scopus, PubMed, Science Direct, Global
Health Database, the WHO library, and WHO regional databases from 1990 to 2012 to identify
relevant studies published between 1990 and 2010. We applied the GBD 2010 analytical
technique (DisMod-MR), based on disease-specific, pre-specified associations between incidence,
prevalence, and mortality, to calculate regional and country-specific estimates of stroke incidence,
prevalence, mortality, and disability-adjusted life-years (DALYs) lost by age group (<75 years,
≥75 years, and in total) and country income level (high-income, and low-income and middle-
income) for 1990, 2005, and 2010.
Findings—We included 119 studies (58 from high-income countries and 61 from low-income
and middle-income countries). From 1990 to 2010, the age-standardised incidence of stroke
significantly decreased by 12% (95% CI 6–17) in high-income countries, and increased by 12% (–
3 to 22) in low-income and middle-income countries, albeit non-significantly. Mortality rates
decreased significantly in both high income (37%, 31–41) and low-income and middle-income
countries (20%, 15–30). In 2010, the absolute numbers of people with first stroke (16·9 million),
stroke survivors (33 million), stroke-related deaths (5·9 million), and DALYs lost (102 million)
were high and had significantly increased since 1990 (68%, 84%, 26%, and 12% increase,
respectively), with most of the burden (68·6% incident strokes, 52·2% prevalent strokes, 70·9%
stroke deaths, and 77·7% DALYs lost) in low-income and middle-income countries. In 2010, 5·2
million (31%) strokes were in children (aged <20 years old) and young and middle-aged adults
(20–64 years), to which children and young and middle-aged adults from low-income and middle-
income countries contributed almost 74 000 (89%) and 4·0 million (78%), respectively, of the
burden. Additionally, we noted significant geographical differences of between three and ten times
in stroke burden between GBD regions and countries. More than 62% of new strokes, 69·8% of
prevalent strokes, 45·5% of deaths from stroke, and 71·7% of DALYs lost because of stroke were
in people younger than 75 years.
Interpretation—Although age-standardised rates of stroke mortality have decreased worldwide
in the past two decades, the absolute number of people who have a stroke every year, stroke
survivors, related deaths, and the overall global burden of stroke (DALYs lost) are great and
increasing. Further study is needed to improve understanding of stroke determinants and burden
worldwide, and to establish causes of disparities and changes in trends in stroke burden between
countries of different income levels.
Funding—Bill & Melinda Gates Foundation.
Feigin et al. Page 2
Lancet. Author manuscript; available in PMC 2014 October 01.
NIH
-PA
Author M
anuscriptN
IH-P
A A
uthor Manuscript
NIH
-PA
Author M
anuscript
Introduction
Estimates from the Global Burden of Diseases, Injuries, and Risk Factors Study (GBD 2010)
ranked stroke as the second most common cause of death1 and the third most common cause
of disability-adjusted life-years (DALYs)2 worldwide in 2010. A previous systematic
review3 of population-based studies of stroke incidence from 28 countries showed that
incidence is increasing in low-income and middle-income countries, by contrast with high-
income countries where a 42% decrease in incidence has taken place in the past four
decades. However, no comprehensive and comparable assessment of stroke incidence,
prevalence, mortality, disability burden (as measured by DALYs lost), and recent
epidemiologic trends has been estimated for most world regions. The GBD 2010
investigators developed statistical methods4 to address incomplete epidemiological data and
provide the most complete and com parable estimates of the global burden of 291 diseases
and injuries in all countries grouped into 21 world regions (appendix). We report estimates
from GBD 2010 for stroke incidence, mortality, prevalence, and DALYs lost in all 21 GBD
world regions in 1990, 2005, and 2010.
Methods
Literature search and data extraction
Details of study eligibility criteria, literature search strategy, and data extraction have been
described in detail elsewhere.4,5 In brief, we included only studies that used WHO’s
definition of stroke,6 that reported methods for ascertainment stroke cases, that distinguished
between first-ever and recurrent stroke (only incident strokes were included in these
analyses), and that reported an age-specific epidemiological parameter of interest and the
population denominator (ie, stroke incidence or prevalence in 5 year or 10 year age bands)
with sufficient detail to enable an estimate of age-adjusted variables. Incidence studies from
high-income countries had to include complete ascertainment of stroke cases (ie, admitted or
not admitted to hospital, fatal and non-fatal) with several overlapping sources of information
(including family physicians and other community health services, nursing homes, hospital
admissions and discharges, neuroimaging and rehabilitation services, and death certificates)
as specified for ideal population-based studies.7 We allowed less rigorous case
ascertainment for studies from low-income and middle-income countries in which no other
relevant data were otherwise available (appendix).5
Stroke death and disease modelling
We used the GBD 2010 mortality database and an ensemble cause-of-death modelling
approach to estimate the mortality rate.1,8 The appendix shows the number of datapoints by
decade for each data source. A key element of the analysis of cause-of-death data is to take
the raw cause of death data and enhance comparability by mapping across various revisions
and national variants of the International Classification of Diseases, and to redistribute so-
called garbage codes to valid cause-of-death codes (appendix).8 We used the Cause of Death
Ensemble model (CODEm) for analysis of death data to estimate age-specific mortality by
See Online for appendix
Feigin et al. Page 3
Lancet. Author manuscript; available in PMC 2014 October 01.
NIH
-PA
Author M
anuscriptN
IH-P
A A
uthor Manuscript
NIH
-PA
Author M
anuscript
country for each stroke type.8,9 We selected a set of relevant covariates and assumed a
plausible direction of effect on the basis of existing scientific literature (appendix). A primary
objective of the analysis of cause of death was to provide estimates for countries and years
that had few data. To inform this analysis, we used several country-level covariates with the
constraint of a resultant plausible effect on outcome. We kept a risk factor (eg, blood
pressure) in the model if it had a positive association with death, and a protective factor (eg,
omega-3 consumption) if it had a negative association (plausible direction). We assumed
that a hierarchy of risk existed that would be retained in the model. As such, we gave risk
factors with a strong pathophysiological effect (level 1—ie, the top-most effect) precedence
over less strong risk factors and factors that were not directly related, such as country
income per person, education, and war.
The ensemble approach combined estimates from several best-performing individual models
made with different combinations of covariates and statistical approaches.9 We used six
different modelling strategies to estimate stroke mortality dependent on the strength of the
available data. All these strategies were designed to generate uncertainty distributions for
rates of stroke death. The model of stroke mortality was an ensemble of selected single-
cause fraction models. In a separate process—the CODCorrect process—the number of
deaths was rescaled to total the overall number of deaths (mortality envelope) for a country,
age, and sex. This process ensured that the sum of deaths from cardiovascular disease would
be equal to all deaths from this disease (modelled independently). The appendix shows the
estimates before and after the correction for stroke death.
DALYs
DALYs have two components: years of life lost (YLL) because of death and years lived
with disability (YLD). The methodology for calculation of DALYs in GBD 2010 has been
described elsewhere.2,4 Briefly, to calculate YLL, the age at death for each fatality is
subtracted from the reference life expectancy at that age.10 YLD represent healthy life-years
lost in survivors, and are calculated from the number of patients living with stroke sequelae,
the number of years living with disability due to the disease, and the disability weight (ie,
the severity of the disease state). Disability weights range between 0 and 1, whereby 0·0
denotes no disability (symptom, limitation, or loss of health), and 1·0 denotes a life value
equal to death.2 To calculate YLD, the stroke prevalence is multiplied by the disability
weight. To control for comorbidity, we estimated YLD with a microsimulation method
assuming independent probabilities of comorbid diseases (eg, stroke plus diabetes). The
resulting disability weights for comorbidity matched the pattern of quality of life in patients
with comorbid illnesses in the US Medical Expenditure Panel Survey (MEPS) study2
adjusted by decreasing of total disability (total disability of two sequelae in a person would
be less than the sum of each disability). The disability weights were calculated with personal
interviews in Bangladesh, Indonesia, Peru, and Tanzania; telephone interviews in the USA;
and an open-access web-based survey.11 Five sequelae of stroke were defined and assessed
for GBD. The appendix presents lay descriptions for disability of each stroke sequela with
the associated disability weights used in GBD 2004.
Feigin et al. Page 4
Lancet. Author manuscript; available in PMC 2014 October 01.
NIH
-PA
Author M
anuscriptN
IH-P
A A
uthor Manuscript
NIH
-PA
Author M
anuscript
The second important factor is distribution of severity or levels of disability within a
disorder. We empirically identified the distribution of severity for chronic stroke by analysis
of individual-level measurements of functional health status with the 12-item short form
questionnaire for three population surveys: the US MEPS 2000–2009, the National
Epidemiological Survey on Alcohol and Related Conditions (NESARC) 2000–2001 and
2004–2005, and the Australian National Survey of Mental Health and Wellbeing of Adults
(AHS) 1997.4,10,12 We calculated the severity distribution for acute stroke with findings
from studies of the distribution of functional disability immediately (≤3 days after the event)
and after (within the first month) stroke measured by the Rankin Scale.13 We assumed the
same disability for haemorrhagic and ischaemic stroke during the hyperacute phase (ie, 1–3
days after the event), but considered disability separately for these stroke types after day
three. We assumed a similar distribution of severity on the basis of the GBD sequela
definition and Rankin Scale categories.14 A slight difference between the definition of
disability and categories in GBD 2010 and the Rankin Scale13 was regarded as acceptable
by consensus of members of an international collaborative stroke expert group (appendix).
We calculated a weighted average of disability to estimate a disability weight for 28 days
after acute stroke of 0·1 for the first 3 days after stroke and 0·9 after 3 days. These data are a
heterogeneous set from developed and developing countries. Scientific literature about the
functional status of acute patients that could be translated for GBD purposes was scarce; we
therefore included all available information.
Stroke incidence and prevalence
Stroke survivors have two sequelae: acute stroke and chronic stroke. For each sequela, we
used models to estimate the number of patients in each age group, sex, region, and year. The
appendix presents the studies identified in a systematic review of the literature. Most studies
reported incidence of first-ever stroke. In GBD, sequelae of acute stroke includes all cases,
including first-ever and repeated events. We used meta-regression weighted by the
proportion of first-ever stroke in all cases of acute stroke to pool the results of studies from
The Netherlands,15 Spain,16 and Australia.17 These studies reported both all-stroke and first-
ever stroke incidence by age. We used the same proportion of first-ever stroke to all stroke
for all GBD regions. We defined a patient with chronic stroke as being diagnosed by a
physician or having a history of definite stroke. Data for stroke prevalence include all stroke
patients irrespective of the type of acute stroke. To be consistent with prevalence and
mortality data of chronic stroke, we calculated incidence of chronic stroke (stroke
survivors). We multiplied incidence of first-ever stroke by survival proportion after 28 days
to estimate incidence of chronic stroke at the regional level. We used the GBD 2010
analytical technique DisMod-MR to estimate the number of incident strokes overall and
ischaemic and haemorrhagic strokes (non-ischaemic; prevalence estimates were for total
strokes only).
To estimate prevalence of acute stroke cases, we modelled incidence and case fatality of
acute strokes. An incident case is a person who has been diagnosed with the type of stroke
or who has died due to stroke. By definition, a prevalent case would be a person having a
stroke in the past 28 days. Finally, because generally more data were available for incidence
of total stroke, we used this aspect to improve stroke-specific incidence by rescaling the
Feigin et al. Page 5
Lancet. Author manuscript; available in PMC 2014 October 01.
NIH
-PA
Author M
anuscriptN
IH-P
A A
uthor Manuscript
NIH
-PA
Author M
anuscript
results of stroke by type to be summed to all-stroke incidence. We corrected the estimated
incidence and prevalence on the basis of the proportion of first-ever stroke in incidence of
total stroke to identify the prevalence of all-stroke cases of acute stroke (first-ever and
recurrent strokes; appendix). We also calculated mortality-to-incidence ratio for each region
and country as an indicator of the success or failure of strategies for stroke management in a
specific region or country (ratio numbers were based on the total number of incident cases
and deaths). We estimated p values on the basis of 1000 draws of the posterior distribution
of each statistic. Because some posterior distributions deviated significantly from normal
distribution, 2·5 and 97·5 percentiles of the draws were reported as lower and upper bounds
of the uncertainty interval for the statistic. We calculated 95% CIs for all rates.
We analysed stroke incidence, prevalence, and mortality rates for 21 GBD regions that we
combined into two major categories: high-income countries (North America, western and
central Europe, Australasia, and high-income Asia Pacific) and low-income and middle-
income countries (central, east, south, and southeast Asia; eastern Europe; Andean, central,
southern, and tropical Latin America and the Caribbean; and North Africa and the Middle
East, Oceania, central, east, southern, and west sub-Saharan Africa). We present overall data
for stroke burden by country income level. We report age-standardised incidence and
mortality rates per 100 000 person-years, and prevalence and DALYs estimates per 100 000
people with the direct method of standardisation and WHOs standard population as a
reference.18
Role of the funding source
The sponsor of the study had no role in study design, data collection, data analysis, data
interpretation, or writing of the report. The Writing and GBD Global Analysis Group had
full access to all the data in the study and had final responsibility for the decision to submit
for publication.
Results
The appendix shows a flowchart for selection of studies. Of 16 558 potentially eligible
studies undertaken in 1990–2010, we selected 119 articles for final analysis: 58 from high-
income countries and 61 from low-income and middle-income countries. 59 studies reported
incidence and excess mortality data, 34 reported prevalence, and 26 reported data only for
excess mortality. The appendix provides a list of studies included in the analysis. Studies of
a high methodological quality (quality rating 4–5) constituted 55 (95%) of the studies in
high-income countries and 14 (23%) of those in low-income and middle-income countries.
105 studies were done in 1990–2004 and 14 in 2005–10; some studies overlapped (2004–
05).
The appendix shows country-specific stroke burden in 1990, 2005, and 2010. We noted
significant geographical variations in stroke incidence by country, ranging in 2010 from 60
cases (Kuwait) to 504 cases (Lithuania) per 100 000 person-years; mortality rates, ranging
from 27 cases (France) to 264 cases (Afghanistan) per 100 000 person-years; prevalence,
ranging from 82 stroke survivors (Burundi) to 1187 survivors (Canada) per 100 000 people;
DALYs lost, ranging from 398 (Australia) to 5227 (Afghanistan) per 100 000 people; and in
Feigin et al. Page 6
Lancet. Author manuscript; available in PMC 2014 October 01.
NIH
-PA
Author M
anuscriptN
IH-P
A A
uthor Manuscript
NIH
-PA
Author M
anuscript
mortality-to-incidence ratios, ranging from 0·11 (Iran) to 1·35 (Afghanistan). Overall, in
2010, an estimated 16·9 million cases of incident stroke took place worldwide (69% in low-
income and middle-income countries), 33·0 million prevalent stroke cases (52% in low-
income and middle-income countries), 5·9 million stroke deaths (71% in low-income and
middle-income countries), and 102·2 million DALYs lost (78% in low-income and middle-
income countries; table 1). More than 38% of new strokes (50% in high-income countries
and 32% in low-income and middle-income countries), 30% of prevalent strokes (40% in
high-income countries and 22% in low-income and middle-income countries), 55% of stroke
deaths (73% in high-income countries and 47% in low-income and middle-income
countries), and 28% of DALYs lost (46% in high-income countries and 23% in low-income
and middle-income countries) were in people aged 75 years and older (table 1).
Globally, in 2010, the mortality-to-incidence ratio was 0·35 (0·32 in high-income countries
and 0·36 in low-income and middle-income countries; table 1). Although overall we noted
no significant change in age-standardised incidence of stroke between 1990 and 2010 (table
1), the direction of changes was different between countries by income level (a 12% [95%
CI 6%–17%] statistically significant decrease in high-income countries, and a 12% [−3 to
22] non-significant increase in low-income and middle-income countries). Further more,
there was a significant 25% reduction in mortality rate (37% [31–41] in high-income
countries and 20% [15–30] in low-income and middle-income countries), DALYs lost (36%
[30–40] and 22% [18–32], respectively), and mortality-to-incidence ratio (23% [14–29] and
27% [14–38]). Stroke prevalence increased significantly by 27% (19–43) in high-income
countries only; the 8·5% (−13 to 34) increase in low-income and middle-income countries
was not significant. Globally, for 1990–2010, we noted a 25% (13–33) significant increase
in stroke incidence in people aged 20–64 years, mostly attributable to an 18% (10–25)
significant increase in low-income and middle-income countries.
In the past two decades globally, noticeable increases took place in the absolute numbers of
people with incident stroke (a 68% increase), stroke survivors (84%), stroke-related deaths
(26%), and DALYs lost (12%; table 1). The most striking increases in the number of stroke
survivors (113%), DALYs lost (31%), and stroke-related deaths (36%) were in people aged
75 years and older (table 1). Presently, age-standardised rates of stroke incidence in low-
income and middle-income countries exceed those in high-income countries by 23% (24%
in people younger than 75 years and 21% in people aged 75 years and older), but the number
of people younger than 75 years with incident stroke in low-income and middle-income
countries is more than three times that in high-income countries (table 1). Similarly, the
number of DALYs lost in people younger than 75 years in low-income and middle-income
countries exceeded those lost in high-income countries by almost five times (table 1),
whereas in people aged 75 years and older, DALYs lost in low-income and middle-income
countries exceeded those lost in high-income countries by less than two times (table 1).
Conversely, the number of stroke survivors aged 75 years and older in high-income
countries exceeded the number in low-income and middle-income countries by 40% (table
1), whereas there were almost 30% more survivors younger than 75 years in low-income and
middle-income countries than in high-income countries (table 1). Age-standardised rates of
stroke mortality in people aged 75 years and older in low-income and middle-income
countries exceeded mortality rates by 33% in the same age group of people living in high-
Feigin et al. Page 7
Lancet. Author manuscript; available in PMC 2014 October 01.
NIH
-PA
Author M
anuscriptN
IH-P
A A
uthor Manuscript
NIH
-PA
Author M
anuscript
income countries, and by 212% for the younger than 75 years population (table 1). Mortality
to incidence ratios in people younger than 75 years in low-income and middle-income
countries were significantly higher at 37% greater than those in high-income countries, but
in those aged 75 years and older, the excess was only 12% (table 1). In 2010, 5·2 million
(31%) strokes were in children (aged <20 years) and young and middle-aged adults (20–64
years), to which children and young to middle-age adults in low-income and middle-income
countries contributed almost 74 000 (89%) and 4·0 million (78%), respectively, of the
burden.
Important differences in trends were found between high-income and low-income and
middle-income regions in age-adjusted incidence and mortality rates, prevalence, DALYs
lost, and mortality-to-ratios by age group (table 1). In high-income countries, age-
standardised rates of stroke incidence were most significantly decreased in people aged 75
years and older (16% vs 9·1% in younger people; table 1), whereas prevalence increased
significantly by a similar proportion (23–25%) in people of both age groups (table 1). Age-
standardised mortality rates in high-income countries significantly decreased by a similar
proportion in younger and older people (by 36–39%; table 1), whereas DALYs lost fell by
36% in people younger than 75 years and by 63% in older people (table 1). The greatest
reduction in mortality-to-incidence ratios was in people younger than 75 years in high-
income countries (32% decrease) compared with a 21% reduction in people aged 75 years
and older, with the lowest ratios shown in 2010 for both age groups (table 1).
In low-income and middle-income countries, age-standardised incidence and prevalence
increased almost equally (9–10%) in younger and older people, but the increases were not
significant (table 1). Most striking were significant reductions in rates of age-standardised
stroke mortality (24%), DALYs lost (24%), and mortality-to-incidence ratios (32%) in
people younger than 75 years compared with older people (16%, 17%, and 23%
respectively; table 1). In 2010, children and youths (aged <20 years) and young and middle-
aged adults (20–64 years) constituted 0·5% and 31%, respectively, of all people with
incident stroke (0·1% and 21%, respectively, in high-income countries and 0·6% and 35%,
respectively, in low-income and middle-income countries), 1·1% and 43% of all prevalent
strokes (0·5% and 34% in high-income countries, and 1·6% and 51% in low-income and
middle-income countries), and 0·7% and 22% of all stroke deaths (0·05% and 11% in high-
income countries, and 1% and 26% in low-income and middle-income countries).
Although the mean age of people with incident stroke worldwide has not significantly
changed in the past two decades (table 2), a significant increase took place in the mean age
of incident, prevalent, and fatal strokes in both high-income and low-income and middle-
income countries (table 2). The mean age of patients with incident and prevalent stroke in
high-income countries was more than 5 years greater than that in low-income and middle-
income countries (table 2). The mean age that people had fatal strokes in low-income and
middle-income countries was more than 8 years younger than that in high-income countries
(table 2).
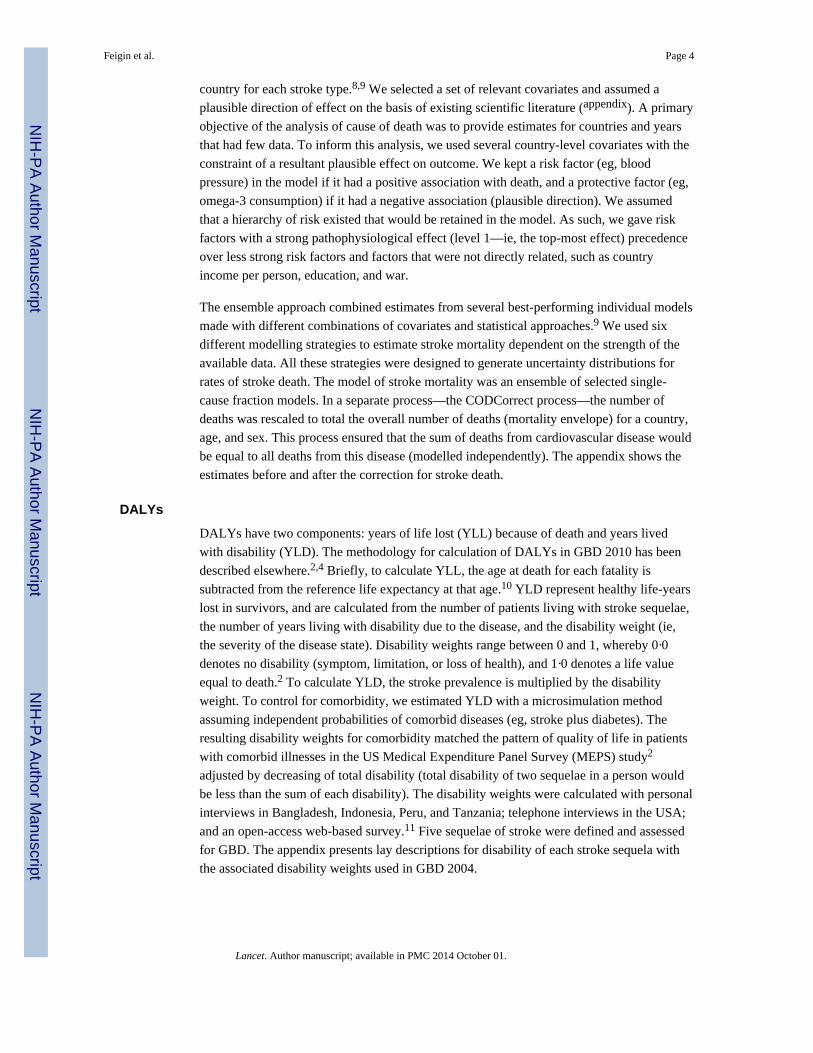
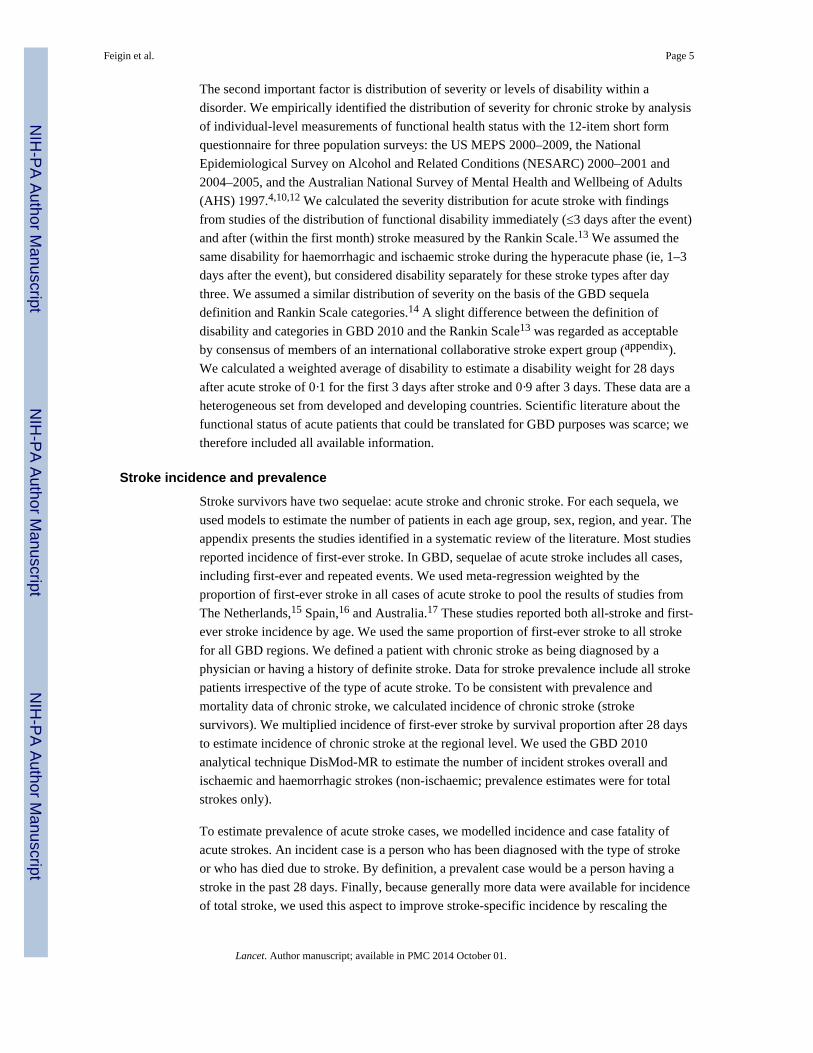
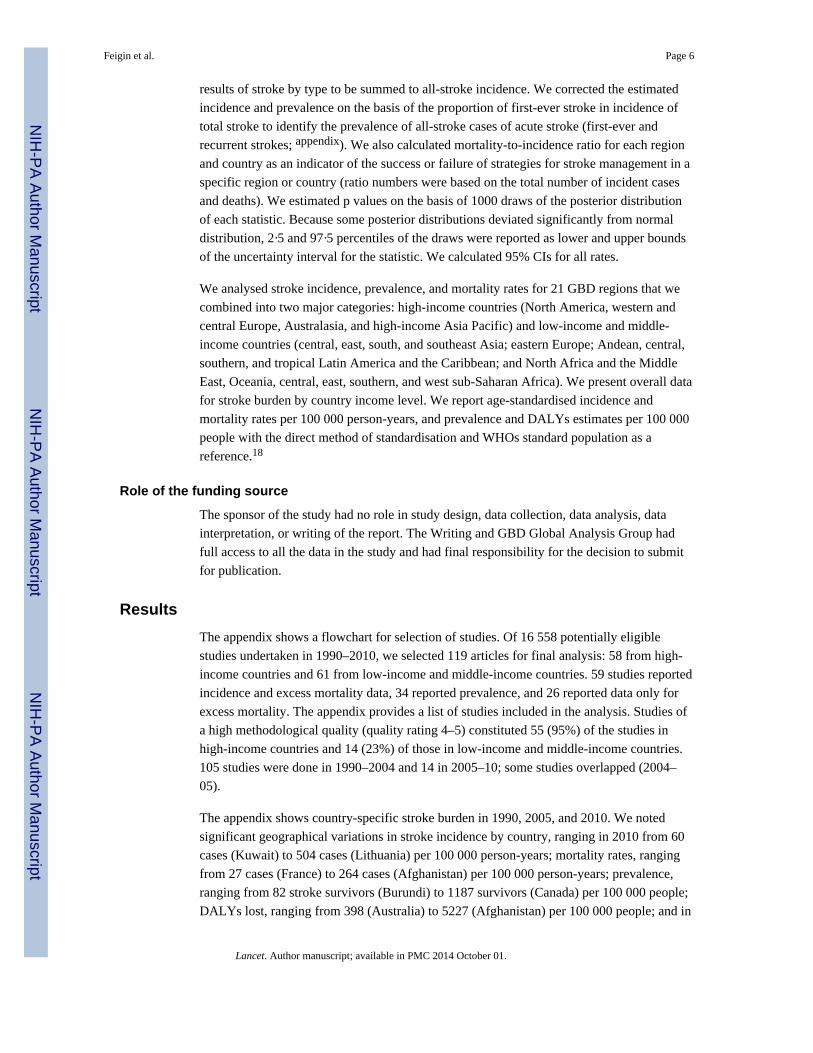
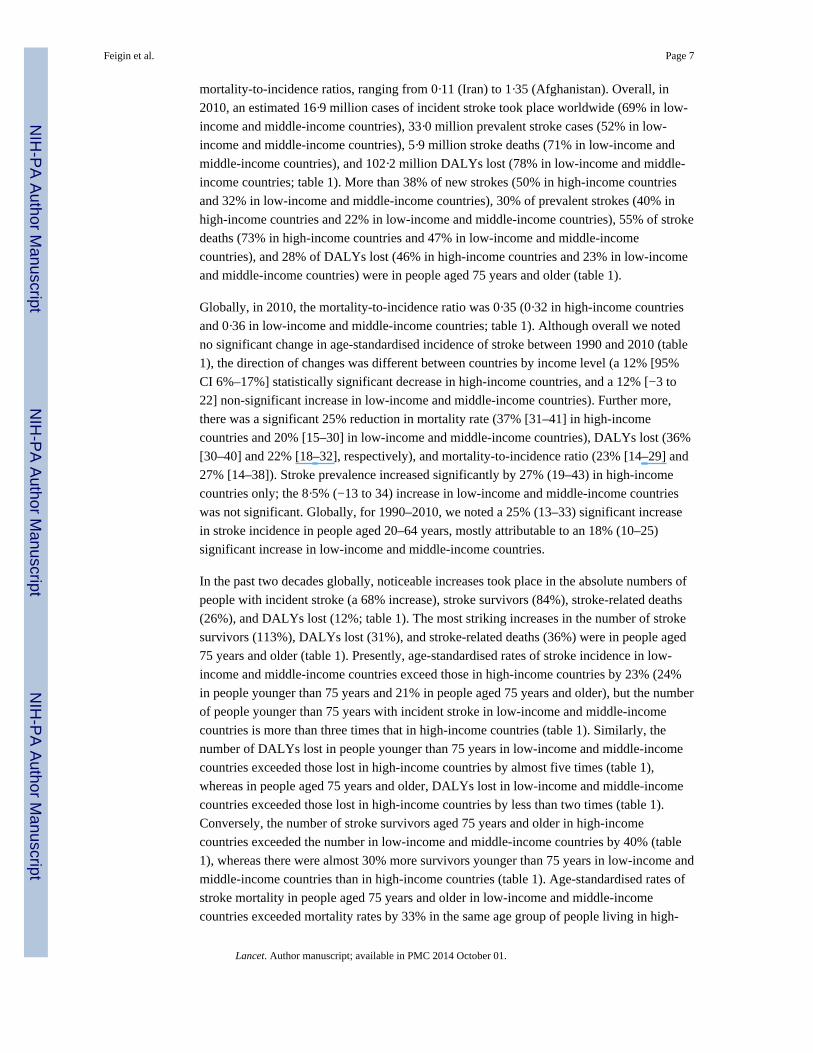
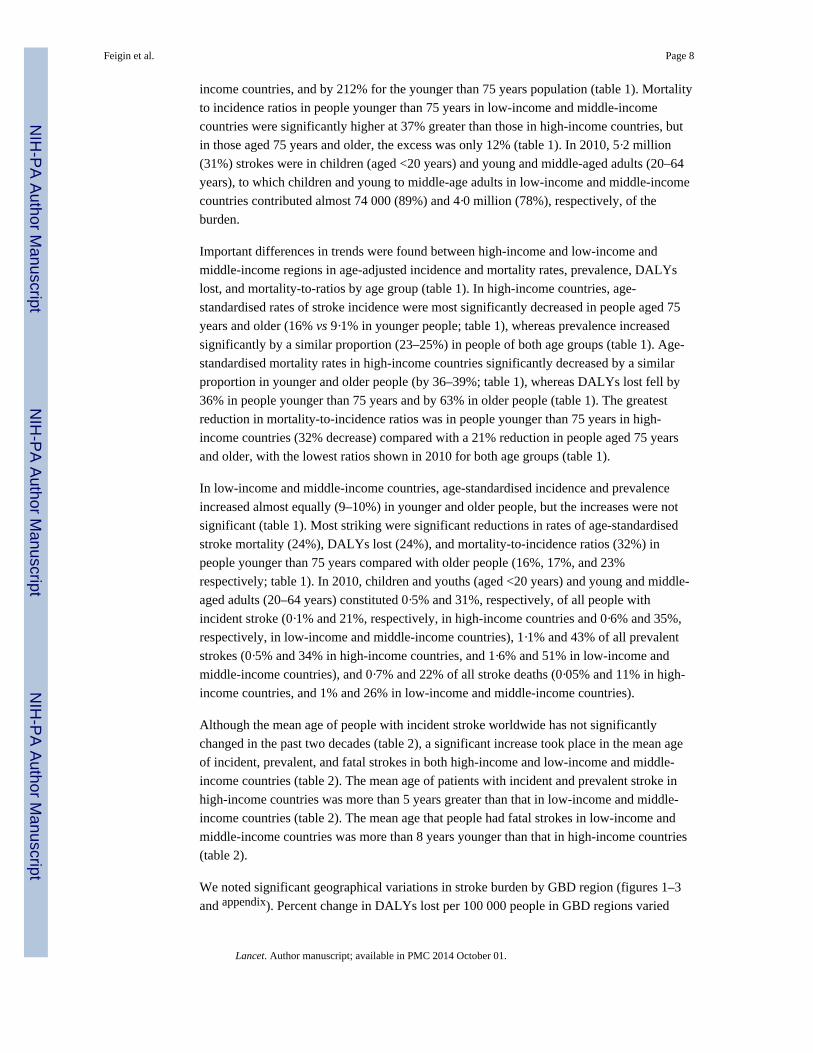
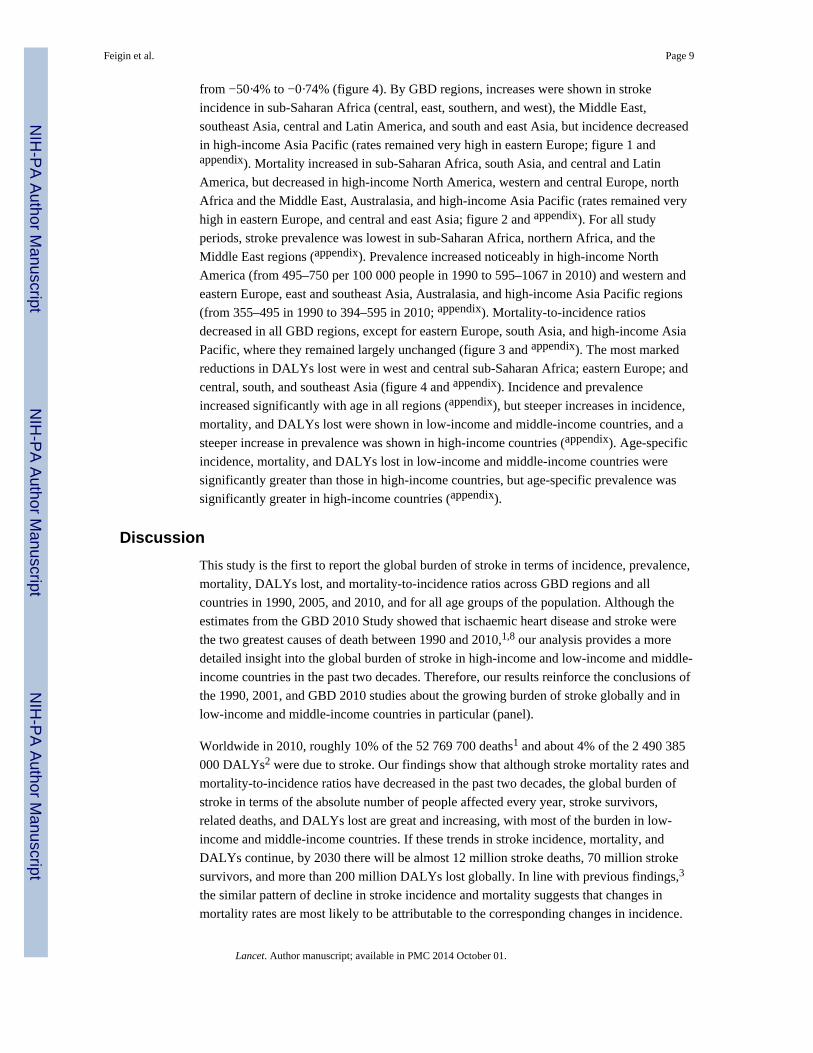
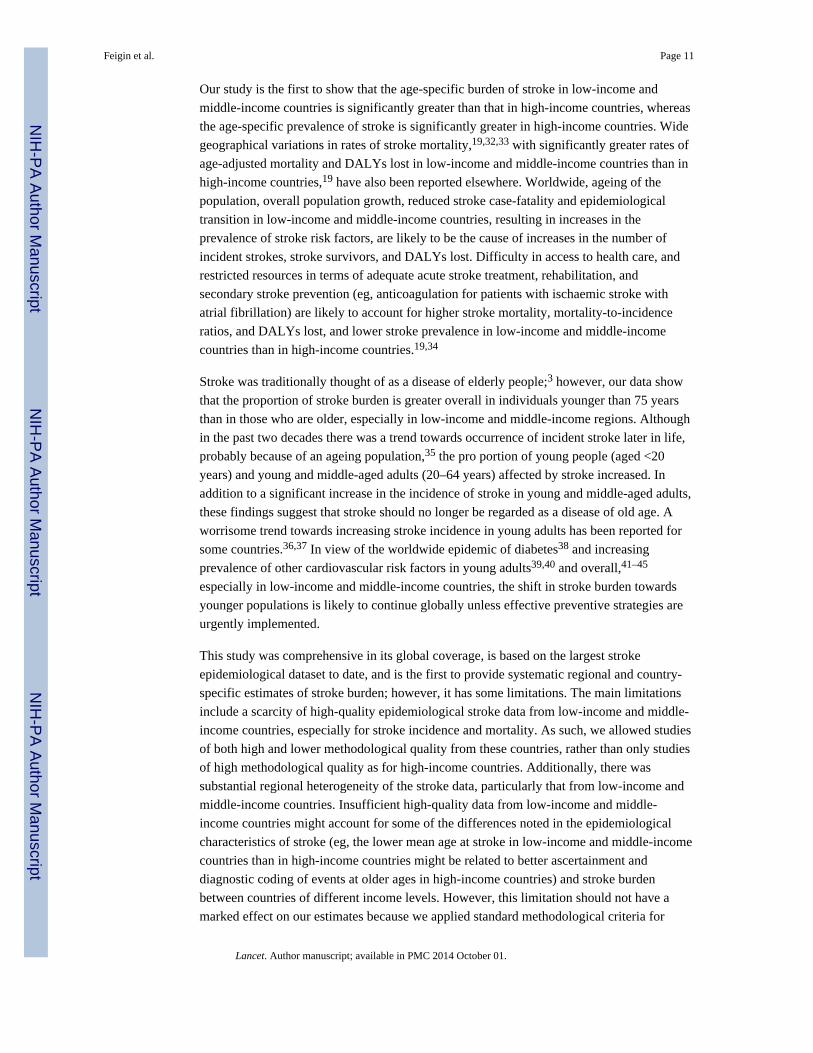
We noted significant geographical variations in stroke burden by GBD region (figures 1–3
and appendix). Percent change in DALYs lost per 100 000 people in GBD regions varied
Feigin et al. Page 8
Lancet. Author manuscript; available in PMC 2014 October 01.
NIH
-PA
Author M
anuscriptN
IH-P
A A
uthor Manuscript
NIH
-PA
Author M
anuscript
from −50·4% to −0·74% (figure 4). By GBD regions, increases were shown in stroke
incidence in sub-Saharan Africa (central, east, southern, and west), the Middle East,
southeast Asia, central and Latin America, and south and east Asia, but incidence decreased
in high-income Asia Pacific (rates remained very high in eastern Europe; figure 1 andappendix). Mortality increased in sub-Saharan Africa, south Asia, and central and Latin
America, but decreased in high-income North America, western and central Europe, north
Africa and the Middle East, Australasia, and high-income Asia Pacific (rates remained very
high in eastern Europe, and central and east Asia; figure 2 and appendix). For all study
periods, stroke prevalence was lowest in sub-Saharan Africa, northern Africa, and the
Middle East regions (appendix). Prevalence increased noticeably in high-income North
America (from 495–750 per 100 000 people in 1990 to 595–1067 in 2010) and western and
eastern Europe, east and southeast Asia, Australasia, and high-income Asia Pacific regions
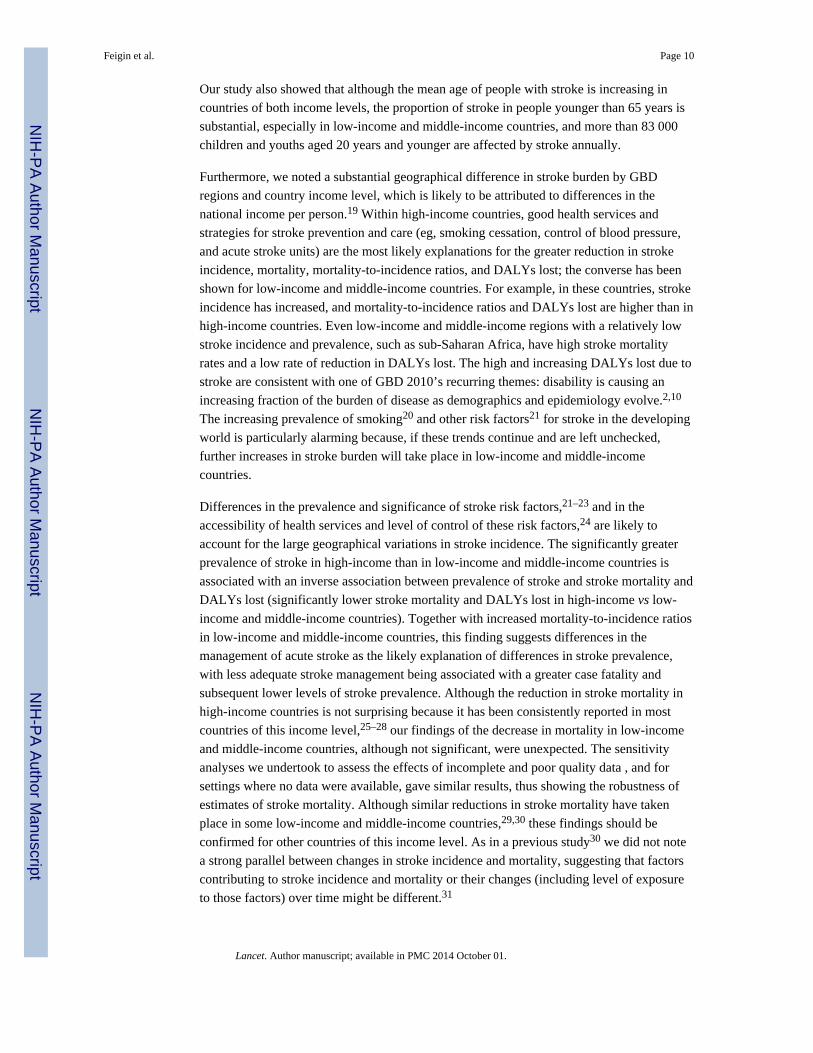
(from 355–495 in 1990 to 394–595 in 2010; appendix). Mortality-to-incidence ratios
decreased in all GBD regions, except for eastern Europe, south Asia, and high-income Asia
Pacific, where they remained largely unchanged (figure 3 and appendix). The most marked
reductions in DALYs lost were in west and central sub-Saharan Africa; eastern Europe; and
central, south, and southeast Asia (figure 4 and appendix). Incidence and prevalence
increased significantly with age in all regions (appendix), but steeper increases in incidence,
mortality, and DALYs lost were shown in low-income and middle-income countries, and a
steeper increase in prevalence was shown in high-income countries (appendix). Age-specific
incidence, mortality, and DALYs lost in low-income and middle-income countries were
significantly greater than those in high-income countries, but age-specific prevalence was
significantly greater in high-income countries (appendix).
Discussion
This study is the first to report the global burden of stroke in terms of incidence, prevalence,
mortality, DALYs lost, and mortality-to-incidence ratios across GBD regions and all
countries in 1990, 2005, and 2010, and for all age groups of the population. Although the
estimates from the GBD 2010 Study showed that ischaemic heart disease and stroke were
the two greatest causes of death between 1990 and 2010,1,8 our analysis provides a more
detailed insight into the global burden of stroke in high-income and low-income and middle-
income countries in the past two decades. Therefore, our results reinforce the conclusions of
the 1990, 2001, and GBD 2010 studies about the growing burden of stroke globally and in
low-income and middle-income countries in particular (panel).
Worldwide in 2010, roughly 10% of the 52 769 700 deaths1 and about 4% of the 2 490 385
000 DALYs2 were due to stroke. Our findings show that although stroke mortality rates and
mortality-to-incidence ratios have decreased in the past two decades, the global burden of
stroke in terms of the absolute number of people affected every year, stroke survivors,
related deaths, and DALYs lost are great and increasing, with most of the burden in low-
income and middle-income countries. If these trends in stroke incidence, mortality, and
DALYs continue, by 2030 there will be almost 12 million stroke deaths, 70 million stroke
survivors, and more than 200 million DALYs lost globally. In line with previous findings,3
the similar pattern of decline in stroke incidence and mortality suggests that changes in
mortality rates are most likely to be attributable to the corresponding changes in incidence.
Feigin et al. Page 9
Lancet. Author manuscript; available in PMC 2014 October 01.
NIH
-PA
Author M
anuscriptN
IH-P
A A
uthor Manuscript
NIH
-PA
Author M
anuscript
Our study also showed that although the mean age of people with stroke is increasing in
countries of both income levels, the proportion of stroke in people younger than 65 years is
substantial, especially in low-income and middle-income countries, and more than 83 000
children and youths aged 20 years and younger are affected by stroke annually.
Furthermore, we noted a substantial geographical difference in stroke burden by GBD
regions and country income level, which is likely to be attributed to differences in the
national income per person.19 Within high-income countries, good health services and
strategies for stroke prevention and care (eg, smoking cessation, control of blood pressure,
and acute stroke units) are the most likely explanations for the greater reduction in stroke
incidence, mortality, mortality-to-incidence ratios, and DALYs lost; the converse has been
shown for low-income and middle-income countries. For example, in these countries, stroke
incidence has increased, and mortality-to-incidence ratios and DALYs lost are higher than in
high-income countries. Even low-income and middle-income regions with a relatively low
stroke incidence and prevalence, such as sub-Saharan Africa, have high stroke mortality
rates and a low rate of reduction in DALYs lost. The high and increasing DALYs lost due to
stroke are consistent with one of GBD 2010’s recurring themes: disability is causing an
increasing fraction of the burden of disease as demographics and epidemiology evolve.2,10
The increasing prevalence of smoking20 and other risk factors21 for stroke in the developing
world is particularly alarming because, if these trends continue and are left unchecked,
further increases in stroke burden will take place in low-income and middle-income
countries.
Differences in the prevalence and significance of stroke risk factors,21–23 and in the
accessibility of health services and level of control of these risk factors,24 are likely to
account for the large geographical variations in stroke incidence. The significantly greater
prevalence of stroke in high-income than in low-income and middle-income countries is
associated with an inverse association between prevalence of stroke and stroke mortality and
DALYs lost (significantly lower stroke mortality and DALYs lost in high-income vs low-
income and middle-income countries). Together with increased mortality-to-incidence ratios
in low-income and middle-income countries, this finding suggests differences in the
management of acute stroke as the likely explanation of differences in stroke prevalence,
with less adequate stroke management being associated with a greater case fatality and
subsequent lower levels of stroke prevalence. Although the reduction in stroke mortality in
high-income countries is not surprising because it has been consistently reported in most
countries of this income level,25–28 our findings of the decrease in mortality in low-income
and middle-income countries, although not significant, were unexpected. The sensitivity
analyses we undertook to assess the effects of incomplete and poor quality data , and for
settings where no data were available, gave similar results, thus showing the robustness of
estimates of stroke mortality. Although similar reductions in stroke mortality have taken
place in some low-income and middle-income countries,29,30 these findings should be
confirmed for other countries of this income level. As in a previous study30 we did not note
a strong parallel between changes in stroke incidence and mortality, suggesting that factors
contributing to stroke incidence and mortality or their changes (including level of exposure
to those factors) over time might be different.31
Feigin et al. Page 10
Lancet. Author manuscript; available in PMC 2014 October 01.
NIH
-PA
Author M
anuscriptN
IH-P
A A
uthor Manuscript
NIH
-PA
Author M
anuscript
Our study is the first to show that the age-specific burden of stroke in low-income and
middle-income countries is significantly greater than that in high-income countries, whereas
the age-specific prevalence of stroke is significantly greater in high-income countries. Wide
geographical variations in rates of stroke mortality,19,32,33 with significantly greater rates of
age-adjusted mortality and DALYs lost in low-income and middle-income countries than in
high-income countries,19 have also been reported elsewhere. Worldwide, ageing of the
population, overall population growth, reduced stroke case-fatality and epidemiological
transition in low-income and middle-income countries, resulting in increases in the
prevalence of stroke risk factors, are likely to be the cause of increases in the number of
incident strokes, stroke survivors, and DALYs lost. Difficulty in access to health care, and
restricted resources in terms of adequate acute stroke treatment, rehabilitation, and
secondary stroke prevention (eg, anticoagulation for patients with ischaemic stroke with
atrial fibrillation) are likely to account for higher stroke mortality, mortality-to-incidence
ratios, and DALYs lost, and lower stroke prevalence in low-income and middle-income
countries than in high-income countries.19,34
Stroke was traditionally thought of as a disease of elderly people;3 however, our data show
that the proportion of stroke burden is greater overall in individuals younger than 75 years
than in those who are older, especially in low-income and middle-income regions. Although
in the past two decades there was a trend towards occurrence of incident stroke later in life,
probably because of an ageing population,35 the pro portion of young people (aged <20
years) and young and middle-aged adults (20–64 years) affected by stroke increased. In
addition to a significant increase in the incidence of stroke in young and middle-aged adults,
these findings suggest that stroke should no longer be regarded as a disease of old age. A
worrisome trend towards increasing stroke incidence in young adults has been reported for
some countries.36,37 In view of the worldwide epidemic of diabetes38 and increasing
prevalence of other cardiovascular risk factors in young adults39,40 and overall,41–45
especially in low-income and middle-income countries, the shift in stroke burden towards
younger populations is likely to continue globally unless effective preventive strategies are
urgently implemented.
This study was comprehensive in its global coverage, is based on the largest stroke
epidemiological dataset to date, and is the first to provide systematic regional and country-
specific estimates of stroke burden; however, it has some limitations. The main limitations
include a scarcity of high-quality epidemiological stroke data from low-income and middle-
income countries, especially for stroke incidence and mortality. As such, we allowed studies
of both high and lower methodological quality from these countries, rather than only studies
of high methodological quality as for high-income countries. Additionally, there was
substantial regional heterogeneity of the stroke data, particularly that from low-income and
middle-income countries. Insufficient high-quality data from low-income and middle-
income countries might account for some of the differences noted in the epidemiological
characteristics of stroke (eg, the lower mean age at stroke in low-income and middle-income
countries than in high-income countries might be related to better ascertainment and
diagnostic coding of events at older ages in high-income countries) and stroke burden
between countries of different income levels. However, this limitation should not have a
marked effect on our estimates because we applied standard methodological criteria for
Feigin et al. Page 11
Lancet. Author manuscript; available in PMC 2014 October 01.
NIH
-PA
Author M
anuscriptN
IH-P
A A
uthor Manuscript
NIH
-PA
Author M
anuscript
selection of studies across the 20 year study period and believe that the quality of data was
consistent for included studies.
Stroke diagnosis is unlikely to have changed between 1990 and 2010 because most
diagnoses have been based on clinical (WHO) criteria and, when imaging was available, for
verification of pathological subtypes on CT images. The consistency of our estimates of
stroke incidence, prevalence, and mortality-to-incidence ratios in both low-income and
middle-income and high-income countries with those reported in two previous systematic
reviews based on methodologically more rigorous ideal population-based studies of stroke
incidence and prevalence3,46 corroborates our findings. Another limitation is that GBD
stroke estimates are based on clinical stroke cases and used the Rankin Scale to index
disability weights. There fore, we probably underestimated the burden of stroke by not
including so-called silent strokes and vascular dementia in the case definition nor the effect
of accelerated long-term cognitive functional decline in our estimation of disability.
Although we cannot exclude the possibility of errors in calculations of stroke disability
weights, the high correlation of the weights across settings suggests that a broadly shared set
of common values exists for health losses due to stroke, thus increasing our confidence in
the reliability of our calculations of disability weights.
New well-designed, comparable, community-based stroke epidemiology and surveillance
studies are greatly needed.3,19,47 Not only will findings from these studies improve our
understanding of stroke determinants and burden worldwide, and establish causes of
disparities and changes in trends in stroke burden between countries of different income
levels, but they will also help with the development and monitoring of the effectiveness of
stroke prevention and management and rehabilitation strategies in different countries and
populations. These strategies should be culturally acceptable, affordable, and aimed at both
high-risk individuals and the global population, wwith the priority placed on population-
based preventive strategies45 to reduce blood pressure and promote smoking cessation.47–49
In view of the increasing prevalence of stroke and DALYs lost because of stroke, and the
already overstretched health resources worldwide, health-care services need to pay more
attention to provision of stroke chronic care (including prevention of secondary stroke)50
and should incorporate community rehabilitation, including self-managed rehabilitation
strategies.
Acknowledgments
This work was undertaken as a part of the Global Burden of Diseases, Injuries, and Risk Factors 2010 (GBD 2010)Study. The results in this paper are prepared independently of the final estimates of the GBD 2010 study. We thankSarah Safranek (University of Washington Health Sciences Library) for her help in developing the systematicreview literature search strategies; Michael F MacIntyre, Brittany Wurtz, and Summer Ohno (University ofWashington Institute for Health Metrics and Evaluation) for research coordination; Ryan M Barber (University ofWashington Institute for Health Metrics and Evaluation) for creating figures and tables for the paper; HannahGardener (University of Miami) for helping reviewing some studies; and Helen McDonald (National Institute forStroke And Applied Neurosciences, Aukland University of Technology) for organising teleconferences andsecretarial support. The authors alone are responsible for the views expressed in this publication.
Feigin et al. Page 12
Lancet. Author manuscript; available in PMC 2014 October 01.
NIH
-PA
Author M
anuscriptN
IH-P
A A
uthor Manuscript
NIH
-PA
Author M
anuscript
Global Burden of Disease Stroke Expert Group members
Laurie Anderson (USA), Suzanne Barker-Collo (New Zealand), Derrick Bennett (UK),
Myles Connor (South Africa), Majiid Ezzati (UK), Valery L Feigin (Chairman; New
Zealand), Mohammed Forouzanfar (USA), Rita Krishnamurthi (New Zealand), Carlene
Lawes (New Zealand), George Mensah (USA), Andrew E Moran (USA), Martin O’Donnell
(Ireland), Jeyaraj Durai Pandian (India), Varsha Parag (New Zealand), Ralph Sacco (USA),
Yukito Shinohara (Japan), Thomas Truelsen (Denmark), Narayanaswamy
Venketasubramanian (Singapore), Emma Witt (New Zealand), Wenzhi Wang (China).
References
1. Lozano R, Naghavi M, Foreman K, et al. Global and regional mortality from 235 causes of death for20 age groups in 1990 and 2010: a systematic analysis for the Global Burden of Disease Study2010. Lancet. 2012; 380:2095–2128. [PubMed: 23245604]
2. Murray CJL, Vos T, Lozano R, et al. Disability-adjusted life-years (DALYs) for 291 diseases andinjuries in 21 regions, 1990–2010: a systematic analysis for the Global Burden of Disease Study2010. Lancet. 2012; 380:2197–2223. [PubMed: 23245608]
3. Feigin VL, Lawes CM, Bennett DA, Barker-Collo SL, Parag V. Worldwide stroke incidence andearly case fatality reported in 56 population-based studies: a systematic review. Lancet Neurol.2009; 8:355–369. [PubMed: 19233729]
4. Murray CJL, Ezzati M, Flaxman AD, et al. GBD 2010: design, definitions, and metrics. Lancet.2012; 380:2063–2066. [PubMed: 23245602]
5. Bennett DA, Anderson LM, Nair N, et al. Methodology of the global and regional burden of strokestudy. Neuroepidemiology. 2012; 38:30–40. [PubMed: 22212892]
6. Aho K, Harmsen P, Hatano S, Marquardsen J, Smirnov VE, Strasser T. Cerebrovascular disease inthe community: results of a WHO collaborative study. Bull World Health Organ. 1980; 58:113–130.[PubMed: 6966542]
7. Feigin V, Hoorn SV. How to study stroke incidence. Lancet. 2004; 363:1920. [PubMed: 15194247]
8. Wang H, Dwyer-Lindgren L, Lofgren KT, et al. Age-specific and sex-specific mortality in 187countries, 1970–2010: a systematic analysis for the Global Burden of Disease Study 2010. Lancet.2012; 380:2071–2094. [PubMed: 23245603]
9. Foreman K, Lozano R, Lopez A, Murray C. Modeling causes of death: an integrated approach usingCODEm. Popul Health Metr. 2012; 10:1. [PubMed: 22226226]
10. Vos T, Flaxman AD, Naghavi M, et al. Years lived with disability (YLDs) for 1160 sequelae of289 diseases and injuries 1990–2010: a systematic analysis for the Global Burden of DiseaseStudy 2010. Lancet. 2012; 380:2163–2196. [PubMed: 23245607]
11. Salomon JA, Vos T, Hogan DR, et al. Common values in assessing health outcomes from diseaseand injury: disability weights measurement study for the Global Burden of Disease Study 2010.Lancet. 2012; 380:2129–2143. [PubMed: 23245605]
12. Salomon JA, Wang H, Freeman MK, et al. Healthy life expectancy for 187 countries, 1990–2010:a systematic analysis for the Global Burden Disease Study 2010. Lancet. 2012; 380:2144–2162.[PubMed: 23245606]
13. Rankin J. Cerebral vascular accidents in patients over the age of 60: II. Prognosis. Scott Med J.1957; 2:200–213. [PubMed: 13432835]
14. Bonita R, Beaglehole R. Recovery of motor function after stroke. Stroke. 1988; 19:1497–1500.[PubMed: 3201508]
15. Herman B, Leyten AC, van Luijk JH, Frenken CW, Op de Coul AA, Schulte BP. Epidemiology ofstroke in Tilburg, the Netherlands. the population-based stroke incidence register: 2. Incidence,initial clinical picture and medical care, and three-week case fatality. Stroke. 1982; 13:629–634.[PubMed: 7123595]
Feigin et al. Page 13
Lancet. Author manuscript; available in PMC 2014 October 01.
NIH
-PA
Author M
anuscriptN
IH-P
A A
uthor Manuscript
NIH
-PA
Author M
anuscript
16. Alzamora MT, Sorribes M, Heras A, et al. Ischemic stroke incidence in Santa Coloma deGramenet (ISISCOG), Spain. A community-based study. BMC Neurology. 2008; 8:5. [PubMed:18371212]
17. Thrift AG, Dewey HM, Macdonell RA, McNeil JJ, Donnan GA. Stroke incidence on the east coastof Australia: the North East Melbourne Stroke Incidence Study (NEMESIS). Stroke. 2000;31:2087–2092. [PubMed: 10978034]
18. Ahmad, OB.; Boschi-Pinto, C.; Lopez, AD.; Murray, CJL.; Lozano, R.; Inoue, M. Agestandardization of rates: a new WHO standard. Luxembourg: World Health Organization; 2013.
19. Johnston SC, Mendis S, Mathers CD. Global variation in stroke burden and mortality: estimatesfrom monitoring, surveillance, and modelling. Lancet Neurol. 2009; 8:345–354. [PubMed:19233730]
20. WHO. WHO report on the global tobacco epidemic. Luxembourg: World Health Organization;2013.
21. Lim SS, Vos T, Flaxman AD, et al. A comparative risk assessment of burden of disease and injuryattributable to 67 risk factors and risk factor clusters in 21 regions, 1990–2010: a systematicanalysis for the Global Burden of Disease Study 2010. Lancet. 2012; 380:2224–2260. [PubMed:23245609]
22. Putaala J, Yesilot N, Waje-Andreassen U, et al. Demographic and geographic vascular risk factordifferences in European young adults with ischemic stroke: the 15 Cities Young Stroke study.Stroke. 2012; 43:2624–2630. [PubMed: 22798330]
23. O’Donnell MJ, Xavier D, Liu L, et al. Risk factors for ischaemic and intracerebral haemorrhagicstroke in 22 countries (the INTERSTROKE study): a case-control study. Lancet. 2010; 376:112–123. [PubMed: 20561675]
24. WHO. Global Atlas on Cardiovascular disease prevention and control. Geneva: World HealthOrganization; 2011.
25. Vaartjes I, O’Flaherty M, Capewell S, Kappelle J, Bots M. Remarkable decline in ischemic strokemortality is not matched by changes in incidence. Stroke. 2013; 44:591–597. [PubMed: 23212165]
26. Gillum RF, Kwagyan J, Obisesan TO. Ethnic and geographic variation in stroke mortality trends.Stroke. 2011; 42:3294–3296. [PubMed: 21940976]
27. Kunst AE, Amiri M, Janssen F. The decline in stroke mortality: exploration of future trends in 7western European countries. Stroke. 2011; 42:2126–2130. [PubMed: 21700943]
28. Redon J, Olsen MH, Cooper RS, et al. Stroke mortality and trends from 1990 to 2006 in 39countries from Europe and Central Asia: implications for control of high blood pressure. Eur HeartJ. 2011; 32:1424–1431. [PubMed: 21487117]
29. André C, Curioni CC, Braga da Cunha C, Veras R. Progressive decline in stroke mortality in Brazilfrom 1980 to 1982, 1990 to 1992, and 2000 to 2002. Stroke. 2006; 37:2784–2789. [PubMed:17008629]
30. Stringhini S, Sinon F, Didon J, Gedeon J, Paccaud F, Bovet P. Declining stroke and myocardialinfarction mortality between 1989 and 2010 in a country of the African region. Stroke. 2012;43:2283–2288. [PubMed: 22700529]
31. Truelsen T, Mahonen M, Tolonen H, et al. Trends in stroke and coronary heart disease in the WHOMONICA Project. Stroke. 2003; 34:1346–1352. [PubMed: 12738889]
32. Sarti C, Rastenyte D, Cepaitis Z, Tuomilehto J. International trends in mortality from stroke, 1968to 1994. Stroke. 2000; 31:1588–1601. [PubMed: 10884459]
33. Sarti C, Stegmayr B, Tolonen H, Mahonen M, Tuomilehto J, Asplund K. Are changes in mortalityfrom stroke caused by changes in stroke event rates or case fatality? Results from the WHOMONICA Project. Stroke. 2003; 34:1833–1840. [PubMed: 12855832]
34. Norrving B, Kissela B. The global burden of stroke and need for a continuum of care. Neurology.2013; 80(suppl):S5–S12. [PubMed: 23319486]
35. Cairncross F. Economics: age, health and wealth. Nature. 2007; 448:875–876. [PubMed:17713520]
36. Kissela BM, Khoury JC, Alwell K, et al. Age at stroke: temporal trends in stroke incidence in alarge, biracial population. Neurology. 2012; 79:1781–1787. [PubMed: 23054237]
Feigin et al. Page 14
Lancet. Author manuscript; available in PMC 2014 October 01.
NIH
-PA
Author M
anuscriptN
IH-P
A A
uthor Manuscript
NIH
-PA
Author M
anuscript
37. Medin J, Nordlund A, Ekberg K. Increasing stroke incidence in Sweden between 1989 and 2000among persons aged 30 to 65 years: evidence from the Swedish Hospital Discharge Register.Stroke. 2004; 35:1047–1051. [PubMed: 15073400]
38. Danaei G, Finucane MM, Lu Y, et al. National, regional, and global trends in fasting plasmaglucose and diabetes prevalence since 1980: systematic analysis of health examination surveys andepidemiological studies with 370 country-years and 2·7 million participants. Lancet. 2011;378:31–40. [PubMed: 21705069]
39. The Lancet. Challenging age—old ideas about stroke. Lancet Neurol. 2012; 79:1013.
40. de los Rios F, Kleindorfer DO, Khoury J, et al. Trends in substance abuse preceding stroke amongyoung adults: a population-based study. Stroke. 2012; 43:3179–3183. [PubMed: 23160887]
41. Danaei G, Finucane MM, Lin JK, et al. National, regional, and global trends in systolic bloodpressure since 1980: systematic analysis of health examination surveys and epidemiologicalstudies with 786 country-years and 5·4 million participants. Lancet. 2011; 377:568–577. [PubMed:21295844]
42. Farzadfar F, Finucane MM, Danaei G, et al. National, regional, and global trends in serum totalcholesterol since 1980: systematic analysis of health examination surveys and epidemiologicalstudies with 321 country-years and 3·0 million participants. Lancet. 2011; 377:578–586. [PubMed:21295847]
43. Finucane MM, Stevens GA, Cowan MJ, et al. National, regional, and global trends in body-massindex since 1980: systematic analysis of health examination surveys and epidemiological studieswith 960 country-years and 9·1 million participants. Lancet. 2011; 377:557–567. [PubMed:21295846]
44. The Lancet. An epidemic of risk factors for cardiovascular disease. Lancet. 2011; 377:527.[PubMed: 21315931]
45. Anand SS, Yusuf S. Stemming the global tsunami of cardiovascular disease. Lancet. 2011;377:529–532. [PubMed: 21295845]
46. Feigin VL, Lawes CMM, Bennett DA, Anderson CS. Stroke epidemiology: a review ofpopulation-based studies of incidence, prevalence, and case-fatality in the late 20th century.Lancet Neurol. 2003; 2:43–53. [PubMed: 12849300]
47. Sidney S, Rosamond WD, Howard VJ, Luepker RV. The “Heart Disease and StrokeStatistics-2013 Update” and the need for a national cardiovascular surveillance system.Circulation. 2013; 127:21–23. [PubMed: 23239838]
48. Feigin VL, Krishnamurthi R. Stroke prevention in the developing world. Stroke. 2011; 42:3655–3658. [PubMed: 22052509]
49. Strong K, Mathers C, Bonita R. Preventing stroke: saving lives around the world. Lancet Neurol.2007; 6:182–187. [PubMed: 17239805]
50. Yusuf S, Islam S, Chow CK, et al. Use of secondary prevention drugs for cardiovascular disease inthe community in high-income, middle-income, and low-income countries (the PURE Study): aprospective epidemiological survey. Lancet. 2011; 378:1231–1243. [PubMed: 21872920]
Feigin et al. Page 15
Lancet. Author manuscript; available in PMC 2014 October 01.
NIH
-PA
Author M
anuscriptN
IH-P
A A
uthor Manuscript
NIH
-PA
Author M
anuscript
Panel: Research in context
Systematic review
We searched Medline, Embase, LILACS, Scopus, PubMed, Science Direct, Global
Health Database, the WHO library, and WHO regional databases between 1990 and 2012
to identify studies published between 1990 and 2010. To be included in this systematic
review, studies of stroke incidence or prevalence had to meet several core requirements.
First, stroke should have been defined according to the standard WHO clinical criteria as
“a rapidly developed sign of focal (or global) disturbance of cerebral function lasting
longer than 24 hours (unless interrupted by death), with no apparent nonvascular cause.”
Incidence and mortality studies from developed countries should have had a complete
stroke case ascertainment (hospitalised and non-hospitalised, fatal and non-fatal) using
various overlapping sources of information as specified for ideal population-based
studies. We allowed less rigorous case ascertainment only for studies from low-income
and middle-income countries in which no other relevant data were available otherwise.
Second, the study should have distinguished between first-ever stroke and recurrent
stroke (only first-ever-in-a-lifetime events were included in the systematic analysis).
Third, the study should have reported on an age-specific epidemiologic parameter of
interest (ie, stroke incidence, prevalence, mortality, or denominator) sufficient to estimate
age-adjusted stroke incidence, mortality, or prevalence.
Interpretation
This study is the first to report the global burden of stroke in terms of incidence,
prevalence, mortality, DALYs lost, and mortality-to-incidence ratios across GBD regions
and all countries in 1990, 2005, and 2010, and for all age groups of the population. Our
findings show that although stroke mortality rates and mortality-to-incidence ratios have
decreased in the past two decades, the global burden of stroke in terms of the absolute
number of people affected every year, stroke survivors, related deaths, and DALYs lost
are great and increasing, with most the burden in low-income and middle-income
countries. If these trends in stroke incidence, mortality, and DALYs continue, by 2030
there will be almost 12 million stroke deaths, 70 million stroke survivors, and more than
200 million DALYs lost globally. New well-designed, comparable, community-based
stroke epidemiology and surveillance studies are needed to improve our understanding of
stroke determinants and burden worldwide, and to establish causes of disparities and
changes in trends in stroke burden between countries of different income levels. Findings
from these studies will also help with the development and monitoring of the
effectiveness of stroke prevention and management and rehabilitation strategies in
different countries and populations.
Feigin et al. Page 16
Lancet. Author manuscript; available in PMC 2014 October 01.
NIH
-PA
Author M
anuscriptN
IH-P
A A
uthor Manuscript
NIH
-PA
Author M
anuscript
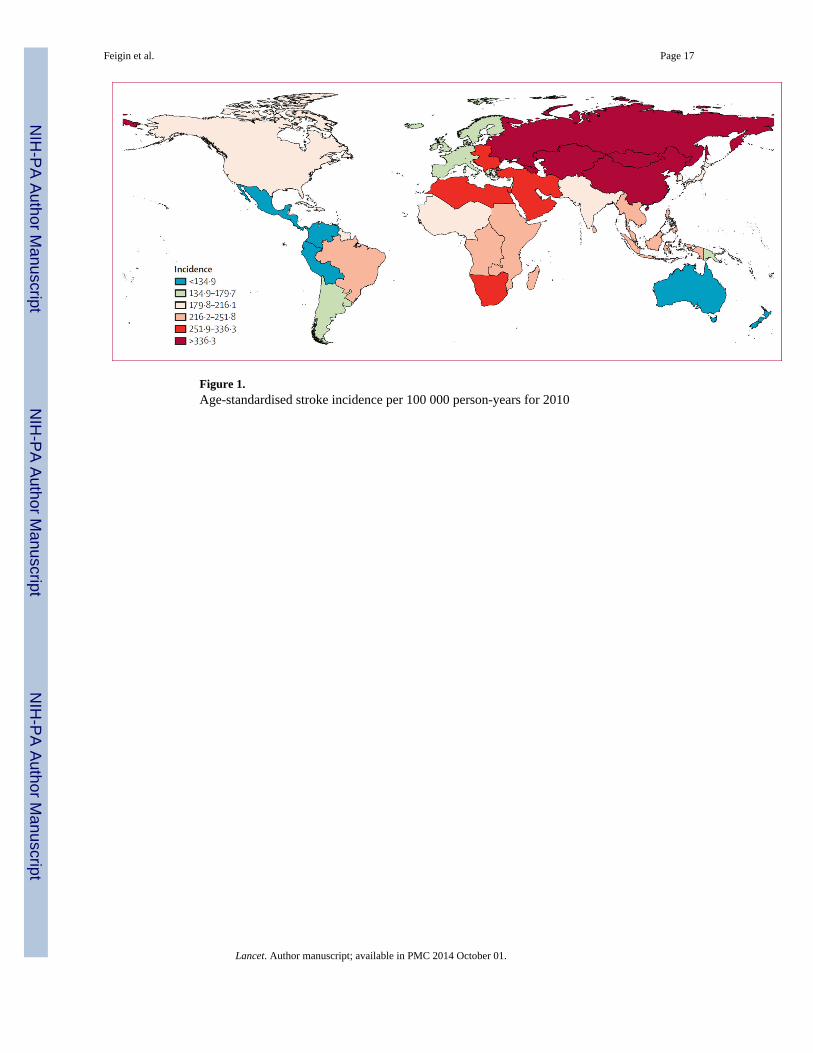
Figure 1.Age-standardised stroke incidence per 100 000 person-years for 2010
Feigin et al. Page 17
Lancet. Author manuscript; available in PMC 2014 October 01.
NIH
-PA
Author M
anuscriptN
IH-P
A A
uthor Manuscript
NIH
-PA
Author M
anuscript
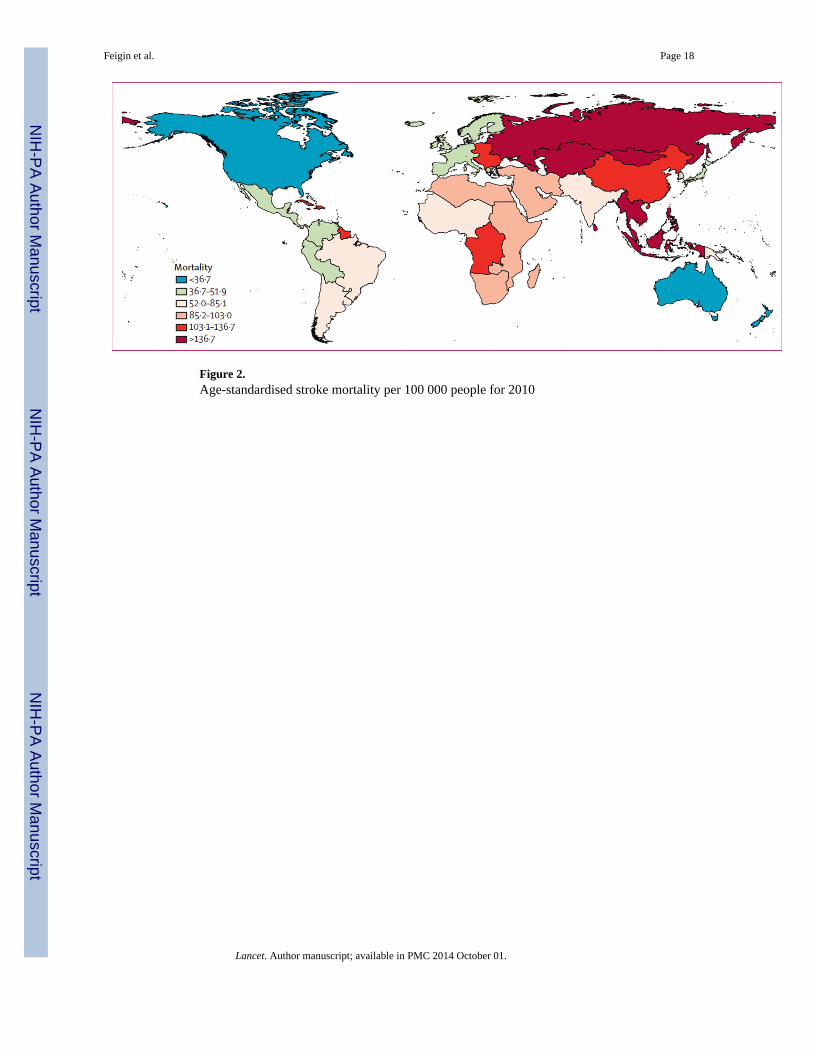
Figure 2.Age-standardised stroke mortality per 100 000 people for 2010
Feigin et al. Page 18
Lancet. Author manuscript; available in PMC 2014 October 01.
NIH
-PA
Author M
anuscriptN
IH-P
A A
uthor Manuscript
NIH
-PA
Author M
anuscript
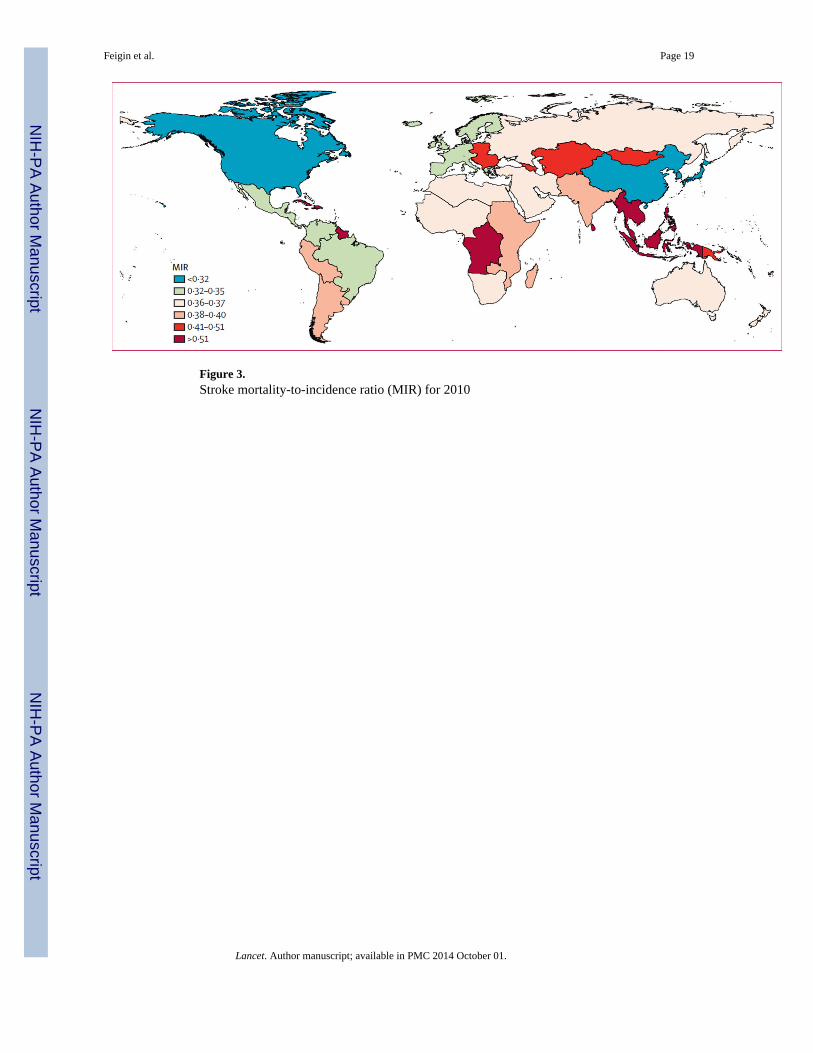
Figure 3.Stroke mortality-to-incidence ratio (MIR) for 2010
Feigin et al. Page 19
Lancet. Author manuscript; available in PMC 2014 October 01.
NIH
-PA
Author M
anuscriptN
IH-P
A A
uthor Manuscript
NIH
-PA
Author M
anuscript
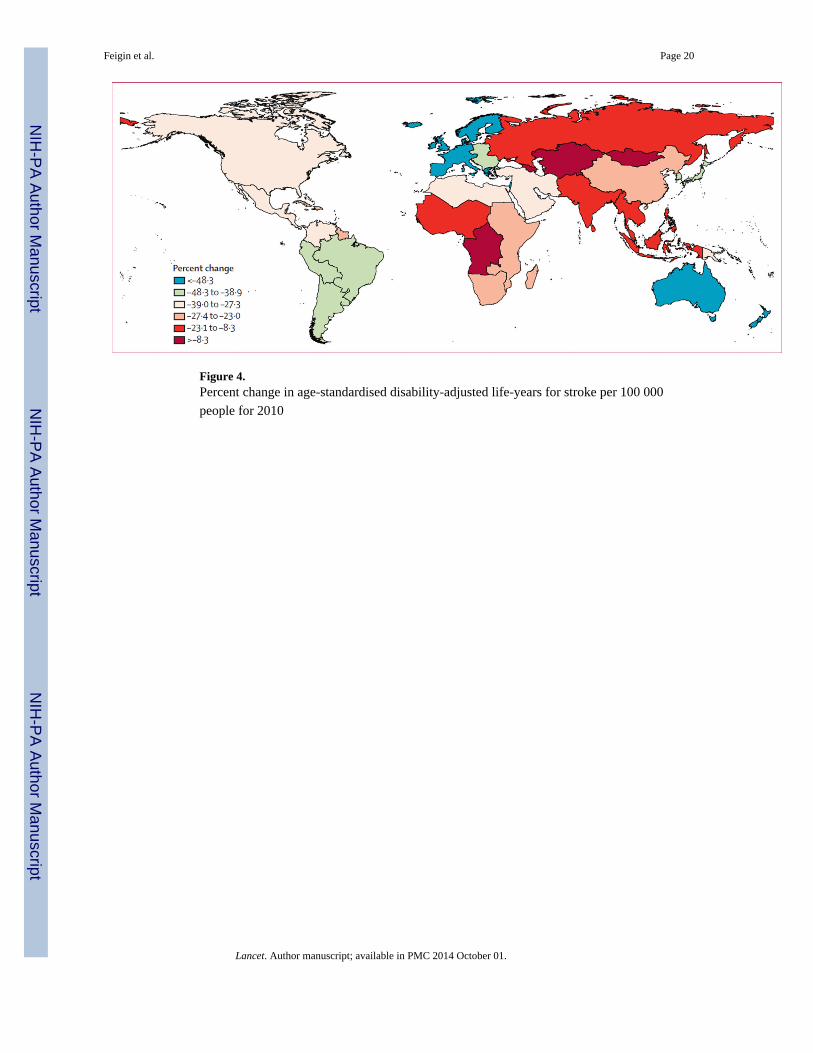
Figure 4.Percent change in age-standardised disability-adjusted life-years for stroke per 100 000
people for 2010
Feigin et al. Page 20
Lancet. Author manuscript; available in PMC 2014 October 01.
NIH
-PA
Author M
anuscriptN
IH-P
A A
uthor Manuscript
NIH
-PA
Author M
anuscript
NIH
-PA
Author M
anuscriptN
IH-P
A A
uthor Manuscript
NIH
-PA
Author M
anuscript
Feigin et al. Page 21
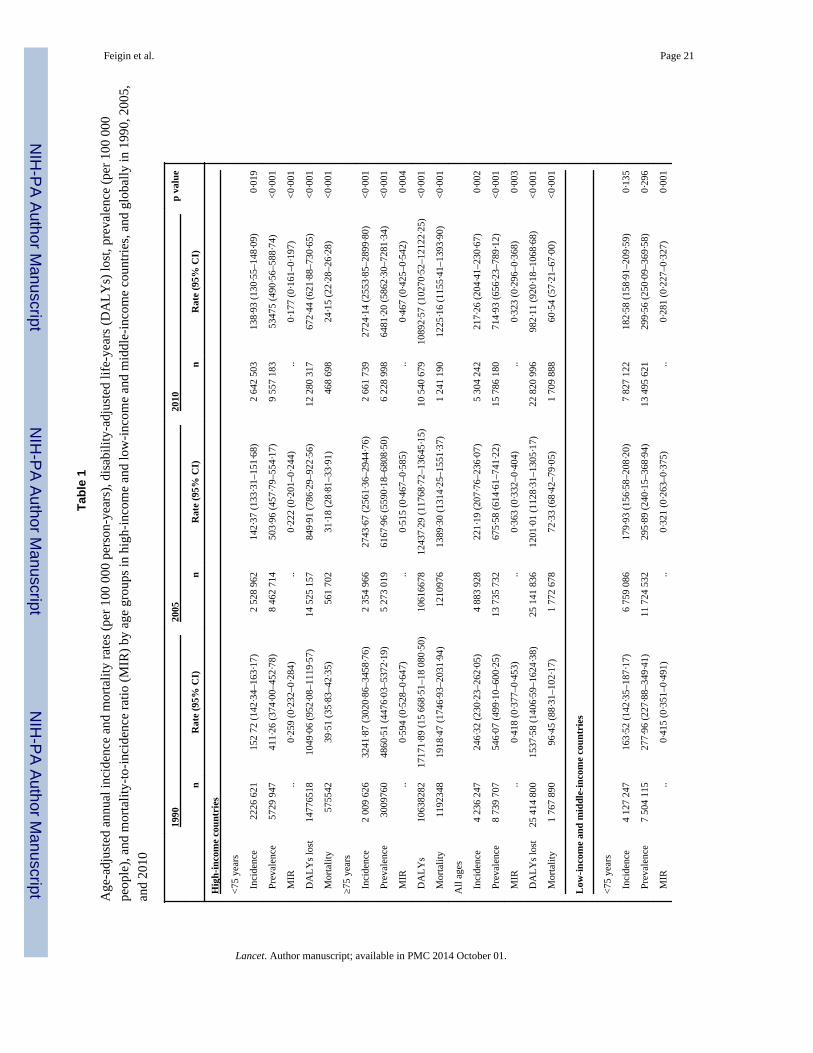
Tab
le 1
Age
-adj
uste
d an
nual
inci
denc
e an
d m
orta
lity
rate
s (p
er 1
00 0
00 p
erso
n-ye
ars)
, dis
abili
ty-a
djus
ted
life-
year
s (D
AL
Ys)
lost
, pre
vale
nce
(per
100
000
peop
le),
and
mor
talit
y-to
-inc
iden
ce r
atio
(M
IR)
by a
ge g
roup
s in
hig
h-in
com
e an
d lo
w-i
ncom
e an
d m
iddl
e-in
com
e co
untr
ies,
and
glo
bally
in 1
990,
200
5,
and
2010
1990
2005
2010
p va
lue
nR
ate
(95%
CI)
nR
ate
(95%
CI)
nR
ate
(95%
CI)
Hig
h-in
com
e co
untr
ies
<75
yea
rs
Inc
iden
ce22
26 6
2115
2 72
(14
2·34
–163
·17)
2 52
8 96
214
2·37
(13
3·31
–151
·68)
2 64
2 50
313
8·93
(13
0·55
–148
·09)
0·01
9
Pre
vale
nce
5729
947
411·
26 (
374·
00–4
52·7
8)8
462
714
503·
96 (
457·
79–5
54·1
7)9
557
183
5347
5 (4
90·5
6–58
8·74
)<
0·00
1
MIR
..0·
259
(0·2
32–0
·284
)..
0·22
2 (0
·201
–0·2
44)
..0·
177
(0·1
61–0
·197
)<
0·00
1
DA
LY
s lo
st14
7765
1810
49·0
6 (9
52·0
8–11
19·5
7)14
525
157
849·
91 (
786·
29–9
22·5
6)12
280
317
672·
44 (
621·
88–7
30·6
5)<
0·00
1
Mor
talit
y57
5542
39·5
1 (3
5·83
–42·
35)
561
702
31·1
8 (2
8·81
–33·
91)
468
698
24·1
5 (2
2·28
–26·
28)
<0·
001
≥75
year
s
Inc
iden
ce2
009
626
3241
·87
(302
0·86
–345
8·76
)2
354
966
2743
·67
(256
1·36
–294
4·76
)2
661
739
2724
·14
(255
3·85
–289
9·80
)<
0·00
1
Pre
vale
nce
3009
760
4860
·51
(447
6·03
–537
2·19
)5
273
019
6167
·96
(559
0·18
–680
8·50
)6
228
998
6481
·20
(586
2·30
–728
1·34
)<
0·00
1
MIR
..0·
594
(0·5
28–0
·647
)..
0·51
5 (0
·467
–0·5
85)
..0·
467
(0·4
25–0
·542
)0·
004
DA
LY
s10
6382
8217
171·
89 (
15 6
68·5
1–18
080
·50)
1061
6678
1243
7·29
(11
768·
72–1
3645
·15)
10 5
40 6
7910
892·
57 (
1027
0·52
–121
22·2
5)<
0·00
1
Mor
talit
y11
9234
819
18·4
7 (1
746·
93–2
031·
94)
1210
976
1389
·30
(131
4·25
–155
1·37
)1
241
190
1225
·16
(115
5·41
–139
3·90
)<
0·00
1
All
ages
Inc
iden
ce4
236
247
246·
32 (
230·
23–2
62·0
5)4
883
928
221·
19 (
207·
76–2
36·0
7)5
304
242
217·
26 (
204·
41–2
30·6
7)0·
002
Pre
vale
nce
8 73
9 70
754
6·07
(49
9·10
–600
·25)
13 7
35 7
3267
5·58
(61
4·61
–741
·22)
15 7
86 1
8071
4·93
(65
6·23
–789
·12)
<0·
001
MIR
..0·
418
(0·3
77–0
·453
)..
0·36
3 (0
·332
–0·4
04)
..0·
323
(0·2
96–0
·368
)0·
003
DA
LY
s lo
st25
414
800
1537
·58
(140
6·59
–162
4·38
)25
141
836
1201
·01
(112
8·31
–130
5·17
)22
820
996
982·
11 (
920·
18–1
068·
68)
<0·
001
Mor
talit
y1
767
890
96·4
5 (8
8·31
–102
·17)
1 77
2 67
872
·33
(68·
42–7
9·05
)1
709
888
60·5
4 (5
7·21
–67·
00)
<0·
001
Low
-inc
ome
and
mid
dle-
inco
me
coun
trie
s
<75
yea
rs
Inc
iden
ce4
127
247
163·
52 (
142·
35–1
87·1
7)6
759
086
179·
93 (
156·
58–2
08·2
0)7
827
122
182·
58 (
158·
91–2
09·5
9)0·
135
Pre
vale
nce
7 50
4 11
527
7·96
(22
7·88
–349
·41)
11 7
24 5
3229
5·89
(24
0·15
–368
·94)
13 4
95 6
2129
9·56
(25
0·09
–369
·58)
0·29
6
MIR
..0·
415
(0·3
51–0
·491
)..
0·32
1 (0
·263
–0·3
75)
..0·
281
(0·2
27–0
·327
)0·
001
Lancet. Author manuscript; available in PMC 2014 October 01.
NIH
-PA
Author M
anuscriptN
IH-P
A A
uthor Manuscript
NIH
-PA
Author M
anuscript
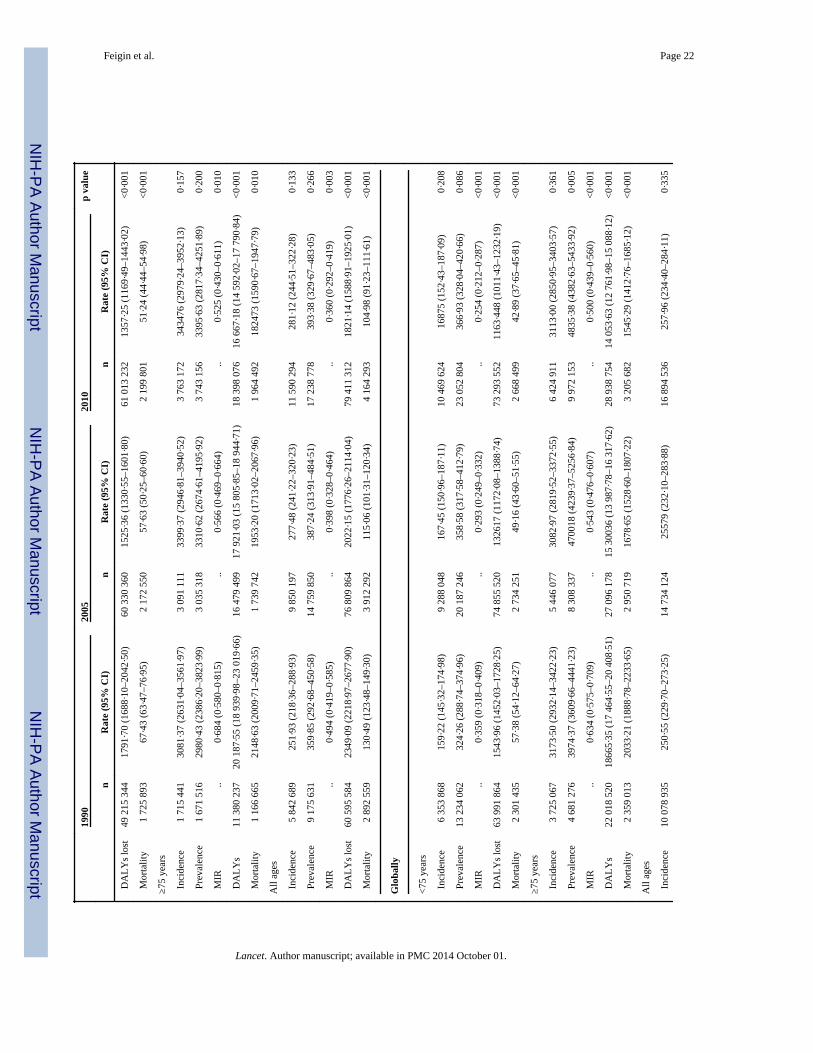
Feigin et al. Page 22
1990
2005
2010
p va
lue
nR
ate
(95%
CI)
nR
ate
(95%
CI)
nR
ate
(95%
CI)
DA
LY
s lo
st49
215
344
1791
·70
(168
8·10
–204
2·50
)60
330
360
1525
·36
(133
0·55
–160
1·80
)61
013
232
1357
·25
(116
9·49
–144
3·02
)<
0·00
1
Mor
talit
y1
725
893
67·4
3 (6
3·47
–76·
95)
2 17
2 55
057
·63
(50·
25–6
0·60
)2
199
801
51·2
4 (4
4·44
–54·
98)
<0·
001
≥75
year
s
Inc
iden
ce1
715
441
3081
·37
(263
1·04
–356
1·97
)3
091
111
3399
·37
(294
6·81
–394
0·52
)3
763
172
3434
76 (
2979
·24–
3952
·13)
0·15
7
Pre
vale
nce
1 67
1 51
629
80·4
3 (2
386·
20–3
823·
99)
3 03
5 31
833
10·6
2 (2
674·
61–4
195·
92)
3 74
3 15
633
95·6
3 (2
817·
34–4
251·
89)
0·20
0
MIR
..0·
684
(0·5
80–0
·815
)..
0·56
6 (0
·469
–0·6
64)
..0·
525
(0·4
30–0
·611
)0·
010
DA
LY
s11
380
237
20 1
87·5
5 (1
8 93
9·98
–23
019·
66)
16 4
79 4
9917
921
·03
(15
805·
85–1
8 94
4·71
)18
398
076
16 6
67·1
8 (1
4 59
2·02
–17
790·
84)
<0·
001
Mor
talit
y1
166
665
2148
·63
(200
9·71
–245
9·35
)1
739
742
1953
·20
(171
3·02
–206
7·96
)1
964
492
1824
73 (
1590
·67–
1947
·79)
0·01
0
All
ages
Inc
iden
ce5
842
689
251·
93 (
218·
36–2
88·9
3)9
850
197
277·
48 (
241·
22–3
20·2
3)11
590
294
281·
12 (
244·
51–3
22·2
8)0·
133
Pre
vale
nce
9 17
5 63
135
9·85
(29
2·68
–450
·58)
14 7
59 8
5038
7·24
(31
3·91
–484
·51)
17 2
38 7
7839
3·38
(32
9·67
–483
·05)
0·26
6
MIR
..0·
494
(0·4
19–0
·585
)..
0·39
8 (0
·328
–0·4
64)
..0·
360
(0·2
92–0
·419
)0·
003
DA
LY
s lo
st60
595
584
2349
·09
(221
8·97
–267
7·90
)76
809
864
2022
·15
(177
6·26
–211
4·04
)79
411
312
1821
·14
(158
8·91
–192
5·01
)<
0·00
1
Mor
talit
y2
892
559
130·
49 (
123·
48–1
49·3
0)3
912
292
115·
06 (
101·
31–1
20·3
4)4
164
293
104·
98 (
91·2
3–11
1·61
)<
0·00
1
Glo
bally
<75
yea
rs
Inc
iden
ce6
353
868
159·
22 (
145·
32–1
74·9
8)9
288
048
167·
45 (
150·
96–1
87·1
1)10
469
624
1687
5 (1
52·4
3–18
7·09
)0·
208
Pre
vale
nce
13 2
34 0
6232
4·26
(28
8·74
–374
·96)
20 1
87 2
4635
8·58
(31
7·58
–412
·79)
23 0
52 8
0436
6·93
(32
8·04
–420
·66)
0·08
6
MIR
..0·
359
(0·3
18–0
·409
)..
0·29
3 (0
·249
–0·3
32)
..0·
254
(0·2
12–0
·287
)<
0·00
1
DA
LY
s lo
st63
991
864
1543
·96
(145
2·03
–172
8·25
)74
855
520
1326
17 (
1172
·08–
1388
·74)
73 2
93 5
5211
63·4
48 (
1011
·43–
1232
·19)
<0·
001
Mor
talit
y2
301
435
57·3
8 (5
4·12
–64·
27)
2 73
4 25
149
·16
(43·
60–5
1·55
)2
668
499
42·8
9 (3
7·65
–45·
81)
<0·
001
≥75
year
s
Inc
iden
ce3
725
067
3173
·50
(293
2·14
–342
2·23
)5
446
077
3082
·97
(281
9·52
–337
2·55
)6
424
911
3113
·00
(285
0·95
–340
3·57
)0·
361
Pre
vale
nce
4 68
1 27
639
74·3
7 (3
609·
66–4
441·
23)
8 30
8 33
747
0018
(42
39·3
7–52
56·8
4)9
972
153
4835
·38
(438
2·63
–543
3·92
)0·
005
MIR
..0·
634
(0·5
75–0
·709
)..
0·54
3 (0
·476
–0·6
07)
..0·
500
(0·4
39–0
·560
)<
0·00
1
DA
LY
s22
018
520
1866
5·35
(17
464
·55–
20 4
08·5
1)27
096
178
15 3
0036
(13
987
·78–
16 3
17·6
2)28
938
754
14 0
53·6
3 (1
2 76
1·98
–15
088·
12)
<0·
001
Mor
talit
y2
359
013
2033
·21
(188
8·78
–223
3·65
)2
950
719
1678
·65
(152
8·60
–180
7·22
)3
205
682
1545
·29
(141
2·76
–168
5·12
)<
0·00
1
All
ages
Inc
iden
ce10
078
935
250·
55 (
229·
70–2
73·2
5)14
734
124
2557
9 (2
32·1
0–28
3·88
)16
894
536
257·
96 (
234·
40–2
84·1
1)0·
335
Lancet. Author manuscript; available in PMC 2014 October 01.
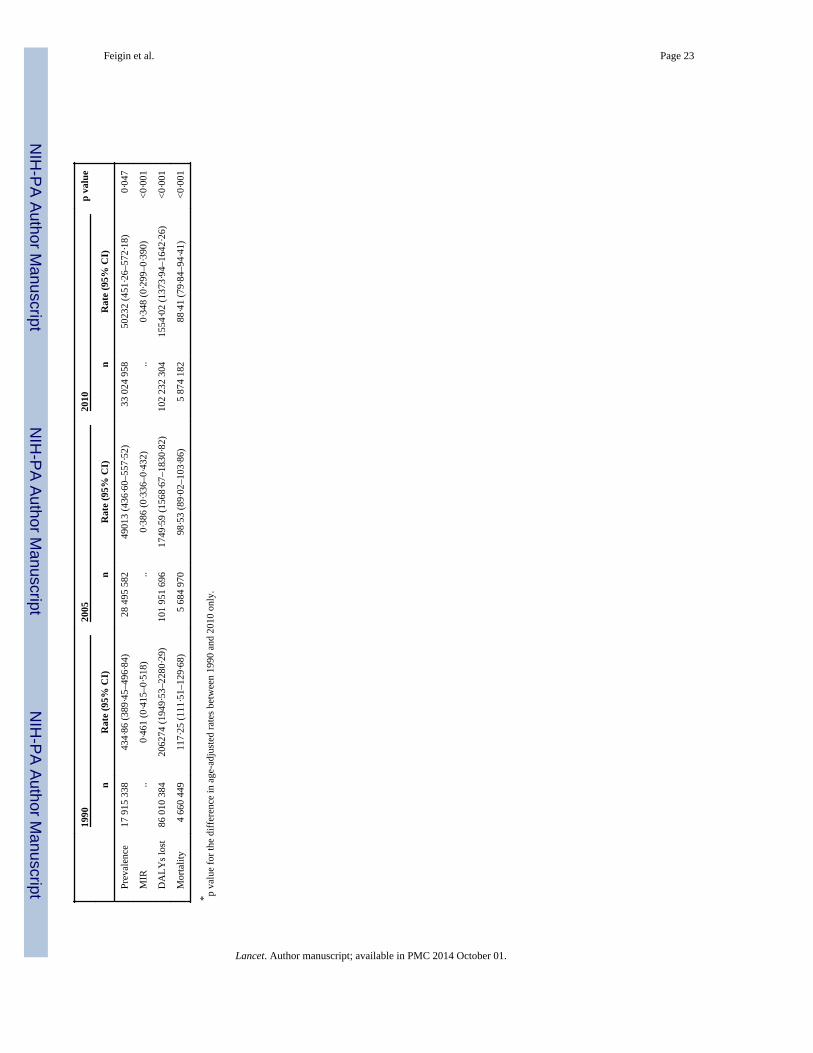
NIH
-PA
Author M
anuscriptN
IH-P
A A
uthor Manuscript
NIH
-PA
Author M
anuscript
Feigin et al. Page 23
1990
2005
2010
p va
lue
nR
ate
(95%
CI)
nR
ate
(95%
CI)
nR
ate
(95%
CI)
Pre
vale
nce
17 9
15 3
3843
4·86
(38
9·45
–496
·84)
28 4
95 5
8249
013
(436
·60–
557·
52)
33 0
24 9
5850
232
(451
·26–
572·
18)
0·04
7
MIR
..0·
461
(0·4
15–0
·518
)..
0·38
6 (0
·336
–0·4
32)
..0·
348
(0·2
99–0
·390
)<
0·00
1
DA
LY
s lo
st86
010
384
2062
74 (
1949
·53–
2280
·29)
101
951
696
1749
·59
(156
8·67
–183
0·82
)10
2 23
2 30
415
54·0
2 (1
373·
94–1
642·
26)
<0·
001
Mor
talit
y4
660
449
117·
25 (
111·
51–1
29·6
8)5
684
970
98·5
3 (8
9·02
–103
·86)
5 87
4 18
288
·41
(79·
84–9
4·41
)<
0·00
1
* p va
lue
for
the
diff
eren
ce in
age
-adj
uste
d ra
tes
betw
een
1990
and
201
0 on
ly.
Lancet. Author manuscript; available in PMC 2014 October 01.
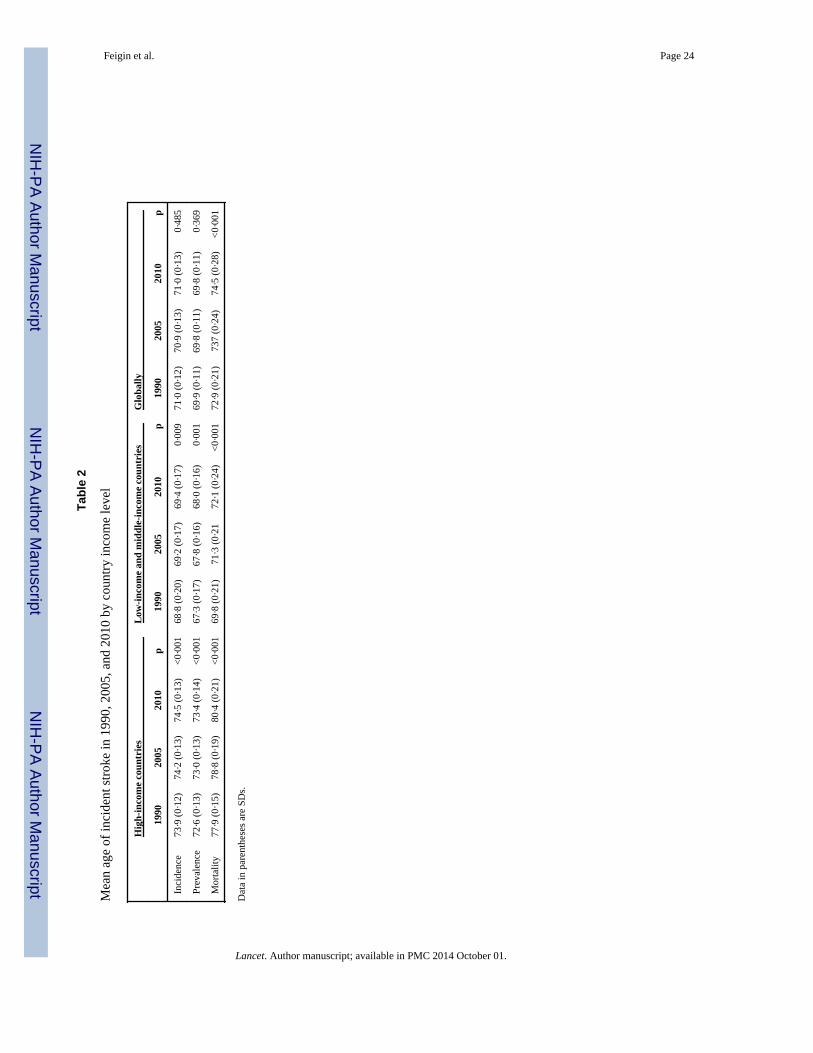
NIH
-PA
Author M
anuscriptN
IH-P
A A
uthor Manuscript
NIH
-PA
Author M
anuscript
Feigin et al. Page 24
Tab
le 2
Mea
n ag
e of
inci
dent
str
oke
in 1
990,
200
5, a
nd 2
010
by c
ount
ry in
com
e le
vel
Hig
h-in
com
e co
untr
ies
Low
-inc
ome
and
mid
dle-
inco
me
coun
trie
sG
loba
lly
1990
2005
2010
p19
9020
0520
10p
1990
2005
2010
p
Inci
denc
e73
·9 (
0·12
)74
·2 (
0·13
)74
·5 (
0·13
)<
0·00
168
·8 (
0·20
)69
·2 (
0·17
)69
·4 (
0·17
)0·
009
71·0
(0·
12)
70·9
(0·
13)
71·0
(0·
13)
0·48
5
Prev
alen
ce72
·6 (
0·13
)73
·0 (
0·13
)73
·4 (
0·14
)<
0·00
167
·3 (
0·17
)67
·8 (
0·16
)68
·0 (
0·16
)0·
001
69·9
(0·
11)
69·8
(0·
11)
69·8
(0·
11)
0·36
9
Mor
talit
y77
·9 (
0·15
)78
·8 (
0·19
)80
·4 (
0·21
)<
0·00
169
·8 (
0·21
)71
·3 (
0·21
72·1
(0·
24)
<0·
001
72·9
(0·
21)
737
(0·2
4)74
·5 (
0·28
)<
0·00
1
Dat
a in
par
enth
eses
are
SD
s.
Lancet. Author manuscript; available in PMC 2014 October 01.
Related Documents