GIS Analysis of Sediment Transport in Humboldt Inlet, California Joshua L. Caulkins

GIS Analysis of Sediment Transport in Humboldt Inlet, California Joshua L. Caulkins
Dec 31, 2015
GIS Analysis of Sediment Transport in Humboldt Inlet, California Joshua L. Caulkins. Importance. Engineering 2001 US Spent $867,760 and dredged 268,465 yd 3 Mitigation Options Dredging is not cost effective. Rationale. Ultimate Goals. - PowerPoint PPT Presentation
Welcome message from author
This document is posted to help you gain knowledge. Please leave a comment to let me know what you think about it! Share it to your friends and learn new things together.
Transcript
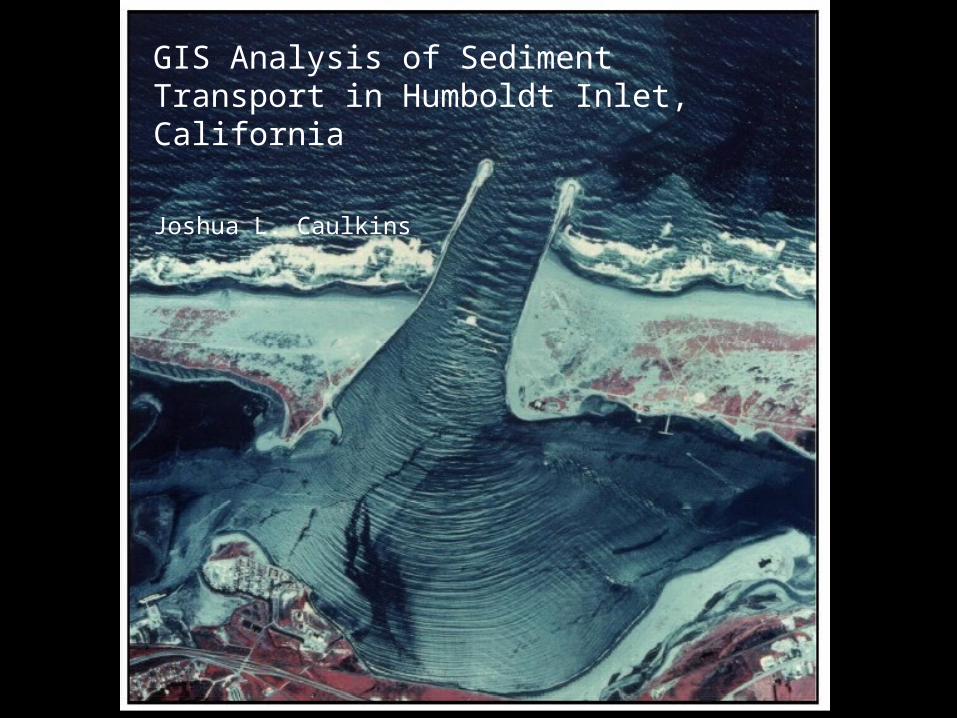
GIS Analysis of Sediment Transport in Humboldt Inlet, California
Joshua L. Caulkins
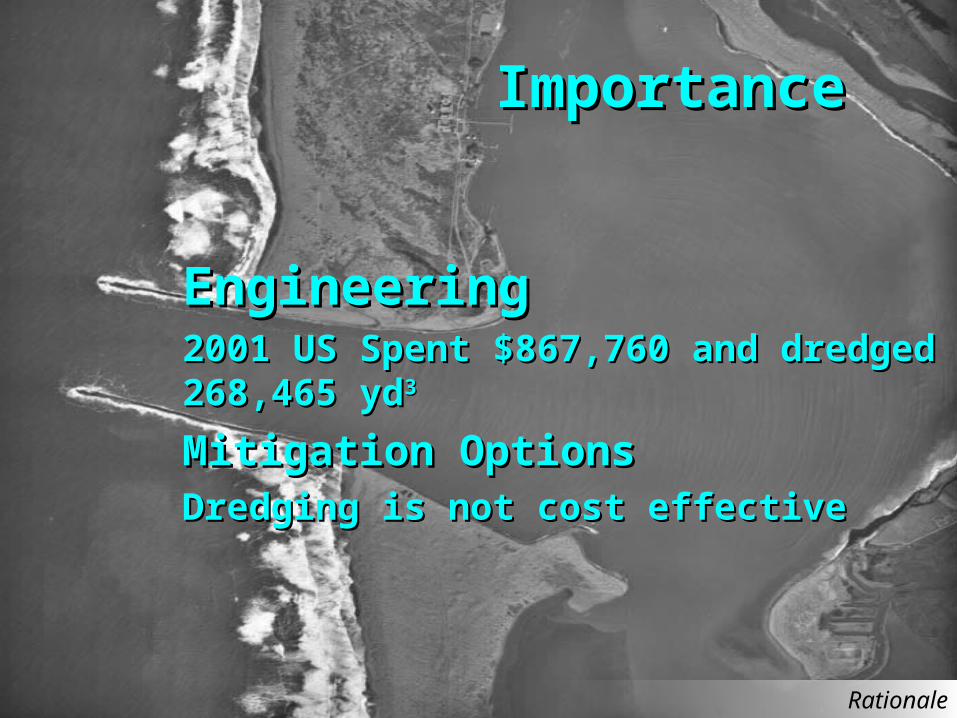
ImportanceImportance
EngineeringEngineering2001 US Spent $867,760 and dredged 2001 US Spent $867,760 and dredged
268,465 yd268,465 yd33
Mitigation OptionsMitigation OptionsDredging is not cost effectiveDredging is not cost effective
Rationale
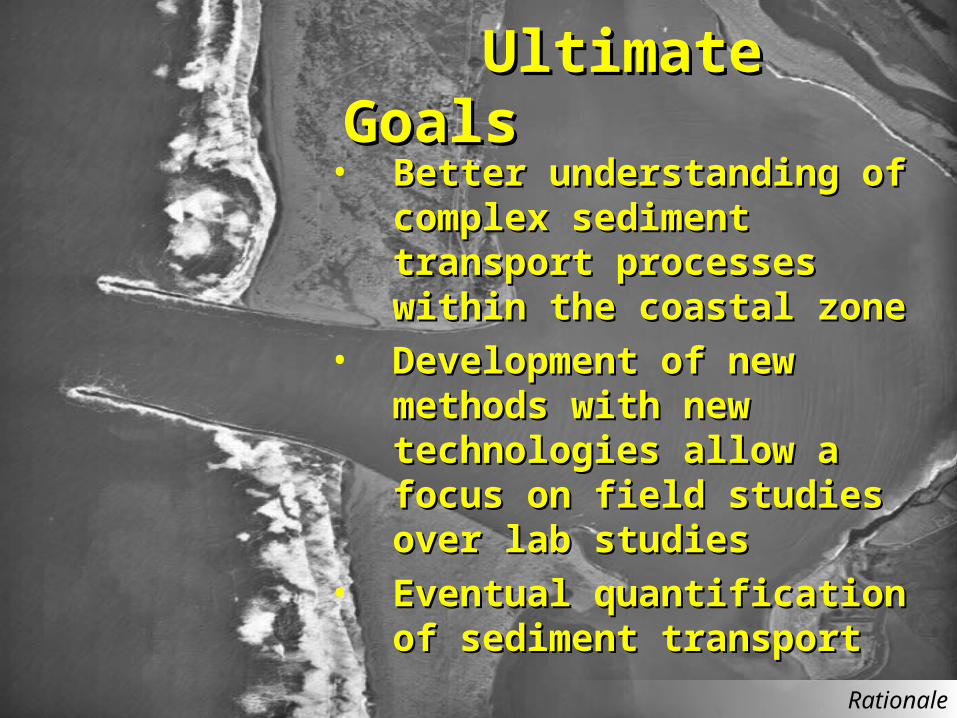
Ultimate GoalsUltimate Goals• Better understanding of Better understanding of
complex sediment transport complex sediment transport processes within the coastal processes within the coastal zonezone
• Development of new methods Development of new methods with new technologies allow a with new technologies allow a focus on field studies over lab focus on field studies over lab studiesstudies
• Eventual quantification of Eventual quantification of sediment transportsediment transport
Rationale
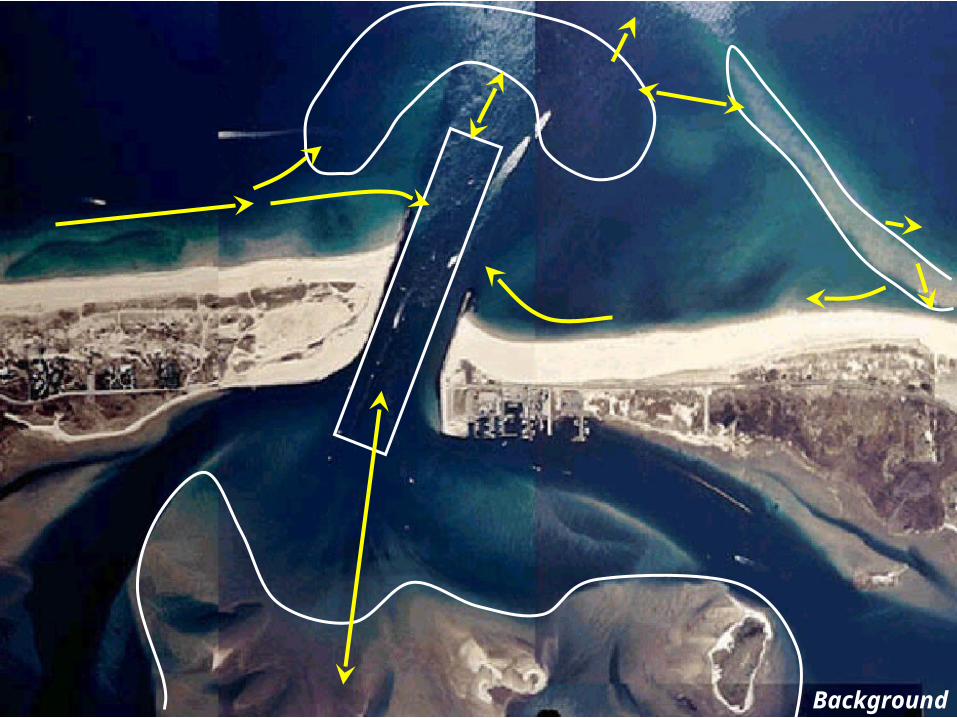
Background
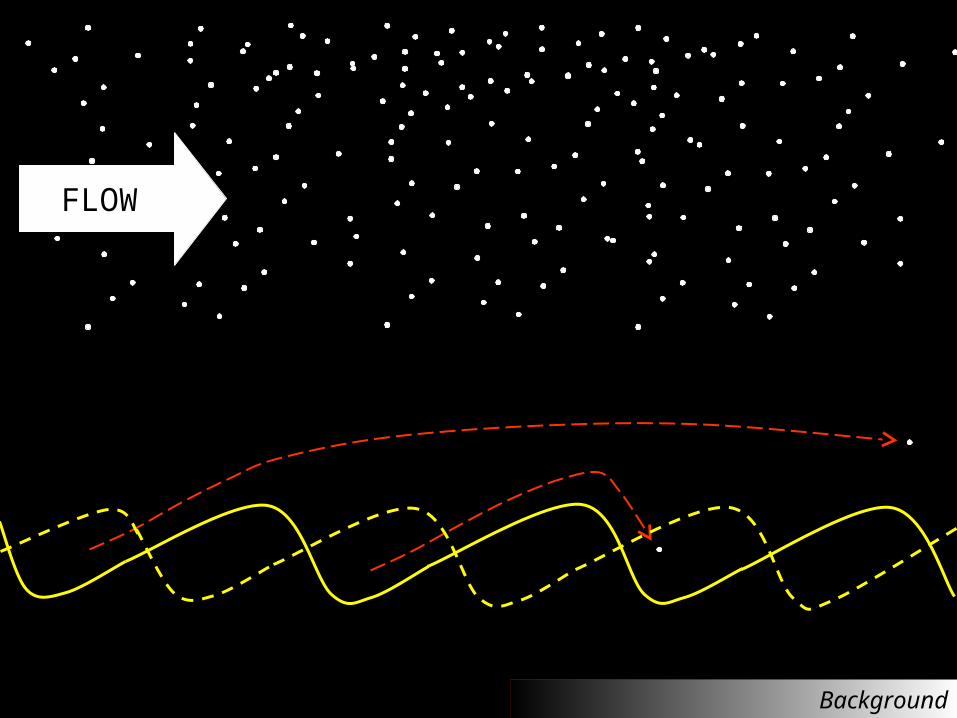
FLOW
Background
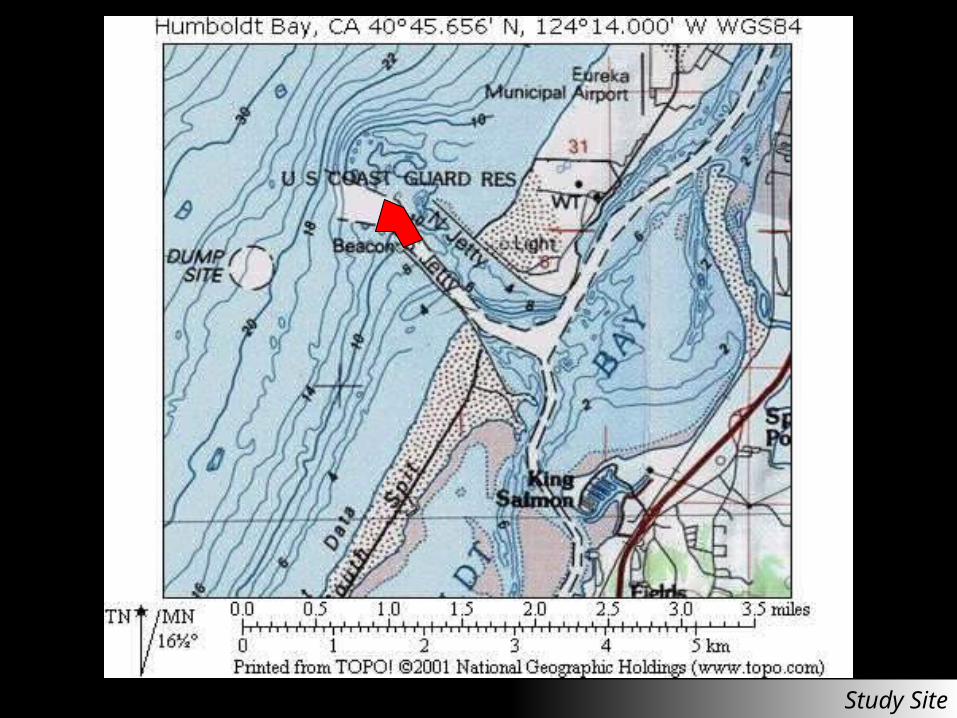
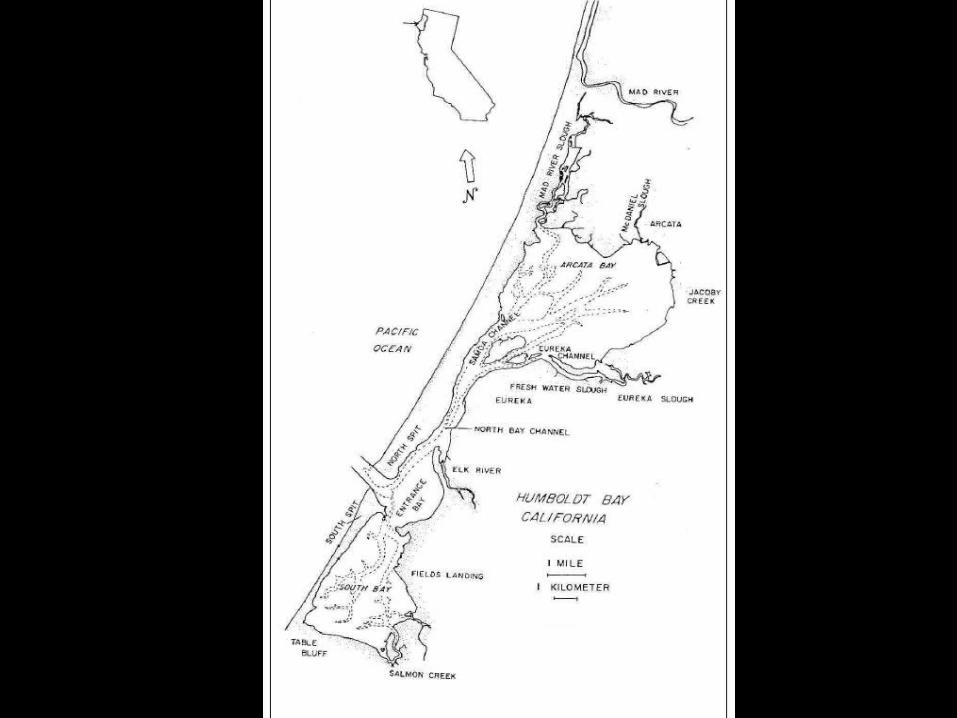
Study Site
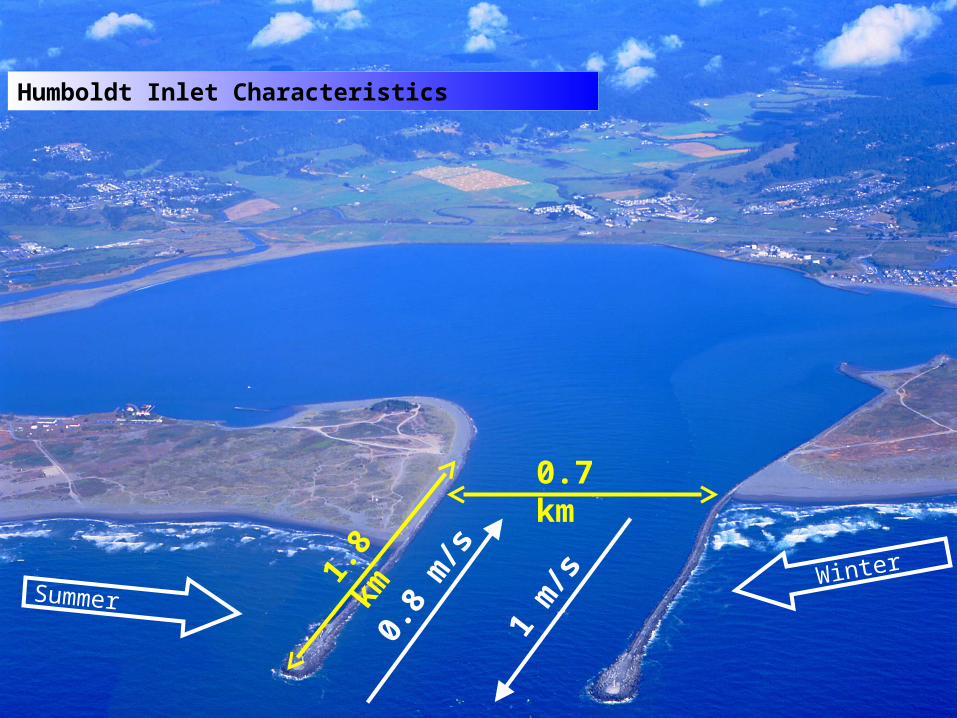
0.7 km
1.8
km0.
8 m
/s
1 m
/sSummerWinter
Humboldt Inlet Characteristics
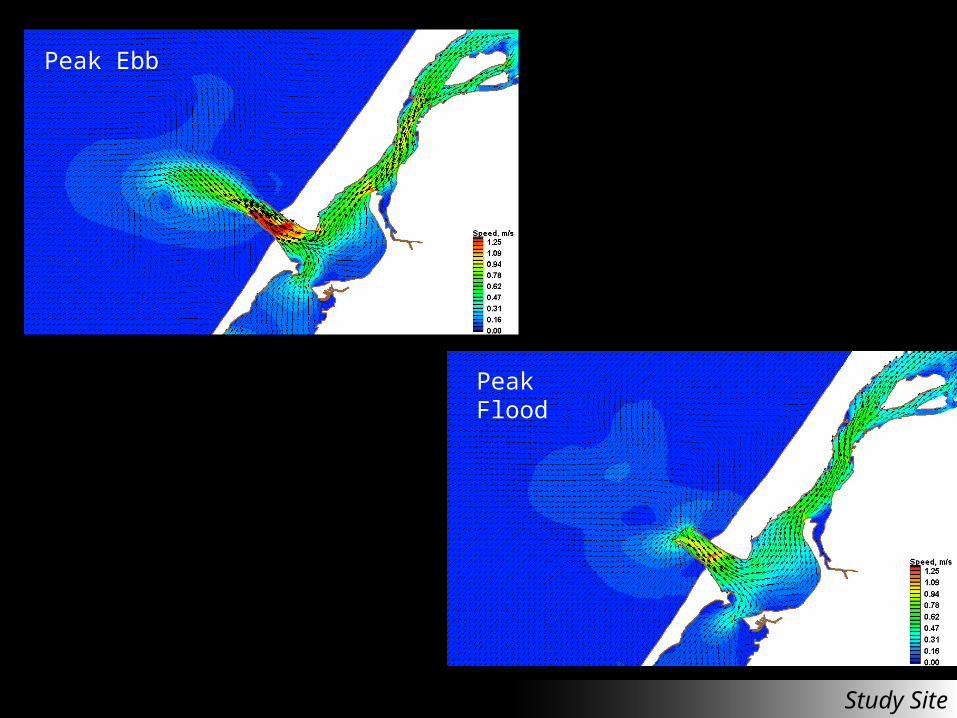
Peak Ebb
Peak Flood
Study Site
1998 1999 2000 2001
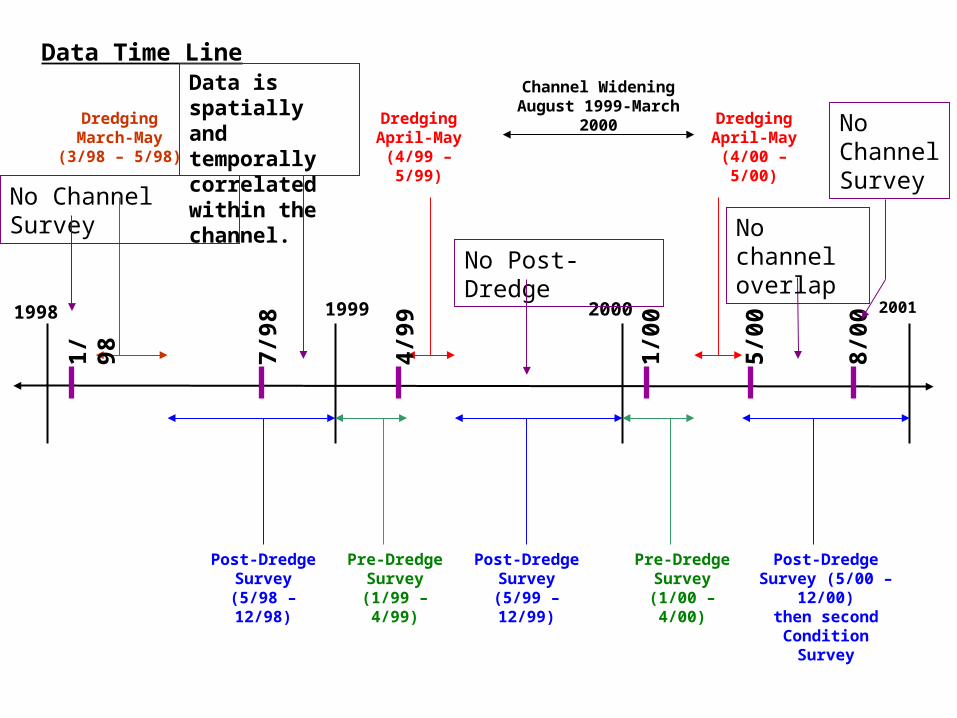
DredgingMarch-May(3/98 – 5/98)
DredgingApril-May
(4/99 – 5/99)
DredgingApril-May
(4/00 – 5/00)
Post-Dredge Survey
(5/98 – 12/98)
Post-Dredge Survey
(5/99 – 12/99)
Post-Dredge Survey (5/00 –
12/00)then second
Condition Survey
Pre-Dredge Survey
(1/99 – 4/99)
Pre-Dredge Survey
(1/00 – 4/00)
Channel WideningAugust 1999-March
2000
Data Time Line
7/98
1/ 9
8
4/99
1/00
5/00
8/00
No channel overlap
Data is spatially and temporally correlated within the channel.
No Channel Survey
No Post-Dredge
No Channel Survey
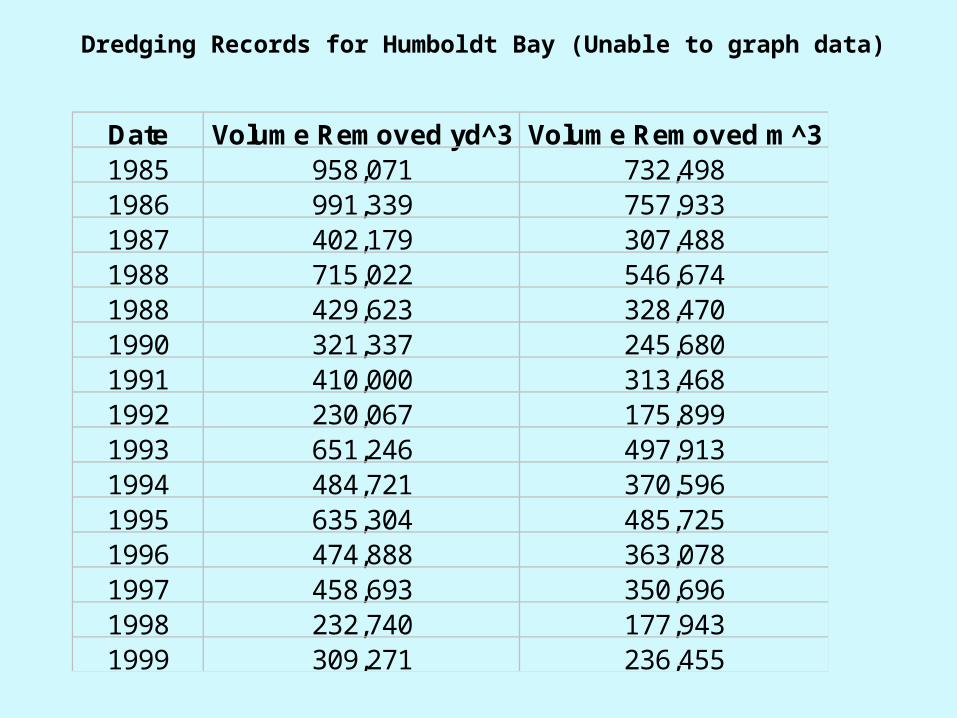
Date Volume Removed yd^3 Volume Removed m^31985 958,071 732,4981986 991,339 757,9331987 402,179 307,4881988 715,022 546,6741988 429,623 328,4701990 321,337 245,6801991 410,000 313,4681992 230,067 175,8991993 651,246 497,9131994 484,721 370,5961995 635,304 485,7251996 474,888 363,0781997 458,693 350,6961998 232,740 177,9431999 309,271 236,455
Dredging Records for Humboldt Bay (Unable to graph data)
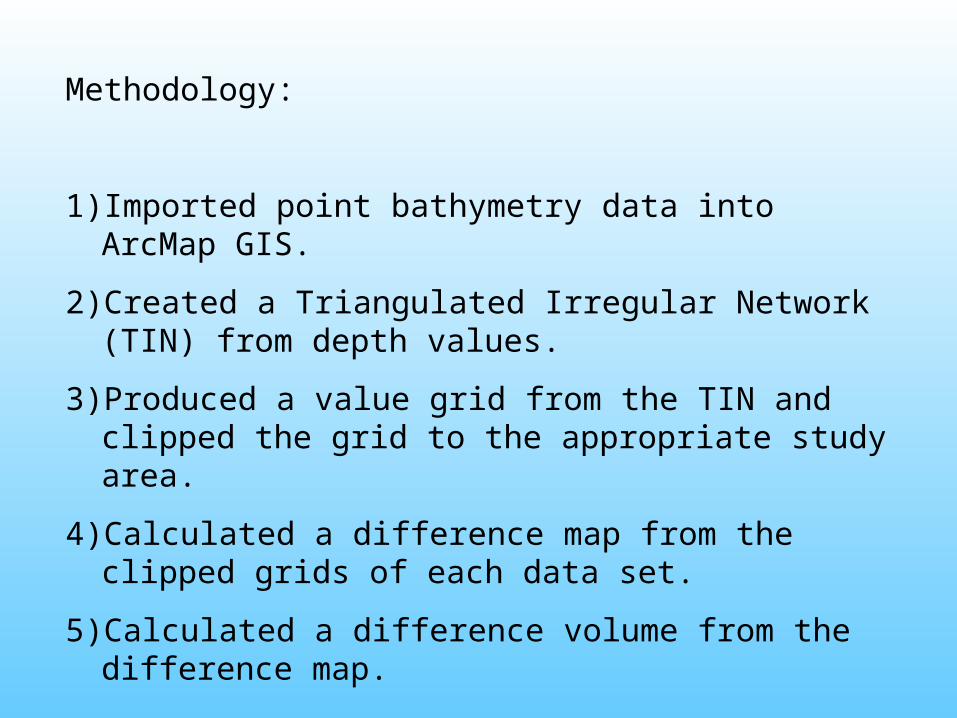
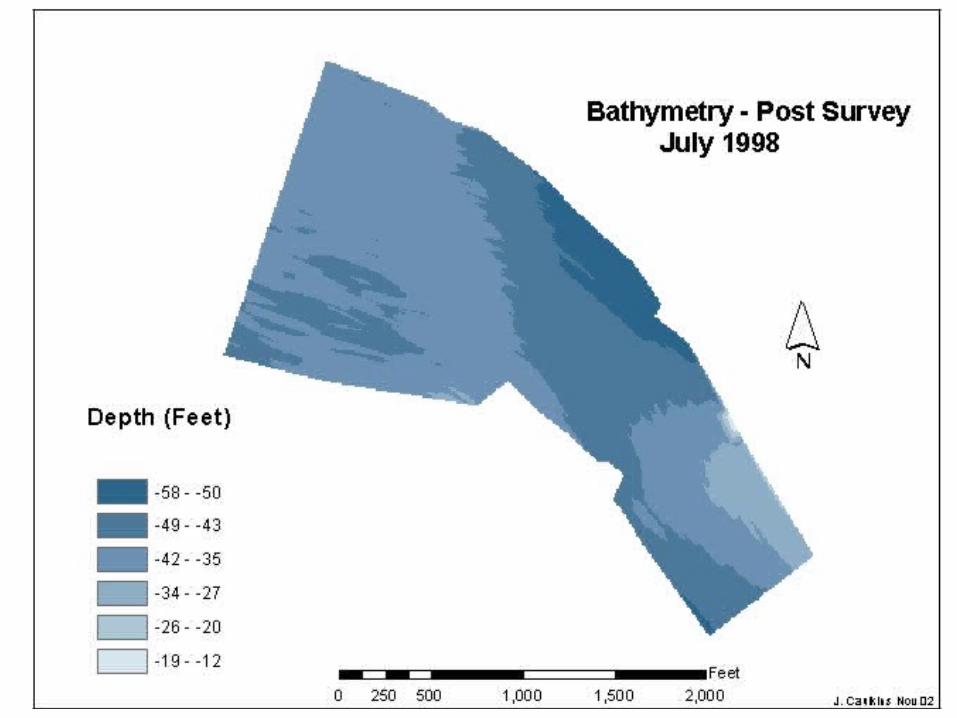
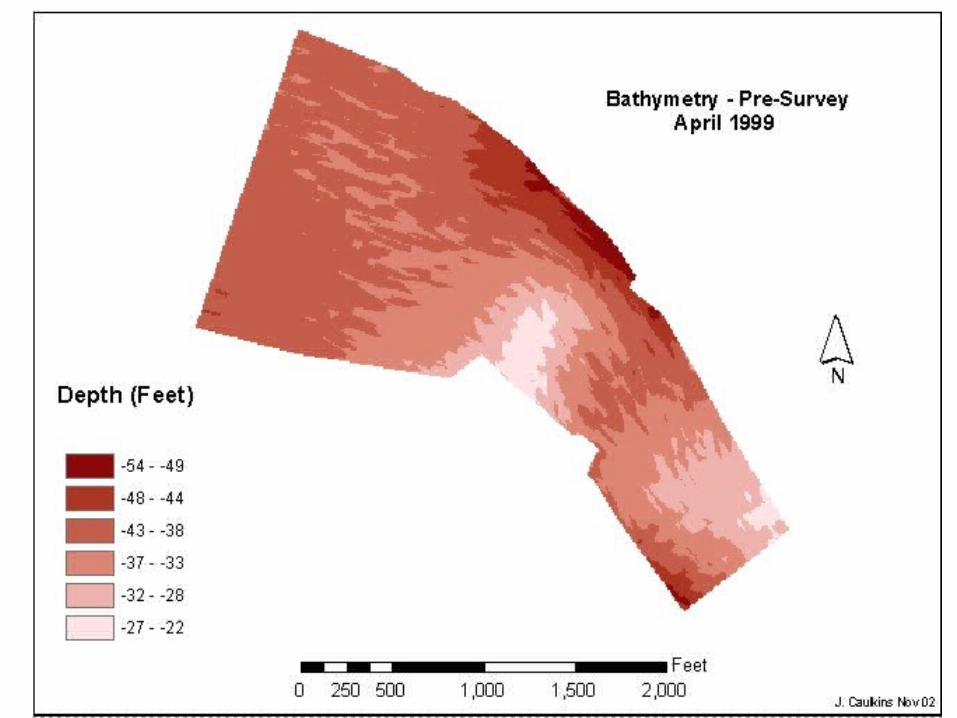
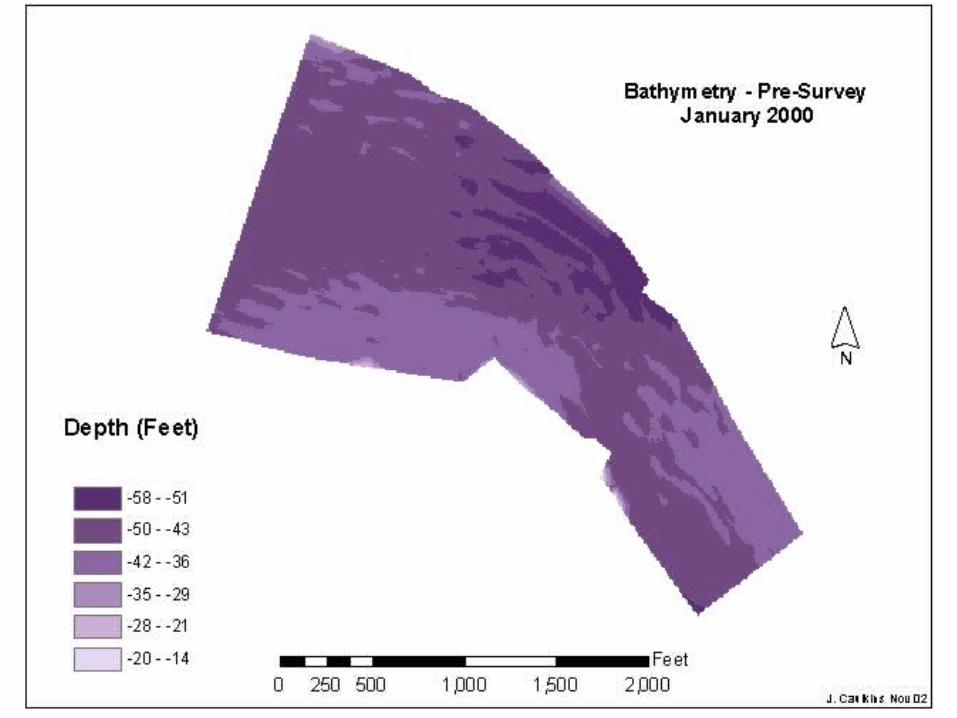
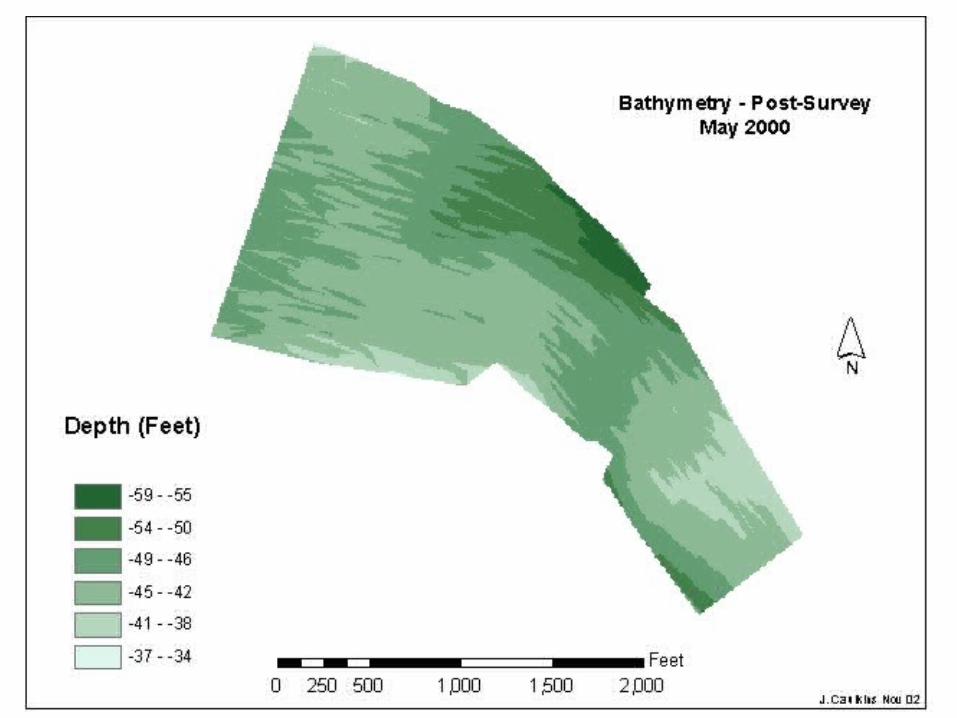
Methodology:
1) Imported point bathymetry data into ArcMap GIS.
2) Created a Triangulated Irregular Network (TIN) from depth values.
3) Produced a value grid from the TIN and clipped the grid to the appropriate study area.
4) Calculated a difference map from the clipped grids of each data set.
5) Calculated a difference volume from the difference map.
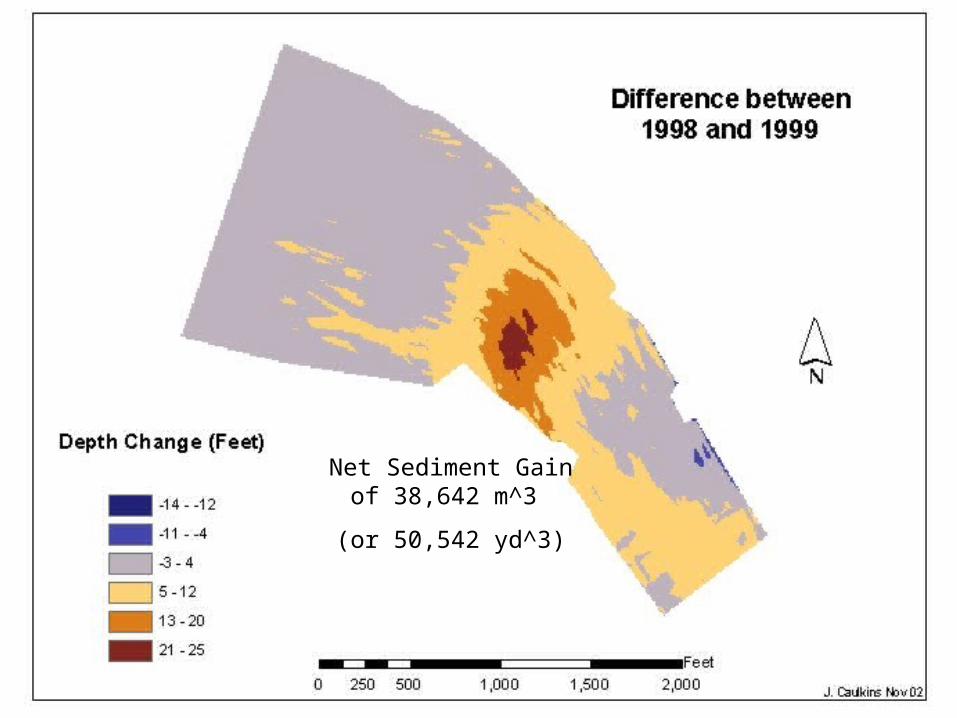
Net Sediment Gain of 38,642 m^3
(or 50,542 yd^3)


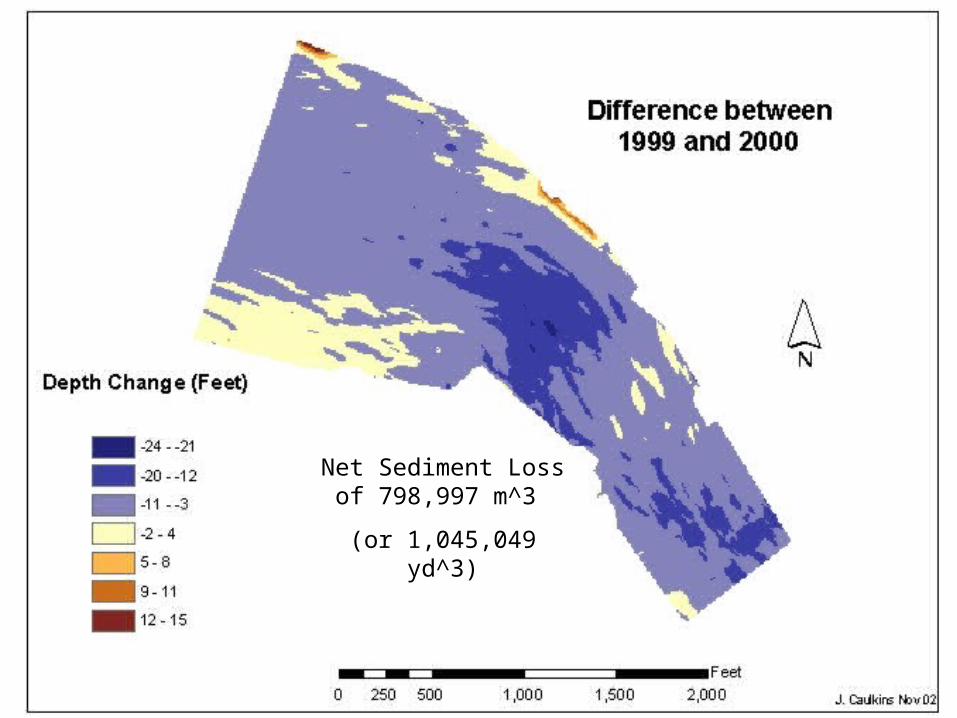
Net Sediment Loss of 798,997 m^3
(or 1,045,049 yd^3)
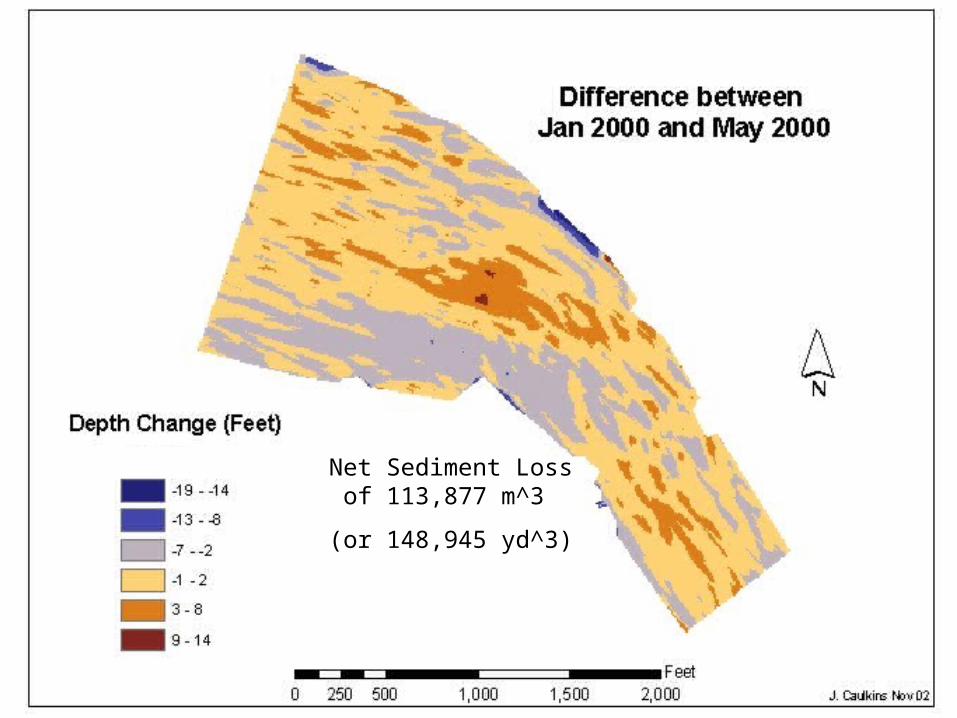
Net Sediment Loss of 113,877 m^3
(or 148,945 yd^3)
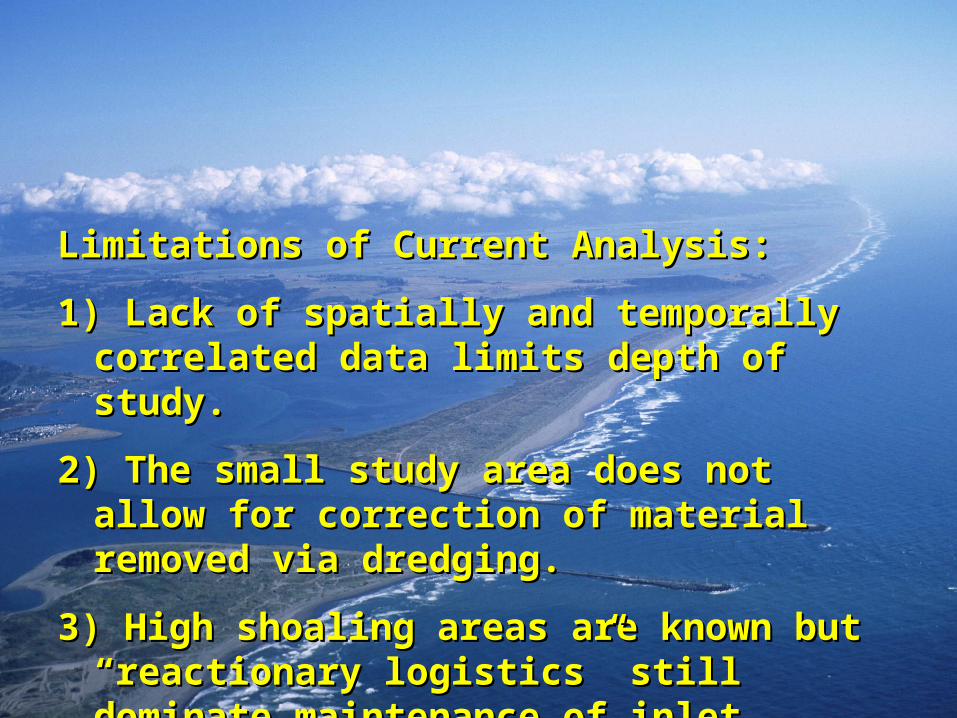
Limitations of Current Analysis:Limitations of Current Analysis:
1)1) Lack of spatially and temporally correlated Lack of spatially and temporally correlated data limits depth of study.data limits depth of study.
2)2) The small study area does not allow for The small study area does not allow for correction of material removed via dredging. correction of material removed via dredging.
3)3) High shoaling areas are known but High shoaling areas are known but “reactionary logistics” still dominate “reactionary logistics” still dominate maintenance of inlet.maintenance of inlet.
Conclusions & Implications of Current Conclusions & Implications of Current Analysis:Analysis:
1)1)Methodology is sound (Ham, Maguire) and Methodology is sound (Ham, Maguire) and cost effective.cost effective.
2)2)Quantification ability at this scale is still in Quantification ability at this scale is still in the early stages. More exploration into the early stages. More exploration into SHOALS or LIDAR data (remote sensing) SHOALS or LIDAR data (remote sensing) would enable a more comprehensive would enable a more comprehensive analysis.analysis.
Related Documents