© The Treasury New Zealand’s Economic & Fiscal Outlook, Treasury’s Long-Term Fiscal Statement, and Treasury’s Living Standards Framework September 2013

Welcome message from author
This document is posted to help you gain knowledge. Please leave a comment to let me know what you think about it! Share it to your friends and learn new things together.
Transcript

© The Treasury
New Zealand’s Economic & Fiscal Outlook,Treasury’s Long-Term Fiscal Statement, and
Treasury’s Living Standards Framework September 2013

© The Treasury
Short-Term (next five years) Economic and
Fiscal Outlook

© The Treasury
Five Key Judgements § International Economic Situation§ Effects of the Drought§ Canterbury§ Terms of Trade§ Monetary Conditions
3

© The Treasury
Global Context

© The Treasury
Global Outlook steady ...
-1
0
1
2
3
4
5
6
2000 2002 2004 2006 2008 2010 2012 2014 2016Years ending 31 December
Annual average % changeAnnual
ForecastTrading Partner Growth

© The Treasury
Global Economic Forecasts
2012 2013 2014 2015 2016 2017Actual Forecast Forecast Forecast Forecast Forecast
Australia 27% 3.6 2.7 2.9 3.0 3.0 3.0China 17% 7.8 8.0 7.6 7.3 7.0 7.0United States 11% 2.2 1.7 2.4 2.5 2.5 2.5Japan 9% 2.0 1.0 1.4 1.1 1.0 1.0Euro area 8% -0.5 -0.4 1.0 1.2 1.3 1.4United Kingdom 4% 0.3 0.7 1.4 1.8 2.0 2.0Canada 2% 1.8 1.6 2.3 2.4 2.5 2.5Other Asia* 23% 3.8 4.3 4.7 5.0 5.0 5.0Trading Partner Growth (TPG) 100% 3.5 3.4 3.8 3.8 3.8 3.9TPG - Consensus (April 2013) 3.5 3.5 3.9 4.1 4.1 4.0TPG - IMF WEO (April 2013) 3.5 3.5 4.1 4.2 4.3 4.4
* South Korea, Taiwan, Hong Kong, Singapore, Malaysia, Indonesia, Thailand, Philippines, India
2013 weights

© The Treasury
Changing export and import markets
Exports Imports

© The Treasury
... and risks have receded a little
• Euro area officials have helped settle thedebt crisis a touch
• US avoided the “fiscal cliff”• China is experiencing modest slowdown

© The Treasury
Domestic Outlook

© The Treasury
Growth outlook influenced by supportiveand constraining factors...
On the supportive side:– The Canterbury rebuild– A high terms of trade– Low interest rates– Less risk-averse households
and firms
Factors constraining growth include:– An elevated exchange rate

© The Treasury
...but the overall economic outlook issimilar to the Half Year Update
-4
-2
0
2
4
6
8
Mar-00 Mar-02 Mar-04 Mar-06 Mar-08 Mar-10 Mar-12 Mar-14 Mar-16Quarterly
BEFU HYEFU
Annual average % change
ForecastReal GDP growth

© The Treasury
Growth to be driven primarily throughInvestment and Consumption...
-4-3-2-10123456
2012 2013 2014 2015 2016 2017Years ended 31 March
Exports Total consumptionNon-residential investment & stocks Residential investmentImports Total GDP (annual average growth %)
Percentage point contribution to annual real GDP growth

© The Treasury
Summary(March Years, %)
2012 2013 2014 2015 2016 2017 Actual Estimate Forecast Forecast Forecast Forecast
Economic (March years, %)
Economic growth 1.9 2.5 2.4 3.0 2.6 2.2 Unemployment rate 6.7 6.9 6.0 5.9 5.5 5.2 CPI inflation 1.6 0.9 1.9 2.0 2.0 2.2 CA balance -4.4 -4.8 -4.8 -5.2 -5.8 -6.5 Fiscal (June years, % of GDP) Total Crown OBEGAL -4.4 -2.9 -0.9 0.0 0.3 1.0 Net debt 24.3 27.1 28.4 28.7 28.1 27.3

© The Treasury
...and in an international context, growthlooks good
-0.50.00.51.01.52.02.53.03.54.04.5Forecast trading partner growth (calendar years), % change
2013 2014 2015Source: Treasury

© The Treasury
Relative growth performance has also improved

© The Treasury
...but there is still a large gap to closeGDP per capita (Index)
1970197119721973197419751976197719781979198019811982198319841985198619871988198919901991199219931994199519961997199819992000200120022003200420052006200720082009201020111970
1970
1972
1972
1974
1974
1976
1976
1978
1978
1980
1980
1982
1982
1984
1984
1986
1986
1988
1988
1990
1990
1992
1992
1994
1994
1996
1996
1998
1998
2000
2000
2002
2002
2004
2004
2006
2006
2008
2008
2010
2010
8012016020080
80
120
120
160
160
200
200
Australia

© The Treasury
Export volume growth is affected by thedrought...
-20-16-12-8-4048
121620
2000 2002 2004 2006 2008 2010 2012 2014 2016Quarterly
Exports Imports
Annual average % change
Forecast

© The Treasury
...but higher dairy prices will support aturnaround in the goods terms of trade
900
1000
1100
1200
1300
1989 1992 1995 1998 2001 2004 2007 2010 2013 2016Quarterly
Index (1995/96 = 1000)
Forecast

© The Treasury
Labour market is expected tostrengthen over forecast period...
-2
-1
0
1
2
3
4
2
3
4
5
6
7
8
2000 2002 2004 2006 2008 2010 2012 2014 2016Quarterly
Unemployment rate Employment (right scale)
% of labour force
Forecast
Annual average % change

© The Treasury
... while inflationary pressures pick up
-3-2-101234567
Mar-00 Mar-02 Mar-04 Mar-06 Mar-08 Mar-10 Mar-12 Mar-14 Mar-16
CPI inflation Tradables Non-tradables
Annual % change
Forecast
Quarterly

© The Treasury
Low interest rates and the Canterbury rebuild
0.0
0.5
1.0
1.5
2.0
2.5
3.0
Mar-00 Mar-02 Mar-04 Mar-06 Mar-08 Mar-10 Mar-12 Mar-14 Mar-16Quarterly
Real residential investment Excluding Canterbury rebuild
$billions (in 1995/96 prices)
Forecast

© The Treasury
Risks
• Risks more balanced compared to HYEFU• Global uncertainties remain
– Fiscal adjustments– Monetary policy– China and impact on Australia
• Domestic risks– Mother nature - earthquakes and drought– Saving behaviour and exchange rate

© The Treasury
Current Account
1615141312111009080706050403020100
0
-2
-4
-5
-7
-9
0.50.0-0.5-1.0-1.5-2.0-2.5
% %-pt deviationCurrent Account Deficit as % of GDP
PREFU forecast BEFU 2012 forecastBEFU less PREFU (RHS) Forecast date

© The Treasury
Higher investment drives current accountdeficit ...

© The Treasury
... higher investment drives currentaccount deficit
-10-9-8-7-6-5-4-3-2-10
2006 2007 2008 2009 2010 2011 2012 2013 2014 2015 2016 2017
% of GDP
Current account Current account ex Canterbury rebuild

© The Treasury
1987Q21987Q31987Q41988Q11988Q21988Q31988Q41989Q11989Q21989Q31989Q41990Q11990Q21990Q31990Q41991Q11991Q21991Q31991Q41992Q11992Q21992Q31992Q41993Q11993Q21993Q31993Q41994Q11994Q21994Q31994Q41995Q11995Q21995Q31995Q41996Q11996Q21996Q31996Q41997Q11997Q21997Q31997Q41998Q11998Q21998Q31998Q41999Q11999Q21999Q31999Q42000Q12000Q22000Q32000Q42001Q12001Q22001Q32001Q42002Q12002Q22002Q32002Q42003Q12003Q22003Q32003Q42004Q12004Q22004Q32004Q42005Q12005Q22005Q32005Q42006Q12006Q22006Q32006Q42007Q12007Q22007Q32007Q42008Q12008Q22008Q32008Q42009Q12009Q22009Q32009Q42010Q12010Q22010Q32010Q42011Q12011Q22011Q32011Q42012Q12012Q22012Q31987Q2
1987Q2
1990Q3
1990Q3
1993Q4
1993Q4
1997Q1
1997Q1
2000Q2
2000Q2
2003Q3
2003Q3
2006Q4
2006Q4
2010Q1
2010Q1
040801201602000
0
40
40
80
80
120
120
160
160
200
200
TradableNon-tradable
Non-tradable
Tradable
Tradeables and Non-tradeables

© The Treasury
Long Term Economic Outlook
Why am I an optimist?§Food
§Education
§Tourism
§ Health
27

© The Treasury

© The Treasury
Falling Poverty in Asia

© The Treasury
Falling Poverty in Asia

© The Treasury
Key Questions
§ How can we exploit this opportunity? § What economic and social outcomes are we aiming for? § How can government policy help us make progress
towards the achievement of these outcomes? § How do we know if we are succeeding?
31

© The Treasury
Fiscal Strategy

© The Treasury
Overview of fiscal strategy
• Restore Government’s financial strength,reduce vulnerabilities
• Restrain expenditure growth• On track for 2014/15 OBEGAL surplus• Target net debt below 20% of GDP by 2020
33

© The Treasury
Budget Decisions

© The Treasury
• Responsibly managing the Government’sfinances
• Building a more productive andcompetitive economy
• Delivering better public services withintight fiscal constraints
• Rebuilding Christchurch
Government’s economic plan

© The Treasury
Budget 2013 - $5.1bn in operatinginitiatives, $1.5bn in capital
$3,600
$893
$313$303
$0
$1,000
$2,000
$3,000
$4,000
$5,000
$6,000
Budget 2013 operating spending, $ million
Net new spending Savings Revenue Contingencies0.0
0.5
1.0
1.5
2.0
Budget 12 Budget 13 Budget 14 Budget 15 Budget 16 Unallocated
Future Investment Fund spending profile, $ billions

© The Treasury
Four-year Plans
• $800 million allowance divided up • Most Votes directed to plan on the basis of
no new funding
104
150
350
60
5086
Emissions Trading SchemeEducation
Health
Welfare
Contingency
Unallocated
© The Treasury
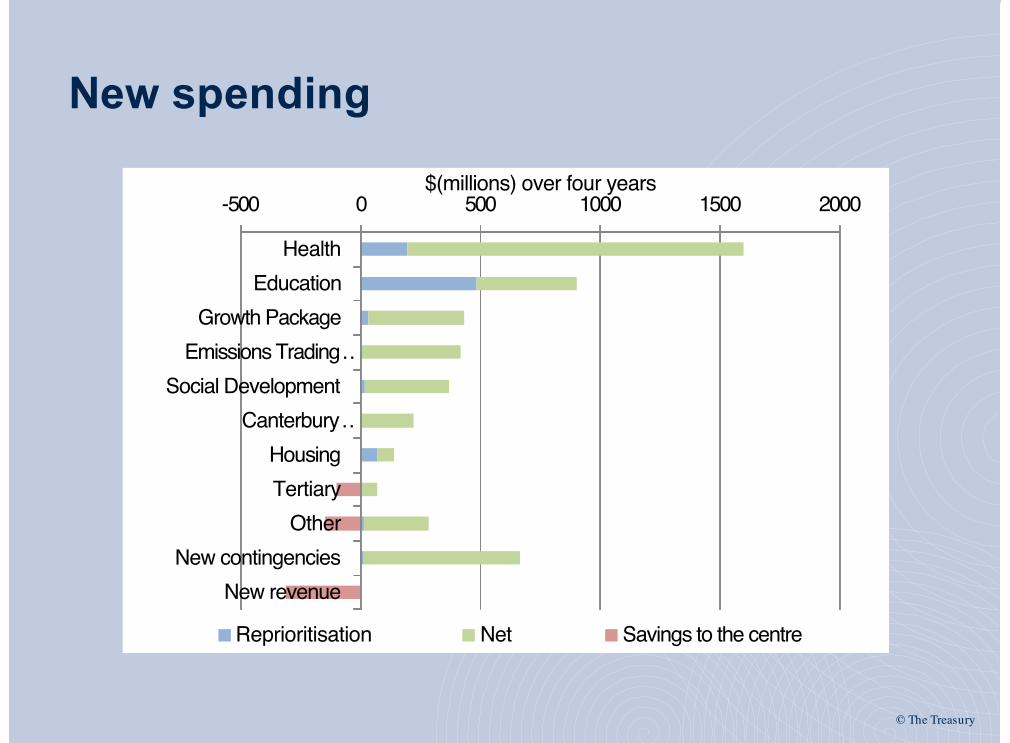
New spending
-500 0 500 1000 1500 2000
HealthEducation
Growth PackageEmissions Trading …
Social DevelopmentCanterbury …
HousingTertiary
OtherNew contingencies
New revenue
$(millions) over four years
Reprioritisation Net Savings to the centre

© The Treasury
Other
• Significant ACC levy reductions signalled– $300m in 14/15– $1 billion in 15/16
• Superfund contributions deferred until Net Debt at 20% of GDP
39

© The Treasury
Future Investment Fund
• $6 billion to be smoothed over the next fewBudgets for new capital spending
• $1.5 billion of spending in Budget 2013
0
0.5
1
1.5
2
Budget 2012 Budget 2013 Budget 2014 Budget 2015 Budget 2016 Unallocated
Expected Future Investment Fund spend
?

© The Treasury
Government share of rebuild now $15b
Local infrastructure,
$2.4 billion
Crown assets, $1.6 billion
Land zoning, $1.2 billion
Christchurch central rebuild,
$0.9 billionOther recovery costs, $1.5
billion
EQC and other Crown entities,
$7.6 billionNet earthquake-related expenses
$15.2 billion

© The Treasury
Fiscal outlook
Revenue, Expenses, OBEGAL,Net debt, Net worth

© The Treasury
From record deficit to surplus...
0
10
20
30
40
50
60
70
80
-25
-20
-15
-10
-5
0
5
10
15
2000 2002 2004 2006 2008 2010 2012 2014 2016
$ billion$ billion
Years ended 30 JuneCore Crown residual cash OBEGAL Net debt (RHS)
Forecast
-2
-1
0
1
2
3
4
1997 1999 2001 2003 2005 2007 2009 2011 2013 2015%
of G
DP
Fiscal Years
Fiscal Impulse Expansion
Contraction

© The Treasury
...via slower spending growth
26
28
30
32
34
36
2003/04 2005/06 2007/08 2009/10 2011/12 2013/14 2015/16 2017/18 2019/20
Core Crown revenue & expenses, % of GDP
Core Crown expenses Core Crown revenue-1.0
-0.5
0.0
0.5
1.0
1.5
2.0
2.5
3.0
3.5
4.0
2004 2006 2008 2010 2012 2014 2016
New Operating Spending per Budget, $ billions

© The Treasury
Total Crown OBEGAL
-10
-8
-6
-4
-2
0
2
4
6
2007 2009 2011 2013 2015 2017 2019 2021 2023 2025 2027
Budget 2013 Half Year Update 2012
% of GDP
ForecastsActuals Projections
Year ended 30 June

© The Treasury
Tax revenue increases by $14.5b
-
5
10
15
2014 2015 2016 2017Individuals Corporate GST Other
$billions
Cumulative change relativeto 2012/13 fiscal year

© The Treasury
Core Crown expenses grow $5.5b (but grow slower than tax revenue)
-4
-2
0
2
4
6
8
2014 2015 2016 2017
$billi
ons
Budget 2013 Future allowances Social assistance Finance costsEarthquake Other Total increase
Cumulative change relativeto 2012/13 fiscal year

© The Treasury
$75m OBEGAL surplus in 14/15OBEGAL = total Crown revenue less total Crown
expenses
-12-10-8-6-4-20246
2012 2013 2014 2015 2016 2017SOE Crown Entity Core Crown OBEGAL

© The Treasury
Core Crown residual cash
-8
-6
-4
-2
0
2
4
6
2007 2009 2011 2013 2015 2017 2019 2021 2023 2025 2027
Budget 2013 Half Year Update 2012
% of GDP
Year ended 30 JuneActuals Forecasts Projections

© The Treasury
Net debt peaks: 28.7% of GDP in 14/15
Borrowing$ 32b over
next four years Borrowing
costs$ 3.5b per
year roughlythe same astotal annualspending onlaw & order
0
5
10
15
20
25
30
35
0
10
20
30
40
50
60
70
80
2003 2005 2007 2009 2011 2013 2015 2017
$billions
Year ended 30 June
Net debt ($b) % GDP
Forecast
% of GDP

© The Treasury
Core Crown Net Debt
-10
0
10
20
30
40
50
60
70
2007 2009 2011 2013 2015 2017 2019 2021 2023 2025 2027
Budget 2009 Budget 2009 without policy responseHalf Year Update 2012 Budget 2013
% of GDP Year ended 30 June

© The Treasury
Affording Our Future The Treasury’s 2013 Statement on the Long-Term Fiscal Position
What’s the story and why does it matter for you?

© The Treasury
Background
• The Public Finance Act requires Treasury topublish a Statement on the Long-Term FiscalPosition at least every 4 years
• Must relate to a period of at least 40 years• The 2013 Statement was presented to Parliament
on 11 July• Together with about 40 background papers,
Affording Our Future is available on Treasury’swebsite
© The Treasury
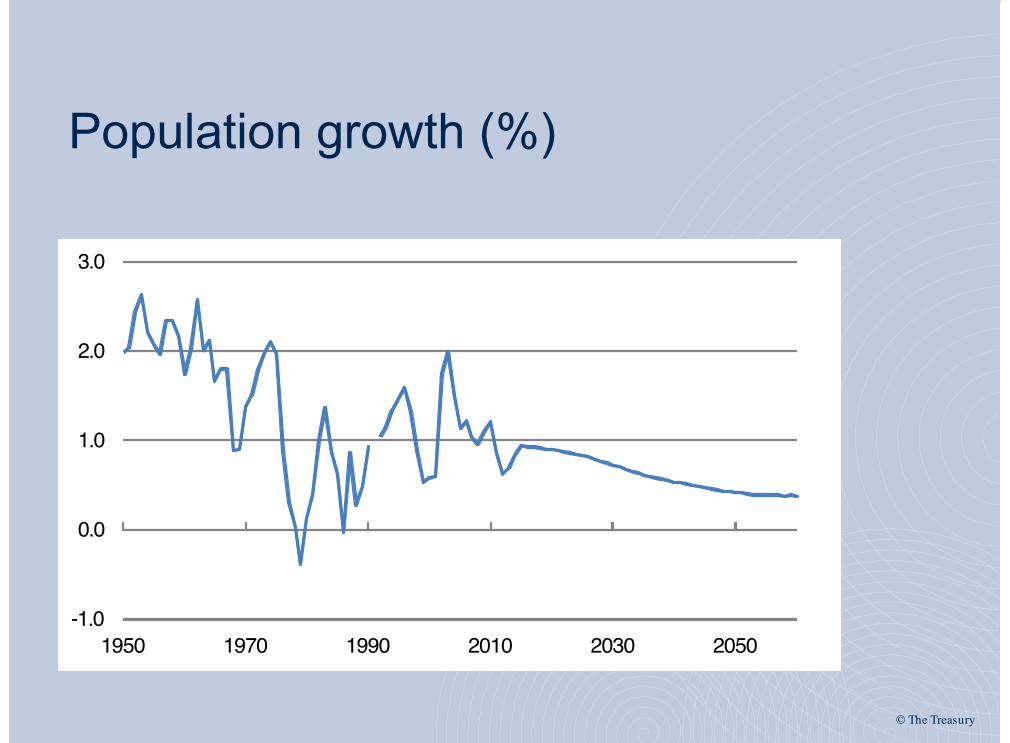
Population growth (%)
-1.0
0.0
1.0
2.0
3.0
1950 1970 1990 2010 2030 2050

© The Treasury
Dependency ratio 65+ to 15-64
People 15-64
2010
2060
People 65+

© The Treasury
Changing balance between work/remaining life for males turning 65

© The Treasury
Slowing growth of the labour force

© The Treasury
Key economic assumptions
• Trend productivity assumption of 1.5% growth in output perhour worked per annum from 2020 (versus 1.1% for thelast 40 years)
• Average weekly hours worked assumed at 33.2 hours(compared with 34.6 hours over the last 35 years)
• Assumes an average annual consumer price inflation rateof 2% (the midpoint of the current inflation range target)
© The Treasury
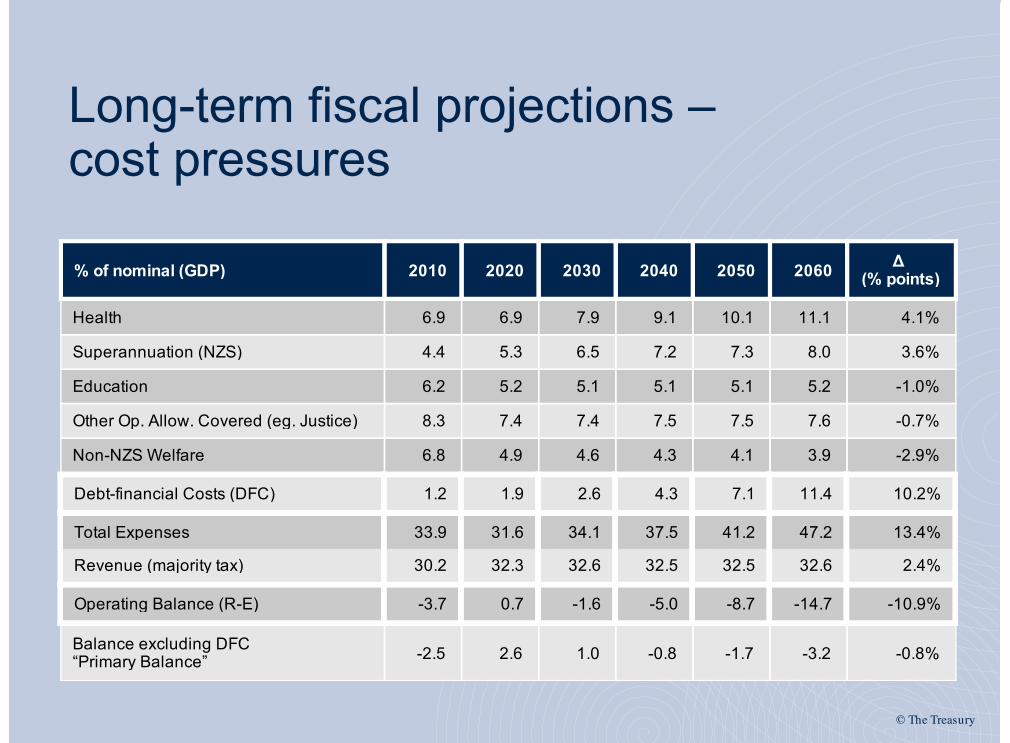
Long-term fiscal projections – cost pressures
% of nominal (GDP) 2010 2020 2030 2040 2050 2060 Δ (% points)
Health 6.9 6.9 7.9 9.1 10.1 11.1 4.1%
Superannuation (NZS) 4.4 5.3 6.5 7.2 7.3 8.0 3.6%
Education 6.2 5.2 5.1 5.1 5.1 5.2 -1.0%
Other Op. Allow. Covered (eg. Justice) 8.3 7.4 7.4 7.5 7.5 7.6 -0.7%
Non-NZS Welfare 6.8 4.9 4.6 4.3 4.1 3.9 -2.9%
Debt-financial Costs (DFC) 1.2 1.9 2.6 4.3 7.1 11.4 10.2%
Total Expenses 33.9 31.6 34.1 37.5 41.2 47.2 13.4%
Revenue (majority tax) 30.2 32.3 32.6 32.5 32.5 32.6 2.4%
Operating Balance (R-E) -3.7 0.7 -1.6 -5.0 -8.7 -14.7 -10.9%
Balance excluding DFC“Primary Balance” -2.5 2.6 1.0 -0.8 -1.7 -3.2 -0.8%

© The Treasury
Major spending areas and aggregate revenue
0
5
10
15
20
25
30
35
40
45
50
2000 2005 2010 2015 2020 2025 2030 2035 2040 2045 2050 2055 2060
% of GDP
SuperWelfare
HealthEducation
Other
Finance costsRevenue

© The Treasury
NZ Super uncertainty around the median
4
5
6
7
8
9
10
2010 2015 2020 2025 2030 2035 2040 2045 2050 2055 2060
95th percentile75th percentile50th percentile
%of GDP
25th percentile5th percentile

© The Treasury
Primary balance uncertainty
-8
-7
-6
-5
-4
-3
-2
-1
0
1
2
2010 2015 2020 2025 2030 2035 2040 2045 2050 2055 2060
95th percentile75th percentile50th percentile
%of GDP
25th percentile5th percentile

© The Treasury
The recent history ofgovernment debt
0.0%
10.0%
20.0%
30.0%
40.0%
50.0%
60.0%
70.0%
1986 1988 1990 1992 1994 1996 1998 2000 2002 2004 2006 2008 2010 2012
% GDP
Net government debt as a % of GDP
"Prudentdebt" requirement introduced

© The Treasury
Treasury’s long-term projectionsare a “what if” scenario• Treasury’s projections do not include the long-
term consequences of the Government’s fiscalstrategy (the May 2013 FSR)
• Rather, they use a “Resume Historic CostGrowth” scenario from the 2015/16 fiscal year(first full fiscal year of new Parliamentary term)
• Point is to show how expense categories mightgrow in the future, using the past as a guide

© The Treasury
What exactly is the “ResumeHistoric Cost Growth” scenario?
– Historic growth rates per recipient in differentexpense categories; plus
– Current legislative settings (e.g. for welfarebenefits and NZ Super); plus
– Assumptions about future demographics; plus– Assumptions about future economic factors

© The Treasury
The “Resume Historic CostGrowth” scenario shows:• If we allow expenses to grow in accordance with
the “Resume Historic Cost Growth” scenario from 2015/16
• And collect the same amount of tax as in recenthistory (29% of GDP)
• We’ll face a growing gap between revenue andexpenses, which we’ll need to borrow to fill

© The Treasury
What is different from last time interms of our methodology?• We have made a much greater effort to involve
experts from outside Treasury this time• We have revised up assumptions for rate of
growth in non-NZS Welfare, Health andEducation expenses based on us having a muchbetter handle of what has happened in history

© The Treasury
Key Conclusions from “ResumeHistoric Cost Growth” projections Error! Unknown document property name.
% of nominal GDP 2010 2020 2030 2040 2050 2060 Healthcare 6.8 6.8 7.7 8.9 9.9 10.8 NZ Super 4.3 5.1 6.4 7.1 7.2 7.9 Education 6.1 5.3 5.2 5.2 5.1 5.2 Law and order 1.7 1.4 1.4 1.4 1.4 1.4 Welfare (excluding NZ Super) 6.7 4.8 4.4 4.2 4.0 3.8 Other 6.5 5.6 5.7 5.8 5.9 6.1 Debt-financing costs 1.2 1.8 2.5 4.2 7.1 11.7 Total government expenses 33.4 30.8 33.4 36.9 40.6 46.8
Tax revenue 26.5 28.9 29.0 29.0 29.0 29.0 Other revenue 3.2 3.0 3.2 3.2 3.3 3.6 Total government re venue 29.7 31.9 32.2 32.2 32.3 32.6
Expenses less revenue 3.6 -1.1 1.2 4.6 8.3 14.3
Net government debt 13.9 27.4 37.1 67.2 118.9 198.3
© The Treasury
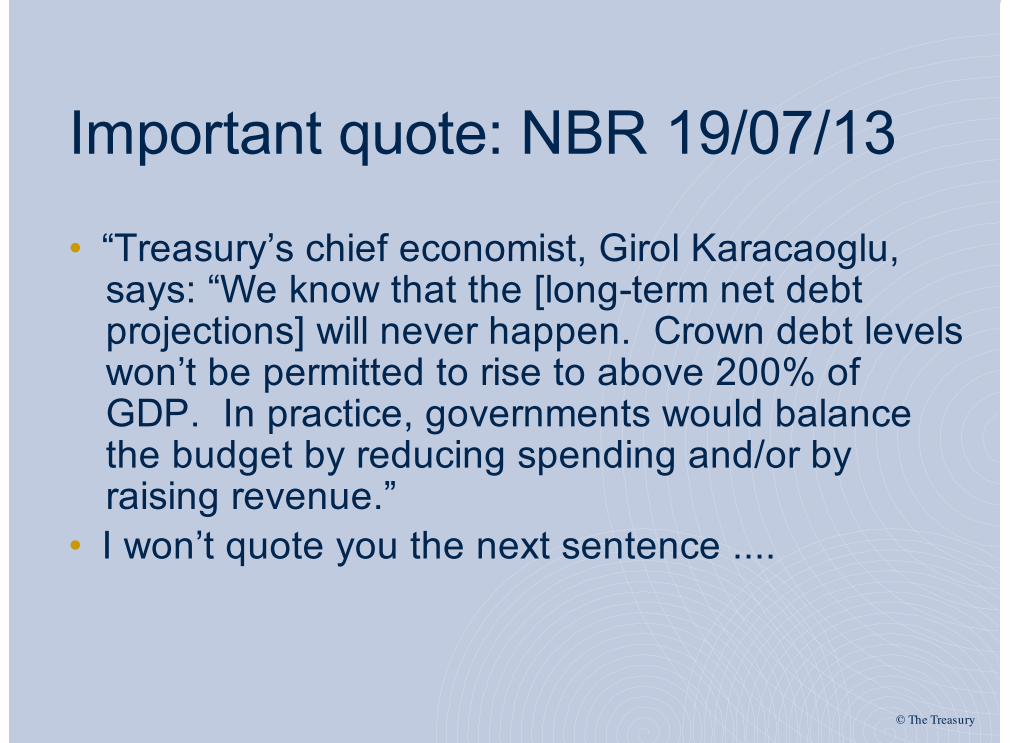
Important quote: NBR 19/07/13
• “Treasury’s chief economist, Girol Karacaoglu,says: “We know that the [long-term net debtprojections] will never happen. Crown debt levelswon’t be permitted to rise to above 200% ofGDP. In practice, governments would balancethe budget by reducing spending and/or byraising revenue.”
• I won’t quote you the next sentence ....

© The Treasury
Background Papers
• Affording Our Future was informed by specialistsfrom across the public service, academics andindependent experts – I’m very interested in yourviews
• Strongly recommend you read the BackgroundPapers Supporting the Statement – these are onour website. They cover Health, Long-TermCare, Education, Welfare, Tax etc

© The Treasury
FSR versus LTFS
• You may have noticed net Crown debt is projected to behigher in 2020 in Affording Our Future compared with theGovernment’s commitment of no higher than 20% of GDPin its May 2013 Fiscal Strategy Report
• That is because Treasury projections capture scale ofpotential expense pressures, based on historic rates ofexpenses growth re-asserting themselves from 2015/16,versus this Government’s commitments should it beresponsible for the annual budgets through to 2020
• The Government’s approach is more fiscally prudent andmore fiscally constrained than recent governments

© The Treasury
Adjusting early, pays bigdividends over time• Stick with the current fiscal strategy (or a different equally prudent
alternative) until 2020, before letting historic rates of Crown expensesgrowth per recipient to re-assert themselves thereafter : Net CrownDebt would be around 39% in 2059/60 and rising
• Maintain fiscal strategy until 2016/17 before you let historic expensepatterns progressively re-assert themselves: Net Crown Debt wouldbe around 124% of GDP in 2059/60 and rising
• Maintain fiscal strategy until we return to surplus in 2014/15, but then
turn on history (from 2015/16) : Net debt would be around 198% ofGDP by June 2060 and rising)

© The Treasury
Putting that into a graph ....
0
10
20
30
40
50
60
1997 2002 2007 2012 2017 2022 2027 2032
Net governmentdebt as % GDP
"Resume Historic Cost Growth" scenario from 2015/16Current fiscal strategy to 2016/17, then "Resume Historic Cost Growth" scenarioCurrent fiscal strategy to 2019/20, then "Resume Historic Cost Growth" scenario

© The Treasury
The current fiscal strategy
NZS Non-NZS benefits and transfers
Operating Allowance controlled expenses
Debt-financing costs (DFC)
0
1
2
3
4
5
6
7
8
Annual average % growth
1996/97 to 2011/12 2012/13 to 2019/20

© The Treasury
The Illustrative Options
• Different governments might make different choices to meet the long-term fiscal challenge – that’s why the Statement analyses someillustrative examples of policy changes that future governments couldconsider to address long-term fiscal issues, including:– Options to increase taxes– Options to constrain growth in health spending– Options to constrain growth in spending on NZ Super
• There are many, many more in the Background Papers Supporting theStatement
• ... And an on-line long-term fiscal calculator athttp://nzpublicfinance.com/ltf-calculator-introduction/

© The Treasury
It isn’t just about money ...
IncreasingEquity
Social Infrastructure
Sustainability forthe Future
Economic Growth
ManagingRisk
Living Standards

© The Treasury
Treasury’s Living Standards Work Programme

© The Treasury
Treasury’s Vision
To be a world class Treasuryworking for higher living standards
for New Zealanders.
78

© The Treasury
The OECD
79

© The Treasury
Better Life vs. GDP
80
© The Treasury
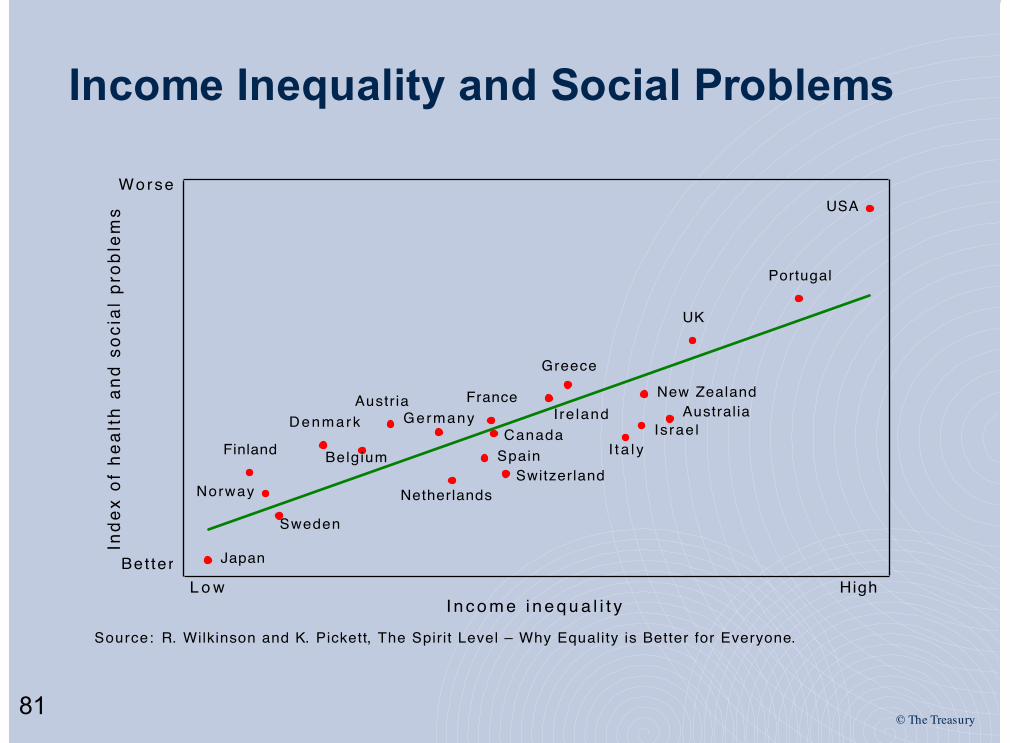
Income Inequality and Social Problems
81
Japan
Sweden
Norway
Finland
Denmark
Belgium
AustriaGermany
Canada
France
Netherlands
SpainSwitzerland
Greece
I re landIsrae l
I t a l y
AustraliaNew Zealand
UK
Portugal
USA
L o w High
Worse
Bet ter
I n c o m e i n e q u a l i t y
Inde
x of
hea
lth
and
soci
al p
robl
ems
Source: R. Wilkinson and K. Pickett, The Spirit Level – Why Equality is Better for Everyone.

© The Treasury
NZ Indicator Rankings
82
Indicator Full Sample Ranking Full Sample Percentile OECD 24 CountryRanking
OECD 24 CountryPercentile
GNI(pc) 28 / 182 15 22 / 24 92
GDP(pc) 25 / 189 13 19 / 21 90
LifeExp 19 / 193 10 12 / 24 50
Fem/Male 132 / 194 68 21 / 24 88
HDI 5 / 187 3 5 / 24 21
EPI 14 / 131 11 11 / 24 46
EcoFprint 22 / 25 88 20 / 23 87
Eco-Glob 21 / 144 15 10 / 24 42
Soc-Glob 30 / 198 15 20 / 24 83
LS-HPI 9 / 25 36 9 / 23 39
OECD-BLI 4 / 33 12 4 / 23 17
LS-Mean 48 / 94 51 18 / 24 75
LS-Sdev 65 / 94 69 22 / 24 92
Gini 51 / 135 38 21 / 24 88
Table 3: New Zealand Indicator Rankings (full sample and 24 OECD countries)A low ranking and a low percentile implies a comparatively high level of wellbeing.
Source: A Grimes, L Oxley, N. Tarrant. “Does Money Buy Me Love: Testing Alternative Measures of Wellbeing,”Motu Working Paper (forthcoming), July 2012.

© The Treasury
Distributionwithin thepopulation and over
time
Subjective Wellbeing
The Living Standards Framework
83

© The Treasury
Fundamentals – WHAT is it all about?
What is “improving standards of living” all about? It is about increasing the freedoms of individuals to enjoy the kindsof lives they wish to live. [Amartya Sen’s concept of justice and human rights. ]
Need to focus on achieving this across society and acrossgenerations – that is what equity and sustainability are all about.
84

© The Treasury
Using LSF to Guide Policy Advice
§Practical §Focused §Measureable
85

© The Treasury
IncreasingEquity
Social Infrastructure
Sustainability forthe Future
Economic Growth
ManagingRisk FINANCIAL &
PHYSICAL
Financial WealthHousing
Infrastructure
NATURAL
ClimateBiodiversity
Water
SOCIAL
InstitutionsTrust
HUMAN
SkillsHealth
Living Standards
86
A Proxy Social WelfareFunction for NZ

© The Treasury
Key Policy Question
Instead of thinking of trade-offs between the five corners of theliving standards cobweb, can we come up with policies thatmake these corners mutually reinforcing – so that we cancreate an expanding dynamic cobweb?
87

© The Treasury
0
0
20
20
Status quoPolicy change
Policy change
Status quo
88 Note: This is intended to demonstrate how the diagram could be used, rather than a Treasury view of therecommendations

© The Treasury
WHAT should be the focus of government-policyinterventions (in support of market processes) –Government Roles?
89
• Providing opportunities• Building capabilities• Improving incentives• Removing obstacles
HigherLiving
Standards
Capabilities
Obstacles
Opportunities
Incentives
All of the above are about maintaining and building:• physical/financial capital• human capital• social capital• natural capital

© The Treasury
Current Policy Levers: BIM
90
• Providing opportunities• Building capabilities• Improving incentives• Removing obstacles
HigherLiving
Standards
Capabilities
Obstacles
Opportunities
Incentives
• growth-supporting infrastructure• support business-led R&D• work-based training• youth agenda
• welfare reform• labour market reform• tax reform
• education reform• wide access to health care• international linkages programme
• removing international trade and investment obstacles• improving economic stability• improving public-sector productivity• work on long-term fiscal strategy
All of the above are about maintaining and building:• physical/financial capital• human capital• social capital• natural capital

© The Treasury
Policy Tools
§ Fiscal Tools§ Government Expenditure§ Taxes§ Public Debt and Public Loans
§ Regulatory Tools§ Regulations§ Authorisations
§ Other Tools§ Ownership§ Contingent Liabilities§ Nudging or Cajoling
91

© The Treasury
IncreasingEquity
Social Infrastructure
Sustainability forthe Future
Economic Growth
ManagingRisk FINANCIAL &
PHYSICAL
Financial WealthHousing
Infrastructure
NATURAL
ClimateBiodiversity
Water
SOCIAL
InstitutionsTrust
HUMAN
SkillsHealth
Living Standards
92
How might wemeasure progressfor New Zealand?
• NNI / capita
• NII position of NZ• Reducing crime rate• Reduction in social welfare dependency
• % of population below 50% of median income• Difference in the PISA score between the top andbottom 10% of students
• gross capital formation• GHG emissions tonnes/capita• % aged between 35-34 withtertiary qualifications
• World Bank government effectiveness indicator• World Values Survey: social trust indicator

© The Treasury93
Reduces intergenerational equityIncreases within generation equity
Example: Effect of a PAYGO-funded expansion of New Zealand Superannuation
Reduces investment risk Increases wage growth risk

© The Treasury
Example: Effect of a SAYGO-funded expansion of New Zealand Superannuation
94

© The Treasury0
0
20
20
OECD averageNZ 2000NZ 2010
NZ 2010
NZ 2000
OECD average
Example: NZ's performance �compared to the OECDExample: NZ's performance �compared to the OECD
Example: NZ's performance �compared to the OECD
EconomicGrowth
Sustainabilityfor the future
IncreasingEquity
SocialInfrastructure
ReducingRisks

© The Treasury
Example: Living Standards Assessment: Risk Management Method: Increasing the freedoms of individuals to enjoy desired lifestyles Elements: Physical Human Social Natural Capital Capital Capital Capital Risks Earthquakes Crime Welfare dependency Climate Changee.g. Floods Ill health Economic crises Biodiversity risks Eruptions Skill Deficiency Education failure Erosion Infrastructure disrepair Civic society failure White elephants Mitigations Insurance Education Policy Welfare Reform Emissions
Trading
96

© The Treasury
Next Steps § USE IT
§ Encouraging various teams within Treasury to trial the framework and sharewhat they learn with other teams.
§ Encouraging teams within Treasury to work with people from across thepublic sector in developing and using the framework, and associatedmeasures.
§ PROMOTE IT§ Ongoing presentations to various audiences (universities, public sector
agencies, ...) to explain the work and seek feedback.
§ DEVELOP IT§ Ongoing work to set up teams, within Treasury and across the public sector,
to progress research and measurement within each “corner” of the cobweb.§ Sharing what we learn by trying with all so that we can improve ways in
which we can enhance the framework for better policy guidance.
97

© The Treasury
1. BACK TESTING OUR ADVICE USING THELIVING STANDARDS FRAMEWORK…

© The Treasury
2. MEASURE THE 5 DIMENSIONS FROM1950…
Joey Au and Amy Thomson (Statistics New Zealand)

© The Treasury
3. WHICH DIMENSION ARE POLICIESFOCUSED ON?www.gen.org.nz
3. IDENTIFY WHICH DIMENSION(S) OF POLICIESWE ARE CURRENTLY FOCUSED ON…
Olga Pleijte, Joey Au and Ricky Utting (Treasury)

© The Treasury
4. WEIGHT THE 5 DIMENSIONS OF THEFRAMEWORK
0
1
2
3
4
5
6
7
Economic Growth
Sustainability for the Future
Increasing Equity
Social Infrastructure
Managing Risks
Status Quo Option A
0
1
2
3
4
5
6
7
Economic Growth
Sustainability for the Future
Increasing Equity
Social Infrastructure
Managing Risks
Status Quo Option B
Option A Option B
they are equal
this onethis one
Joey Au, Andrew Coleman (Treasury) and Trudy Sullivan (University of Otago)HUGE thanks to Paul Hansen (University of Otago) and Franz Ombler (1000Minds)

© The Treasury
5. DEVELOP THE LIVING STANDARDS HUB /COMMUNITY www.gen.org.nz
Share
Connect
Discuss
Related Documents


