GEOLOGIC EXPRESSIONS OF FAULTING AND EARTHQUAKE STRONG GROUND MOTIONS IN INTRAPLATE BEDROCK TERRAINS Tamarah Rosellen King ORCID: 0000-0002-9654-2917 Submitted in total fulfillment of the requirements of the degree of Doctor of Philosophy December 2019 School of Earth Sciences University of Melbourne

Welcome message from author
This document is posted to help you gain knowledge. Please leave a comment to let me know what you think about it! Share it to your friends and learn new things together.
Transcript

GEOLOGIC EXPRESSIONS OF FAULTING
AND EARTHQUAKE STRONG GROUND
MOTIONS IN INTRAPLATE BEDROCK
TERRAINS
Tamarah Rosellen King
ORCID: 0000-0002-9654-2917
Submitted in total fulfillment of the requirements of the degree of
Doctor of Philosophy
December 2019
School of Earth Sciences
University of Melbourne
i
Abstract
Australian earthquakes offer unique opportunities to investigate environmental and
landscape effects of reverse rupturing faults. All historic surface-rupturing earthquakes have
occurred in arid, low-relief, bedrock dominated areas with little to no anthropogenic
influence. Environmental earthquake effects identified following the 2016, reverse-
mechanism, MW 6.1 Petermann earthquake in remote central Australia are categorised with
the Environmental Seismic Intensity scale, the first application of this scale for an Australian
earthquake. The intensity and distribution of environmental damage demonstrates strong
asymmetry due to fault geometry, with damage increasing towards the surface rupture rather
than epicentral region. The direction and distances of 1,437 co-seismically displaced rock
fragments (chips) in the near-field of the Petermann earthquake provide a dense proxy-
record of strong ground motions, both along- and across-rupture. Chips record preferred
azimuths of displacement that are attributed to rupture fling effects. This unprecedented
geological proxy-record of the distribution, directivity and intensity of strong ground
motions has important implications for hazard analysis in the near-field of reverse
earthquakes. Fine-scale mapping of the 2016 Peterman surface rupture and secondary
fractures using field, drone-derived and remote-sensing datasets indicates surface rupture
characteristics vary with changes in surface geology. Deformation zones are wider and less
recognizable in granular materials (e.g. dunes, alluvium) compared with those in proximal
bedrock. Kinematic analysis of bedrock fractures indicates sinistral-reverse faulting,
consistent with published focal mechanisms, and a maximum compressive stress (σ1)
orientation generally consistent with the inferred regional SHMax orientation. Trenching and 10Be cosmogenic nuclide erosion rates provide preliminary evidence of absence for prior
rupture on the Petermann faults within the last 200 to 400 kyrs. The 2016 earthquake is
therefore hypothesized to be the first to rupture this fault in the near surface. Analyses of
geological and geophysical data from ten moderate magnitude (MW 4.7 – 6.6) historical
surface-rupturing earthquakes in cratonic Australia indicate that rupture likely propagated
along pre-existing Precambrian bedrock structures. Six of seven events show evidence of
multi-fault rupture across 2 to 6 discrete faults of ≥ 1 km length, placing these events as
some of the most structurally complex earthquake ruptures identified globally for this
magnitude. No unambiguous geological evidence for preceding surface-rupturing
earthquakes is present. This raises important questions regarding the recurrence behaviour
of intraplate stable continental region faults, with implications for seismic hazard analysis. In
summary, this thesis explores observational, seismic, and remote-sensing data of surface
rupturing earthquakes in Australia to provide new (i) data regarding the recurrence patterns
of Australian earthquakes (ii) insights into basement controls on these earthquakes (iii) and
methods to quantify seismic directionality behaviour common to reverse earthquakes
globally. These contribute to better understanding the why, what, when, where of intraplate
earthquakes, and how seismic hazard varies across diverse tectonic and crustal environments.
ii
Declaration
This is to certify that
(i) the thesis comprises only my original work towards the PhD except where
indicated in the preface;
(ii) due acknowledgement has been made in the text to all other material used;
(iii) the thesis is fewer than the 100,000 words in length, exclusive of tables, maps,
bibliographies and appendices.
Tamarah R King

iii
Preface
Tamarah R King was the primary researcher and author for the chapters in this thesis,
including the planning and execution of the research project as well as the preparation of the
contributing articles. Associate Professor Mark Quigley and Professor Mike Sandiford
provided important intellectual oversight of aspects of the thesis, appropriate to their roles
as PhD supervisors. Dr Dan Clark of Geoscience Australia provided field support and
intellectual guidance on aspects of this thesis, as indicated by co-authorship of published
papers. Collectively, Mark Quigley, Mike Sandiford and Dan Clark provided: advice on the
direction of the research project; critique of methodology and interpretations; comments on
written work; field support; and logistical and financial support of field activities and
research.
Published materials
Chapter 2 and Chapter 5 consist of original published works with Tamarah R King as the
primary author. Mark Quigley, as primary supervisor of this PhD research, has signed the
University of Melbourne Declaration for thesis with publication. All co-authors have signed
the University of Melbourne co-author declaration for published works included in Chapter
2 and Chapter 5.
Publication details are listed below.
Full Title: Earthquake environmental effects produced by the Mw 6.1, 20th May 2016
Petermann earthquake, Australia
Authors: Tamarah R. King, Mark C. Quigley, Dan Clark
Candidates Contribution: 85%
Journal: Tectonophysics
Year, volume and pages: 2018, 747 – 748, 357 – 372
DOI: 10.1016/j.tecto.2018.10.010
Full Title: Surface-rupturing historical earthquakes in Australia and their environmental
effects: new insights from re-analyses of observational data
Authors: Tamarah R. King, Mark C. Quigley, Dan Clark
Candidates Contribution: 95%
Journal: Geosciences
Year and volume: 2019, 9 (10)
DOI: 10.3390/geosciences9100408
These chapters are reformatted version of the Author Accepted manuscript of the published
materials. Reformatting includes:

iv
• Changes to heading, figure and table numbers;
• Minor changes to figure and table captions to better summarise the content within
the Lists of Tables and Figures (pages xiii and xiv respectively);
• The addition of Table 5.2 and Table 5.4 in Chapter 5 to summarise references
previously included in Table 5.1, and Table 5.5 to Table 5.12. This is due to a change
between numbered in-text referencing style from the original publication, to the
Author, Year style used in this thesis;
• Reference lists for each publication are moved from the end of the manuscripts to
the reference list for this thesis, on page 159.
Preprint Manuscripts
As a supplement to these published works, seven preprint manuscripts were published on
EarthArXiv (a preprint server) with Tamarah R King as the primary author. Publication
details are listed below, and the full text of these manuscripts are included in Appendix A.
King, T. R., M. C. Quigley, and D. Clark (2019) Review paper: The 14th October 1968 Mw 6.6 Meckering surface rupturing earthquake, Australia, EarthArXiv Prepr., doi: https://doi.org/10.31223/osf.io/2zgrn.
King, T. R., M. C. Quigley, and D. Clark (2019) Review paper: The 10th March 1970 Mw 5.0 Calingiri surface rupturing earthquake, Australia, EarthArXiv Prepr., doi: https://doi.org/10.31223/osf.io/egw4c.
King, T. R., M. C. Quigley, and D. Clark (2019) Review paper: The 2nd June 1979 Mw 6.1 Cadoux surface rupturing earthquake, Australia, EarthArXiv Prepr., doi: https://doi.org/10.31223/osf.io/9dhx8.
King, T. R., M. C. Quigley, and D. Clark (2019) Review paper: The 30th March 1968 Mw 5.7 Marryat Creek surface rupturing earthquake, Australia, EarthArXiv Prepr., doi: https://doi.org/10.31223/osf.io/5ysfx.
King, T. R., M. C. Quigley, D. Clark, S. Valkaniotis, H. Mohammadi, and W. D. Barnhart (2019) The 1987 to 2019 Tennant Creek, Australia, earthquake sequence: a protracted intraplate multi-mainshock sequence, EarthArXiv Prepr., doi: https://doi.org/10.31223/osf.io/j4nk7.
King, T. R., M. C. Quigley, and D. Clark (2019) Review paper: The 23rd March 2012 Mw 5.2 Pukatja surface rupturing earthquake, Australia, EarthArXiv Prepr., doi: https://doi.org/10.31223/osf.io/p73ae.
King, T. R., M. C. Quigley, and D. Clark (2019) Review paper: The 20th May 2016 Mw 6.1 Petermann surface rupturing earthquake, Australia, EarthArXiv Prepr., doi: https://doi.org/10.31223/osf.io/gbp9t.
v
Co-authored publications
In addition to the first-authored publications and preprints, Tamarah R King was a co-author
on multiple publications during the course of this PhD candidature, contributing material
related to research presented in this thesis. These co-authored papers are included in
Appendix B and listed below:
Published work:
Gold, R. D., D. Clark, W. D. Barnhart, T. R. King, M. C. Quigley, and R. W. Briggs,
(2019), Surface rupture and distributed deformation revealed by optical satellite
imagery: The intraplate 2016 Mw 6.0 Petermann Ranges earthquake, Australia,
Geophysical Research Letters, doi: https://doi.org/10.1029/2019GL084926.
Quigley, M. C., A. Jiménez, B. Duffy, and T. R. King, (2019), Physical and Statistical
Behaviour of Multifault Earthquakes : Darfield Earthquake Case Study, New
Zealand, Journal of Geophysical Research: Solid Earth, 124, doi:
https://doi.org/10.1029/2019JB017508.
Preprints:
Quigley, M. C., A. Jiménez, B. Duffy, and T. R. King (2018), An investigation of
multi-fault rupture scenarios using a variety of Coulomb stress modelling criteria:
methods paper and full results, EarthArXiv Preprints, doi:
https://doi.org/10.31223/osf.io/v8t3n.
In Review:
Attanayake, J., T. R. King, M. C. Quigley, G. Gibson, D. Clark, A. Jones, and M.
Sandiford, (2019), Rupture Characteristics and the Structural Control of the 2016
Mwp 6.1 Intraplate Earthquake in the Petermann Ranges, Australia, Bulletin of the
Seismological Society of America
These appendices items have been removed from the final library version of this thesis to avoid
copyright infringement.
Conference materials
Part of the work presented in this thesis was presented in a number of conference papers,
talks and posters during the course of the PhD candidature. These are summarised below:
Paper:
King, T. R., M. C. Quigley, and M. Sandiford, (2017), Near-source strong ground
motions inferred from displaced geologic objects, in Australian Earthquake Engineering
Society 2017 Conference, Nov 24-26, Canberra, ACT.
Talk:
King, T. R., M. C. Quigley, M. Sandiford, and D. Clark, (2019), Strong ground
shaking and the absence thereof: insights from displaced and fragile geologic objects

vi
in remote Australia, in 2019 Southern California Earthquake Center (SCEC) Annual
Meeting.
Gibson, G., and T. R. King, (2016), The Petermann ranges Mw 6.1 Earthquake of
2016-05-20 1814 UTC and its aftershocks, in Australian Earthquake Engineering Society
2016 Conference, Nov 25-27, Melbourne, Vic.
Poster:
King, T. R., M. C. Quigley, and D. Clark, (2019), Surface-rupturing earthquakes in
Australia: bedrock controls on multi-fault reverse ruptures and near-field strong
ground motion effects (Poster), in 2019 Southern California Earthquake Center (SCEC)
Annual Meeting.
King, T. R., (2016), Precariously balanced rocks and other palaeoseismic proxies
across Australia, in Neotectonics of the Australian Plate: new science for energy, mineral and
groundwater systems, and hazard assessment, 29 Feb to 1 March 2016, Geoscience
Australia, Canberra.
Gold, R., D. Clark, T. R. King, and M. C. Quigley, (2017), Surface rupture and
vertical deformation associated with 20 May 2016 M6 Petermann Ranges earthquake,
Northern Territory, Australia, in European Geosciences Union General Assembly: Vienna,
Austria.
Funding
The research conducted during this PhD candidature was funded through the Australian
Research Council Discovery Grant #DP170103350.
This PhD candidature was supported by the Australian Government Research Training
Program Scholarship. Part of the field work and research presented here-in was also
supported by a Baragwanath Travel Scholarship.

vii
Acknowledgments
Firstly, I would like to acknowledge: the Jawoyn people of the Katherine region; Antakirinja,
Yankunytjatjara, and Pitjantjatjara people of the Western Desert and APY lands in South
Australia / Northern Territory; Noongar people of south-west Western Australia; the
Warumungu people of Tennant Creek; and the Wurundjeri people of the Melbourne area, as
the traditional custodians of the land on which all historic surface ruptures occurred, where
the data described in this thesis were collected, on whose land I was born and raised, and
where I currently live and work. I strongly believe that earth sciences research in Australia
can only be strengthened by listening to, and actively engaging with, the custodians who have
lived on this land for over 60,000 years, and I hope to always pursue my research in a way
that is considerate of the history and culture preserved in our landscapes.
I was raised in a remote outback town, Katherine NT, an environment that offered incredible
freedom, adventure, and cultural connection, but relatively limited academic education. I’ve
encountered so many challenging and steep learning curves since arriving in Melbourne a
decade ago. Throughout, I have retained a deep appreciation for the outback Australian
landscapes I grew up in, which ultimately led to this PhD uncovering how those ‘ancient’
landscapes are actively evolving and changing. The path from Katherine to submitting my
PhD has been challenging, but so rewarding. That journey wouldn’t have been possible
without the support of a huge number of people, some of whom are mentioned below.
This thesis wouldn’t have been completed without Mark Quigley’s support and supervision.
Aside from the knowledge about earthquakes and tectonics I’ve picked up, Mark has taught
me how to have confidence in my own abilities, to be less stubborn when I’m wrong
(however begrudgingly), and the value of supportive networks for when I reach the limit of
my abilities. Mark’s confidence is wholly un-Australian (no tall-poppy syndrome in sight!),
and his influence led me into opportunities I wouldn’t have dreamed of including an
unexpected (but highly enjoyable) set of children’s science TV appearances and a whole sub-
career as a drone instructor. I’ve no doubt that without his mentorship, I wouldn’t have
achieved half the things I’ve done in the past few years, and I wouldn’t be heading into
incredible future opportunities. I’ll thoroughly miss being an active member of Team Quigs.
I’m doubtful I would have started a PhD if it weren’t for Mike Sandiford convincing me it
was a good idea. Since 2012 when I started my masters research, Mike has provided
opportunities that I wouldn’t have dreamt of striving for, and pushed me to try new things
that I felt were far outside my academic abilities. I’m very glad he badgered me into a PhD,
and grateful he’s been around to offer advice and support through all the academic and
personal ups and downs of the past few years.
I’m very grateful to Dan Clark from Geoscience Australia for the countless hours he’s put
into helping me understand Australian earthquakes and faults. I can’t count the times he’s
pulled me up on an incorrect statement and dedicated his time to making sure I not only fix
it, but actually understand it. Dan is an incredible scientist, thoroughly dedicated to producing
the most accurate and beneficial work he can, and I look forward to many more years of

viii
being meticulously corrected by him. Additional thanks to Trevor Allen at Geoscience
Australia who’s been incredibly generous with his time and support throughout the years.
I owe my masters supervisors Janet Hergt and Steve Boger much of the credit for getting me
hooked on research. Steve’s enthusiasm for deciphering geological mysteries is contagious,
and Janet’s incredible career and mentorship inspired me to take the leap into academia when
I hadn’t considered it an option. I also want to thank Dave Phillips for his support during
my tenure as president of the Earth Sciences Postgraduate Group, Abaz Alimanovic for the
many years of sample prep support, the many professional staff who keep things functioning,
and all the postgrads and postdocs who make the research path so enjoyable. A huge thank
you to the other Team Quigs students Jessie Vermeer, Hiwa Mohammadi, Schirin Sellmann,
Kevin Kuang and Andrew Wilson, I thoroughly appreciate your support, jokes and debates.
And thank you to Januka Attanayake and Brendan Duffy for all your support and guidance
in deciphering research fields unfamiliar to me.
I doubt my family ever imagined I’d wind up studying geology, let alone finishing a PhD on
remote Australian earthquakes. However, they did encourage me from an early age to read
widely, have adventures, maintain strong relationships with diverse people, enjoy the thrill of
solving problems, find enjoyment in reading atlases (of all things), and pursue creative
musical pursuits despite a lack of any real talent. All of these childhood pursuits played some
role in my ability to apply myself to challenging research problems and I’m forever grateful
for the upbringing my parents provided for me and my siblings. A big thankyou also to my
in-law families, who have been incredibly supportive and welcoming (including providing
the Venus Bay beach house where half of this thesis was written!).
I’m sure my friends, particularly those who had the pleasure of completing undergrad with
me, would agree that while sufficiently capable at academic pursuits, I’m not always the
smartest person. I’m exceedingly grateful for all the times those friends have corrected me,
taught me, made me laugh, and encouraged me to try new things. While I might ruin many
things, thankfully I haven’t yet ruined those friendships. A specific thankyou to Laura
Spelbrink who has my own personal cheer squad for so many years now, and who introduced
me to The Neighbours, who extend beyond family-like ties into some wonderful multi-house
bond powered by impromptu dance parties, never ending tea, Boogie boogies, and entirely
unremarkable and wonderful home intrusions, all of which have kept me (mostly) sane.
And finally, to my number one supporter Fabian, without whom this PhD would never have
been finished. I maintain that you’re the smartest and nicest person in this relationship, and
I can never thank you enough for all the work you’ve put into the pages of this thesis. I
couldn’t imagine a better field-hand, your assistance and dedication know no bounds (just,
next time save your ribs rather than the purposefully robust field equipment). Thank you for
putting up with the highs and lows of this PhD, thank you for making sure I’m fed, thank
you for forcing me to go duck spotting whenever I needed it, thank you for arranging your
life plans so I could start this PhD, thank you for all the joyful moments we share during
even the hardest of times, thank you for letting me be with you through those hard times,
and thank you for all our future adventures together. This PhD is, at last, gottagotgone.
ix
Table of Contents
Abstract ............................................................................................................................................ i
Declaration .....................................................................................................................................ii
Preface ........................................................................................................................................... iii
Acknowledgments ...................................................................................................................... vii
Table of Contents ........................................................................................................................ ix
List of Tables ............................................................................................................................. xiii
List of Figures ............................................................................................................................ xiv
CHAPTER 1. Introduction .......................................................................................................... 1
CHAPTER 2. Earthquake environmental effects produced by the Mw 6.1, 20th May
2016 Petermann earthquake, Australia .......................................................................................... 4
Abstract .......................................................................................................................................... 4
2.1. Background ....................................................................................................................... 5
2.1.1. Introduction .............................................................................................................. 5
2.1.2. Seismotectonic setting ............................................................................................. 7
2.1.3. Seismology ................................................................................................................ 7
2.1.4. Geology ..................................................................................................................... 8
2.1.5. Geography ................................................................................................................. 8
2.2. Observed Environmental Effects .................................................................................. 9
2.2.1. Data collection and field seasons ........................................................................... 9
2.2.2. Surface rupture ....................................................................................................... 10
2.2.3. Cracking ................................................................................................................... 12
2.2.4. Polygonal cracking ................................................................................................. 14
2.2.5. Outcrop damage ..................................................................................................... 15
2.2.6. Vegetation ............................................................................................................... 17
2.2.7. Holes ........................................................................................................................ 18
2.3. Degradation of observed environmental effects ....................................................... 19
2.4. Discussion ....................................................................................................................... 21
2.4.1. Environmental Seismic Intensity of the Petermann earthquake ..................... 21
2.4.2. ESI-07 scale as a palaeoseismic tool .................................................................... 24
2.5. Conclusion ....................................................................................................................... 28
x
CHAPTER 3. Near-field directionality of earthquake strong ground motions measured
by displaced geological objects ..................................................................................................... 30
Abstract ........................................................................................................................................ 30
3.1. Introduction .................................................................................................................... 30
3.2. Background ..................................................................................................................... 32
3.2.1. Dynamic and static ‘pulse-like’ near-field strong ground motions ................. 32
3.2.2. Prior studies of coseismically displaced objects ................................................ 35
3.2.3. Seismotectonic setting and Australian ground motion prediction equations 36
3.2.4. Geology and geography of the 2016 Petermann earthquake .......................... 39
3.3. Methods ........................................................................................................................... 40
3.3.1. Field-work ............................................................................................................... 40
3.3.2. Measurement of data of interest .......................................................................... 43
3.4. Results .............................................................................................................................. 45
3.4.1. Data reduction ........................................................................................................ 45
3.4.2. Spatial distribution of measurements .................................................................. 47
3.4.3. Number of chips per location .............................................................................. 47
3.4.4. Chip movement relative to InSAR deformation field and along-rupture
vertical offset .......................................................................................................................... 49
3.4.5. Chip movement relative to surface rupture ....................................................... 49
3.4.6. Sequentially displaced chips .................................................................................. 55
3.5. Discussion ....................................................................................................................... 56
3.5.1. Schematic model for the 3D directionality field of a simplified reverse
earthquake ............................................................................................................................... 57
3.5.2. Interpretation of dynamic and static directionality from displaced chips...... 59
3.5.3. Hypocentre location and rupture directivity constrained by displaced chips 61
3.5.4. Estimates of ground motions resulting in coseismic rock displacement ....... 65
3.6. Conclusions ..................................................................................................................... 69
CHAPTER 4. Characterising surface rupture complexity and recurrence of the 2016 MW
6.1 Petermann earthquake ............................................................................................................. 70
Abstract ........................................................................................................................................ 70
4.1. Introduction .................................................................................................................... 70
4.1.1. Surface rupture mapping ....................................................................................... 71
4.1.2. Cosmogenic nuclide dating of earthquake recurrence ...................................... 73
4.2. Methods ........................................................................................................................... 75
xi
4.2.1. Field observations .................................................................................................. 75
4.2.2. Drone data .............................................................................................................. 76
4.2.3. QGIS mapping and data reduction ..................................................................... 79
4.2.4. Cosmogenic nuclide erosion rates ....................................................................... 80
4.3. Results .............................................................................................................................. 84
4.3.1. Drone results .......................................................................................................... 84
4.3.2. Primary surface rupture and secondary fracture mapping ............................... 92
4.3.3. Kinematics of the Petermann surface rupture ................................................. 108
4.3.4. Trench logs ........................................................................................................... 111
4.3.1. Cosmogenic nuclide erosion rates ..................................................................... 112
4.4. Discussion ..................................................................................................................... 115
4.4.1. Rupture characterisation with field, drone and InSAR datasets ................... 115
4.4.2. Distribution of secondary deformation features relative to surface geology
118
4.4.3. Rupture kinematics and relation to direction of SHMax .................................... 119
4.4.4. Recurrence history of the Petermann faults ..................................................... 120
4.5. Conclusions ................................................................................................................... 122
CHAPTER 5. Surface-Rupturing Historical Earthquakes in Australia and Their
Environmental Effects: New Insights from Re-Analyses of Observational Data .............. 124
Abstract ...................................................................................................................................... 124
5.1. Introduction .................................................................................................................. 125
5.2. Review Data, Methods and Terminology ................................................................. 129
5.3. Results ............................................................................................................................ 131
5.3.1. Geology ................................................................................................................. 131
5.3.2. Seismology ............................................................................................................ 135
5.3.3. Surface Ruptures .................................................................................................. 136
5.3.4. Environmental Damage ...................................................................................... 146
5.3.5. Paleoseismology and Slip Rate ........................................................................... 146
5.4. Discussion-Lessons from the Last 50 Years of Australian Surface Ruptures ..... 150
5.4.1. Inconsistencies in Data Use ............................................................................... 150
5.4.2. Surface rupture Bedrock Controls, Updated Datasets and Environmental
Intensity 151
5.4.3. Recurrence of Historic Surface Ruptures and Implications for Hazard
Modelling .............................................................................................................................. 153

xii
5.5. Conclusions ................................................................................................................... 156
CHAPTER 6. Conclusions ...................................................................................................... 157
REFERENCES ............................................................................................................................. 159
Appendix A: First Author Preprint Papers .............................................................................. 183
1. Review paper: The 14th October 1968 Mw 6.6 Meckering surface rupturing earthquake,
Australia ..................................................................................................................................... 184
2. Review paper: The 10th March 1970 Mw 5.0 Calingiri surface rupturing earthquake,
Australia ..................................................................................................................................... 208
3. Review paper: The 2nd June 1979 MW 6.1 Cadoux surface rupturing earthquake, Australia
..................................................................................................................................................... 221
4. Review paper: The 30th March 1986 Mw 5.7 Marryat Creek surface rupturing earthquake,
Australia ..................................................................................................................................... 239
5. The 1987 to 2019 Tennant Creek, Australia, earthquake sequence: a protracted
intraplate multi-mainshock sequence .................................................................................... 255
6. Review paper: The 23rd March 2012 Mw 5.2 Pukatja surface rupturing earthquake,
Australia ..................................................................................................................................... 286
7. Review paper: The 20th May 2016 Mw 6.1 Petermann surface rupturing earthquake,
Australia ..................................................................................................................................... 297
References ................................................................................................................................. 311
Appendix B: Co-Authored Papers and Pre-Prints ................................................................... 319
1. Gold et al. (2019) Surface rupture and distributed deformation revealed by optical
satellite imagery: The intraplate 2016 Mw 6.0 Petermann Ranges earthquake, Australia
..................................................................................................................................................... 319
2. Attanayake et al. (2019) Rupture Characteristics and the Structural Control of the 2016
Mwp 6.1 Intraplate Earthquake in the Petermann Ranges, Australia ............................... 319
3. Quigley et al. (2019) Physical and Statistical Behaviour of Multifault Earthquakes :
Darfield Earthquake Case Study ............................................................................................ 319
3. Quigley et al. (2018) An investigation of multi-fault rupture scenarios using a variety of
Coulomb stress modelling criteria: methods paper and full results .................................. 319
xiii
List of Tables
Table 2.1. Classifications used to attribute observed EEEs to ESI-07 categories ................ 21
Table 3.1. Data collected from GPS-located photographs ....................................................... 44
Table 3.2. Summary of mid- to highest-confidence data by location ...................................... 48
Table 4.1. Summary data for each 2016 drone flight and 3D model ...................................... 78
Table 4.2. Sample details ................................................................................................................ 82
Table 4.3. Sample processing and analysis data .......................................................................... 83
Table 4.4. Summary data of 2016 drone DEMs and orthomosaics ........................................ 84
Table 4.5. Erosion rate results ..................................................................................................... 114
Table 5.1. Summary of known historic Australian surface rupturing earthquakes and relevant
references. ...................................................................................................................................... 126
Table 5.2. Relevant literature for each surface rupture ........................................................... 126
Table 5.3. Summary of data sources used in reviewing Australian historic surface ruptures.
......................................................................................................................................................... 128
Table 5.4. Literature references for each Table ........................................................................ 130
Table 5.5. Summary of regional geology for each historic surface rupture. ......................... 132
Table 5.6. Degree of alignment between rupture, basement structures, and geophysical
anomalies ........................................................................................................................................ 133
Table 5.7. Summary of seismological data and interpretations for each rupture. ............... 137
Table 5.8. Summary of surface measurements for each rupture. ........................................... 138
Table 5.9. Summary of environmental effects described for each rupture .......................... 147
Table 5.10. Summary of available paleoseismic trenching. ..................................................... 148
Table 5.11. Maximum slip rates based on minimum and maximum bedrock erosion rates
......................................................................................................................................................... 149
Table 5.12. Comparisons between calculated magnitude, area and displacement ............... 154

xiv
List of Figures
Figure 2.1. Seismotectonic maps describing the 2016 Petermann earthquake ........................ 6
Figure 2.2. Distribution of observed EEEs around the 2016 Petermann earthquake surface
rupture ................................................................................................................................................ 9
Figure 2.3. Timeline of field–work methods and observations following the 20th May 2016
Petermann earthquake .................................................................................................................... 10
Figure 2.4. Rupture styles observed along the Petermann scarp ............................................. 11
Figure 2.5. Observed cracking surrounding the Petermann surface rupture ......................... 13
Figure 2.6. Polygonal cracking around harder patches of sand observed following the
Petermann earthquake .................................................................................................................... 15
Figure 2.7. Outcrop damage observed following the Petermann earthquake ........................ 16
Figure 2.8. Minor tree damage observed following the Petermann earthquake .................... 17
Figure 2.9. Major tree damage observed following the Petermann earthquake .................... 18
Figure 2.10. Denudation and changes along the Petermann surface rupture ........................ 20
Figure 2.11. Environmental Seismic Intensity contour map of observed EEEs following the
Petermann earthquake. ................................................................................................................... 22
Figure 2.12. (a) The observed maximum distance from the Petermann surface rupture for
each category of EEE .................................................................................................................... 23
Figure 2.13. Conceptual charts showing the preservation and observability of EEEs through
time.................................................................................................................................................... 25
Figure 2.14. Expected change to the Petermann earthquake ESI contour map at 50 and 1000
years post event ............................................................................................................................... 26
Figure 3.1. Flow chart of classification of recorded strong ground motions ......................... 33
Figure 3.2 Map of Australian seismotectonic setting and local geology and geography of the
Petermann earthquake .................................................................................................................... 37
Figure 3.3. Maps of identified infrastructure damage showing potential directionality of
strong ground motions in the near-field (< 10 km) of the 1968 MW 6.6 Meckering and 1979
MW 6.1 Cadoux earthquakes .......................................................................................................... 39
Figure 3.4. Example photos of displaced chips and outcrops across the Petermann area. . 42
Figure 3.5. Graphs comparing the difference between the cleaned dataset, and the total
dataset. .............................................................................................................................................. 45
Figure 3.6. Rose diagrams showing distribution of trend data across confidence levels for
coseismic movement and selection of chip origin, and outcrop height/dip. ......................... 46
Figure 3.7. Schematic diagrams of circular statistics for rose diagrams, and strike vs. fault
relative movement descriptions .................................................................................................... 50
Figure 3.8. Map of the spatial distribution of chip measurements around the Petermann
surface rupture. ................................................................................................................................ 51
Figure 3.9. Zoomed in maps of chip data locations relative to visible surface rupture and
measured vertical offsets ................................................................................................................ 52
Figure 3.10. Grid showing direction and distance rose diagrams for each location. ............ 54
Figure 3.11. Images and map for the three identified multi-directional outcrops ................. 56
xv
Figure 3.12. 3D model showing an idealized reverse fault earthquake rupture and the
resulting motions ............................................................................................................................. 58
Figure 3.13. Various ways of interpreting and representing directionality of chip data ....... 60
Figure 3.14 Models for seismic wave, fling, and one-sided pulse related chip displacement
from a proposed hypocenter location slightly north-west of the center of PF East ............ 63
Figure 3.15. Chip direction maps from Figure 3.13 projected onto 3D models of the
Petermann faults (PF East, PF West) and Woodroffe Thrust ................................................. 64
Figure 3.16. Schematic of projectile trajectories of chip displacement from in-situ bedrock
........................................................................................................................................................... 68
Figure 4.1. Damaged bedrock outcrops ...................................................................................... 74
Figure 4.2. Overall map of the Petermann surface rupture area .............................................. 75
Figure 4.3. Example of misidentification of vegetation-related linear features as fracture
traces on Worldview imagery ........................................................................................................ 76
Figure 4.4. Map of the ten 2016 drone flights as labelled for Table 4.1. ................................ 77
Figure 4.5. Example of bowl effects for a 2016 drone-derived DEM .................................... 79
Figure 4.6. Map of sample locations, photos of each sample and outcrop ............................ 81
Figure 4.7. Uncertainty data for each drone flight (1 to 10) from Agisoft Photoscan
Processing Report ........................................................................................................................... 85
Figure 4.8. Comparison of satellite and drone derived products ............................................. 86
Figure 4.9. Hill-shaded drone derived DEM of Zone 1 ........................................................... 87
Figure 4.10. Hill-shaded drone derived DEM of Zone 2 ......................................................... 88
Figure 4.11. Hill-shaded drone derived DEM of Zone 3 ......................................................... 88
Figure 4.12. Hill-shaded drone derived DEM of Zone 4 ......................................................... 89
Figure 4.13. Hill-shaded drone derived DEM of Zone 5 ......................................................... 89
Figure 4.14. Hill-shaded drone derived DEM of Zone 6 ......................................................... 90
Figure 4.15. Hill-shaded drone derived DEM of Zone 7 ......................................................... 90
Figure 4.16. Hill-shaded drone derived DEM of Zone 8 ......................................................... 91
Figure 4.17. Hill-shaded drone derived DEM of Zone 9 ......................................................... 91
Figure 4.18. Hill-shaded drone derived DEM of Zone 10 ....................................................... 92
Figure 4.19. All mapping results across the 2016 Petermann rupture. ................................... 93
Figure 4.20. Mapping results from Zone 1. ................................................................................ 94
Figure 4.21. Mapping results from Zone 2. ................................................................................ 95
Figure 4.22. Mapping results from Zone 3. ................................................................................ 96
Figure 4.23. Mapping results from Zone 4. ................................................................................ 97
Figure 4.24. Mapping results from Zone 5. ................................................................................ 98
Figure 4.25. Mapping results from Zone 6. ................................................................................ 99
Figure 4.26. Mapping results from Zone 7. .............................................................................. 100
Figure 4.27. Mapping results from Zone 8. .............................................................................. 101
Figure 4.28. Mapping results from Zone 9. .............................................................................. 102
Figure 4.29. Mapping results from Zone 10. ............................................................................ 103
Figure 4.30. Mapping results from Zone 11. ............................................................................ 104
Figure 4.31. Probability density functions and cumulative distribution functions for distance
of secondary fractures .................................................................................................................. 105
xvi
Figure 4.32. Interpolation maps of fracture distance and length ........................................... 106
Figure 4.33. Ground water boreholes close to the 2016 Petermann surface rupture ......... 107
Figure 4.34. Graphs of fracture length and distance from the closest point of primary surface
rupture ............................................................................................................................................ 108
Figure 4.35. Schematic of expected orientation of fractures .................................................. 109
Figure 4.36. The orientation of mapped primary surface rupture and secondary fracturing
relative to SHMax and published focal mechanism ...................................................................... 110
Figure 4.37. Kinematic analysis of mapped fracture features ................................................. 111
Figure 4.38. Photos and trench logs for (a) Trench 1 and (b) Trench 2. .............................. 113
Figure 4.39. 10Be erosion rate results .......................................................................................... 114
Figure 4.40. Comparison of data from the Petermann earthquake with relationships from
Livio et al. (2017), Leonard (2010) and Leonard (2014) ......................................................... 117
Figure 5.1. Map of Australia ........................................................................................................ 127
Figure 5.2. Examples of the relationship between geophysical data and surface outcrop to
historic ruptures ............................................................................................................................ 134
Figure 5.3. 1968 Mw 6.6 Meckering earthquake ....................................................................... 140
Figure 5.4. 1970 Mw 5.0 Calingiri earthquake .......................................................................... 141
Figure 5.5. 1979 Mw 6.1 Cadoux earthquake ........................................................................... 142
Figure 5.6. 1986 Mw 5.7 Marryat Creek earthquake ................................................................ 143
Figure 5.7. 1988 Mw 6.3 (TC1), 6.4 (TC2) and 6.6 (TC3) Tennant Creek earthquakes ..... 144
Figure 5.8. 2008 Mw 4.7 Katanning earthquake ....................................................................... 144
Figure 5.9. 2012 Mw 5.2 Pukatja / Ernabella earthquake ....................................................... 145
Figure 5.10. 2016 Mw 6.1 Petermann earthquake .................................................................... 145
1
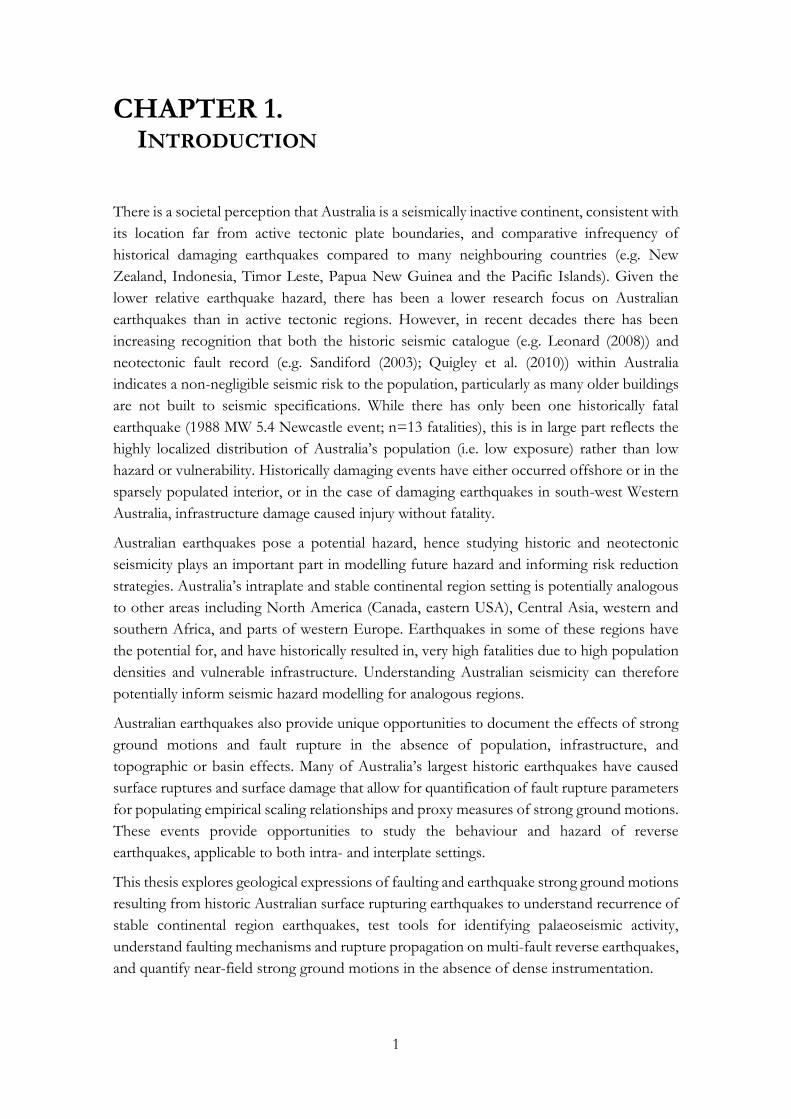
CHAPTER 1. INTRODUCTION
There is a societal perception that Australia is a seismically inactive continent, consistent with
its location far from active tectonic plate boundaries, and comparative infrequency of
historical damaging earthquakes compared to many neighbouring countries (e.g. New
Zealand, Indonesia, Timor Leste, Papua New Guinea and the Pacific Islands). Given the
lower relative earthquake hazard, there has been a lower research focus on Australian
earthquakes than in active tectonic regions. However, in recent decades there has been
increasing recognition that both the historic seismic catalogue (e.g. Leonard (2008)) and
neotectonic fault record (e.g. Sandiford (2003); Quigley et al. (2010)) within Australia
indicates a non-negligible seismic risk to the population, particularly as many older buildings
are not built to seismic specifications. While there has only been one historically fatal
earthquake (1988 MW 5.4 Newcastle event; n=13 fatalities), this is in large part reflects the
highly localized distribution of Australia’s population (i.e. low exposure) rather than low
hazard or vulnerability. Historically damaging events have either occurred offshore or in the
sparsely populated interior, or in the case of damaging earthquakes in south-west Western
Australia, infrastructure damage caused injury without fatality.
Australian earthquakes pose a potential hazard, hence studying historic and neotectonic
seismicity plays an important part in modelling future hazard and informing risk reduction
strategies. Australia’s intraplate and stable continental region setting is potentially analogous
to other areas including North America (Canada, eastern USA), Central Asia, western and
southern Africa, and parts of western Europe. Earthquakes in some of these regions have
the potential for, and have historically resulted in, very high fatalities due to high population
densities and vulnerable infrastructure. Understanding Australian seismicity can therefore
potentially inform seismic hazard modelling for analogous regions.
Australian earthquakes also provide unique opportunities to document the effects of strong
ground motions and fault rupture in the absence of population, infrastructure, and
topographic or basin effects. Many of Australia’s largest historic earthquakes have caused
surface ruptures and surface damage that allow for quantification of fault rupture parameters
for populating empirical scaling relationships and proxy measures of strong ground motions.
These events provide opportunities to study the behaviour and hazard of reverse
earthquakes, applicable to both intra- and interplate settings.
This thesis explores geological expressions of faulting and earthquake strong ground motions
resulting from historic Australian surface rupturing earthquakes to understand recurrence of
stable continental region earthquakes, test tools for identifying palaeoseismic activity,
understand faulting mechanisms and rupture propagation on multi-fault reverse earthquakes,
and quantify near-field strong ground motions in the absence of dense instrumentation.
2
Results from this work will inform ideas on how best to represent seismic hazard in an
intraplate stable continental region, provide data for use in understanding the underlying
tectonic mechanisms of intraplate stable continental region seismicity, and test analytical
tools for identifying neotectonic earthquake activity within the arid bedrock dominated
landscapes of Australia.
The thesis is presented in six chapters comprising an introduction, four main research
chapters, and a combined discussion and conclusion.
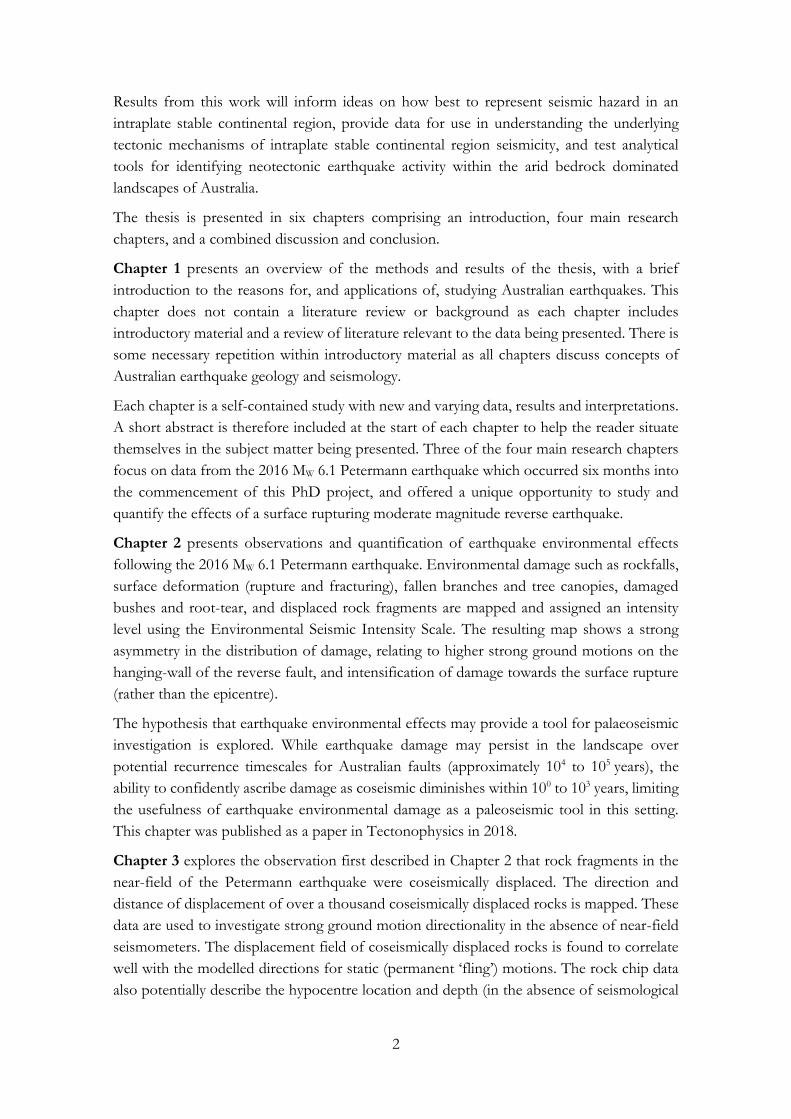
Chapter 1 presents an overview of the methods and results of the thesis, with a brief
introduction to the reasons for, and applications of, studying Australian earthquakes. This
chapter does not contain a literature review or background as each chapter includes
introductory material and a review of literature relevant to the data being presented. There is
some necessary repetition within introductory material as all chapters discuss concepts of
Australian earthquake geology and seismology.
Each chapter is a self-contained study with new and varying data, results and interpretations.
A short abstract is therefore included at the start of each chapter to help the reader situate
themselves in the subject matter being presented. Three of the four main research chapters
focus on data from the 2016 MW 6.1 Petermann earthquake which occurred six months into
the commencement of this PhD project, and offered a unique opportunity to study and
quantify the effects of a surface rupturing moderate magnitude reverse earthquake.
Chapter 2 presents observations and quantification of earthquake environmental effects
following the 2016 MW 6.1 Petermann earthquake. Environmental damage such as rockfalls,
surface deformation (rupture and fracturing), fallen branches and tree canopies, damaged
bushes and root-tear, and displaced rock fragments are mapped and assigned an intensity
level using the Environmental Seismic Intensity Scale. The resulting map shows a strong
asymmetry in the distribution of damage, relating to higher strong ground motions on the
hanging-wall of the reverse fault, and intensification of damage towards the surface rupture
(rather than the epicentre).
The hypothesis that earthquake environmental effects may provide a tool for palaeoseismic
investigation is explored. While earthquake damage may persist in the landscape over
potential recurrence timescales for Australian faults (approximately 104 to 105 years), the
ability to confidently ascribe damage as coseismic diminishes within 100 to 103 years, limiting
the usefulness of earthquake environmental damage as a paleoseismic tool in this setting.
This chapter was published as a paper in Tectonophysics in 2018.
Chapter 3 explores the observation first described in Chapter 2 that rock fragments in the
near-field of the Petermann earthquake were coseismically displaced. The direction and
distance of displacement of over a thousand coseismically displaced rocks is mapped. These
data are used to investigate strong ground motion directionality in the absence of near-field
seismometers. The displacement field of coseismically displaced rocks is found to correlate
well with the modelled directions for static (permanent ‘fling’) motions. The rock chip data
also potentially describe the hypocentre location and depth (in the absence of seismological

3
controls), bi-lateral rupture propagation, and support the interpretation that rupture
propagated across a two fault system.
The observations and interpretations from these geological strong ground motion proxies
has the potential to improve understanding of near-field dynamic and static pulse-like strong
ground motions, with important implications for understanding and modelling near-field
seismic hazard to infrastructure.
Chapter 4 presents fine-scale mapping of the Petermann surface rupture and explores the
recurrence of earthquakes on the Petermann fault. The Petermann event was the first
Australian surface rupture to be documented using an Unmanned Aerial Vehicle (drone),
and the methods and results of this work are presented. Fine-scale mapping of the primary
surface rupture, secondary fracturing and surface geology (using field, drone, and satellite
derived datasets) show that surface geology imparted a primary control on how surface
deformation was expressed. Trenching of the Petermann surface rupture, cosmogenic
erosion rates from samples across the region of the 2016 surface rupture, topographic data,
and fine-scale surface geology mapping strongly supports an absence of prior surface rupture
on the Petermann fault since 200 – 400 ka. The 2016 earthquake is hypothesized to be the
first event to rupture this fault in the near surface with implications for how earthquake
science understands fault maturity, recurrence behaviour and hazard analysis in intraplate
and stable continental regions.
Chapter 5 collates and reviews geological, geophysical, seismological and paleoseismic data
for ten of the eleven historic Australian surface rupturing earthquakes. This data is used to
analyse the prevailing characteristic of these events and their environmental effects, and
presents new length and net-slip values for each event for use in magnitude – source – size
– displacement scaling equations. The results show all earthquakes involved co-seismic
reverse faulting on single or multiple (1 – 6) discrete faults (as distinguished by orientation
criteria) which align with pre-existing Precambrian bedrock structures (foliations and/or
quartz veins and/or intrusive boundaries and/or pre-existing faults). No available
paleoseismic, topographic or geomorphic evidence provides conclusive evidence for prior
neotectonic rupture on any of the historically surface rupturing faults. These results suggest
that in the context of the Australia Precambrian crust, active fault catalogues may not
accurately predict future seismic hazard. This chapter was published as a paper in
Geosciences in 2019.
Chapter 6 summarises and integrates the data and results presented in Chapters 2 to 5 to
provide a framework for understanding fault behaviour and strong ground motion
characteristics for surface rupturing earthquakes within bedrock dominated, intraplate stable
continental regions.

4
CHAPTER 2. EARTHQUAKE ENVIRONMENTAL EFFECTS
PRODUCED BY THE MW 6.1, 20TH MAY 2016
PETERMANN EARTHQUAKE, AUSTRALIA
This chapter is a reproduction of this paper:
King, T.R., Quigley, M.C., Clark, D. (2018). Earthquake environmental effects produced by
the Mw 6.1, 20th May 2016 Petermann earthquake, Australia. Tectonophysics 747–748,
357–372. https://doi.org/10.1016/j.tecto.2018.10.010
The paper has been reformatted in the following ways:
• Changes to heading, figure and table numbers;
• Minor changes to figure and table captions to better summarise the content within
the Lists of Tables and Figures (pages xiii and xiv respectively);
• Reference list is incorporated into the overall thesis reference list
All other content in this chapter is reproduced as accepted by the journal.
Abstract
Earthquake Environmental Effects (EEEs) identified in the source region of the 20th May
2016 intraplate moment magnitude (Mw) 6.1 Petermann earthquake in Central Australia are
described and classified using the Environmental Seismic Intensity (ESI-07) scale. EEEs
include surface rupture, ground fissures and cracks, vegetation damage, rockfalls, and
displaced (jumped) bedrock fragments. The maximum ESI intensity derived from EEEs is
X, consistent with previous observations from some moderate Mw crustal earthquakes.
Maximum ESI isoseismals correlate with the location of the surface rupture rather than
epicentre area due to the dipping geometry of the reverse source fault. ESI isoseismals
encompass a larger area of the hanging-wall than the footwall, indicating stronger ground
motions on the hanging-wall due to increased proximity to the rupture source and ground
motion amplification effects. The maximum areal extent of secondary (seismic shaking-
induced) EEEs (300 km2) is significantly smaller than expected using the published ESI-07
scale (approx. 5000 km2). This relates to the low topographic relief and relatively
homogeneous bedrock geology of the study region, which (i) reduced the potential for site
response amplification of strong ground motions, and (ii) reduced the susceptibility of the
landscape to EEE such as landsliding and liquefaction. Erosional degradation of the
observed EEE features and decreasing confidence with which they can be uniquely
attributed to a seismic origin with increasing time since the earthquake highlight challenges
in using many of the natural features observed herein to characterise the locations and
attributes of paleo-earthquakes.
5
2.1. Background
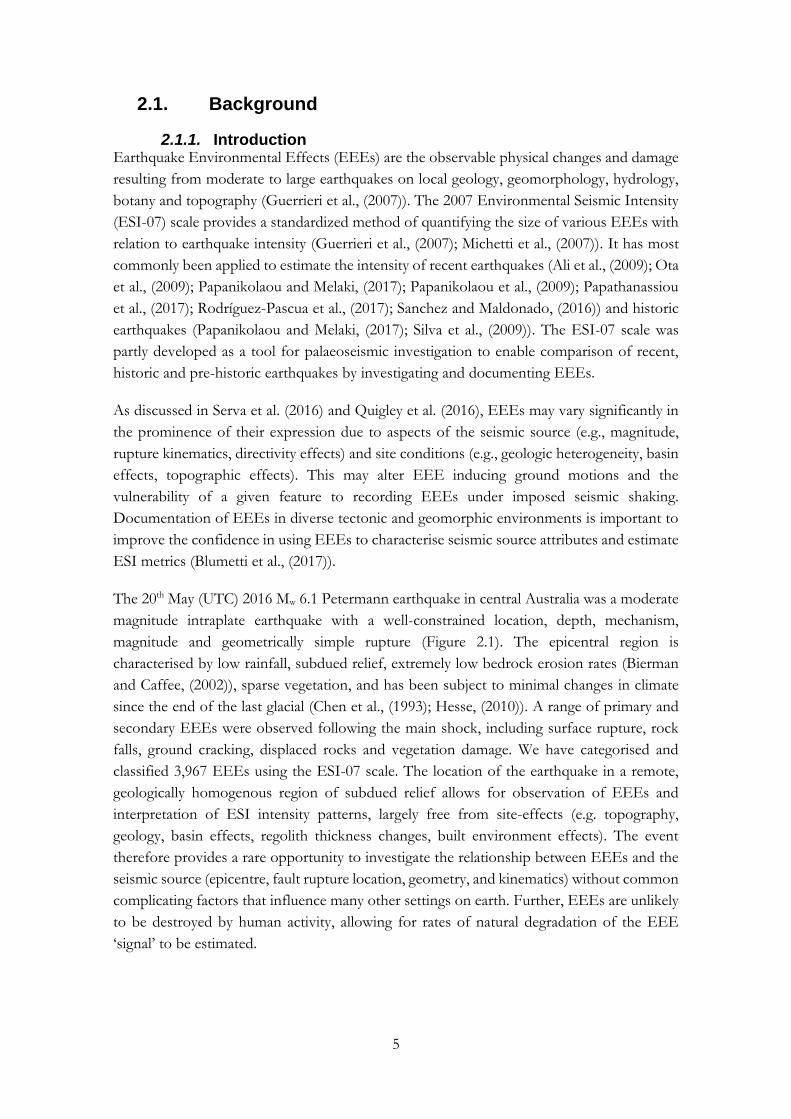
2.1.1. Introduction Earthquake Environmental Effects (EEEs) are the observable physical changes and damage
resulting from moderate to large earthquakes on local geology, geomorphology, hydrology,
botany and topography (Guerrieri et al., (2007)). The 2007 Environmental Seismic Intensity
(ESI-07) scale provides a standardized method of quantifying the size of various EEEs with
relation to earthquake intensity (Guerrieri et al., (2007); Michetti et al., (2007)). It has most
commonly been applied to estimate the intensity of recent earthquakes (Ali et al., (2009); Ota
et al., (2009); Papanikolaou and Melaki, (2017); Papanikolaou et al., (2009); Papathanassiou
et al., (2017); Rodríguez-Pascua et al., (2017); Sanchez and Maldonado, (2016)) and historic
earthquakes (Papanikolaou and Melaki, (2017); Silva et al., (2009)). The ESI-07 scale was
partly developed as a tool for palaeoseismic investigation to enable comparison of recent,
historic and pre-historic earthquakes by investigating and documenting EEEs.
As discussed in Serva et al. (2016) and Quigley et al. (2016), EEEs may vary significantly in
the prominence of their expression due to aspects of the seismic source (e.g., magnitude,
rupture kinematics, directivity effects) and site conditions (e.g., geologic heterogeneity, basin
effects, topographic effects). This may alter EEE inducing ground motions and the
vulnerability of a given feature to recording EEEs under imposed seismic shaking.
Documentation of EEEs in diverse tectonic and geomorphic environments is important to
improve the confidence in using EEEs to characterise seismic source attributes and estimate
ESI metrics (Blumetti et al., (2017)).
The 20th May (UTC) 2016 Mw 6.1 Petermann earthquake in central Australia was a moderate
magnitude intraplate earthquake with a well-constrained location, depth, mechanism,
magnitude and geometrically simple rupture (Figure 2.1). The epicentral region is
characterised by low rainfall, subdued relief, extremely low bedrock erosion rates (Bierman
and Caffee, (2002)), sparse vegetation, and has been subject to minimal changes in climate
since the end of the last glacial (Chen et al., (1993); Hesse, (2010)). A range of primary and
secondary EEEs were observed following the main shock, including surface rupture, rock
falls, ground cracking, displaced rocks and vegetation damage. We have categorised and
classified 3,967 EEEs using the ESI-07 scale. The location of the earthquake in a remote,
geologically homogenous region of subdued relief allows for observation of EEEs and
interpretation of ESI intensity patterns, largely free from site-effects (e.g. topography,
geology, basin effects, regolith thickness changes, built environment effects). The event
therefore provides a rare opportunity to investigate the relationship between EEEs and the
seismic source (epicentre, fault rupture location, geometry, and kinematics) without common
complicating factors that influence many other settings on earth. Further, EEEs are unlikely
to be destroyed by human activity, allowing for rates of natural degradation of the EEE
‘signal’ to be estimated.
6
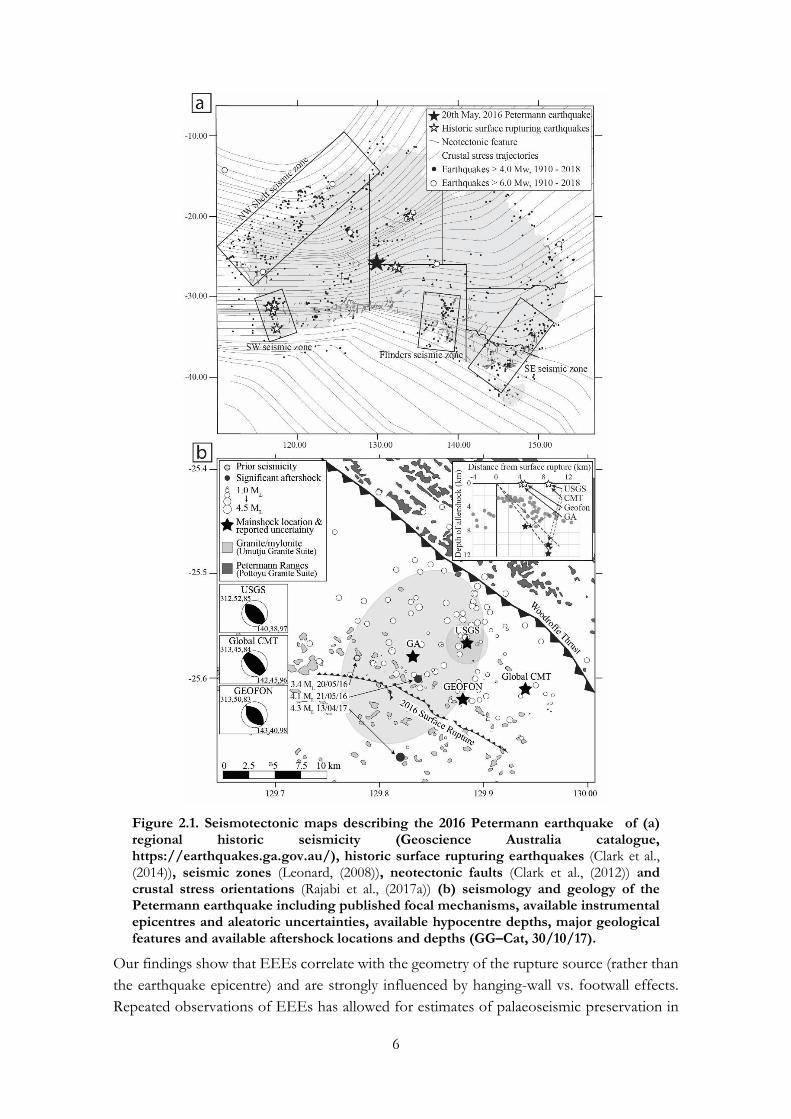
Figure 2.1. Seismotectonic maps describing the 2016 Petermann earthquake of (a) regional historic seismicity (Geoscience Australia catalogue, https://earthquakes.ga.gov.au/), historic surface rupturing earthquakes (Clark et al., (2014)), seismic zones (Leonard, (2008)), neotectonic faults (Clark et al., (2012)) and crustal stress orientations (Rajabi et al., (2017a)) (b) seismology and geology of the Petermann earthquake including published focal mechanisms, available instrumental epicentres and aleatoric uncertainties, available hypocentre depths, major geological features and available aftershock locations and depths (GG–Cat, 30/10/17).
Our findings show that EEEs correlate with the geometry of the rupture source (rather than
the earthquake epicentre) and are strongly influenced by hanging-wall vs. footwall effects.
Repeated observations of EEEs has allowed for estimates of palaeoseismic preservation in

7
this slow changing environment, with implications for EEE preservation in more
geomorphically active regions.
2.1.2. Seismotectonic setting Australia is a stable continental region within the Indo-Australian plate, with distant active
plate boundaries. The most recently published Australian stress map (Rajabi et al., (2017b))
demonstrates a variably orientated crustal stress field (Figure 2.1a) aligned with convergent
Indo-Australian plate boundaries. Australia experiences a > Mw 6.0 earthquake every 8 years
on average (Leonard, (2008)) with 12 recorded events since 1910 (Figure 2.1a). Half of these
have occurred in the cratonic continental interior, remote from previously recognised zones
of high seismic activity (Leonard, (2008)) (Figure 2.1a). There have been eight documented
historic surface rupturing events (Figure 2.1a), ranging from the 1.6 km long 2012 Mw 5.4
Pukatja (Ernabella) earthquake (Clark et al., (2014)), to the 37 km long 1968 Mw 6.8
Meckering earthquake (Gordon and Lewis, (1980)).Historic surface ruptures have commonly
been complex multi-fault ruptures comprising dominantly reverse and minor strike-slip
movements depending upon the azimuthal angle between the fault orientation and the
prevailing maximum horizontal present-day stress field (Clark and McCue, (2003)).
Detailed palaeoseismic investigations in Australia have focused on areas that correspond with
topographic anomalies and higher historic seismicity, as well as being in regions that are
relatively easy to access for trenching and field investigations (Clark et al., (2011a); Quigley
et al., (2010)). Neotectonic structures and folds have been identified based on clear structural
evidence, traditional geomorphic markers such as offset geomorphology/waterways and
young talus slopes (Clark et al., (2008); Crone et al., (2003); Quigley et al., (2010)), offset and
warping within Miocene and younger sedimentary packages (Holdgate et al., (2008), (2003);
Mcpherson et al., (2014); Wallace et al., (2005)), and anomalous weathering rates across
topographic features (Quigley et al., (2007a), (2007b)). Several hundred potential surface
rupturing neotectonic faults have been identified in SRTM digital elevation models and other
data (Clark, (2010a); Clark et al., (2011b)). These are freely available from Geoscience
Australia’s neotectonic features database (http://pid.geoscience.gov.au/dataset/ga/71856)
(Figure 2.1a). Most have not been investigated in detail, due to remoteness and/or the low
societal perception of earthquake risk in intraplate regions.
Despite the large number of neotectonic structures identified, all historic surface rupturing
earthquakes have occurred on previously unknown cratonic faults with little to no prior
geomorphic or topographic expression. These events highlight the difficulty in identifying
active faults in intraplate settings using traditional palaeoseismic methods. EEEs potentially
provide an additional investigative tool.
2.1.3. Seismology The Petermann earthquake occurred near the Petermann Ranges of far south-west Northern
Territory. Ground movements woke residents 115 km away in Yulara (Uluru) and in remote
indigenous communities up to 250 km away. The United States Geological Survey (USGS)
reported Mw 6.0 and depth of 10 km (± 1.7 km), while Geoscience Australia (GA) reported
8
Mw 6.1 with no depth estimate (Figure 2.1b). The closest seismometers were located 166 km
west in Warakurna, Western Australia, and 505 km north-east in Alice Springs, Northern
Territory. Reported epicentral uncertainties are shown on Figure 2.1b.
High resolution aftershock data recorded on a temporary seismometer network are shown
on Figure 2.1b, obtained from GG-Cat (Allen et al., (2012)) accessed on the 30th October
2017. During the 15 months that the temporary seismometer network was deployed and
active, two > ML 4.0 aftershocks including a ML 4.3 on 13th April 2017 (11 months after the
mainshock) were recorded (Figure 2.1b). The only recorded earthquake in the area prior to
the 20th May 2016 mainshock was a ML 3.5 event on the 19th May 2016 (2 days before the
mainshock) ~10 km from the mainshock location (Figure 2.1b).
Available published moment tensors are included in Figure 2.1b. The Petermann earthquake
surface rupture has an average strike of ~294° and dips to the north-east (Figure 2.1b). Sixty-
five well located aftershocks with median aleatoric depth uncertainty of ±0.23 km are plotted
in Figure 2.1b alongside the USGS preferred nodal plane solution of 52°, and Global CMT
solution of 45°. The strike of the fault is orientated roughly perpendicular to calculated
crustal stress trajectories for the region (Rajabi et al., (2017b)).
2.1.4. Geology The 20th May 2016 Petermann earthquake occurred in the western Musgrave Block, a
Mesoproterozoic basement province that stretches across the Northern Territory/South
Australia border and into Western Australia, which formed predominately in the 580 - 520
Ma Petermann Orogeny (Edgoose et al., (2004)). Two large structures, the Woodroffe Thrust
and Mann Fault, dominated uplift and deformation during the Petermann Orogeny,
displacing mid to lower-crustal metamorphic units which now form the Petermann and
Mann Ranges. The 2016 Petermann earthquake ruptured through north-east dipping
mylonite in the hanging-wall of the south west dipping Woodroffe Thrust. The surface trace
of the Woodroffe Thrust is mapped ~10 km north-east of the 2016 rupture (Figure 2.1b).
2.1.5. Geography The Petermann earthquake occurred in vegetated desert punctuated by southeast-trending
mid- to late Pleistocene longitudinal dunes (Hesse, (2010)) up to several tens of kilometres
long and 2 - 10 m in height. Sand dunes are well vegetated with spinifex (Triodia) and mature
desert oak trees (Allocasuarina decaisneana) up to 10m high with a canopy diameter up to 20m.
Adjacent low-lying land is vegetated with spinifex, groves of mulga bush (Acacia aneura) and
sporadic desert oak trees (Robinson et al., (2003)).
Isolated granite and gneiss hills rise prominently up to 100m above the desert surface while
outcrops of mylonite occur locally in inter-dune regions, generally outcropping as multiple
outcrops each 1 - 10 m in diameter and <5 m high (Figure 2.1b and Figure 2.2). Sediments
overlying bedrock are typically skeletal and related to sheet-wash and aeolian processes,
except where Tertiary paleo-valley systems contain several tens of metres of fluvial, lacustrine
and chemical sediments (Bell et al., (2012)).
9
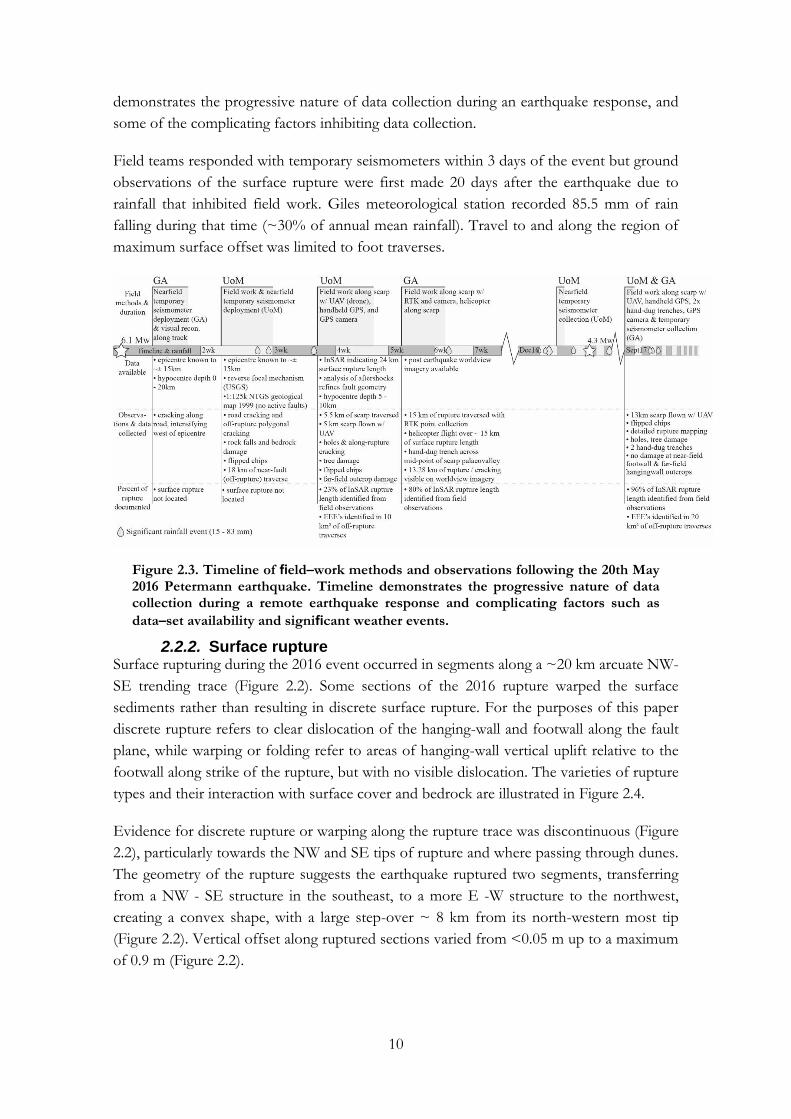
The area experienced abnormally high rainfall in the year following the 20th May 2016
earthquake with record high rainfall recorded by the Bureau of Meteorology (bom.gov.au)
for June 2016 (at Giles Meteorological Office, 172km north-west), August 2016 (at Yulara
Airport, 116 km north-east), and December 2016 (at Curtin Springs, 190 km east). The
months of May 2016, June 2016, December 2016 and January 2017 also saw the second
highest monthly rainfall recorded at Yulara since records began in 1983. In the immediate
vicinity of the fault, drainage from infrequent rains occurs in small inter-dune playas,
palaeovalleys and vehicle tracks.
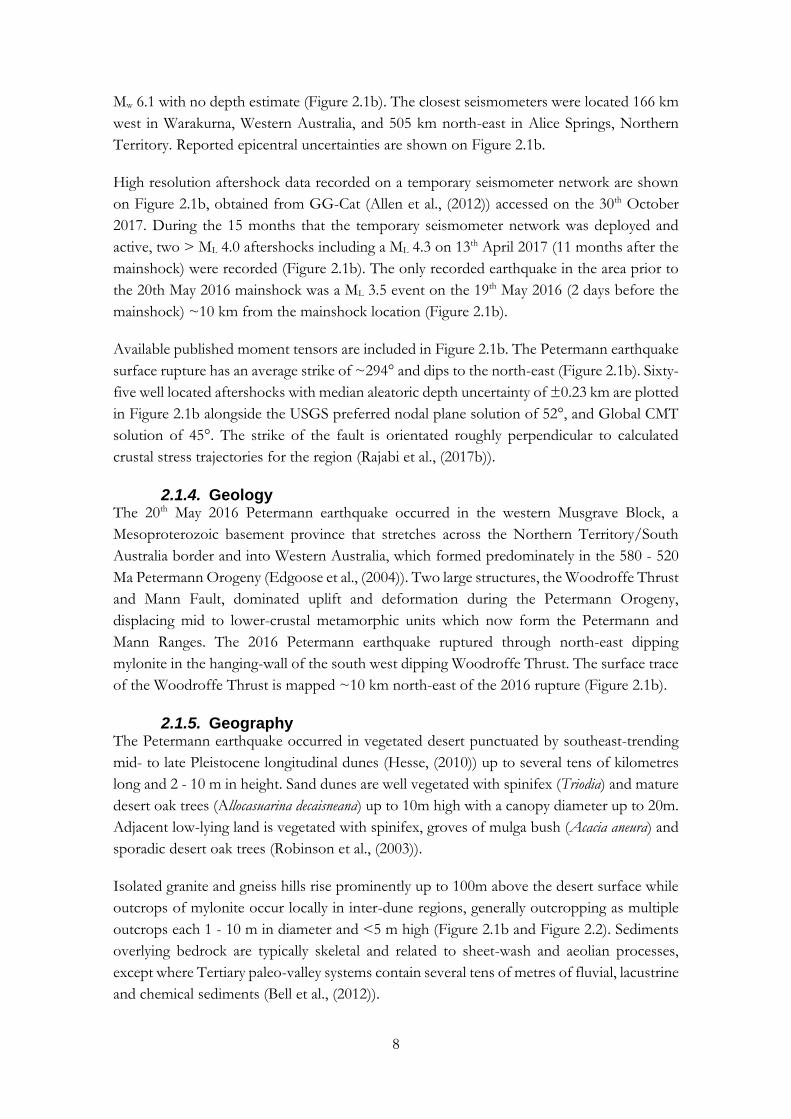
Figure 2.2. Distribution of observed EEEs around the 2016 Petermann earthquake surface rupture including extent of surface rupture deformation as observed on InSAR
and discrete surface rupture as observed in the field and satellite imagery. Drone imagery overlap from 2016 and 2017 provides comparison for denudation of EEEs.
Off–rupture cracking 2 are data observed 16 months after the mainshock, and potentially related to aftershocks.
2.2. Observed Environmental Effects
2.2.1. Data collection and field seasons The epicentral area was accessed via an unsealed access track (Figure 2.2) approximately 150
km from the town of Yulara (Uluru). A prompt field response was arranged to investigate
the epicentral region for a surface rupture and environmental damage, with a second season
completed 16 months after the event. All EEE data collected in this time is shown in Figure
2.2. Figure 2.3 summarises the field response including the duration of fieldwork, available
data at the time of field work, equipment used, and data collected. This summary
10
demonstrates the progressive nature of data collection during an earthquake response, and
some of the complicating factors inhibiting data collection.
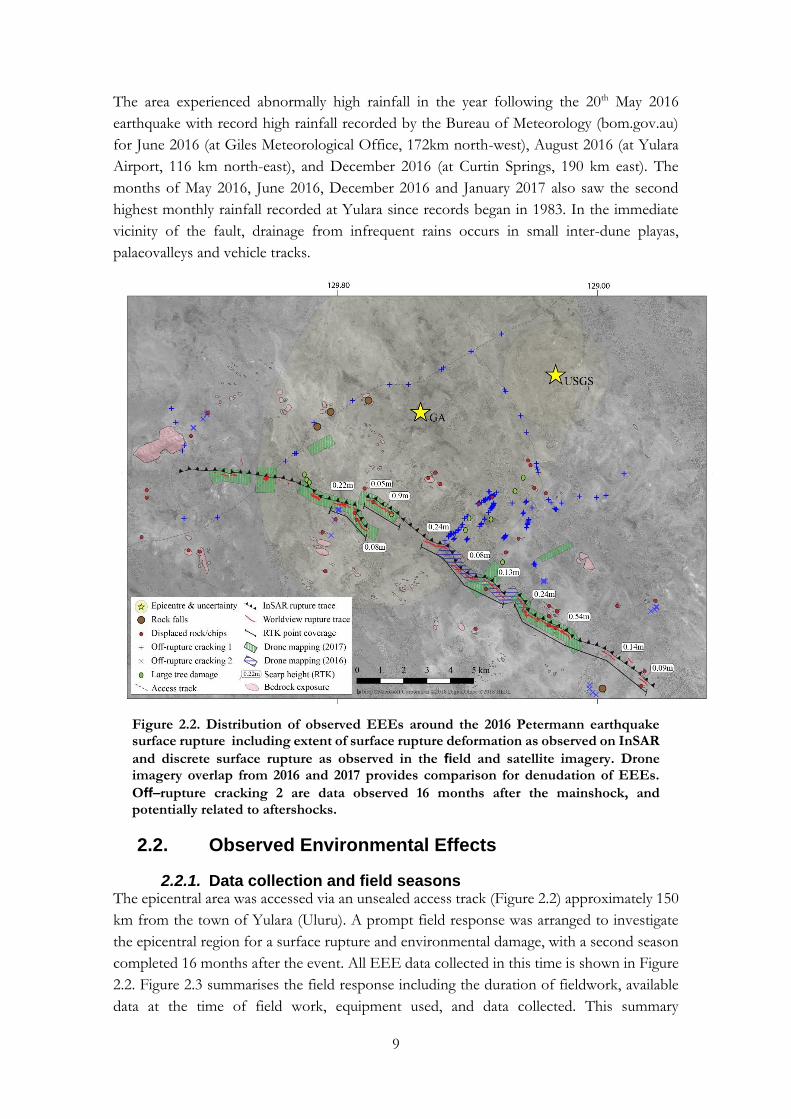
Field teams responded with temporary seismometers within 3 days of the event but ground
observations of the surface rupture were first made 20 days after the earthquake due to
rainfall that inhibited field work. Giles meteorological station recorded 85.5 mm of rain
falling during that time (~30% of annual mean rainfall). Travel to and along the region of
maximum surface offset was limited to foot traverses.
Figure 2.3. Timeline of field–work methods and observations following the 20th May 2016 Petermann earthquake. Timeline demonstrates the progressive nature of data collection during a remote earthquake response and complicating factors such as
data–set availability and significant weather events.
2.2.2. Surface rupture Surface rupturing during the 2016 event occurred in segments along a ~20 km arcuate NW-
SE trending trace (Figure 2.2). Some sections of the 2016 rupture warped the surface
sediments rather than resulting in discrete surface rupture. For the purposes of this paper
discrete rupture refers to clear dislocation of the hanging-wall and footwall along the fault
plane, while warping or folding refer to areas of hanging-wall vertical uplift relative to the
footwall along strike of the rupture, but with no visible dislocation. The varieties of rupture
types and their interaction with surface cover and bedrock are illustrated in Figure 2.4.
Evidence for discrete rupture or warping along the rupture trace was discontinuous (Figure
2.2), particularly towards the NW and SE tips of rupture and where passing through dunes.
The geometry of the rupture suggests the earthquake ruptured two segments, transferring
from a NW - SE structure in the southeast, to a more E -W structure to the northwest,
creating a convex shape, with a large step-over ~ 8 km from its north-western most tip
(Figure 2.2). Vertical offset along ruptured sections varied from <0.05 m up to a maximum
of 0.9 m (Figure 2.2).
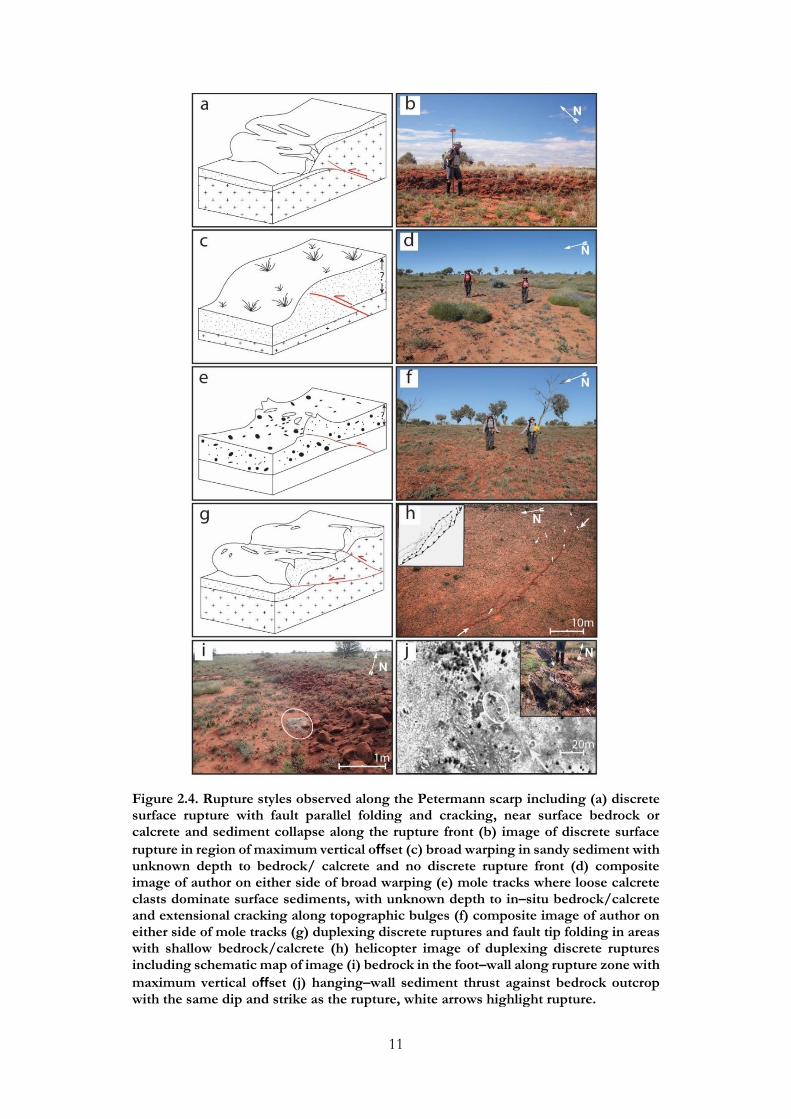
11
Figure 2.4. Rupture styles observed along the Petermann scarp including (a) discrete surface rupture with fault parallel folding and cracking, near surface bedrock or calcrete and sediment collapse along the rupture front (b) image of discrete surface
rupture in region of maximum vertical offset (c) broad warping in sandy sediment with unknown depth to bedrock/ calcrete and no discrete rupture front (d) composite image of author on either side of broad warping (e) mole tracks where loose calcrete clasts dominate surface sediments, with unknown depth to in–situ bedrock/calcrete and extensional cracking along topographic bulges (f) composite image of author on either side of mole tracks (g) duplexing discrete ruptures and fault tip folding in areas with shallow bedrock/calcrete (h) helicopter image of duplexing discrete ruptures including schematic map of image (i) bedrock in the foot–wall along rupture zone with
maximum vertical offset (j) hanging–wall sediment thrust against bedrock outcrop with the same dip and strike as the rupture, white arrows highlight rupture.

12
The magnitude of vertical offset and strike direction of the scarp varied over short distances,
typically corresponding with dune topographic or lithological changes (Figure 2.4). Vertical
offset maximums generally occurred in semi-consolidated sandy environments with bedrock
or calcrete at or near the surface (Figure 2.4a, b). In some areas broad warping is visible with
no discrete rupture of surface sediment (Figure 2.4c, d). In two locations on dune slopes
where loose calcrete clasts dominate the surface and subsurface, rupture consisted of
discontinuous topographic bulges (mole tracks) and extensional cracks (Figure 2.4e, f).
Hanging-wall sediments are thrust over bedrock outcrop in at least two locations (Figure
2.4i). In one instance, hanging-wall sediments are thrust against a ~ 1 m high mylonite
outcrop with a strike and dip that matches the 2016 rupture (Figure 2.4j).
Fault tip folding occurred on the hanging-wall within 5 m of discrete rupture along certain
sections (Figure 2.4g, h). Rupture parallel extensional cracking is associated with this folding.
Sections where discrete rupture and hanging-wall folding occurred generally ruptured
through flat intra-dune areas with more consolidated sheet-wash and aeolian sand/dust
surface cover and near-surface calcrete or bedrock. These long sections of surface rupture
often contain back-steps in rupture and multiple duplexing discrete ruptures (Figure 2.4h).
2.2.3. Cracking Coseismic extensional (Figure 2.5a,b), transtensional (Figure 2.5c,d), compressional (Figure
2.5e,f) and mole track (Figure 2.5e) cracking was observed along all mapped segments of the
surface rupture, and within 7 km from the surface rupture on the hanging-wall. Field
observations were obtained primarily along the trace of the surface rupture, on fault
perpendicular traverses, and on large outcrops at distances of 2 - 50 km from the scarp
(Figure 2.2). Cracks documented on traverses were only those large enough to be easily
observed between ground covering vegetation while walking. The dataset is therefore
incomplete spatially and in crack size across the area.
Edge collapse of extensional cracks due to rainfall and slope instability made these cracks the
most obvious, and therefore the most commonly documented. Compressional cracking (i.e.
pop-ups and mole-tracks) were less visible between the abundant low-growing spinifex and
grasses and easily destroyed by rainfall runoff and animal movement (camels, kangaroos,
dingos and various small marsupials). Most observed cracks occurred between dunes in silty
and/or clay-rich sands, clay-pans and playas, though some were also observed at the apex of
well vegetated and stable dunes included during the second field season over a year later.
Cracks along vehicular tracks often occurred on the soft sediment piled up to the verges
from annual maintenance (Figure 2.5h). These occurred parallel to the tracks which were
commonly perpendicular to the surface rupture, suggesting a rheological control (i.e. between
the firm track and the soft side sediment).

13
Figure 2.5. Observed cracking surrounding the Petermann surface rupture (a)
extensional cracks due to fault–tip folding (b) large extensional cracks/fissures at backward step of scarp (c) transpressional cracking with right lateral movement creating push–up along an extensional fault (d) transtensional cracking with right
lateral movement creating slightly offset extensional features (e) compressional pop–ups along access track (f) compressional pop–ups where surface sediment is dominated by calcrete clasts (Figure 2.4e) (g) minor cracking observed in 2016, potentially from aftershocks (h) cracking parallel to road (roughly perpendicular to rupture). All photos taken on the hanging–wall.
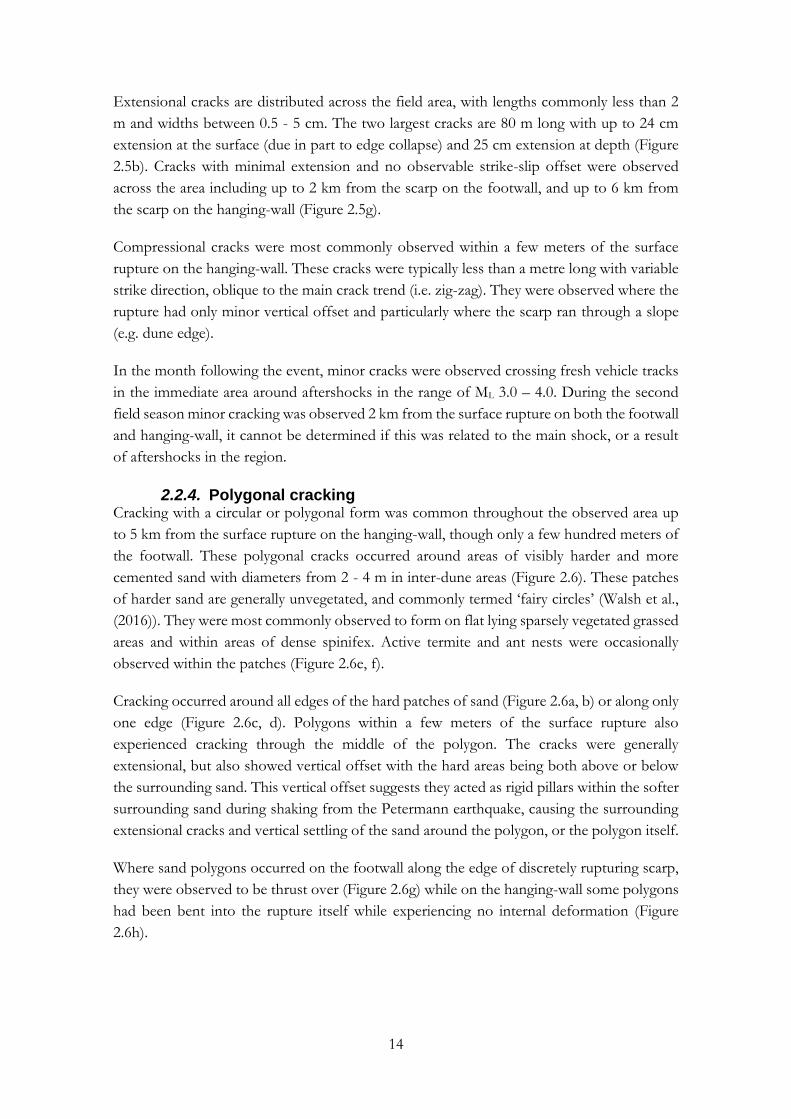
14
Extensional cracks are distributed across the field area, with lengths commonly less than 2
m and widths between 0.5 - 5 cm. The two largest cracks are 80 m long with up to 24 cm
extension at the surface (due in part to edge collapse) and 25 cm extension at depth (Figure
2.5b). Cracks with minimal extension and no observable strike-slip offset were observed
across the area including up to 2 km from the scarp on the footwall, and up to 6 km from
the scarp on the hanging-wall (Figure 2.5g).
Compressional cracks were most commonly observed within a few meters of the surface
rupture on the hanging-wall. These cracks were typically less than a metre long with variable
strike direction, oblique to the main crack trend (i.e. zig-zag). They were observed where the
rupture had only minor vertical offset and particularly where the scarp ran through a slope
(e.g. dune edge).
In the month following the event, minor cracks were observed crossing fresh vehicle tracks
in the immediate area around aftershocks in the range of ML 3.0 – 4.0. During the second
field season minor cracking was observed 2 km from the surface rupture on both the footwall
and hanging-wall, it cannot be determined if this was related to the main shock, or a result
of aftershocks in the region.
2.2.4. Polygonal cracking Cracking with a circular or polygonal form was common throughout the observed area up
to 5 km from the surface rupture on the hanging-wall, though only a few hundred meters of
the footwall. These polygonal cracks occurred around areas of visibly harder and more
cemented sand with diameters from 2 - 4 m in inter-dune areas (Figure 2.6). These patches
of harder sand are generally unvegetated, and commonly termed ‘fairy circles’ (Walsh et al.,
(2016)). They were most commonly observed to form on flat lying sparsely vegetated grassed
areas and within areas of dense spinifex. Active termite and ant nests were occasionally
observed within the patches (Figure 2.6e, f).
Cracking occurred around all edges of the hard patches of sand (Figure 2.6a, b) or along only
one edge (Figure 2.6c, d). Polygons within a few meters of the surface rupture also
experienced cracking through the middle of the polygon. The cracks were generally
extensional, but also showed vertical offset with the hard areas being both above or below
the surrounding sand. This vertical offset suggests they acted as rigid pillars within the softer
surrounding sand during shaking from the Petermann earthquake, causing the surrounding
extensional cracks and vertical settling of the sand around the polygon, or the polygon itself.
Where sand polygons occurred on the footwall along the edge of discretely rupturing scarp,
they were observed to be thrust over (Figure 2.6g) while on the hanging-wall some polygons
had been bent into the rupture itself while experiencing no internal deformation (Figure
2.6h).
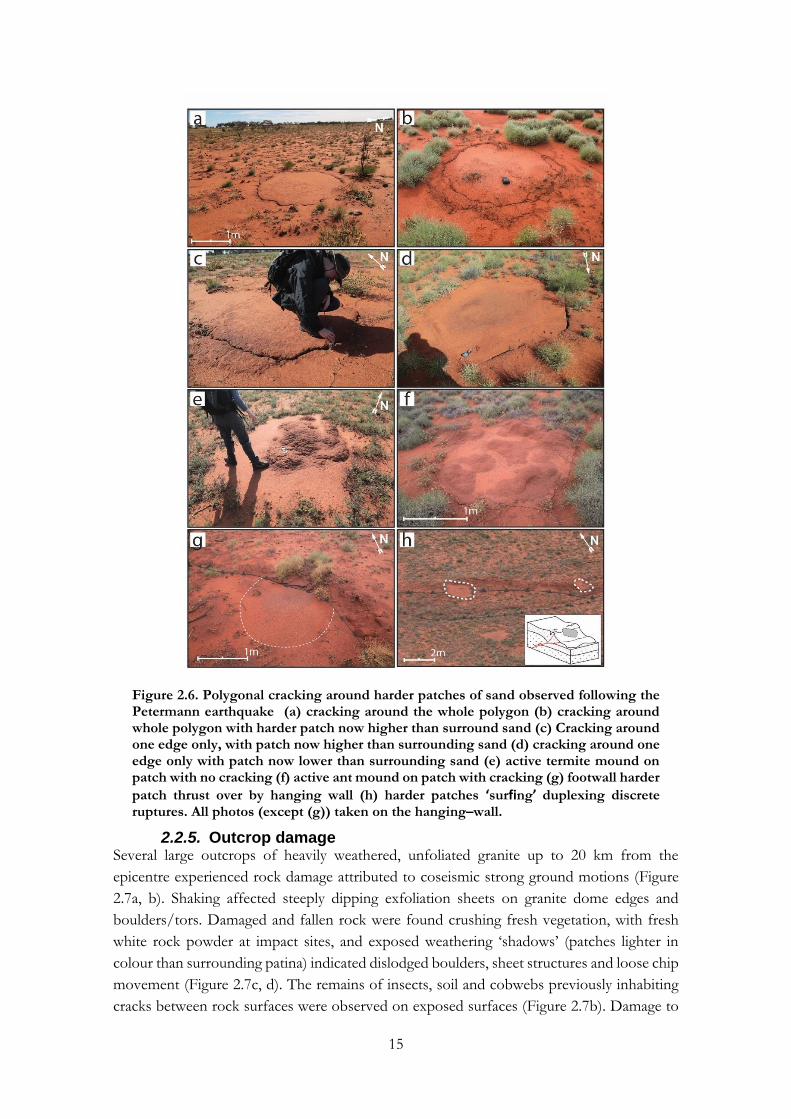
15
Figure 2.6. Polygonal cracking around harder patches of sand observed following the Petermann earthquake (a) cracking around the whole polygon (b) cracking around whole polygon with harder patch now higher than surround sand (c) Cracking around one edge only, with patch now higher than surrounding sand (d) cracking around one edge only with patch now lower than surrounding sand (e) active termite mound on patch with no cracking (f) active ant mound on patch with cracking (g) footwall harder
patch thrust over by hanging wall (h) harder patches ‘surfing’ duplexing discrete ruptures. All photos (except (g)) taken on the hanging–wall.
2.2.5. Outcrop damage Several large outcrops of heavily weathered, unfoliated granite up to 20 km from the
epicentre experienced rock damage attributed to coseismic strong ground motions (Figure
2.7a, b). Shaking affected steeply dipping exfoliation sheets on granite dome edges and
boulders/tors. Damaged and fallen rock were found crushing fresh vegetation, with fresh
white rock powder at impact sites, and exposed weathering ‘shadows’ (patches lighter in
colour than surrounding patina) indicated dislodged boulders, sheet structures and loose chip
movement (Figure 2.7c, d). The remains of insects, soil and cobwebs previously inhabiting
cracks between rock surfaces were observed on exposed surfaces (Figure 2.7b). Damage to

16
larger outcrops was most intense around the edges of outcrops where the outcrop dip is
highest.
Where outcrop damage was most severe, rockfalls consisted of sheeting structures (2-15 cm
thick), small boulders (40-60 cm diameter), parts of large boulders (20-50 cm thick) and
whole large boulders (60-150 cm diameter). Outcrops with minor damage lost near-vertical
sheeting structures and had occasional small boulder movement. At the most damaged
outcrops rock loss is estimated in the order of 30-50 m3 decreasing with distance from the
surface rupture to less than 10 m3 at outcrops with visible minor damage. Precarious perched
boulders of varying sizes (20-150 cm diameter) were observed on footwall outcrops 4 – 50
km from the surface rupture and 20 - 30 km on the hanging-wall.
Figure 2.7. Outcrop damage observed following the Petermann earthquake (a)
boulder fallen off the edge of a 5m high outcrop onto near–surface bedrock (b) block of outcrop broken along erosion cracks exposing insect nests previously living in the
cracks, without which the damage may not have been identified as recent (c)
exfoliation chips of low lying bedrock flipped and displaced due to earthquake (d)
displaced flipped chips of small low–lying bedrock outcrop. All photos taken on the hanging wall.
Small exfoliation chips of mylonite rock fragments with ~4 cm average thickness were found
dislodged and transported from their original locations (Figure 2.7c,d). The original location
of these chips was clear from damage and fresh dust at detachment sites on the outcrop and
chip, exposed weathering ‘shadows’ on the outcrop and under the surface of chips, and
imprinted sand where chips landed on the ground rather than outcrop. The most significant
movement included up to 100 cm horizontal distance with less than 50 cm vertical distance
between the original location and the ground. More commonly the range of movement was
10 - 40 cm horizontal and < 40 cm vertical distance. The trajectory required for the chips to
17
travel such distances from their original locations suggests a coseismic strong ground motion
origin (King et al., (2017)).
Figure 2.8. Minor tree damage observed following the Petermann earthquake (a) small bush collapsed in multiple directions due to strong ground motions (b) grove of immature desert oak trees along the surface rupture with browning leaves due to root–tear (c) and (d) bushes pushed over by hanging–wall rupture tree on hanging–wall rupture (e) cracking around the trunk of a small bush with no damage to the bush (f) and (g) tree on hanging–wall rupture with no damage (h) dying/dead tree on footwall with no other damage, unclear if health of tree is earthquake related.
2.2.6. Vegetation Notable damage observed to vegetation and large trees in the near-fault region included tall
shrubs fallen down (Figure 2.8a), bushes and young trees knocked over/split and killed by
surface rupture and subsurface root tear (Figure 2.8b,c,d), bark ‘exploded’ from sides of the
tree (Figure 2.9a,b), canopies broken off the trunk (Figure 2.9c,d), fallen fresh and dead limbs
of large desert oaks (Figure 2.9e), and a complete trunk split in half (Figure 2.9f). These
features were observed along the surface rupture, on the hanging-wall within 200 meters of
the surface rupture, or between step-overs of the scarp. This damage is attributed as
coseismic as the intensity and density of damage proximal to the rupture was not observed

18
at distance from the rupture during traverses. Coseismic damage to trees was not consistent
in expression along the surface rupture, with many trees, bushes and grasses in the same
vicinity as damaged vegetation exhibiting no structural or root damage despite being located
on fold structures, cracks, or adjacent to the surface rupture (Figure 2.8e, f,g,h). Many burnt-
out and dead trunks exist across the region and many of these were observed fallen on both
hanging-wall and footwall adjacent to the surface rupture. The age of these fallen and
damaged trunks is difficult to determine, they may not be coseismic.
Figure 2.9. Major tree damage observed following the Petermann earthquake (a) and (b) bark ‘exploded’ from tree in wrenching motion near hanging-wall rupture (c) and (d) tree canopies fallen from mature trees (e) large branch fallen from mature tree (f) large tree broken in two along trunk. All images taken on the hanging-wall.
2.2.7. Holes Several tens of holes were observed in close proximity or along the surface rupture on the
hanging-wall, distinct from deep extensional cracks due to the lack of clear
directivity/strike/elongation (images of holes available in supplementary material). Holes
were commonly less than 1 m diameter and 30 cm depth, with some reaching 3 m diameter
and 1 m depth. Holes were most common in inter-dune regions where surface sediment was
semi-consolidated and/or clay-rich. No evidence of pre-existing holes is observable in
available pre-earthquake satellite imagery of the area. These may represent patches of
‘collapsible soils’, sandy soils with an open unstable structure where clay, salt or carbonate
provide partial bonds between grains which collapse upon saturation and loading. These are

19
found most commonly in aeolian Pleistocene environments (Derbyshire et al., (2017);
Rogers, (1995)) such as those found in the Petermann area (Hesse, (2010)). Seismic stresses
have previously been suggested as potential triggers of collapse in unsaturated soils (Rogers,
(1995)). Dynamic stresses due to Petermann earthquake fault rupture propagation towards
the surface may have locally collapsed susceptible surface sediments along the hanging-wall.
Further testing of the soil would be required to confirm this theory for hole formation, as
opposed to the features relating to collapsed animal burrows or other potential mechanisms.
2.3. Degradation of observed environmental effects
Field work conducted 16 months after the earthquake found sheet-wash, footwall ponding
and vegetation growth had significantly obscured and lowered the surface rupture in areas of
low vertical offset (Figure 2.10a,b,c,d) and obscured much of the surface cracking around
the scarp. Many smaller extensional cracks were partially or completely in-filled by wind-
blown dust and animal movement, however larger cracks were mostly unchanged in the 16
months. Rills had formed across some areas of rupture within a few weeks of the earthquake
(Figure 2.10e) and minor gullies were locally cutting into the rupture 16 months later (Figure
2.10f).
Regional sand availability and transport is thought to be extremely low in upland desert
environments such as the Petermann dune system (Hesse, (2010)). Based on repeat
observations of holes created during the 2012 Mw 5.4 Pukatja earthquake (images available
in supplementary information), edge collapse and local sediment sheetwash are likely to infill
holes and fissures faster than regional sediment transport, within 102 years. We speculate that
the largest fissures and holes may infill in 103 years. No erosion rate data are known from the
granitic landscapes of the Petermann or Mann Ranges. However, cosmogenic radionuclide
erosion rates from weathered and sheeting granitic inselbergs from the semi-arid Eyre
Peninsula in South Australia provide an acceptable analogue in terms of rock type, outcrop
style and climate. Rates of 0.3 - 0.5 m Ma-1 on the top of outcrops, and up to 3.4-5.7 m Ma-1
for the lowest platforms of the inselbergs (Bierman and Caffee, (2002)) provide a basis to
estimate the rate of rock-related EEE degradation in the Petermann Ranges.
Fallen and damaged rocks are now located on sediment or bedrock surfaces and are thus
comparatively more susceptible to chemical and physical weathering than in-situ outcrop.
Based on erosion rates ranges of 0.3 – 5.7 Ma-1 for near-surface bedrock from Eyre Peninsula
inselbergs, these damaged rocks may be completely eroded within 3.5 – 66 Ka for 2 cm, and
263 – 5000 Ka for 150 cm thick rocks.
In contrast to the longevity of damaged rock (103 – 105 year timescales), evidence for the
coseismic nature of the damage such as crushed vegetation, clearly exposed weathering
‘shadows’, and fresh dust at detachment and impact sites is more transient. This evidence
was already difficult to identify a month after the event, and was only visible with careful
examination during the second field season.

20
Figure 2.10. Denudation and changes along the Petermann surface rupture (a) and (b) comparisons of 2016 and 2017 drone imagery showing i. abundant vegetation growth along the footwall where ponding was observed in 2016, and ii. new camel baths on the hanging–wall (c) and (d) discrete rupture near a hand trench from 2016 (redug in 2017) shows nearly complete denudation of the surface rupture front (e) erosional features along the rupture including i. rills pushing back into the hanging–wall ii. gulling across the hanging–wall and redeposits of sediment on the footwall iii. ponding of water along the rupture on the footwall (f) gully development along the rupture observed 16 months after mainshock after a year of record breaking rainfall events, no observable base level lowering from sheetwash.
The density and intensity of displaced chips around the surface rupture may be diagnostic of
coseismic damage for a considerable time until they erode away (103 - 104 years, based on the
above near-surface granitic erosion rate). However, a single displaced chip is not clearly
diagnostic of strong ground motion as animals, lightning and vegetation could conceivably
displace chips. During the second field season, post-rain ground-covering vegetation
obscured many of the displaced chips identified during the first field season.
Vegetation damage was preserved a year after the event, however the coseismic nature of the
damage was not as clear. Evidence of lost limbs and bark was obscured by ground cover or
weathered by rain, and dead bushes and trees were not clearly recent. We speculate that
broken canopies and large fallen limbs might withstand decay and bushfire effects for 101 -
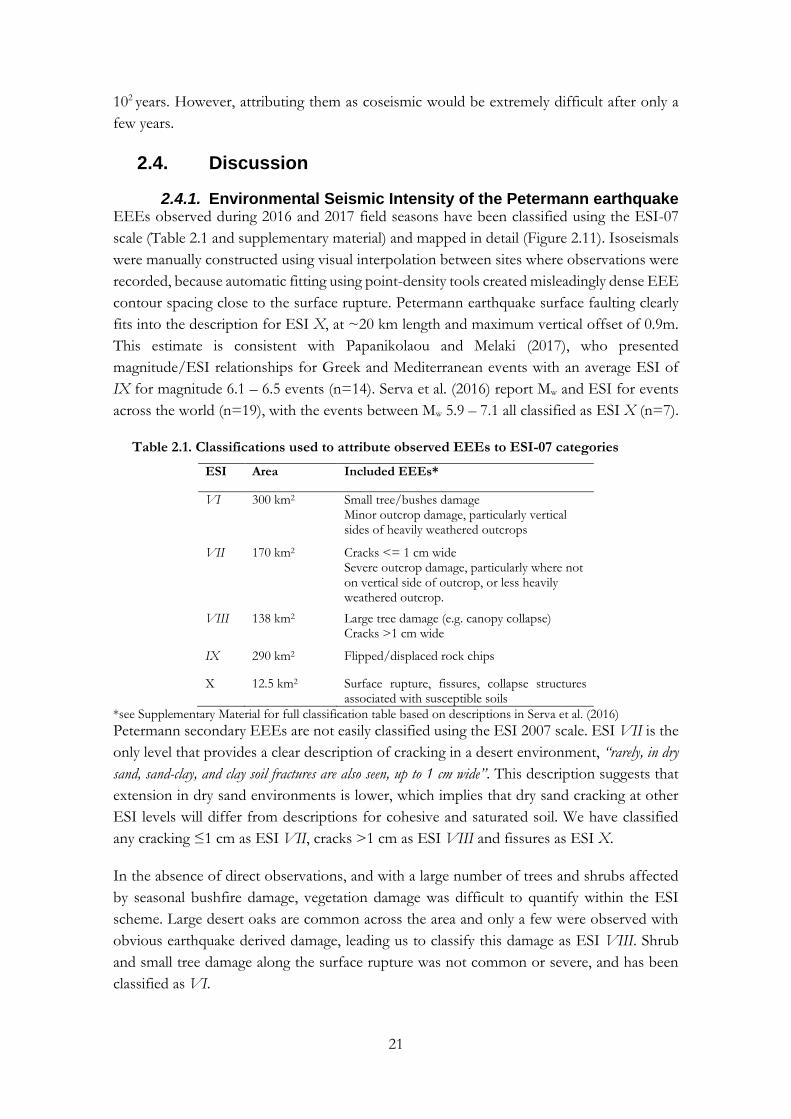
21
102 years. However, attributing them as coseismic would be extremely difficult after only a
few years.
2.4. Discussion
2.4.1. Environmental Seismic Intensity of the Petermann earthquake EEEs observed during 2016 and 2017 field seasons have been classified using the ESI-07
scale (Table 2.1 and supplementary material) and mapped in detail (Figure 2.11). Isoseismals
were manually constructed using visual interpolation between sites where observations were
recorded, because automatic fitting using point-density tools created misleadingly dense EEE
contour spacing close to the surface rupture. Petermann earthquake surface faulting clearly
fits into the description for ESI X, at ~20 km length and maximum vertical offset of 0.9m.
This estimate is consistent with Papanikolaou and Melaki (2017), who presented
magnitude/ESI relationships for Greek and Mediterranean events with an average ESI of
IX for magnitude 6.1 – 6.5 events (n=14). Serva et al. (2016) report Mw and ESI for events
across the world (n=19), with the events between Mw 5.9 – 7.1 all classified as ESI X (n=7).
Table 2.1. Classifications used to attribute observed EEEs to ESI-07 categories
ESI Area Included EEEs*
VI 300 km2 Small tree/bushes damage Minor outcrop damage, particularly vertical sides of heavily weathered outcrops
VII 170 km2 Cracks <= 1 cm wide Severe outcrop damage, particularly where not on vertical side of outcrop, or less heavily weathered outcrop.
VIII 138 km2 Large tree damage (e.g. canopy collapse) Cracks >1 cm wide
IX 290 km2 Flipped/displaced rock chips
X 12.5 km2 Surface rupture, fissures, collapse structures associated with susceptible soils
*see Supplementary Material for full classification table based on descriptions in Serva et al. (2016)
Petermann secondary EEEs are not easily classified using the ESI 2007 scale. ESI VII is the
only level that provides a clear description of cracking in a desert environment, “rarely, in dry
sand, sand-clay, and clay soil fractures are also seen, up to 1 cm wide”. This description suggests that
extension in dry sand environments is lower, which implies that dry sand cracking at other
ESI levels will differ from descriptions for cohesive and saturated soil. We have classified
any cracking ≤1 cm as ESI VII, cracks >1 cm as ESI VIII and fissures as ESI X.
In the absence of direct observations, and with a large number of trees and shrubs affected
by seasonal bushfire damage, vegetation damage was difficult to quantify within the ESI
scheme. Large desert oaks are common across the area and only a few were observed with
obvious earthquake derived damage, leading us to classify this damage as ESI VIII. Shrub
and small tree damage along the surface rupture was not common or severe, and has been
classified as VI.
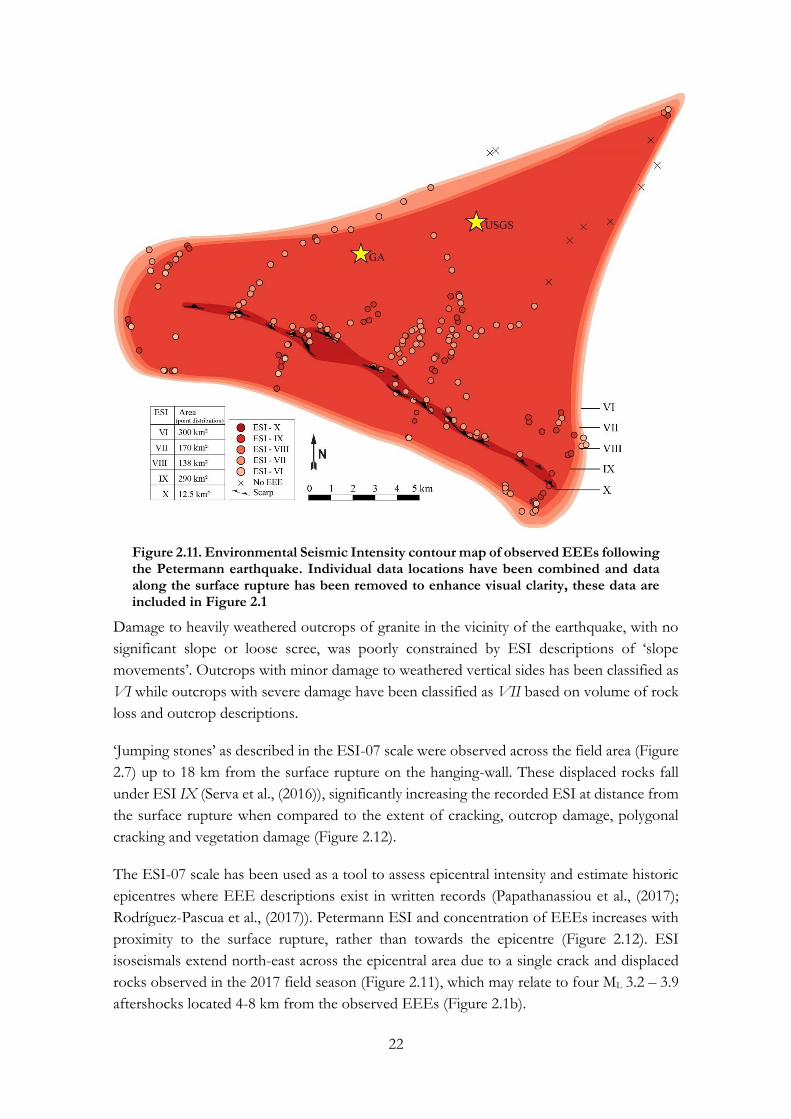
22
Figure 2.11. Environmental Seismic Intensity contour map of observed EEEs following the Petermann earthquake. Individual data locations have been combined and data along the surface rupture has been removed to enhance visual clarity, these data are included in Figure 2.1
Damage to heavily weathered outcrops of granite in the vicinity of the earthquake, with no
significant slope or loose scree, was poorly constrained by ESI descriptions of ‘slope
movements’. Outcrops with minor damage to weathered vertical sides has been classified as
VI while outcrops with severe damage have been classified as VII based on volume of rock
loss and outcrop descriptions.
‘Jumping stones’ as described in the ESI-07 scale were observed across the field area (Figure
2.7) up to 18 km from the surface rupture on the hanging-wall. These displaced rocks fall
under ESI IX (Serva et al., (2016)), significantly increasing the recorded ESI at distance from
the surface rupture when compared to the extent of cracking, outcrop damage, polygonal
cracking and vegetation damage (Figure 2.12).
The ESI-07 scale has been used as a tool to assess epicentral intensity and estimate historic
epicentres where EEE descriptions exist in written records (Papathanassiou et al., (2017);
Rodríguez-Pascua et al., (2017)). Petermann ESI and concentration of EEEs increases with
proximity to the surface rupture, rather than towards the epicentre (Figure 2.12). ESI
isoseismals extend north-east across the epicentral area due to a single crack and displaced
rocks observed in the 2017 field season (Figure 2.11), which may relate to four ML 3.2 – 3.9
aftershocks located 4-8 km from the observed EEEs (Figure 2.1b).
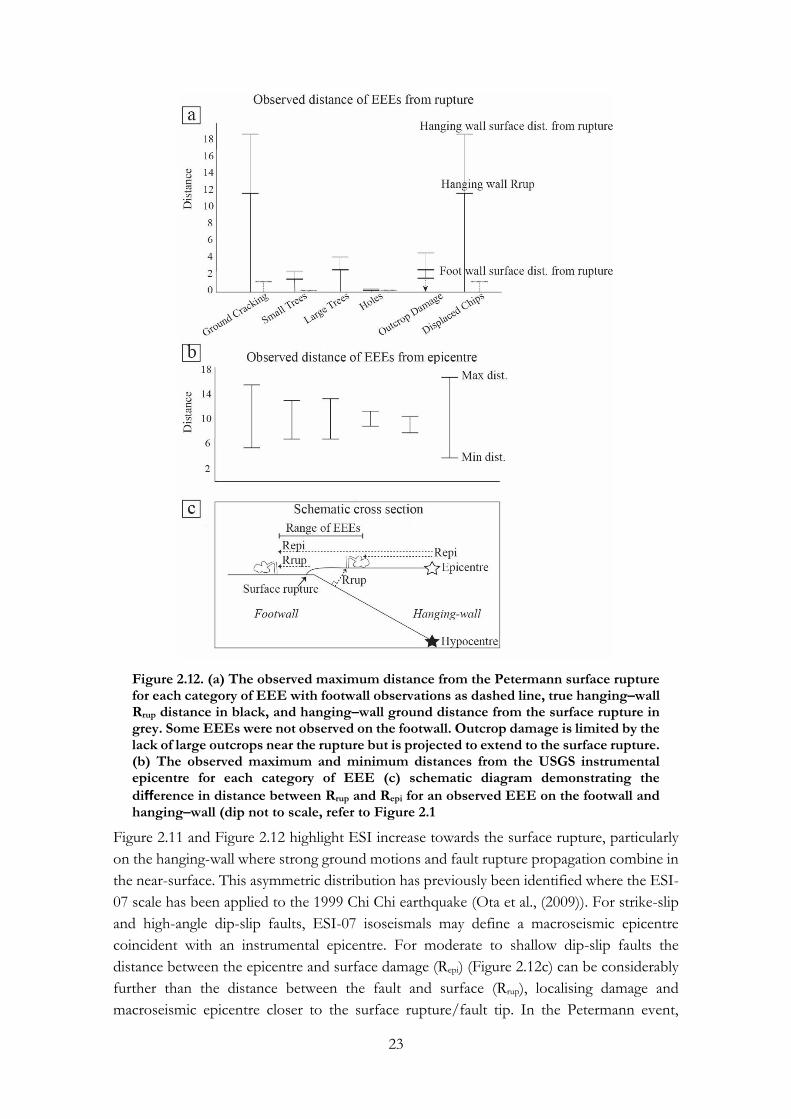
23
Figure 2.12. (a) The observed maximum distance from the Petermann surface rupture for each category of EEE with footwall observations as dashed line, true hanging–wall Rrup distance in black, and hanging–wall ground distance from the surface rupture in grey. Some EEEs were not observed on the footwall. Outcrop damage is limited by the lack of large outcrops near the rupture but is projected to extend to the surface rupture. (b) The observed maximum and minimum distances from the USGS instrumental epicentre for each category of EEE (c) schematic diagram demonstrating the
difference in distance between Rrup and Repi for an observed EEE on the footwall and hanging–wall (dip not to scale, refer to Figure 2.1
Figure 2.11 and Figure 2.12 highlight ESI increase towards the surface rupture, particularly
on the hanging-wall where strong ground motions and fault rupture propagation combine in
the near-surface. This asymmetric distribution has previously been identified where the ESI-
07 scale has been applied to the 1999 Chi Chi earthquake (Ota et al., (2009)). For strike-slip
and high-angle dip-slip faults, ESI-07 isoseismals may define a macroseismic epicentre
coincident with an instrumental epicentre. For moderate to shallow dip-slip faults the
distance between the epicentre and surface damage (Repi) (Figure 2.12c) can be considerably
further than the distance between the fault and surface (Rrup), localising damage and
macroseismic epicentre closer to the surface rupture/fault tip. In the Petermann event,

24
maximum ESI-07 isoseismials are within uncertainty bounds of instrumental epicentres, but
define the surface rupture rather than a macroseismic or instrumental epicentre.
Within the ESI-07 scale an earthquake of ESI X should affect an area in the order of 5,000
km2. The distribution of observed EEEs of the Petermann earthquake is an order of
magnitude lower, affecting just 300 km2 (Figure 2.11). In the absence of significant
topographic or soil-related site effects, the distribution of cracking, outcrop and vegetation
damage is limited to the near field region. Jumping stones extend further than other
secondary EEEs, particularly on the hanging-wall. These features are thought to be largely
controlled by first-motion fault directivity pulses related to fault rupture propagation along a
dipping plane (King et al., (2017); Somerville et al., (1997)). Almost all other lower ESI data
points are covered by the IX contour due to the displaced stones, with the area of ESI IX
significantly larger than that of ESI VIII and VII (Figure 2.11). Our observations suggest the
ESI-07 scale may overestimate the true intensity required to displace stones where strong
hanging-wall directivity is present. The ESI-07 scale includes many hydrological effects not
observable in the arid desert landscape which may have otherwise extended ESI isoseismals
out to larger distances.
2.4.2. ESI-07 scale as a palaeoseismic tool For the ESI-07 scale to be used for palaeoseismic investigations EEEs must remain
identifiable in the landscape on a timescale consistent with the return time of multiple strong
ground motion events at a given location. These palaeoseismic time scales are orders of
magnitude different depending on the tectonic setting, and the preservation of EEEs is
dependent on tectonic setting, local geography, geology and geomorphology. The
degradation of Petermann EEEs in an intraplate landscape that has experienced relatively
little change during the Holocene offers insight into the potential maximum longevity of
EEEs in more dynamic landscapes.
Three historic surface ruptures provide comparable geographic examples to assess the
longevity of the 2016 Petermann scarp; the 13 km long 1986 Mw 5.8 Marryat Creek (Machette
et al., (1993)), 32 km long 1988 Mw 6.7 Tennant Creek scarps (Bowman, (1992)) and 1.6 km
long 2012 Mw 5.4 Pukatja (Ernabella) Scarp (Clark et al., (2014)). Levelling data collected four
years after the Marryat Creek event (Machette et al., (1993)) showed 0.3 m of vertical offset
lost from the maximum offset of 0.9 m (the same maximum offset as the Petermann event).
Degradation was reported at a similar rate across the Tennant Creek scarp two years after its
formation (Clark and McCue, (2003)). No repeat survey has occurred along the Pukatja
surface rupture to document erosion of the 0.36-0.51 m high scarp (Clark et al., (2014)),
however part of the scarp with 0.4 – 0.48 m original offset had lost ~0.1 - 0.2 m vertical
height as observed in 2016 during a brief visit by the authors. In contrast, a section of the 37
km long 1968 Meckering earthquake scarp that was fenced off as a geological monument has
persisted as a topographic high for 50 years in part thanks to the ferricrete horizon defining
the scarp (Clark and McCue, (2003)).
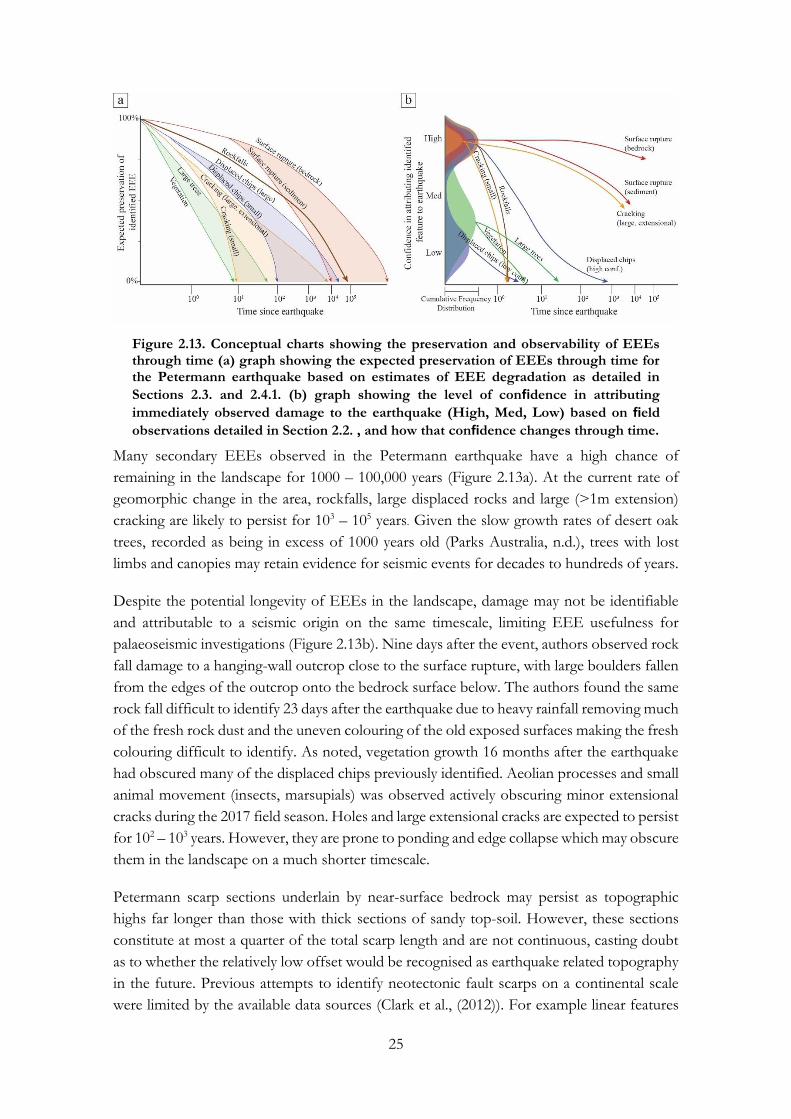
25
Figure 2.13. Conceptual charts showing the preservation and observability of EEEs through time (a) graph showing the expected preservation of EEEs through time for the Petermann earthquake based on estimates of EEE degradation as detailed in
Sections 2.3. and 2.4.1. (b) graph showing the level of confidence in attributing
immediately observed damage to the earthquake (High, Med, Low) based on field
observations detailed in Section 2.2. , and how that confidence changes through time.
Many secondary EEEs observed in the Petermann earthquake have a high chance of
remaining in the landscape for 1000 – 100,000 years (Figure 2.13a). At the current rate of
geomorphic change in the area, rockfalls, large displaced rocks and large (>1m extension)
cracking are likely to persist for 103 – 105 years. Given the slow growth rates of desert oak
trees, recorded as being in excess of 1000 years old (Parks Australia, n.d.), trees with lost
limbs and canopies may retain evidence for seismic events for decades to hundreds of years.
Despite the potential longevity of EEEs in the landscape, damage may not be identifiable
and attributable to a seismic origin on the same timescale, limiting EEE usefulness for
palaeoseismic investigations (Figure 2.13b). Nine days after the event, authors observed rock
fall damage to a hanging-wall outcrop close to the surface rupture, with large boulders fallen
from the edges of the outcrop onto the bedrock surface below. The authors found the same
rock fall difficult to identify 23 days after the earthquake due to heavy rainfall removing much
of the fresh rock dust and the uneven colouring of the old exposed surfaces making the fresh
colouring difficult to identify. As noted, vegetation growth 16 months after the earthquake
had obscured many of the displaced chips previously identified. Aeolian processes and small
animal movement (insects, marsupials) was observed actively obscuring minor extensional
cracks during the 2017 field season. Holes and large extensional cracks are expected to persist
for 102 – 103 years. However, they are prone to ponding and edge collapse which may obscure
them in the landscape on a much shorter timescale.
Petermann scarp sections underlain by near-surface bedrock may persist as topographic
highs far longer than those with thick sections of sandy top-soil. However, these sections
constitute at most a quarter of the total scarp length and are not continuous, casting doubt
as to whether the relatively low offset would be recognised as earthquake related topography
in the future. Previous attempts to identify neotectonic fault scarps on a continental scale
were limited by the available data sources (Clark et al., (2012)). For example linear features
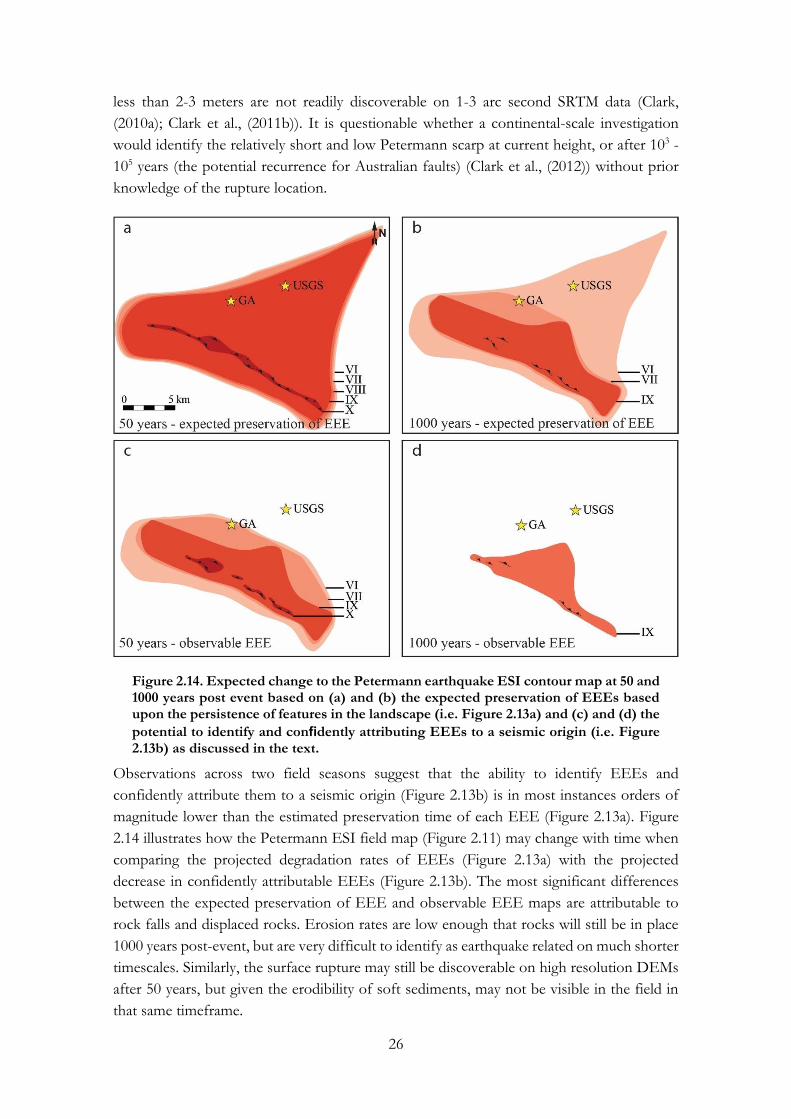
26
less than 2-3 meters are not readily discoverable on 1-3 arc second SRTM data (Clark,
(2010a); Clark et al., (2011b)). It is questionable whether a continental-scale investigation
would identify the relatively short and low Petermann scarp at current height, or after 103 -
105 years (the potential recurrence for Australian faults) (Clark et al., (2012)) without prior
knowledge of the rupture location.
Figure 2.14. Expected change to the Petermann earthquake ESI contour map at 50 and 1000 years post event based on (a) and (b) the expected preservation of EEEs based upon the persistence of features in the landscape (i.e. Figure 2.13a) and (c) and (d) the
potential to identify and confidently attributing EEEs to a seismic origin (i.e. Figure 2.13b) as discussed in the text.
Observations across two field seasons suggest that the ability to identify EEEs and
confidently attribute them to a seismic origin (Figure 2.13b) is in most instances orders of
magnitude lower than the estimated preservation time of each EEE (Figure 2.13a). Figure
2.14 illustrates how the Petermann ESI field map (Figure 2.11) may change with time when
comparing the projected degradation rates of EEEs (Figure 2.13a) with the projected
decrease in confidently attributable EEEs (Figure 2.13b). The most significant differences
between the expected preservation of EEE and observable EEE maps are attributable to
rock falls and displaced rocks. Erosion rates are low enough that rocks will still be in place
1000 years post-event, but are very difficult to identify as earthquake related on much shorter
timescales. Similarly, the surface rupture may still be discoverable on high resolution DEMs
after 50 years, but given the erodibility of soft sediments, may not be visible in the field in
that same timeframe.
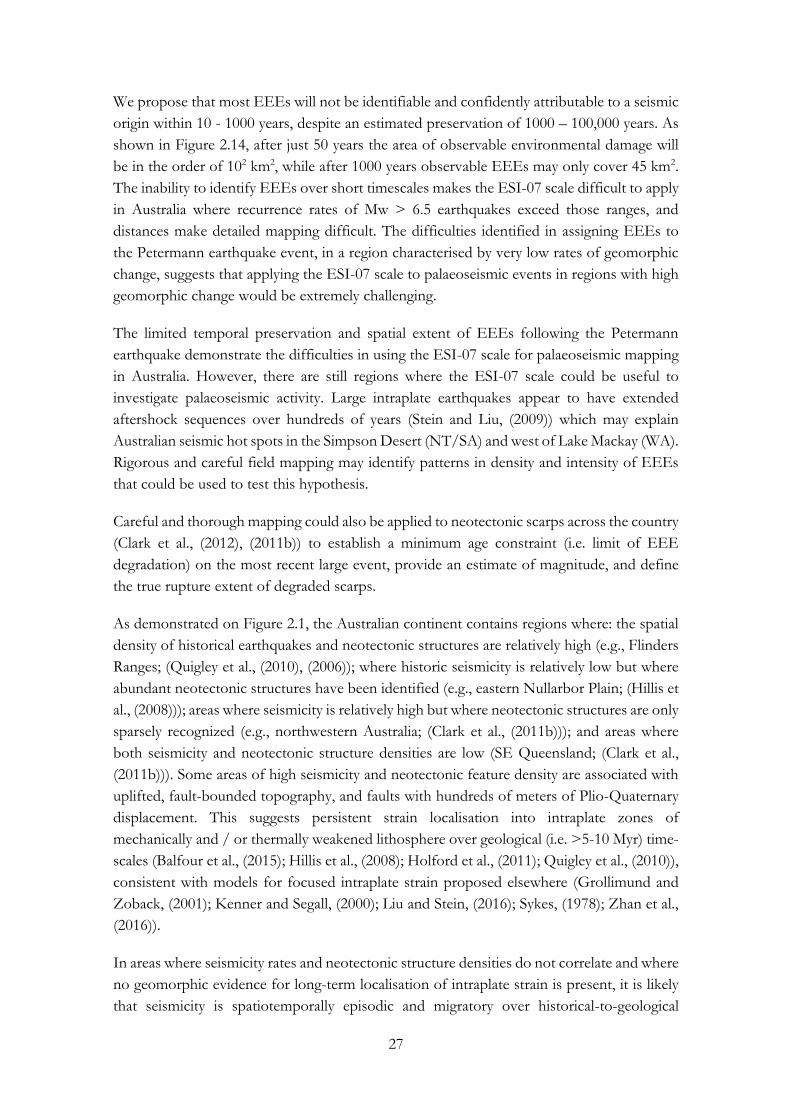
27
We propose that most EEEs will not be identifiable and confidently attributable to a seismic
origin within 10 - 1000 years, despite an estimated preservation of 1000 – 100,000 years. As
shown in Figure 2.14, after just 50 years the area of observable environmental damage will
be in the order of 102 km2, while after 1000 years observable EEEs may only cover 45 km2.
The inability to identify EEEs over short timescales makes the ESI-07 scale difficult to apply
in Australia where recurrence rates of Mw > 6.5 earthquakes exceed those ranges, and
distances make detailed mapping difficult. The difficulties identified in assigning EEEs to
the Petermann earthquake event, in a region characterised by very low rates of geomorphic
change, suggests that applying the ESI-07 scale to palaeoseismic events in regions with high
geomorphic change would be extremely challenging.
The limited temporal preservation and spatial extent of EEEs following the Petermann
earthquake demonstrate the difficulties in using the ESI-07 scale for palaeoseismic mapping
in Australia. However, there are still regions where the ESI-07 scale could be useful to
investigate palaeoseismic activity. Large intraplate earthquakes appear to have extended
aftershock sequences over hundreds of years (Stein and Liu, (2009)) which may explain
Australian seismic hot spots in the Simpson Desert (NT/SA) and west of Lake Mackay (WA).
Rigorous and careful field mapping may identify patterns in density and intensity of EEEs
that could be used to test this hypothesis.
Careful and thorough mapping could also be applied to neotectonic scarps across the country
(Clark et al., (2012), (2011b)) to establish a minimum age constraint (i.e. limit of EEE
degradation) on the most recent large event, provide an estimate of magnitude, and define
the true rupture extent of degraded scarps.
As demonstrated on Figure 2.1, the Australian continent contains regions where: the spatial
density of historical earthquakes and neotectonic structures are relatively high (e.g., Flinders
Ranges; (Quigley et al., (2010), (2006)); where historic seismicity is relatively low but where
abundant neotectonic structures have been identified (e.g., eastern Nullarbor Plain; (Hillis et
al., (2008))); areas where seismicity is relatively high but where neotectonic structures are only
sparsely recognized (e.g., northwestern Australia; (Clark et al., (2011b))); and areas where
both seismicity and neotectonic structure densities are low (SE Queensland; (Clark et al.,
(2011b))). Some areas of high seismicity and neotectonic feature density are associated with
uplifted, fault-bounded topography, and faults with hundreds of meters of Plio-Quaternary
displacement. This suggests persistent strain localisation into intraplate zones of
mechanically and / or thermally weakened lithosphere over geological (i.e. >5-10 Myr) time-
scales (Balfour et al., (2015); Hillis et al., (2008); Holford et al., (2011); Quigley et al., (2010)),
consistent with models for focused intraplate strain proposed elsewhere (Grollimund and
Zoback, (2001); Kenner and Segall, (2000); Liu and Stein, (2016); Sykes, (1978); Zhan et al.,
(2016)).
In areas where seismicity rates and neotectonic structure densities do not correlate and where
no geomorphic evidence for long-term localisation of intraplate strain is present, it is likely
that seismicity is spatiotemporally episodic and migratory over historical-to-geological
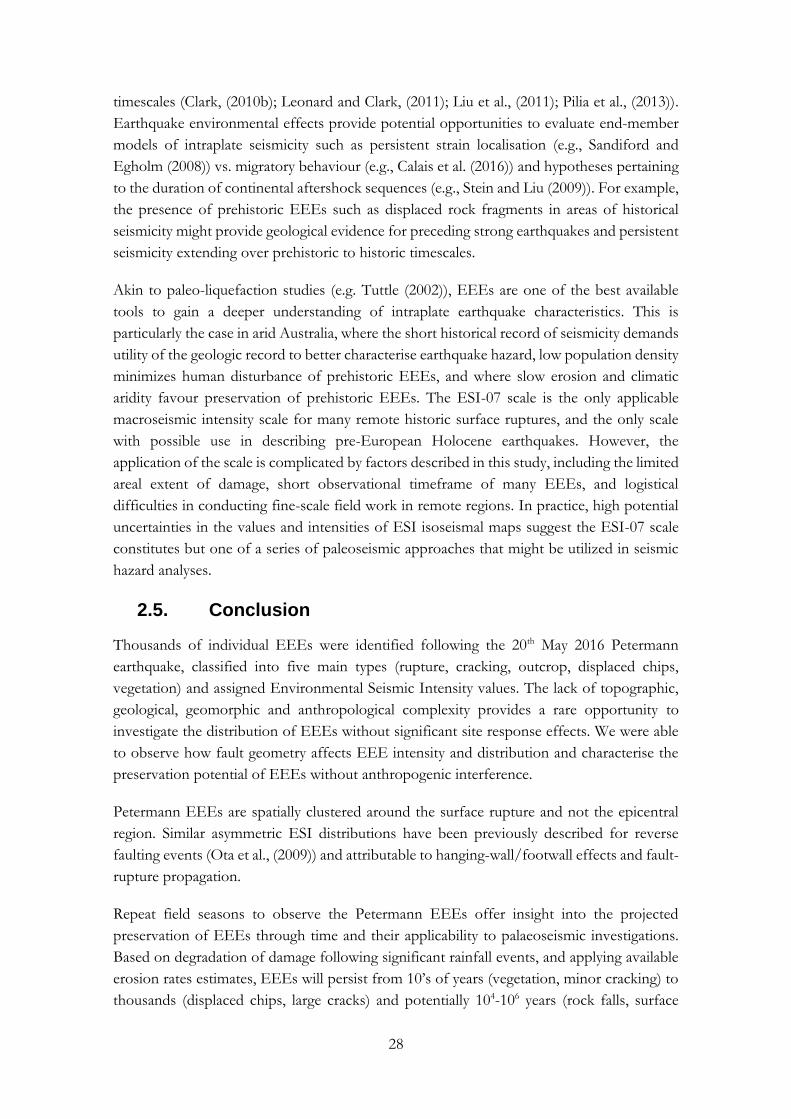
28
timescales (Clark, (2010b); Leonard and Clark, (2011); Liu et al., (2011); Pilia et al., (2013)).
Earthquake environmental effects provide potential opportunities to evaluate end-member
models of intraplate seismicity such as persistent strain localisation (e.g., Sandiford and
Egholm (2008)) vs. migratory behaviour (e.g., Calais et al. (2016)) and hypotheses pertaining
to the duration of continental aftershock sequences (e.g., Stein and Liu (2009)). For example,
the presence of prehistoric EEEs such as displaced rock fragments in areas of historical
seismicity might provide geological evidence for preceding strong earthquakes and persistent
seismicity extending over prehistoric to historic timescales.
Akin to paleo-liquefaction studies (e.g. Tuttle (2002)), EEEs are one of the best available
tools to gain a deeper understanding of intraplate earthquake characteristics. This is
particularly the case in arid Australia, where the short historical record of seismicity demands
utility of the geologic record to better characterise earthquake hazard, low population density
minimizes human disturbance of prehistoric EEEs, and where slow erosion and climatic
aridity favour preservation of prehistoric EEEs. The ESI-07 scale is the only applicable
macroseismic intensity scale for many remote historic surface ruptures, and the only scale
with possible use in describing pre-European Holocene earthquakes. However, the
application of the scale is complicated by factors described in this study, including the limited
areal extent of damage, short observational timeframe of many EEEs, and logistical
difficulties in conducting fine-scale field work in remote regions. In practice, high potential
uncertainties in the values and intensities of ESI isoseismal maps suggest the ESI-07 scale
constitutes but one of a series of paleoseismic approaches that might be utilized in seismic
hazard analyses.
2.5. Conclusion
Thousands of individual EEEs were identified following the 20th May 2016 Petermann
earthquake, classified into five main types (rupture, cracking, outcrop, displaced chips,
vegetation) and assigned Environmental Seismic Intensity values. The lack of topographic,
geological, geomorphic and anthropological complexity provides a rare opportunity to
investigate the distribution of EEEs without significant site response effects. We were able
to observe how fault geometry affects EEE intensity and distribution and characterise the
preservation potential of EEEs without anthropogenic interference.
Petermann EEEs are spatially clustered around the surface rupture and not the epicentral
region. Similar asymmetric ESI distributions have been previously described for reverse
faulting events (Ota et al., (2009)) and attributable to hanging-wall/footwall effects and fault-
rupture propagation.
Repeat field seasons to observe the Petermann EEEs offer insight into the projected
preservation of EEEs through time and their applicability to palaeoseismic investigations.
Based on degradation of damage following significant rainfall events, and applying available
erosion rates estimates, EEEs will persist from 10’s of years (vegetation, minor cracking) to
thousands (displaced chips, large cracks) and potentially 104-106 years (rock falls, surface
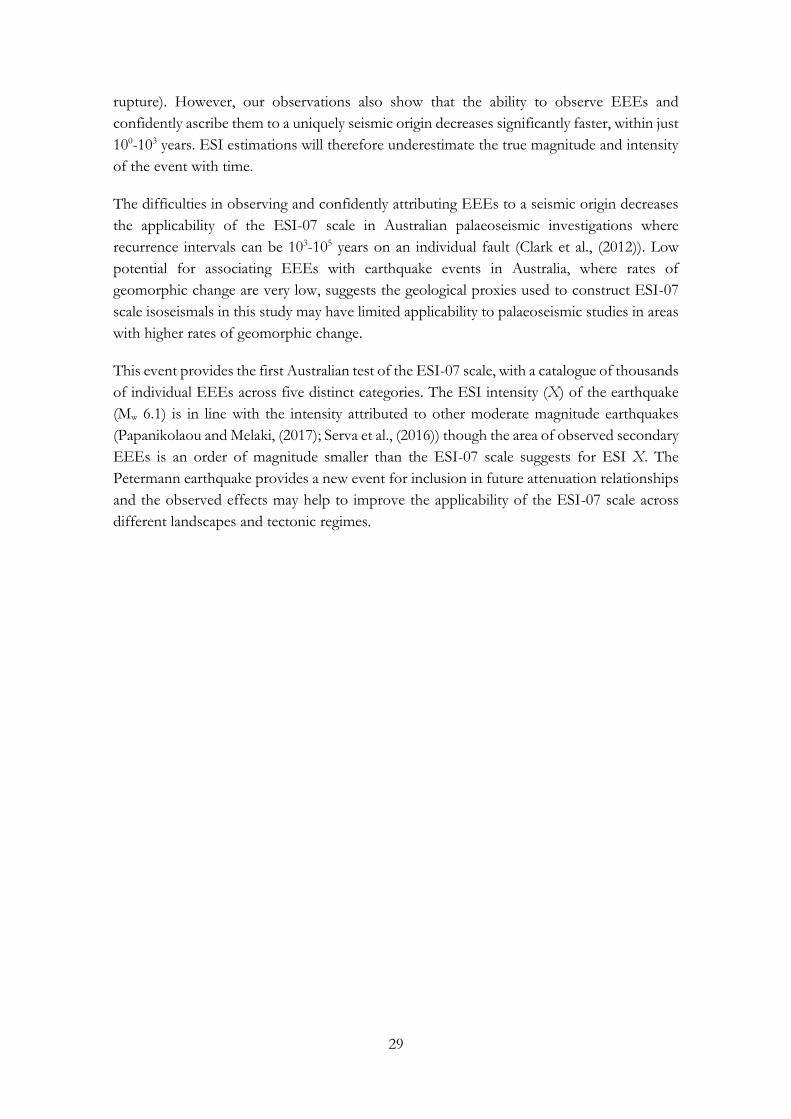
29
rupture). However, our observations also show that the ability to observe EEEs and
confidently ascribe them to a uniquely seismic origin decreases significantly faster, within just
100-103 years. ESI estimations will therefore underestimate the true magnitude and intensity
of the event with time.
The difficulties in observing and confidently attributing EEEs to a seismic origin decreases
the applicability of the ESI-07 scale in Australian palaeoseismic investigations where
recurrence intervals can be 103-105 years on an individual fault (Clark et al., (2012)). Low
potential for associating EEEs with earthquake events in Australia, where rates of
geomorphic change are very low, suggests the geological proxies used to construct ESI-07
scale isoseismals in this study may have limited applicability to palaeoseismic studies in areas
with higher rates of geomorphic change.
This event provides the first Australian test of the ESI-07 scale, with a catalogue of thousands
of individual EEEs across five distinct categories. The ESI intensity (X) of the earthquake
(Mw 6.1) is in line with the intensity attributed to other moderate magnitude earthquakes
(Papanikolaou and Melaki, (2017); Serva et al., (2016)) though the area of observed secondary
EEEs is an order of magnitude smaller than the ESI-07 scale suggests for ESI X. The
Petermann earthquake provides a new event for inclusion in future attenuation relationships
and the observed effects may help to improve the applicability of the ESI-07 scale across
different landscapes and tectonic regimes.
30
CHAPTER 3. NEAR-FIELD DIRECTIONALITY OF EARTHQUAKE
STRONG GROUND MOTIONS MEASURED BY
DISPLACED GEOLOGICAL OBJECTS
Abstract
Rock fragments (chips) displaced from bedrock outcrops were observed in the very near-
field (less than 5 km from the surface rupture) of the 2016 MW 6.1 Petermann earthquake.
Chips were observed to have crushed fresh vegetation, exposed insect castings, and produced
fine powder at impact sites with other parts of bedrock. These observations of the
youthfulness of displacement together with an increase in number of chips displaced, and
distance travelled with proximity to the surface rupture, and a lack of other feasible
mechanisms for displacement, supports a coseismic mechanism of displacement. In total,
the morphology, displacement directions and distances of 1437 chips were measured over
an area of 100 km2 along and across the Petermann surface rupture. Displacement directions
were non-random with strong polarity interpreted to reflect coseismic, complex, seismically
generated displacement of chips, with intensity of motion increasing with proximity to the
surface rupture. The observations provide a test for the validity of available models for
directionality of near-field strong ground motions, in particular by providing a dense dataset
of both along and across fault motions, as yet unrecorded instrumentally for a reverse
earthquake. The dominant displacement signals are interpreted to result from fling (elastic
rebound / permanent offset of the ground surface) with some displacements relating to
seismic wave directionality, though no conclusive evidence to suggest these were ‘pulse-like’
seismic-waves. The location of the Petermann hypocentre is estimated using the prevailing
orientation of the directed strong ground motions required to produce the observed chip
displacements. The hypocentre resolves to a point-source (epicentre) slightly off-centre of
one of the two faults that ruptured in the Petermann earthquake. This estimated epicentre
location is consistent with the location of an inferred intersection between the Petermann
fault and nearby Woodroffe Thrust at approximately 3 km depth. This study provides a dense
along- and across-rupture proxy record of strong ground motions at less than 5 km distance
from a surface rupturing reverse earthquake. This data demonstrates the applicability of
geological damage for capturing seismic data in the absence of dense instrumentation, and
may help test models of near-field dynamic and static pulse-like strong ground motion for
dip-slip earthquakes
3.1. Introduction
Strong ground motions proximal to earthquake sources may show pulse-like motions with
azimuthal components related to seismic waves (dynamic) and elastic-rebound/fling (static).
For dipping faults, hanging-wall effects increase the intensity of strong ground motions in
31
the near-field. Fault geometry may impact controls on static and dynamic ground motions.
Hanging-wall amplification and directionality of strong ground motions in the near-field of
reverse earthquakes pose significant hazards to infrastructure and population (Bray and
Rodriguez-Marek, (2004); Champion and Liel, (2012); Shahi and Baker, (2011)) as seen in
events such as the 2005 MW 7.6 Kashmir, Pakistan earthquake (Kaneda et al., (2008)) and
1999 MW 7.7 Chi Chi. Taiwan earthquake (Dalguer et al., (2001)). Few reverse earthquakes
have occurred in areas of dense instrumentation (Abrahamson and Donahue, (2013)),
making quantification and modelling of these effects challenging.
The 20th May 2016 MW 6.1 Petermann earthquake occurred in sparsely populated central
Australia, within a low-relief, bedrock-dominated, arid landscape (King et al., (2018)).
Thousands of displaced rock fragments were identified and measured across an
approximately 100 km2 area surrounding the surface rupture, at distances from the surface
rupture of up to 5 km on the hanging-wall and 2 km on the foot-wall. In the absence of a
dense seismometer network, these rock fragments provide a proxy for the intensity and
polarity of strong ground motions in the near-field region of a surface rupturing reverse fault.
The geological and seismological characteristics of this event offer a unique opportunity to
observe how surface objects experience directionality of reverse earthquake strong ground
motions in the absence of source effects such as sediment cover and infrastructure, and in
an area of very low relief.
This chapter uses these observational data to address a series of questions:
- Were chips displaced by seismic processes, or non-seismic alternatives (natural or
anthropogenic)?
- Do displacement vectors indicate a preferred directional signal, or are the data random?
- Can displacement signals be explained with a prevailing single simple physical process
resulting from shaking? (e.g. outcrop topography; outcrop slope direction; surface
topography; surface geology)
- Do vectors show evidence of being derived from seismological processes consistent
with a reverse fault earthquake? For instance, is there across-fault asymmetry due to
hanging-wall effects?
- Assuming evidence for seismological control, can these chips be used to evaluate and
test key characteristics of available models for polarisation of near-field ground motions?
For instance: directionality of seismic waves, rupture propagation direction, fling-step
effects.
- Assuming available models for the directionality of reverse earthquake ground motions
are accurate, can displacement vectors better constrain the rupture process of the
Petermann earthquake?
Interpreting the data within the framework of these questions shows that displacement
vectors from displaced rock fragments around the Petermann earthquake are (i) consistent
with complex coseismic strong ground motions (ii) record relative intensities of ground
motion across and along rupture and (iii) allow for interpretations of the rupture process.
These displaced geological features represent the most spatially dense near-field proxy
dataset for constraining strong ground motions for a reverse earthquake to date.

32
3.2. Background
Polarity of the direction and intensity of strong ground motions is recognisable in some, but
not all, near-field instrumental records of earthquakes in three-component motion (fault-
normal, fault-parallel, vertical). The observation of strong ground motion polarity (that is,
stronger motions in a particular azimuthal orientation) in seismic records has led to the
development of many ground motion prediction equations (GMPEs) and physical models
to quantify these motions for engineering purposes (Aagaard et al., (2004); Bray and
Rodriguez-Marek, (2004); Burks and Baker, (2016); Day et al., (2008); Dreger et al., (2011);
Kohrangi et al., (2019); Shahi and Baker, (2014), (2013); Tarbali et al., (2019); Xie, (2019)).
This section provides context for the current state of knowledge regarding directionality of
near-field strong ground motions. These seismological concepts provide background for the
interpretation of displaced rock data presented later in this chapter.
This section also provides brief literature reviews for past studies of displaced geological
objects, Australian GMPEs, past directionality effects documented from Australian surface
rupturing earthquakes (recorded by displaced anthropological objects), and the geology and
geography surrounding the 2016 Petermann earthquake.
3.2.1. Dynamic and static ‘pulse-like’ near-field strong ground motions
3.2.1.1. Classification of ‘pulse-like’, directivity, and directionality
Many near-field seismic records show strong ground motions that exhibit directionality and
are described as ‘pulse-like’ (Figure 3.1). The seismological and earthquake engineering
literature on these effects have differing descriptions for the terminology used, the physical
mechanisms of their production and their directions relative to the fault (e.g. fault-normal or
fault-parallel). This paper makes use of descriptions from literature describing recorded and
modelled near-fault pulse-like motions and/or directionality and/or directivity effects for
seismological and earthquake engineering purposes (Aagaard et al., (2004); Boatwright,
(2007); Bray and Rodriguez-Marek, (2004); Burks and Baker, (2016); Day et al., (2008);
Dreger et al., (2011); Kohrangi et al., (2019); Shahi and Baker, (2014), (2013); Tarbali et al.,
(2019); Xie, (2019)).
In the literature, instrumental records that (after filtering/processing) show a distinct larger
and/or more distinct peak in velocity and/or displacement (and/or various other measures
of seismic energy derived from three-component records) are termed ‘pulses’ (Figure 3.1).
The classification of ‘pulse-like’ motion is somewhat subjective and many methods have been
proposed to enable consistent processing of seismic waveforms to identify ‘pulse-like’
motion (Shahi and Baker, (2013); Spudich et al., (2014); Tarbali et al., (2019)). Additionally,
standard filtering of seismic records often removes static displacements (Dabaghi and Der
Kiureghian, (2018); Xie, (2019)) which also produce pulse-like strong ground motions in the
near-field (i.e. fling effects discussed below).
Xie (2019) makes a distinction between directivity and directionality, which is a polarity of near-
field waveforms (specific to dynamic pulse-like records). Directivity has broader implications
with differing interpretations between the fields of seismology and engineering (Boatwright,
(2007); Tarbali et al., (2019)). Both fields recognise that directivity is related to wave
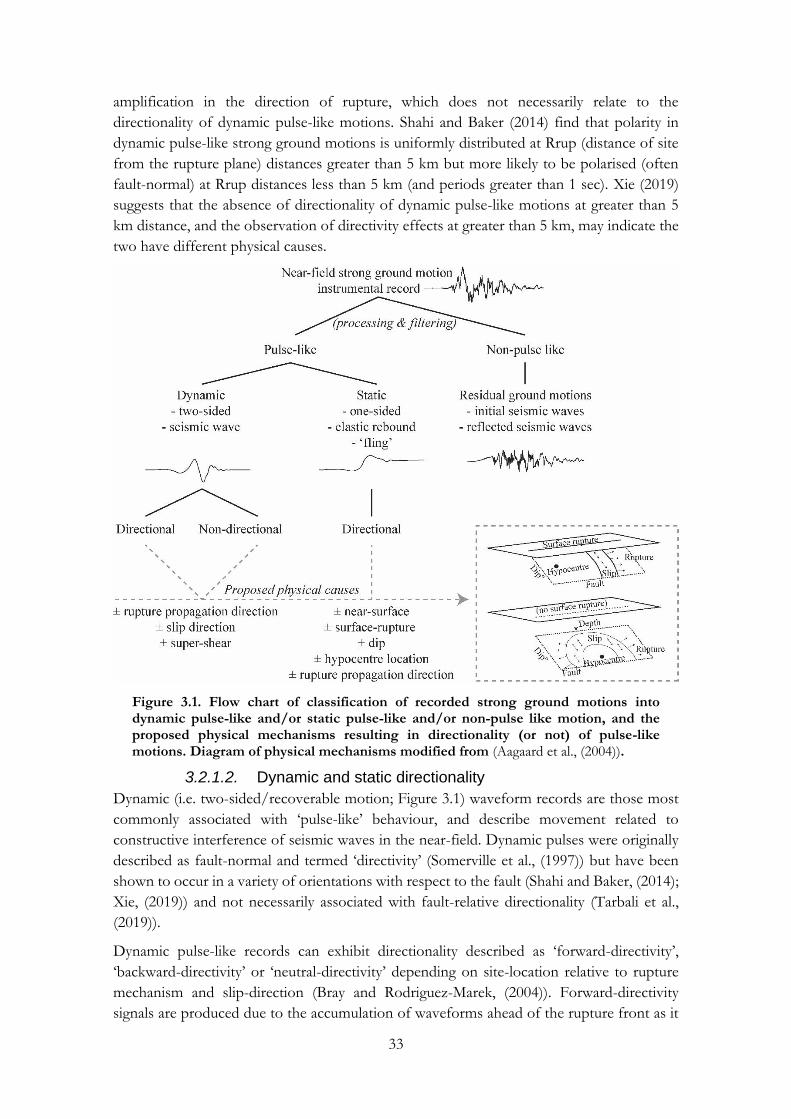
33
amplification in the direction of rupture, which does not necessarily relate to the
directionality of dynamic pulse-like motions. Shahi and Baker (2014) find that polarity in
dynamic pulse-like strong ground motions is uniformly distributed at Rrup (distance of site
from the rupture plane) distances greater than 5 km but more likely to be polarised (often
fault-normal) at Rrup distances less than 5 km (and periods greater than 1 sec). Xie (2019)
suggests that the absence of directionality of dynamic pulse-like motions at greater than 5
km distance, and the observation of directivity effects at greater than 5 km, may indicate the
two have different physical causes.
Figure 3.1. Flow chart of classification of recorded strong ground motions into dynamic pulse-like and/or static pulse-like and/or non-pulse like motion, and the proposed physical mechanisms resulting in directionality (or not) of pulse-like motions. Diagram of physical mechanisms modified from (Aagaard et al., (2004)).
3.2.1.2. Dynamic and static directionality
Dynamic (i.e. two-sided/recoverable motion; Figure 3.1) waveform records are those most
commonly associated with ‘pulse-like’ behaviour, and describe movement related to
constructive interference of seismic waves in the near-field. Dynamic pulses were originally
described as fault-normal and termed ‘directivity’ (Somerville et al., (1997)) but have been
shown to occur in a variety of orientations with respect to the fault (Shahi and Baker, (2014);
Xie, (2019)) and not necessarily associated with fault-relative directionality (Tarbali et al.,
(2019)).
Dynamic pulse-like records can exhibit directionality described as ‘forward-directivity’,
‘backward-directivity’ or ‘neutral-directivity’ depending on site-location relative to rupture
mechanism and slip-direction (Bray and Rodriguez-Marek, (2004)). Forward-directivity
signals are produced due to the accumulation of waveforms ahead of the rupture front as it
34
propagates outwards from the hypocentre along a fault, producing large amplitude short
duration records (Bray and Rodriguez-Marek, (2004); Day et al., (2008)). This dynamic pulse-
like forward-directivity is not observed for all sites around an earthquake, generally only those
located subparallel or at a low inter-strike angle with the direction of rupture propagation.
This effect is not observed in all earthquakes, with models showing forward-directivity is
most common where the direction of slip is parallel to the direction of rupture propagation
away from the hypocentre (Aagaard et al., (2004)). For this reason, dynamic pulse-like
motions with directionality are commonly observed in strike-slip events where slip and
rupture propagation are along-strike and parallel to the ground surface for both unilateral
and bilateral rupture. This is not necessarily the case for dip-slip events, in which
directionality of dynamic pulse-like motions is dependent on fault geometry, slip direction,
rupture propagation direction, and hypocentre location and depth (Figure 3.1).
In addition to dynamic (two-sided; Figure 3.1) pulse-like motions, pulse-like records may be
produced from static (i.e. one-sided) permanent ground displacement, often termed ‘fling-
step’, ‘fling’ or ‘fling-pulse’ (Aagaard et al., (2004); Bray and Rodriguez-Marek, (2004); Burks
and Baker, (2016); Dreger et al., (2011)) (termed fling in this study). This results from the
permanent offset / elastic rebound of rocks in the opposite direction to each other along a
fault, as slip accumulates following rupture initiation and propagation. This creates a one-
sided long-period pulse with directionality related to directivity (rupture propagation),
distinct from dynamic pulse-like motions which may not exhibit directionality (Figure 3.1)
(Bray and Rodriguez-Marek, (2004); Burks and Baker, (2016); Dreger et al., (2011); Xie,
(2019)).
Commonly, fling is described as fault-parallel while dynamic forward-directivity is described
as fault normal (Shahi and Baker, (2013); Somerville et al., (1997); Yadav and Gupta, (2017)).
However, simulated rupture on faults with varying dips (20° - 90°) shows both fling and
dynamic-directivity pulses can occur in any of three component directions (vertical, fault-
normal, fault-parallel) (Dreger et al., (2011)). Simulated rupture of a MW 6.5 reverse event on
a 40° dipping fault finds the vertical and fault-normal components are dominated by fling
(elastic rebound) while the fault parallel components show weak dynamic directionality
(Dreger et al., (2011)), in direct contrast to the commonly described directions of these
motions. This simulation is in line with the findings of Aagaard et al. (2004) who note a
weaker directivity effect on reverse faults when the hypocentre is offset from the centre of
the fault (i.e. unilateral rupture) (Figure 3.1) as is the case of the Dreger et al. (2011) model.
This situation occurs due to obliqueness between the direction of slip (up/down dip) and
rupture propagation (outwards from the hypocentre, with a stronger fault-parallel
component in the case of unilateral rupture). When the hypocentre is in a central location,
rupture propagation and slip direction align to create a directivity field up-dip of the
hypocentre.
Very few earthquakes have occurred in areas with sufficiently dense instrumentation to
adequately record near-field dynamic and static pulse-like directionality. Most recordings
come from strike-slip events, and those few from reverse events (e.g. 1999 MW 7.6 Chi Chi,
Taiwan; 1994 MW 6.7 Northridge, California) show complicated patterns of directionality
(Aagaard et al., (2004)). In lieu of recorded data, authors modelling directivity on vertical and

35
dip-slip faults also finding higher complexity in directivity patterns for dipping faults
(Aagaard et al., (2004); Dreger et al., (2011)).
Fling related pulse-like records are less common than dynamic seismic-wave pulse-like
records (Burks and Baker, (2016)) in part due to their localisation at the fault which is difficult
to capture without a very dense seismic network. Fling effects were largely unnoticed prior
to recordings of the 1999 Chi Chi, Taiwan and 1999 Kocaeli, Turkey earthquakes (Burks and
Baker, (2016)). The 1999 Chi Chi earthquake was well recorded by a dense seismometer
array, with fling records with an Rrup distance of 1.84 – 11.40 km (Xie, (2019)). The closest
strong-motion record of fling comes from the 1966 Parkfield earthquake, 80m from the
rupture (Dreger et al., (2011)).
In addition to dynamic and/or static pulse-like directivity of strong-ground motions, the
near-field region of reverse fault earthquakes is characterised by asymmetric ground motion
intensity due to hanging-wall effects (Abrahamson and Donahue, (2013); Abrahamson and
Somerville, (1996)). This occurs as sites on the hanging-wall are closer to the fault plane than
those on the foot-wall, therefore experiencing stronger ground shaking effects which
attenuate with distance from the rupture / near-fault region. In some cases when the
propagating rupture front reaches the free-surface of the ground, the sudden release of
energy induces ‘flapping’ of the hanging-wall wedge (Gabuchian et al., (2017)).
3.2.2. Prior studies of coseismically displaced objects Multiple attempts have been made to study seismically displaced anthropological objects
(Allen et al., (1998); Bolt and Hansen, (1977)) and geological objects (Clark, (1972); Khajavi
et al., (2012); Michael et al., (2002); Ohmachi and Midorikawa, (1992)) to understand the
intensity and polarity of strong ground motions.
Only two studies have systematically identified and modelled displaced rocks and boulders
in the earthquake near-field, both on strike-slip faults in California (Clark, (1972); Michael et
al., (2002)). These studies identified rocks displaced from their original positions in sediment
on a single transect across the fault (Michael et al., (2002)) or opportunistically where
observed at the tops of ridges close to the rupture (Clark, (1972)). Both studies use the
displaced rocks to estimate horizontal accelerations, but do not attempt to relate the
directions of rock movement to near-fault directionality of strong ground motions. The
observations from these studies suggest influence by topographic amplification (Clark,
(1972)) and soil amplification (Michael et al., (2002)).
The only published attempt to relate a displaced object to ground motion directionality in
the near-field of a reverse earthquake is from the 1971 MW 6.5 San Fernando, California
earthquake in which a 50 m long asphalt slab was offset intact across the surface rupture (i.e.
experienced no shortening) (Allen et al., (1998)). This study proposes that the slab remained
intact due to a dynamic forward directivity pulse creating vertical offset of the slab prior to
rupture propagation reaching the surface and producing shortening of other features along
the fault tip. Gabuchian et al. (2017) suggest that these observations may alternatively relate
to ‘flapping’ of the hanging-wall as the rupture front reaches the surface. Khajavi et al. (2012)
observed boulder displacement vectors subparallel with predominant ground motion
displacement vectors from proximal seismometers in the Canterbury earthquake sequence

36
(Quigley et al., (2016)). These observations demonstrate that geological objects can record
movements similar to instrumentally recorded strong ground motions.
All prior studies attempting to link prevailing displaced geological objects to strong ground
motion estimates have relied on data at single site locations or single transects across the
rupture, limiting the ability to assess polarity and intensity of strong ground motions
surrounding the rupture as recorded by these displaced objects. This paper presents a
spatially comprehensive dataset of coseismically displaced rock fragments recorded both
along and across the reverse surface rupture of the 2016 MW 6.1 Petermann earthquake,
Australia.
3.2.3. Seismotectonic setting and Australian ground motion prediction equations
Australia is an intraplate stable continental region surrounded by passive margins (Hillis et
al., (2008)). The crustal stress field is predominately compressive and orientated relative to
far-field plate boundary forces (as documented by bore-hole breakouts and focal
mechanisms) (Rajabi et al., (2017b)). More than 360 potentially active faults have been
identified across the country predominately from displacements visible in SRTM elevation
data (Clark, (2012); Clark et al., (2011b)), except in the south-east and south-west of the
continent where active faults have been identified on the basis of offset Cenozoic units,
topographic and geomorphic offsets which outpace erosive forces, and paleoseismic
investigations (e.g. trenching) (see summaries in: Clark et al., 2012; Quigley et al., 2010;
Sandiford, 2003).
Four seismic zones are defined across Australia based on higher rates of historic seismicity,
three of which are coincident with population centres (Perth, Adelaide, Melbourne,
Canberra, Sydney) (Figure 3.2). Eight historic onshore earthquakes greater than MW 6.0 have
been instrumentally recorded (Allen et al., (2018c)) (Figure 3.2) causing significant
infrastructure damage where located close to population centres (e.g. 1968 MW 6.6
Meckering, 1979 MW 6.1 Cadoux). The 1989 MW 5.42 (Allen et al., (2018c)) Newcastle
earthquake (n=13 fatalities) demonstrates that strong ground motions from moderate
magnitude events pose a risk to populations in Australia.
Three ground motion prediction equations (GMPEs) have been developed specifically for
Australia, for the south-east (Allen, (2012)), and south-east and south-west (Somerville,
(2010); Somerville et al., (2009)). These are commonly extended to apply to all Australian
non-cratonic (south-east Australian GMPEs) and cratonic (south-west Australia GMPE)
crust (e.g. (Ghasemi and Allen, (2018))). The GMPEs are described as applicable to MW
ranges 4.0 to 7.5 and distances 0 to 400 km (Allen, (2012)), and MW range 5.0 to 7.5 and
distance ranges 0 to 500 km (Somerville, (2010); Somerville et al., (2009)). However, both
models are limited by the lack of records for greater than MW 6.0 events, particularly at
distances less than 100 km. The only instrumental recordings at less than 100 km distance of
a greater than MW 6.0 earthquake is of the 1988 MW 6.6, 6.4 and 6.3 Tennant Creek
earthquakes, which were recorded by the Warramunga Seismic Array 30 km east of the
epicentres (Bowman, (1992)). Neither of these GMPEs account for near-field directivity or
hanging-wall effects. Somerville (2010) argues that this is currently unnecessary for Australian
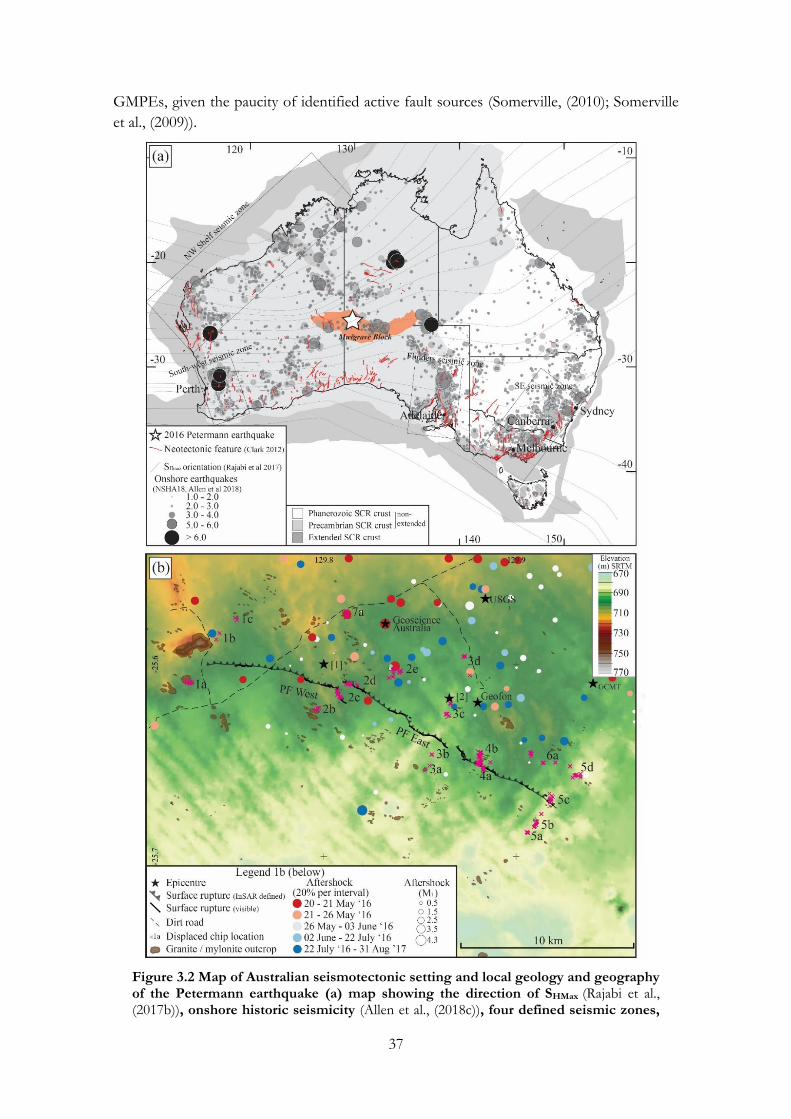
37
GMPEs, given the paucity of identified active fault sources (Somerville, (2010); Somerville
et al., (2009)).
Figure 3.2 Map of Australian seismotectonic setting and local geology and geography of the Petermann earthquake (a) map showing the direction of SHMax (Rajabi et al., (2017b)), onshore historic seismicity (Allen et al., (2018c)), four defined seismic zones,
38
identified potentially active faults (Clark, (2012)), major crustal divisions (cratonic and non-cratonic) (Leonard et al., (2014)) and the location of the Musgrave Block (Raymond et al., (2018)) (b) map of the 2016 Petermann surface rupture including published epicenters ([1] centroid of moment release Hejrani and Tkalčić (2018); [2] Polcari et al. (2018)), faults named in this paper (Petermann fault east (PF East), Petermann fault west (PF West)), aftershocks measured by both the national seismic network (20 – 26 May) and a dense aftershock network (26 May 2016 to 31 Aug 2017) (Attanayake et al., (2019); King et al., (2019a)), location of chip measurements and assigned location names, bedrock outcrops across the area and access roads. Underlying SRTM DEM shows the locations of dunes, a paleovalley through which the central section of surface rupture passes, and a gentle slope from NE to SW, draining into a line of playas which runs east to west across the region. Topography increases towards the Petermann Ranges to the north and east.
All historic onshore MW > 6.0 Australian earthquakes and surface-rupturing events have
occurred in cratonic regions in either unpopulated arid, or sparsely populated agricultural,
landscapes. The locations of these events offer unique opportunities to investigate
environmental and landscape effects of near-source strong ground motions due to bedrock
dominated near-surface geology (e.g. lack of soil/basin effects), minimal topography and
limited anthropogenic influence. For instance, environmental effects following the 2016
Petermann earthquake define strong asymmetry in the intensity and distribution of
environmental damage (e.g. rock falls, cracking, vegetation damage) due to hanging-wall
effects (King et al., (2018)).
Similarly, the farm-land and sparsely located infrastructure in the vicinity of the 1968 MW 6.6
Meckering and 1979 MW 6.1 Cadoux earthquakes allowed for fine-scale mapping of primary
surface rupture and secondary fracturing (Gordon and Lewis, (1980); King et al., (2019a),
(2019b), (2019c); Lewis et al., (1981)), along with identification of infrastructure damage
potentially related to directionality of near-field strong ground motions (Figure 3.3). For both
events, the direction of coseismic collapse or offset of infrastructure such as tank stands,
statues and headstones was recorded by geologists and land-holders immediately following
the earthquakes (Gordon and Lewis, (1980); Lewis et al., (1981)) (Figure 3.3).
At least three displaced objects observed following the Meckering earthquake were attributed
to strong vertical motions. This includes the offset of a 2 m high granite monument from its
pedestal, without damaging the vertical 7.6 cm high and 1.9 cm wide iron rod which
previously held it in place (Gordon and Lewis, (1980)) (location (i) in Figure 3.3). The pattern
of directionality documented in the Meckering earthquake is roughly radial away from a point
located in the approximate location of the preferred main-shock hypocentre of King et al.
(2019b) at the intersection of the Meckering and Splinter faults (Figure 3.3). Fewer displaced
objects were documented around the Cadoux surface rupture (Figure 3.3b). The geometry
of the surface ruptures recorded from that event and the unknown hypocentral fault, do not
allow for further estimation of the directionality field.
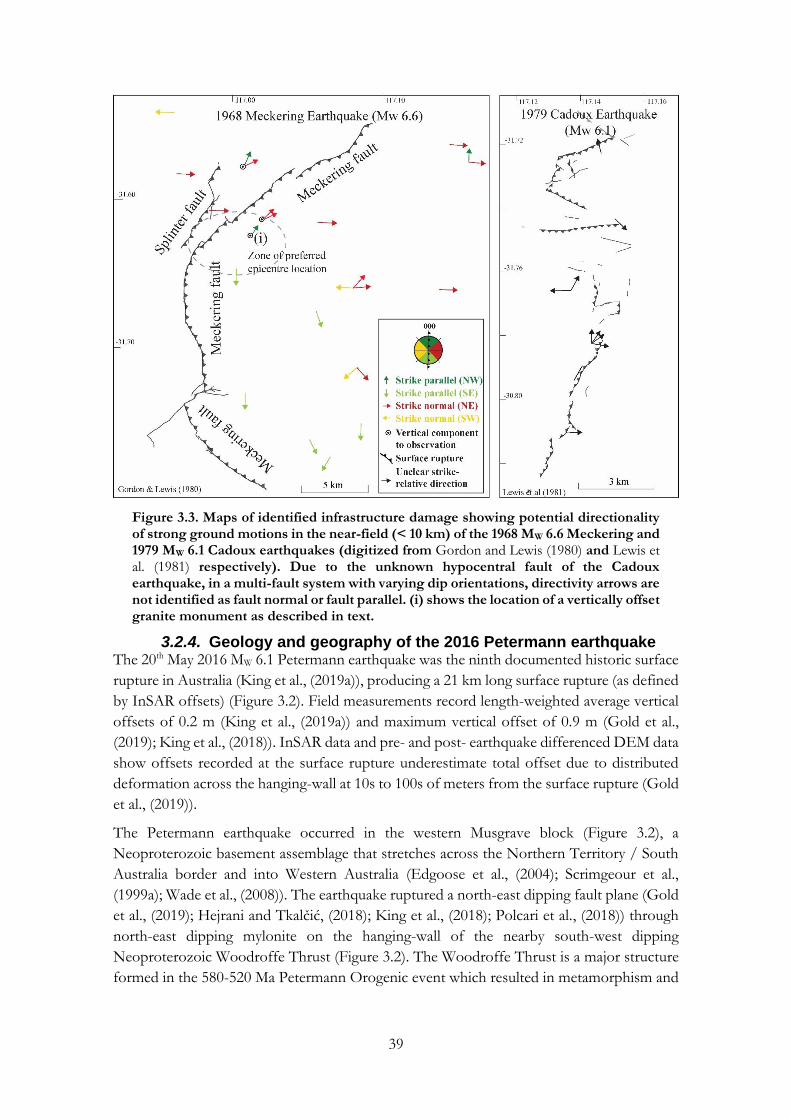
39
Figure 3.3. Maps of identified infrastructure damage showing potential directionality of strong ground motions in the near-field (< 10 km) of the 1968 MW 6.6 Meckering and 1979 MW 6.1 Cadoux earthquakes (digitized from Gordon and Lewis (1980) and Lewis et al. (1981) respectively). Due to the unknown hypocentral fault of the Cadoux earthquake, in a multi-fault system with varying dip orientations, directivity arrows are not identified as fault normal or fault parallel. (i) shows the location of a vertically offset granite monument as described in text.
3.2.4. Geology and geography of the 2016 Petermann earthquake The 20th May 2016 MW 6.1 Petermann earthquake was the ninth documented historic surface
rupture in Australia (King et al., (2019a)), producing a 21 km long surface rupture (as defined
by InSAR offsets) (Figure 3.2). Field measurements record length-weighted average vertical
offsets of 0.2 m (King et al., (2019a)) and maximum vertical offset of 0.9 m (Gold et al.,
(2019); King et al., (2018)). InSAR data and pre- and post- earthquake differenced DEM data
show offsets recorded at the surface rupture underestimate total offset due to distributed
deformation across the hanging-wall at 10s to 100s of meters from the surface rupture (Gold
et al., (2019)).
The Petermann earthquake occurred in the western Musgrave block (Figure 3.2), a
Neoproterozoic basement assemblage that stretches across the Northern Territory / South
Australia border and into Western Australia (Edgoose et al., (2004); Scrimgeour et al.,
(1999a); Wade et al., (2008)). The earthquake ruptured a north-east dipping fault plane (Gold
et al., (2019); Hejrani and Tkalčić, (2018); King et al., (2018); Polcari et al., (2018)) through
north-east dipping mylonite on the hanging-wall of the nearby south-west dipping
Neoproterozoic Woodroffe Thrust (Figure 3.2). The Woodroffe Thrust is a major structure
formed in the 580-520 Ma Petermann Orogenic event which resulted in metamorphism and

40
deformation of the granitic rocks forming the outcrops surrounding the 2016 rupture
(Edgoose et al., (2004); Neumann, (2013); Quentin de Gromard et al., (2019)).
In the immediate vicinity of the Petermann earthquake stable vegetated NE-SW trending
sand dunes between 4 – 6 m height and granitic outcrops up to 100 m high define local
topography. The ground surface across the region has a south-west slope away from the
foot-hills of the nearby Petermann ranges (approximately 750 m ASL) toward a set of E-W
trending playas (approximately 670 m ASL) over a distance of 25 – 35 km (Figure 3.2).
Sporadic low-lying outcrops of mylonite (<1 m high) (Figure 3.4) occur between dunes while
larger outcrops (5-100 m high) of granitic granulite occur sporadically across the region
(Figure 3.2) (King et al., (2018)). Granite outcrops tend to be domed (Figure 3.4a) due to a
lack of foliation or planar weaknesses, while mylonite outcrops tend to dip to the north-east
(aligned with the prevailing foliation geometry) where not flat to the ground surface (Figure
3.4b). Mylonite outcrops are occasionally domed with low relief (< 0.5 m high) where
foliation/shearing is weak within the outcrop (Figure 3.4g).
Mylonite outcrops with strong foliation are weathered along planar weaknesses (Figure 3.4b,
d, e, h), while granitic outcrops and mylonite with weak foliations are weathered
predominately through exfoliation of the exposed surface into sheets of variable sizes (Figure
3.4a, g, c, j). Exfoliation sheets are either detached and resting on the outcrop, or partially
attached to the in-situ outcrop at the base and/or edges of the exfoliating sheet (Figure 3.4a,
b, c, e, h). Surfaces of in-situ outcrop covered by exfoliation sheets, and the underside of
exfoliation sheets, are generally lighter in colour than exposed parts of the outcrop due to
the formation of a darker desert varnish (Gordon and Dorn, (2005)).
3.3. Methods
3.3.1. Field-work Small exfoliation sheets of granite and mylonite (herein termed ‘chips’) were observed to be
displaced from bedrock outcrops across an approximately 100 km2 area in the near-field
region of the 2016 Petermann earthquake (Figure 3.4). Chips were identifiably offset from
bedrock locations as the shapes and colour of the underside of the chip matched lighter
patches of bedrock where the chip had previously protected the outcrop from development
of a desert varnish (e.g. Figure 3.4 a, c). Alternatively, in foliated outcrops with less clearly
defined varnish, the source location of chips was often visible as freshly damaged surfaces
and edges of outcrop as defined by rough and lighter coloured sections (e.g. Figure 3.4 b, e,
f), or the presence of fine granular material where the chip was dislodged.
Chips are interpreted to have been displaced coseismically as multiple observations were
made where displaced chips overlay fresh but damaged vegetation, exposed insect castings
and habitations, and created fresh dust at impact sites with bedrock. Potential alternate
explanations for the displacement of rock chips include: anthropogenic displacement by the
Pitjantjatjara people who until recently (50 to 100 years ago) regularly moved across the
Petermann area on foot; displacement by hopping or hooved animals moving across bedrock
outcrops including kangaroos, small hopping marsupials, and more recently feral camels;
lightning strikes and heavy sheet-wash from large infrequent storms; spallation due to large
41
daily and annual temperature gradients in the desert climate or rapid cooling from infrequent
day-time storms (e.g. Collins and Stock (2016)). Observation of hundreds of displaced chips
across such a wide area (~100 km2) which appear fresh, and with evidence of very recent
movement (e.g. overlying fresh but damaged vegetation) supports a young and similar age of
displacement (i.e. 2016) rather than a background steady-state displacement by other forces.
The chips are therefore interpreted to be coseismic with the Petermann earthquake, though
there is potential that a small cohort of chips may have been displaced by the alternative
mechanisms listed above.
All observations were made more than ten days (and up to 16 months) following the
mainshock and there is potential that some chips were displaced due to aftershock activity.
The largest aftershock (ML 4.3) occurred 11 months following the mainshock at 10 km depth
on the foot-wall, 4.2 km from the closest chip measurements (aftershock located by dense
aftershock network) (Figure 3.2). The depth and magnitude of this event limit the amount
of seismic energy experienced at the surface, and the distal location from observed displaced
chips (Figure 3.2) suggest it is unlikely to have contributed to chip displacement.
The 2nd to 9th largest aftershocks (ML 4.1 to 3.5) occurred within 25 hrs after the mainshock
across the hanging-wall between 0 km and 10 km from chip measurements. These events
were recorded by the national seismic network and may have ± 10 km location errors (King
et al., (2019a); Leonard, (2008)), limiting the ability to directly relate them to locations of
displaced chips. In total, 60 aftershocks were recorded by the national network prior to the
first observation of displaced chips, with average ML 3.1 (ML 1.5 – 4.1). These aftershocks
have the potential to have caused local ‘rock bursts’ (e.g. Twidale and Bourne (2000) but no
single event, aside from the mainshock, is likely to have caused chip displacement across the
whole 100 km2 observation area.
Chip measurements were obtained over ten field days during three field seasons: ten days
after the mainshock; three weeks after the mainshock; and 16 months after the mainshock
(see King et al. (2018) for details on field campaigns). Two significant rainfall events occurred
between the first and second field trip, and in the 16 months between the second and third
field trip (King et al., (2018)). Due to the bedrock origin of rock chips (rather than soil /
sediment), evidence of the pre-seismic chip location was retained despite rainfall (e.g.
matching of the shape and/or colour of the pre-seismic chip location). Some evidence of
coseismic movement (e.g. dust from bedrock impact sites, crushed vegetation, exposed insect
castings) was removed by rainfall yet substantial evidence remained to ascertain the timing
of movement (e.g. visible fresh damage to bedrock, crushed vegetation, indented sand due
to impact, un-degraded seeds beneath chips (Figure 3.4 e, g, i, j)). In some instances re-
location of chips in the field defined a progressive sequence of chip movement (Figure 3.4
g, h, i) with chips initially moving in a different direction to that of underlying chips, discussed
more in Section 3.4.6. below.

42
Figure 3.4. Example photos of displaced chips and outcrops across the Petermann area. (a) typical dome-shaped granite outcrop with exfoliation sheets and varnish, exfoliation sheet on the edge of the outcrop has moved ‘down-slope’ but without clear coseismicity (b) typical ‘steep’ mylonite outcrop weathering along foliation planes rather than as exfoliation sheets; chip has been displaced ‘down-slope’ but remains on the outcrop (c) ‘flat’ outcrop with displaced and overturned exfoliation sheet, with clear source location based on varnish outline (d) ‘low’ outcrop with displaced chips in the foot-wall of the surface rupture (e) ‘steep’ outcrop where chip has been displaced ‘across-slope’ of its original position rather than ‘down-slope’ as may be expected by destabilisation from background erosion (f) chip has travelled ‘up-slope’ of its original
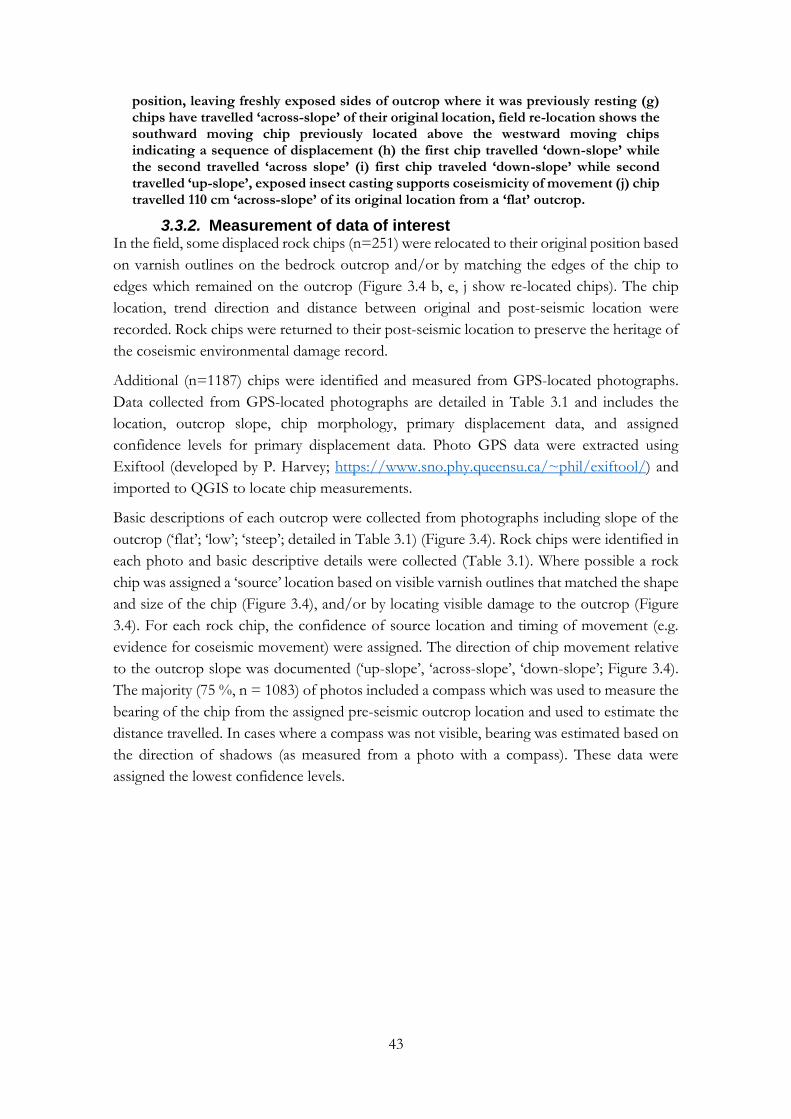
43
position, leaving freshly exposed sides of outcrop where it was previously resting (g) chips have travelled ‘across-slope’ of their original location, field re-location shows the southward moving chip previously located above the westward moving chips indicating a sequence of displacement (h) the first chip travelled ‘down-slope’ while the second travelled ‘across slope’ (i) first chip traveled ‘down-slope’ while second travelled ‘up-slope’, exposed insect casting supports coseismicity of movement (j) chip travelled 110 cm ‘across-slope’ of its original location from a ‘flat’ outcrop.
3.3.2. Measurement of data of interest In the field, some displaced rock chips (n=251) were relocated to their original position based
on varnish outlines on the bedrock outcrop and/or by matching the edges of the chip to
edges which remained on the outcrop (Figure 3.4 b, e, j show re-located chips). The chip
location, trend direction and distance between original and post-seismic location were
recorded. Rock chips were returned to their post-seismic location to preserve the heritage of
the coseismic environmental damage record.
Additional (n=1187) chips were identified and measured from GPS-located photographs.
Data collected from GPS-located photographs are detailed in Table 3.1 and includes the
location, outcrop slope, chip morphology, primary displacement data, and assigned
confidence levels for primary displacement data. Photo GPS data were extracted using
Exiftool (developed by P. Harvey; https://www.sno.phy.queensu.ca/~phil/exiftool/) and
imported to QGIS to locate chip measurements.
Basic descriptions of each outcrop were collected from photographs including slope of the
outcrop (‘flat’; ‘low’; ‘steep’; detailed in Table 3.1) (Figure 3.4). Rock chips were identified in
each photo and basic descriptive details were collected (Table 3.1). Where possible a rock
chip was assigned a ‘source’ location based on visible varnish outlines that matched the shape
and size of the chip (Figure 3.4), and/or by locating visible damage to the outcrop (Figure
3.4). For each rock chip, the confidence of source location and timing of movement (e.g.
evidence for coseismic movement) were assigned. The direction of chip movement relative
to the outcrop slope was documented (‘up-slope’, ‘across-slope’, ‘down-slope’; Figure 3.4).
The majority (75 %, n = 1083) of photos included a compass which was used to measure the
bearing of the chip from the assigned pre-seismic outcrop location and used to estimate the
distance travelled. In cases where a compass was not visible, bearing was estimated based on
the direction of shadows (as measured from a photo with a compass). These data were
assigned the lowest confidence levels.
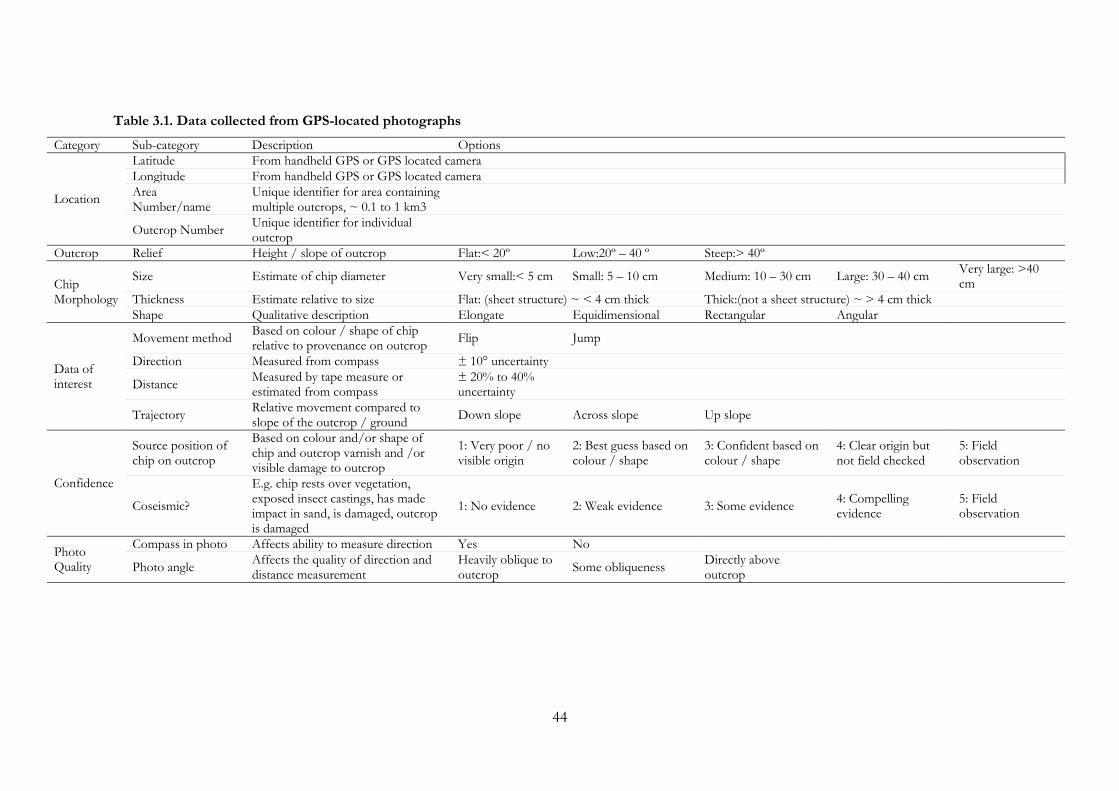
44
Table 3.1. Data collected from GPS-located photographs
Category Sub-category Description Options
Location
Latitude From handheld GPS or GPS located camera
Longitude From handheld GPS or GPS located camera
Area Number/name
Unique identifier for area containing multiple outcrops, ~ 0.1 to 1 km3
Outcrop Number Unique identifier for individual outcrop
Outcrop Relief Height / slope of outcrop Flat:< 20º Low:20º – 40 º Steep:> 40º
Chip Morphology
Size Estimate of chip diameter Very small:< 5 cm Small: 5 – 10 cm Medium: 10 – 30 cm Large: 30 – 40 cm Very large: >40 cm
Thickness Estimate relative to size Flat: (sheet structure) ~ < 4 cm thick Thick:(not a sheet structure) ~ > 4 cm thick
Shape Qualitative description Elongate Equidimensional Rectangular Angular
Data of interest
Movement method Based on colour / shape of chip relative to provenance on outcrop
Flip Jump
Direction Measured from compass ± 10° uncertainty
Distance Measured by tape measure or estimated from compass
± 20% to 40% uncertainty
Trajectory Relative movement compared to slope of the outcrop / ground
Down slope Across slope Up slope
Confidence
Source position of chip on outcrop
Based on colour and/or shape of chip and outcrop varnish and /or visible damage to outcrop
1: Very poor / no visible origin
2: Best guess based on colour / shape
3: Confident based on colour / shape
4: Clear origin but not field checked
5: Field observation
Coseismic?
E.g. chip rests over vegetation, exposed insect castings, has made impact in sand, is damaged, outcrop is damaged
1: No evidence 2: Weak evidence 3: Some evidence 4: Compelling evidence
5: Field observation
Photo Quality
Compass in photo Affects ability to measure direction Yes No
Photo angle Affects the quality of direction and distance measurement
Heavily oblique to outcrop
Some obliqueness Directly above outcrop
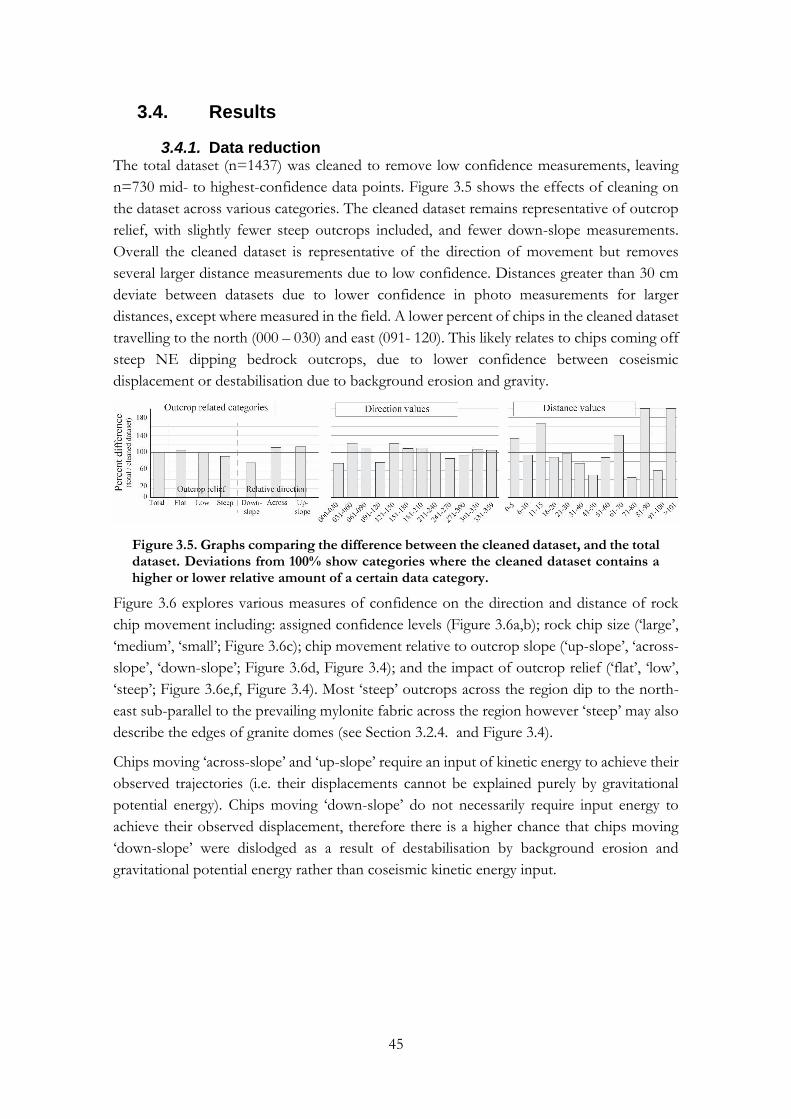
45
3.4. Results
3.4.1. Data reduction The total dataset (n=1437) was cleaned to remove low confidence measurements, leaving
n=730 mid- to highest-confidence data points. Figure 3.5 shows the effects of cleaning on
the dataset across various categories. The cleaned dataset remains representative of outcrop
relief, with slightly fewer steep outcrops included, and fewer down-slope measurements.
Overall the cleaned dataset is representative of the direction of movement but removes
several larger distance measurements due to low confidence. Distances greater than 30 cm
deviate between datasets due to lower confidence in photo measurements for larger
distances, except where measured in the field. A lower percent of chips in the cleaned dataset
travelling to the north (000 – 030) and east (091- 120). This likely relates to chips coming off
steep NE dipping bedrock outcrops, due to lower confidence between coseismic
displacement or destabilisation due to background erosion and gravity.
Figure 3.5. Graphs comparing the difference between the cleaned dataset, and the total dataset. Deviations from 100% show categories where the cleaned dataset contains a higher or lower relative amount of a certain data category.
Figure 3.6 explores various measures of confidence on the direction and distance of rock
chip movement including: assigned confidence levels (Figure 3.6a,b); rock chip size (‘large’,
‘medium’, ‘small’; Figure 3.6c); chip movement relative to outcrop slope (‘up-slope’, ‘across-
slope’, ‘down-slope’; Figure 3.6d, Figure 3.4); and the impact of outcrop relief (‘flat’, ‘low’,
‘steep’; Figure 3.6e,f, Figure 3.4). Most ‘steep’ outcrops across the region dip to the north-
east sub-parallel to the prevailing mylonite fabric across the region however ‘steep’ may also
describe the edges of granite domes (see Section 3.2.4. and Figure 3.4).
Chips moving ‘across-slope’ and ‘up-slope’ require an input of kinetic energy to achieve their
observed trajectories (i.e. their displacements cannot be explained purely by gravitational
potential energy). Chips moving ‘down-slope’ do not necessarily require input energy to
achieve their observed displacement, therefore there is a higher chance that chips moving
‘down-slope’ were dislodged as a result of destabilisation by background erosion and
gravitational potential energy rather than coseismic kinetic energy input.

46
Figure 3.6. Rose diagrams showing distribution of trend data across confidence levels for coseismic movement and selection of chip origin, and outcrop height/dip.
The influence of slope, background erosion and gravity on chip movement is explored in
Figure 3.6f by comparing chips from steep outcrops (from which chips are more likely to
have been displaced pre-earthquake) that travelled ‘across-slope’ with those that travelled
‘down-slope’. Both datasets show strong NE directed movement which matches the
dominant direction of displacement for ‘low’ and ‘flat’ outcrops, suggesting outcrop slope,
background erosion, and gravity are not the primary driver for NE directed chip
displacement, even from steep outcrops (e.g. Figure 3.4e). Overall a dominant north-east
and/or south-west (strike-normal) direction of movement is present regardless of confidence
level, chip size and outcrop relief.
47
3.4.2. Spatial distribution of measurements Data were collected along five profiles (L = 1.2 to 6.9 km) approximately perpendicular to
the surface rupture (Figure 3.2), one profile approximately parallel to the surface rupture (6a;
L = 2.4 km; Figure 3.2) and one granitic outcrop along the access track (7a) (Figure 3.2).
Each of the five profiles contains 2 – 4 individual locations, labelled from south-west (foot-
wall) to north-east (hanging-wall) (locations shown on Figure 3.2, Figure 3.8, Figure 3.9).
Figure 3.6g shows summary data for different across-rupture distance intervals. A greater
number of displaced chips were documented on the hanging-wall than the foot-wall, and
hanging-wall locations show more dominant NE and/or SW direction to movement. The
greatest distances occur on the hanging-wall within 1 km of the surface rupture and are
directed to the SW and NE.
Along-rupture and individual location data are presented in multiple ways: summary
information for each location is presented in Table 3.2; Figure 3.8 shows a whole map view
of combined direction and distance rose diagrams and includes the area of InSAR defined
surface deformation; Figure 3.9 shows direction and distance rose diagrams in higher
resolution maps of each transect, and measured vertical offsets along the surface rupture;
Figure 3.10 shows separate distance and direction rose diagrams for each location as a grid
(this data is combined in Figure 3.8). Various interpretations of the data are presented in
Figure 3.13 and Figure 3.14 in Section 3.5. (Discussion).
3.4.3. Number of chips per location The number of chips measured per location is in part dependant on the number of outcrops
in each location (Figure 3.2b shows bedrock outcrops across the region), the size of
individual outcrops, the degree of weathering of each outcrop, and the field-time spent at
each location. At location 2d, which straddles the surface rupture, 27 chip measurements
recorded from 17 outcrops were documented (Table 3.2). In comparison, 25 outcrops
including a 10 m high granite outcrop with extensive exfoliation weathering (Figure 3.2b)
were documented in location 2b (on the foot-wall 2 km from surface rupture) with 21 chip
measurements (Table 3.2). This disparity between the higher number of chips recorded at a
location with fewer and smaller outcrops (2d) compared to a location with large and
numerous outcrops (2b), suggests fault-relative location imparted a primary control on
coseismic chip movement.
Similarly, few (1a, n=32; 1b and 1c, n=9) chips were observed on the hanging-wall at the
north-west end of rupture, where surface rupture offset was also at a minimum and only
visible as distributed cracking (see maps of visible surface rupture in Figure 3.8 and vertical
offset measurements in Figure 3.9). In contrast, locations at the south-east end of the rupture
(5a – 5d) show a higher number of observed chips (n= 29 to 91). Locations 1a and 5a have
comparable fault-relative locations (~ 2 km from surface rupture on the foot-wall) and
similar number of documented outcrops (18 and 14 respectively) yet 32 chips were measured
in 1a compared to 52 in 5a. The asymmetry in number of chips displaced in the north-west
compared to south-east ends of rupture likely relates to an asymmetry in seismic processes
(e.g the amount of offset along the fault).
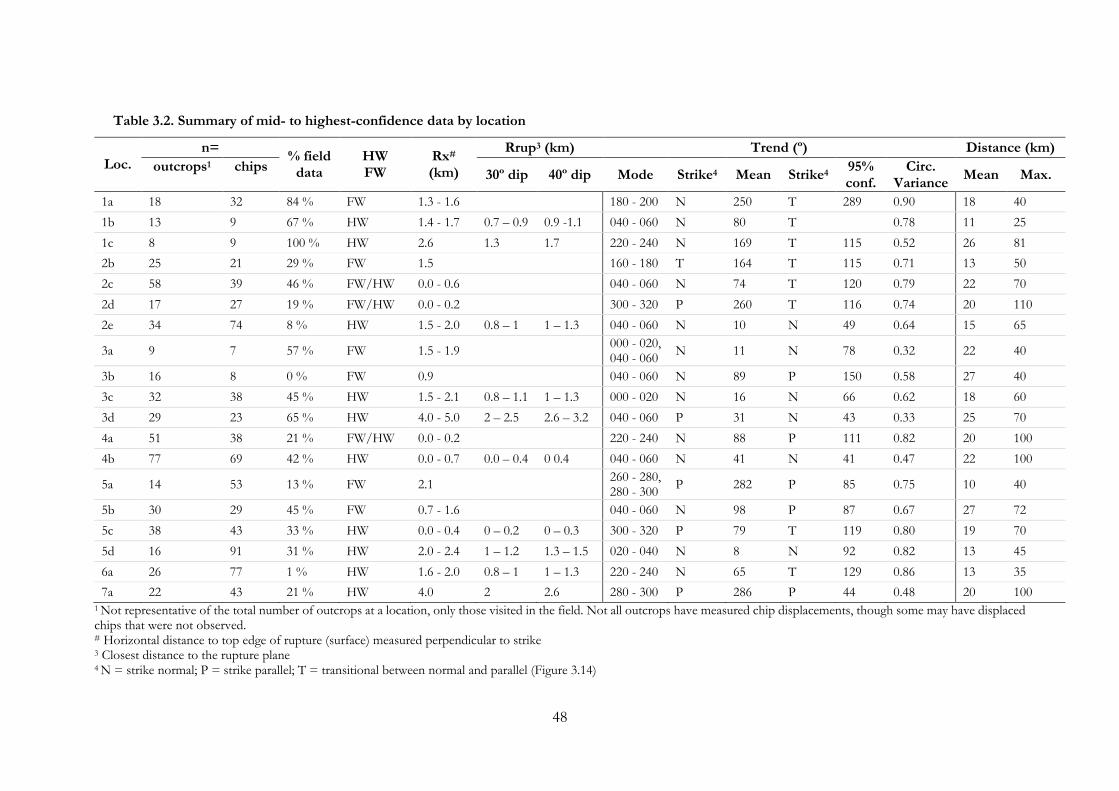
48
Table 3.2. Summary of mid- to highest-confidence data by location
Loc.
n= % field
data HW FW
Rx# (km)
Rrup3 (km) Trend (º) Distance (km)
outcrops1 chips 30º dip 40º dip Mode Strike4 Mean Strike4
95% conf.
Circ. Variance
Mean Max.
1a 18 32 84 % FW 1.3 - 1.6 180 - 200 N 250 T 289 0.90 18 40
1b 13 9 67 % HW 1.4 - 1.7 0.7 – 0.9 0.9 -1.1 040 - 060 N 80 T 0.78 11 25
1c 8 9 100 % HW 2.6 1.3 1.7 220 - 240 N 169 T 115 0.52 26 81
2b 25 21 29 % FW 1.5 160 - 180 T 164 T 115 0.71 13 50
2c 58 39 46 % FW/HW 0.0 - 0.6 040 - 060 N 74 T 120 0.79 22 70
2d 17 27 19 % FW/HW 0.0 - 0.2 300 - 320 P 260 T 116 0.74 20 110
2e 34 74 8 % HW 1.5 - 2.0 0.8 – 1 1 – 1.3 040 - 060 N 10 N 49 0.64 15 65
3a 9 7 57 % FW 1.5 - 1.9 000 - 020, 040 - 060
N 11 N 78 0.32 22 40
3b 16 8 0 % FW 0.9 040 - 060 N 89 P 150 0.58 27 40
3c 32 38 45 % HW 1.5 - 2.1 0.8 – 1.1 1 – 1.3 000 - 020 N 16 N 66 0.62 18 60
3d 29 23 65 % HW 4.0 - 5.0 2 – 2.5 2.6 – 3.2 040 - 060 P 31 N 43 0.33 25 70
4a 51 38 21 % FW/HW 0.0 - 0.2 220 - 240 N 88 P 111 0.82 20 100
4b 77 69 42 % HW 0.0 - 0.7 0.0 – 0.4 0 0.4 040 - 060 N 41 N 41 0.47 22 100
5a 14 53 13 % FW 2.1 260 - 280, 280 - 300
P 282 P 85 0.75 10 40
5b 30 29 45 % FW 0.7 - 1.6 040 - 060 N 98 P 87 0.67 27 72
5c 38 43 33 % HW 0.0 - 0.4 0 – 0.2 0 – 0.3 300 - 320 P 79 T 119 0.80 19 70
5d 16 91 31 % HW 2.0 - 2.4 1 – 1.2 1.3 – 1.5 020 - 040 N 8 N 92 0.82 13 45
6a 26 77 1 % HW 1.6 - 2.0 0.8 – 1 1 – 1.3 220 - 240 N 65 T 129 0.86 13 35
7a 22 43 21 % HW 4.0 2 2.6 280 - 300 P 286 P 44 0.48 20 100 1 Not representative of the total number of outcrops at a location, only those visited in the field. Not all outcrops have measured chip displacements, though some may have displaced chips that were not observed. # Horizontal distance to top edge of rupture (surface) measured perpendicular to strike 3 Closest distance to the rupture plane 4 N = strike normal; P = strike parallel; T = transitional between normal and parallel (Figure 3.14)
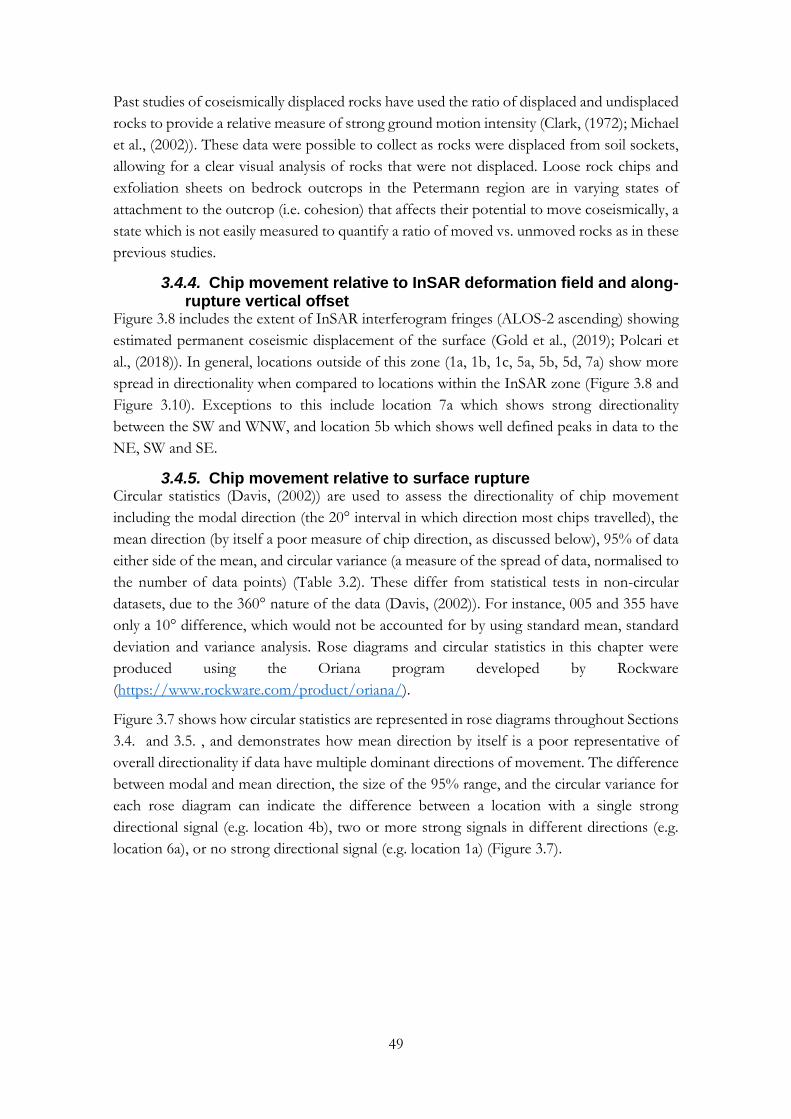
49
Past studies of coseismically displaced rocks have used the ratio of displaced and undisplaced
rocks to provide a relative measure of strong ground motion intensity (Clark, (1972); Michael
et al., (2002)). These data were possible to collect as rocks were displaced from soil sockets,
allowing for a clear visual analysis of rocks that were not displaced. Loose rock chips and
exfoliation sheets on bedrock outcrops in the Petermann region are in varying states of
attachment to the outcrop (i.e. cohesion) that affects their potential to move coseismically, a
state which is not easily measured to quantify a ratio of moved vs. unmoved rocks as in these
previous studies.
3.4.4. Chip movement relative to InSAR deformation field and along-rupture vertical offset
Figure 3.8 includes the extent of InSAR interferogram fringes (ALOS-2 ascending) showing
estimated permanent coseismic displacement of the surface (Gold et al., (2019); Polcari et
al., (2018)). In general, locations outside of this zone (1a, 1b, 1c, 5a, 5b, 5d, 7a) show more
spread in directionality when compared to locations within the InSAR zone (Figure 3.8 and
Figure 3.10). Exceptions to this include location 7a which shows strong directionality
between the SW and WNW, and location 5b which shows well defined peaks in data to the
NE, SW and SE.
3.4.5. Chip movement relative to surface rupture Circular statistics (Davis, (2002)) are used to assess the directionality of chip movement
including the modal direction (the 20° interval in which direction most chips travelled), the
mean direction (by itself a poor measure of chip direction, as discussed below), 95% of data
either side of the mean, and circular variance (a measure of the spread of data, normalised to
the number of data points) (Table 3.2). These differ from statistical tests in non-circular
datasets, due to the 360° nature of the data (Davis, (2002)). For instance, 005 and 355 have
only a 10° difference, which would not be accounted for by using standard mean, standard
deviation and variance analysis. Rose diagrams and circular statistics in this chapter were
produced using the Oriana program developed by Rockware
(https://www.rockware.com/product/oriana/).
Figure 3.7 shows how circular statistics are represented in rose diagrams throughout Sections
3.4. and 3.5. , and demonstrates how mean direction by itself is a poor representative of
overall directionality if data have multiple dominant directions of movement. The difference
between modal and mean direction, the size of the 95% range, and the circular variance for
each rose diagram can indicate the difference between a location with a single strong
directional signal (e.g. location 4b), two or more strong signals in different directions (e.g.
location 6a), or no strong directional signal (e.g. location 1a) (Figure 3.7).

50
Figure 3.7. Schematic diagrams of circular statistics for rose diagrams, and strike vs. fault relative movement descriptions
This Results section presents the direction of chip movement in plan/map view, and
therefore describes direction as strike-normal (away or toward rupture) or strike-parallel. This
is in contrast with Section 3.5. which discusses mechanisms for chip directionality related to
fault movement, and hence uses fault-relative descriptions (normal or parallel). The
distinction between strike-relative and fault-relative terminology is represented schematically
in Figure 3.7c demonstrating how fault-parallel and fault-normal movement both produce
strike-normal directions in plan-view. This is explored more in Section 3.5.
The directionality of chip movements varies both across, and along the surface rupture trace,
as shown in Figure 3.8 and Figure 3.9. Locations 1a, 1b and 1c at the north-west end of
rupture show variable directions of movement. This may relate to the low number of chips
recorded not exhibiting a strong signal, or that outcrops were located outside of the extent
of InSAR defined surface offset. In contrast, at the south-east end of rupture, the mean and
95% of data at locations 5b, 5c, 5d and 6a show directionality away from the surface rupture.
The modal direction of chip movement at these locations does not necessarily match the
mean showing either multiple dominant directions (5b, 6a) or a large spread in data (5c, 5d).
Outcrops on the hanging-wall in the central region of surface rupture (2e, 3c, 3d) show
consistently different direction orientations to those on the foot-wall at similar distances (2b,
3a, 3b). Foot-wall locations close to the surface rupture (2c, 3b, 4a) show larger maximum
distances and consistent mean and 95 percentiles directed towards the east (between NE to
south). Modal directions fall within the 95-percentile range and are strike-normal towards
the NE and/or SW.
Hanging-wall locations at distance from the surface rupture (1.5 km to 5 km) (2e, 3c, 3d;
Figure 3.8) show strong strike-normal (NE) and strike-parallel (NW – SE) movement, with
few chips travelling towards the surface rupture (SW). The distances of travel are similar
across these locations, with maximums of 60-70 cm (strike parallel for 2e and 3c, strike-
normal (NE) for 3d) and averages of 15 cm to 25 cm.
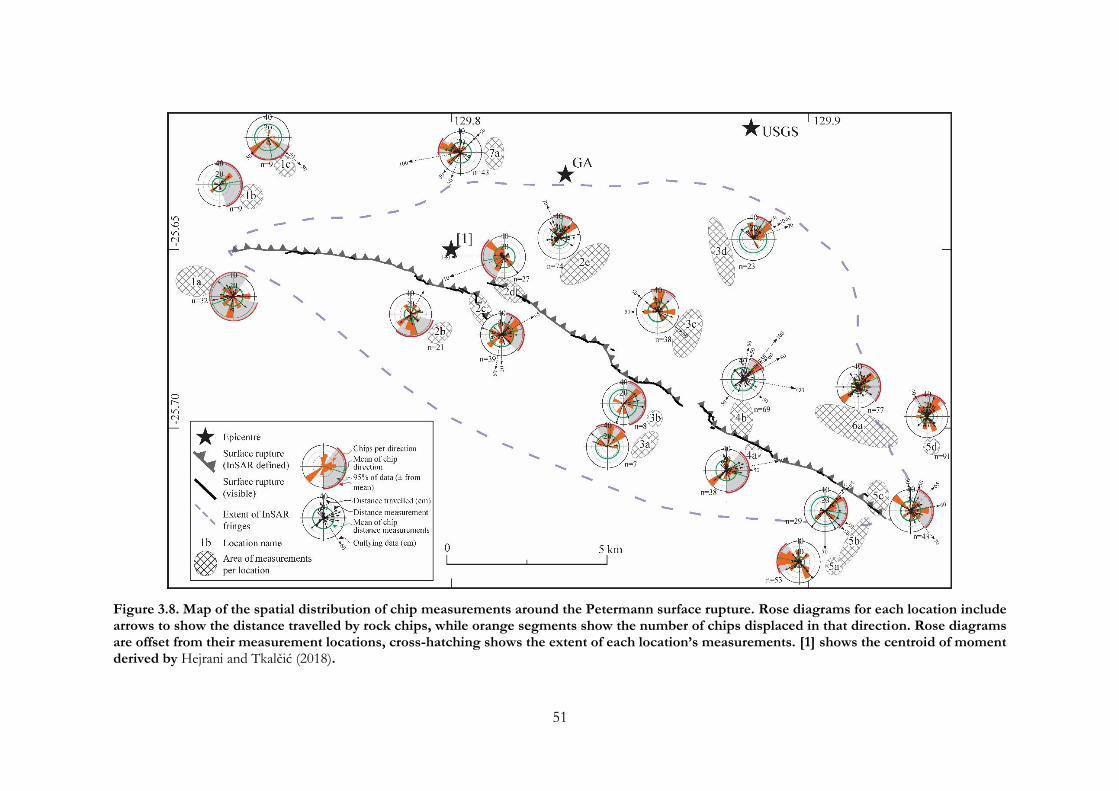
51
Figure 3.8. Map of the spatial distribution of chip measurements around the Petermann surface rupture. Rose diagrams for each location include arrows to show the distance travelled by rock chips, while orange segments show the number of chips displaced in that direction. Rose diagrams are offset from their measurement locations, cross-hatching shows the extent of each location’s measurements. [1] shows the centroid of moment derived by Hejrani and Tkalčić (2018).
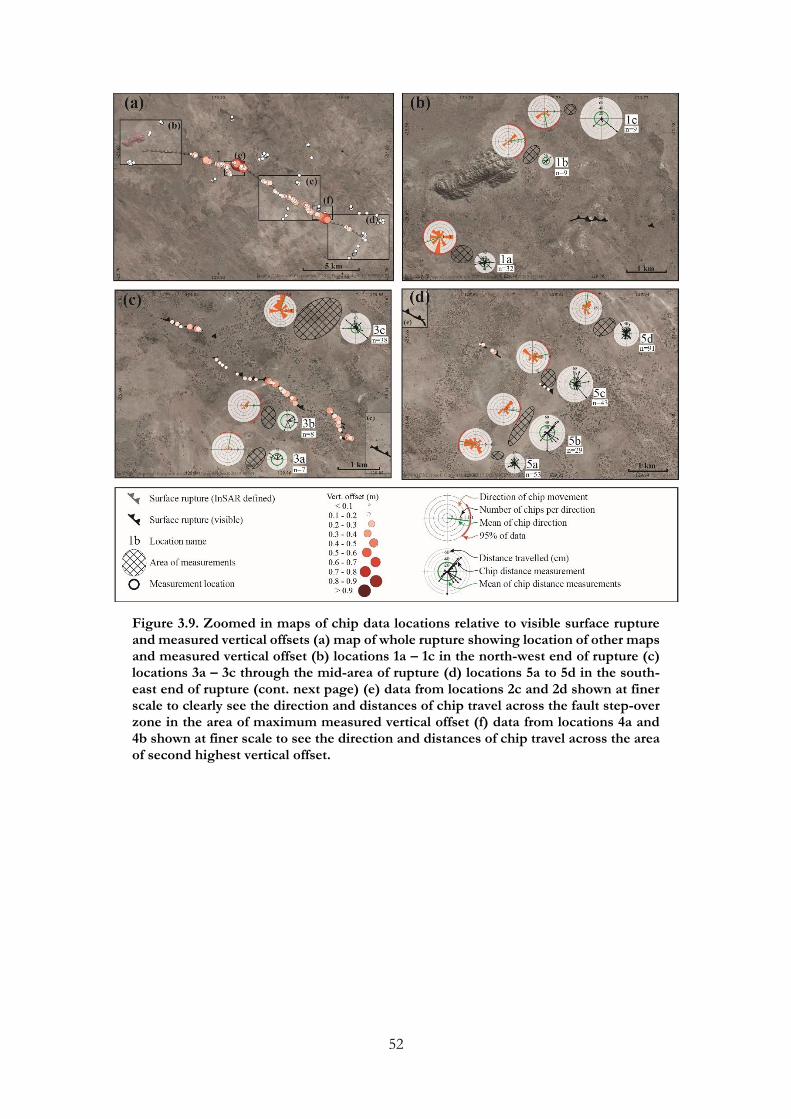
52
Figure 3.9. Zoomed in maps of chip data locations relative to visible surface rupture and measured vertical offsets (a) map of whole rupture showing location of other maps and measured vertical offset (b) locations 1a – 1c in the north-west end of rupture (c) locations 3a – 3c through the mid-area of rupture (d) locations 5a to 5d in the south-east end of rupture (cont. next page) (e) data from locations 2c and 2d shown at finer scale to clearly see the direction and distances of chip travel across the fault step-over zone in the area of maximum measured vertical offset (f) data from locations 4a and 4b shown at finer scale to see the direction and distances of chip travel across the area of second highest vertical offset.

53

54
Figure 3.10. Grid showing direction and distance rose diagrams for each location. Count of chips per direction is included (rose diagrams in Figure 3.8 are unit-less). The number of chips per location, and the circular variance (CV) are shown at the bottom left of each rose diagram.

55
Chips located at the surface rupture (2c, 2d, 4a and 4b) are best observed in Figure 3.9 which
shows locations sub-divided into smaller localities. This is particularly pertinent for locations
2c and 2d which cross the fault step-over and thus some outcrops are on both the foot-wall
of PF East (Petermann fault east; Figure 3.2) and hanging-wall of PF West (Petermann fault
west; Figure 3.2).
Location 2d outcrops are adjacent to the location of the maximum measured vertical surface
rupture offsets. The largest observed distance of all the data occurs on the foot-wall side of
location 2d (PF East) (hanging-wall of 2c / PF west) (Figure 3.9f). Outcrops adjacent to PF
East (2d) on both hanging-wall and foot-wall show mean, modal and 95 percentile directions
towards the SW (strike-normal), with very few measurements towards the NE, dissimilar to
other hanging-wall locations. Data on both the hanging-wall and foot-wall of PF West (2c)
show less consistency of direction at the scale of smaller localities (Figure 3.9f) though taken
together (Figure 3.10) they show a preference for NE to SE directed movement, near-
perpendicular to the direction of chips at location 2d.
Locations 4a and 4b occur along a section of surface rupture with the second highest
measured vertical offsets and simpler rupture than in locations 2c and 2d. Hanging-wall
outcrops (4b) show dominant NE directed movement at all localities, with maximum
distances increasing towards the surface rupture. Foot-wall outcrops (4a) show more varied
directionality with localities showing north, east and south-west modal and mean directions.
Most foot-wall localities show maximum distances less than those of the hanging-wall, except
for a single 100 cm measurement.
3.4.6. Sequentially displaced chips Three outcrops were identified during field work where field-reconstruction of prior chip
location resulted in evidence for a temporal sequence chip displacement directions and
associated ground motion directions (Figure 3.11). In all cases, the previously top-most chip
(that is, the chips displaced first) travelled downslope of its original outcrop location in a
variety of strike-relative directions. The underlying chips (that is, the chips displaced second)
travelled either across-slope, or up-slope of their original locations, in a variety of strike-
relative directions.
In the case of the sequenced-displacement outcrops in location 2c and 4b, the direction of
first and second displacement are approximately 90° to each other, implying a temporal
sequence of separate motions of movement. In the case of the outcrop at location 5a, chips
travelled in directions 120° from each other, which may relate to two separate mechanisms,
or one bi-directional mechanism (e.g. two-sided motion). These outcrops are discussed
further in Section 3.5.3. below.
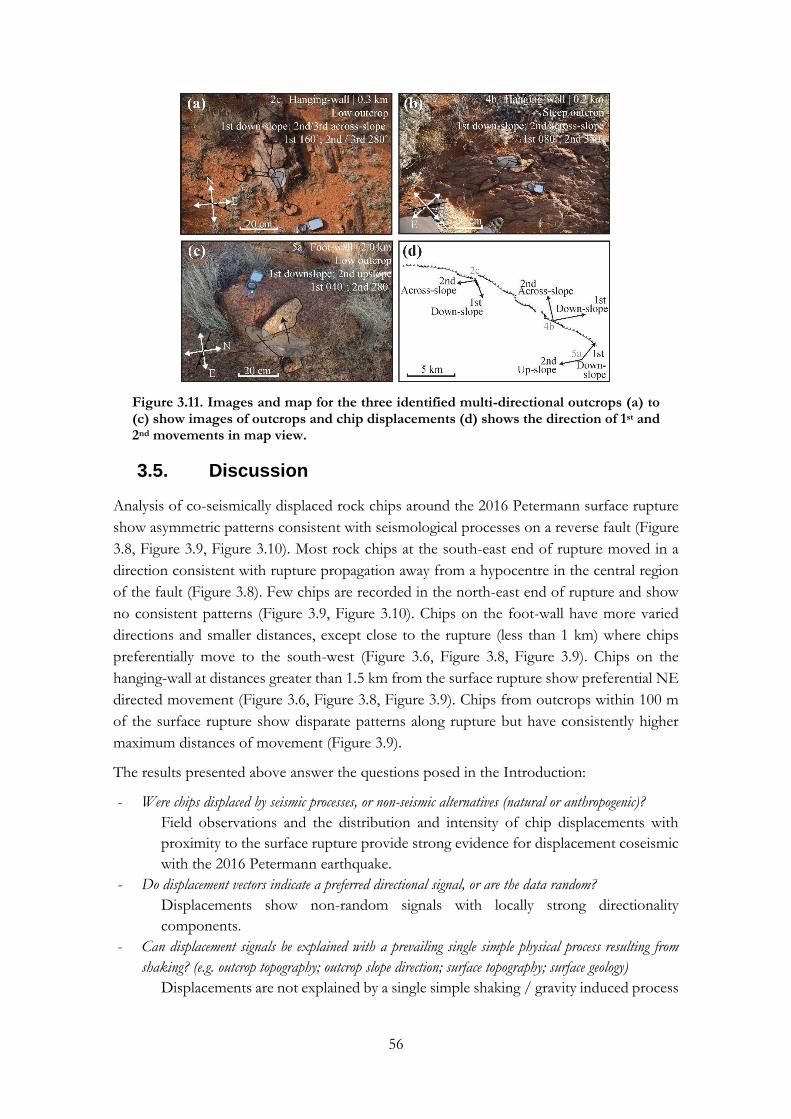
56
Figure 3.11. Images and map for the three identified multi-directional outcrops (a) to (c) show images of outcrops and chip displacements (d) shows the direction of 1st and 2nd movements in map view.
3.5. Discussion
Analysis of co-seismically displaced rock chips around the 2016 Petermann surface rupture
show asymmetric patterns consistent with seismological processes on a reverse fault (Figure
3.8, Figure 3.9, Figure 3.10). Most rock chips at the south-east end of rupture moved in a
direction consistent with rupture propagation away from a hypocentre in the central region
of the fault (Figure 3.8). Few chips are recorded in the north-east end of rupture and show
no consistent patterns (Figure 3.9, Figure 3.10). Chips on the foot-wall have more varied
directions and smaller distances, except close to the rupture (less than 1 km) where chips
preferentially move to the south-west (Figure 3.6, Figure 3.8, Figure 3.9). Chips on the
hanging-wall at distances greater than 1.5 km from the surface rupture show preferential NE
directed movement (Figure 3.6, Figure 3.8, Figure 3.9). Chips from outcrops within 100 m
of the surface rupture show disparate patterns along rupture but have consistently higher
maximum distances of movement (Figure 3.9).
The results presented above answer the questions posed in the Introduction:
- Were chips displaced by seismic processes, or non-seismic alternatives (natural or anthropogenic)?
Field observations and the distribution and intensity of chip displacements with
proximity to the surface rupture provide strong evidence for displacement coseismic
with the 2016 Petermann earthquake.
- Do displacement vectors indicate a preferred directional signal, or are the data random?
Displacements show non-random signals with locally strong directionality
components.
- Can displacement signals be explained with a prevailing single simple physical process resulting from
shaking? (e.g. outcrop topography; outcrop slope direction; surface topography; surface geology)
Displacements are not explained by a single simple shaking / gravity induced process
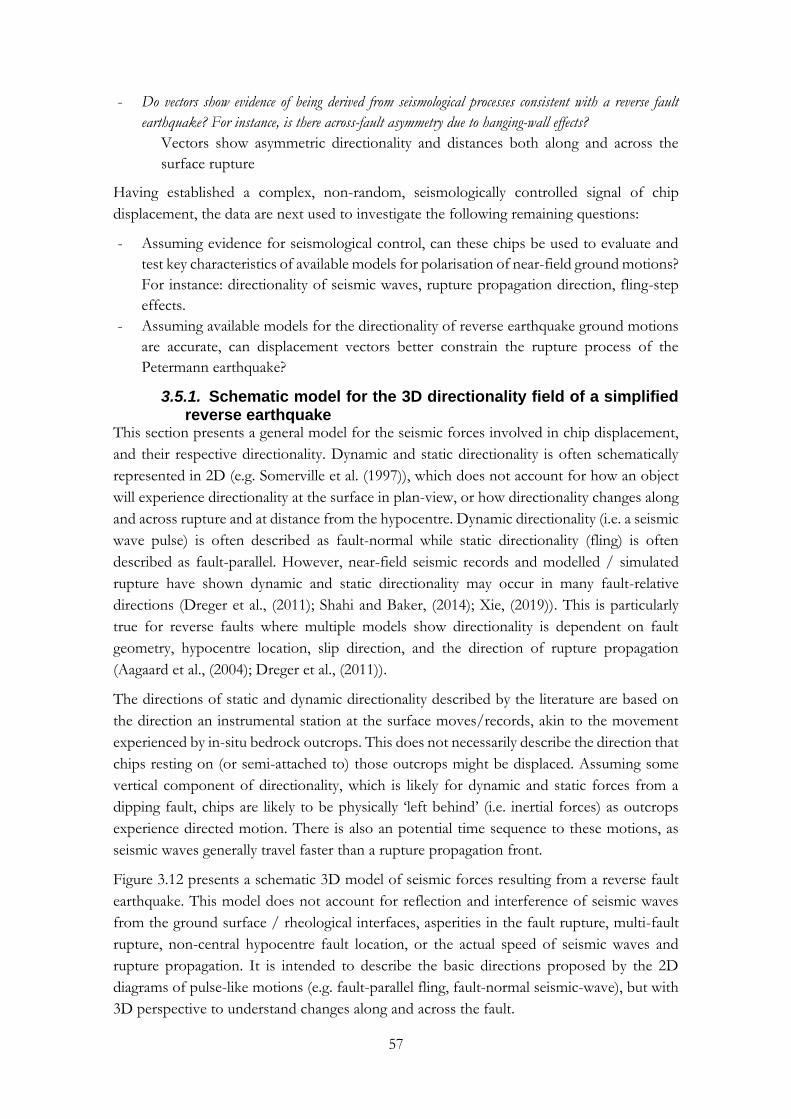
57
- Do vectors show evidence of being derived from seismological processes consistent with a reverse fault
earthquake? For instance, is there across-fault asymmetry due to hanging-wall effects?
Vectors show asymmetric directionality and distances both along and across the
surface rupture
Having established a complex, non-random, seismologically controlled signal of chip
displacement, the data are next used to investigate the following remaining questions:
- Assuming evidence for seismological control, can these chips be used to evaluate and
test key characteristics of available models for polarisation of near-field ground motions?
For instance: directionality of seismic waves, rupture propagation direction, fling-step
effects.
- Assuming available models for the directionality of reverse earthquake ground motions
are accurate, can displacement vectors better constrain the rupture process of the
Petermann earthquake?
3.5.1. Schematic model for the 3D directionality field of a simplified reverse earthquake
This section presents a general model for the seismic forces involved in chip displacement,
and their respective directionality. Dynamic and static directionality is often schematically
represented in 2D (e.g. Somerville et al. (1997)), which does not account for how an object
will experience directionality at the surface in plan-view, or how directionality changes along
and across rupture and at distance from the hypocentre. Dynamic directionality (i.e. a seismic
wave pulse) is often described as fault-normal while static directionality (fling) is often
described as fault-parallel. However, near-field seismic records and modelled / simulated
rupture have shown dynamic and static directionality may occur in many fault-relative
directions (Dreger et al., (2011); Shahi and Baker, (2014); Xie, (2019)). This is particularly
true for reverse faults where multiple models show directionality is dependent on fault
geometry, hypocentre location, slip direction, and the direction of rupture propagation
(Aagaard et al., (2004); Dreger et al., (2011)).
The directions of static and dynamic directionality described by the literature are based on
the direction an instrumental station at the surface moves/records, akin to the movement
experienced by in-situ bedrock outcrops. This does not necessarily describe the direction that
chips resting on (or semi-attached to) those outcrops might be displaced. Assuming some
vertical component of directionality, which is likely for dynamic and static forces from a
dipping fault, chips are likely to be physically ‘left behind’ (i.e. inertial forces) as outcrops
experience directed motion. There is also an potential time sequence to these motions, as
seismic waves generally travel faster than a rupture propagation front.
Figure 3.12 presents a schematic 3D model of seismic forces resulting from a reverse fault
earthquake. This model does not account for reflection and interference of seismic waves
from the ground surface / rheological interfaces, asperities in the fault rupture, multi-fault
rupture, non-central hypocentre fault location, or the actual speed of seismic waves and
rupture propagation. It is intended to describe the basic directions proposed by the 2D
diagrams of pulse-like motions (e.g. fault-parallel fling, fault-normal seismic-wave), but with
3D perspective to understand changes along and across the fault.
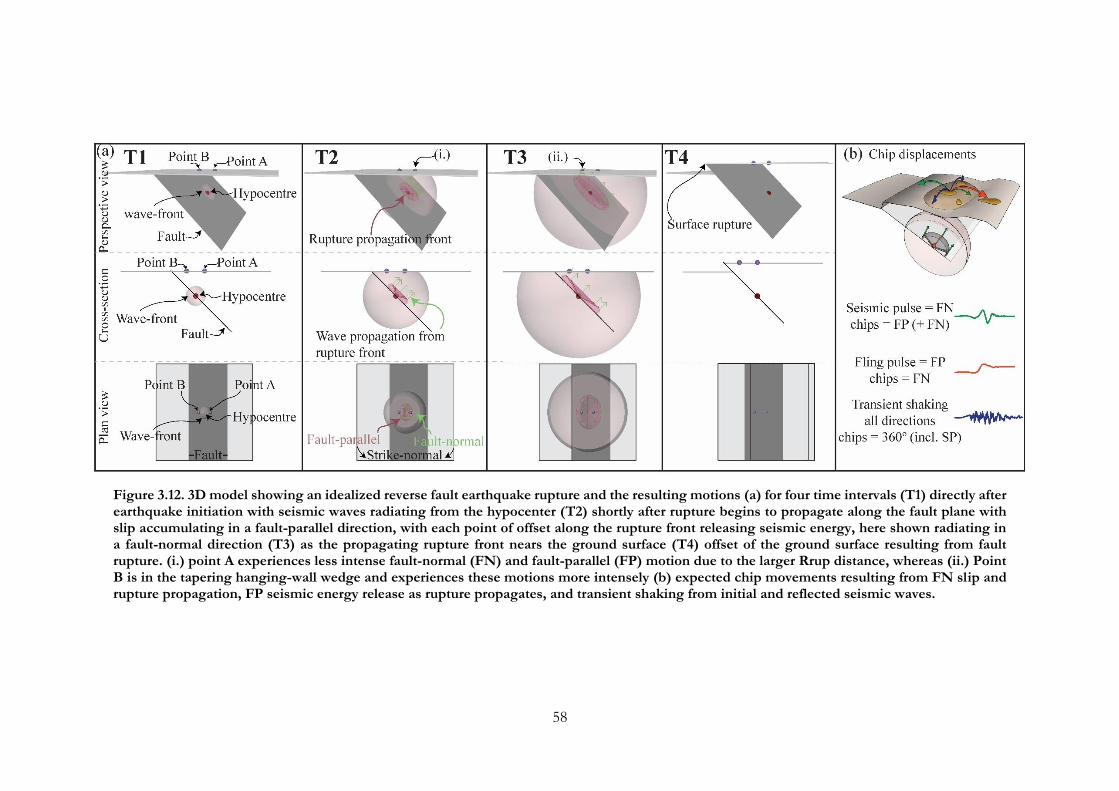
58
Figure 3.12. 3D model showing an idealized reverse fault earthquake rupture and the resulting motions (a) for four time intervals (T1) directly after earthquake initiation with seismic waves radiating from the hypocenter (T2) shortly after rupture begins to propagate along the fault plane with slip accumulating in a fault-parallel direction, with each point of offset along the rupture front releasing seismic energy, here shown radiating in a fault-normal direction (T3) as the propagating rupture front nears the ground surface (T4) offset of the ground surface resulting from fault rupture. (i.) point A experiences less intense fault-normal (FN) and fault-parallel (FP) motion due to the larger Rrup distance, whereas (ii.) Point B is in the tapering hanging-wall wedge and experiences these motions more intensely (b) expected chip movements resulting from FN slip and rupture propagation, FP seismic energy release as rupture propagates, and transient shaking from initial and reflected seismic waves.
59
The model proposes that at time 1 (T1) (immediately following earthquake initiation), seismic
waves begin to propagate away from the hypocentre. At T2, rupture begins to propagate
along the fault plane away from the hypocentre. At each point along the rupture front, which
travels in a fault-parallel direction, energy is released as the rocks experience slip along the
fault. This release of seismic energy along the propagating rupture front produces fault-
normal seismic pulses. Point A at the surface experiences this energy as a two-sided pulse,
and additionally experiences minor permanent offset as rupture propagates along the fault.
At T3, rupture propagation has continued across the fault, accumulating more fault-parallel
slip. Point B experiences a stronger fault-normal two-sided pulse than Point A, and larger
permanent fault-parallel offsets, due to a shorter Rrup distance in the tapering wedge of the
hanging-wall. At T4, rupture has propagated to the surface causing permanent offset of the
hanging-wall and foot-wall. Transient seismic waves continue to propagate and interfere with
each other until all energy is dissipated, not shown on the model.
The model demonstrates that in a 2D cross section rupture propagation can result in fault-
parallel permanent offset, and a fault-normal seismic-wave pulse. Plan view of this 3D model
demonstrates that at each point on the surface, this two-sided fault-normal seismic pulse
initially produces strike-normal motion away from the surface rupture (and then towards the
rupture as motion is recovered). One-sided fault-parallel rupture propagation however is
experienced at the surface (in plan-view) with varying directionality, as it relates to a
propagating rupture front outward from the hypocenter.
Figure 3.12b shows the proposed direction of chip movement resulting from the strong
ground motions in Figure 3.12a. This includes strike-parallel displacement away from the
surface rupture due to fault-parallel (FP) inertial forces, strike parallel displacement towards
the surface rupture from fault-normal (FN) inertial forces, and multi-directional
displacement due to transient seismic-wave strong ground motions.
This model provides a basic framework for understanding the temporal and directional
aspects of the observational data presented in the results of this chapter, within the general
constraints of the current understanding of pulse-like and directed strong ground motions
as observed instrumentally.
3.5.2. Interpretation of dynamic and static directionality from displaced chips
Figure 3.13 shows various ways of interpreting the raw chip directionality data presented in
Section 3.4. (Figure 3.8, Figure 3.9, Figure 3.10, Table 3.2). Figure 3.13b shows the dominant
direction of chip movement based on a visual interpretation of modal direction, mean
direction, and the 95-percentile range of data (Figure 3.13a). Hanging-wall data show a
consistent pattern of movement away from the surface rupture within the area defined by
InSAR surface deformation, except at location 2d where rupture steps over between faults.
This data is explored in more detail in Section 3.5.3. below.

60
Figure 3.13. Various ways of interpreting and representing directionality of chip data (a) summary data of modal direction, mean direction, mean distance, maximum distance, and 95% of data bounds (b) generalized dominant chip direction based on visual interpretation of modal, mean, and 95 percentile for each location (c) direction rose diagrams coloured to show fault-normal, fault-parallel and strike-parallel components of movement (see Figure 3.7) (d) directions of data which show two-sided motion (similar number of chips in opposite directions to each other) and single-sided motion (large difference in number of chips travelling in opposite directions to each other) based on full rose diagram (i.e. (c))

61
Figure 3.13c separates data into fault-normal and fault-parallel components (e.g. Figure 3.7)
based on the assumption of 2D movement at all locations along and across a planar fault
(striking 300°). This visualisation of the data shows, in general, more fault-normal directed
movement on the hanging-wall than fault-parallel, and more mixed directionality in the foot-
wall data. This may imply that hanging-wall chips experienced stronger fling related
directionality, while foot-wall chips experience both fling and dynamic directionality. As
demonstrated in Figure 3.12, this 2D simplification of motions may adequately describe fault-
normal motion (e.g. two-sided) along rupture, but does not describe directionality of one-
sided motion (fling) along the rupture in plan-view.
In Figure 3.13d, rose diagram segments that have nearly equal number of chips in opposing
directions are described as ‘two-sided’ movement, and segments that have large inequalities
between the number of chips moving in opposing directions are described as ‘one-sided’
movement. One-sided movement is best described by static permanent offsets rather than
seismic wave related motion. Two-sided chip movement may describe ‘pulse-like’ dynamic
strong-ground motions.
Some locations demonstrate strike-normal two-sided movement as may be expected by a
dynamic (seismic-wave) directionality pulse (Figure 3.12), however this is not consistent with
all two-sided orientations, suggesting a two-sided pulse of directionality is not the only
control on two-sided chip movement. Two-sided movement does not necessarily require
pulse-like motions as all seismic waves (P-waves, S-waves, Love-waves and Rayleigh waves)
produce two-sided motions in varying hypocentre-relative directions. Directionality of one-
sided pulses is generally consistent with the idea of fling-direction in plan-view relating to
rupture propagating from a hypocentre (Figure 3.12).
In summary, the data may support an interpretation that fault-parallel fling related motions
on the hanging-wall produced one-sided directed chip motion away from a hypocentre
generally located in the centre of PF East, but the data are not necessarily consistent with a
fault-normal dynamic pulse-like directionality (though, this does not negate non-pulse
seismic wave contributions to chip movement, e.g transient shaking in Figure 3.12). This
interpretation of the data is based on a simplistic model of fault-normal and fault-parallel
strong ground motions (as often described) which has shown to be inconsistent with records
and modelling of directionality fields, particularly for dip-slip events (Dreger et al., (2011);
Shahi and Baker, (2014); Xie, (2019)).
3.5.3. Hypocentre location and rupture directivity constrained by displaced chips
As seen in the models by Dreger et al. (2011) and Aagaard et al. (2004), directionality for dip-
slip earthquakes is complicated by the location and depth of the hypocentre, and the direction
of slip relative to rupture propagation direction. The Petermann earthquake occurred 160
km from the closest seismometer, and thus the hypocentral location is imprecise, with errors
up to 10 km for published epicentres. Given the available chip displacements should relate
to the location of the hypocentre as described by models of dip-slip directionality, this section
explores the potential for chip data to better constrain the hypocentre location and the
direction of rupture propagation.

62
The data presented in Sections 3.4. and 3.5.2. shows that the chip directionality signal is
complex and cannot be simply described by fault-normal and fault-parallel motions. In
particular, the three sequenced-displacement outcrops discussed in Section 3.4.6. show that
some chips were initially displaced in a different direction to underlying chips, implying a
temporal sequence of distinct ground motion directions (Figure 3.4). Any model produced
to explain the observed complex directionality of chip motion must also resolve the timing
and directions of these sequenced-displacement outcrops. The first motion experienced by
the sequenced-displacement outcrops induced down-slope chip movement, while the second
produced across- or up-slope movement. The simplest way to resolve these two directions
of movement is by invoking in the first instance seismic shaking to produce down-slope
movement through gravitationally controlled motion, and in the second instance static
ground displacements inducing up-slope (or across-slope) movement through inclined input
energies (e.g. vertical and horizontal components of motion).
Figure 3.14 shows the surface orientations of compressional waves, shear waves, one-sided
fling pulse (from Figure 3.12) and two-sided seismic pulse (from Figure 3.12). The
hypocentre in this figure was located by projecting these strong ground motions to a point
source and moving the point source around the hanging-wall until the orientations of the
strong ground motion directions resolved to adequately match the direction of chip
movements recorded at the three sequenced-displacement outcrops.
Figure 3.14a demonstrates the direction of P-wave motion propagated from a hypocentre
located central to PF East, while Figure 3.14b demonstrates horizontal seismic waves (S- or
Love-waves). While some outcrops show directionality potentially consistent with P-wave
polarity this does not correlate with the first-motion recorded by the sequenced-displacement
outcrops. Figure 3.14b shows that the orientation of horizontal waves radiating from the
proposed hypocentre aligns well with the directions observed for first-motions at each of the
multi-directional outcrop locations. This direction is also sub-parallel to chip directions
observed at other locations across the area.
Figure 3.14c shows the hypothetical direction of rupture propagation and fling from the
proposed hypocentre, which can potentially explain the direction of secondary chip
movement at all three sequenced-displacement outcrops. First, at location 5a on the foot-
wall, downwards NE directed permanent foot-wall offset may explain an up-slope chip
movement directed in the opposite direction (SW). In location 4b close to the surface rupture
on the hanging-wall, across-slope movement to the north may be explained by NE motion
resulting from static offset of outcrops upwards and towards the SW. Though the chip
direction at this outcrop is oblique to a strike-normal direction, the dominant movement
across location 4b is strongly strike-normal, supporting a strong fling-step signal in this
location. South-west directed across-slope movement at location 2c is poorly explained by
opposing motion of hanging-wall fling offset of PF West to the NE. However, this outcrop
was initially located on the foot-wall of PF East prior to rupture propagating to PF West,
and therefore may have experienced an initial downward NE directed pulse, causing chip
movement to the SW prior to uplift commencing along PF West.

63
Figure 3.14 Models for seismic wave, fling, and one-sided pulse related chip displacement from a proposed hypocenter location slightly north-west of the center of PF East (a) P-wave direction at each chip location, based on the assumption that the P-wave travels ahead of other waves (i.e. non-pulse-like behavior) (b) horizontal wave direction (Love waves?) at each chip location, potentially explaining the first chip displacement for the three sequenced-displacement outcrops (Section 3.4.6. and Figure 3.11) (c) direction of fling (one-sided pulse) motion as proposed in Figure 3.13 from the proposed epicentre, potentially accounting for the direction of the second chips displaced at the sequenced-displacement outcrops in location 2d and 4b (d) first direction of the two-sided pulse motion as proposed in Figure 3.13, from the proposed epicenter location. Directionality of motions in (c) and (d) is not necessarily applicable across both hanging-wall and foot-wall.

64
Figure 3.15. Chip direction maps from Figure 3.13 projected onto 3D models of the Petermann faults (PF East, PF West) and Woodroffe Thrust (a) and (b) two perspective views of 3D fault model with the ground surface showing the generalized direction of dominant chip direction relative to fault geometry (Figure 3.13b), and along-rupture RTK derived vertical offset measurements shown schematically along the rupture. Fault intersections are based on geometries from available aftershock, trenching, and geophysical data (Attanayake et al., (2019); King et al., (2019d)), the hypocenter is located based on Figure 3.14, and [1] shows the depth of the centroid of moment derived by Hejrani and Tkalčić (2018) located onto PF East, 1.5 km east of the published solution. (c) and (d) show the same 3D model as (a) and (b) with the directions of one- and two- sided chip motions on the ground surface (Figure 3.13d).
65
While not conclusive, a fling-step pulse potentially accounts for all secondary movements
observed at multi-directional outcrops. The coincidence of higher chip numbers and stronger
directivity to chip movement within the area of permanent surface offset as defined by
InSAR fringes (Figure 3.8) also supports permanent ground offsets being a dominant control
on the direction of chip movement.
The location of this proposed hypocentre was then tested against other seismological and
geophysical fault geometry constraints. Polcari et al. (2018) and Attanayake et al. (2019)
include schematic cross-sections of the Petermann fault and Woodroffe Thrust, proposing
they intersect at 3 – 4 km depth. The Attanayake et al. (2019) Petermann fault plane is
constrained by aftershock locations and depths (from a dense aftershock array), and the
Woodroffe Thrust geometry is based of available geophysical imaging both west and south
of the Petermann rupture (Edgoose et al., (2004); Neumann, (2013); Raimondo et al., (2010)).
Figure 3.15 models the two Petermann faults ( PF East, PF West) with 30° dips, and the
Woodroffe Thrust (located 10 km to the north-east) also with a 30° dip. This results in a
fault intersection at 3 km depth, approximately 5 km from the surface rupture along the
ground surface, the same distance as the epicentre/hypocentre proposed to explain chip
directionality. Chip displacements may therefore provide constraints on the geometry of the
faults, with a hypocentre along the fault intersection between PF East and the Woodroffe
Thrust.
The decreased number of chips offset at the end of PF West and the lower vertical
displacements measured along the surface rupture (Figure 3.15) and by InSAR data, may be
explained if by a decrease in available rupture energy following propagation from one fault
to another (i.e. the step-over in surface rupture). Hejrani and Tkalčić (2018) derive a centroid
of moment at 1 km depth in the vicinity of the fault step-over (Figure 3.2b), which may
describe this large amount of energy being released due to rupture propagating between faults
(essentially an asperity in rupture). The depth of this centroid of moment (1 km) is projected
onto the edge of PF East in Figure 3.15, located approximately 1.5 km east of the published
solution location. The solution coordinates of Hejrani and Tkalčić (2018) are provided to
only one decimal place and no location uncertainties are given, so it is possible that this
solution could be located closer to this inferred step-over between the two faults. This energy
released as rupture moves from one fault to another potentially provides a mechanism for
both the location and depth of the published centroid of moment, and the observed chip
displacements and surface rupture offsets along PF West.
3.5.4. Estimates of ground motions resulting in coseismic rock displacement
The observed chip movements describe both the directionality field of strong ground
motions and the strength of those strong ground motions, with chips recording longer
maximum displacements with proximity to the surface rupture. These displacements are a
direct result of the intensity of seismic energy, and therefore chips have the potential to
describe parameters such as PGA and PGV for use in ground motion prediction equations.
These values may be globally significant for understanding the change in magnitude with
distance from the surface rupture of a reverse earthquake in the very near field (less than 5

66
km). They would be particularly useful for Australian GMPEs, for which near-field records
of moderate magnitude earthquakes currently do not exist. No prior literature exists that is
specifically relevant to calculating PGA values for displaced chips such as those observed in
the Petermann event. This section explores available comparable models for coseismically
displaced objects, to understand potential avenues for deriving absolute intensity values.
Many authors describing the required force for overturning or upthrow of objects during
earthquakes model objects as rigid blocks (Psycharis and Jennings, (1985)), based on the
movement of objects such as statues, headstones, and precarious boulders. In these models,
the effects of rocking and slenderness are particularly important to block movement
(Anooshehpoor et al., (2004); Housner, (1963); Shi et al., (1996); Yim et al., (1980)). These
models for co-seismic object displacement do not adequately describe horizontal
displacements of small flat rock fragments previously flat against, or attached to, in-situ
bedrock outcrops which have little potential for rocking motions or overturning.
Observations from analogue shake table tests to simulate boulders being upthrown from soil
sockets show variations in height and direction of movement for boulders with the same
input conditions (Ohmachi and Midorikawa, (1992)). This suggests that some scatter in the
displacement of geological features may be expected. These analogue tests differ from the
observed Petermann chip movement in that the rocks did not originate in soil and were in
some instances still weakly connected to the in-situ bedrock outcrop (as observed by freshly
broken fracture planes).
Theoretical models for the vertical displacement of objects from near-field strong ground
motions (Bolt and Hansen, (1977)) suggest that component parts of an object (e.g. something
resting on an object) or an object with elastic properties (e.g. an object resting on layers of
soil) may compound in creating vertical upwards forces with less than 1g input acceleration.
This is particularly true where wave frequencies are close to the resonance of the system,
which control displacement of the overlying object more than the amplitude of ground
acceleration. These models have been used to suggest that observed offsets that seemingly
resulted from vertical motion with no regard to gravity (e.g. the offset monument described
in Section 3.2.3. from the 1968 Meckering earthquake) do not necessarily require forces
greater than 1g. The authors point out that their working does not negate vertical
accelerations greater than 1g to excite displacement of an object resting on another, but that
those forces are not required for vertical movement (Bolt and Hansen, (1977)).
The Petermann examples of displaced exfoliation sheets may therefore be explained by input
energy to bedrock outcrops being transferred to chips in an amplified manner, meaning
ground motions need not necessarily exceed 1.0 g. This is particularly applicable to
observations of chips travelling up-slope of their original locations, with an apparent
disregard of gravitational forces. To further complicate the derivation of input forces,
multiple examples were found where chips were broken away from heavily weathered granite
edges (e.g. bonds between weathered minerals were broken to achieve movement) (Figure
3.4) which suggests there was sufficient input energy to break loosely attached rocks away
from the outcrop, rather than the chips simply resting on bedrock.
67
Previous attempts to estimate PGA from displaced rocks (Clark, (1972); Michael et al.,
(2002)) measured the static force required to initiate sliding of rocks sitting on (or embedded
in) soil which is not applicable for the Petermann data. Considering the complicated factors
of energy transfer between bedrock and chip, the connectiveness of chip to outcrop, and the
individual parameters of chip size/density/outcrop relief, it is beyond the scope of this paper
to calculate the absolute PGAs described by Petermann chip displacement. The data do
however describe relative PGAs across the Petermann surface rupture, with larger distances
travelled by chips closer to the surface rupture, consistent with strong ground motion
amplification in the tapering wedge of a reverse fault (Figure 3.12).
While deriving PGAs from the data would require physical modelling of many complex
parameters of movement, a chip starting on a horizontal surface displaced to another
horizontal surface requires an inclined input energy which might be approximated by a
projectile trajectory (Figure 3.16), allowing for estimation of input velocity. Assuming chips
start on the ground (i.e. have no vertical height) an estimate of the require input velocity (V0,
ms-1) for any given chip can be computed using:
𝑉0 = √𝑅𝑔
sin 2𝜃 [1]
Where R is the horizontal distance travelled (m), g is gravity (ms-2), and θ is the angle of
launch (Figure 3.16).
Deriving an angle of launch requires multiple assumptions and simplifications regarding the
direction of strong ground motions, the direction that outcrops travel in response to those
motions, and the energy transferred from the outcrop motion to the chip resulting in its
displacement. The direction that the underlying outcrop moves is assumed to be equal to the
angle of either fault normal or fault parallel motions (Figure 3.16). Assuming a fault dip of
30°, this results in a 60° fault-normal two -sided motion and a 30° fault-parallel one-sided
motion (Figure 3.16). Assuming chips move in the opposing direction to outcrop motion,
the angle of launch for two-sided motion is at first 30° in a strike-normal direction towards
rupture, with a non-projectile trajectory described by the down-ward motion of the two-
sided pulse (i.e. input velocity is negative) (Figure 3.16). One-sided fault-parallel motion
results in a 60° angle of launch of chips in a strike-normal direction away from rupture on
the hanging-wall, and a non-projectile trajectory on the foot-wall. Given the same initial
velocity, 30° and 60° launch angles result in the same horizontal distance using the equation
for projectile trajectories.
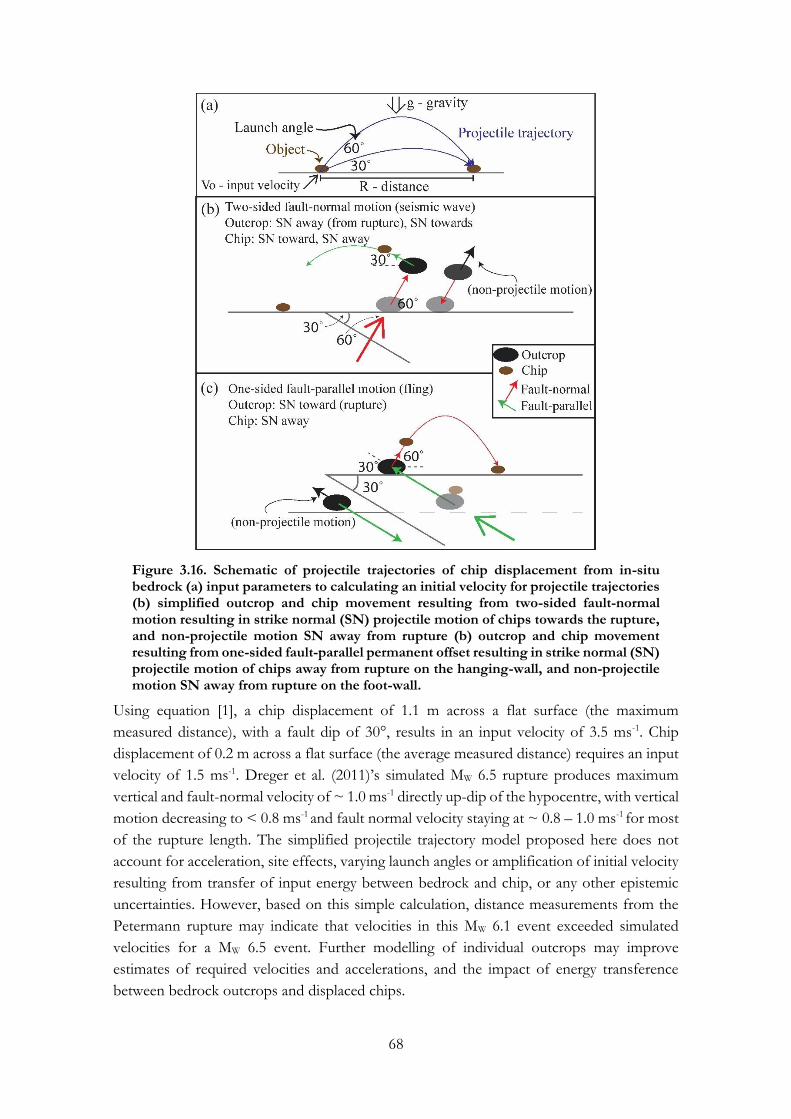
68
Figure 3.16. Schematic of projectile trajectories of chip displacement from in-situ bedrock (a) input parameters to calculating an initial velocity for projectile trajectories (b) simplified outcrop and chip movement resulting from two-sided fault-normal motion resulting in strike normal (SN) projectile motion of chips towards the rupture, and non-projectile motion SN away from rupture (b) outcrop and chip movement resulting from one-sided fault-parallel permanent offset resulting in strike normal (SN) projectile motion of chips away from rupture on the hanging-wall, and non-projectile motion SN away from rupture on the foot-wall.
Using equation [1], a chip displacement of 1.1 m across a flat surface (the maximum
measured distance), with a fault dip of 30°, results in an input velocity of 3.5 ms-1. Chip
displacement of 0.2 m across a flat surface (the average measured distance) requires an input
velocity of 1.5 ms-1. Dreger et al. (2011)’s simulated MW 6.5 rupture produces maximum
vertical and fault-normal velocity of ~ 1.0 ms-1 directly up-dip of the hypocentre, with vertical
motion decreasing to < 0.8 ms-1 and fault normal velocity staying at ~ 0.8 – 1.0 ms-1 for most
of the rupture length. The simplified projectile trajectory model proposed here does not
account for acceleration, site effects, varying launch angles or amplification of initial velocity
resulting from transfer of input energy between bedrock and chip, or any other epistemic
uncertainties. However, based on this simple calculation, distance measurements from the
Petermann rupture may indicate that velocities in this MW 6.1 event exceeded simulated
velocities for a MW 6.5 event. Further modelling of individual outcrops may improve
estimates of required velocities and accelerations, and the impact of energy transference
between bedrock outcrops and displaced chips.

69
3.6. Conclusions
This chapter set out to answer a series of questions, based on the observation of displaced
rock fragments in the near-field of the 2016 MW 6.1 Petermann earthquake. The observations
are consistent with a coseismic, complex, non-randomly orientated, seismically generated
displacement of chips within the very near-field (less than 5 km) of a surface rupturing fault.
The observations have provided a test for the validity of available models for the polarisation
of near-field strong ground motions, in particular by providing a dense dataset of both along
and across fault motions, as yet unrecorded instrumentally for a reverse earthquake. The
results are inconsistent with simple 2D fault-relative (e.g. normal or parallel) motions for
pulse-like strong ground motions. One-sided motions of chip movement are consistent with
the directionality expected by one-sided fling / permanent offsets in a 3D sense, related to
rupture propagating away from a hypocentre. However, two-sided motions are inconsistent
with a fault-normal two-sided pulse-like motion across the rupture, suggesting that either (a)
a fault-normal model of two-sided pulse-like motions is too simplistic, (b) two-sided chip
displacement signals could be produced by non-pulse-like motions, or (c) two-sided pulse-
like motions can occur in multiple directions in the very near-field of a surface rupturing
reverse fault (through an unknown physical mechanism).
The orientation of displaced chip data combined with a variety of instrumental (e.g.
aftershocks), modelled (e.g. geometry of the Woodroffe Thrust), and observational (e.g.
vertical offsets) data offers insight into the hypocentral depth and location, and rupture
dynamics in the absence of nearby seismic records of the mainshock (the closest seismometer
being 160 km west). This data supports a hypocentre at or near the intersection of Petermann
PF East and the Woodroffe Thrust at approximately 3 km depth and 5 km from the surface
rupture. The orientation of chip directionality supports a hypocentre slightly north-west of
the centre of the fault. Rupture is modelled to have propagated up and away from the
hypocentre bilaterally across PF East and on to PF West, creating a peak dissipation of energy
at the PF East-B step-over resulting in more distributed deformation, and less abundant
displaced chips with less defined directionality.
This is the first study that systematically documents displaced rocks both across and along
rupture (in an area of approximately 100 km2) to understand the distribution, directivity and
distances of coseismic rock displacement. Unlike other examples of displaced rocks (Clark,
(1972)) there is no component of topographic amplification in the Petermann earthquake,
and results from flat outcrops shows that outcrop relief cannot be the primary determinant
of chip directivity or distance (Section 3.4.1. and Figure 3.6. This is also the first study that
documents displaced rocks sourced from in-situ bedrock outcrops rather than a soil-mantle
(Table 3.1). The remote setting of this intraplate cratonic earthquake also means potential
for post-seismic anthropogenic influence on the data is extremely low.
This data demonstrates the applicability of geological damage for capturing seismic data in
the absence of dense instrumentation, and may help test models of near-field dynamic and
static pulse-like strong ground motion for dip-slip earthquakes (e.g. (Dadras et al., (2017);
Shahi and Baker, (2011))).
70
CHAPTER 4. CHARACTERISING SURFACE RUPTURE
COMPLEXITY AND RECURRENCE OF THE 2016
MW 6.1 PETERMANN EARTHQUAKE
Abstract
The 20th May 2016 moment magnitude (MW) 6.1 Petermann earthquake was the 2nd longest
single-event historic Australian surface rupture and largest MW on-shore earthquake in 28
years. This chapter presents the methods and results of the first use of an Unmanned Aerial
Vehicle (drone) to map a historic Australian surface rupture. Drone-derived data are
combined with field observations and photographs, and satellite derived imagery and offset
data, to map in fine-detail the primary surface rupture and secondary fracturing /
deformation resulting from the Petermann earthquake. Results show that (i) rupture is
manifested at the surface differently in undulating granular materials (e.g. sand dunes) than
proximal bedrock surfaces, causing discontinuities in discrete surface rupture trace (ii) surface
geology imparts a primary control on the length of secondary fractures, and the distance of
fractures from the surface rupture (i.e. rupture zone width). Structural analysis of secondary
fractures relative to primary surface rupture indicates oblique-sinistral reverse fault rupture,
consistent with focal mechanism solutions and the modelled orientation of SHMax in this
region. Evidence suggests that some secondary fracture features preserve inaccurate σ1
orientations due to either block rotation, or rupture being distributed through near-surface
previously un-ruptured sediments. Trench logs from two hand-dug trenches are presented
and combined with fine-scale geological mapping of the area to evaluate whether evidence
for penultimate rupture(s) on the Petermann fault is present. Ten 10Be cosmogenic nuclide
erosion rates of bedrock outcrops at 0 to 50 km from the surface rupture trace are combined
with the trenching results and interpretation of the landscape history to suggest that the 2016
event is the only surface rupturing earthquake on the Petermann fault in the last 200 to 400
kyrs, and possibly the first ever on this fault.
4.1. Introduction
Earthquake surface ruptures are routinely mapped to quantify the length, width and offset
of primary rupture and extent of secondary fracturing and distributed deformation. This
assists earthquake scientists and engineers in a variety of ways including, but not limited to:
understanding the mechanisms behind fault rupture and earthquake propagation (Klinger et
al., (2018)); establishing length – magnitude – offset scaling relationships for use in modelling
future hazard on faults which have yet to rupture historically (e.g. relevant for reverse faults:
(Baize et al., (2019); Leonard, (2014); Moss and Ross, (2011); Somerville et al., (2000); Wells
and Coppersmith, (1994))); and documenting the extent of permanent damage zones to
protect near-fault infrastructure from future events through fault zone avoidance and

71
mitigation measures (Boncio et al., (2018); Bray, (2009), (2001); Livio et al., (2020)). Efforts
to understand the past rupture history of historic surface rupturing faults enables
quantification and modelling of future hazard on those faults, and enhances understanding
of the past behaviour of identified active faults which have yet to rupture historically.
This chapter presents methods and results of field and remote-sensing mapping of the 2016
MW 6.1 Petermann earthquake surface rupture and explores evidence for absence of prior
rupture along the Petermann fault. Fine-scale primary and secondary deformation mapping
is conducted using surface, photogrammetry and satellite derived data. The distribution of
permanent surface deformation features is compared to fine-scale mapping of surface
geology and satellite derived deformation maps (InSAR data) to investigate potential
influences of the complexity of surface rupture. The kinematics of secondary fractures are
analysed in order to ascertain the fault mechanics (e.g. pure or oblique rupture) and the
direction of SHMax (horizontal compressive stress) in this area. Evidence of prior ruptures
along the Petermann fault are investigated using two hand-dug trenches and cosmogenic
nuclide erosion rate analysis. The data presented here contributes to an understanding of the
behaviour of intraplate cratonic faults, recurrence of earthquakes in stable continental
regions, and questions regarding the perceived complexity of surface deformation relative to
the underlying seismogenic fault.
4.1.1. Surface rupture mapping Earthquake sources are generally described as planar faults, defined by parameters such as
fault length, width, area, and depth to the top of the fault (Beavan et al., (2012)). This
tendency to describe faults as simple planar structures is in part due to an inability to directly
observe seismogenic faults. Many earthquake ruptures do not reach the surface, making
observations limited to seismic data, geophysical data, or geomorphic data from landscape
changes due to earthquake recurrence over time.
Surface rupturing earthquakes therefore offer an opportunity to investigate the link between
seismic observations of sub-surface processes and earthquake surface deformation,
presumed to be the surface expression of the seismogenic fault (e.g. the 2016 Kaikoura, New
Zealand earthquake (Klinger et al., (2018)); 2010 Darfield, New Zealand earthquake (Quigley
et al., (2019)); 2008 Wenchuan, China earthquake (Yu et al., (2010)); 2016 Norcia, Italy
earthquake (Livio et al., (2017))). Where possible trenching is conducted across the rupture
to identify past events for recurrence calculations (e.g. the 1986 Marryat Creek and 1988
Tennant Creek, Australia earthquakes (Crone et al., (1997)); 2010 Darfield, New Zealand
earthquake (Hornblow et al., (2014)); 1999 Chi Chi, Taiwan earthquake (Lee et al., (2003))).
In the last decade or so, it has become routine to supplement field observations and ground
surveying with satellite derived offset data (InSAR, digital elevation, visual imagery; e.g. 2013
Balochistan, Pakistan earthquake (Gold et al., (2015); Vallage et al., (2015)), 2010–2011
Canterbury earthquakes, New Zealand earthquakes (Elliott et al., (2012))), and
photogrammetry (e.g. 2016 Amatrice, Italy earthquake (Brozzetti et al., (2019)); 2016
Kaikoura, New Zealand earthquake (Kearse et al., (2018); Litchfield et al., (2018)); 2018 Lake
Muir, Australia earthquakes (Clark et al., (2019))) to characterise both the primary
deformation zone and distributed deformation and earthquake effects.
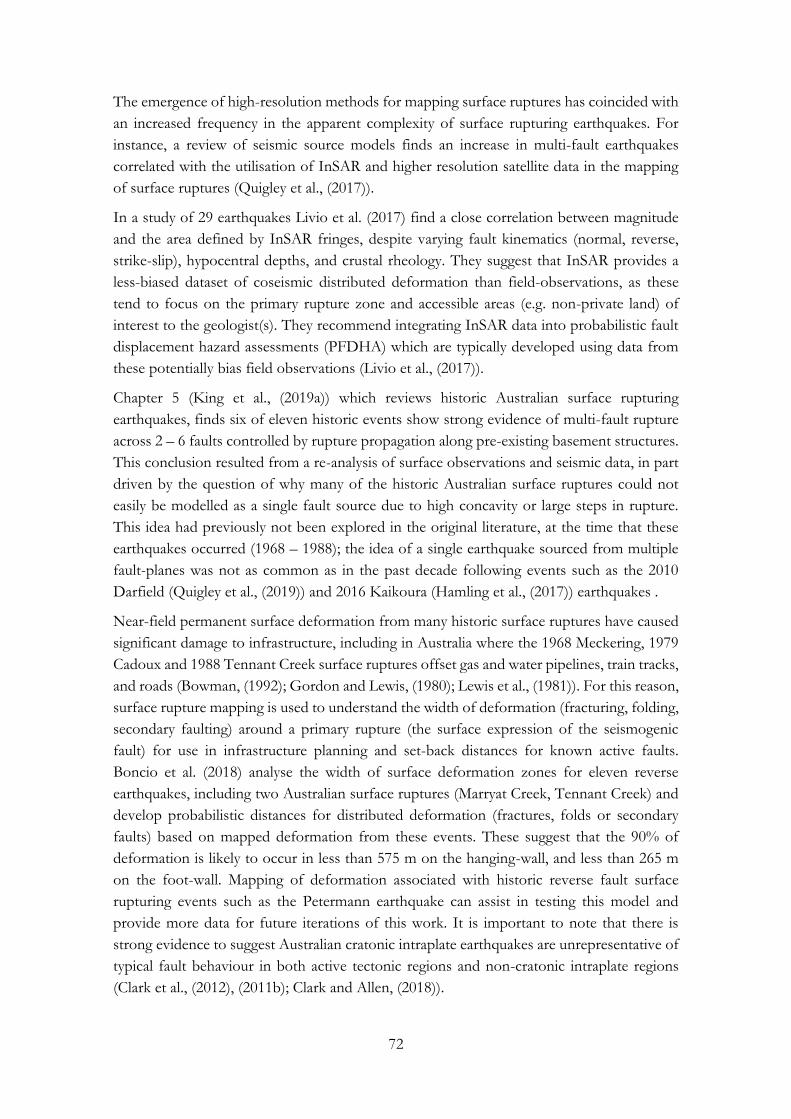
72
The emergence of high-resolution methods for mapping surface ruptures has coincided with
an increased frequency in the apparent complexity of surface rupturing earthquakes. For
instance, a review of seismic source models finds an increase in multi-fault earthquakes
correlated with the utilisation of InSAR and higher resolution satellite data in the mapping
of surface ruptures (Quigley et al., (2017)).
In a study of 29 earthquakes Livio et al. (2017) find a close correlation between magnitude
and the area defined by InSAR fringes, despite varying fault kinematics (normal, reverse,
strike-slip), hypocentral depths, and crustal rheology. They suggest that InSAR provides a
less-biased dataset of coseismic distributed deformation than field-observations, as these
tend to focus on the primary rupture zone and accessible areas (e.g. non-private land) of
interest to the geologist(s). They recommend integrating InSAR data into probabilistic fault
displacement hazard assessments (PFDHA) which are typically developed using data from
these potentially bias field observations (Livio et al., (2017)).
Chapter 5 (King et al., (2019a)) which reviews historic Australian surface rupturing
earthquakes, finds six of eleven historic events show strong evidence of multi-fault rupture
across 2 – 6 faults controlled by rupture propagation along pre-existing basement structures.
This conclusion resulted from a re-analysis of surface observations and seismic data, in part
driven by the question of why many of the historic Australian surface ruptures could not
easily be modelled as a single fault source due to high concavity or large steps in rupture.
This idea had previously not been explored in the original literature, at the time that these
earthquakes occurred (1968 – 1988); the idea of a single earthquake sourced from multiple
fault-planes was not as common as in the past decade following events such as the 2010
Darfield (Quigley et al., (2019)) and 2016 Kaikoura (Hamling et al., (2017)) earthquakes .
Near-field permanent surface deformation from many historic surface ruptures have caused
significant damage to infrastructure, including in Australia where the 1968 Meckering, 1979
Cadoux and 1988 Tennant Creek surface ruptures offset gas and water pipelines, train tracks,
and roads (Bowman, (1992); Gordon and Lewis, (1980); Lewis et al., (1981)). For this reason,
surface rupture mapping is used to understand the width of deformation (fracturing, folding,
secondary faulting) around a primary rupture (the surface expression of the seismogenic
fault) for use in infrastructure planning and set-back distances for known active faults.
Boncio et al. (2018) analyse the width of surface deformation zones for eleven reverse
earthquakes, including two Australian surface ruptures (Marryat Creek, Tennant Creek) and
develop probabilistic distances for distributed deformation (fractures, folds or secondary
faults) based on mapped deformation from these events. These suggest that the 90% of
deformation is likely to occur in less than 575 m on the hanging-wall, and less than 265 m
on the foot-wall. Mapping of deformation associated with historic reverse fault surface
rupturing events such as the Petermann earthquake can assist in testing this model and
provide more data for future iterations of this work. It is important to note that there is
strong evidence to suggest Australian cratonic intraplate earthquakes are unrepresentative of
typical fault behaviour in both active tectonic regions and non-cratonic intraplate regions
(Clark et al., (2012), (2011b); Clark and Allen, (2018)).

73
Many authors have used global compilations of surface rupture data to build scaling
relationships and model the behaviour of different fault systems (strike-slip, reverse, normal)
for the use in predicting the behaviour of future earthquakes on active faults. These include
variations of length – offset – magnitude scaling relationships (Anderson et al., (1996); Clark
et al., (2014); Leonard, (2014), (2010); Martin Mai and Beroza, (2000); Somerville, (2014);
Somerville et al., (1999); Wells and Coppersmith, (1994)), and predicting the end points of
future ruptures based on steps, gaps, bends and segmentation in surface ruptures (Biasi and
Wesnousky, (2017), (2016); Wesnousky, (2008)). These necessarily assume that surface
ruptures are a direct expression of the seismogenic fault and therefore measurement of
surface data can provide an understanding of fault complexity and rupture propagation.
Field observations of surface ruptures, in particular those from dip-slip events, show that in
some cases the rupture trace can divert around buildings and infrastructure (e.g. examples in
Faccioli et al. (2008) covering the 1999 Chi Chi, Taiwan earthquake (Kelson et al., (2001))
and 1999 Kocaeli, Turkey 1999 earthquake (Anastasopoulos and Gazetas, (2007); Bray and
Kelson, (2006))). Many numerical and sand-box models of reverse earthquakes have been
conducted to investigate this behaviour, and the behaviour of ruptures where they interact
with surficial sediments (as opposed to rupturing solely through bedrock to the surface)
(Anastasopoulos et al., (2007); Bransby et al., (2008); Bray et al., (1994b), (1994a); Cole and
Lade, (1984); Lade et al., (1984); Lee and Hamada, (2005); Loukidis et al., (2009); Oettle et
al., (2015); Oettle and Bray, (2013)).
Oettle and Bray (2013) conduct numerical simulations of reverse fault rupture through
bedrock into dry sand to investigate the effect of prior-rupture on how ruptures propagate
to the surface through soil, and how that may affect the way surface ruptures interact with
point-loading at the surface (e.g. buildings, infrastructure). They find that without a prior
event, rupture has a higher chance of diverting around point-loads at the surface, and ground
deformation (e.g. distributed fracturing and deformation) is less localised. Oettle et al. (2015)
investigate the effect of slip rate along a reverse (and normal) fault on how a surface rupture
will interact with infrastructure placed on (or very close to) the surface rupture. They find
that rupture dynamics (e.g. slip rate) play a secondary role to things such as soil characteristics
(e.g. dense / dry sand), pre-ruptured soil (e.g. Oettle and Bray (2013)), and the amount of
fault displacement, on how a fault will rupture through to the surface and interact with
infrastructure. Oettle et al. (2015) note that the amount of bedrock displacement places a
primary control on whether a fault will propagate through soil, and whether the rupture
pattern at the surface will preserve fault kinematics.
4.1.2. Cosmogenic nuclide dating of earthquake recurrence Cosmogenic nuclides are isotopes formed within a rock from the collision and interaction of
elementary particles (principally neutrons and muons) with isotopes held within the crystal
lattice of mineral such as 16O and 28Si in quartz, creating radionuclides such as 10Be and 26Al
(Dunai and Lifton, (2014); Gosse and Phillips, (2001); Lal, (1991)). Given known production
and decay rates through time of these cosmogenic radionuclides, their abundance within a
rock can be used to quantify either the exposure time of that rock at the surface, or the

74
erosion rate experienced by that rock, assuming a steady-state erosion of continuously
exposed surfaces through time (Dunai and Lifton, (2014); Gosse and Phillips, (2001)).
Coseismic landslides and rock fracturing from both historic and neotectonic events have
been documented across Australia (Clark et al., (2014); Quigley et al., (2007b); Twidale and
Bourne, (2000)). Geological damage and landslides from recurring earthquakes provides a
mechanism for increased removal of bedrock material and an increase in local erosion rates.
This has been documented in the Flinders Ranges where catchment averaged erosion rates
are elevated above background rates following a major (minimum MW 7.0) earthquake at
approximately 30 ka (Quigley et al., (2007b)).
As discussed in Chapter 2 and Chapter 3 (King et al., (2018)) hanging-wall outcrops within
5 km of the Petermann surface rupture experienced strong-ground motion-induced rock
falls, and many low lying outcrops surrounding the surface rupture experienced loss of
exfoliation sheets (e.g. displaced chips) (Figure 4.1). Rock fall damage was not observed on
any foot-wall outcrops within 2 to 40 km from the surface rupture, and fewer chips were
observed displaced from foot-wall outcrops relative to hanging-wall outcrops. These
observations suggest that coseismic loss of bedrock may have increased the apparent erosion
rate of hanging-wall outcrops relative to foot-wall outcrops, and that the erosion rate of
bedrock within 5 km of the surface rupture may have increased relative to that of bedrock at
greater distances from the rupture. Additionally, small outcrops were observed with
‘shattered’ appearances in the near-field (Figure 4.1). While no evidence was observed to
constrain these as coseismically damaged, the fresh appearance and lack of erosion along
fractured planes suggests a recent origin. If coseismically damaged, this ‘shattering’ of small
outcrops is likely to increase the long-term erodibility of those outcrops.
Figure 4.1. Damaged bedrock outcrops (a) rock-fall from large granite outcrop (b) displaced rock chips (e.g. Chapter 3) (c) small outcrop with ‘shattered’ appearance, no constraints of coseismicity of damage.
This chapter explores the potential for precursor ruptures on the Petermann fault system to
have locally increased the erosion rates preserved by bedrock within 5 km of the surface
rupture through rock loss (rock-fall or chip displacement), increased erodibility from
‘shattering’, or increased erosion of hanging-wall outcrops from base-level lowering erosive
processes following coseismic uplift. Erosion rate analyses of bedrock outcrops are
interpreted alongside trench data and fine-scale surface geology mapping across the
Petermann rupture to understand the evolution of the landscape around the Peterman
surface rupture, and potential for previous earthquakes on the Petermann fault.
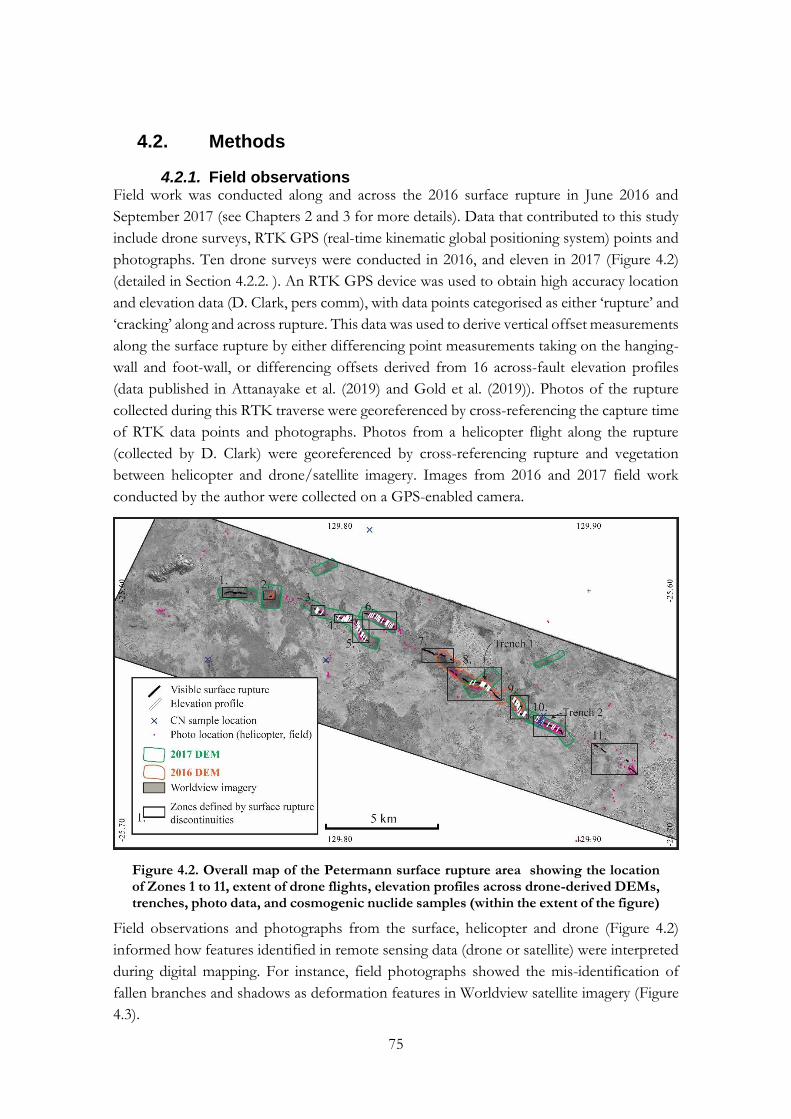
75
4.2. Methods
4.2.1. Field observations Field work was conducted along and across the 2016 surface rupture in June 2016 and
September 2017 (see Chapters 2 and 3 for more details). Data that contributed to this study
include drone surveys, RTK GPS (real-time kinematic global positioning system) points and
photographs. Ten drone surveys were conducted in 2016, and eleven in 2017 (Figure 4.2)
(detailed in Section 4.2.2. ). An RTK GPS device was used to obtain high accuracy location
and elevation data (D. Clark, pers comm), with data points categorised as either ‘rupture’ and
‘cracking’ along and across rupture. This data was used to derive vertical offset measurements
along the surface rupture by either differencing point measurements taking on the hanging-
wall and foot-wall, or differencing offsets derived from 16 across-fault elevation profiles
(data published in Attanayake et al. (2019) and Gold et al. (2019)). Photos of the rupture
collected during this RTK traverse were georeferenced by cross-referencing the capture time
of RTK data points and photographs. Photos from a helicopter flight along the rupture
(collected by D. Clark) were georeferenced by cross-referencing rupture and vegetation
between helicopter and drone/satellite imagery. Images from 2016 and 2017 field work
conducted by the author were collected on a GPS-enabled camera.
Figure 4.2. Overall map of the Petermann surface rupture area showing the location of Zones 1 to 11, extent of drone flights, elevation profiles across drone-derived DEMs, trenches, photo data, and cosmogenic nuclide samples (within the extent of the figure)
Field observations and photographs from the surface, helicopter and drone (Figure 4.2)
informed how features identified in remote sensing data (drone or satellite) were interpreted
during digital mapping. For instance, field photographs showed the mis-identification of
fallen branches and shadows as deformation features in Worldview satellite imagery (Figure
4.3).
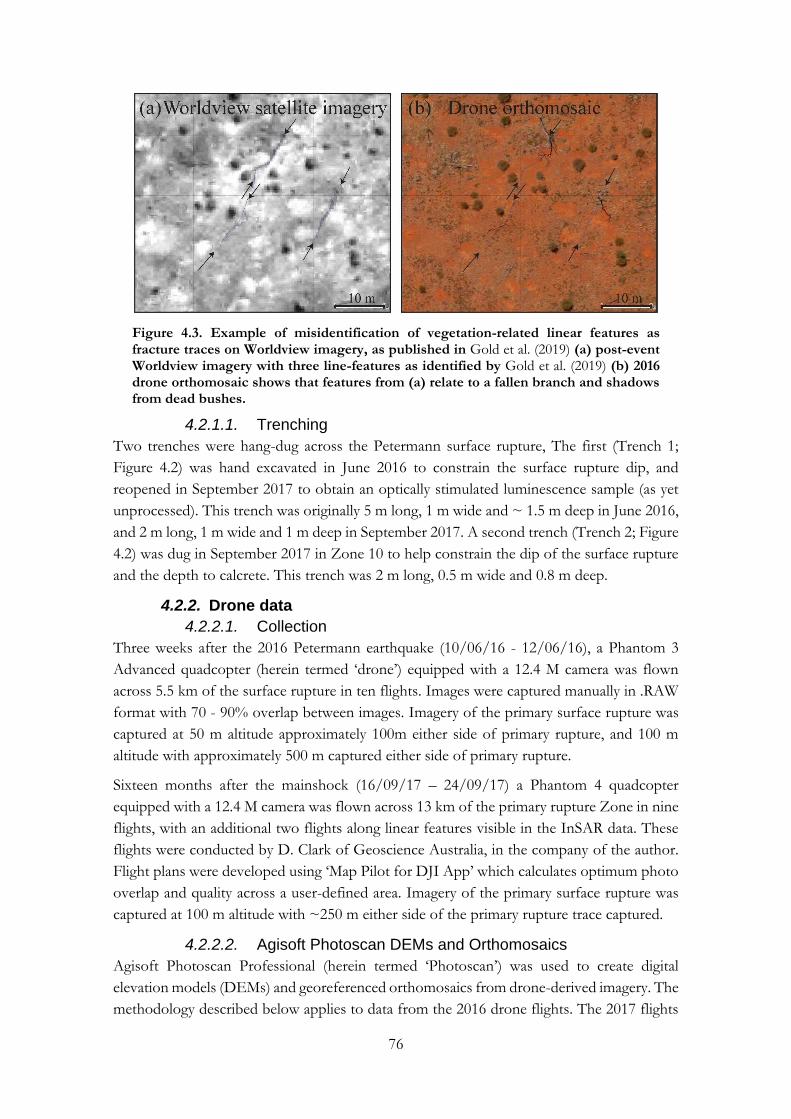
76
Figure 4.3. Example of misidentification of vegetation-related linear features as fracture traces on Worldview imagery, as published in Gold et al. (2019) (a) post-event Worldview imagery with three line-features as identified by Gold et al. (2019) (b) 2016 drone orthomosaic shows that features from (a) relate to a fallen branch and shadows from dead bushes.
4.2.1.1. Trenching
Two trenches were hang-dug across the Petermann surface rupture, The first (Trench 1;
Figure 4.2) was hand excavated in June 2016 to constrain the surface rupture dip, and
reopened in September 2017 to obtain an optically stimulated luminescence sample (as yet
unprocessed). This trench was originally 5 m long, 1 m wide and ~ 1.5 m deep in June 2016,
and 2 m long, 1 m wide and 1 m deep in September 2017. A second trench (Trench 2; Figure
4.2) was dug in September 2017 in Zone 10 to help constrain the dip of the surface rupture
and the depth to calcrete. This trench was 2 m long, 0.5 m wide and 0.8 m deep.
4.2.2. Drone data
4.2.2.1. Collection
Three weeks after the 2016 Petermann earthquake (10/06/16 - 12/06/16), a Phantom 3
Advanced quadcopter (herein termed ‘drone’) equipped with a 12.4 M camera was flown
across 5.5 km of the surface rupture in ten flights. Images were captured manually in .RAW
format with 70 - 90% overlap between images. Imagery of the primary surface rupture was
captured at 50 m altitude approximately 100m either side of primary rupture, and 100 m
altitude with approximately 500 m captured either side of primary rupture.
Sixteen months after the mainshock (16/09/17 – 24/09/17) a Phantom 4 quadcopter
equipped with a 12.4 M camera was flown across 13 km of the primary rupture Zone in nine
flights, with an additional two flights along linear features visible in the InSAR data. These
flights were conducted by D. Clark of Geoscience Australia, in the company of the author.
Flight plans were developed using ‘Map Pilot for DJI App’ which calculates optimum photo
overlap and quality across a user-defined area. Imagery of the primary surface rupture was
captured at 100 m altitude with ~250 m either side of the primary rupture trace captured.
4.2.2.2. Agisoft Photoscan DEMs and Orthomosaics
Agisoft Photoscan Professional (herein termed ‘Photoscan’) was used to create digital
elevation models (DEMs) and georeferenced orthomosaics from drone-derived imagery. The
methodology described below applies to data from the 2016 drone flights. The 2017 flights
77
were processed at Geoscience Australia by D. Clark. Photoscan models for the 2016 data
were run on a Windows 10 device with Intel i7-6700K 4GHz core; 32 GB RAM; and
GeForce GTX 1070 graphics processing unit.
Figure 4.4. Map of the ten 2016 drone flights as labelled for Table 4.1.
To assist in the identification of surface features, images from each flight were edited in
Adobe Lightroom to increase brightness and contrast, decrease green and yellow colour
saturation (i.e. vegetation) and increase orange and red colour saturation (land surface).
Images were imported to Photoscan and aligned using: ‘high’ accuracy; ‘reference
preselection’ (photo GPS location and altitude); ‘key point limit’ of 1,000,000; ‘tie point limit’
of 100,000; and ‘adaptive camera model fitting’. A sparse cloud was produced for each flight
with 0.8 to 8.7 million points depending on the number of input photos, and run times of
0.7 to 31 hours (Table 4.1).
Photoscan tool ‘optimize camera alignment’ was used to increase the accuracy of the sparse
cloud. Inaccurate points were removed from the sparse cloud by alternating between using
the Photoscan ‘gradual selection’ tool to highlight and delete inaccurate points, and ‘optimize
camera alignment’. This process was repeated until all points were below error limits in the
‘gradual selection’ tool (‘reconstruction uncertainty’ < 100; ‘reprojection error’ < 5; and
‘projection accuracy’ < 50).
After optimising and cleaning the sparse cloud, a dense point cloud was built using ‘high’
quality and ‘aggressive’ depth filtering. Dense clouds contained 17 to 152 million points, with
run times from 0.5 to 19 hours (Table 4.1). DEMs were created using dense clouds with
interpolation enabled, and orthomosaics were created using DEM surfaces and mosaic
blending mode. DEMs and orthomosaics were extracted to .TIF format and imported to
QGIS.
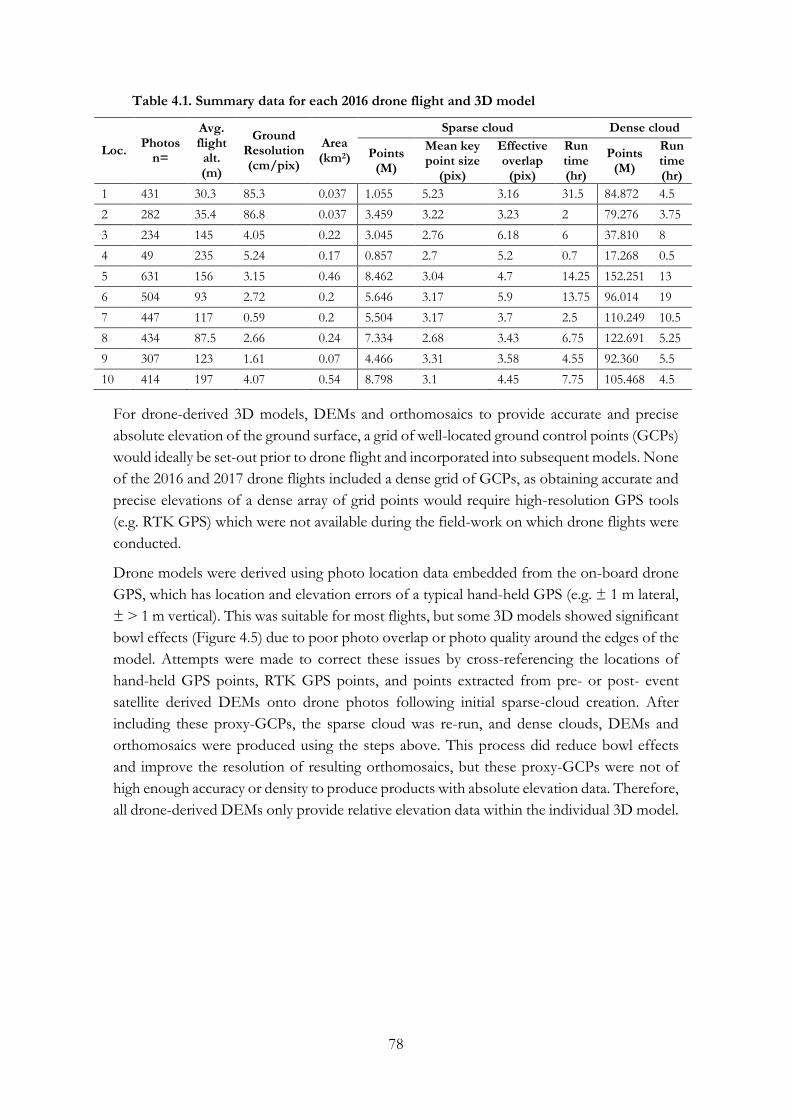
78
Table 4.1. Summary data for each 2016 drone flight and 3D model
Loc. Photos
n=
Avg. flight alt. (m)
Ground Resolution (cm/pix)
Area (km2)
Sparse cloud Dense cloud
Points (M)
Mean key point size
(pix)
Effective overlap
(pix)
Run time (hr)
Points (M)
Run time (hr)
1 431 30.3 85.3 0.037 1.055 5.23 3.16 31.5 84.872 4.5
2 282 35.4 86.8 0.037 3.459 3.22 3.23 2 79.276 3.75
3 234 145 4.05 0.22 3.045 2.76 6.18 6 37.810 8
4 49 235 5.24 0.17 0.857 2.7 5.2 0.7 17.268 0.5
5 631 156 3.15 0.46 8.462 3.04 4.7 14.25 152.251 13
6 504 93 2.72 0.2 5.646 3.17 5.9 13.75 96.014 19
7 447 117 0.59 0.2 5.504 3.17 3.7 2.5 110.249 10.5
8 434 87.5 2.66 0.24 7.334 2.68 3.43 6.75 122.691 5.25
9 307 123 1.61 0.07 4.466 3.31 3.58 4.55 92.360 5.5
10 414 197 4.07 0.54 8.798 3.1 4.45 7.75 105.468 4.5
For drone-derived 3D models, DEMs and orthomosaics to provide accurate and precise
absolute elevation of the ground surface, a grid of well-located ground control points (GCPs)
would ideally be set-out prior to drone flight and incorporated into subsequent models. None
of the 2016 and 2017 drone flights included a dense grid of GCPs, as obtaining accurate and
precise elevations of a dense array of grid points would require high-resolution GPS tools
(e.g. RTK GPS) which were not available during the field-work on which drone flights were
conducted.
Drone models were derived using photo location data embedded from the on-board drone
GPS, which has location and elevation errors of a typical hand-held GPS (e.g. ± 1 m lateral,
± > 1 m vertical). This was suitable for most flights, but some 3D models showed significant
bowl effects (Figure 4.5) due to poor photo overlap or photo quality around the edges of the
model. Attempts were made to correct these issues by cross-referencing the locations of
hand-held GPS points, RTK GPS points, and points extracted from pre- or post- event
satellite derived DEMs onto drone photos following initial sparse-cloud creation. After
including these proxy-GCPs, the sparse cloud was re-run, and dense clouds, DEMs and
orthomosaics were produced using the steps above. This process did reduce bowl effects
and improve the resolution of resulting orthomosaics, but these proxy-GCPs were not of
high enough accuracy or density to produce products with absolute elevation data. Therefore,
all drone-derived DEMs only provide relative elevation data within the individual 3D model.
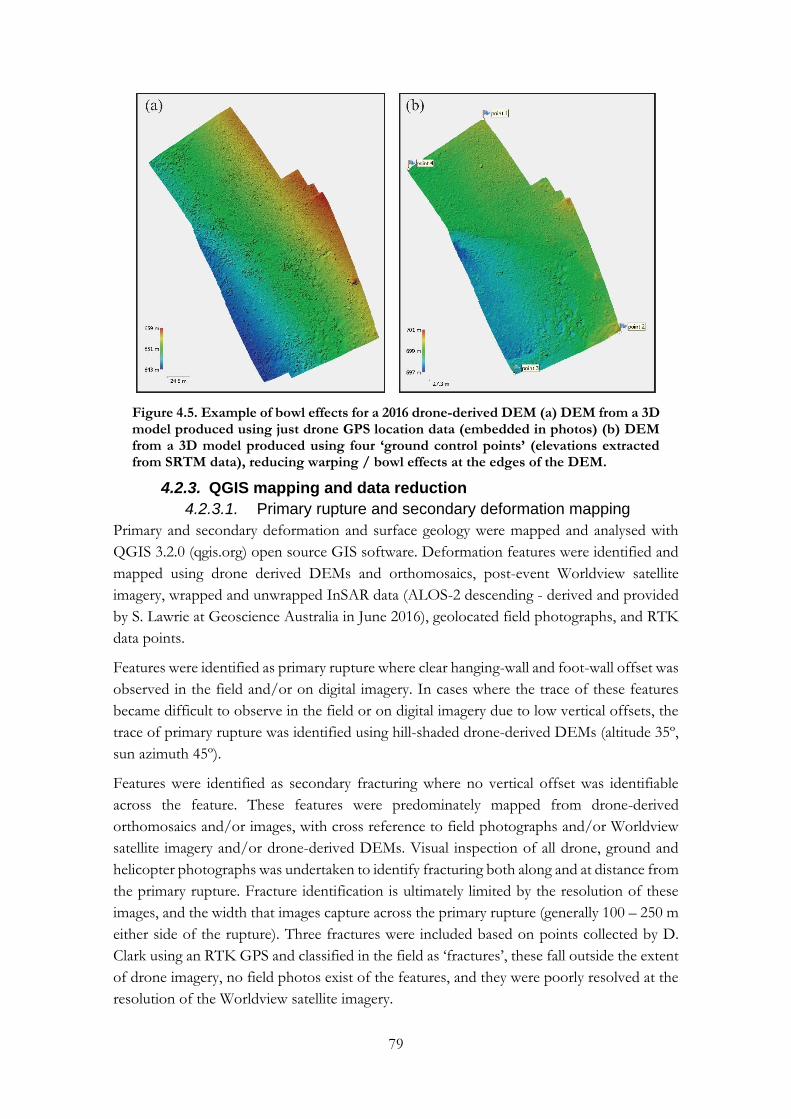
79
Figure 4.5. Example of bowl effects for a 2016 drone-derived DEM (a) DEM from a 3D model produced using just drone GPS location data (embedded in photos) (b) DEM from a 3D model produced using four ‘ground control points’ (elevations extracted from SRTM data), reducing warping / bowl effects at the edges of the DEM.
4.2.3. QGIS mapping and data reduction
4.2.3.1. Primary rupture and secondary deformation mapping
Primary and secondary deformation and surface geology were mapped and analysed with
QGIS 3.2.0 (qgis.org) open source GIS software. Deformation features were identified and
mapped using drone derived DEMs and orthomosaics, post-event Worldview satellite
imagery, wrapped and unwrapped InSAR data (ALOS-2 descending - derived and provided
by S. Lawrie at Geoscience Australia in June 2016), geolocated field photographs, and RTK
data points.
Features were identified as primary rupture where clear hanging-wall and foot-wall offset was
observed in the field and/or on digital imagery. In cases where the trace of these features
became difficult to observe in the field or on digital imagery due to low vertical offsets, the
trace of primary rupture was identified using hill-shaded drone-derived DEMs (altitude 35º,
sun azimuth 45º).
Features were identified as secondary fracturing where no vertical offset was identifiable
across the feature. These features were predominately mapped from drone-derived
orthomosaics and/or images, with cross reference to field photographs and/or Worldview
satellite imagery and/or drone-derived DEMs. Visual inspection of all drone, ground and
helicopter photographs was undertaken to identify fracturing both along and at distance from
the primary rupture. Fracture identification is ultimately limited by the resolution of these
images, and the width that images capture across the primary rupture (generally 100 – 250 m
either side of the rupture). Three fractures were included based on points collected by D.
Clark using an RTK GPS and classified in the field as ‘fractures’, these fall outside the extent
of drone imagery, no field photos exist of the features, and they were poorly resolved at the
resolution of the Worldview satellite imagery.
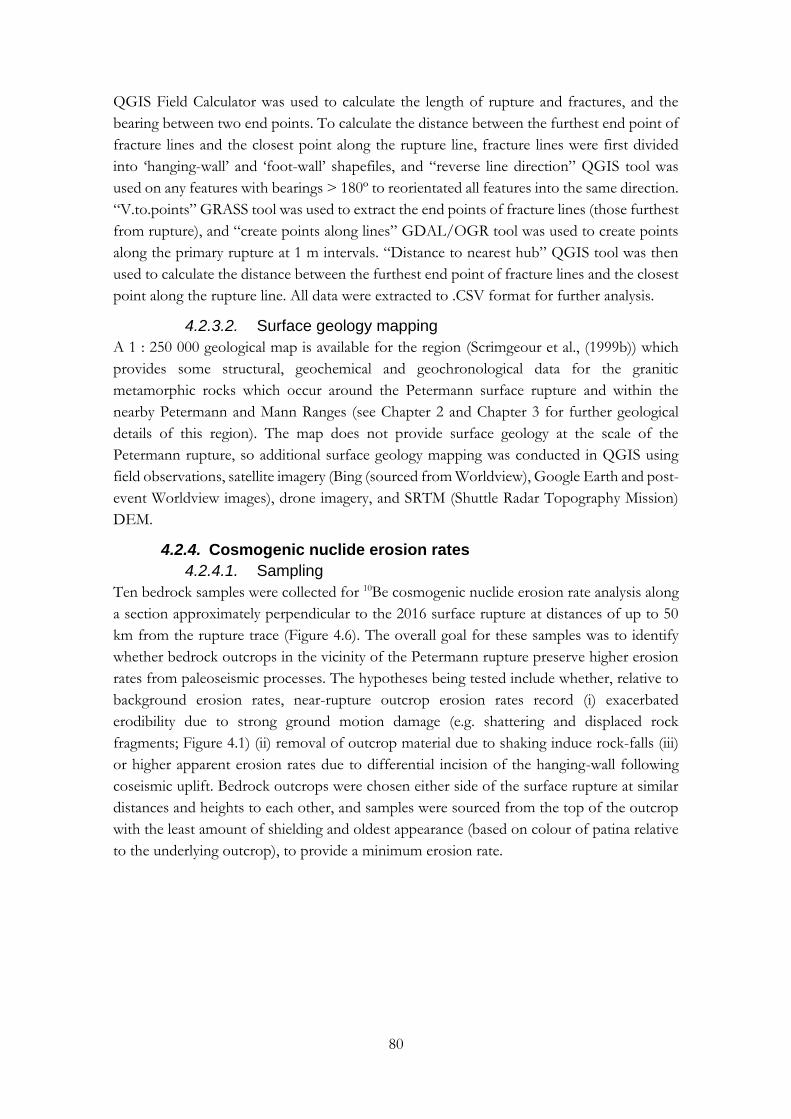
80
QGIS Field Calculator was used to calculate the length of rupture and fractures, and the
bearing between two end points. To calculate the distance between the furthest end point of
fracture lines and the closest point along the rupture line, fracture lines were first divided
into ‘hanging-wall’ and ‘foot-wall’ shapefiles, and “reverse line direction” QGIS tool was
used on any features with bearings > 180º to reorientated all features into the same direction.
“V.to.points” GRASS tool was used to extract the end points of fracture lines (those furthest
from rupture), and “create points along lines” GDAL/OGR tool was used to create points
along the primary rupture at 1 m intervals. “Distance to nearest hub” QGIS tool was then
used to calculate the distance between the furthest end point of fracture lines and the closest
point along the rupture line. All data were extracted to .CSV format for further analysis.
4.2.3.2. Surface geology mapping
A 1 : 250 000 geological map is available for the region (Scrimgeour et al., (1999b)) which
provides some structural, geochemical and geochronological data for the granitic
metamorphic rocks which occur around the Petermann surface rupture and within the
nearby Petermann and Mann Ranges (see Chapter 2 and Chapter 3 for further geological
details of this region). The map does not provide surface geology at the scale of the
Petermann rupture, so additional surface geology mapping was conducted in QGIS using
field observations, satellite imagery (Bing (sourced from Worldview), Google Earth and post-
event Worldview images), drone imagery, and SRTM (Shuttle Radar Topography Mission)
DEM.
4.2.4. Cosmogenic nuclide erosion rates
4.2.4.1. Sampling
Ten bedrock samples were collected for 10Be cosmogenic nuclide erosion rate analysis along
a section approximately perpendicular to the 2016 surface rupture at distances of up to 50
km from the rupture trace (Figure 4.6). The overall goal for these samples was to identify
whether bedrock outcrops in the vicinity of the Petermann rupture preserve higher erosion
rates from paleoseismic processes. The hypotheses being tested include whether, relative to
background erosion rates, near-rupture outcrop erosion rates record (i) exacerbated
erodibility due to strong ground motion damage (e.g. shattering and displaced rock
fragments; Figure 4.1) (ii) removal of outcrop material due to shaking induce rock-falls (iii)
or higher apparent erosion rates due to differential incision of the hanging-wall following
coseismic uplift. Bedrock outcrops were chosen either side of the surface rupture at similar
distances and heights to each other, and samples were sourced from the top of the outcrop
with the least amount of shielding and oldest appearance (based on colour of patina relative
to the underlying outcrop), to provide a minimum erosion rate.
81
Figure 4.6. Map of sample locations, photos of each sample and outcrop (sample location circled in white, scale provided by field geologists or equipment).
Samples A and J were collected from granite outcrops at least 20 km from the surface
rupture. Sample A was collected from the top of an isolated granite outcrop within the Mann
Ranges (20 m above sand plain), and Sample J was collected from the top of an outcrop
within the Petermann Ranges (50 m above sand plain). These were expected to provide the
best estimates of regional background erosion rates, as they were sourced from the largest
outcrops within bedrock ranges.
Samples B, C, and H were collected from large granitic granulite outcrops within 5 km of the
surface rupture on both the hanging-wall and foot-wall. Sample B was from an outcrop 40 -
50 m above the sand plain, and sample C and H were 20 m above the sand plain. Sample B
and H were from the tops of similar sized outcrops at similar distances from the rupture,
and were expected to provide the best test for possible palaeoseismic erosion rate differences
as large rock falls were observed at outcrop H (hanging-wall) following the 2016 mainshock
(King et al., (2018)), while none were observed at outcrop B (foot-wall).
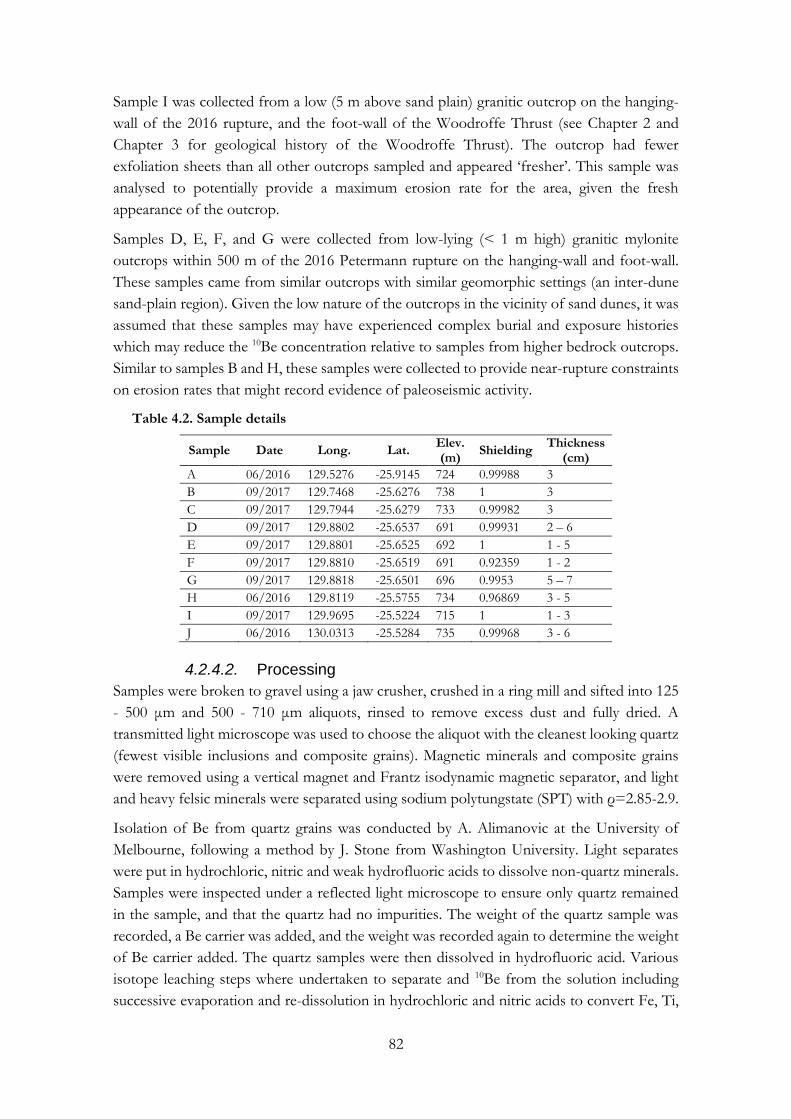
82
Sample I was collected from a low (5 m above sand plain) granitic outcrop on the hanging-
wall of the 2016 rupture, and the foot-wall of the Woodroffe Thrust (see Chapter 2 and
Chapter 3 for geological history of the Woodroffe Thrust). The outcrop had fewer
exfoliation sheets than all other outcrops sampled and appeared ‘fresher’. This sample was
analysed to potentially provide a maximum erosion rate for the area, given the fresh
appearance of the outcrop.
Samples D, E, F, and G were collected from low-lying (< 1 m high) granitic mylonite
outcrops within 500 m of the 2016 Petermann rupture on the hanging-wall and foot-wall.
These samples came from similar outcrops with similar geomorphic settings (an inter-dune
sand-plain region). Given the low nature of the outcrops in the vicinity of sand dunes, it was
assumed that these samples may have experienced complex burial and exposure histories
which may reduce the 10Be concentration relative to samples from higher bedrock outcrops.
Similar to samples B and H, these samples were collected to provide near-rupture constraints
on erosion rates that might record evidence of paleoseismic activity.
Table 4.2. Sample details
Sample Date Long. Lat. Elev. (m)
Shielding Thickness
(cm)
A 06/2016 129.5276 -25.9145 724 0.99988 3
B 09/2017 129.7468 -25.6276 738 1 3
C 09/2017 129.7944 -25.6279 733 0.99982 3
D 09/2017 129.8802 -25.6537 691 0.99931 2 – 6
E 09/2017 129.8801 -25.6525 692 1 1 - 5
F 09/2017 129.8810 -25.6519 691 0.92359 1 - 2
G 09/2017 129.8818 -25.6501 696 0.9953 5 – 7
H 06/2016 129.8119 -25.5755 734 0.96869 3 - 5
I 09/2017 129.9695 -25.5224 715 1 1 - 3
J 06/2016 130.0313 -25.5284 735 0.99968 3 - 6
4.2.4.2. Processing
Samples were broken to gravel using a jaw crusher, crushed in a ring mill and sifted into 125
- 500 μm and 500 - 710 μm aliquots, rinsed to remove excess dust and fully dried. A
transmitted light microscope was used to choose the aliquot with the cleanest looking quartz
(fewest visible inclusions and composite grains). Magnetic minerals and composite grains
were removed using a vertical magnet and Frantz isodynamic magnetic separator, and light
and heavy felsic minerals were separated using sodium polytungstate (SPT) with ρ=2.85-2.9.
Isolation of Be from quartz grains was conducted by A. Alimanovic at the University of
Melbourne, following a method by J. Stone from Washington University. Light separates
were put in hydrochloric, nitric and weak hydrofluoric acids to dissolve non-quartz minerals.
Samples were inspected under a reflected light microscope to ensure only quartz remained
in the sample, and that the quartz had no impurities. The weight of the quartz sample was
recorded, a Be carrier was added, and the weight was recorded again to determine the weight
of Be carrier added. The quartz samples were then dissolved in hydrofluoric acid. Various
isotope leaching steps where undertaken to separate and 10Be from the solution including
successive evaporation and re-dissolution in hydrochloric and nitric acids to convert Fe, Ti,
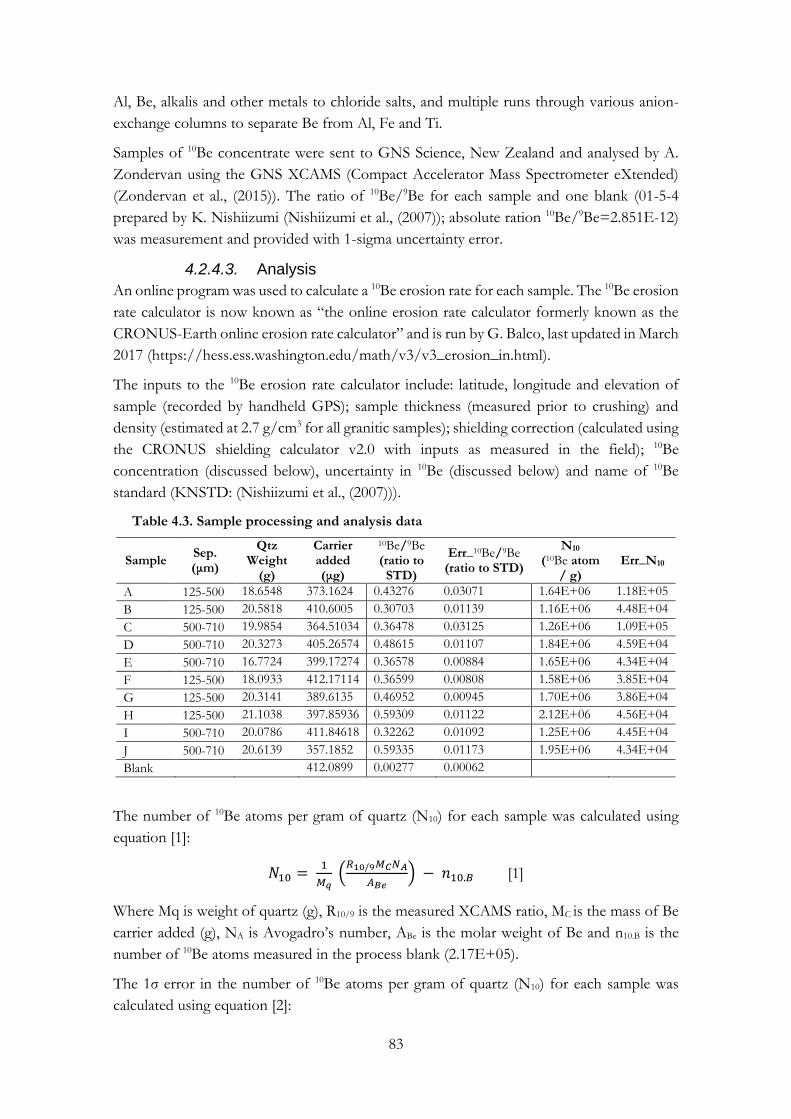
83
Al, Be, alkalis and other metals to chloride salts, and multiple runs through various anion-
exchange columns to separate Be from Al, Fe and Ti.
Samples of 10Be concentrate were sent to GNS Science, New Zealand and analysed by A.
Zondervan using the GNS XCAMS (Compact Accelerator Mass Spectrometer eXtended)
(Zondervan et al., (2015)). The ratio of 10Be/9Be for each sample and one blank (01-5-4
prepared by K. Nishiizumi (Nishiizumi et al., (2007)); absolute ration 10Be/9Be=2.851E-12)
was measurement and provided with 1-sigma uncertainty error.
4.2.4.3. Analysis
An online program was used to calculate a 10Be erosion rate for each sample. The 10Be erosion
rate calculator is now known as “the online erosion rate calculator formerly known as the
CRONUS-Earth online erosion rate calculator” and is run by G. Balco, last updated in March
2017 (https://hess.ess.washington.edu/math/v3/v3_erosion_in.html).
The inputs to the 10Be erosion rate calculator include: latitude, longitude and elevation of
sample (recorded by handheld GPS); sample thickness (measured prior to crushing) and
density (estimated at 2.7 g/cm3 for all granitic samples); shielding correction (calculated using
the CRONUS shielding calculator v2.0 with inputs as measured in the field); 10Be
concentration (discussed below), uncertainty in 10Be (discussed below) and name of 10Be
standard (KNSTD: (Nishiizumi et al., (2007))).
Table 4.3. Sample processing and analysis data
Sample Sep. (μm)
Qtz Weight
(g)
Carrier added (μg)
10Be/9Be (ratio to
STD)
Err_10Be/9Be (ratio to STD)
N10 (10Be atom
/ g) Err_N10
A 125-500 18.6548 373.1624 0.43276 0.03071 1.64E+06 1.18E+05
B 125-500 20.5818 410.6005 0.30703 0.01139 1.16E+06 4.48E+04
C 500-710 19.9854 364.51034 0.36478 0.03125 1.26E+06 1.09E+05
D 500-710 20.3273 405.26574 0.48615 0.01107 1.84E+06 4.59E+04
E 500-710 16.7724 399.17274 0.36578 0.00884 1.65E+06 4.34E+04
F 125-500 18.0933 412.17114 0.36599 0.00808 1.58E+06 3.85E+04
G 125-500 20.3141 389.6135 0.46952 0.00945 1.70E+06 3.86E+04
H 125-500 21.1038 397.85936 0.59309 0.01122 2.12E+06 4.56E+04
I 500-710 20.0786 411.84618 0.32262 0.01092 1.25E+06 4.45E+04
J 500-710 20.6139 357.1852 0.59335 0.01173 1.95E+06 4.34E+04
Blank 412.0899 0.00277 0.00062
The number of 10Be atoms per gram of quartz (N10) for each sample was calculated using
equation [1]:
𝑁10 = 1
𝑀𝑞 (
𝑅10/9𝑀𝐶𝑁𝐴
𝐴𝐵𝑒) − 𝑛10.𝐵 [1]
Where Mq is weight of quartz (g), R10/9 is the measured XCAMS ratio, MC is the mass of Be
carrier added (g), NA is Avogadro’s number, ABe is the molar weight of Be and n10.B is the
number of 10Be atoms measured in the process blank (2.17E+05).
The 1σ error in the number of 10Be atoms per gram of quartz (N10) for each sample was
calculated using equation [2]:
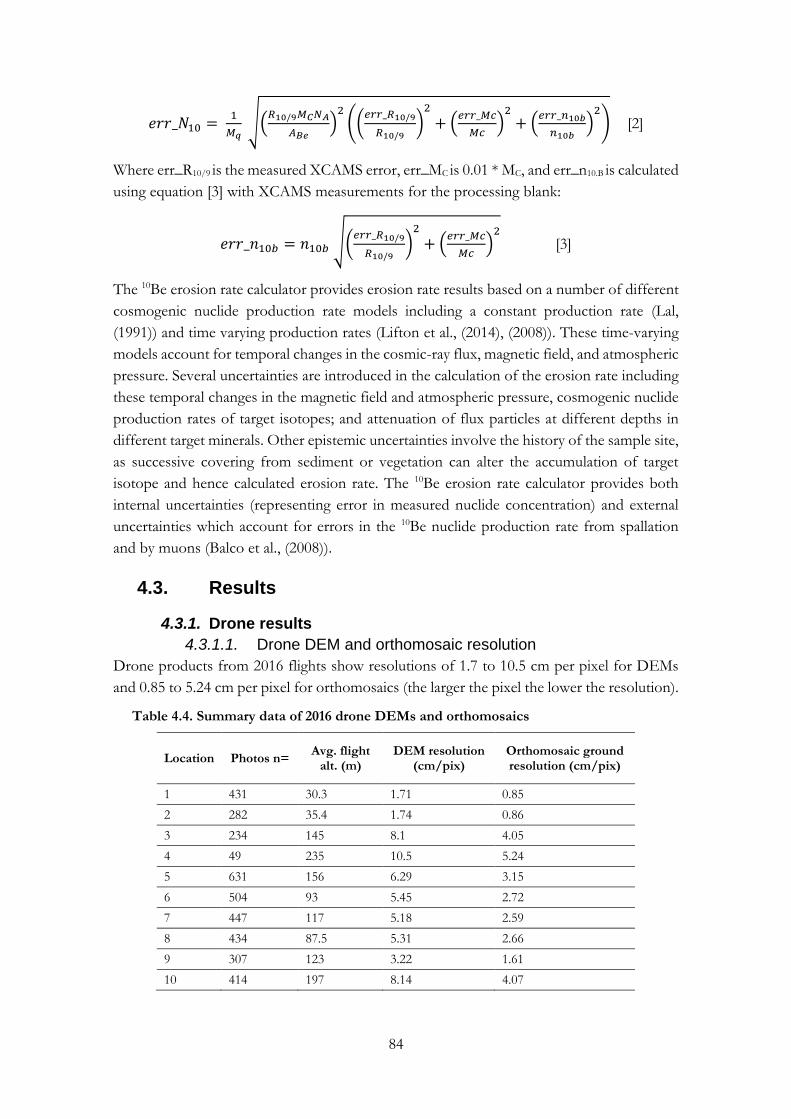
84
𝑒𝑟𝑟_𝑁10 = 1
𝑀𝑞 √(
𝑅10/9𝑀𝐶𝑁𝐴
𝐴𝐵𝑒)
2((
𝑒𝑟𝑟_𝑅10/9
𝑅10/9)
2
+ (𝑒𝑟𝑟_𝑀𝑐
𝑀𝑐)
2+ (
𝑒𝑟𝑟_𝑛10𝑏
𝑛10𝑏)
2) [2]
Where err_R10/9 is the measured XCAMS error, err_MC is 0.01 * MC, and err_n10.B is calculated
using equation [3] with XCAMS measurements for the processing blank:
𝑒𝑟𝑟_𝑛10𝑏 = 𝑛10𝑏 √(𝑒𝑟𝑟_𝑅10/9
𝑅10/9)
2
+ (𝑒𝑟𝑟_𝑀𝑐
𝑀𝑐)
2 [3]
The 10Be erosion rate calculator provides erosion rate results based on a number of different
cosmogenic nuclide production rate models including a constant production rate (Lal,
(1991)) and time varying production rates (Lifton et al., (2014), (2008)). These time-varying
models account for temporal changes in the cosmic-ray flux, magnetic field, and atmospheric
pressure. Several uncertainties are introduced in the calculation of the erosion rate including
these temporal changes in the magnetic field and atmospheric pressure, cosmogenic nuclide
production rates of target isotopes; and attenuation of flux particles at different depths in
different target minerals. Other epistemic uncertainties involve the history of the sample site,
as successive covering from sediment or vegetation can alter the accumulation of target
isotope and hence calculated erosion rate. The 10Be erosion rate calculator provides both
internal uncertainties (representing error in measured nuclide concentration) and external
uncertainties which account for errors in the 10Be nuclide production rate from spallation
and by muons (Balco et al., (2008)).
4.3. Results
4.3.1. Drone results
4.3.1.1. Drone DEM and orthomosaic resolution
Drone products from 2016 flights show resolutions of 1.7 to 10.5 cm per pixel for DEMs
and 0.85 to 5.24 cm per pixel for orthomosaics (the larger the pixel the lower the resolution).
Table 4.4. Summary data of 2016 drone DEMs and orthomosaics
Location Photos n= Avg. flight
alt. (m) DEM resolution
(cm/pix) Orthomosaic ground resolution (cm/pix)
1 431 30.3 1.71 0.85
2 282 35.4 1.74 0.86
3 234 145 8.1 4.05
4 49 235 10.5 5.24
5 631 156 6.29 3.15
6 504 93 5.45 2.72
7 447 117 5.18 2.59
8 434 87.5 5.31 2.66
9 307 123 3.22 1.61
10 414 197 8.14 4.07
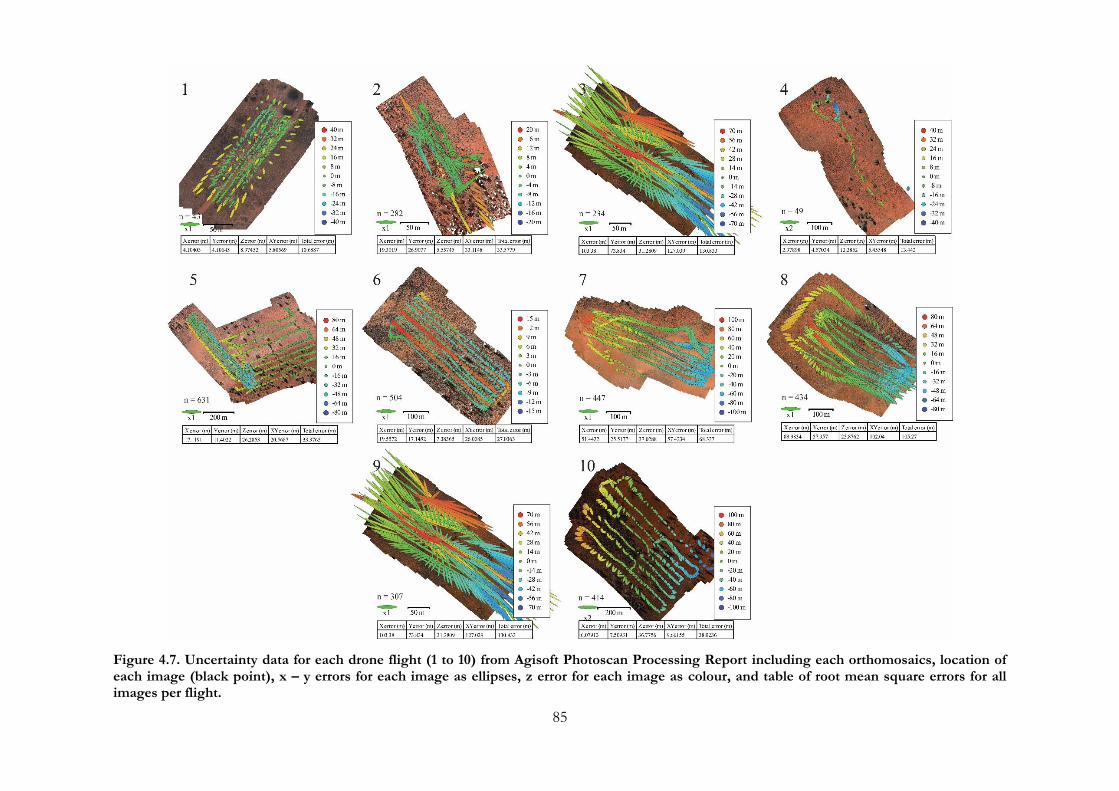
85
Figure 4.7. Uncertainty data for each drone flight (1 to 10) from Agisoft Photoscan Processing Report including each orthomosaics, location of each image (black point), x – y errors for each image as ellipses, z error for each image as colour, and table of root mean square errors for all images per flight.
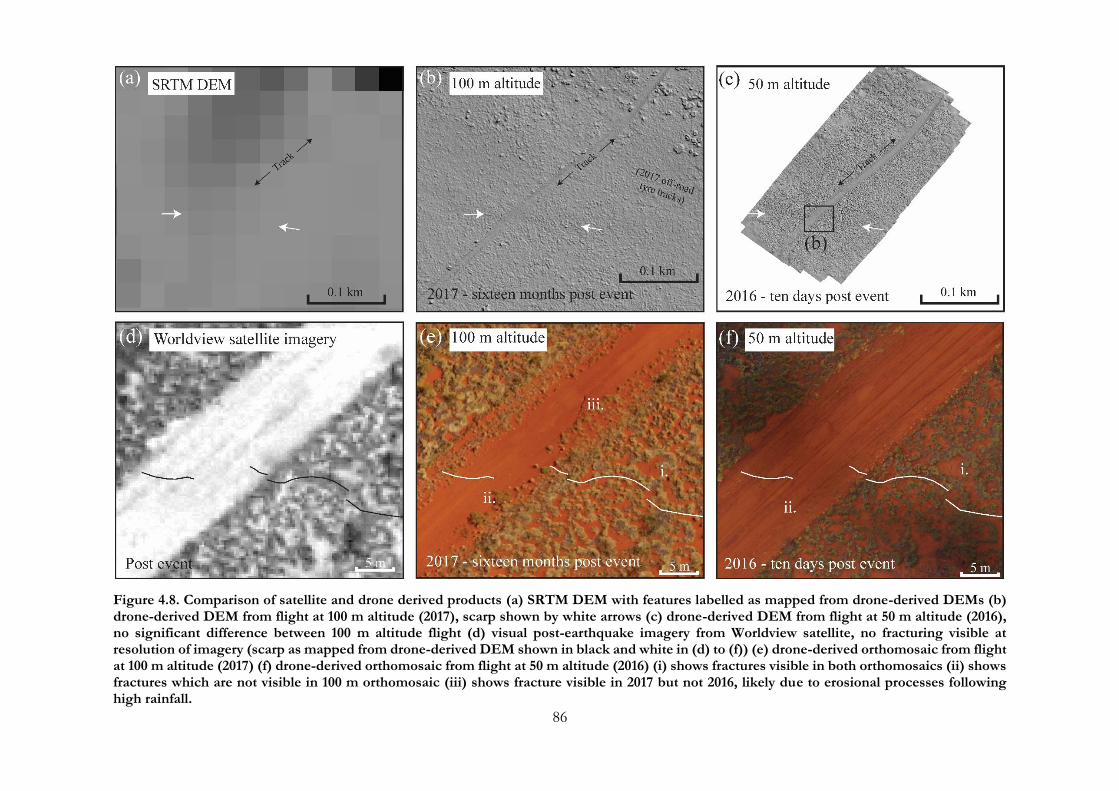
86
Figure 4.8. Comparison of satellite and drone derived products (a) SRTM DEM with features labelled as mapped from drone-derived DEMs (b) drone-derived DEM from flight at 100 m altitude (2017), scarp shown by white arrows (c) drone-derived DEM from flight at 50 m altitude (2016), no significant difference between 100 m altitude flight (d) visual post-earthquake imagery from Worldview satellite, no fracturing visible at resolution of imagery (scarp as mapped from drone-derived DEM shown in black and white in (d) to (f)) (e) drone-derived orthomosaic from flight at 100 m altitude (2017) (f) drone-derived orthomosaic from flight at 50 m altitude (2016) (i) shows fractures visible in both orthomosaics (ii) shows fractures which are not visible in 100 m orthomosaic (iii) shows fracture visible in 2017 but not 2016, likely due to erosional processes following high rainfall.

87
Figure 4.7 shows individual photo location and altitude errors for each 2016 drone flight as
estimated and provided by Photoscan. No clear correlation exists between models with high
photo errors (e.g. model 3 and 9; Figure 4.7) and DEM / orthomosaic resolution, flight
height, or number of photos per model.
A comparison of satellite derived and drone products (imagery and DEMs) is shown in
Figure 4.8. Figure 4.8a demonstrates the significant increase in DEM resolution between
SRTM satellite data (~ 2,700 cm/pix), drone flight at 100 m altitude (~17 cm/pix) and drone
flight at 50 m altitude (1.71 cm/pix). Figure 4.8b demonstrates the difference in image
resolution between post-event Worldview satellite data (~ 30 cm/pix), 100m high drone
flight (5 cm/pix) and 50 m high drone flight (0.85 cm/pix). Along with indicating the
differences in resolution between flight heights, the orthomosaics in Figure 4.8b show
changes to deformation features between ten days and sixteen months following the
mainshock. Record rainfalls in the intervening period (bom.com.au; Chapter 2) produced
significant vegetation growth which in some cases obscured features visible during the first
field season, and in some cases removed those features entirely through erosive processes. A
crack visible along the track in 2017 was not evident in 2016 (Figure 4.8e) and was
presumably produced by erosive processes along a minor unmapped extensional crack.
4.3.1.2. Drone DEM rupture mapping and vertical offset
measurements
All drone derived DEMs are shown in Figure 4.9 to Figure 4.18. These products were of
sufficient vertical resolution to enable mapping of primary surface rupture that was not
always visible in the field. Primary surface rupture features are observed to be discontinuous
in these DEM products, supporting field observations of discontinuous rupture.
Figure 4.9. Hill-shaded drone derived DEM of Zone 1 (Figure 4.2) with primary surface rupture indicated by white arrows (vertically exaggerated). Surface rupture in this location was not identifiable in the field due to low vertical offsets. However, InSAR data records displacement in this area, and minor offset is visible in this drone DEM.

88
Figure 4.10. Hill-shaded drone derived DEM of Zone 2 (Figure 4.2) with primary surface rupture indicated by white arrows (vertically exaggerated). Similar to Figure 4.9, rupture was not identifiable in the field in this location, but could be traced on this drone DEM coincident with the location of rupture on InSAR data.
Figure 4.11. Hill-shaded drone derived DEM of Zone 3 (Figure 4.2) with primary surface rupture indicated by white arrows (vertically exaggerated)
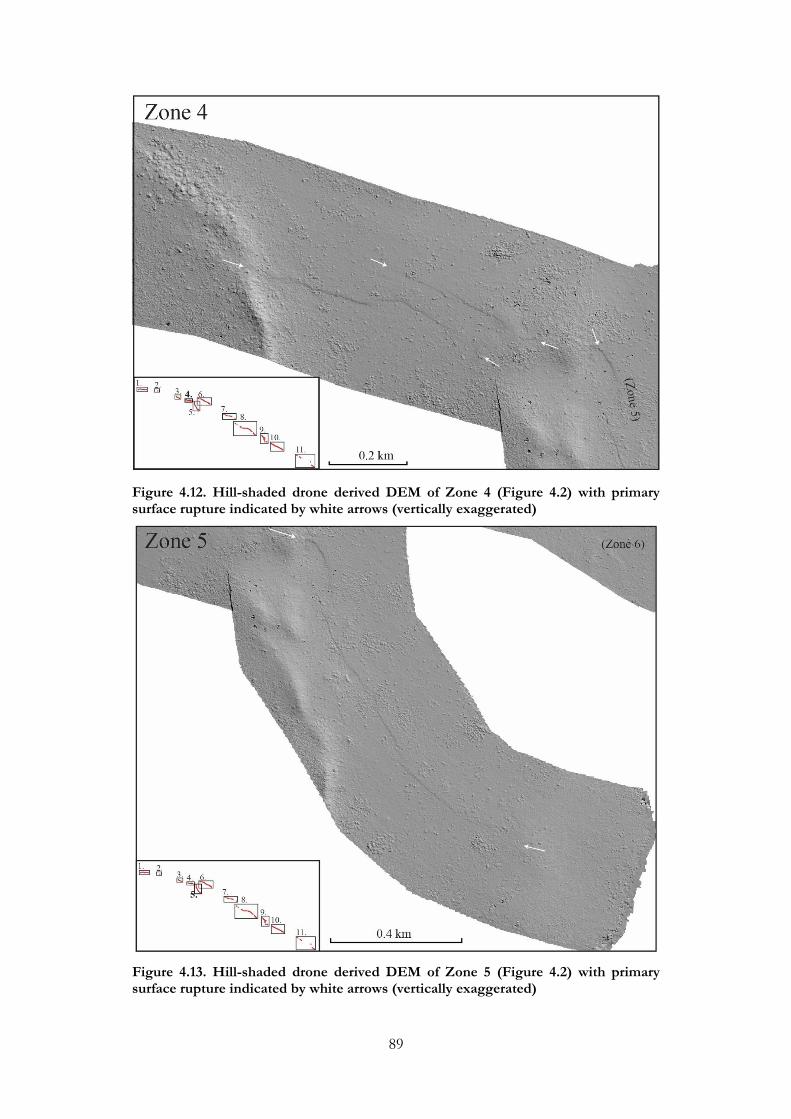
89
Figure 4.12. Hill-shaded drone derived DEM of Zone 4 (Figure 4.2) with primary surface rupture indicated by white arrows (vertically exaggerated)
Figure 4.13. Hill-shaded drone derived DEM of Zone 5 (Figure 4.2) with primary surface rupture indicated by white arrows (vertically exaggerated)
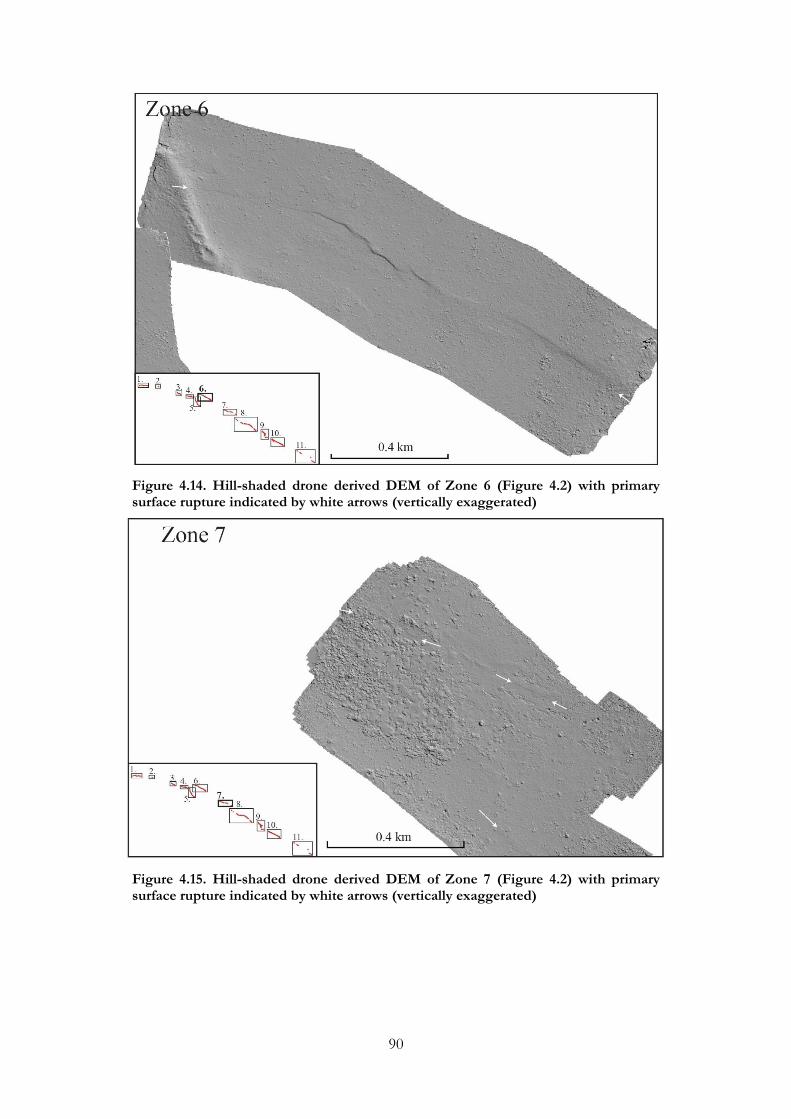
90
Figure 4.14. Hill-shaded drone derived DEM of Zone 6 (Figure 4.2) with primary surface rupture indicated by white arrows (vertically exaggerated)
Figure 4.15. Hill-shaded drone derived DEM of Zone 7 (Figure 4.2) with primary surface rupture indicated by white arrows (vertically exaggerated)
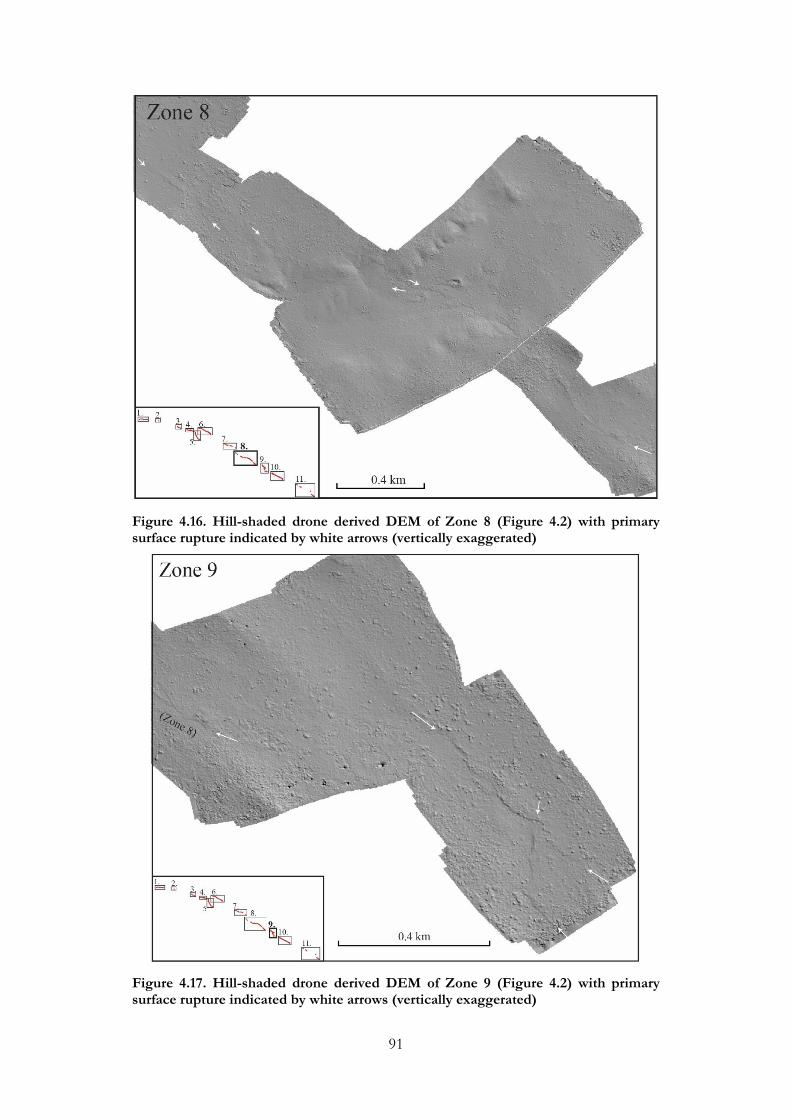
91
Figure 4.16. Hill-shaded drone derived DEM of Zone 8 (Figure 4.2) with primary surface rupture indicated by white arrows (vertically exaggerated)
Figure 4.17. Hill-shaded drone derived DEM of Zone 9 (Figure 4.2) with primary surface rupture indicated by white arrows (vertically exaggerated)

92
Figure 4.18. Hill-shaded drone derived DEM of Zone 10 (Figure 4.2) with primary surface rupture indicated by white arrows (vertically exaggerated)
4.3.2. Primary surface rupture and secondary fracture mapping
4.3.2.1. Maps and fracture density
Analysis of InSAR data suggests the 2016 Petermann earthquake surface rupture extends for
a total length of 21 km (Gold et al., (2019)). However, discrete surface rupture as visible in
the field and on high-resolution drone-derived DEMs is highly discontinuous. Figure 4.19
shows the full surface rupture map, with eleven zones of rupture defined based on the
location of gaps in visible surface rupture. Fine-scale mapping of deformation features
(surface rupture and fractures) and surface geology for each zone are presented in Figure
4.20 to Figure 4.30 for each of the eleven defined zones. Also presented in each figure are
available RTK vertical offset measurements, unwrapped InSAR interferogram data, mapped
surface geology, rose diagrams of rupture and fracture orientations, and photos of surface
rupture and/or fracturing for each zone.
Surface rupture was too low to be visibly discernible in Zones 1 and 2 during field work and
in orthomosaics but is traceable in drone-derived DEMs (Figure 4.9, Figure 4.10). Only two
fractures are mapped in Zone 1 and Zone 11. The only available imagery from Zone 2 comes
from a 2017 drone flight at 100 m elevation, no RTK data was collected in this zone, and no
helicopter photographs are available, limiting the ability to map fractures. Fractures in Zone
11 were mapped on the ground during the RTK survey by D. Clark. No drone imagery is
available for Zone 11, however multiple helicopter photos are available, with no observable
fracturing along the primary rupture.
Zone 2 includes the most mapped fractures (n=2068), which may in part relate to the
resolution of the 2016 drone orthomosaic for this area (location 1 (Zone 2), Table 4.4; 0.85

93
cm / pix). However, the fractures mapped in Zone 7 from a 2016 orthomosaic with
comparable resolution (location 2 (Zone 7), Table 4.4; 0.86 cm / pix) shows an order of
magnitude fewer fractures (n=317), suggesting that the number of fractures in Zone 2 is not
solely a product of available imagery quality.
Figure 4.31 shows probability distribution functions and cumulative distribution functions
for the distance of cracks away from the surface rupture for all zones, across the hanging-
wall and foot-wall. Less than 5% of all mapped fractures occur on the foot-wall of the 2016
surface rupture, most within 0 and 25 m from the rupture (4%), and some up to 80 m from
rupture (1%). In contrast, 50% of all mapped fractures occur within 30 m of surface rupture
on the hanging-wall, with the other 45% of fracture data falling between 30 and 250 m from
rupture (Figure 4.19, Figure 4.31). The majority of fractures at greater than 100 m distance
from the rupture occur in Zone 2 (Figure 4.31), with n = 528 fractures, compared to n = 33
combined across the other eight zones (Zones 1 and 11 are excluded from the analysis, as
they have n=2 fractures each). Seven of nine zones (4, 5, 6, 7, 8, 9, 10) have greater than 50%
of their mapped fractures within 20 m of surface rupture on the hanging-wall (Zone 3 has
49% of data within 20 m, and Zone 2 has 20%) (Figure 4.31). Zone 5 and 6 have 100% of
fractures within 10 m of surface rupture on the hanging-wall.
Figure 4.19. All mapping results across the 2016 Petermann rupture. Main map shows all mapped primary and secondary deformation features, RTK GPS measured vertical offsets along the surface rupture, published mainshock locations ([1] Hejrani and Tkalčić (2018) [2] Polcari et al. (2018)), and the locations of Zones 1 to 11, detailed in Figure 4.21 to Figure 4.30. (a) shows unwrapped InSAR (Gold et al., (2019) (b) shows mapped surface geology (c) shows rupture (red) and fracture (blue) orientations relative to the overall rupture strike (300°).

94
Figure 4.20. Mapping results from Zone 1. Main map shows all mapped primary and secondary deformation features, (ii) shows drone imagery and DEM demonstrating the low vertical offset mapped in this Zone (a) shows unwrapped InSAR (Gold et al., (2019) (b) shows mapped surface geology (c) shows rupture and fracture orientations relative to the overall rupture strike (300°).
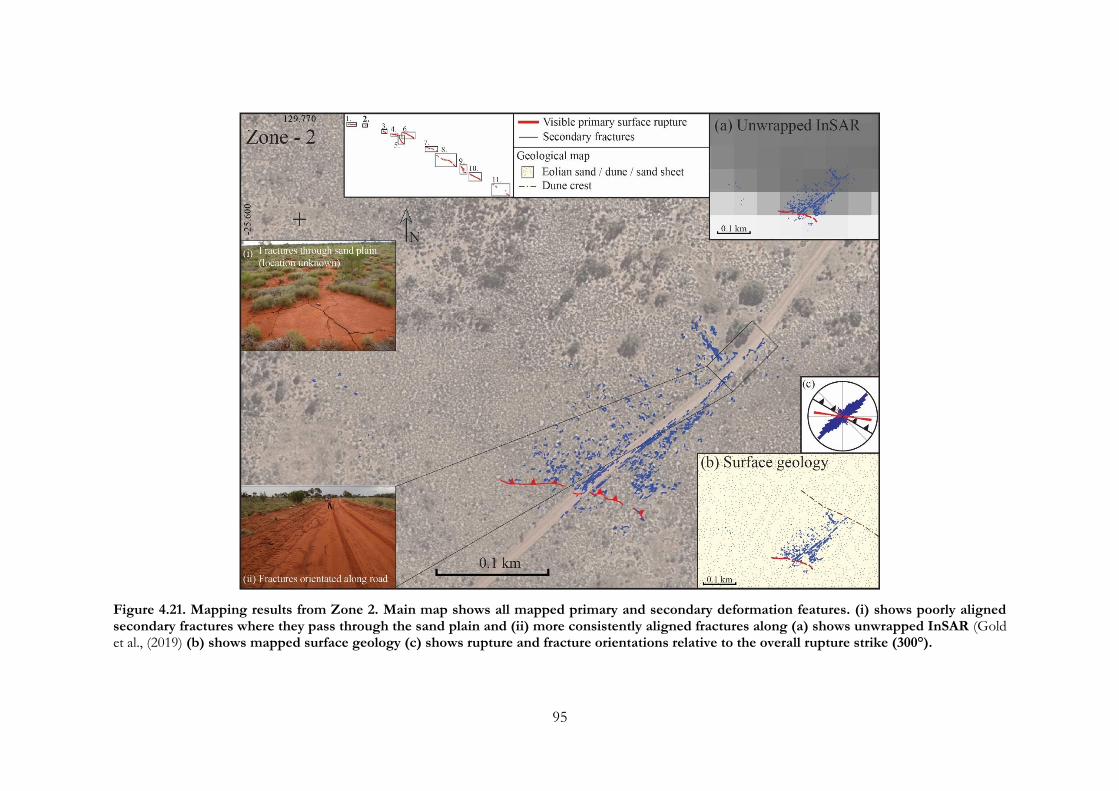
95
Figure 4.21. Mapping results from Zone 2. Main map shows all mapped primary and secondary deformation features. (i) shows poorly aligned secondary fractures where they pass through the sand plain and (ii) more consistently aligned fractures along (a) shows unwrapped InSAR (Gold et al., (2019) (b) shows mapped surface geology (c) shows rupture and fracture orientations relative to the overall rupture strike (300°).
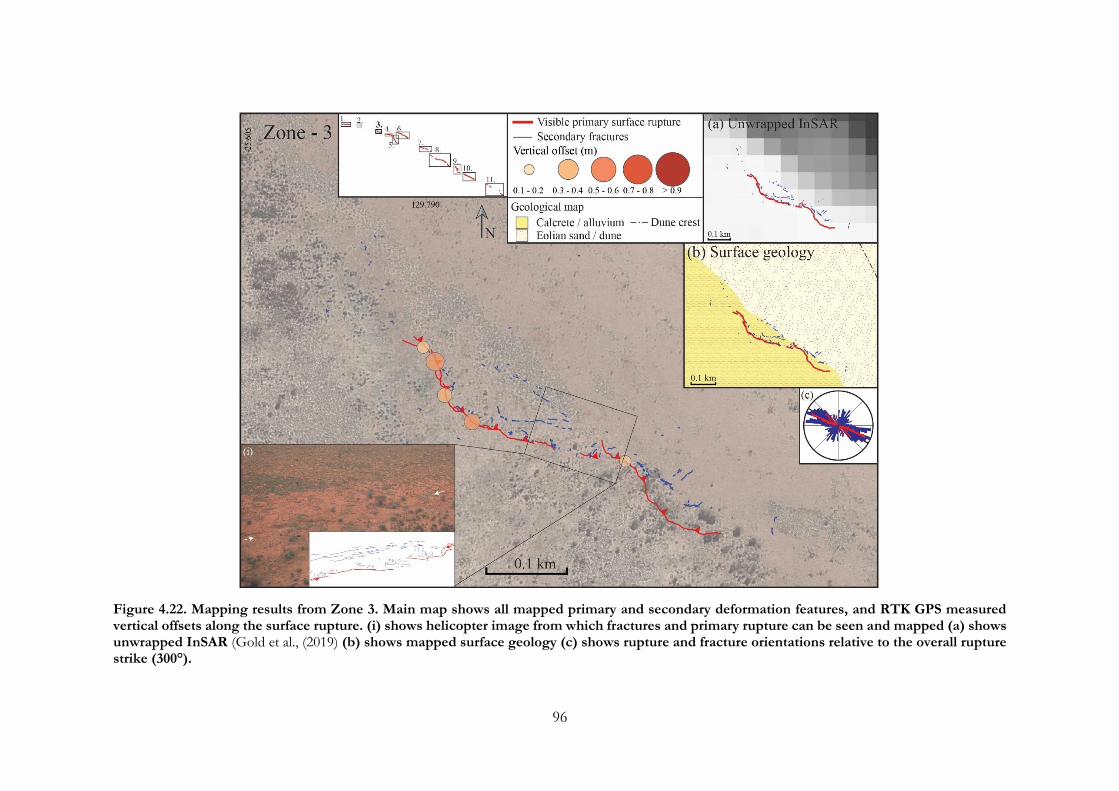
96
Figure 4.22. Mapping results from Zone 3. Main map shows all mapped primary and secondary deformation features, and RTK GPS measured vertical offsets along the surface rupture. (i) shows helicopter image from which fractures and primary rupture can be seen and mapped (a) shows unwrapped InSAR (Gold et al., (2019) (b) shows mapped surface geology (c) shows rupture and fracture orientations relative to the overall rupture strike (300°).

97
Figure 4.23. Mapping results from Zone 4. Main map shows all mapped primary and secondary deformation features, and RTK GPS measured vertical offsets along the surface rupture. (i), (ii) and (iii) show a large ~1 m wide fissure, in which in-situ bedrock dipping in the direction of the surface rupture can be seen within the aeolian sediment mantle (a) shows unwrapped InSAR (Gold et al., (2019) (b) shows mapped surface geology (c) shows rupture and fracture orientations relative to the overall rupture strike (300°).
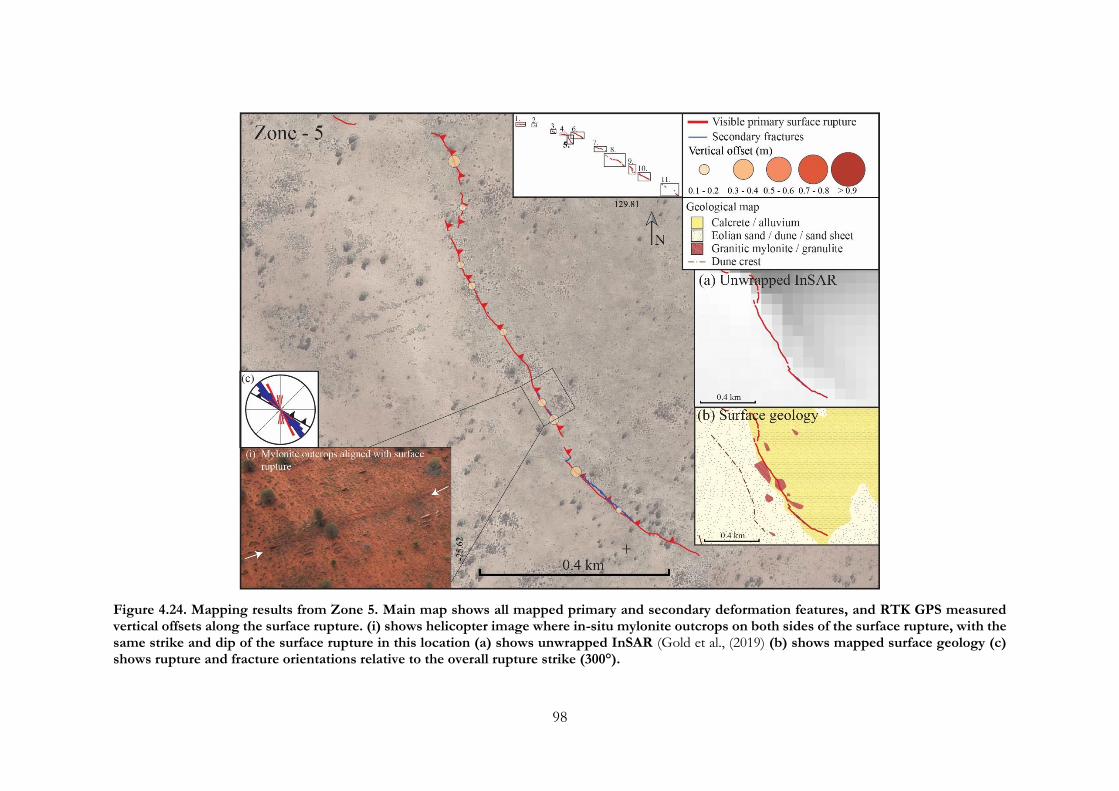
98
Figure 4.24. Mapping results from Zone 5. Main map shows all mapped primary and secondary deformation features, and RTK GPS measured vertical offsets along the surface rupture. (i) shows helicopter image where in-situ mylonite outcrops on both sides of the surface rupture, with the same strike and dip of the surface rupture in this location (a) shows unwrapped InSAR (Gold et al., (2019) (b) shows mapped surface geology (c) shows rupture and fracture orientations relative to the overall rupture strike (300°).
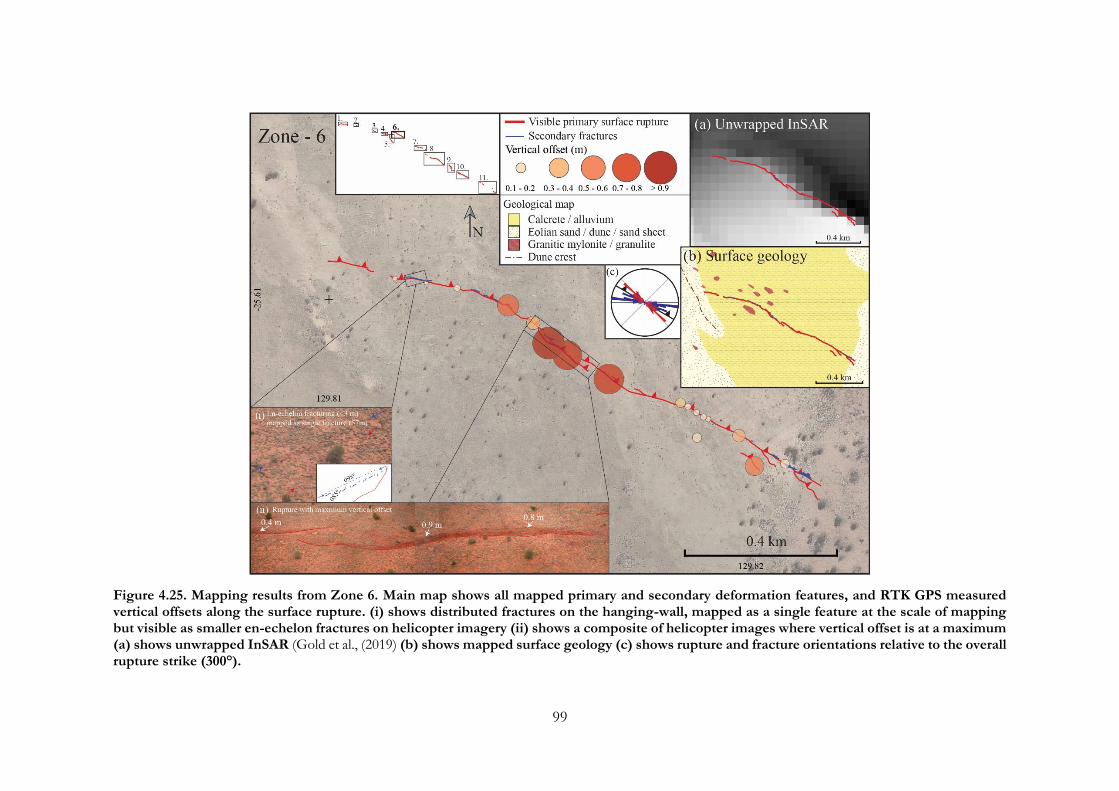
99
Figure 4.25. Mapping results from Zone 6. Main map shows all mapped primary and secondary deformation features, and RTK GPS measured vertical offsets along the surface rupture. (i) shows distributed fractures on the hanging-wall, mapped as a single feature at the scale of mapping but visible as smaller en-echelon fractures on helicopter imagery (ii) shows a composite of helicopter images where vertical offset is at a maximum (a) shows unwrapped InSAR (Gold et al., (2019) (b) shows mapped surface geology (c) shows rupture and fracture orientations relative to the overall rupture strike (300°).
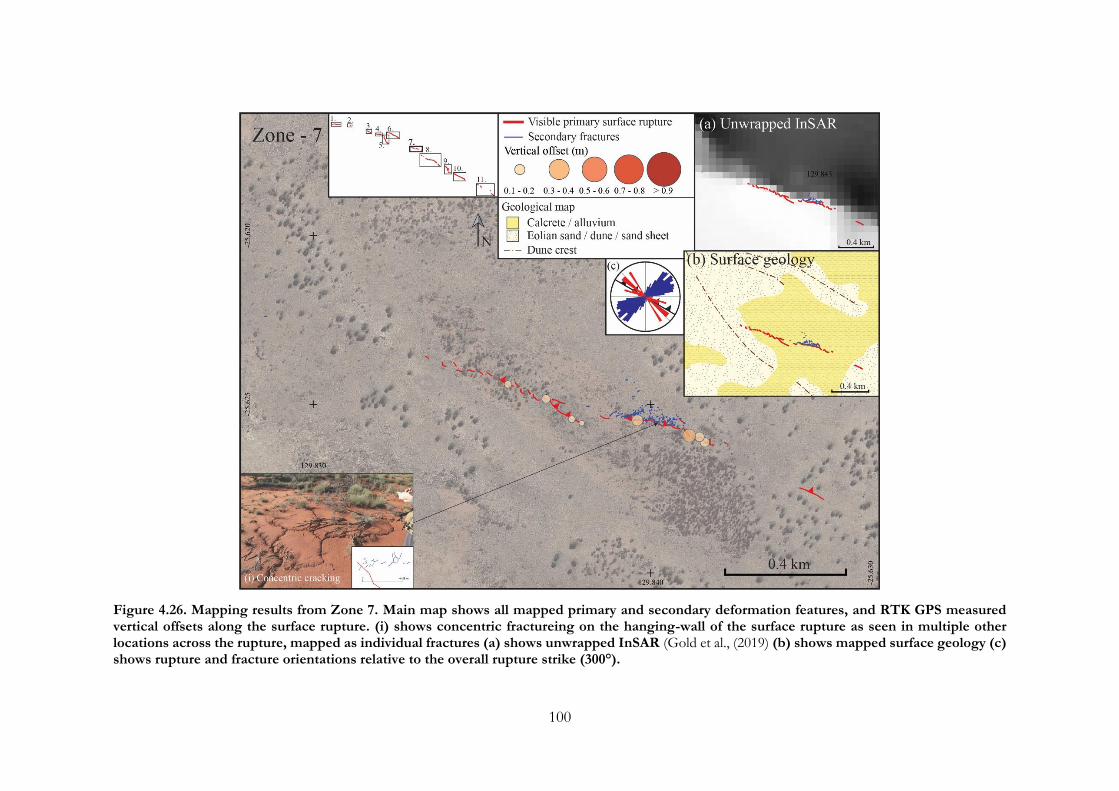
100
Figure 4.26. Mapping results from Zone 7. Main map shows all mapped primary and secondary deformation features, and RTK GPS measured vertical offsets along the surface rupture. (i) shows concentric fractureing on the hanging-wall of the surface rupture as seen in multiple other locations across the rupture, mapped as individual fractures (a) shows unwrapped InSAR (Gold et al., (2019) (b) shows mapped surface geology (c) shows rupture and fracture orientations relative to the overall rupture strike (300°).
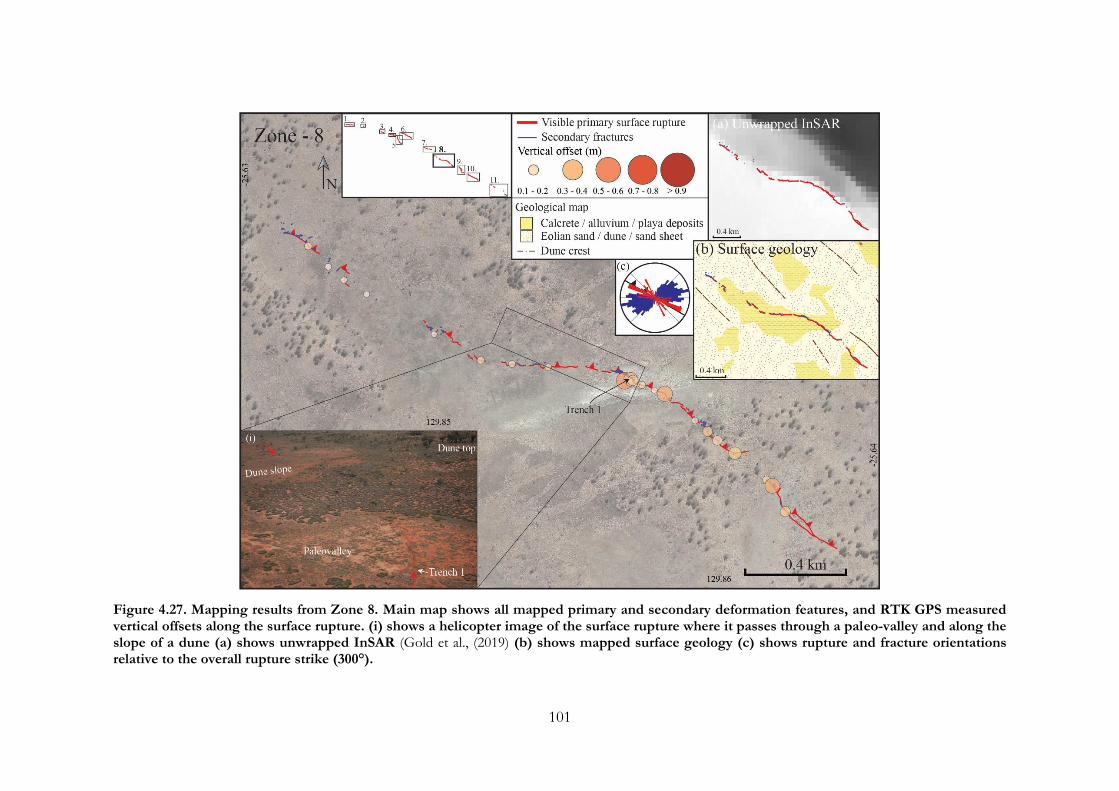
101
Figure 4.27. Mapping results from Zone 8. Main map shows all mapped primary and secondary deformation features, and RTK GPS measured vertical offsets along the surface rupture. (i) shows a helicopter image of the surface rupture where it passes through a paleo-valley and along the slope of a dune (a) shows unwrapped InSAR (Gold et al., (2019) (b) shows mapped surface geology (c) shows rupture and fracture orientations relative to the overall rupture strike (300°).

102
Figure 4.28. Mapping results from Zone 9. Main map shows all mapped primary and secondary deformation features, and RTK GPS measured vertical offsets along the surface rupture. (i) shows a helicopter image of surface rupture where it branches, with the main trace (higher offsets) continuing at a 50º angle to the overall rupture strike (a) shows unwrapped InSAR (Gold et al., (2019) (b) shows mapped surface geology (c) shows rupture and fracture orientations relative to the overall rupture strike (300°).
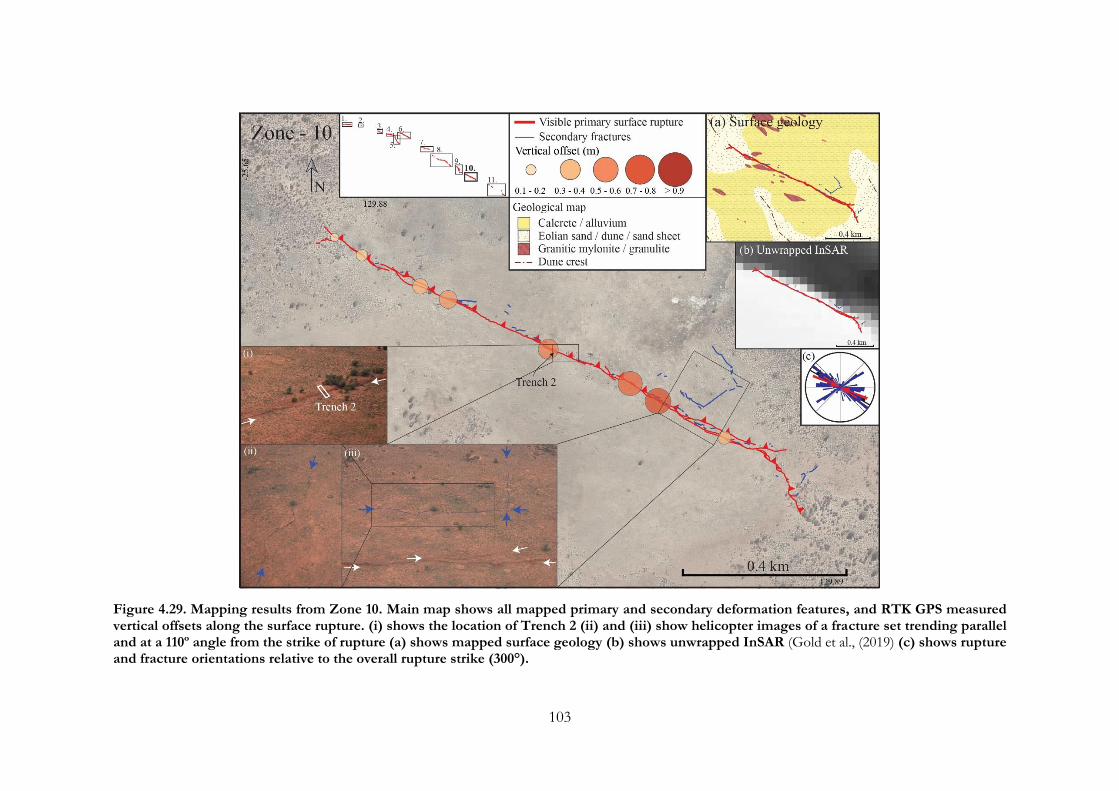
103
Figure 4.29. Mapping results from Zone 10. Main map shows all mapped primary and secondary deformation features, and RTK GPS measured vertical offsets along the surface rupture. (i) shows the location of Trench 2 (ii) and (iii) show helicopter images of a fracture set trending parallel and at a 110º angle from the strike of rupture (a) shows mapped surface geology (b) shows unwrapped InSAR (Gold et al., (2019) (c) shows rupture and fracture orientations relative to the overall rupture strike (300°).
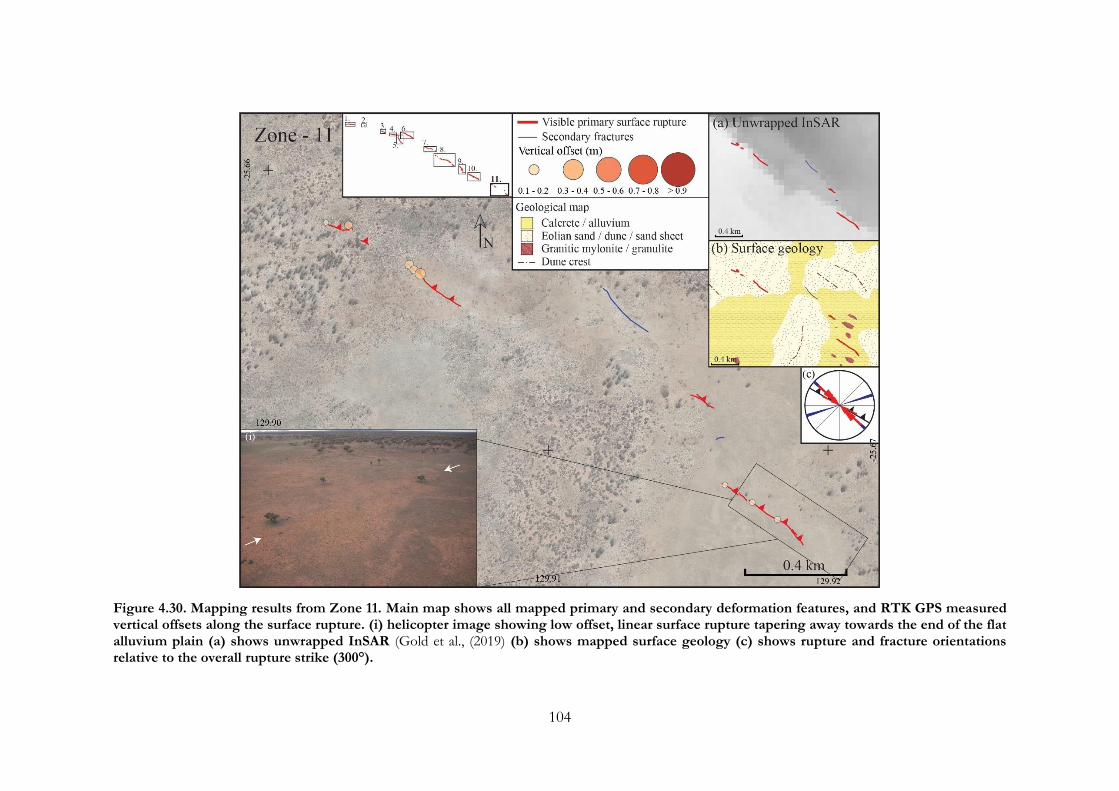
104
Figure 4.30. Mapping results from Zone 11. Main map shows all mapped primary and secondary deformation features, and RTK GPS measured vertical offsets along the surface rupture. (i) helicopter image showing low offset, linear surface rupture tapering away towards the end of the flat alluvium plain (a) shows unwrapped InSAR (Gold et al., (2019) (b) shows mapped surface geology (c) shows rupture and fracture orientations relative to the overall rupture strike (300°).
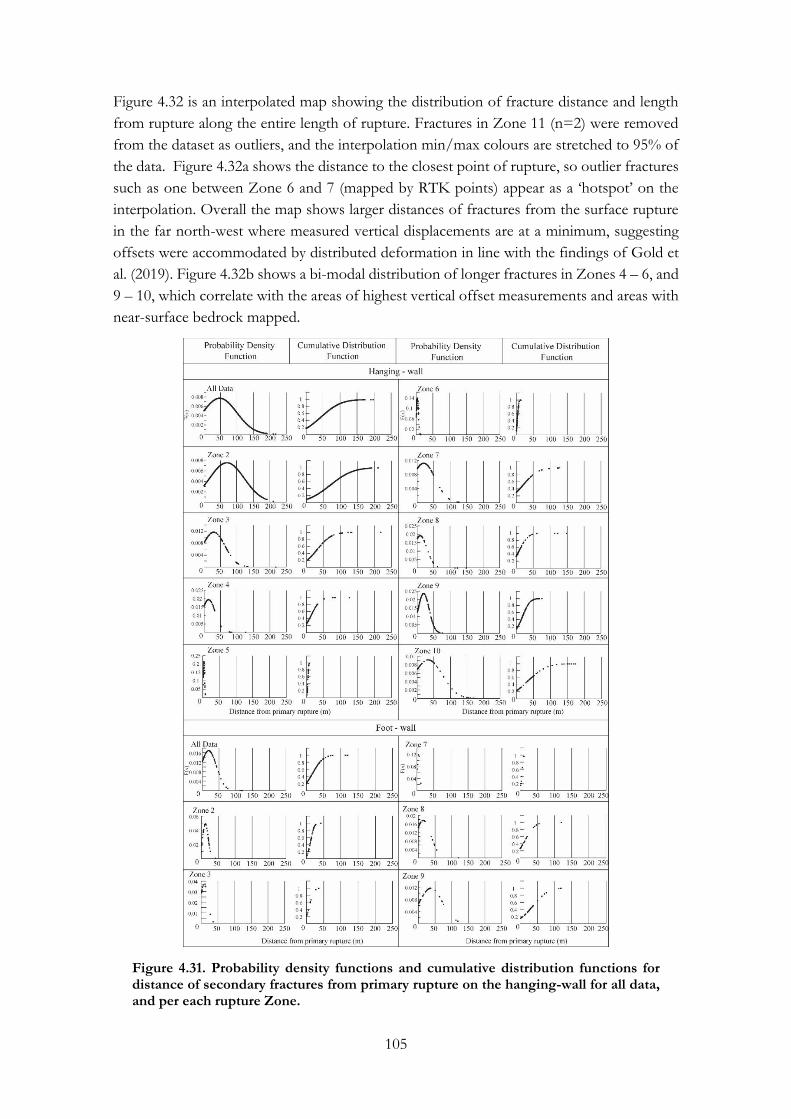
105
Figure 4.32 is an interpolated map showing the distribution of fracture distance and length
from rupture along the entire length of rupture. Fractures in Zone 11 (n=2) were removed
from the dataset as outliers, and the interpolation min/max colours are stretched to 95% of
the data. Figure 4.32a shows the distance to the closest point of rupture, so outlier fractures
such as one between Zone 6 and 7 (mapped by RTK points) appear as a ‘hotspot’ on the
interpolation. Overall the map shows larger distances of fractures from the surface rupture
in the far north-west where measured vertical displacements are at a minimum, suggesting
offsets were accommodated by distributed deformation in line with the findings of Gold et
al. (2019). Figure 4.32b shows a bi-modal distribution of longer fractures in Zones 4 – 6, and
9 – 10, which correlate with the areas of highest vertical offset measurements and areas with
near-surface bedrock mapped.
Figure 4.31. Probability density functions and cumulative distribution functions for distance of secondary fractures from primary rupture on the hanging-wall for all data, and per each rupture Zone.
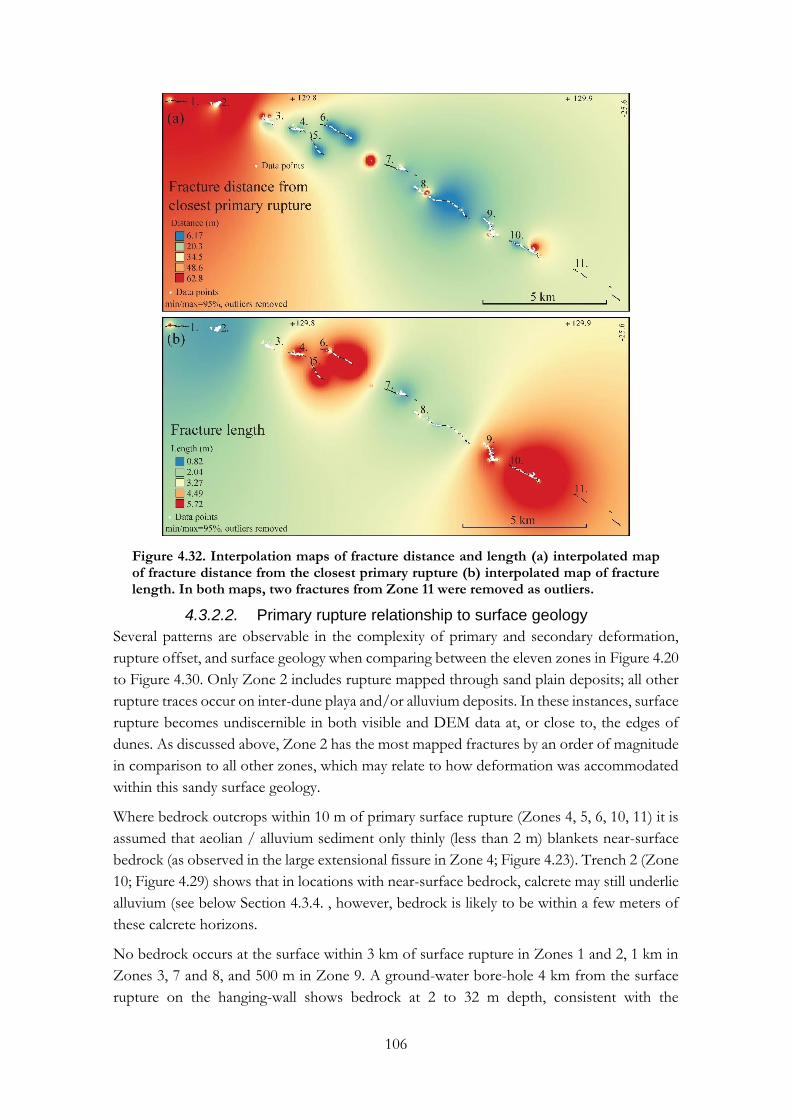
106
Figure 4.32. Interpolation maps of fracture distance and length (a) interpolated map of fracture distance from the closest primary rupture (b) interpolated map of fracture length. In both maps, two fractures from Zone 11 were removed as outliers.
4.3.2.2. Primary rupture relationship to surface geology
Several patterns are observable in the complexity of primary and secondary deformation,
rupture offset, and surface geology when comparing between the eleven zones in Figure 4.20
to Figure 4.30. Only Zone 2 includes rupture mapped through sand plain deposits; all other
rupture traces occur on inter-dune playa and/or alluvium deposits. In these instances, surface
rupture becomes undiscernible in both visible and DEM data at, or close to, the edges of
dunes. As discussed above, Zone 2 has the most mapped fractures by an order of magnitude
in comparison to all other zones, which may relate to how deformation was accommodated
within this sandy surface geology.
Where bedrock outcrops within 10 m of primary surface rupture (Zones 4, 5, 6, 10, 11) it is
assumed that aeolian / alluvium sediment only thinly (less than 2 m) blankets near-surface
bedrock (as observed in the large extensional fissure in Zone 4; Figure 4.23). Trench 2 (Zone
10; Figure 4.29) shows that in locations with near-surface bedrock, calcrete may still underlie
alluvium (see below Section 4.3.4. , however, bedrock is likely to be within a few meters of
these calcrete horizons.
No bedrock occurs at the surface within 3 km of surface rupture in Zones 1 and 2, 1 km in
Zones 3, 7 and 8, and 500 m in Zone 9. A ground-water bore-hole 4 km from the surface
rupture on the hanging-wall shows bedrock at 2 to 32 m depth, consistent with the
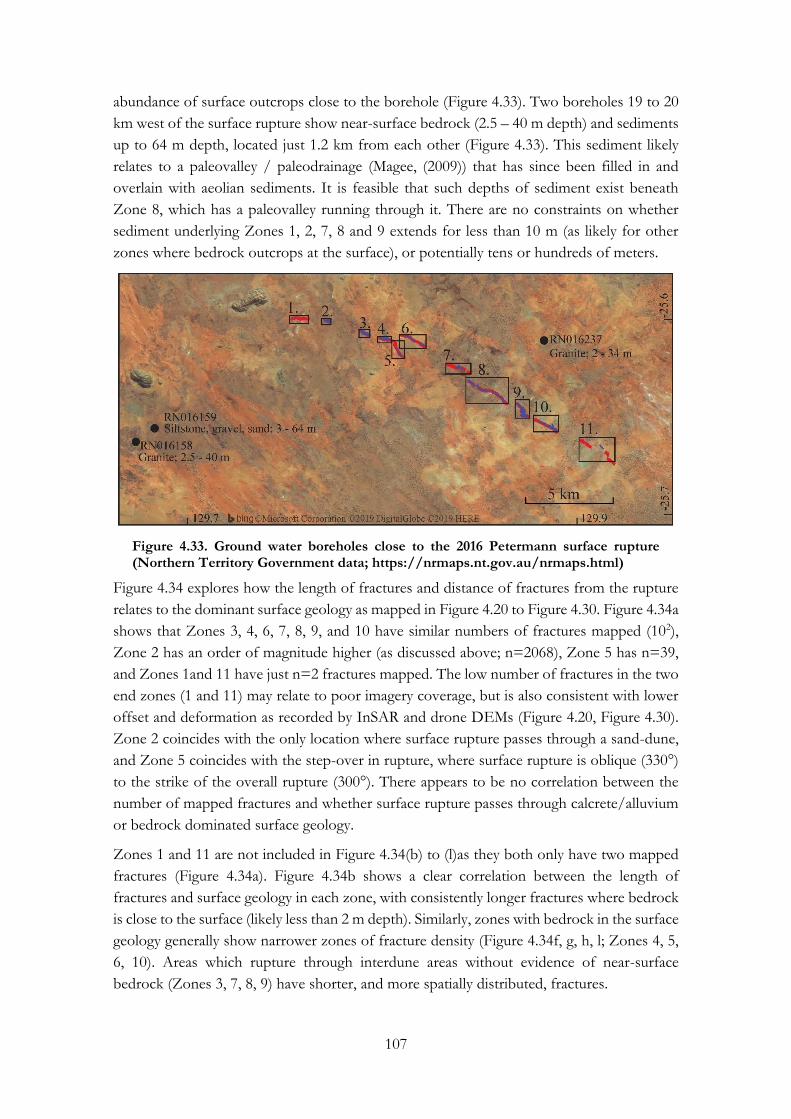
107
abundance of surface outcrops close to the borehole (Figure 4.33). Two boreholes 19 to 20
km west of the surface rupture show near-surface bedrock (2.5 – 40 m depth) and sediments
up to 64 m depth, located just 1.2 km from each other (Figure 4.33). This sediment likely
relates to a paleovalley / paleodrainage (Magee, (2009)) that has since been filled in and
overlain with aeolian sediments. It is feasible that such depths of sediment exist beneath
Zone 8, which has a paleovalley running through it. There are no constraints on whether
sediment underlying Zones 1, 2, 7, 8 and 9 extends for less than 10 m (as likely for other
zones where bedrock outcrops at the surface), or potentially tens or hundreds of meters.
Figure 4.33. Ground water boreholes close to the 2016 Petermann surface rupture (Northern Territory Government data; https://nrmaps.nt.gov.au/nrmaps.html)
Figure 4.34 explores how the length of fractures and distance of fractures from the rupture
relates to the dominant surface geology as mapped in Figure 4.20 to Figure 4.30. Figure 4.34a
shows that Zones 3, 4, 6, 7, 8, 9, and 10 have similar numbers of fractures mapped (102),
Zone 2 has an order of magnitude higher (as discussed above; n=2068), Zone 5 has n=39,
and Zones 1and 11 have just n=2 fractures mapped. The low number of fractures in the two
end zones (1 and 11) may relate to poor imagery coverage, but is also consistent with lower
offset and deformation as recorded by InSAR and drone DEMs (Figure 4.20, Figure 4.30).
Zone 2 coincides with the only location where surface rupture passes through a sand-dune,
and Zone 5 coincides with the step-over in rupture, where surface rupture is oblique (330°)
to the strike of the overall rupture (300°). There appears to be no correlation between the
number of mapped fractures and whether surface rupture passes through calcrete/alluvium
or bedrock dominated surface geology.
Zones 1 and 11 are not included in Figure 4.34(b) to (l)as they both only have two mapped
fractures (Figure 4.34a). Figure 4.34b shows a clear correlation between the length of
fractures and surface geology in each zone, with consistently longer fractures where bedrock
is close to the surface (likely less than 2 m depth). Similarly, zones with bedrock in the surface
geology generally show narrower zones of fracture density (Figure 4.34f, g, h, l; Zones 4, 5,
6, 10). Areas which rupture through interdune areas without evidence of near-surface
bedrock (Zones 3, 7, 8, 9) have shorter, and more spatially distributed, fractures.
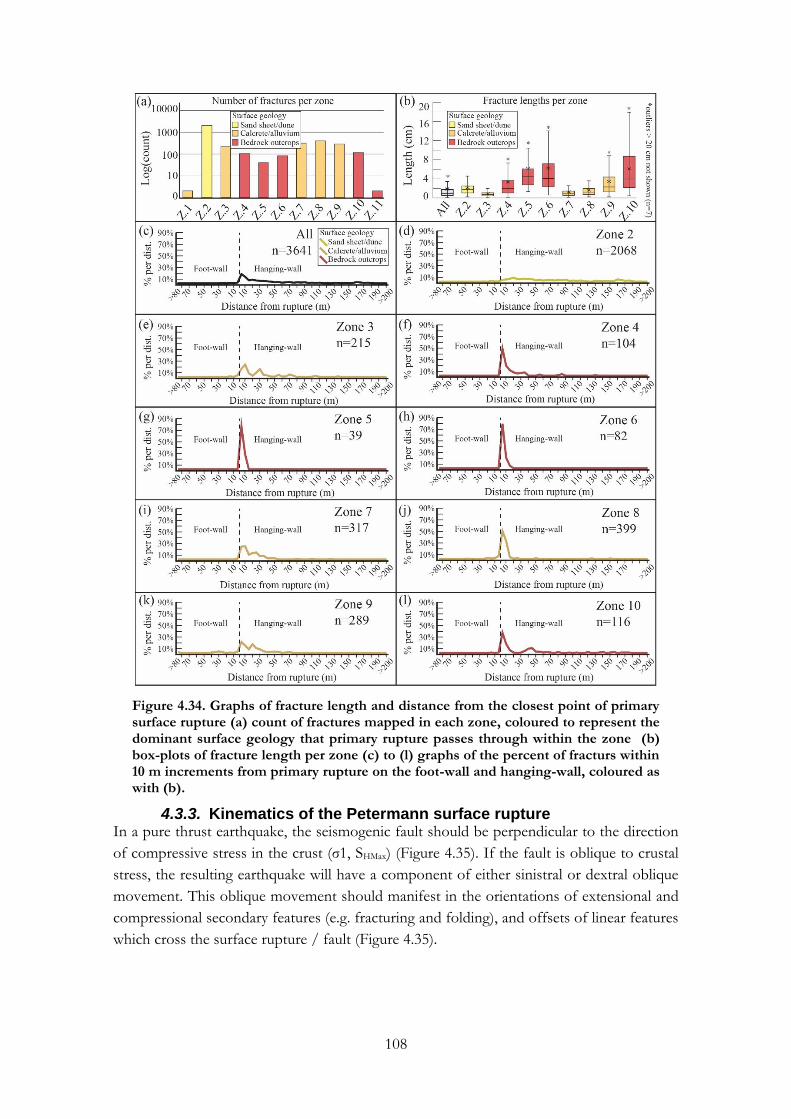
108
Figure 4.34. Graphs of fracture length and distance from the closest point of primary surface rupture (a) count of fractures mapped in each zone, coloured to represent the dominant surface geology that primary rupture passes through within the zone (b) box-plots of fracture length per zone (c) to (l) graphs of the percent of fracturs within 10 m increments from primary rupture on the foot-wall and hanging-wall, coloured as with (b).
4.3.3. Kinematics of the Petermann surface rupture In a pure thrust earthquake, the seismogenic fault should be perpendicular to the direction
of compressive stress in the crust (σ1, SHMax) (Figure 4.35). If the fault is oblique to crustal
stress, the resulting earthquake will have a component of either sinistral or dextral oblique
movement. This oblique movement should manifest in the orientations of extensional and
compressional secondary features (e.g. fracturing and folding), and offsets of linear features
which cross the surface rupture / fault (Figure 4.35).
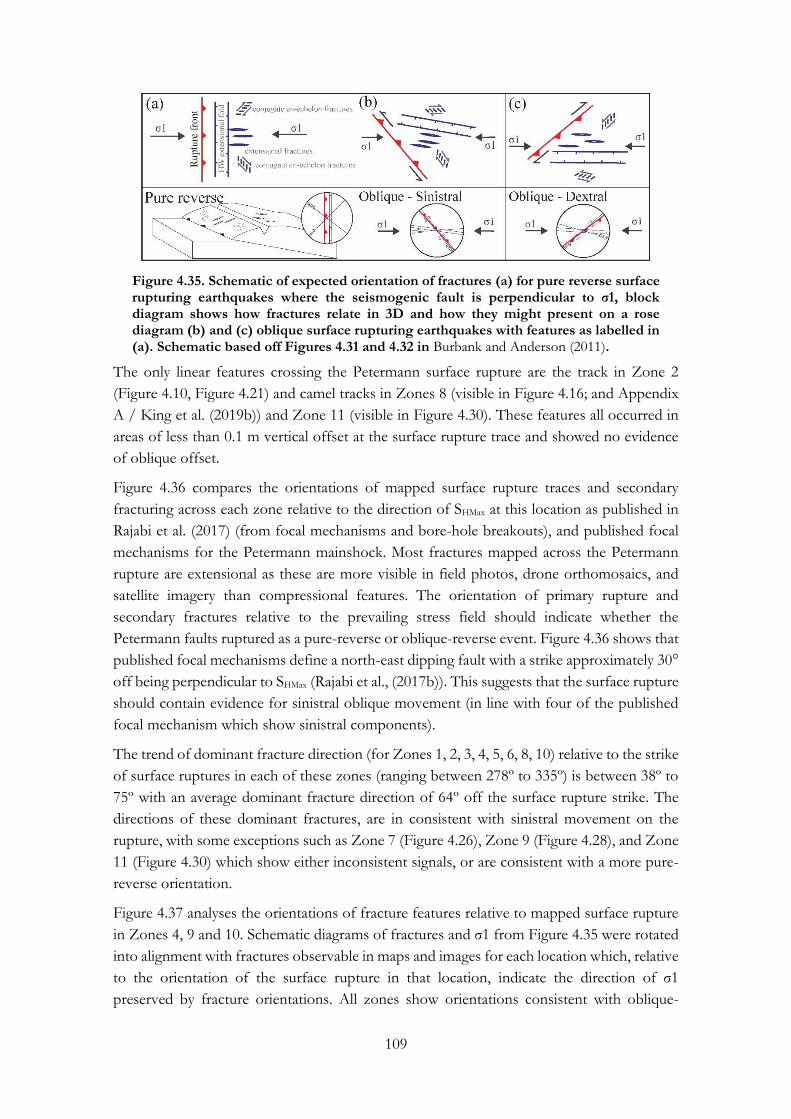
109
Figure 4.35. Schematic of expected orientation of fractures (a) for pure reverse surface rupturing earthquakes where the seismogenic fault is perpendicular to σ1, block diagram shows how fractures relate in 3D and how they might present on a rose diagram (b) and (c) oblique surface rupturing earthquakes with features as labelled in (a). Schematic based off Figures 4.31 and 4.32 in Burbank and Anderson (2011).
The only linear features crossing the Petermann surface rupture are the track in Zone 2
(Figure 4.10, Figure 4.21) and camel tracks in Zones 8 (visible in Figure 4.16; and Appendix
A / King et al. (2019b)) and Zone 11 (visible in Figure 4.30). These features all occurred in
areas of less than 0.1 m vertical offset at the surface rupture trace and showed no evidence
of oblique offset.
Figure 4.36 compares the orientations of mapped surface rupture traces and secondary
fracturing across each zone relative to the direction of SHMax at this location as published in
Rajabi et al. (2017) (from focal mechanisms and bore-hole breakouts), and published focal
mechanisms for the Petermann mainshock. Most fractures mapped across the Petermann
rupture are extensional as these are more visible in field photos, drone orthomosaics, and
satellite imagery than compressional features. The orientation of primary rupture and
secondary fractures relative to the prevailing stress field should indicate whether the
Petermann faults ruptured as a pure-reverse or oblique-reverse event. Figure 4.36 shows that
published focal mechanisms define a north-east dipping fault with a strike approximately 30°
off being perpendicular to SHMax (Rajabi et al., (2017b)). This suggests that the surface rupture
should contain evidence for sinistral oblique movement (in line with four of the published
focal mechanism which show sinistral components).
The trend of dominant fracture direction (for Zones 1, 2, 3, 4, 5, 6, 8, 10) relative to the strike
of surface ruptures in each of these zones (ranging between 278º to 335º) is between 38º to
75º with an average dominant fracture direction of 64º off the surface rupture strike. The
directions of these dominant fractures, are in consistent with sinistral movement on the
rupture, with some exceptions such as Zone 7 (Figure 4.26), Zone 9 (Figure 4.28), and Zone
11 (Figure 4.30) which show either inconsistent signals, or are consistent with a more pure-
reverse orientation.
Figure 4.37 analyses the orientations of fracture features relative to mapped surface rupture
in Zones 4, 9 and 10. Schematic diagrams of fractures and σ1 from Figure 4.35 were rotated
into alignment with fractures observable in maps and images for each location which, relative
to the orientation of the surface rupture in that location, indicate the direction of σ1
preserved by fracture orientations. All zones show orientations consistent with oblique-

110
sinistral reverse movement, with σ1 trend directions varying from 045° to 090° (SHMax is
orientated to 066º in Rajabi et al. (2017a), based on the orientation of focal mechanisms and
bore-hole breakouts across the region).
Figure 4.36. The orientation of mapped primary surface rupture and secondary fracturing relative to SHMax and published focal mechanism (a) published focal mechanisms for the Petermann earthquake (b) data points from the Global Stress Map (http://www.world-stress-map.org/) through central Australia and the orientation of the SHMax as published in Rajabi et al. (2017) (c) rose diagrams for all mapped features and per zone, showing rupture and fracture orientations (not length weighted), the strike of overall rupture (300°) and orientations of SHMax and fault planes from published focal mechanisms.

111
Figure 4.37. Kinematic analysis of mapped fracture features (a) to (d) shows two a large extensional fissures in Zone 4 (a) mapped surface rupture and fissure orientations (b) drone image of fissure system with arrows indicating visible displacements (c) schematic representation of SHMax rotated to align with observed fracture orientations (d) schematic of sinistral extensional jogs from Kim et al. (2004) which aligns with observed features. (e) to (g) extensional fractures in Zone 10 (e) mapped surface rupture and fracture orientations (f) helicopter photo rotated to north showing observable offsets of fractures (g) schematic representation of SHMax rotated to align with observed fracture orientations. (h) to (k) extensional fractures in Zone 9 (h) mapped surface rupture and fracture orientations (i) helicopter photo rotated to north showing observable offsets of fractures (j) schematic of sinistral compressional jogs from Kim et al. (2004) which aligns with observed features (k) schematic representation of SHMax rotated to align with observed fracture orientations (l) the orientation of σ1 as recorded from Zones 4, 9, 10, and the direction of SHMax (Rajabi et al., (2017b)).
4.3.4. Trench logs Trench 1 (Zone 8) was dug across the Petermann surface rupture within a palaeovalley while
Trench 2 (Zone 10) was dug within an inter-dune location with bedrock outcrops on both
hanging-wall and foot-wall. Both trenches exposed calcrete underlying aeolian and alluvial
sediments at 0.72 m in Trench 1 and 0.25 m in Trench 2. Calcrete in Trench 1 was massive
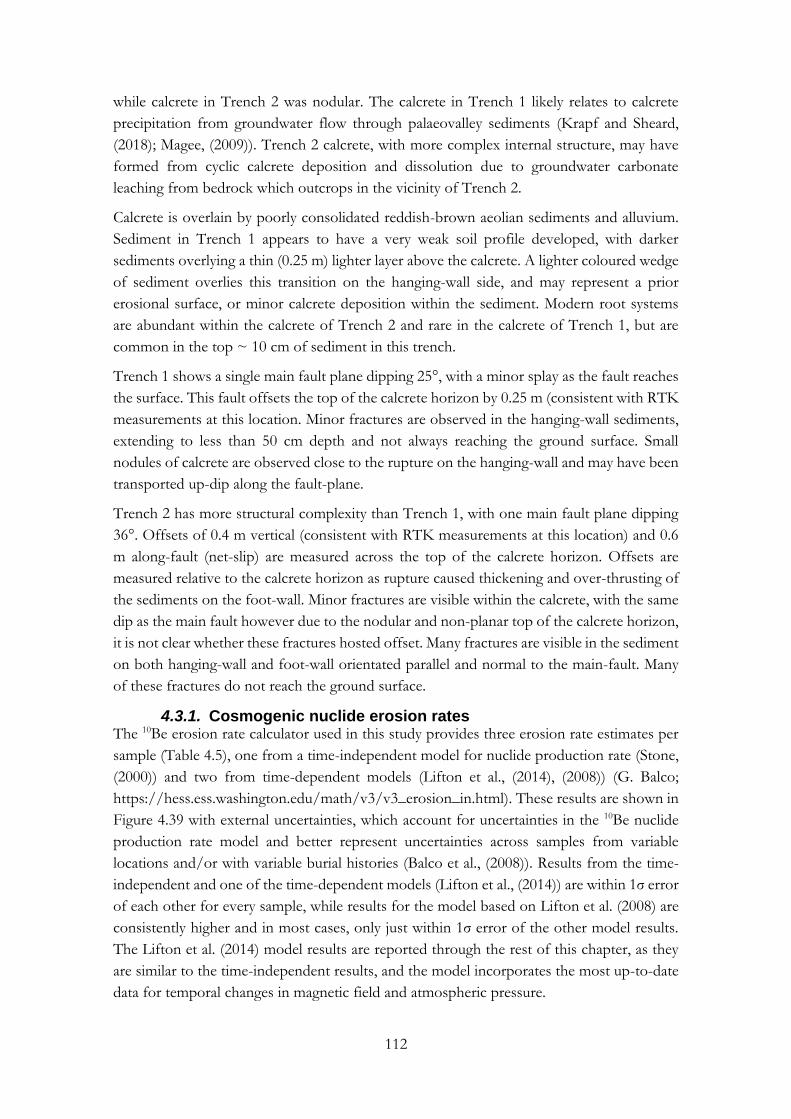
112
while calcrete in Trench 2 was nodular. The calcrete in Trench 1 likely relates to calcrete
precipitation from groundwater flow through palaeovalley sediments (Krapf and Sheard,
(2018); Magee, (2009)). Trench 2 calcrete, with more complex internal structure, may have
formed from cyclic calcrete deposition and dissolution due to groundwater carbonate
leaching from bedrock which outcrops in the vicinity of Trench 2.
Calcrete is overlain by poorly consolidated reddish-brown aeolian sediments and alluvium.
Sediment in Trench 1 appears to have a very weak soil profile developed, with darker
sediments overlying a thin (0.25 m) lighter layer above the calcrete. A lighter coloured wedge
of sediment overlies this transition on the hanging-wall side, and may represent a prior
erosional surface, or minor calcrete deposition within the sediment. Modern root systems
are abundant within the calcrete of Trench 2 and rare in the calcrete of Trench 1, but are
common in the top ~ 10 cm of sediment in this trench.
Trench 1 shows a single main fault plane dipping 25°, with a minor splay as the fault reaches
the surface. This fault offsets the top of the calcrete horizon by 0.25 m (consistent with RTK
measurements at this location. Minor fractures are observed in the hanging-wall sediments,
extending to less than 50 cm depth and not always reaching the ground surface. Small
nodules of calcrete are observed close to the rupture on the hanging-wall and may have been
transported up-dip along the fault-plane.
Trench 2 has more structural complexity than Trench 1, with one main fault plane dipping
36°. Offsets of 0.4 m vertical (consistent with RTK measurements at this location) and 0.6
m along-fault (net-slip) are measured across the top of the calcrete horizon. Offsets are
measured relative to the calcrete horizon as rupture caused thickening and over-thrusting of
the sediments on the foot-wall. Minor fractures are visible within the calcrete, with the same
dip as the main fault however due to the nodular and non-planar top of the calcrete horizon,
it is not clear whether these fractures hosted offset. Many fractures are visible in the sediment
on both hanging-wall and foot-wall orientated parallel and normal to the main-fault. Many
of these fractures do not reach the ground surface.
4.3.1. Cosmogenic nuclide erosion rates The 10Be erosion rate calculator used in this study provides three erosion rate estimates per
sample (Table 4.5), one from a time-independent model for nuclide production rate (Stone,
(2000)) and two from time-dependent models (Lifton et al., (2014), (2008)) (G. Balco;
https://hess.ess.washington.edu/math/v3/v3_erosion_in.html). These results are shown in
Figure 4.39 with external uncertainties, which account for uncertainties in the 10Be nuclide
production rate model and better represent uncertainties across samples from variable
locations and/or with variable burial histories (Balco et al., (2008)). Results from the time-
independent and one of the time-dependent models (Lifton et al., (2014)) are within 1σ error
of each other for every sample, while results for the model based on Lifton et al. (2008) are
consistently higher and in most cases, only just within 1σ error of the other model results.
The Lifton et al. (2014) model results are reported through the rest of this chapter, as they
are similar to the time-independent results, and the model incorporates the most up-to-date
data for temporal changes in magnetic field and atmospheric pressure.

113
Figure 4.38. Photos and trench logs for (a) Trench 1 and (b) Trench 2. Locations of trenches shown in Figure 4.2, Figure 4.27, and Figure 4.29.
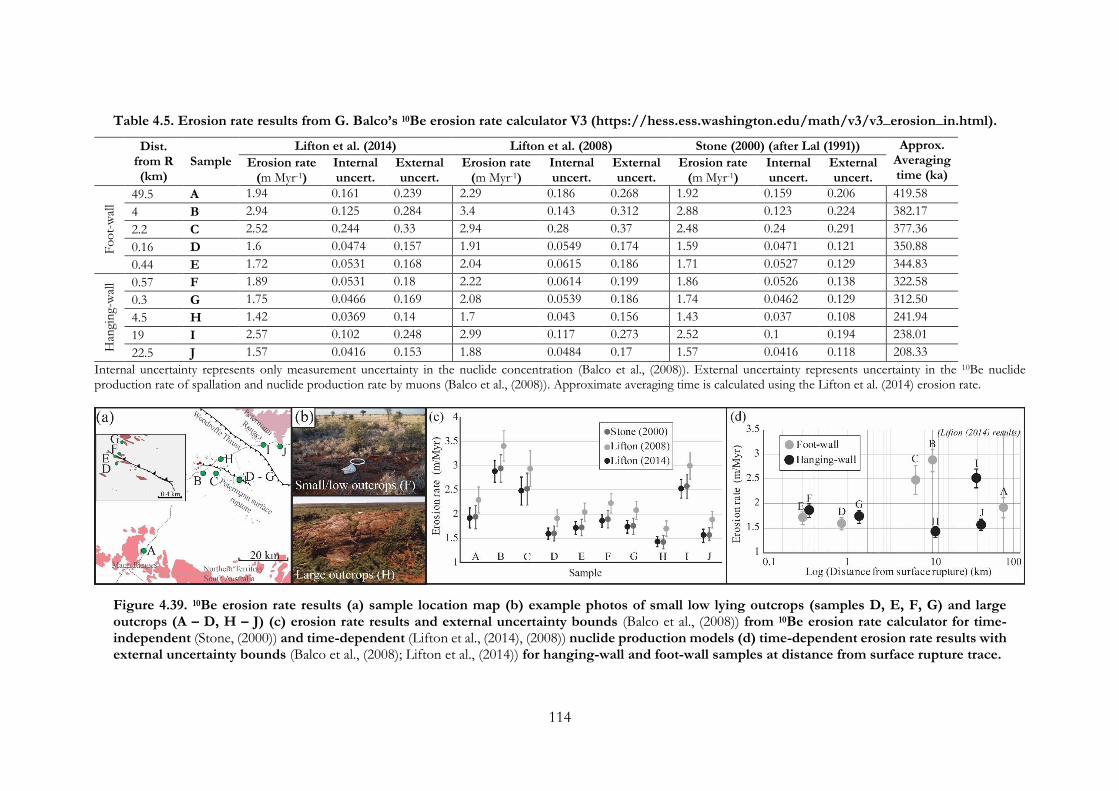
114
Table 4.5. Erosion rate results from G. Balco’s 10Be erosion rate calculator V3 (https://hess.ess.washington.edu/math/v3/v3_erosion_in.html).
Dist.
from R (km)
Sample
Lifton et al. (2014) Lifton et al. (2008) Stone (2000) (after Lal (1991)) Approx. Averaging time (ka)
Erosion rate (m Myr-1)
Internal uncert.
External uncert.
Erosion rate (m Myr-1)
Internal uncert.
External uncert.
Erosion rate (m Myr-1)
Internal uncert.
External uncert.
Fo
ot-
wal
l
49.5 A 1.94 0.161 0.239 2.29 0.186 0.268 1.92 0.159 0.206 419.58
4 B 2.94 0.125 0.284 3.4 0.143 0.312 2.88 0.123 0.224 382.17
2.2 C 2.52 0.244 0.33 2.94 0.28 0.37 2.48 0.24 0.291 377.36
0.16 D 1.6 0.0474 0.157 1.91 0.0549 0.174 1.59 0.0471 0.121 350.88
0.44 E 1.72 0.0531 0.168 2.04 0.0615 0.186 1.71 0.0527 0.129 344.83
Han
gin
g-w
all 0.57 F 1.89 0.0531 0.18 2.22 0.0614 0.199 1.86 0.0526 0.138 322.58
0.3 G 1.75 0.0466 0.169 2.08 0.0539 0.186 1.74 0.0462 0.129 312.50
4.5 H 1.42 0.0369 0.14 1.7 0.043 0.156 1.43 0.037 0.108 241.94
19 I 2.57 0.102 0.248 2.99 0.117 0.273 2.52 0.1 0.194 238.01
22.5 J 1.57 0.0416 0.153 1.88 0.0484 0.17 1.57 0.0416 0.118 208.33
Internal uncertainty represents only measurement uncertainty in the nuclide concentration (Balco et al., (2008)). External uncertainty represents uncertainty in the 10Be nuclide production rate of spallation and nuclide production rate by muons (Balco et al., (2008)). Approximate averaging time is calculated using the Lifton et al. (2014) erosion rate.
Figure 4.39. 10Be erosion rate results (a) sample location map (b) example photos of small low lying outcrops (samples D, E, F, G) and large outcrops (A – D, H – J) (c) erosion rate results and external uncertainty bounds (Balco et al., (2008)) from 10Be erosion rate calculator for time-independent (Stone, (2000)) and time-dependent (Lifton et al., (2014), (2008)) nuclide production models (d) time-dependent erosion rate results with external uncertainty bounds (Balco et al., (2008); Lifton et al., (2014)) for hanging-wall and foot-wall samples at distance from surface rupture trace.
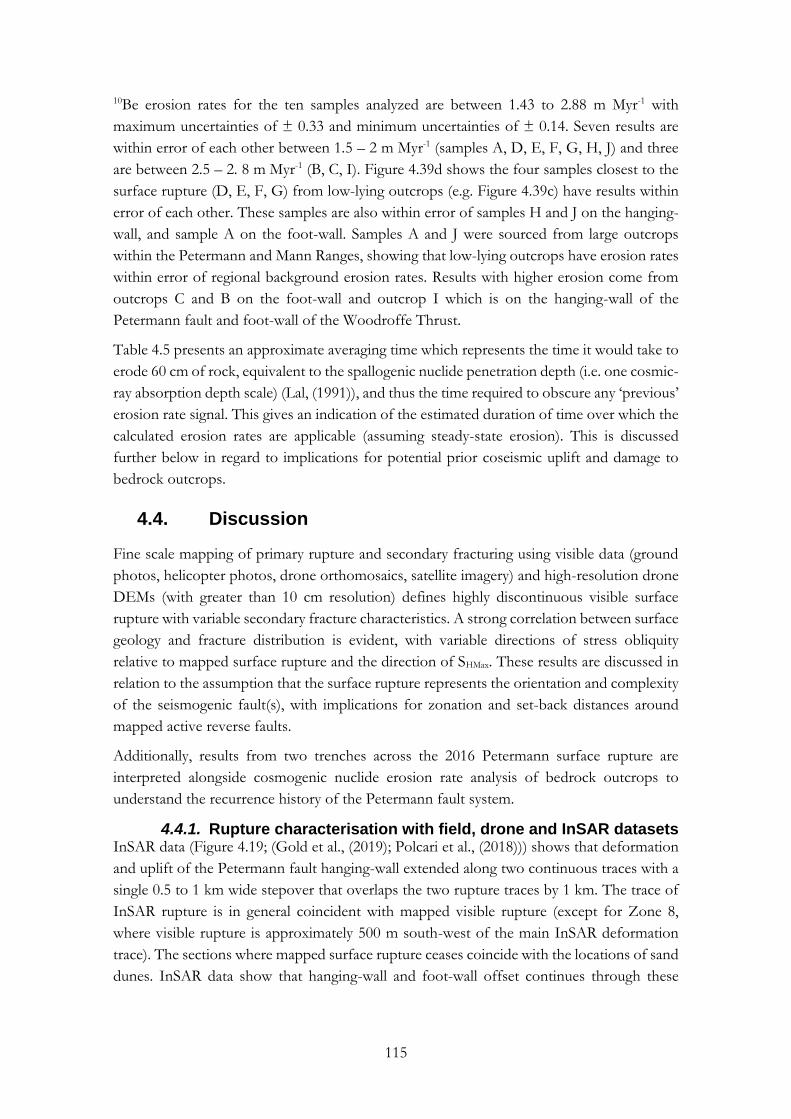
115
10Be erosion rates for the ten samples analyzed are between 1.43 to 2.88 m Myr-1 with
maximum uncertainties of ± 0.33 and minimum uncertainties of ± 0.14. Seven results are
within error of each other between 1.5 – 2 m Myr-1 (samples A, D, E, F, G, H, J) and three
are between 2.5 – 2. 8 m Myr-1 (B, C, I). Figure 4.39d shows the four samples closest to the
surface rupture (D, E, F, G) from low-lying outcrops (e.g. Figure 4.39c) have results within
error of each other. These samples are also within error of samples H and J on the hanging-
wall, and sample A on the foot-wall. Samples A and J were sourced from large outcrops
within the Petermann and Mann Ranges, showing that low-lying outcrops have erosion rates
within error of regional background erosion rates. Results with higher erosion come from
outcrops C and B on the foot-wall and outcrop I which is on the hanging-wall of the
Petermann fault and foot-wall of the Woodroffe Thrust.
Table 4.5 presents an approximate averaging time which represents the time it would take to
erode 60 cm of rock, equivalent to the spallogenic nuclide penetration depth (i.e. one cosmic-
ray absorption depth scale) (Lal, (1991)), and thus the time required to obscure any ‘previous’
erosion rate signal. This gives an indication of the estimated duration of time over which the
calculated erosion rates are applicable (assuming steady-state erosion). This is discussed
further below in regard to implications for potential prior coseismic uplift and damage to
bedrock outcrops.
4.4. Discussion
Fine scale mapping of primary rupture and secondary fracturing using visible data (ground
photos, helicopter photos, drone orthomosaics, satellite imagery) and high-resolution drone
DEMs (with greater than 10 cm resolution) defines highly discontinuous visible surface
rupture with variable secondary fracture characteristics. A strong correlation between surface
geology and fracture distribution is evident, with variable directions of stress obliquity
relative to mapped surface rupture and the direction of SHMax. These results are discussed in
relation to the assumption that the surface rupture represents the orientation and complexity
of the seismogenic fault(s), with implications for zonation and set-back distances around
mapped active reverse faults.
Additionally, results from two trenches across the 2016 Petermann surface rupture are
interpreted alongside cosmogenic nuclide erosion rate analysis of bedrock outcrops to
understand the recurrence history of the Petermann fault system.
4.4.1. Rupture characterisation with field, drone and InSAR datasets InSAR data (Figure 4.19; (Gold et al., (2019); Polcari et al., (2018))) shows that deformation
and uplift of the Petermann fault hanging-wall extended along two continuous traces with a
single 0.5 to 1 km wide stepover that overlaps the two rupture traces by 1 km. The trace of
InSAR rupture is in general coincident with mapped visible rupture (except for Zone 8,
where visible rupture is approximately 500 m south-west of the main InSAR deformation
trace). The sections where mapped surface rupture ceases coincide with the locations of sand
dunes. InSAR data show that hanging-wall and foot-wall offset continues through these

116
dunes (Gold et al., (2019)), suggesting that rupture was distributed through granular dune
material rather than reaching the surface as discrete offset.
The discontinuous visible discrete surface rupture mapped from field investigations, visual
data and drone DEMs includes ten gaps of greater than 0.4 km, and three gaps of greater
than 1 km, between surface rupture traces. In the absence of InSAR data showing that
rupture is linearly continuous (except at the step-over), these gaps in rupture may have been
classified as four separate faults consisting of Zones 1 to 2, 3 to 4, 5 to 10, and 11 based on
some classifications of surface rupture complexity (Biasi and Wesnousky, (2016); Quigley et
al., (2017)). The only section of rupture that can arguably mark the location of distinct faults
is the 1 km long overlapping step-over between Zones 5 and 6 which is evident in both
InSAR and visible surface rupture.
Multiple chapters of this thesis argue that the change in strike of surface rupture trace on
either side of this step-over, a decrease in vertical offsets measured after the step-over, the
distribution of coseismically displaced rock fragments, and the location of the centroid of
moment release derived by Hejrani and Tkalčić (2018) support an interpretation that this
step-over defines at least two faults ruptured during the Petermann earthquake. The
Petermann Fault West (Figure 4.19) strand cannot be easily modelled as a single planar fault
due to high curvature in the trace of the rupture as observed in InSAR and the strike
orientation of mapped discrete rupture. However, the lack of steps, gaps, or geometrical
complexity in this section suggests that this may be a single curved planar fault, with the
exception of Zone 5 which is not easily aligned with either Petermann Fault West or East
(Figure 4.19). Surface rupture in Zone 5 is subparallel to shear-foliations in mylonite outcrops
within 10 m of the surface rupture, slightly oblique (approximately 25 to 30°) to the general
trend of mylonite foliations across the region, suggesting orientation of surface rupture was
controlled by the dominant bedrock fabric in this location.
The combination of seismic, field and remote sensing data suggests that the Petermann
earthquake ruptured across at least two distinct faults. However, in the absence of InSAR, it
is feasible that the discontinuous nature of visible discrete surface rupture could have led to
the inference of greater faulting complexity. Sections of surface rupture not visible in the
field (but identifiable in drone DEMs) may also have gone unmapped. This has implications
when regarding historic surface rupturing events or surface ruptures for which InSAR and
high-resolution post-event DEM data are not available. Particularly for historic events with
discontinuous discrete surface ruptures in regions where surface geology is dominated by
granular materials (e.g. dunes). Livio et al. (2017) argue that this bias in field observations,
relative to remote-sensing data, can affect the accuracy of seismic hazard assessments (e.g.
PFDHAs), if inaccurate data are being used to characterise the distribution of primary and
secondary deformation.
Figure 4.40 plots data from the Petermann earthquake against the Livio et al. (2017)
comparisons of the area defined by InSAR fringes (on both hanging-wall and foot-wall) with
magnitude and depth, and Leonard (2014) and Leonard (2010) magnitude – length –
displacement scaling relationships for stable continental region (SCR) dip-slip earthquakes.
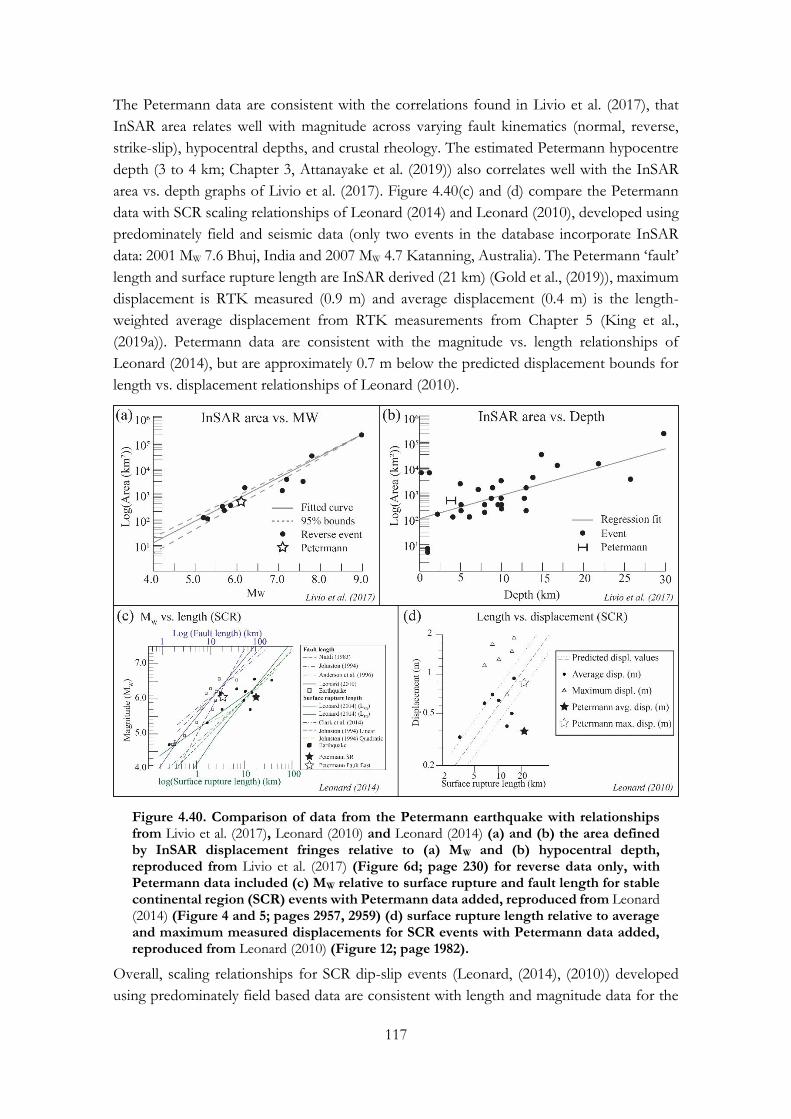
117
The Petermann data are consistent with the correlations found in Livio et al. (2017), that
InSAR area relates well with magnitude across varying fault kinematics (normal, reverse,
strike-slip), hypocentral depths, and crustal rheology. The estimated Petermann hypocentre
depth (3 to 4 km; Chapter 3, Attanayake et al. (2019)) also correlates well with the InSAR
area vs. depth graphs of Livio et al. (2017). Figure 4.40(c) and (d) compare the Petermann
data with SCR scaling relationships of Leonard (2014) and Leonard (2010), developed using
predominately field and seismic data (only two events in the database incorporate InSAR
data: 2001 MW 7.6 Bhuj, India and 2007 MW 4.7 Katanning, Australia). The Petermann ‘fault’
length and surface rupture length are InSAR derived (21 km) (Gold et al., (2019)), maximum
displacement is RTK measured (0.9 m) and average displacement (0.4 m) is the length-
weighted average displacement from RTK measurements from Chapter 5 (King et al.,
(2019a)). Petermann data are consistent with the magnitude vs. length relationships of
Leonard (2014), but are approximately 0.7 m below the predicted displacement bounds for
length vs. displacement relationships of Leonard (2010).
Figure 4.40. Comparison of data from the Petermann earthquake with relationships from Livio et al. (2017), Leonard (2010) and Leonard (2014) (a) and (b) the area defined by InSAR displacement fringes relative to (a) MW and (b) hypocentral depth, reproduced from Livio et al. (2017) (Figure 6d; page 230) for reverse data only, with Petermann data included (c) MW relative to surface rupture and fault length for stable continental region (SCR) events with Petermann data added, reproduced from Leonard (2014) (Figure 4 and 5; pages 2957, 2959) (d) surface rupture length relative to average and maximum measured displacements for SCR events with Petermann data added, reproduced from Leonard (2010) (Figure 12; page 1982).
Overall, scaling relationships for SCR dip-slip events (Leonard, (2014), (2010)) developed
using predominately field based data are consistent with length and magnitude data for the
118
Petermann event, though maximum and average displacements are below predicted values.
Gold et al. (2019) identify that for the Petermann earthquake, field measured offsets at the
surface rupture underestimate total displacement, with distributed deformation identified in
InSAR and Worldview pre- and post-event differenced DEMs. As argued by Livio et al.
(2017), integrating InSAR data with future scaling relationships may improve displacement
estimates in events such as the Petermann where field measurements at the surface rupture
are not necessarily representative of the full deformation field.
4.4.2. Distribution of secondary deformation features relative to surface geology
All mapped zones show a strong asymmetry across rupture in the number of mapped
secondary fractures and distance of fractures from the primary rupture on the hanging-wall
relative to the foot-wall, consistent with analyses of global surface rupturing reverse
earthquakes (Boncio et al., (2018)). The length and distance of mapped secondary fractures
from primary surface rupture varies also vary along-rupture, between the eleven mapped
zones.
Zone 1 and 11 at the far north-west and south-east of rupture have significantly fewer
mapped fractures than other zones. This likely relates to lower and more distributed
displacement at the ends of rupture, as recorded in profiles through InSAR data and
differenced DEMs of pre- and post- event Worldview imagery (Gold et al., (2019)).
The only surface rupture mapped through dune deposits occurs in Zone 2. Surface rupture
was not visible in the field in this location but was observable as a warping/folding of the
ground surface in drone derived DEMs (Figure 4.10). Fractures in this location occur
predominately on the hanging-wall (96.4%) and 51.6% of fractures occur at distances of
greater than 50 m from the surface rupture, compared to 0% to 18% across the other zones.
Observation of fracture distribution in Zone 2 are in line with the interpretation that rupture
could not effectively propagate through dune systems (as interpreted by the gaps in mapped
surface rupture) and was instead distributed through the granular material. It is unclear why
this distributed deformation reached the surface in Zone 2, but not in other locations with
dunes. Potential explanations include the amount of displacement experienced at this
location, a difference in the composition of the dune relative to others in the area which was
not observed during field work, or shallower bedrock beneath this dune relative to others in
the area.
Zones 4, 5 and 6, where surface rupture occurs close to (or abuts against; see Chapter 2 and
Appendix A) bedrock outcrops have consistently longer fractures and shorter distances from
the surface rupture relative to zones without near-rupture bedrock. As discussed in Chapter
2 and Chapter 3, bedrock close to the surface rupture consists of mylonite with varying levels
of foliation subparallel to the direction of surface rupture. These pre-existing planar
structures through which rupture propagated likely imparted a primary control on the
expression of deformation at the surface, with displacement accommodated on planar
structures close to the rupture plane rather than being distributed through granular materials.
119
Zones 3, 7, 8 and 9 occurred in intra-dune regions with no nearby bedrock outcrops (within
0.5 to 1 km). The length of fractures in these locations are consistently less than those in
bedrock dominated zones, and fractures are more distributed away from the surface rupture
(on the hanging-wall) than in bedrock locations (though less than through dune deposits of
Zone 2). As shown by borehole data 20 km to the west of the Petermann rupture (Figure
4.33), depth to bedrock can change dramatically from 2 m to greater than 65 m in less than
1.2 km distance. It is feasible that these locations are underlain by sediments of tens to
hundreds of meters depth, or by near-surface bedrock that does not outcrop above aeolian
and alluvium deposits. Without constraints on the depth to bedrock, it is hard to compare
these data to those of Zones 4, 5, and 6. However, assuming there was no pre-existing
rupture through sediments (as posited below based on trench and erosion rate analysis), these
data are consistent with observations from numerical and sand-box modelling which shows
deformation from reverse fault rupture is less defined in sand-dominated surface sediments
in the absence of prior shear-bands (Oettle et al., (2015); Oettle and Bray, (2013)). These
models are also consistent with observations for bedrock-dominated zones, with bedrock
foliation planes behaving as a pre-existing rupture.
Evidence that surface geology imparts a primary control on the length and distance of
secondary fractures from primary rupture has implications for hazard planning and
development of set-back distances from mapped active faults. Analyses of distributed
deformation such as Boncio et al. (2018) are critically important for developing guidelines
for infrastructure risk around active faults. However, future iterations may benefit from an
understanding of how surface geology (and various other mechanics) can change the width
of deformation zone for reverse earthquake surface ruptures.
4.4.3. Rupture kinematics and relation to direction of SHMax The orientation of maximum compressive stress in the Petermann region is modelled based
on focal mechanisms and bore-hole breakouts(Rajabi et al., (2017b)) located more than 100
km away from the surface rupture to the north-east, east and south-west (Figure 4.35). The
orientation of SHMax relative to the orientation of primary rupture and secondary fractures
suggests an oblique-sinistral reverse mechanism, as also indicated by published focal
mechanisms. However, analysis of fracture orientations in Zones 4, 9 and 10 show variable
σ1 orientations between 045° and 090°. This deviation in orientation may relate to local
rotation of offset blocks where rupture propagates through structurally complex
intersections (Philip and Meghraoui, (1983); Tchalenko and Ambraseys, (1970)). For
instance, in Zone 4 rupture steps over between strands 66 m apart, with large extensional
fissures and fractures between. These two hanging-wall blocks moving in close proximity,
combined with the obliquity of movement, may have locally rotated the orientation of
fractures and hence the direction of σ1. Analysis of fracture orientations in this region (090°)
deviate by 24° from modelled SHMax (066°).
Alternatively, observations from numerical and sand-box models suggest that the amount of
bedrock displacement when propagating through surface sediments places a primary control
on whether surface features preserve fault kinematics (Oettle and Bray, (2013)). Analysis of
fracture orientations for Zone 10 where bedrock occurs at the surface shows a σ1 orientation

120
(076°) close to modelled SHMax (066°). In contrast, in Zone 9 where no bedrock outcrops, σ1
orientation is 21° (090°) off SHMax (066°) and in Zone 4 where only minor bedrock outcrops
are observed and where potential block-rotation occurred, σ1 orientation is 24° off SHMax.
This data suggests that SHMax is likely orientated between 066° and 076° in the Petermann
region.
4.4.4. Recurrence history of the Petermann faults Vertical offsets measured across calcrete horizons exposed in both trenches were the same
as RTK measurements across rupture at the surface, indicating aeolian / alluvium sediment
and calcrete were only faulted in the 2016 Petermann earthquake. The land surface in the
vicinity of the Petermann ruptures slopes gently south-west, with ephemeral drainages
running into a set of playas between the Petermann and Mann Ranges, 7 to 20 km south of
the Petermann rupture. There is no evidence in the topography or dune systems to suggest
downcutting drainage or migrating knickpoints across the hanging-wall of the modern
rupture, which also supports a lack of prior rupture within the time-frame that aeolian
sediments and dunes have covered this landscape.
In the absence of trench evidence for prior rupture, other avenues must be explored to
constrain the recurrence history of the Petermann faults. Given the observations described
above, the age of aeolian sediment deposition provides a minimum age constraint on
potential prior rupture along the Petermann fault. While no dating has been published on
the dune systems between the Petermann and Mann Ranges, optically stimulated
luminescence (OSL) and thermoluminescence (TL) dating have been conducted on nearby
dune-fields which may be applicable to the Petermann area. Lake Amadeus is a large NW –
SE trending playa over 120 km long located 130 km north-east of the Petermann rupture,
on the other side of the Petermann Ranges. Dunes bordering the lake are classified as older
gypsiferous dunes, or younger quartz dunes, which sometimes blanket the gypsiferous dunes
(Chen et al., (1993)). The gypsiferous dunes are described as forming from lake-proximal
precipitation and deflation of gypsum within quartz dunes during wetter times. In contrast,
the quartz dunes are associated with arid conditions. TL dates of gypsiferous dunes show
formation between 44 – 54 kya, while quartz dune deposition is suggested by the authors
during the last glacial maximum (LGM) (Chen et al., (1993)). Hesse et al. (2004) describe
dating of linear dune fields around Lake Lewis by Chen et al. (1995) and English et al. (2001),
400 km north-east of the Petermann rupture and 250 km north-east of Lake Amadeus. A
single OSL date describes dune deposition at over 95 ka, and TL dates show dune building
around the lake-shore at 21 and 23 ka (associated with the LGM) (Chen et al., (1995); English
et al., (2001); Hesse et al., (2004)). In the Musgrave Block south of the Petermann rupture,
palaeovalleys are overlain by sand dunes of the Great Victorian Desert (Magee, (2009)). Two
OSL dates from dunes approximately 500 km south of the Petermann rupture within the
Great Victorian Desert indicate deposition at approximately 200 ka (Sheard et al., (2006)).
Hesse et al. (2004) also describe dust records from drill-cores in the Indian Ocean, which
show peaks in aeolian sediment between approximately 12 – 25 ka, moving offshore of
Australia during the LGM and a larger peak in dust deposition between approximately 120

121
– 180 ka (Hesse et al., (2004); Hesse and McTainsh, (2003)). These describe periods of aridity
and heightened aeolian transport and sedimentation through central Australia.
These dates provide potential constraints on the formation of dunes in the Petermann region,
during either the LGM or an earlier arid period between approximately 100 and 200 ka.
Therefore, any prior ruptures along the Petermann faults must pre-date the LGM at
approximately 20 ka, and may have formed between 100 and 200 ka. These dates of aeolian
sedimentation place a minimum age constraint on past ruptures.
Cosmogenic nuclide erosion rates potentially provide a further constraint on the recurrence
history of the Petermann faults. 10Be erosion rate analysis was conducted on samples from
low-lying bedrock outcrops within 500 m of the Petermann surface rupture, the tops of 20
– 50 m high bedrock outcrops within 5 km of the surface rupture, and the tops of bedrock
outcrops within the Petermann and Mann Ranges (20 and 50 km from the surface rupture
respectively). These samples were selected to test a hypothesis that (i) bedrock outcrops close
to the surface rupture are likely to experience strong ground motion damage that would
exacerbate erodibility (e.g. shattering and displaced rock fragments; Figure 4.1) and increase
apparent erosion rate (ii) outcrops which experience coseismic rockfalls may preserve higher
apparent erosion rates (iii) hanging-wall outcrops may preserve higher apparent erosion rates
due to base-level lowering of uplifted areas. Bedrock erosion rates from the Petermann and
Mann Ranges outcrops were collected to provide background erosion rates to compare to
potentially coseismically affected erosion rates closer to the surface rupture.
Erosion rate results for low-lying hanging-wall and foot-wall outcrops within 500 m of the
surface rupture are consistent with each other (within 1σ error), and with bedrock erosion
rates from the Petermann and Mann Ranges samples. Foot-wall outcrops between 2 – 5 km
from the rupture have the highest measured erosion rates, with the lowest measured erosion
rate coming from a hanging-wall outcrop 5 km from the surface rupture, on which modern
coseismic rockfall damage was observed. Results record erosion rates of 1.5 to 3 m Myr-1
across the region, with no evidence for tectonically-induced erosional perturbations as
proxied by lower 10Be concentrations (e.g. Quigley et al. (2007)). Analysis of 26Al was not
conducted for this study, which precludes the ability to constrain and complexity in burial
and exhumation history of low-lying outcrops (Gosse and Phillips, (2001); Lal, (1991)).
However, the observation of slow 10Be erosion rates from both low-lying outcrops and
summits is consistent with simple continuous exposure of bedrock.
The similarity between erosion rates from the Petermann and Mann Ranges with those close
to the surface rupture, and the lack of higher erosion rates preserved by hanging-wall
outcrops relative to foot-wall, suggests that outcrops preserve no evidence of enhanced
erosion that might be attributable to prior strong ground motions damage (shattering or
flipped chips) or coseismic uplift and differential incision across the hanging-wall. These
erosion rates are assumed to be applicable over the averaging timescale presented in Table
4.5 (200 to 400 ka). This supports the interpretation presented above based on deposition of
aeolian sediments, that prior rupture could not have occurred since 200 ka, potentially
extending back to 400 ka.

122
Prior to deposition of overlying sediments and before the averaging period of cosmogenic
nuclide erosion rates, a prior event could have formed a bedrock scarp and been eroded
away, with no evidence preserved in the landscape or erosion rates. In this case, 10Be erosion
rates can provide a minimum estimate of pre-existing rupture prior to sediment deposition.
In this case, it is assumed that a prior event would have similar dimensions to the modern
scarp (21 km long, maximum vertical offset 0.9 m, average vertical offset 0.4 m). Minimum
(1.42 m Myr-1) and maximum (2.94 m Myr-1) measured erosion rates suggest total erosion of
an 0.4 m high scarp could be achieved within 130 to 280 kyrs, and an 0.9 m scarp within 300
to 630 kyrs. This may extend the minimum age of prior rupture to more than 500 ka, and
potentially greater than 1 Ma.
Trenches, aeolian sediment deposition, and cosmogenic nuclide erosion rates show evidence
of absence of prior rupture along the Petermann faults within approximately 0.5 to 1 Myrs.
While no constraints can be placed on potential ruptures earlier than this, the simplest
interpretation of data (e.g. Occam’s razor) suggests that the 2016 earthquake was the first
such event on the Petermann faults. While the foliation planes that the 2016 rupture
propagated through existed prior to rupture (formed in the Precambrian Petermann
Orogeny), available evidence suggests that the ‘Petermann faults’ did not exist prior to 2016.
Structural geology would now require that these structures be termed faults, having hosted
tectonic displacements across planar structures. However, the lack of prior events brings up
the question of whether these faults can be expected to host future earthquakes, and if not,
whether they should be mapped as ‘active faults’ for hazard assessment purposes. This
rupture could also be considered to have occurred on an incredibly immature fault. However,
as discussed above, pre-existing bedrock foliations appear to have imparted primary controls
on the distribution of fractures. Therefore at least some sections of this rupture were
controlled by pre-existing bedrock structures acting as a pre-existing weakness. This rupture
may not be suitable for analysis in models for immature fault systems, which tend to assume
a homogenous medium.
4.5. Conclusions
This chapter presents methods and results of field and remote-sensing mapping of the 2016
MW 6.1 Petermann earthquake surface rupture and explores evidence for a lack of prior
rupture along the Petermann fault. Visible surface rupture of the Petermann earthquake is
highly discontinuous, with strong evidence suggesting that surface geology and the locations
of dunes imparted primary controls on the ability for rupture to propagate to the surface,
and the density of secondary fracturing at the surface. In the absence of InSAR data, the
steps and gaps in visible surface rupture may have led to an interpretation of complex
seismogenic fault system. Available data suggest that the Petermann earthquake ruptured
across two faults, here named Petermann Fault East and Petermann Fault west.
Evidence from trenching and cosmogenic nuclide erosion rate analysis show evidence of
absence for prior rupture along the Petermann fault. This implies that the Petermann
earthquake ruptured these fault planes for the first time and that they are incredibly immature
faults. However, given the evidence to suggest pre-existing bedrock foliation planes imparted

123
a primary control on how deformation was accommodated, the definition of ‘immature’ and
‘active fault’ are complicated in the case of the Petermann fault system. The observation of
no prior rupture on this fault adds support to interpretations that some cratonic earthquakes
within Australia may not behave in a recurrent fashion, and that intraplate and stable
continental region faults have variable behaviour across different crustal settings (Clark et al.,
(2012), (2011b); Clark and Allen, (2018); King et al., (2019a))). Overall the data presented in
this chapter contribute to an improved understanding of how reverse faults interact with
near-surface geology, and the behaviour and recurrence of intraplate stable continental
region faults.

124
CHAPTER 5. SURFACE-RUPTURING HISTORICAL
EARTHQUAKES IN AUSTRALIA AND THEIR
ENVIRONMENTAL EFFECTS: NEW INSIGHTS
FROM RE-ANALYSES OF OBSERVATIONAL DATA
This chapter is a reproduction of this paper:
King, T.R., Quigley, M.C., Clark, D. (2019). Surface-rupturing historical earthquakes in
Australia and their environmental effects: new insights from re-analyses of observational
data. Geosciences 9, 1–34. https://doi.org/10.3390/geosciences9100408
The paper has been reformatted in the following ways:
• Changes to heading, figure and table numbers;
• Minor changes to figure and table captions to better summarise the content within
the Lists of Tables and Fables (pages xiii and xiv respectively);
• Reference list is incorporated into the overall thesis reference list;
• The addition of Table 5.2 and Table 5.4 to summarise references previously included
in Table 5.1, and Table 5.5 to Table 5.12. This is due to a change between numbered
in-text referencing style from the original publication, to the Author, Year style used
in this thesis.
All other content in this chapter is reproduced as accepted by the journal.
Abstract
We digitize surface rupture maps and compile observational data from 67 publications on
ten of eleven historical, surface-rupturing earthquakes in Australia to analyze the prevailing
characteristics of surface ruptures and other environmental effects in this crystalline
basement-dominated intraplate environment. The studied earthquakes occurred between
1968 and 2018, and range in moment magnitude (Mw) from 4.7 to 6.6. All earthquakes
involved co-seismic reverse faulting (with varying amounts of strike-slip) on single or
multiple (1 to 6) discrete faults of ≥ 1 km length that are distinguished by orientation and
kinematic criteria. Nine of ten earthquakes have surface-rupturing fault orientations that align
with prevailing linear anomalies in geophysical (gravity and magnetic) data and bedrock
structure (foliations and/or quartz veins and/or intrusive boundaries and/or pre-existing
faults), indicating strong control of inherited crustal structure on contemporary faulting.
Rupture kinematics are consistent with horizontal shortening driven by regional trajectories
of horizontal compressive stress. The lack of precision in seismological data prohibits
assessment of whether surface ruptures project to hypocentral locations via contiguous,
125
planar principal slip zones or whether rupture segmentation occurs between seismogenic
depths and the surface. Rupture centroids of 1 to 4 km depth indicate predominantly shallow
seismic moment release. No studied earthquakes have unambiguous geological evidence for
preceding surface-rupturing earthquakes on the same faults and five earthquakes contain
evidence of absence of preceding ruptures since the late Pleistocene, collectively highlighting
the challenge of using mapped active faults to predict future seismic hazard. Estimated
maximum fault slip rates are 0.2 – 9.1 m Myr-1 with at least one order of uncertainty. New
estimates for rupture length, fault dip, and coseismic net slip can be used to improve future
iterations of earthquake magnitude – source size – displacement scaling equations. Observed
environmental effects include primary surface rupture, and secondary fracture/cracks,
fissures, rock falls, ground-water anomalies, vegetation damage, sand-blows / liquefaction,
displaced rock fragments, and holes from collapsible soil failure, at maximum estimated
epicentral distances ranging from 0 to ~ 250 km. ESI-07 intensity-scale estimates range by
± 3 classes in each earthquake, depending on the effect considered. Comparing Mw-ESI
relationships across geologically diverse environments is a fruitful avenue for future research.
5.1. Introduction
In the 50 years between 1968 and 2018 Australia experienced eleven known surface rupturing
earthquakes (Table 5.1, Figure 5.1). Studies of Australian surface rupturing earthquakes have
contributed to improvements in our collective understanding of intraplate earthquake
behaviour, including rupture recurrence, in stable continental regions (SCR) (Calais et al.,
(2016); Clark et al., (2012); Crone et al., (2003), (1997); Quigley et al., (2010)) and empirically-
derived scaling relationships for reverse earthquakes (Biasi and Wesnousky, (2016); Clark et
al., (2014); Wells and Coppersmith, (1994); Wesnousky, (2008)).
This paper reviews available published literature on historic surface ruptures (Table 5.1 and
Table 5.3) and collates geological data (Table 5.5 and Table 5.6, Figure 5.1 and Figure 5.2),
seismological data and analyses (Table 5.7), surface rupture measurements (Table 5.8),
environmental damage (Table 5.9), and paleoseismic data (Appendix A) (Figure 5.3, Figure
5.4, Figure 5.5, Figure 5.6, Figure 5.7, Figure 5.8, Figure 5.9, and Figure 5.10). We re-evaluate
and reconsider rupture and fault characteristics in light of new data (e.g., geophysical and
geological) using modern analysis techniques (e.g., environmental seismic intensity scale
(ESI-07) (Michetti et al., (2007))) and new or updated concepts in earthquake science since
the time of publication (e.g., paleoseismology, SCR earthquake recurrence).
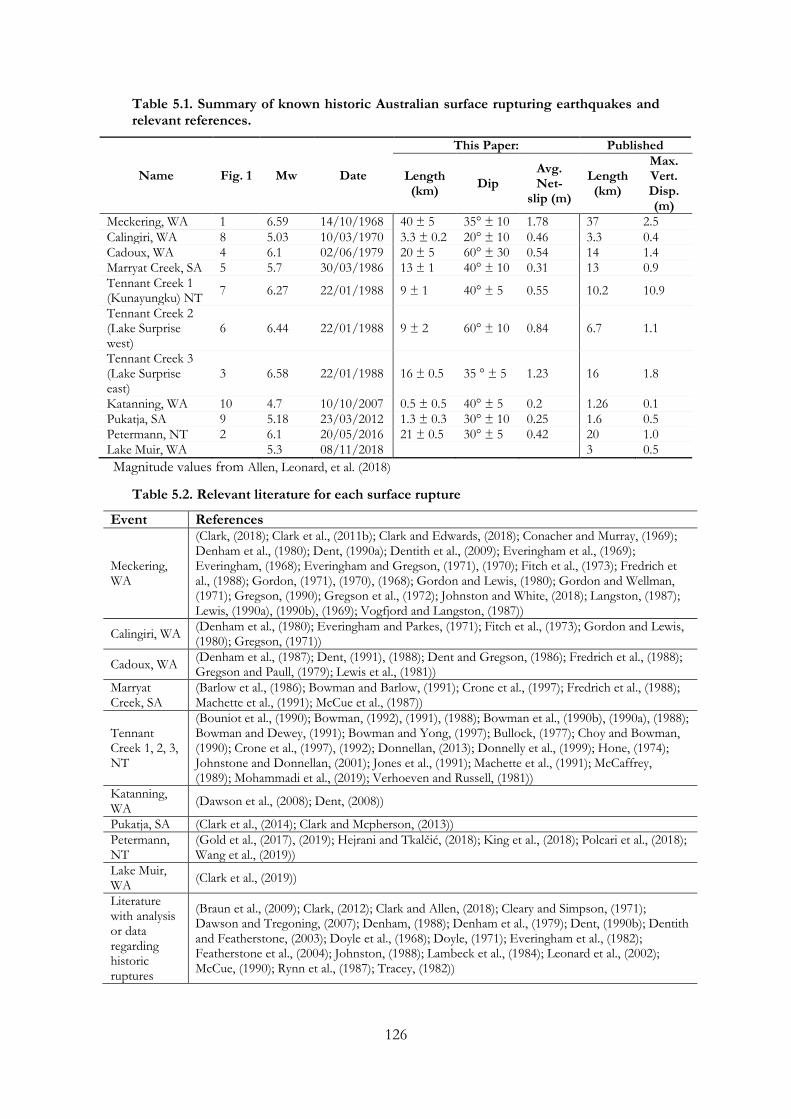
126
Table 5.1. Summary of known historic Australian surface rupturing earthquakes and relevant references.
Name Fig. 1 Mw Date
This Paper: Published
Length (km)
Dip Avg. Net-
slip (m)
Length (km)
Max. Vert. Disp. (m)
Meckering, WA 1 6.59 14/10/1968 40 ± 5 35° ± 10 1.78 37 2.5
Calingiri, WA 8 5.03 10/03/1970 3.3 ± 0.2 20° ± 10 0.46 3.3 0.4 Cadoux, WA 4 6.1 02/06/1979 20 ± 5 60° ± 30 0.54 14 1.4
Marryat Creek, SA 5 5.7 30/03/1986 13 ± 1 40° ± 10 0.31 13 0.9
Tennant Creek 1 (Kunayungku) NT
7 6.27 22/01/1988 9 ± 1 40° ± 5 0.55 10.2 10.9
Tennant Creek 2 (Lake Surprise west)
6 6.44 22/01/1988 9 ± 2 60° ± 10 0.84 6.7 1.1
Tennant Creek 3 (Lake Surprise east)
3 6.58 22/01/1988 16 ± 0.5 35 ° ± 5 1.23 16 1.8
Katanning, WA 10 4.7 10/10/2007 0.5 ± 0.5 40° ± 5 0.2 1.26 0.1
Pukatja, SA 9 5.18 23/03/2012 1.3 ± 0.3 30° ± 10 0.25 1.6 0.5 Petermann, NT 2 6.1 20/05/2016 21 ± 0.5 30° ± 5 0.42 20 1.0
Lake Muir, WA 5.3 08/11/2018 3 0.5
Magnitude values from Allen, Leonard, et al. (2018)
Table 5.2. Relevant literature for each surface rupture
Event References
Meckering, WA
(Clark, (2018); Clark et al., (2011b); Clark and Edwards, (2018); Conacher and Murray, (1969); Denham et al., (1980); Dent, (1990a); Dentith et al., (2009); Everingham et al., (1969); Everingham, (1968); Everingham and Gregson, (1971), (1970); Fitch et al., (1973); Fredrich et al., (1988); Gordon, (1971), (1970), (1968); Gordon and Lewis, (1980); Gordon and Wellman, (1971); Gregson, (1990); Gregson et al., (1972); Johnston and White, (2018); Langston, (1987); Lewis, (1990a), (1990b), (1969); Vogfjord and Langston, (1987))
Calingiri, WA (Denham et al., (1980); Everingham and Parkes, (1971); Fitch et al., (1973); Gordon and Lewis, (1980); Gregson, (1971))
Cadoux, WA (Denham et al., (1987); Dent, (1991), (1988); Dent and Gregson, (1986); Fredrich et al., (1988); Gregson and Paull, (1979); Lewis et al., (1981))
Marryat Creek, SA
(Barlow et al., (1986); Bowman and Barlow, (1991); Crone et al., (1997); Fredrich et al., (1988); Machette et al., (1991); McCue et al., (1987))
Tennant Creek 1, 2, 3, NT
(Bouniot et al., (1990); Bowman, (1992), (1991), (1988); Bowman et al., (1990b), (1990a), (1988); Bowman and Dewey, (1991); Bowman and Yong, (1997); Bullock, (1977); Choy and Bowman, (1990); Crone et al., (1997), (1992); Donnellan, (2013); Donnelly et al., (1999); Hone, (1974); Johnstone and Donnellan, (2001); Jones et al., (1991); Machette et al., (1991); McCaffrey, (1989); Mohammadi et al., (2019); Verhoeven and Russell, (1981))
Katanning, WA
(Dawson et al., (2008); Dent, (2008))
Pukatja, SA (Clark et al., (2014); Clark and Mcpherson, (2013))
Petermann, NT
(Gold et al., (2017), (2019); Hejrani and Tkalčić, (2018); King et al., (2018); Polcari et al., (2018); Wang et al., (2019))
Lake Muir, WA
(Clark et al., (2019))
Literature with analysis or data regarding historic ruptures
(Braun et al., (2009); Clark, (2012); Clark and Allen, (2018); Cleary and Simpson, (1971); Dawson and Tregoning, (2007); Denham, (1988); Denham et al., (1979); Dent, (1990b); Dentith and Featherstone, (2003); Doyle et al., (1968); Doyle, (1971); Everingham et al., (1982); Featherstone et al., (2004); Johnston, (1988); Lambeck et al., (1984); Leonard et al., (2002); McCue, (1990); Rynn et al., (1987); Tracey, (1982))

127
Figure 5.1. Map of Australia showing locations of historic surface rupturing events, continental scale crustal divisions (Leonard et al., (2014)), onshore historic seismology >4.0 (1840–2017) (Allen et al., (2018c)), simplified crustal stress trajectory map (Rajabi et al., (2017b)), GA neotectonic features database (Clark, (2012)), recognized seismic zones (Hillis et al., (2008); Leonard, (2008)) and specific crustal provinces relevant for surface rupture events (Table 3) (Raymond et al., (2018)). Small maps show individual surface ruptures at the same scale and ordered by rupture length (excluding 2018 Lake Muir).
Australia is regarded as a stable continental region (Johnston et al., (1994)) surrounded by
passive margins with an intraplate stress field controlled by plate boundary forces (Rajabi et
al., (2017a), (2017b)) (Figure 5.1). This stress field has been extant throughout much of
Australia since the late Miocene, broadly concurrent with a rearrangement of tectonic
boundaries in India, New Zealand, New Guinea, and Timor (Hillis et al., (2008)). More than
360 potentially neotectonic features (those showing displacements associated with, or since
initiation of, the current stress-field conditions) (Clark, (2012); Clark et al., (2012)) have been
recognized in the landscape through field mapping, subsurface geophysical imaging, digital
elevation modelling, and palaeoseismic investigation (Clark, (2012), (2010a); Clark et al.,
(2012), (2011a), (2011b), (2008); Crone et al., (2003); Quigley et al., (2006), (2010), (2007a),
(2007b); Thom, (1971); Williams, (1978)) (Figure 5.1).
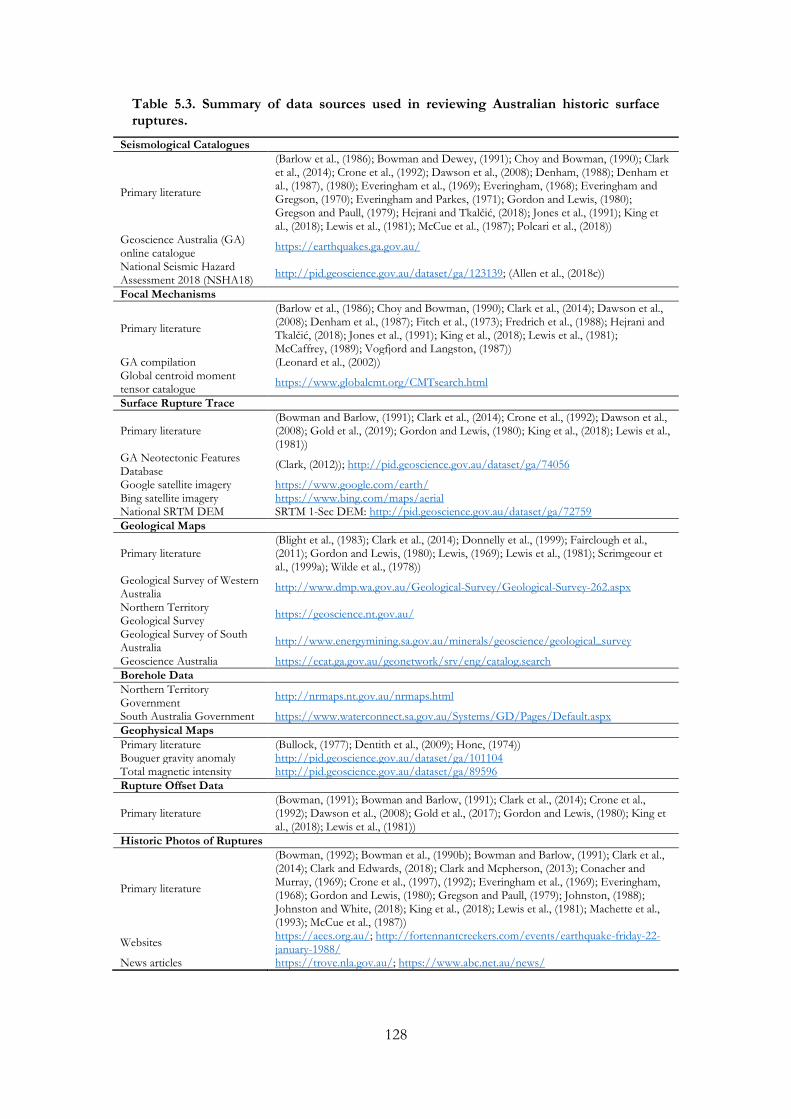
128
Table 5.3. Summary of data sources used in reviewing Australian historic surface ruptures.
Seismological Catalogues
Primary literature
(Barlow et al., (1986); Bowman and Dewey, (1991); Choy and Bowman, (1990); Clark et al., (2014); Crone et al., (1992); Dawson et al., (2008); Denham, (1988); Denham et al., (1987), (1980); Everingham et al., (1969); Everingham, (1968); Everingham and Gregson, (1970); Everingham and Parkes, (1971); Gordon and Lewis, (1980); Gregson and Paull, (1979); Hejrani and Tkalčić, (2018); Jones et al., (1991); King et al., (2018); Lewis et al., (1981); McCue et al., (1987); Polcari et al., (2018))
Geoscience Australia (GA) online catalogue
https://earthquakes.ga.gov.au/
National Seismic Hazard Assessment 2018 (NSHA18)
http://pid.geoscience.gov.au/dataset/ga/123139; (Allen et al., (2018c))
Focal Mechanisms
Primary literature
(Barlow et al., (1986); Choy and Bowman, (1990); Clark et al., (2014); Dawson et al., (2008); Denham et al., (1987); Fitch et al., (1973); Fredrich et al., (1988); Hejrani and Tkalčić, (2018); Jones et al., (1991); King et al., (2018); Lewis et al., (1981); McCaffrey, (1989); Vogfjord and Langston, (1987))
GA compilation (Leonard et al., (2002)) Global centroid moment tensor catalogue
https://www.globalcmt.org/CMTsearch.html
Surface Rupture Trace
Primary literature (Bowman and Barlow, (1991); Clark et al., (2014); Crone et al., (1992); Dawson et al., (2008); Gold et al., (2019); Gordon and Lewis, (1980); King et al., (2018); Lewis et al., (1981))
GA Neotectonic Features Database
(Clark, (2012)); http://pid.geoscience.gov.au/dataset/ga/74056
Google satellite imagery https://www.google.com/earth/ Bing satellite imagery https://www.bing.com/maps/aerial National SRTM DEM SRTM 1-Sec DEM: http://pid.geoscience.gov.au/dataset/ga/72759
Geological Maps
Primary literature (Blight et al., (1983); Clark et al., (2014); Donnelly et al., (1999); Fairclough et al., (2011); Gordon and Lewis, (1980); Lewis, (1969); Lewis et al., (1981); Scrimgeour et al., (1999a); Wilde et al., (1978))
Geological Survey of Western Australia
http://www.dmp.wa.gov.au/Geological-Survey/Geological-Survey-262.aspx
Northern Territory Geological Survey
https://geoscience.nt.gov.au/
Geological Survey of South Australia
http://www.energymining.sa.gov.au/minerals/geoscience/geological_survey
Geoscience Australia https://ecat.ga.gov.au/geonetwork/srv/eng/catalog.search
Borehole Data
Northern Territory Government
http://nrmaps.nt.gov.au/nrmaps.html
South Australia Government https://www.waterconnect.sa.gov.au/Systems/GD/Pages/Default.aspx
Geophysical Maps
Primary literature (Bullock, (1977); Dentith et al., (2009); Hone, (1974)) Bouguer gravity anomaly http://pid.geoscience.gov.au/dataset/ga/101104 Total magnetic intensity http://pid.geoscience.gov.au/dataset/ga/89596
Rupture Offset Data
Primary literature (Bowman, (1991); Bowman and Barlow, (1991); Clark et al., (2014); Crone et al., (1992); Dawson et al., (2008); Gold et al., (2017); Gordon and Lewis, (1980); King et al., (2018); Lewis et al., (1981))
Historic Photos of Ruptures
Primary literature
(Bowman, (1992); Bowman et al., (1990b); Bowman and Barlow, (1991); Clark et al., (2014); Clark and Edwards, (2018); Clark and Mcpherson, (2013); Conacher and Murray, (1969); Crone et al., (1997), (1992); Everingham et al., (1969); Everingham, (1968); Gordon and Lewis, (1980); Gregson and Paull, (1979); Johnston, (1988); Johnston and White, (2018); King et al., (2018); Lewis et al., (1981); Machette et al., (1993); McCue et al., (1987))
Websites https://aees.org.au/; http://fortennantcreekers.com/events/earthquake-friday-22-january-1988/
News articles https://trove.nla.gov.au/; https://www.abc.net.au/news/
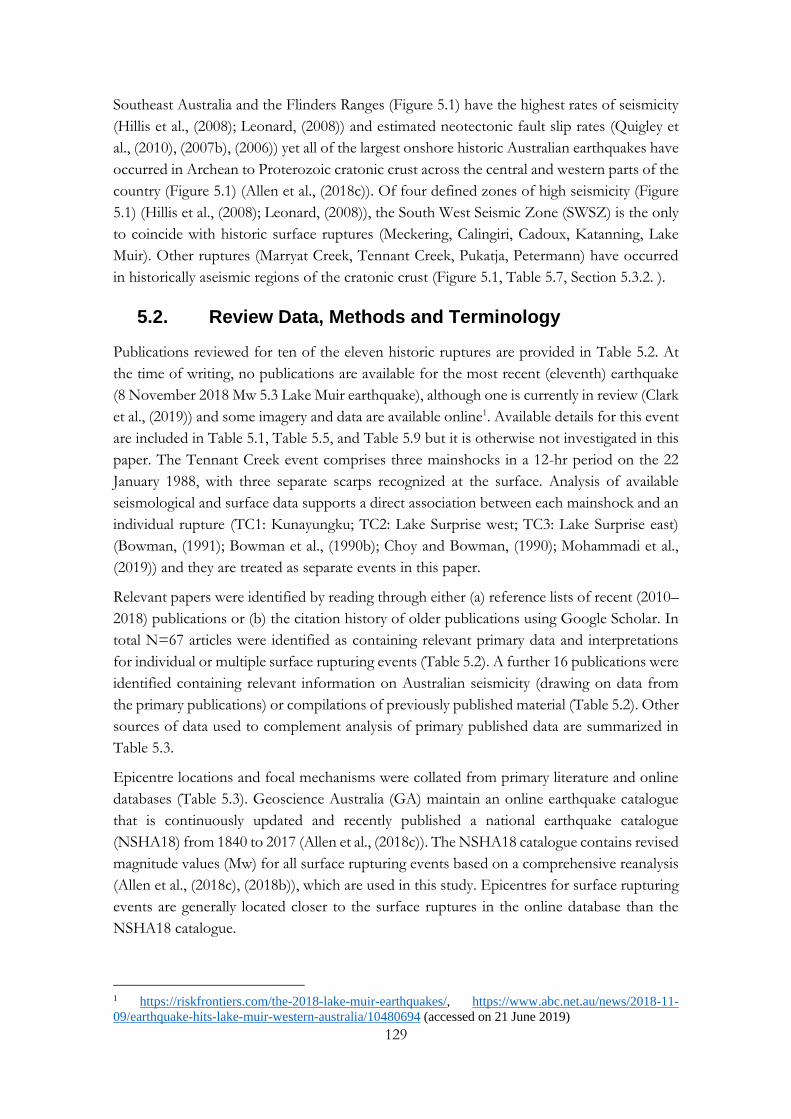
129
Southeast Australia and the Flinders Ranges (Figure 5.1) have the highest rates of seismicity
(Hillis et al., (2008); Leonard, (2008)) and estimated neotectonic fault slip rates (Quigley et
al., (2010), (2007b), (2006)) yet all of the largest onshore historic Australian earthquakes have
occurred in Archean to Proterozoic cratonic crust across the central and western parts of the
country (Figure 5.1) (Allen et al., (2018c)). Of four defined zones of high seismicity (Figure
5.1) (Hillis et al., (2008); Leonard, (2008)), the South West Seismic Zone (SWSZ) is the only
to coincide with historic surface ruptures (Meckering, Calingiri, Cadoux, Katanning, Lake
Muir). Other ruptures (Marryat Creek, Tennant Creek, Pukatja, Petermann) have occurred
in historically aseismic regions of the cratonic crust (Figure 5.1, Table 5.7, Section 5.3.2. ).
5.2. Review Data, Methods and Terminology
Publications reviewed for ten of the eleven historic ruptures are provided in Table 5.2. At
the time of writing, no publications are available for the most recent (eleventh) earthquake
(8 November 2018 Mw 5.3 Lake Muir earthquake), although one is currently in review (Clark
et al., (2019)) and some imagery and data are available online1. Available details for this event
are included in Table 5.1, Table 5.5, and Table 5.9 but it is otherwise not investigated in this
paper. The Tennant Creek event comprises three mainshocks in a 12-hr period on the 22
January 1988, with three separate scarps recognized at the surface. Analysis of available
seismological and surface data supports a direct association between each mainshock and an
individual rupture (TC1: Kunayungku; TC2: Lake Surprise west; TC3: Lake Surprise east)
(Bowman, (1991); Bowman et al., (1990b); Choy and Bowman, (1990); Mohammadi et al.,
(2019)) and they are treated as separate events in this paper.
Relevant papers were identified by reading through either (a) reference lists of recent (2010–
2018) publications or (b) the citation history of older publications using Google Scholar. In
total N=67 articles were identified as containing relevant primary data and interpretations
for individual or multiple surface rupturing events (Table 5.2). A further 16 publications were
identified containing relevant information on Australian seismicity (drawing on data from
the primary publications) or compilations of previously published material (Table 5.2). Other
sources of data used to complement analysis of primary published data are summarized in
Table 5.3.
Epicentre locations and focal mechanisms were collated from primary literature and online
databases (Table 5.3). Geoscience Australia (GA) maintain an online earthquake catalogue
that is continuously updated and recently published a national earthquake catalogue
(NSHA18) from 1840 to 2017 (Allen et al., (2018c)). The NSHA18 catalogue contains revised
magnitude values (Mw) for all surface rupturing events based on a comprehensive reanalysis
(Allen et al., (2018c), (2018b)), which are used in this study. Epicentres for surface rupturing
events are generally located closer to the surface ruptures in the online database than the
NSHA18 catalogue.
1 https://riskfrontiers.com/the-2018-lake-muir-earthquakes/, https://www.abc.net.au/news/2018-11-
09/earthquake-hits-lake-muir-western-australia/10480694 (accessed on 21 June 2019)

130
Table 5.4. Literature references for each Table
Event Table 5.5. Summary of regional geology for each historic surface rupture
Table 5.6. Degree of alignment between rupture, basement structures, and geophysical anomalies
Table 5.7. Summary of seismological data and interpretations for each rupture.
Table 5.8. Summary of surface measurements for each rupture.
Table 5.10 Summary of available paleoseismic trenching.
Meckering, WA (Clark et al., (2008); Dentith et al., (2009); Dentith and Featherstone, (2003); Wilde et al., (1996))
(Dentith et al., (2009); Gordon and Lewis, (1980); Lewis, (1969); Wilde et al., (1978))
(Allen et al., (2018c); Denham et al., (1980); Everingham, (1968); Everingham et al., (1969); Everingham and Gregson, (1970); Fitch et al., (1973); Fredrich et al., (1988); Gordon and Lewis, (1980); Leonard et al., (2002); Vogfjord and Langston, (1987))
(Gordon and Lewis, (1980))
(Clark, (2018); Clark et al., (2011b); Clark and Edwards, (2018))
Calingiri, WA (Clark et al., (2008); Dentith and Featherstone, (2003); Wilde et al., (1996))
(Gordon and Lewis, (1980); Wilde et al., (1978))
(Allen et al., (2018c); Everingham and Parkes, (1971); Fitch et al., (1973); Gordon and Lewis, (1980))
(Gordon and Lewis, (1980))
(Gordon and Lewis, (1980))
Cadoux, WA (Clark et al., (2008); Dentith and Featherstone, (2003); Wilde et al., (1996))
(Blight et al., (1983); Lewis et al., (1981))
(Allen et al., (2018c); Denham et al., (1987); Fredrich et al., (1988); Gregson and Paull, (1979); Lewis et al., (1981))
(Lewis et al., (1981)) (Lewis et al., (1981))
Marryat Creek, SA
(Edgoose et al., (2004); Neumann, (2013); Raimondo et al., (2010); Wade et al., (2008))
(Bowman and Barlow, (1991); Fairclough et al., (2011); McCue et al., (1987))
(Allen et al., (2018c); Barlow et al., (1986); Denham, (1988); Fredrich et al., (1988); McCue et al., (1987))
(Bowman and Barlow, (1991))
(Machette et al., (1993))
Tennant Creek 1 (Kunayungku) NT
(Donnellan, (2013); Johnstone and Donnellan, (2001))
(Bullock, (1977); Donnellan, (2013); Donnellan et al., (1998); Hone, (1974); Johnstone and Donnellan, (2001); Verhoeven and Russell, (1981))
(Allen et al., (2018c); Bowman and Dewey, (1991); Choy and Bowman, (1990); Crone et al., (1992); Jones et al., (1991); McCaffrey, (1989))
(Crone et al., (1992)) (Crone et al., (1992))
Tennant Creek 2 (Lake Surprise west)
(Donnellan, (2013); Johnstone and Donnellan, (2001))
(Bullock, (1977); Donnellan, (2013); Donnellan et al., (1998); Hone, (1974); Johnstone and Donnellan, (2001))
(Allen et al., (2018c); Bowman and Dewey, (1991); Choy and Bowman, (1990); Crone et al., (1992); Jones et al., (1991); McCaffrey, (1989))
(Crone et al., (1992)) (Crone et al., (1992))
Tennant Creek 3 (Lake Surprise east)
(Donnellan, (2013); Johnstone and Donnellan, (2001))
(Bullock, (1977); Donnellan, (2013); Donnellan et al., (1998); Hone, (1974); Johnstone and Donnellan, (2001))
(Allen et al., (2018c); Bowman and Dewey, (1991); Choy and Bowman, (1990); Crone et al., (1992); Jones et al., (1991); McCaffrey, (1989))
(Crone et al., (1992)) (Crone et al., (1992))
Katanning, WA (Clark et al., (2008); Dentith and Featherstone, (2003); Wilde et al., (1996))
(Brakel et al., (1985)) (Dawson et al., (2008)) (Dawson et al., (2008); Dent, (2008))
Pukatja, SA (Edgoose et al., (2004); Neumann, (2013); Raimondo et al., (2010); Wade et al., (2008))
(Clark et al., (2014)) (Allen et al., (2018c); Clark et al., (2014)) (Clark et al., (2014)) (Clark et al., (2014))
Petermann, NT
(Edgoose et al., (2004); Neumann, (2013); Raimondo et al., (2010); Scrimgeour et al., (1999a); Wade et al., (2008))
(Edgoose et al., (2004); King et al., (2018); Scrimgeour et al., (1999b))
(Hejrani and Tkalčić, (2018); King et al., (2018); Polcari et al., (2018))
(Gold et al., (2017); King et al., (2018))
Unpub.
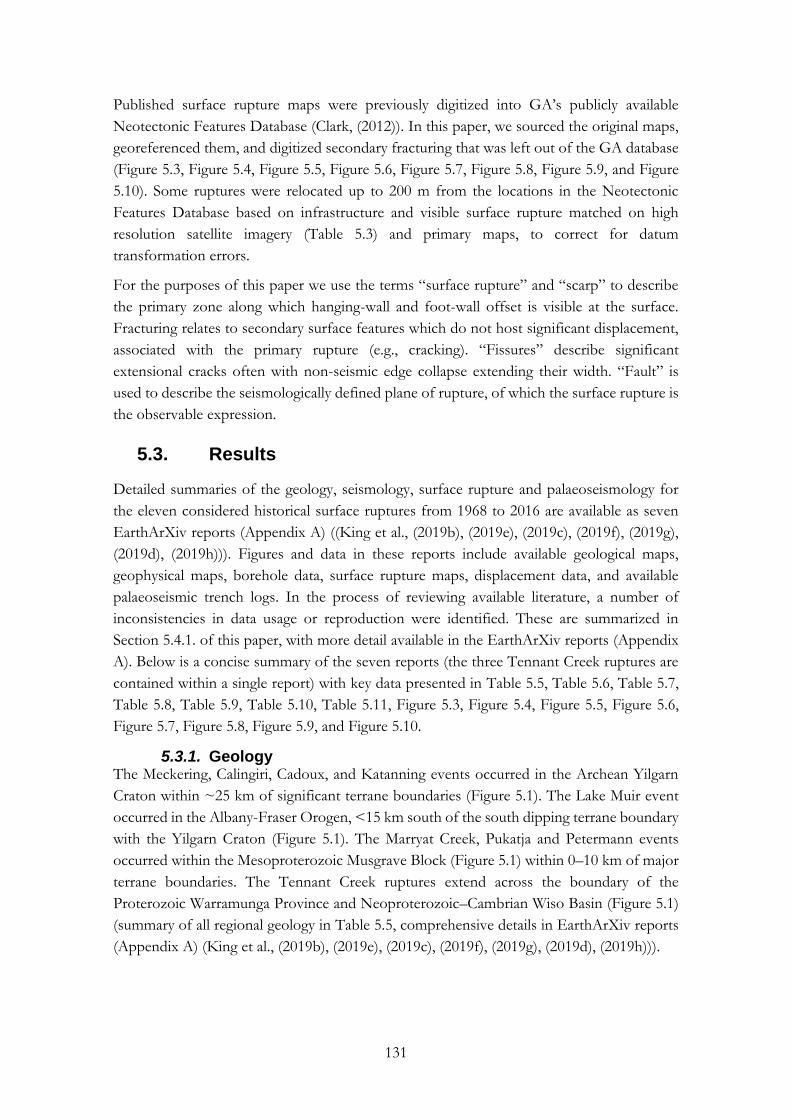
131
Published surface rupture maps were previously digitized into GA’s publicly available
Neotectonic Features Database (Clark, (2012)). In this paper, we sourced the original maps,
georeferenced them, and digitized secondary fracturing that was left out of the GA database
(Figure 5.3, Figure 5.4, Figure 5.5, Figure 5.6, Figure 5.7, Figure 5.8, Figure 5.9, and Figure
5.10). Some ruptures were relocated up to 200 m from the locations in the Neotectonic
Features Database based on infrastructure and visible surface rupture matched on high
resolution satellite imagery (Table 5.3) and primary maps, to correct for datum
transformation errors.
For the purposes of this paper we use the terms “surface rupture” and “scarp” to describe
the primary zone along which hanging-wall and foot-wall offset is visible at the surface.
Fracturing relates to secondary surface features which do not host significant displacement,
associated with the primary rupture (e.g., cracking). “Fissures” describe significant
extensional cracks often with non-seismic edge collapse extending their width. “Fault” is
used to describe the seismologically defined plane of rupture, of which the surface rupture is
the observable expression.
5.3. Results
Detailed summaries of the geology, seismology, surface rupture and palaeoseismology for
the eleven considered historical surface ruptures from 1968 to 2016 are available as seven
EarthArXiv reports (Appendix A) ((King et al., (2019b), (2019e), (2019c), (2019f), (2019g),
(2019d), (2019h))). Figures and data in these reports include available geological maps,
geophysical maps, borehole data, surface rupture maps, displacement data, and available
palaeoseismic trench logs. In the process of reviewing available literature, a number of
inconsistencies in data usage or reproduction were identified. These are summarized in
Section 5.4.1. of this paper, with more detail available in the EarthArXiv reports (Appendix
A). Below is a concise summary of the seven reports (the three Tennant Creek ruptures are
contained within a single report) with key data presented in Table 5.5, Table 5.6, Table 5.7,
Table 5.8, Table 5.9, Table 5.10, Table 5.11, Figure 5.3, Figure 5.4, Figure 5.5, Figure 5.6,
Figure 5.7, Figure 5.8, Figure 5.9, and Figure 5.10.
5.3.1. Geology The Meckering, Calingiri, Cadoux, and Katanning events occurred in the Archean Yilgarn
Craton within ~25 km of significant terrane boundaries (Figure 5.1). The Lake Muir event
occurred in the Albany-Fraser Orogen, <15 km south of the south dipping terrane boundary
with the Yilgarn Craton (Figure 5.1). The Marryat Creek, Pukatja and Petermann events
occurred within the Mesoproterozoic Musgrave Block (Figure 5.1) within 0–10 km of major
terrane boundaries. The Tennant Creek ruptures extend across the boundary of the
Proterozoic Warramunga Province and Neoproterozoic–Cambrian Wiso Basin (Figure 5.1)
(summary of all regional geology in Table 5.5, comprehensive details in EarthArXiv reports
(Appendix A) (King et al., (2019b), (2019e), (2019c), (2019f), (2019g), (2019d), (2019h))).
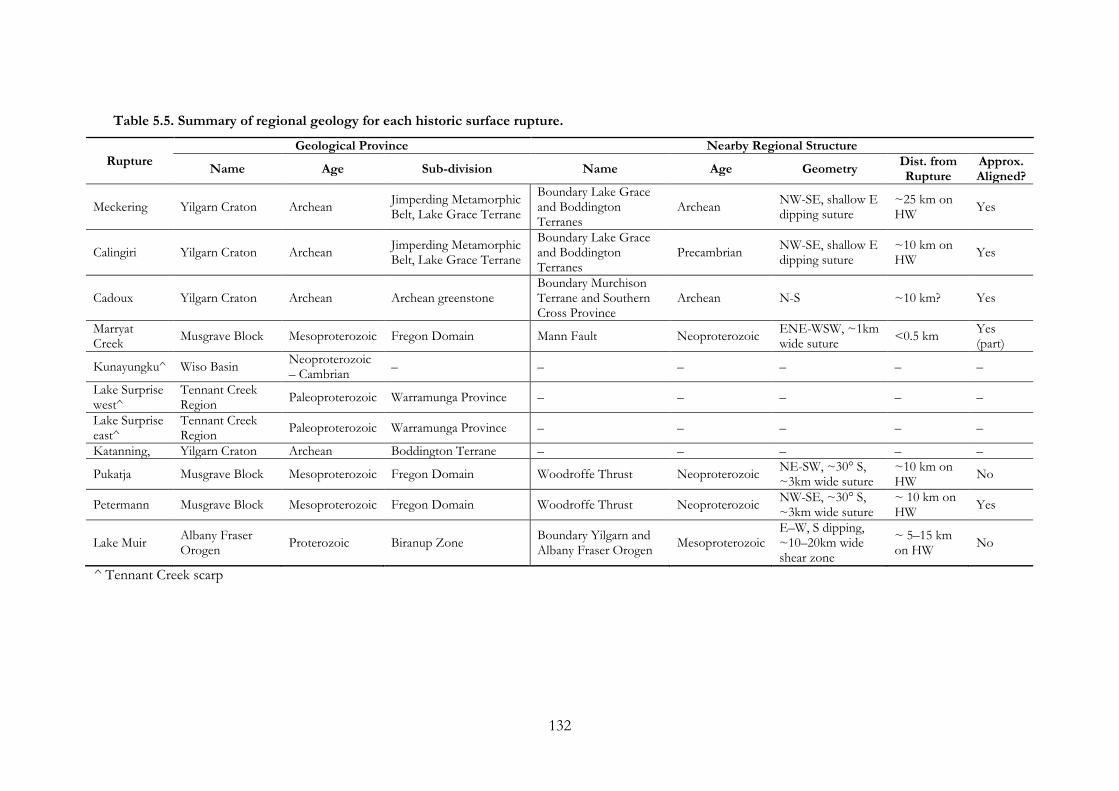
132
Table 5.5. Summary of regional geology for each historic surface rupture.
Rupture
Geological Province Nearby Regional Structure
Name Age Sub-division Name Age Geometry Dist. from Rupture
Approx. Aligned?
Meckering Yilgarn Craton Archean Jimperding Metamorphic Belt, Lake Grace Terrane
Boundary Lake Grace and Boddington Terranes
Archean NW-SE, shallow E dipping suture
~25 km on HW
Yes
Calingiri Yilgarn Craton Archean Jimperding Metamorphic Belt, Lake Grace Terrane
Boundary Lake Grace and Boddington Terranes
Precambrian NW-SE, shallow E dipping suture
~10 km on HW
Yes
Cadoux Yilgarn Craton Archean Archean greenstone Boundary Murchison Terrane and Southern Cross Province
Archean N-S ~10 km? Yes
Marryat Creek
Musgrave Block Mesoproterozoic Fregon Domain Mann Fault Neoproterozoic ENE-WSW, ~1km wide suture
<0.5 km Yes (part)
Kunayungku^ Wiso Basin Neoproterozoic – Cambrian
– – – – – –
Lake Surprise west^
Tennant Creek Region
Paleoproterozoic Warramunga Province – – – – –
Lake Surprise east^
Tennant Creek Region
Paleoproterozoic Warramunga Province – – – – –
Katanning, Yilgarn Craton Archean Boddington Terrane – – – – –
Pukatja Musgrave Block Mesoproterozoic Fregon Domain Woodroffe Thrust Neoproterozoic NE-SW, ~30° S, ~3km wide suture
~10 km on HW
No
Petermann Musgrave Block Mesoproterozoic Fregon Domain Woodroffe Thrust Neoproterozoic NW-SE, ~30° S, ~3km wide suture
~ 10 km on HW
Yes
Lake Muir Albany Fraser Orogen
Proterozoic Biranup Zone Boundary Yilgarn and Albany Fraser Orogen
Mesoproterozoic E–W, S dipping, ~10–20km wide shear zone
~ 5–15 km on HW
No
^ Tennant Creek scarp
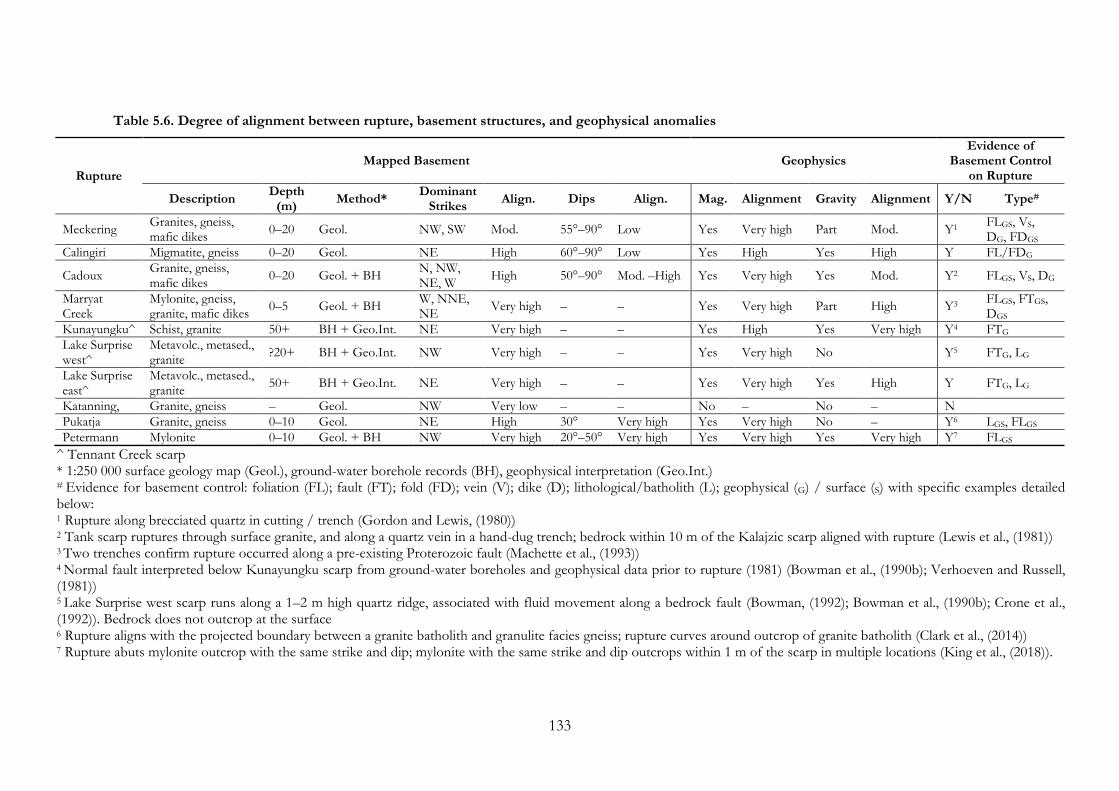
133
Table 5.6. Degree of alignment between rupture, basement structures, and geophysical anomalies
Rupture
Mapped Basement Geophysics Evidence of
Basement Control on Rupture
Description Depth
(m) Method*
Dominant Strikes
Align. Dips Align. Mag. Alignment Gravity Alignment Y/N Type#
Meckering Granites, gneiss, mafic dikes
0–20 Geol. NW, SW Mod. 55°–90° Low Yes Very high Part Mod. Y1 FLGS, VS, DG, FDGS
Calingiri Migmatite, gneiss 0–20 Geol. NE High 60°–90° Low Yes High Yes High Y FL/FDG
Cadoux Granite, gneiss, mafic dikes
0–20 Geol. + BH N, NW, NE, W
High 50°–90° Mod. –High Yes Very high Yes Mod. Y2 FLGS, VS, DG
Marryat Creek
Mylonite, gneiss, granite, mafic dikes
0–5 Geol. + BH W, NNE, NE
Very high – – Yes Very high Part High Y3 FLGS, FTGS, DGS
Kunayungku^ Schist, granite 50+ BH + Geo.Int. NE Very high – – Yes High Yes Very high Y4 FTG
Lake Surprise west^
Metavolc., metased., granite
?20+ BH + Geo.Int. NW Very high – – Yes Very high No Y5 FTG, LG
Lake Surprise east^
Metavolc., metased., granite
50+ BH + Geo.Int. NE Very high – – Yes Very high Yes High Y FTG, LG
Katanning, Granite, gneiss – Geol. NW Very low – – No – No – N
Pukatja Granite, gneiss 0–10 Geol. NE High 30° Very high Yes Very high No – Y6 LGS, FLGS
Petermann Mylonite 0–10 Geol. + BH NW Very high 20°–50° Very high Yes Very high Yes Very high Y7 FLGS
^ Tennant Creek scarp * 1:250 000 surface geology map (Geol.), ground-water borehole records (BH), geophysical interpretation (Geo.Int.) # Evidence for basement control: foliation (FL); fault (FT); fold (FD); vein (V); dike (D); lithological/batholith (L); geophysical (G) / surface (S) with specific examples detailed below: 1 Rupture along brecciated quartz in cutting / trench (Gordon and Lewis, (1980)) 2 Tank scarp ruptures through surface granite, and along a quartz vein in a hand-dug trench; bedrock within 10 m of the Kalajzic scarp aligned with rupture (Lewis et al., (1981)) 3 Two trenches confirm rupture occurred along a pre-existing Proterozoic fault (Machette et al., (1993)) 4 Normal fault interpreted below Kunayungku scarp from ground-water boreholes and geophysical data prior to rupture (1981) (Bowman et al., (1990b); Verhoeven and Russell, (1981)) 5 Lake Surprise west scarp runs along a 1–2 m high quartz ridge, associated with fluid movement along a bedrock fault (Bowman, (1992); Bowman et al., (1990b); Crone et al., (1992)). Bedrock does not outcrop at the surface 6 Rupture aligns with the projected boundary between a granite batholith and granulite facies gneiss; rupture curves around outcrop of granite batholith (Clark et al., (2014)) 7 Rupture abuts mylonite outcrop with the same strike and dip; mylonite with the same strike and dip outcrops within 1 m of the scarp in multiple locations (King et al., (2018)).

134
Figure 5.2. Examples of the relationship between geophysical data and surface outcrop to historic ruptures (a) national total magnetic intensity map with ruptures overlaid, and dashed lines indicating linear anomalies (b) interpreted basement geology around the three Tennant Creek scarps (no basement outcrops at the surface) demonstrating strong correlation between intrusive/lithological boundaries, basement faults, and historic surface rupture (legend heavily simplified to show lithologies around the ruptures, more details in EarthArXiv report (Appendix A) (King et al., (2019h)) legend and original map. Map used under creative commons NT Gov) (c) examples of surface outcrop structures visible in basement around the Marryat Creek rupture including three sets of dike / foliation / fault orientations coincident with the three major orientations of the historic rupture, uninterpreted satellite imagery insets (i) and (ii) available in Marryat Creek EarthArXiv report (Appendix A) (King et al., (2019f)) (d) example of mylonite foliation orientation along a section of the Petermann rupture where outcrop occurs within the primary rupture zone.
Granitic gneiss, migmatite, mylonite, granulite, and/or amphibolite basement rock is
observed in trenches or outcrop at <1 m depth at multiple locations along the Petermann
(Figure 5.2), Pukatja, Marryat Creek (Figure 5.2), Cadoux and Meckering ruptures.
Proterozoic basement in the vicinity of the Tennant Creek ruptures is variably overlain by 10
s to 100 s of meters of Phanerozoic basin bedrock. Structural measurements (foliations,
intrusive boundaries) for bedrock outcrops within 5 km of surface ruptures are qualitatively
well-aligned to surface ruptures in eight of ten events, though dip measurements are only
qualitatively well aligned in three cases. This may relate to dip measurement difficulties for
heavily weathered bedrock. (Summary of basement/bedrock in Table 5.6, comprehensive
135
details in EarthArXiv reports (Appendix A) (King et al., (2019b), (2019e), (2019c), (2019f),
(2019g), (2019d), (2019h))).
Nine of ten ruptures align with linear magnetic anomalies (Figure 5.2) and six align with
linear gravity anomalies/gradients. The Katanning rupture does not align with either gravity
or magnetics at the scale of available geophysical data (Figure 5.2, Table 5.3), and the Lake
Muir rupture was not studied in this paper (paper in review: (Clark et al., (2019))). In cases
where surface rupture traces are highly curved, arcuate, and/or segmented (Meckering,
Marryat Creek, Tennant Creek, Pukatja), the distinctly-oriented rupture traces all align with
distinct orientations of linear geophysical anomalies interpreted as faults, dikes, and
lithological contacts (e.g., (Dentith et al., (2009))).
5.3.2. Seismology The sparse nature of the Australian National Seismograph Network
(https://www.fdsn.org/networks/detail/AU/) results in large (i.e., ≥ 5–10 km) uncertainties
in earthquake epicentre and hypocentre location estimates that are difficult to quantify,
including those for the earthquakes studied here (Leonard, (2008)). Epicentral
determinations (Figure 5.3, Figure 5.4, Figure 5.5, Figure 5.6, Figure 5.7, Figure 5.8, Figure
5.9, and Figure 5.10) are typically not sufficiently accurate to unambiguously associate with
surface ruptures. Six of ten ruptures have favoured epicentre locations that are located on
the rupture hanging-wall, within approximated positional uncertainty bounds.
Hypocentres derived from mainshock instrumental data do not project onto rupture planes
as defined by surface rupture for any of the studied events. Hypocentral depth estimates
based on aftershock data and relocated epicentre locations suggest depths of <5 km (for
Tennant Creek (Bowman et al., (1990b)), Petermann (King et al., (2018)) and Meckering
(Clark and Edwards, (2018))). Centroid moment tensor depths are <6 km depth, with the
authors’ preferred best-fits all <4 km depth (Meckering (Fredrich et al., (1988); Langston,
(1987); Vogfjord and Langston, (1987)); Cadoux (Fredrich et al., (1988)); Marryat Creek
(Fredrich et al., (1988)); Tennant Creek (McCaffrey, (1989)); Katanning (Dawson et al.,
(2008)); Petermann (Hejrani and Tkalčić, (2018))).
Epicentral location uncertainties limit the study of rupture propagation directions(s) for most
events. Model scenarios for the Meckering earthquake support a bilateral rupture (Clark and
Edwards, (2018)). Unilateral upwards propagation has been proposed for the first Tennant
Creek mainshock, complex propagation in the second mainshock, and unilateral upwards
propagation to the Southeast in the third mainshock (all on separate faults) (Choy and
Bowman, (1990)).
Seven of ten events show foreshock activity within six months and 50 km of the mainshock
epicentre and six of ten show instrumentally recorded prior seismicity (more than five events
within 10 years and 50 km). Precise locations are difficult to obtain due to epistemic and
statistical uncertainties, particularly for assessing seismicity prior to 1980 due to sparse
instrumentation (Leonard, (2008)). Aftershock data are inherently incomplete for most
events due to sparse instrumentation. However, temporary seismometers were deployed
following most events and magnitude completeness from the national network is >3.0 Mw
136
for all events (Leonard, (2008)) (though, the locations of these events are generally highly
uncertain compared to the temporary arrays, as discussed above). The Musgrave block events
(Marryat Creek, Pukatja, Petermann, Figure 5.1, Table 5.5) show less aftershock activity in
comparison to the Tennant Creek and Western Australia earthquakes (Meckering, Calingiri,
Cadoux) which had extended aftershock sequences (Clark et al., (2012), (2011b)).
5.3.3. Surface Ruptures Methods for the original mapping of individual ruptures are summarized in Table 5.8 and
give some indication of data quality (explored in more detail in EarthArXiv reports
(Appendix A) (King et al., (2019b), (2019e), (2019c), (2019f), (2019g), (2019d), (2019h))).
Some readjustment of terminology and classification is required when considering the earlier
ruptures (e.g., ‘fault’ may refer to both primary rupture and secondary fractures) and
considerable detail of rupture morphology was lost between fine-scale (i.e., 1:500) and whole
rupture (1:25,000–1:50,000) for pre-digital maps (Meckering to Tennant Creek). Six of ten
ruptures are concave relative to the hanging-wall, three are straight and one is slightly convex
(Petermann) (Table 5.8). All ruptures are reverse, and only two events have surface
measurements consistent with secondary lateral movement (Meckering: dextral; Calingiri:
sinistral; Table 5.8, explored in individual EarthArXiv reports (Appendix A) (King et al.,
(2019b), (2019e), (2019c), (2019f), (2019g), (2019d), (2019h))).
Nine of ten ruptures studied (Katanning was excluded due to lack of field mapping) show a
relationship between surface sediments / bedrock depth to rupture morphology. Discrete
rupture and duplexing rupture are more common where bedrock is close to the surface or
surface sediments are predominately calcrete/ferricrete/silcrete. Where sands dominate in
the surface sediments, rupture tends to present as warping and folding, or correspond with
breaks in visible surface rupture (e.g., Petermann: morphology explored in individual
EarthArXiv report (Appendix A) (King et al., (2019d)))).
Figure 5.3, Figure 5.4, Figure 5.5, Figure 5.6, Figure 5.7, Figure 5.8, Figure 5.9, and Figure
5.10 show digitized versions of published primary ruptures, secondary fracturing, and dip
values measured at the surface. Primary sources inconsistently derive published length values
to describe their mapped rupture (Table 5.1 and Table 5.8; explored in detail in EarthArXiv
reports (Appendix A) (King et al., (2019b), (2019e), (2019c), (2019f), (2019g), (2019d),
(2019h))) which are then used in secondary sources including scaling relationships. This
includes simplifying scarps to straight lengths (Calingiri, Cadoux, Marryat Creek), capturing
along-rupture complexity to varying degrees (Pukatja, Tennant Creek), excluding segments
that have length, offset and morphology characteristics of primary rupture (Meckering,
Tennant Creek, Cadoux), and reporting InSAR derived lengths rather than visible rupture
(Katanning). (Explored in more detail in individual EarthArXiv reports (Appendix A) (King
et al., (2019b), (2019e), (2019c), (2019f), (2019g), (2019d), (2019h))).

137
Table 5.7. Summary of seismological data and interpretations for each rupture.
Rupture
Published Epicentres
Located on Hanging-Wall
Hypocentre Depth1 (km)
Focal Mechanisms Rup.
Propagation Foreshocks4
Prior Seismicity5
N= Uncert.2
(km) Initial Relocated Range Uncert. N=
CMT Depth3
(km)
Dip Range
Strike Corr. with
Rupture?
Meckering 8 ~10 1 2 2.5–13 1-10km 4 1.5–3 29°–45° Yes Bilateral Yes Yes
Calingiri 2 ~10 0 1 1–15 >5 1 50° Yes Unknown Yes Yes
Cadoux 6 ~10 N/A6 N/A6 3–15 >5 4 4–6 N/A6 Part6 Unknown Yes Yes
Marryat Creek 7 >10 0 1 5–19 >5 3 0–3 35°–67° Part Unknown No No
Kunayungku^ 4 2–10 ? 0 5–6.5 1–4 4 2.7 35°–55° Yes Unilateral Yes Yes
Lake Surprise west^
4 2–10 ? 2 3–4 0.5–3 4 3.0 38°–70° Part7 Unknown Yes Yes
Lake Surprise east^
4 2–10 ? 4 4.5–5 0.5–3 4 4.2 36°–45° Yes Unilateral Yes Yes
Katanning, 3 0.04–5 0 2 <1 1 43° Yes Unknown No No
Pukatja 6 >10 0 1 4–12 5? 3 45°–72° Yes Unknown No No
Petermann 6 2.5–8 4 2 1–10 > 5 4 1–2 26°–52° Yes Unknown yes No
^ Tennant Creek scarp 1 Includes both initial hypocentral depth estimates, and revised depths based on aftershock depths and locations, uncertainties from source literature 2 Epicentre uncertainty based on published uncertainties and/or estimate based on published uncertainties for similar events 3 Centroid moment tensor depth, preferred value from publication 4 Earthquake within 6 months and 50 km of epicentre (affected by catalogue completeness for very remote events, see EarthArXiv reports (Appendix A) ((King et al., (2019b), (2019e), (2019c), (2019f), (2019g), (2019d), (2019h))) for details) 5 Earthquakes (n >5) within 10 years and 50 km of the epicentre (affected by catalogue completeness for very remote events, see EarthArXiv reports (Appendix A) for details) 6 Geometry of the seismogenic fault is unclear as scarps in the Cadoux rupture dip both east and west 7 Waveform analysis of the second Tennant Creek mainshock show complicated rupture, potentially related to complex fault interaction
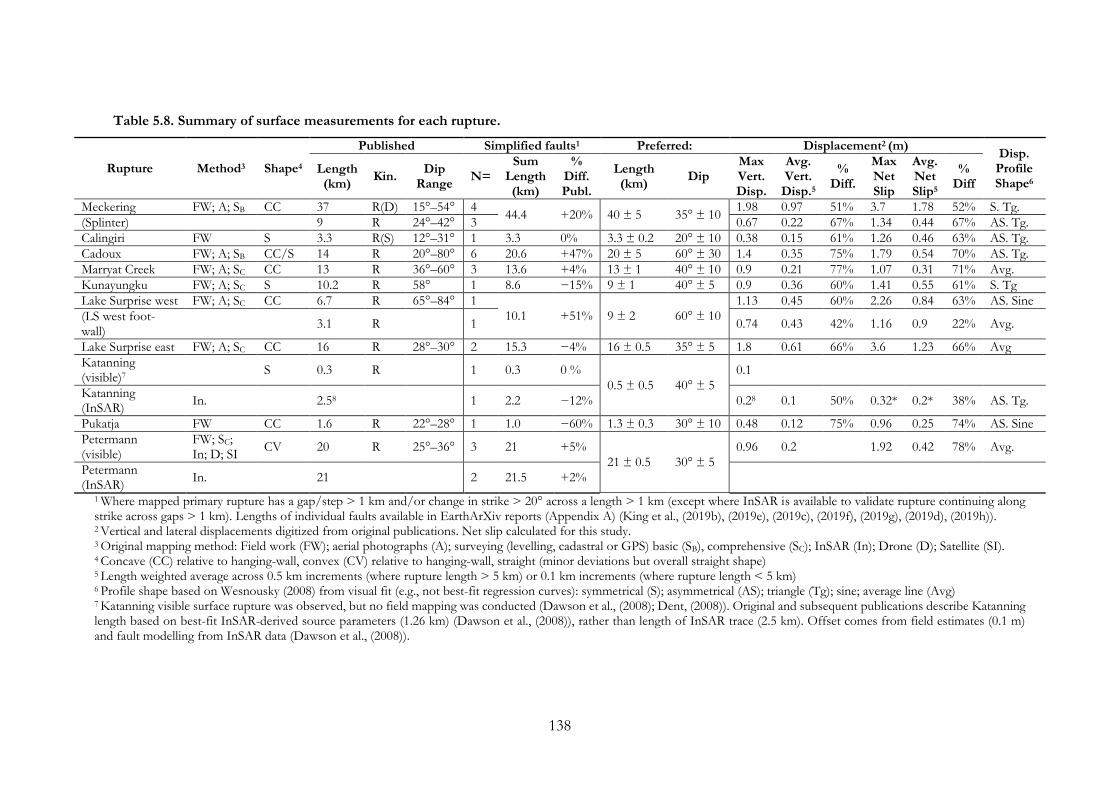
138
Table 5.8. Summary of surface measurements for each rupture.
Rupture Method3 Shape4
Published Simplified faults1 Preferred: Displacement2 (m) Disp.
Profile Shape6
Length (km)
Kin. Dip
Range N=
Sum Length (km)
% Diff. Publ.
Length (km)
Dip Max Vert. Disp.
Avg. Vert.
Disp.5
% Diff.
Max Net Slip
Avg. Net Slip5
% Diff
Meckering FW; A; SB CC 37 R(D) 15°–54° 4 44.4 +20% 40 ± 5 35° ± 10
1.98 0.97 51% 3.7 1.78 52% S. Tg.
(Splinter) 9 R 24°–42° 3 0.67 0.22 67% 1.34 0.44 67% AS. Tg.
Calingiri FW S 3.3 R(S) 12°–31° 1 3.3 0% 3.3 ± 0.2 20° ± 10 0.38 0.15 61% 1.26 0.46 63% AS. Tg.
Cadoux FW; A; SB CC/S 14 R 20°–80° 6 20.6 +47% 20 ± 5 60° ± 30 1.4 0.35 75% 1.79 0.54 70% AS. Tg.
Marryat Creek FW; A; SC CC 13 R 36°–60° 3 13.6 +4% 13 ± 1 40° ± 10 0.9 0.21 77% 1.07 0.31 71% Avg.
Kunayungku FW; A; SC S 10.2 R 58° 1 8.6 −15% 9 ± 1 40° ± 5 0.9 0.36 60% 1.41 0.55 61% S. Tg
Lake Surprise west FW; A; SC CC 6.7 R 65°–84° 1 10.1 +51% 9 ± 2 60° ± 10
1.13 0.45 60% 2.26 0.84 63% AS. Sine
(LS west foot-wall)
3.1 R 1 0.74 0.43 42% 1.16 0.9 22% Avg.
Lake Surprise east FW; A; SC CC 16 R 28°–30° 2 15.3 −4% 16 ± 0.5 35° ± 5 1.8 0.61 66% 3.6 1.23 66% Avg
Katanning (visible)7
S 0.3 R 1 0.3 0 %
0.5 ± 0.5 40° ± 5
0.1
Katanning (InSAR)
In. 2.58 1 2.2 −12% 0.28 0.1 50% 0.32* 0.2* 38% AS. Tg.
Pukatja FW CC 1.6 R 22°–28° 1 1.0 −60% 1.3 ± 0.3 30° ± 10 0.48 0.12 75% 0.96 0.25 74% AS. Sine
Petermann (visible)
FW; SC; In; D; SI
CV 20 R 25°–36° 3 21 +5%
21 ± 0.5 30° ± 5
0.96 0.2 1.92 0.42 78% Avg.
Petermann (InSAR)
In. 21 2 21.5 +2%
1 Where mapped primary rupture has a gap/step > 1 km and/or change in strike > 20° across a length > 1 km (except where InSAR is available to validate rupture continuing along strike across gaps > 1 km). Lengths of individual faults available in EarthArXiv reports (Appendix A) (King et al., (2019b), (2019e), (2019c), (2019f), (2019g), (2019d), (2019h)). 2 Vertical and lateral displacements digitized from original publications. Net slip calculated for this study. 3 Original mapping method: Field work (FW); aerial photographs (A); surveying (levelling, cadastral or GPS) basic (SB), comprehensive (SC); InSAR (In); Drone (D); Satellite (SI). 4 Concave (CC) relative to hanging-wall, convex (CV) relative to hanging-wall, straight (minor deviations but overall straight shape) 5 Length weighted average across 0.5 km increments (where rupture length > 5 km) or 0.1 km increments (where rupture length < 5 km) 6 Profile shape based on Wesnousky (2008) from visual fit (e.g., not best-fit regression curves): symmetrical (S); asymmetrical (AS); triangle (Tg); sine; average line (Avg) 7 Katanning visible surface rupture was observed, but no field mapping was conducted (Dawson et al., (2008); Dent, (2008)). Original and subsequent publications describe Katanning length based on best-fit InSAR-derived source parameters (1.26 km) (Dawson et al., (2008)), rather than length of InSAR trace (2.5 km). Offset comes from field estimates (0.1 m) and fault modelling from InSAR data (Dawson et al., (2008)).
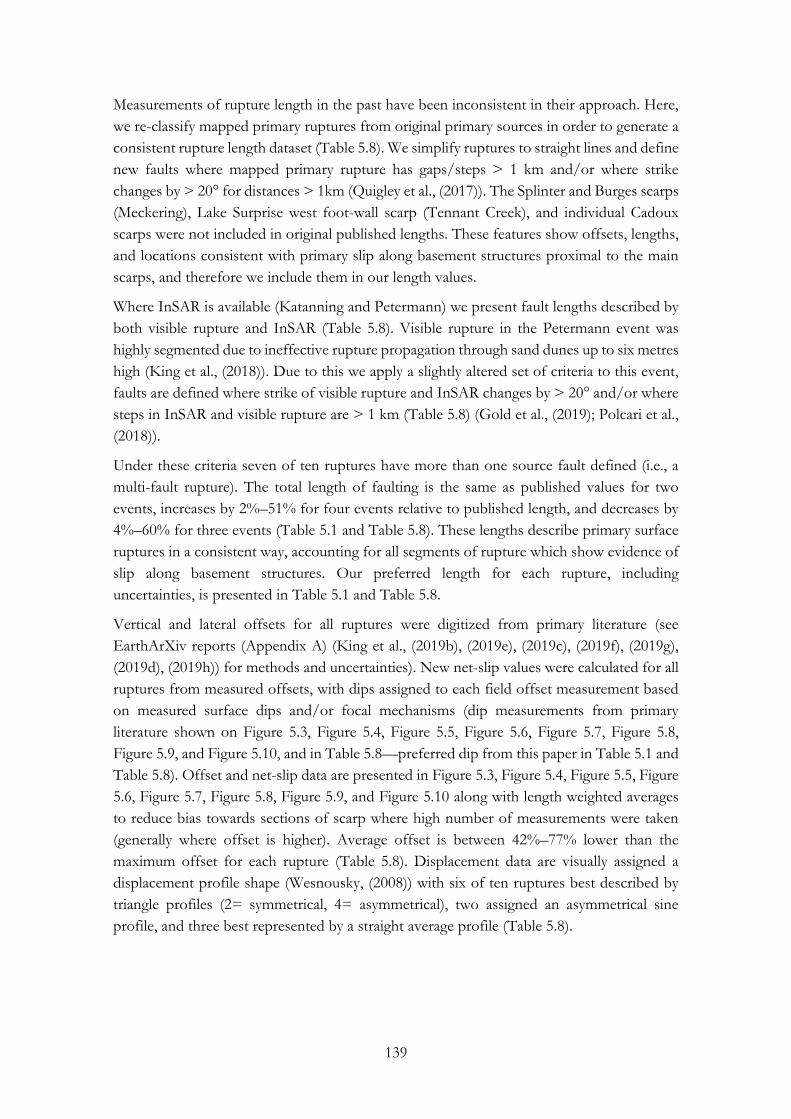
139
Measurements of rupture length in the past have been inconsistent in their approach. Here,
we re-classify mapped primary ruptures from original primary sources in order to generate a
consistent rupture length dataset (Table 5.8). We simplify ruptures to straight lines and define
new faults where mapped primary rupture has gaps/steps > 1 km and/or where strike
changes by > 20° for distances > 1km (Quigley et al., (2017)). The Splinter and Burges scarps
(Meckering), Lake Surprise west foot-wall scarp (Tennant Creek), and individual Cadoux
scarps were not included in original published lengths. These features show offsets, lengths,
and locations consistent with primary slip along basement structures proximal to the main
scarps, and therefore we include them in our length values.
Where InSAR is available (Katanning and Petermann) we present fault lengths described by
both visible rupture and InSAR (Table 5.8). Visible rupture in the Petermann event was
highly segmented due to ineffective rupture propagation through sand dunes up to six metres
high (King et al., (2018)). Due to this we apply a slightly altered set of criteria to this event,
faults are defined where strike of visible rupture and InSAR changes by > 20° and/or where
steps in InSAR and visible rupture are > 1 km (Table 5.8) (Gold et al., (2019); Polcari et al.,
(2018)).
Under these criteria seven of ten ruptures have more than one source fault defined (i.e., a
multi-fault rupture). The total length of faulting is the same as published values for two
events, increases by 2%–51% for four events relative to published length, and decreases by
4%–60% for three events (Table 5.1 and Table 5.8). These lengths describe primary surface
ruptures in a consistent way, accounting for all segments of rupture which show evidence of
slip along basement structures. Our preferred length for each rupture, including
uncertainties, is presented in Table 5.1 and Table 5.8.
Vertical and lateral offsets for all ruptures were digitized from primary literature (see
EarthArXiv reports (Appendix A) (King et al., (2019b), (2019e), (2019c), (2019f), (2019g),
(2019d), (2019h)) for methods and uncertainties). New net-slip values were calculated for all
ruptures from measured offsets, with dips assigned to each field offset measurement based
on measured surface dips and/or focal mechanisms (dip measurements from primary
literature shown on Figure 5.3, Figure 5.4, Figure 5.5, Figure 5.6, Figure 5.7, Figure 5.8,
Figure 5.9, and Figure 5.10, and in Table 5.8—preferred dip from this paper in Table 5.1 and
Table 5.8). Offset and net-slip data are presented in Figure 5.3, Figure 5.4, Figure 5.5, Figure
5.6, Figure 5.7, Figure 5.8, Figure 5.9, and Figure 5.10 along with length weighted averages
to reduce bias towards sections of scarp where high number of measurements were taken
(generally where offset is higher). Average offset is between 42%–77% lower than the
maximum offset for each rupture (Table 5.8). Displacement data are visually assigned a
displacement profile shape (Wesnousky, (2008)) with six of ten ruptures best described by
triangle profiles (2= symmetrical, 4= asymmetrical), two assigned an asymmetrical sine
profile, and three best represented by a straight average profile (Table 5.8).

140
Figure 5.3. 1968 Mw 6.6 Meckering earthquake (a) rupture and fracture map of Meckering and Splinter scarps (Gordon and Lewis, (1980)) with faults labelled as per displacement graphs, trench location from Clark & Edwards (2018) (b) published epicenter locations, open stars show approximate locations of epicenters without published coordinates (c) selected dip measurements of scarp and displacement of resurveyed road bench marks (Gordon and Lewis, (1980)) (d) graphs of along-rupture vertical and lateral displacement measurements and net slip calculations (Gordon and Lewis, (1980)) and net slip calculated from available data averaged over 0.5 km increments (this study) (e)focal mechanisms (red line shows preferred plane from original publication) from (i) Fitch et al. (1973), (ii) Fitch et al. (1993) & Leonard et al. (2002), (iii) Fredrich et al. (1988), and (iv) Vogfjord & Langston (1987).
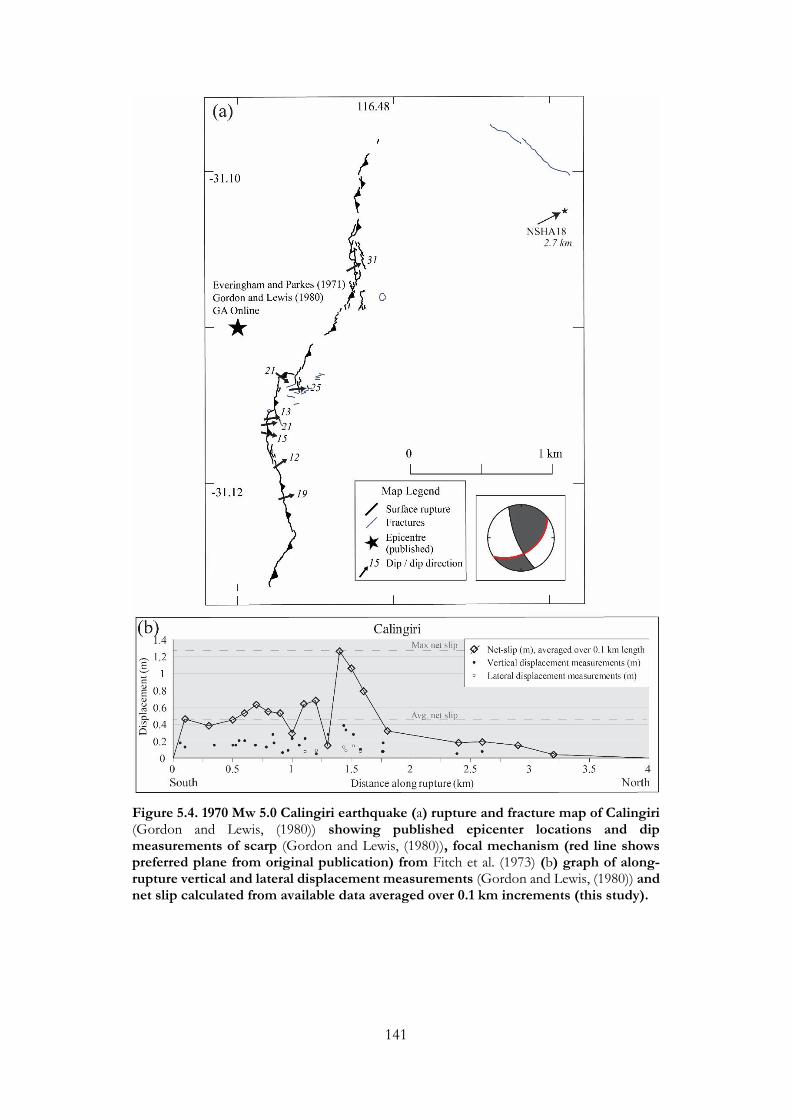
141
Figure 5.4. 1970 Mw 5.0 Calingiri earthquake (a) rupture and fracture map of Calingiri (Gordon and Lewis, (1980)) showing published epicenter locations and dip measurements of scarp (Gordon and Lewis, (1980)), focal mechanism (red line shows preferred plane from original publication) from Fitch et al. (1973) (b) graph of along-rupture vertical and lateral displacement measurements (Gordon and Lewis, (1980)) and net slip calculated from available data averaged over 0.1 km increments (this study).
142
Figure 5.5. 1979 Mw 6.1 Cadoux earthquake (a) rupture scarps and fracturing involved in the Cadoux rupture with named faults (Lewis et al., (1981)), focal mechanisms from (i) Denham et al. 1987 (ii) Fredrich et al. (1988) (iii) Everingham and Smith (unpublished, Lewis et al. (1981)) (iv) CMT (b) available dip measurements, black where directly measured and grey were calculated based on available displacement measurements (Lewis et al., (1981)) (c) published epicenter locations (d) graph along-rupture of vertical and lateral displacement measurements and calculated net slip
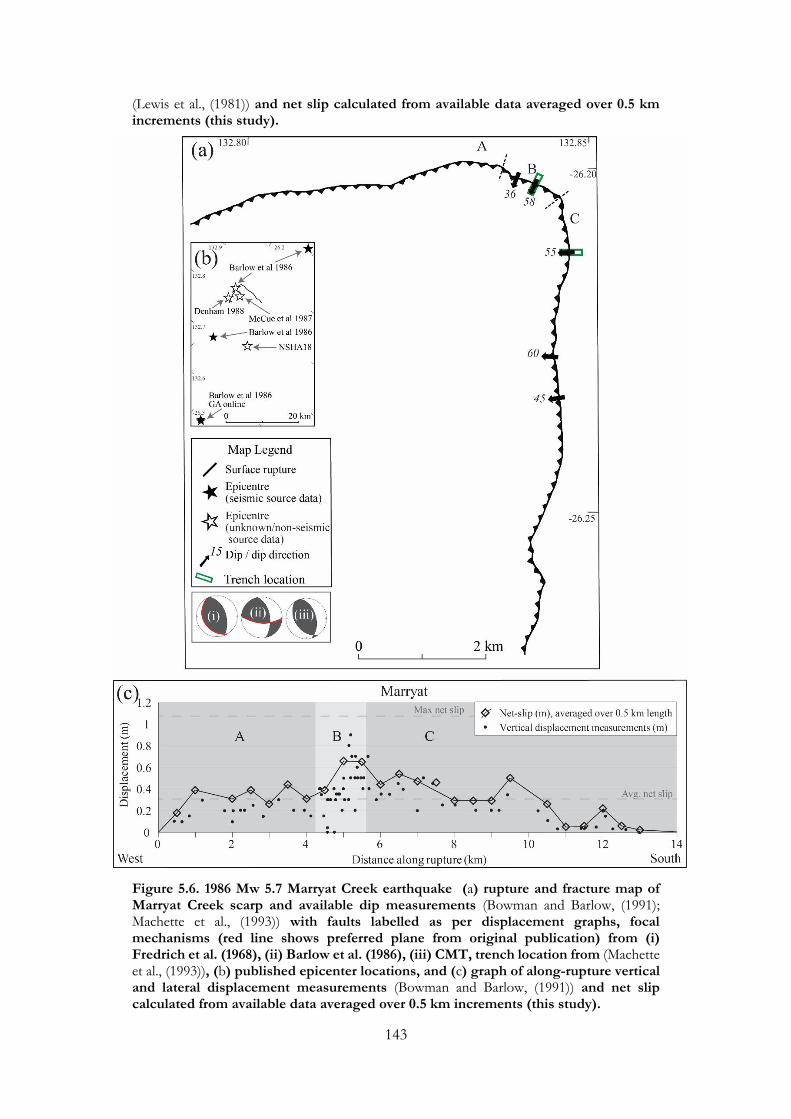
143
(Lewis et al., (1981)) and net slip calculated from available data averaged over 0.5 km increments (this study).
Figure 5.6. 1986 Mw 5.7 Marryat Creek earthquake (a) rupture and fracture map of Marryat Creek scarp and available dip measurements (Bowman and Barlow, (1991); Machette et al., (1993)) with faults labelled as per displacement graphs, focal mechanisms (red line shows preferred plane from original publication) from (i) Fredrich et al. (1968), (ii) Barlow et al. (1986), (iii) CMT, trench location from (Machette et al., (1993)), (b) published epicenter locations, and (c) graph of along-rupture vertical and lateral displacement measurements (Bowman and Barlow, (1991)) and net slip calculated from available data averaged over 0.5 km increments (this study).
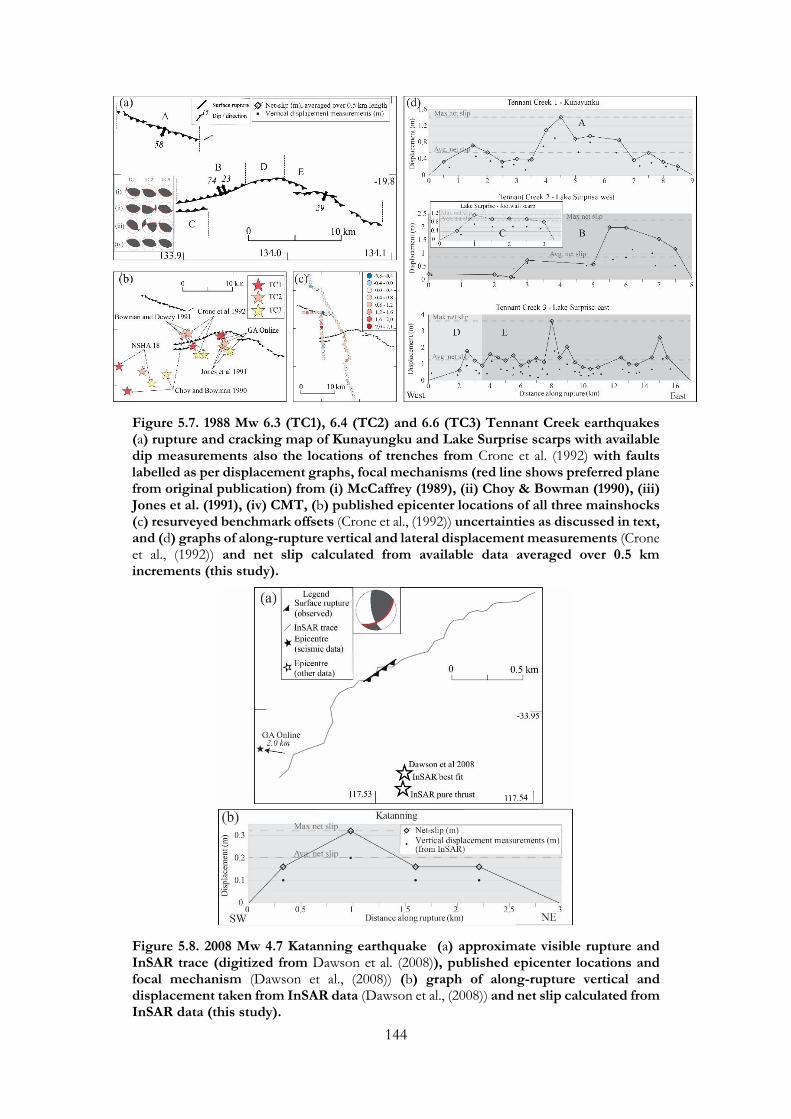
144
Figure 5.7. 1988 Mw 6.3 (TC1), 6.4 (TC2) and 6.6 (TC3) Tennant Creek earthquakes (a) rupture and cracking map of Kunayungku and Lake Surprise scarps with available dip measurements also the locations of trenches from Crone et al. (1992) with faults labelled as per displacement graphs, focal mechanisms (red line shows preferred plane from original publication) from (i) McCaffrey (1989), (ii) Choy & Bowman (1990), (iii) Jones et al. (1991), (iv) CMT, (b) published epicenter locations of all three mainshocks (c) resurveyed benchmark offsets (Crone et al., (1992)) uncertainties as discussed in text, and (d) graphs of along-rupture vertical and lateral displacement measurements (Crone et al., (1992)) and net slip calculated from available data averaged over 0.5 km increments (this study).
Figure 5.8. 2008 Mw 4.7 Katanning earthquake (a) approximate visible rupture and InSAR trace (digitized from Dawson et al. (2008)), published epicenter locations and focal mechanism (Dawson et al., (2008)) (b) graph of along-rupture vertical and displacement taken from InSAR data (Dawson et al., (2008)) and net slip calculated from InSAR data (this study).
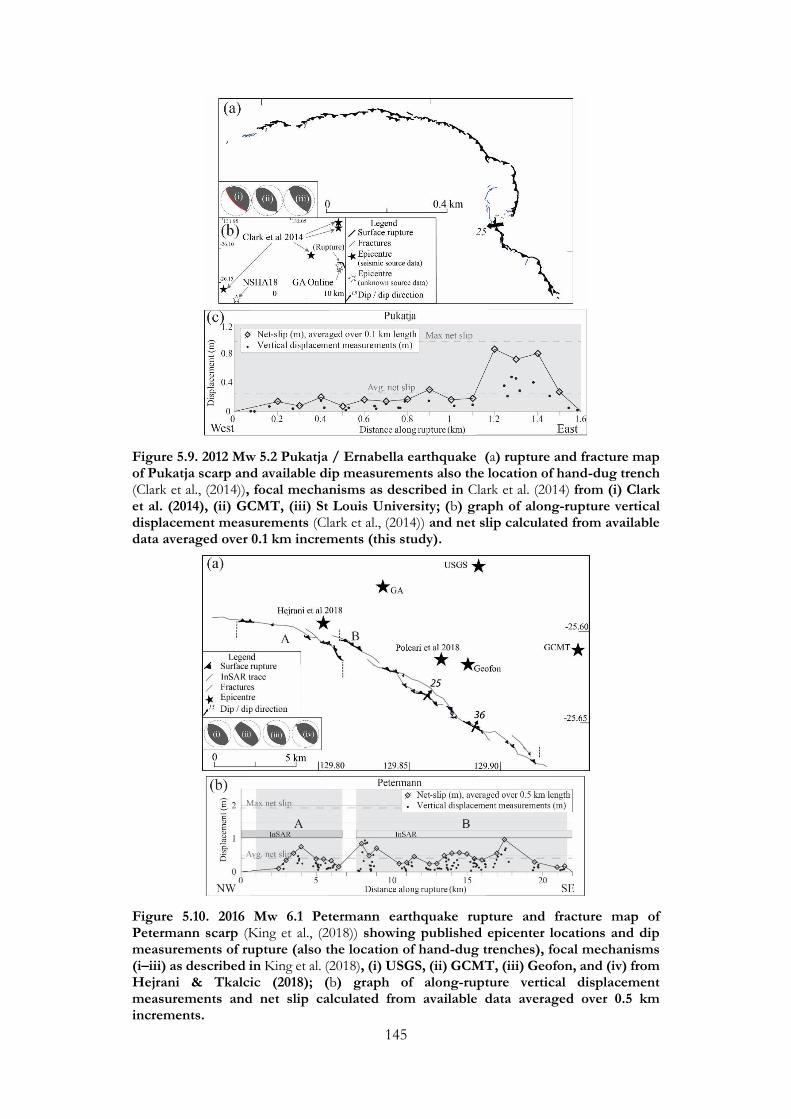
145
Figure 5.9. 2012 Mw 5.2 Pukatja / Ernabella earthquake (a) rupture and fracture map of Pukatja scarp and available dip measurements also the location of hand-dug trench (Clark et al., (2014)), focal mechanisms as described in Clark et al. (2014) from (i) Clark et al. (2014), (ii) GCMT, (iii) St Louis University; (b) graph of along-rupture vertical displacement measurements (Clark et al., (2014)) and net slip calculated from available data averaged over 0.1 km increments (this study).
Figure 5.10. 2016 Mw 6.1 Petermann earthquake rupture and fracture map of Petermann scarp (King et al., (2018)) showing published epicenter locations and dip measurements of rupture (also the location of hand-dug trenches), focal mechanisms (i–iii) as described in King et al. (2018), (i) USGS, (ii) GCMT, (iii) Geofon, and (iv) from Hejrani & Tkalcic (2018); (b) graph of along-rupture vertical displacement measurements and net slip calculated from available data averaged over 0.5 km increments.
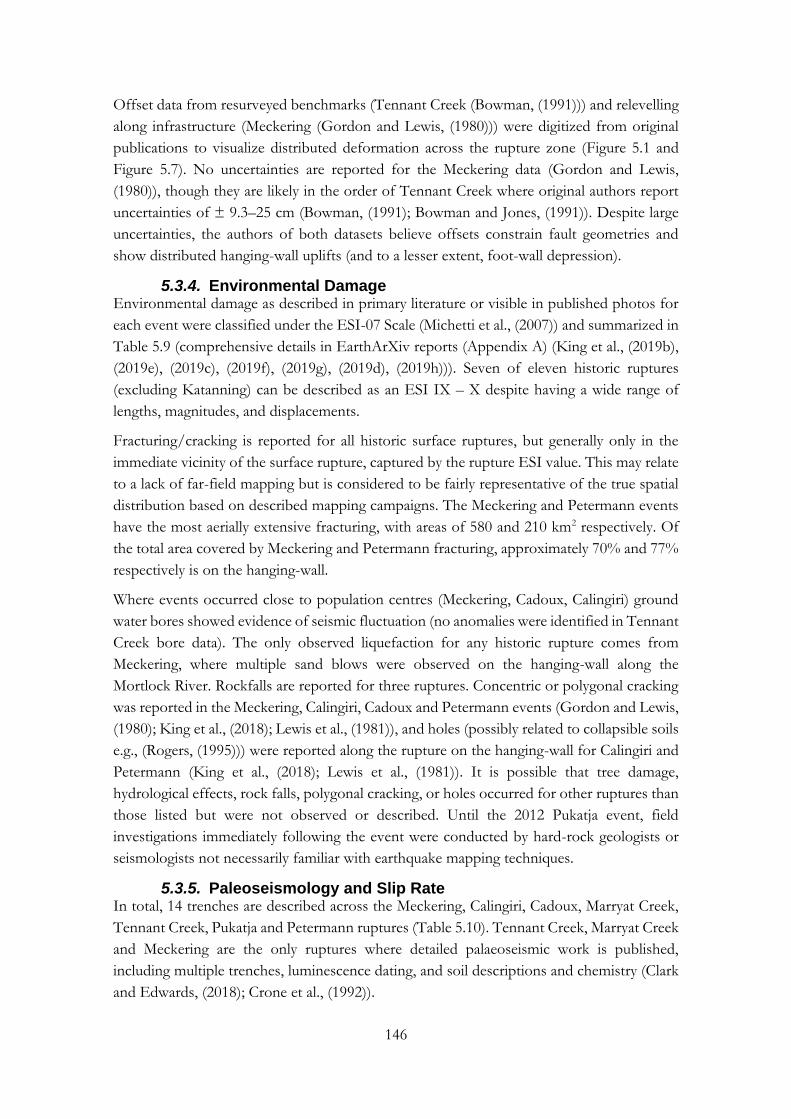
146
Offset data from resurveyed benchmarks (Tennant Creek (Bowman, (1991))) and relevelling
along infrastructure (Meckering (Gordon and Lewis, (1980))) were digitized from original
publications to visualize distributed deformation across the rupture zone (Figure 5.1 and
Figure 5.7). No uncertainties are reported for the Meckering data (Gordon and Lewis,
(1980)), though they are likely in the order of Tennant Creek where original authors report
uncertainties of ± 9.3–25 cm (Bowman, (1991); Bowman and Jones, (1991)). Despite large
uncertainties, the authors of both datasets believe offsets constrain fault geometries and
show distributed hanging-wall uplifts (and to a lesser extent, foot-wall depression).
5.3.4. Environmental Damage Environmental damage as described in primary literature or visible in published photos for
each event were classified under the ESI-07 Scale (Michetti et al., (2007)) and summarized in
Table 5.9 (comprehensive details in EarthArXiv reports (Appendix A) (King et al., (2019b),
(2019e), (2019c), (2019f), (2019g), (2019d), (2019h))). Seven of eleven historic ruptures
(excluding Katanning) can be described as an ESI IX – X despite having a wide range of
lengths, magnitudes, and displacements.
Fracturing/cracking is reported for all historic surface ruptures, but generally only in the
immediate vicinity of the surface rupture, captured by the rupture ESI value. This may relate
to a lack of far-field mapping but is considered to be fairly representative of the true spatial
distribution based on described mapping campaigns. The Meckering and Petermann events
have the most aerially extensive fracturing, with areas of 580 and 210 km2 respectively. Of
the total area covered by Meckering and Petermann fracturing, approximately 70% and 77%
respectively is on the hanging-wall.
Where events occurred close to population centres (Meckering, Cadoux, Calingiri) ground
water bores showed evidence of seismic fluctuation (no anomalies were identified in Tennant
Creek bore data). The only observed liquefaction for any historic rupture comes from
Meckering, where multiple sand blows were observed on the hanging-wall along the
Mortlock River. Rockfalls are reported for three ruptures. Concentric or polygonal cracking
was reported in the Meckering, Calingiri, Cadoux and Petermann events (Gordon and Lewis,
(1980); King et al., (2018); Lewis et al., (1981)), and holes (possibly related to collapsible soils
e.g., (Rogers, (1995))) were reported along the rupture on the hanging-wall for Calingiri and
Petermann (King et al., (2018); Lewis et al., (1981)). It is possible that tree damage,
hydrological effects, rock falls, polygonal cracking, or holes occurred for other ruptures than
those listed but were not observed or described. Until the 2012 Pukatja event, field
investigations immediately following the event were conducted by hard-rock geologists or
seismologists not necessarily familiar with earthquake mapping techniques.
5.3.5. Paleoseismology and Slip Rate In total, 14 trenches are described across the Meckering, Calingiri, Cadoux, Marryat Creek,
Tennant Creek, Pukatja and Petermann ruptures (Table 5.10). Tennant Creek, Marryat Creek
and Meckering are the only ruptures where detailed palaeoseismic work is published,
including multiple trenches, luminescence dating, and soil descriptions and chemistry (Clark
and Edwards, (2018); Crone et al., (1992)).
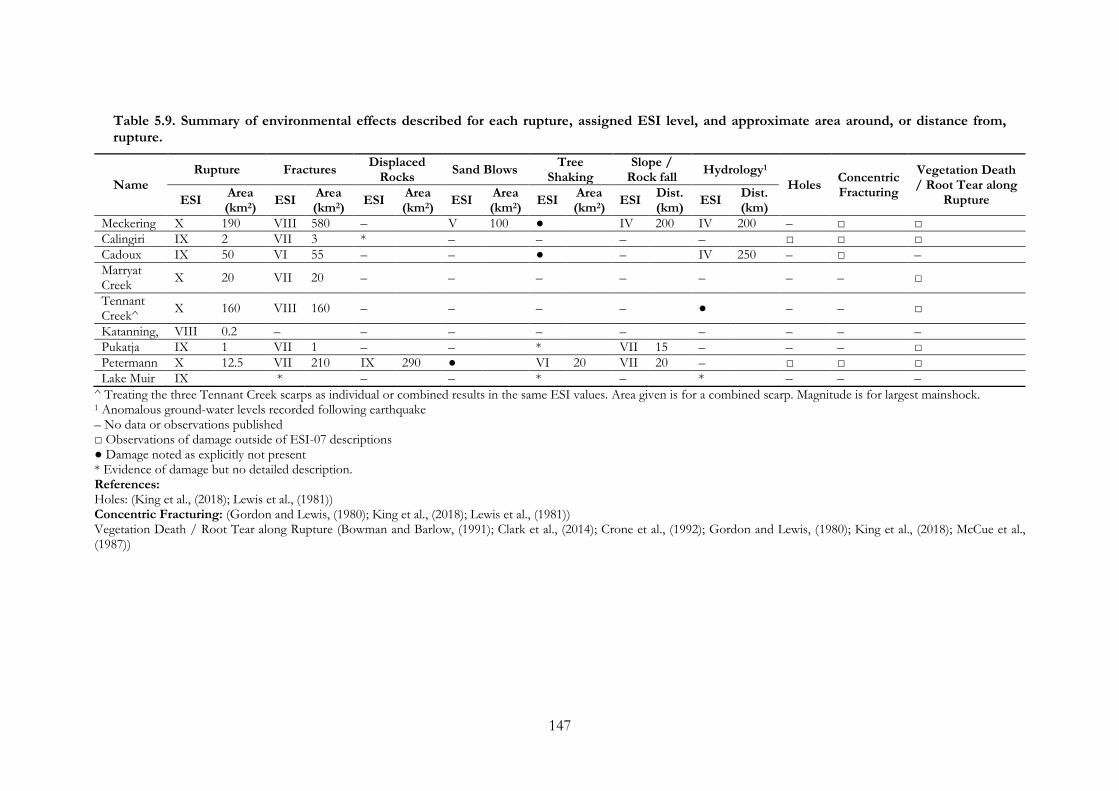
147
Table 5.9. Summary of environmental effects described for each rupture, assigned ESI level, and approximate area around, or distance from, rupture.
Name
Rupture Fractures Displaced
Rocks Sand Blows
Tree Shaking
Slope / Rock fall
Hydrology1
Holes Concentric Fracturing
Vegetation Death / Root Tear along
Rupture ESI Area (km2)
ESI Area (km2)
ESI Area (km2)
ESI Area (km2)
ESI Area (km2)
ESI Dist. (km)
ESI Dist. (km)
Meckering X 190 VIII 580 – V 100 ● IV 200 IV 200 – □ □
Calingiri IX 2 VII 3 * – – – – □ □ □
Cadoux IX 50 VI 55 – – ● – IV 250 – □ –
Marryat Creek
X 20 VII 20 – – – – – – – □
Tennant Creek^
X 160 VIII 160 – – – – ● – – □
Katanning, VIII 0.2 – – – – – – – – –
Pukatja IX 1 VII 1 – – * VII 15 – – – □
Petermann X 12.5 VII 210 IX 290 ● VI 20 VII 20 – □ □ □
Lake Muir IX * – – * – * – – –
^ Treating the three Tennant Creek scarps as individual or combined results in the same ESI values. Area given is for a combined scarp. Magnitude is for largest mainshock. 1 Anomalous ground-water levels recorded following earthquake – No data or observations published □ Observations of damage outside of ESI-07 descriptions ● Damage noted as explicitly not present * Evidence of damage but no detailed description. References: Holes: (King et al., (2018); Lewis et al., (1981)) Concentric Fracturing: (Gordon and Lewis, (1980); King et al., (2018); Lewis et al., (1981)) Vegetation Death / Root Tear along Rupture (Bowman and Barlow, (1991); Clark et al., (2014); Crone et al., (1992); Gordon and Lewis, (1980); King et al., (2018); McCue et al., (1987))

148
Table 5.10. Summary of available paleoseismic trenching.
Rupture Location
Bedrock Sediments Pre-existing: Possible Rup. Since 100ka
Desc. Age Depth (m) (HW/FW)
Desc. Age* Cenozoic
Offset Bedrock Offset
Meckering 1 Tributary of river Not exposed >3 Fluvial sands Late Pleistocene
No No N
Meckering 2 Farmland Altered granite Archean <1.5 Ferricrete / sand T? / Holocene
No Maybe1 N
Calingiri No Maybe1
Cadoux / Carter scarp
Farmland Altered granite Archean <0.5 Sand / soil Q? No No
Cadoux / Tank scarp
Farmland Granite Archean 0? No No
Marryat Creek west
10m N of dry creek
Altered gneiss Proterozoic <0.3 Ferricrete / eolian sand
T? / < 130 ka
No No N
Marryat Creek south
‘Near’ dry creek Altered greenstone
Proterozoic <1.25 Ferricrete / gravel, eolian sand
T? / < 130 ka
No No N
Kunayungku Max vert. disp. Altered sedimentary rock
Cambrian? <2 Ferricrete / eolian sand
T? / < 30 ka
No No N
Lake Surprise east
Max vert. disp. Not exposed >2 Ferricrete / eolian sand
T? / < 46 ka
No No N
Lake Surprise west 1
Monoclinal rupture (near quartz ridge)
Altered “iron-rich quartzite”
Cambrian? <0.5 / >2 Gravel / eolian sand Q / < 50 ka
No Yes3 Y
Lake Surprise west 2
Discrete rupture (375m E LSW-1)
Altered “hematitic quartzite”
Cambrian? <0.5 / >0.7
Ferricrete / gravel / eolian sand
T? /Q /< 50ka
Maybe2 Yes3 Y
Pukatja Max. vert. disp. Not exposed >1.5 Sand ~ 104 - 105 No No Y
Petermann 1 Paleovalley Not exposed >1.5 Calcrete / eolian sand T? / Q No No N
Petermann 2 Inter-dune region Not exposed >1.5 Calcrete / eolian sand T? / Q No No N
* ages in bold from direct dating in literature, italics inferred based on nearby dating, underline from estimate in literature, “T?” or “Q?” estimated Tertiary or Quaternary 1 Thicker soil horizons described on foot-wall relative to hanging-wall (Gordon and Lewis, (1980)) 2 Fissure of potentially seismic origin filled with gravel, overlain by eolian sand; fracture through ferricrete overlain by gravel and eolian sand (Crone et al., (1992)) 3 Authors propose three possible origins: earthquake rupture bedrock offset; paleochannel along pre-existing bedrock structure; or combination of both; paleotopography greater than twice the height of historic slip (Crone et al., (1992)).
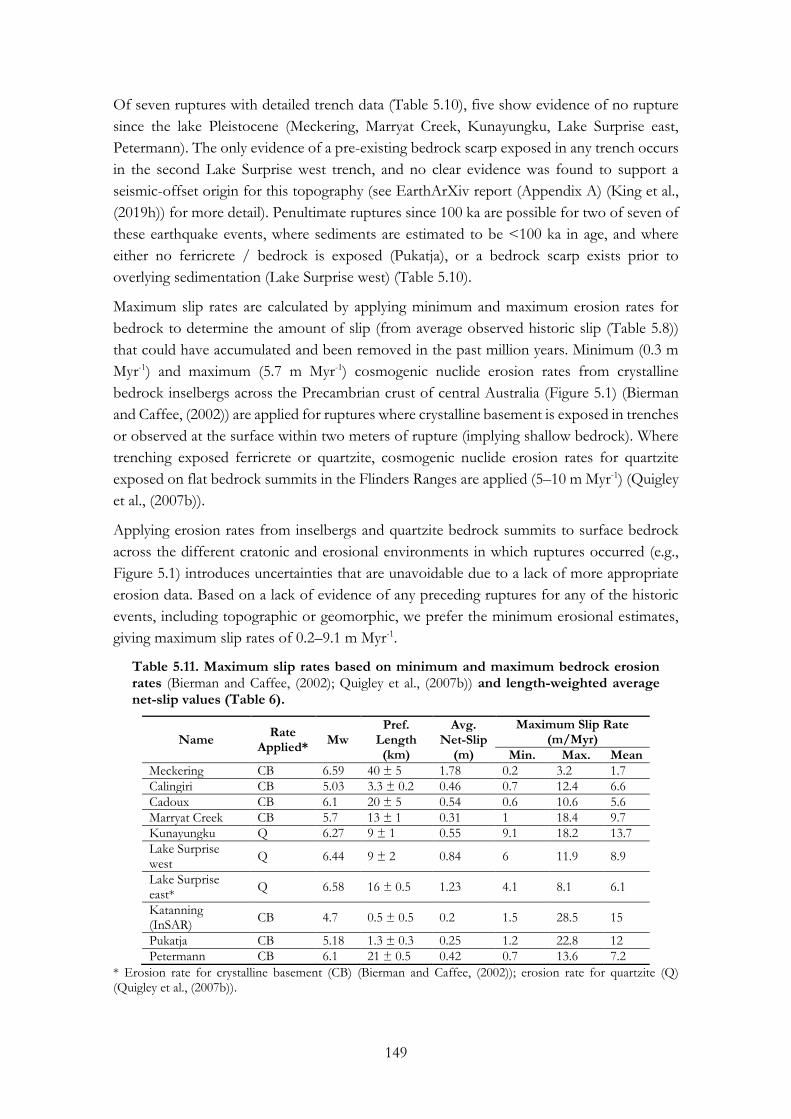
149
Of seven ruptures with detailed trench data (Table 5.10), five show evidence of no rupture
since the lake Pleistocene (Meckering, Marryat Creek, Kunayungku, Lake Surprise east,
Petermann). The only evidence of a pre-existing bedrock scarp exposed in any trench occurs
in the second Lake Surprise west trench, and no clear evidence was found to support a
seismic-offset origin for this topography (see EarthArXiv report (Appendix A) (King et al.,
(2019h)) for more detail). Penultimate ruptures since 100 ka are possible for two of seven of
these earthquake events, where sediments are estimated to be <100 ka in age, and where
either no ferricrete / bedrock is exposed (Pukatja), or a bedrock scarp exists prior to
overlying sedimentation (Lake Surprise west) (Table 5.10).
Maximum slip rates are calculated by applying minimum and maximum erosion rates for
bedrock to determine the amount of slip (from average observed historic slip (Table 5.8))
that could have accumulated and been removed in the past million years. Minimum (0.3 m
Myr-1) and maximum (5.7 m Myr-1) cosmogenic nuclide erosion rates from crystalline
bedrock inselbergs across the Precambrian crust of central Australia (Figure 5.1) (Bierman
and Caffee, (2002)) are applied for ruptures where crystalline basement is exposed in trenches
or observed at the surface within two meters of rupture (implying shallow bedrock). Where
trenching exposed ferricrete or quartzite, cosmogenic nuclide erosion rates for quartzite
exposed on flat bedrock summits in the Flinders Ranges are applied (5–10 m Myr-1) (Quigley
et al., (2007b)).
Applying erosion rates from inselbergs and quartzite bedrock summits to surface bedrock
across the different cratonic and erosional environments in which ruptures occurred (e.g.,
Figure 5.1) introduces uncertainties that are unavoidable due to a lack of more appropriate
erosion data. Based on a lack of evidence of any preceding ruptures for any of the historic
events, including topographic or geomorphic, we prefer the minimum erosional estimates,
giving maximum slip rates of 0.2–9.1 m Myr-1.
Table 5.11. Maximum slip rates based on minimum and maximum bedrock erosion rates (Bierman and Caffee, (2002); Quigley et al., (2007b)) and length-weighted average net-slip values (Table 6).
Name Rate
Applied* Mw
Pref. Length (km)
Avg. Net-Slip
(m)
Maximum Slip Rate (m/Myr)
Min. Max. Mean
Meckering CB 6.59 40 ± 5 1.78 0.2 3.2 1.7
Calingiri CB 5.03 3.3 ± 0.2 0.46 0.7 12.4 6.6
Cadoux CB 6.1 20 ± 5 0.54 0.6 10.6 5.6
Marryat Creek CB 5.7 13 ± 1 0.31 1 18.4 9.7
Kunayungku Q 6.27 9 ± 1 0.55 9.1 18.2 13.7
Lake Surprise west
Q 6.44 9 ± 2 0.84 6 11.9 8.9
Lake Surprise east*
Q 6.58 16 ± 0.5 1.23 4.1 8.1 6.1
Katanning (InSAR)
CB 4.7 0.5 ± 0.5 0.2 1.5 28.5 15
Pukatja CB 5.18 1.3 ± 0.3 0.25 1.2 22.8 12
Petermann CB 6.1 21 ± 0.5 0.42 0.7 13.6 7.2
* Erosion rate for crystalline basement (CB) (Bierman and Caffee, (2002)); erosion rate for quartzite (Q) (Quigley et al., (2007b)).

150
5.4. Discussion-Lessons from the Last 50 Years of Australian Surface Ruptures
5.4.1. Inconsistencies in Data Use A number of inconsistent uses of data were found while reviewing papers that reference
primary sources, as summarized below:
• Some of the original Marryat Creek vertical offset measurements are reproduced
incorrectly in subsequent publications (Machette et al., (1993); Wesnousky, (2008)).
We recommend referring to the original source (Bowman and Barlow, (1991)) or the
data tables from this paper.
• Limbs of the Marryat Creek rupture show sinistral (west limb) and dextral (south
limb) components due to SW over NE directed uplift along an arcuate rupture (best
described as three faults, Figure 5.2 and Figure 5.6). Data tables used in subsequent
scaling relationships (Wells and Coppersmith, (1994)) describe the event as left-lateral
based on one of three published focal mechanisms. We recommend a dominantly
reverse mechanism for this event based on all available data.
• We recommend referring to the original source of the Calingiri focal mechanism
(Fitch et al., (1973)) when describing kinematics and preferred rupture plane
geometry, as subsequent authors (Gordon and Lewis, (1980)) appear to misread the
mechanism (King et al., (2019e)).
• The Tennant Creek rupture has been treated by multiple authors as a single rupture
length for fault scaling relationships (Biasi and Wesnousky, (2017), (2016); Johnston
et al., (1994); Mcpherson et al., (2014); Wesnousky, (2008)) and hazard mapping
(Allen et al., (2018a), (2018b); Clark et al., (2016)) as opposed to three separate
earthquakes and associated ruptures (Boncio et al., (2018); Leonard, (2010); Moss
and Ross, (2011); Wells and Coppersmith, (1994)), a decision which significantly
changes the length to magnitude ratio and slip distribution relative to an averaged
epicentre location and magnitude.
• An instance of the above decision is seen where a 6 km step over between Tennant
Creek scarps is identified as an outlier for reverse fault data (Wesnousky, (2008)). The
rupture length and complexity for this event is not anomalous if treated as three
separate events.
• Some scaling relationships (e.g., (Wesnousky, (2008))) define only a portion of the
Cadoux scarp (the 10km long Robb Scarp), due to “insufficient mapping” of the
northern ~ 6 km. The full rupture includes one step-over that fits the publication
analysis criteria (> 1km) but is not represented in the original paper’s database
(Wesnousky, (2008)) and subsequent work (Biasi and Wesnousky, (2017), (2016);
Lavrentiadis and Abrahamson, (2019)). Mapping of the Cadoux rupture was
thorough, but uncertainty regarding which of the mapped scarps (if any) represent
the Cadoux mainshock fault complicates the use of this event in scaling relationships.
• A slip rate of 0.005 mm/yr is used to describe the Marryat Creek scarp (Anderson et
al., (2017)). This value is likely derived from ~ 0.5 m measured historic slip in a trench

151
with no evidence of prior rupture between deposition of Quaternary sediments
(estimated age from primary source < 130 ka (Crone et al., (1992))) and formation
of the structure along which the modern event ruptured (Proterozoic) (Machette et
al., (1993)). While evidence of prior Quaternary–Tertiary rupture may have been
removed by erosion, a slip rate of 0.5 m per 100,000 years is unsupported by available
evidence.
• The recently published NSHA18 applies slip rates of 4–8 m / Myr for the historic
ruptures discussed in this paper (Allen et al., (2018a), (2018b)). No historic surface
ruptures provide convincing evidence of rupture between deposition of Quaternary
sediments (50 ka to late Pleistocene) and formation of the host structure (Archean–
Cambrian). At least for cratonic areas of Australia (Figure 5.1), questions arise as to
whether historically seismogenic faults are recurrent at all, or if long-term seismic
release may be hosted across unique basement structures (e.g., (Calais et al., (2016))),
as well as on recurrent structures (e.g., Lort River, Hyden, Dumbleyung (Clark et al.,
(2011b), (2008); Crone et al., (2003))). We recommend caution in applying these rates
in future work.
5.4.2. Surface rupture Bedrock Controls, Updated Datasets and Environmental Intensity
Analysis of geology and reanalysis of mapped ruptures presented in this paper suggest that
in four of the ten events studied (Meckering, Marryat Creek, Cadoux and Peterman) rupture
propagated across 2–6 bedrock-controlled faults (e.g., pre-existing fractures and/or foliation
planes and/or lithological boundaries and/or intrusive boundaries), and nine of ten events
show strong basement controls on rupture location and orientation. Simplistic projection of
surface defined faults using our preferred dips results in faults intersecting at depths that are
consistent with published centroid depths (e.g., < 4 km) in three of the four events with
more than one fault defined (Petermann excluded). In all four cases, fault intersections
project up-dip to the area of maximum vertical offset (in the case of Petermann, maximum
dip occurs where the two faults overlap). It is uncertain with available seismic data whether
hypocentres align with these projected fault intersections, and more data would be required
to show that surface defined faults can be extended to depth along planar slip zones.
However, linear geophysical anomalies in many cases show ruptures associated with
basement conjugate fracture/dike orientations underlying rupture, suggesting strong control
of the crustal architecture on intraplate earthquake nucleation and/or propagation.
New length, dip, and net-slip data presented for historic ruptures are derived by applying
consistent framework and methodology. Past scaling relationships have included and
excluded Australian surface rupturing events inconsistently, generally without clear
explanation. They have also relied on vertical offset measurements as most of the original
publications do not calculate net-slip. Length-weighted averages of net-slip values calculated
in this paper are 32%–67 % larger than those for vertical offset data, and maximum net-slip
is 68%–89% higher than maximum vertical offset. This suggests that Australian events may
be systematically misrepresented in past scaling relationships. Our new data, compiled by
thorough analysis of available seismological and field data, and coupled with the recent
152
revision of magnitude values (Allen et al., (2018c)), will facilitate more consistent integration
of Australian events into earthquake catalogues and displacement-length scaling
relationships.
In Table 5.12 we compare the calculated Mw, area and average displacement from SCR dip-
slip scaling relationships of (Leonard, (2014)) using the surface rupture length used in
developing the scaling relationships with the length from this paper. Table 5.12 then
compares the difference between calculated average displacement and magnitude as derived
using length of this paper and SCR dip-slip scaling relationship (Leonard, (2014)) with the
average net slip derived from this paper, and update Mw values (Allen et al., (2018c)). Results
show differences of over 600% between scaling relationship average displacement and
calculated average net slip values of this paper, and up to 18.7% difference in calculated Mw
and updated values (Allen et al., (2018c)). This highlights the need to investigate length,
magnitude, and net-slip inputs of previous scaling relationships.
Most vertical displacement data for historic surface ruptures are collected as spot-height
measurements of foot-wall elevation relative to hanging-wall elevation proximal to the
surface trace. Less frequently, scarp perpendicular profiles are captured 5–50 m either side
of the rupture. Satellite-based imaging of recent scarps (Petermann (Gold et al., (2017),
(2019); Polcari et al., (2018)), Katanning (Dawson et al., (2008)), Lake Muir ( (Clark et al.,
(2019)))) shows permanent distributed displacement of the hanging-wall, and to a lesser
degree of the foot-wall that is not captured by these spot-heights and short traverses.
Specifically, InSAR imaging shows distributed deformation extending hundreds of metres to
kilometres perpendicular to surface scarps (Gold et al., (2019)), and extending along-strike
for kilometres beyond the surface rupture detectable in the field (Clark et al., (2019); Dawson
et al., (2008); Gold et al., (2019)). This is particularly the case for smaller earthquakes
(Katanning (Dawson et al., (2008)) (Figure 5.8) and Lake Muir (in review (Clark et al.,
(2019)))), where the rupture ellipse only partially intersects the surface. Without these satellite
derived deformation imaging techniques, the degree to which field observations and spot-
height measurements along the visible surface rupture underestimate the length, height and
width of surface deformation along a fault cannot be quantified.
Digitized offset data from resurveyed benchmarks across the Tennant Creek (Figure 5.7),
Meckering (Figure 5.3) and Cadoux (EarthArXiv report (Appendix A) (King et al., (2019c)))
ruptures provide evidence of distributed hanging-wall offset, though published uncertainties
are on the order of measured offsets and data should be interpreted with caution. This data
cannot be improved upon within the resolution of pre-deformation height data but suggests
that the deformation envelope extends beyond the discrete surface rupture, and offset
measurements as presented in Figure 5.3, Figure 5.4, Figure 5.5, Figure 5.6, Figure 5.7, Figure
5.8, Figure 5.9, and Figure 5.10 may underestimate the true total vertical displacement values
for each event. The ratio of distributed deformation to discrete deformation at a rupture tip
might be expected to be larger for surface rupture segments that are more modest in vertical
displacement, or cut through relatively more weathered regolith or thicker sedimentary
deposits, as much of the initial deformation will be taken up as folding prior to the emergence
of the fault tip (Finch et al., (2003)).
153
This paper reviews primary literature to identify environmental earthquake effects (EEEs)
for the purposes of applying the ESI-07 Scale (Michetti et al., (2007); Serva, (2019)) to
Australian surface rupturing earthquakes. We find that the majority of environmental damage
is observed in the immediate rupture zone, with the exception of rare rockfalls in prone-
areas (e.g., road cuttings) at distances of ~200 km, and rare ground-water fluctuations up to
250 km away for some but not all events where ground water data was investigated. While
this dataset likely does not capture the full range of potential ESI values and affected area
due to sparse reporting of EEEs in the literature, it does provide a basis for comparing the
maximum ESI and magnitude of reverse earthquakes in intraplate, low-topography, near-
surface crystalline bedrock (in most cases), and generally arid settings against events in
tectonically and geomorphically diverse regions (e.g., (Ahmad et al., (2014); Audemard M. et
al., (2015); Giner-Robles et al., (2015); Heddar et al., (2016); Nappi et al., (2017); Porfido et
al., (2015); Reicherter et al., (2009); Sanchez and Maldonado, (2016); Serva et al., (2016))).
5.4.3. Recurrence of Historic Surface Ruptures and Implications for Hazard Modelling
In the fifty years between 1968 and 2018, eleven moderate magnitude reverse earthquakes
caused surface ruptures in cratonic Australian. Nine of the ten events analysed show evidence
of rupture along pre-existing structures with little to no evidence of prior Neotectonic
movement. While this does not preclude the possibility that evidence of prior rupture was
removed prior to the late Pleistocene, the lack of topographic or geomorphic evidence
supporting repeated rupture suggests historic surface ruptures may have occurred on faults
that could be considered previously inactive in the Neotectonic period (e.g., (Calais et al.,
(2016))).
It is unclear whether the historic surface rupturing faults have entered a period of activity
and will host future Neotectonic earthquakes, have occurred as isolated events, or have such
long recurrence intervals as to obscure all evidence of prior rupture. Paleoseismic work
across the Precambrian SCR crust (Figure 5.1) has shown that faults in similar settings as the
historic ruptures have hosted multiple Neotectonic earthquakes (Clark et al., (2011b), (2008);
Crone et al., (2003)), with available dating indicating long recurrence (> 30–70 ka (Crone et
al., (2003))), and low topography indicating erosion may outpace seismic slip-rate. In
contrast, paleoseismic investigations in the Phanerozoic non-extended crust of eastern
Australia identify multiple faults with recurrence frequent enough to maintain topography
(Clark et al., (2012), (2011b), (2011a); Hillis et al., (2008); Quigley et al., (2010), (2007b)),
despite no historic surface rupturing or large earthquakes in this part of the continent.
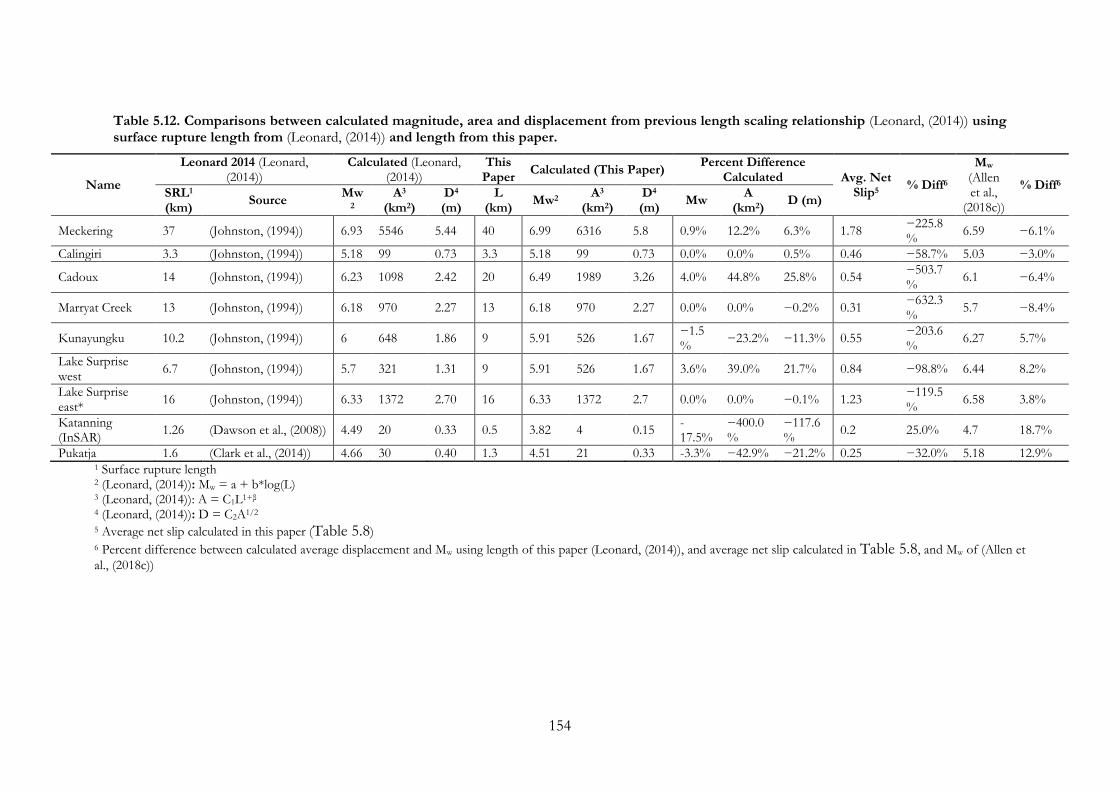
154
Table 5.12. Comparisons between calculated magnitude, area and displacement from previous length scaling relationship (Leonard, (2014)) using surface rupture length from (Leonard, (2014)) and length from this paper.
Name
Leonard 2014 (Leonard, (2014))
Calculated (Leonard, (2014))
This Paper
Calculated (This Paper) Percent Difference
Calculated Avg. Net Slip5
% Diff6
Mw (Allen et al.,
(2018c))
% Diff6 SRL1 (km)
Source Mw
2 A3
(km2) D4 (m)
L (km)
Mw2 A3
(km2) D4 (m)
Mw A
(km2) D (m)
Meckering 37 (Johnston, (1994)) 6.93 5546 5.44 40 6.99 6316 5.8 0.9% 12.2% 6.3% 1.78 −225.8%
6.59 −6.1%
Calingiri 3.3 (Johnston, (1994)) 5.18 99 0.73 3.3 5.18 99 0.73 0.0% 0.0% 0.5% 0.46 −58.7% 5.03 −3.0%
Cadoux 14 (Johnston, (1994)) 6.23 1098 2.42 20 6.49 1989 3.26 4.0% 44.8% 25.8% 0.54 −503.7%
6.1 −6.4%
Marryat Creek 13 (Johnston, (1994)) 6.18 970 2.27 13 6.18 970 2.27 0.0% 0.0% −0.2% 0.31 −632.3%
5.7 −8.4%
Kunayungku 10.2 (Johnston, (1994)) 6 648 1.86 9 5.91 526 1.67 −1.5%
−23.2% −11.3% 0.55 −203.6%
6.27 5.7%
Lake Surprise west
6.7 (Johnston, (1994)) 5.7 321 1.31 9 5.91 526 1.67 3.6% 39.0% 21.7% 0.84 −98.8% 6.44 8.2%
Lake Surprise east*
16 (Johnston, (1994)) 6.33 1372 2.70 16 6.33 1372 2.7 0.0% 0.0% −0.1% 1.23 −119.5%
6.58 3.8%
Katanning (InSAR)
1.26 (Dawson et al., (2008)) 4.49 20 0.33 0.5 3.82 4 0.15 -17.5%
−400.0%
−117.6%
0.2 25.0% 4.7 18.7%
Pukatja 1.6 (Clark et al., (2014)) 4.66 30 0.40 1.3 4.51 21 0.33 -3.3% −42.9% −21.2% 0.25 −32.0% 5.18 12.9% 1 Surface rupture length 2 (Leonard, (2014)): Mw = a + b*log(L) 3 (Leonard, (2014)): A = C1L1+β 4 (Leonard, (2014)): D = C2A1/2
5 Average net slip calculated in this paper (Table 5.8) 6 Percent difference between calculated average displacement and Mw using length of this paper (Leonard, (2014)), and average net slip calculated in Table 5.8, and Mw of (Allen et
al., (2018c))

155
Historic surface rupture kinematics are all consistent with SHmax (as measured from bore-hole
breakouts, drilling induce fractures, and focal mechanisms (Rajabi et al., (2017b))) either
directly (e.g., a straight fault perpendicular to SHmax) or indirectly (e.g., rupture occurred along
multiple faults, some of which are aligned oblique to SHmax, but uplift of the hanging-wall
block is perpendicular to SHmax). The past fifty years of historic surface rupturing events show
that in the Precambrian non-extended crust, basement with at least one set of linear
structures aligned with SHmax, or multiple conjugate basement structures, could host a shallow
moderate magnitude surface rupturing earthquake along one or multiple (in these cases,
previously unrecognized and typically unrecognizable) faults. Eight of eleven surface
rupturing earthquakes have occurred in areas of (or proximal to) preceding seismicity, while
three (Petermann, Pukatja and Marryat Creek) occurred in areas with low historic seismicity,
though instrument density limits the magnitude of completeness and location accuracy and
precision of the historic earthquake catalogue in these locations. This suggests that spatially
smoothed (distributed) seismicity models may provide the best utility for seismic hazard
analyses in the central and western parts of Australia (e.g., (Griffin et al., (2017))). This is also
relevant for assessments of earthquake hazard in Precambrian intraplate crust elsewhere (e.g.,
Canada (Adams et al., (1992); Bent, (1994); Mitchell et al., (2010))). Further work is required
to understand tentative correlations between seismogenic potential and large geophysical
anomalies and/or Moho discontinuities (e.g., (Beekman et al., (1997); Sandiford and Egholm,
(2008))), and whether transient local stress perturbations increase the potential for shallow
seismicity (e.g., changes in pore-fluid pressure (Wang et al., (2019)) or surface load variations
(Calais et al., (2016)))
The historic earthquake catalogue for Australia is complete for ML > 5.5 since 1910, and ML
> 5.0 since 1960 (Leonard, (2008)). The magnitude values of historic earthquakes were
recently revised (Allen et al., (2018c)). This new catalogue contains seven MW > 5.5 on-shore
earthquakes within the Precambrian non-extended crust that are not related to the historic
surface rupturing events, and only one onshore event in the eastern Phanerozoic crust
(Figure 5.1). The Precambrian crustal events include: four events (1941 Mw 5.6, 5.9, 6.5, and
1972 Mw 5.6) in the Simpson Desert NT (Denham et al., (1979); Doyle et al., (1968);
Everingham and Smith, (1979)), one event (1970 Mw 5.9) within the Lake Mackay WA
sequence (20 events Mw 4.5–5.5 between 1970–1992) (Cleary and Simpson, (1971); Denham
et al., (1979); Everingham and Smith, (1979); Fitch et al., (1973)), one event 200 km south of
Warburton WA (1975 Mw 5.6), and the 1941 Mw 6.8 Meeberrie WA event—Australia’s largest
recorded onshore earthquake (Figure 5.1). No surface ruptures have been identified for these
events. While depths are poorly constrained due to poor instrumental density, estimates
range from 7–33 km (Allen et al., (2018c); Denham et al., (1979)), deeper than the best
estimates of depth for surface rupturing events (1–4 km for centroids, < 6 km for
hypocentral / base of fault depth). This suggests that moderate magnitude and potentially
damaging earthquakes (e.g., Mw >5.5) can be generated at depths of up to 33 km within the
Precambrian non-extended crust, providing another source of hazard that cannot be
effectively captured by active-fault catalogues in seismic hazard analysis.
156
5.5. Conclusions
We provide new length, dip, and net-slip data derived using a consistent framework and
methodology in order to facilitate more consistent integration of Australian events into
earthquake catalogues and displacement-length scaling relationships. Our reanalysis of
primary data from 67 publications on ten of eleven historical surface rupturing earthquakes
in Australia shows:
Surface rupture fault orientations aligned with basement structures identified in proximal
surface outcrops (foliations ± quartz veins ± intrusive boundaries ± pre-existing faults) and
linear geophysical anomalies;
Ruptures involve 1–6 discrete faults based on reanalysis of surface rupture lengths using
consistent criteria, with evidence that intersecting basement structures may control rupture
initiation and/or propagation;
• Large aleatoric and epistemic uncertainties in seismological data, related to a sparse
seismic network, limit determination of hypocentre and fault interaction, rupture
propagation, and assessment of whether surface ruptures project to seismogenic
depths along planar principle slip zones or whether rupture propagates to multiple
basement structures in the near-surface;
• Available analyses of rupture centroids (seven of ten events) show depths of 1–4 km
indicating predominately shallow seismic moment release;
• None of the historic surfacing rupturing events have unambiguous geological or
geomorphic evidence for preceding earthquakes on the same faults, with five events
showing an absence of rupture since at least the late Pleistocene;
• Within the constraints of available basement erosion rates, preferred maximum slip
rates are 0.2–9.1 m Myr-1 with an estimated minimum epistemic uncertainty of at least
one order of magnitude lower. These are considered applicable only within the non-
extended Precambrian crust in which all historic surface ruptures have occurred;
• ESI-07 estimates range by ± 3 classes in each earthquake and provide new maximum
ESI vs. magnitude data for comparison between different tectonic and geomorphic
settings.
.
157
CHAPTER 6. CONCLUSIONS
This thesis explores various ways in which observations from surface rupturing earthquakes
help constrain (i) the geometry of seismogenic faults (ii) the intensity and directionality of
near-field strong ground motions and (iii) recurrence history, particularly within cratonic
Australian landscapes.
Chapter 2 presents the first application of the Environmental Seismic Intensity Scale (ESI-
07) within Australia, and for an arid intraplate earthquake, to quantify the intensity of shaking
as observed by environmental earthquake effects. Damage is found to intensify with
proximity to the surface rupture rather than the epicentre. The distribution of damage also
shows clear asymmetry across the surface rupture, with shaking intensity extending further
on the hanging-wall due to geometrical effects of the reverse fault rupture.
Chapter 3 presents the first study that systematically documents displaced rocks both across
and along rupture to understand the distribution, directivity and distances of coseismic rock
displacement. It is also the first study that documents displaced rocks sourced from in-situ
bedrock outcrops rather than a soil-mantle, with results from flat outcrops demonstrating
that outcrop relief cannot be the primary determinant of chip directivity or distance. Data
are consistent with coseismic, complex, directional, seismically-generated displacement of
chips within the very near-field (less than 5 km) of this surface rupturing fault. They provide
a dense dataset of both along and across fault motions, as yet unrecorded instrumentally for
a reverse earthquake, to test available models for the polarisation of near-field strong ground
motions. Results show the chip displacements are most consistent with the expected
orientations of fling effects (one-sided pulse-like motions in instrumental records). The
displacement field, combined with instrumental (e.g. aftershock) and modelled (geometry of
the Woodroffe Thrust) data, offer insights into the hypocentral depth and location, and
rupture dynamics, in the absence of nearby seismic records.
Chapter 4 provides evidence of absence for prior rupture of the Petermann fault using
trench observations and cosmogenic nuclide erosion rates, and provides fine-scale mapping
of primary rupture and secondary fracturing resulting from the Petermann earthquake
incorporating a range of field, drone and remote-sensing data. The density, length and
distance of secondary fractures from primary rupture are found to correlate with surface
geology, consistent with numerical and sand-box models of idealised reverse earthquake
ruptures. Rupture through granular materials (e.g. dunes, alluvium), as opposed to bedrock-
dominated surface geology, results in wider deformation zones and/or no visibly observable
deformation at the surface. Additionally, surface deformation does not accurately preserve
the direction of σ1 relative to modelled regional SHMax orientation where rupture has travelled
through previously unruptured sediments. These observations have implications for
158
understanding the widths of deformation zones for reverse faults, important for hazard
analysis in the near-field of mapped active faults. Results from cosmogenic nuclide erosion
rate analysis and two trenches across the Petermann rupture show evidence of absence of a
prior rupture on the Petermann faults. This interpretation contributes to better
understanding the behaviour of intraplate fault systems, and raises questions as to how to
map future hazard where recurrence cannot be assumed.
Chapter 5 provides the first comprehensive reanalysis of all historic Australian surface
rupture data. Digitisation and analysis of available surface observation data results in new
length and net-slip datasets for use in magnitude – source – size – displacement scaling
equations. Analysis of available seismic data and surface rupture data suggests that five of
eleven historic events were the result of multi-fault ruptures (involving 2 to 6 faults). No
available paleoseismic, topographic or geomorphic evidence provides conclusive evidence
for prior neotectonic rupture on any of the historically surface rupturing faults. This chapter
provides consistent datasets for use in future global or Australian analyses of intraplate
and/or reverse and/or surface rupturing earthquakes. The observation that all surface
ruptures are aligned with pre-existing Precambrian bedrock structures, with no evidence of
prior events, provides new ideas regarding the behaviour of intraplate cratonic-region fault
systems, with implications for hazard assessments.
The insights presented in this thesis regarding the behaviour and recurrence of historic
Australian surface rupturing earthquakes have implications for how intraplate earthquakes
are understood to behave. Evidence from Australian earthquakes demonstrates that the
behaviour of intraplate faults in a stable continental region is heterogenous across different
cratonic regions. Therefore, there is unlikely to be a universal fault character across all
intraplate regions.
Understanding the limitations of Australian historic earthquake data and the heterogeneity
of Australian seismicity provides avenues for understanding the primary controls on how
and where strain is partitioned in an intraplate cratonic environment, broadening our
understanding of intraplate stress and its implication for the evolution of the crust.
Importantly, it also opens up questions about how best to model seismic hazard in an
‘intraplate’ region where earthquakes frequently show non-recurrent behaviour, occurring
seemingly as ‘one-off’ or first-of-their-kind events, with non-homogenous behaviour across
different cratonic environments.
This thesis provides new (i) data regarding the recurrence patterns of such earthquakes (ii)
insights into basement controls on these earthquakes (iii) ways for identifying past
earthquakes (iv) and methods to quantify seismic directionality behaviour common to reverse
earthquakes globally. These all contribute to how to best frame testable questions regarding
the why, what, when, where of such earthquakes, and how seismic hazard varies across
diverse tectonic and crustal environments.

159
REFERENCES
Aagaard, B., Hall, J.F., Heaton, T.H., (2004). Effects of Fault Dip and Slip Rake Angles on
Near-Source Ground Motions : Why Rupture Directivity Was Minimal in the 1999 Chi-Chi , Taiwan , Earthquake. Bulletin of the Seismological Society of America 94, 155–170.
Abrahamson, N.A., Donahue, J.L., (2013). Hanging-Wall Scaling using Finite-Fault Simulations. Pacific Earthquake Engineering Research Center, Berkeley, California.
Abrahamson, N.A., Somerville, P.G., (1996). Effects of the hanging wall and footwall on ground motions recorded during the Northridge earthquake. Bulletin of the Seismological Society of America 86, 93–99.
Adams, J., Percival, J.A., Wetmiller, R.J., Drysdale, J.A., Robertson, P.B., (1992). Geological controls on the 1989 Ungava surface rupture: a preliminary interpretationn (GSC Paper 92-1C), in: Current Research, Part C. Geological Survey of Canada, Ottawa, Canada, pp. 147–155. 10.4095/132858
Ahmad, B., Sana, H., Alam, A., (2014). Macroseismic intensity assessment of 1885 Baramulla Earthquake of northwestern Kashmir Himalaya, using the Environmental Seismic Intensity scale (ESI 2007). Quaternary International 321, 59–64. https://doi.org/10.1016/j.quaint.2014.04.064
Ali, Z., Qaisar, M., Mahmood, T., Shah, M.A., Iqbal, T., Serva, L., Michetti, A.M., Burton, P.W., (2009). The Muzaffarabad, Pakistan, earthquake of 8 October 2005: surface faulting, environmental effects and macroseismic intensity. Geological Society, London, Special Publications 316, 155–172. https://doi.org/10.1144/SP316.9
Allen, C.R., Brune, J.N., Cluff, L.S., Barrows, A.G., (1998). Evidence for unusually strong near-field ground motion on the hanging wall of the San Fernando Fault during the 1971 earthquake. Seismological Research Letters 69, 524–531.
Allen, T., (2012). Stochastic ground motion prediction equations for southeastern Australian earthquakes using updated source and attenuation parameters, Geoscience Australia.
Allen, T., Griffin, J., Clark, D., (2018a). The 2018 National Seismic Hazard Assessment: Model input files (GA Record 2018/032), 2018/32. ed. Geoscience Australia, Canberra, ACT. https://doi.org/10.11636/Record.2018.032
Allen, T., Griffin, J., Leonard, M., Clark, D., Ghasemi, H., (2018b). The 2018 National Seismic Hazard Assessment: Model overview (GA Record 2018/27). Geoscience Australia, Commonwealth of Australia, Canberra, Australia. https://doi.org/10.11636/Record.2018.027
Allen, T., Leonard, M., Collins, C., (2012). The 2012 Australian Seismic Hazard Map – Catalogue and Ground Motion Prediction Equations, in: Australian Earthquake Engineering Society 2011 Conference, 18-20 Nov., Barossa Valley, South Australia. pp. 18–20.
Allen, T., Leonard, M., Ghasemi, H., Gibson, G., (2018c). The 2018 National Seismic Hazard Assesment: Earthquake epicentre catalogue (GA Record 2018/30). Geoscience Australia, Commonwealth of Australia, Canberra, ACT. https://doi.org/10.11636/Record.2018.030
Anastasopoulos, I., Gazetas, G., (2007). Foundation-structure systems over a rupturing

160
normal fault: Part I. Observations after the Kocaeli 1999 earthquake. Bulletin of Earthquake Engineering 5, 253–275. https://doi.org/10.1007/s10518-007-9029-2
Anastasopoulos, I., Gazetas, G., Bransby, M.F., Davies, M.C.R., Nahas, A. El, (2007). Fault Rupture Propagation through Sand: Finite-Element Analysis and Validation through Centrifuge Experiments. Journal of Geotechnical and Geoenvironmental Engineering 133, 943–958. https://doi.org/10.1061/(ASCE)1090-0241(2007)133:8(943)
Anderson, J.G., Biasi, G.P., Wesnousky, S.G., (2017). Fault-scaling relationships depend on the average fault-slip rate. Bulletin of the Seismological Society of America 107, 2561–2577. https://doi.org/10.1785/0120160361
Anderson, J.G., Wesnousky, S.G., Stirling, M.W., (1996). Earthquake Size as a Function of Fault Slip Rate. Bulletin of the Seismological Society of America 86, 683–690.
Anooshehpoor, A., Brune, J.N., Zeng, Y., (2004). Methodology for Obtaining Constraints on Ground Motion from Precariously Balanced Rocks. Bulletin of the Seismological Society of America 94, 285–303. https://doi.org/10.1785/0120020242
Attanayake, J., King, T.R., Quigley, M.C., Gibson, G., Clark, D., Jones, A., Sandiford, M., (2019). Rupture Characteristics and the Structural Control of the 2016 Mwp 6.1 Intraplate Earthquake in the Petermann Ranges, Australia. Bulletin of the Seismological Society of America (in review).
Audemard M., F.A., Azuma, T., Baiocco, F., Baize, S., Blumetti, A.M., Brustia, E., Clague, J., Comerci, V., Esposito, E., Guerrieri, L., Gurpinar, A., Grutzner, C., Jin, K., Kim, Y.S., Kopsachilis, V., Lucarini, M., Mc Calpin, J., Michetti, A.M., Mohammadioun, B., Morner, N.A., Okumura, K., Ota, Y., Papathanassiou, G., Pavlides, S., Perez-Lopez, R., Porfido, S., Reicherter, K., Rodriquez-Pascua, M.A., Roghozhin, E., Scaramella, A., Serva, L., Silva, P.G., Sintubin, M., Tatevossian, R.E., Vittori, E., (2015). Earthquake Environmental Effect for seismic hazard assessment: the ESI intensity scale and the EEE Catalogue. Memorie Descrittive della Carta Geologica d’Italia 97, 1–181.
Baize, S., Nurminen, F., Sarmiento, A., Dawson, T., Takao, M., Scotti, O., Azuma, T., Boncio, P., Champenois, J., Cinti, F.R., Civico, R., Costa, C., Guerrieri, L., Marti, E., McCalpin, J., Okumura, K., Villamor, P., (2019). A Worldwide and Unified Database of Surface Ruptures (SURE) for Fault Displacement Hazard Analyses. Seismological Research Letters. https://doi.org/10.1785/0220190144
Balco, G., Stone, J.O., Lifton, N.A., Dunai, T.J., (2008). A complete and easily accessible means of calculating surface exposure ages or erosion rates from 10Be and 26Al measurements. Quaternary Geochronology 3, 174–195. https://doi.org/10.1016/j.quageo.2007.12.001
Balfour, N.J., Cummins, P.R., Pilia, S., Love, D., (2015). Localization of intraplate deformation through fluid-assisted faulting in the lower-crust: The Flinders Ranges, South Australia. Tectonophysics 655, 97–106. https://doi.org/10.1016/j.tecto.2015.05.014
Barlow, B.C., Denham, D., Jones, T., McCue, K., (1986). The Musgrave Ranges earthquake of March 30, 1986. Transactions of the Royal Society of South Australia 110, 187–189. https://doi.org/10.1126/science.97.2526.482-a
Beavan, J., Motagh, M., Fielding, E.J., Donnelly, N., Collett, D., (2012). Fault slip models of the 2010-2011 Canterbury, New Zealand, earthquakes from geodetic data and observations of postseismic ground deformation. New Zealand Journal of Geology and
161
Geophysics 55, 207–221. https://doi.org/10.1080/00288306.2012.697472
Beekman, F., Stephenson, R.A., Korsch, R.J., (1997). Mechanical stability of the Redbank Thrust Zone, Central Australia: Dynamic and rheological implications. Australian Journal of Earth Sciences 44, 215–226. https://doi.org/10.1080/08120099708728305
Bell, J.G., Kilgour, P.L., English, P.M., Woodgate, M.F., Lewis, S.J., Wischusen, J.D.H., (2012). WASANT Palaeovalley Map - Distribution of Palaeovalleys in Arid and Semi-arid WA-SA-NT. Geoscience Australia. http://pid.geoscience.gov.au/dataset/ga/73980
Bent, A.L., (1994). The 1989 (Ms 6.3) Ungava, Quebec, Earthquake: a Complex Intraplate Event. Bulletin of the Seismological Society of America 84, 1075–1088.
Biasi, G.P., Wesnousky, S.G., (2017). Bends and ends of surface ruptures. Bulletin of the Seismological Society of America 107, 2543–2560. https://doi.org/10.1785/0120160292
Biasi, G.P., Wesnousky, S.G., (2016). Steps and gaps in ground ruptures: Empirical bounds on rupture propagation. Bulletin of the Seismological Society of America 106, 1110–1124. https://doi.org/10.1785/0120150175
Bierman, P.R., Caffee, M.W., (2002). Cosmogenic exposure and erosion history of Australian bedrock landforms. Bulletin of the Geological Society of America 114, 787–803. https://doi.org/10.1130/0016-7606(2002)114<0787:CEAEHO>2.0.CO;2
Blight, D.F., Chin, R.J., Smith, R.A., Bunting, J.A., Elias, M., (1983). Bencubbin 1:250 000 Geological Map Sheet. Geological Survey of Western Australia, Perth, Australia.
Blumetti, A.M., Grützner, C., Guerrieri, L., Livio, F., Grutzner, C., Guerrieri, L., Livio, F., (2017). Quaternary earthquakes: Geology and palaeoseismology for seismic hazard assessment. Quaternary International 451, 1–10. https://doi.org/10.1016/j.quaint.2017.04.002
Boatwright, J., (2007). The persistence of directivity in small earthquakes. Bulletin of the Seismological Society of America 97, 1850–1861. https://doi.org/10.1785/0120050228
Bolt, B.A., Hansen, R.A., (1977). The upthrow of objects in earthquakes. Bulletin of the Seismological Society of America 67, 1415–1427.
Boncio, P., Liberi, F., Caldarella, M., Nurminen, F.C., (2018). Width of surface rupture zone for thrust earthquakes: Implications for earthquake fault zoning. Natural Hazards and Earth System Sciences 18, 241–256. https://doi.org/10.5194/nhess-18-241-2018
Bouniot, E., Jones, T., McCue, K., (1990). The pattern of 1987 sequence at Tennant Creek, NT, in: Gregson, P.J. (Ed.), Recent Intraplate Seismicity Studies Symposium, Perth Western Australia (BMR Record 1990/44). Bureau of Mineral Resources, Geology and Geophysics, Canberra, ACT.
Bowman, J.R., (1992). The 1988 Tennant Creek, Northern Territory, earthquakes: A synthesis. Australian Journal of Earth Sciences 39, 651–669. https://doi.org/10.1080/08120099208728056
Bowman, J.R., (1991). Geodetic evidence for conjugate faulting during the 1988 Tennant Creek, Australia earthquake sequence. Geophysical Journal International 107, 47–56. https://doi.org/10.1111/j.1365-246X.1991.tb01155.x
Bowman, J.R., (1988). Constraints on locations of large intraplate earthquakes in the Northern Territory, Australia from observations at the Warramunga seismic array. Geophysical Research Letters 15, 1475–1478. https://doi.org/10.1029/GL015i013p01475

162
Bowman, J.R., Barlow, B.C., (1991). Surveys of the Fault Scarp of the 1986 Marryat Creek, South Australia, Earthquake (BMR Record 1991/109). Australian Seismological Centre, Bureau of Mineral Resources, Canberra, ACT. http://pid.geoscience.gov.au/dataset/ga/14490
Bowman, J.R., Dewey, J.W., (1991). Relocation of teleseismically recorded earthquakes near Tennant Creek, Australia: Implications for midplate seismogenesis. Journal of Geophysical Research 96, 11,973-11,979. https://doi.org/10.1029/91JB00923
Bowman, J.R., Dewey, J.W., Peters, N., (1990a). Recent Results from Tennant Creek, in: Gregson, P.J. (Ed.), Recent Intraplate Seismicity Studies Symposium, Perth Western Australia (BMR Record 1990/44). Bureau of Mineral Resources, Geology and Geophysics, Canberra, ACT.
Bowman, J.R., Gibson, G., Jones, T., (1990b). Aftershocks of the 1988 January 22 Tennant
Creek, Australia Intraplate Earthquakes: Evidence For A Complex Thrust‐Fault Geometry. Geophysical Journal International 100, 87–97. https://doi.org/10.1111/j.1365-246X.1990.tb04570.x
Bowman, J.R., Gibson, G., Jones, T., (1988). Faulting process of the January 22, 1988 Tennant Creek, Northern Territory, Australia earthquakes, in: Abstracts for the AGU Fall Meeting 1988: EoS Transactions. American Geophysical Union, Washington, USA, p. 1301.
Bowman, J.R., Jones, T., (1991). Post-seismic surveys of the epicentral area of the 1988 Tennant Creek, N.T., earthquakes (BMR Record 1992/002). Bureau of Mineral Resources, Geology and Geophysics, Canberra, Australia. http://pid.geoscience.gov.au/dataset/ga/14510
Bowman, J.R., Yong, C., (1997). Case 22 A Seismicity Precursor to a Sequence of M 6.3-6.7 Midplate Earthquakes in Australia. Pure and Applied Geophysics 149, 61–78. https://doi.org/10.1007/BF00945161
Brakel, A.T., Montcrieff, J.S., Muhling, P.D.C., Chin, R.J., Moncrieff, J.S., Muhling, P.D.C., Chin, R.J., (1985). Dumbleyung 1:250 000 geological map. Geological Survey of Western Australia, Perth, Western Australia.
Bransby, M.F., Davies, M.C.R., El Nahas, A., Nagaoka, S., (2008). Centrifuge modelling of reverse fault-foundation interaction. Bulletin of Earthquake Engineering 6, 607–628. https://doi.org/10.1007/s10518-008-9080-7
Braun, J., Burbidge, D.R., Gesto, F.N., Sandiford, M., Gleadow, A.J.W., Kohn, B.P., Cummins, P.R., (2009). Constraints on the current rate of deformation and surface uplift of the Australian continent from a new seismic database and low-T thermochronological data. Australian Journal of Earth Sciences 56, 99–110. https://doi.org/10.1080/08120090802546977
Bray, J.D., (2009). Designing buildings to accommodate earthquake surface fault rupture, in: Proc. 2009 ATC and SEI Conference on Improving the Seismic Performance of Existing Buildings and Other Structures. pp. 1269–1280.
Bray, J.D., (2001). Developing mitigation measures for the hazards associated with earthquake surface fault rupture, in: A Workshop on Seismic Fault-Induced Failures – Possible Remedies for Damage to Urban Facilities. pp. 55–80.
Bray, J.D., Kelson, K.I., (2006). Observations of surface fault rupture from the 1906 earthquake in the context of current practice. Earthquake Spectra 22, 69–89. https://doi.org/10.1193/1.2181487

163
Bray, J.D., Rodriguez-Marek, A., (2004). Characterization of forward-directivity ground motions in the near-fault region. Soil Dynamics and Earthquake Engineering 24, 815–828. https://doi.org/10.1016/j.soildyn.2004.05.001
Bray, J.D., Seed, R.B., Cluff, L.S., Seed, H.B., (1994a). Earthquake fault rupture propagation through soil. Journal of Geotechnical Engineering 120, 543–561. https://doi.org/10.1061/(ASCE)0733-9410(1994)120:3(543)
Bray, J.D., Seed, R.B., Seed, H.B., (1994b). Analysis of earthquake fault rupture propagation through cohesive soil. Journal of Geotechnical Engineering 120, 562–580. https://doi.org/10.1061/(ASCE)0733-9410(1994)120:3(562)
Brozzetti, F., Boncio, P., Cirillo, D., Ferrarini, F., de Nardis, R., Testa, A., Liberi, F., Lavecchia, G., (2019). High-Resolution Field Mapping and Analysis of the August–October 2016 Coseismic Surface Faulting (Central Italy Earthquakes): Slip Distribution, Parameterization, and Comparison With Global Earthquakes. Tectonics 38, 417–439. https://doi.org/10.1029/2018TC005305
Bullock, P.W.B., (1977). Tennant Creek gravity and magnetic survey, Northern Territory, 1973 (BMR Record 1977/30). Bureau of Mineral Resources, Geology and Geophysics, Canberra, Australia. http://pid.geoscience.gov.au/dataset/ga/13559
Burbank, D.W., Anderson, R.S., (2011). Chapter 4: Stress, faults and folds, in: Tectonic Geomorphology, Second Edition. Wiley-Blackwell, Hoboken, NJ, pp. 71–116.
Burks, L.S., Baker, J.W., (2016). A predictive model for fling-step in near-fault ground motions based on recordings and simulations. Soil Dynamics and Earthquake Engineering 80, 119–126. https://doi.org/10.1016/j.soildyn.2015.10.010
Calais, E., Camelbeeck, T., Stein, S., Liu, M., Craig, T.J., (2016). A new paradigm for large earthquakes in stable continental plate interiors. Geophysical Research Letters 43, 10,621-10,637. https://doi.org/10.1002/2016GL070815
Champion, C., Liel, A., (2012). The effect of near-fault directivity on building seismic collapse risk. Earthquake Engineering & Structural Dynamics 41, 1391–1409. https://doi.org/10.1002/eqe.1188
Chen, X.Y., Bowler, J.M., Magee, J.W., (1993). Late cenozoic stratigraphy and hydrologic history of lake amadeus, a central australian playa. Australian Journal of Earth Sciences 40, 1–14. https://doi.org/10.1080/08120099308728059
Chen, X.Y., Chappell, J., Murray, A.S., (1995). High ( ground ) water levels and dune
development in central Australia : TL dates from gypsum and quartz dunes around Lake Lewis ( Napperby ), Northern Territory. Geomorphology 11, 311–322.
Choy, G.L., Bowman, J.R., (1990). Rupture process of a multiple main shock sequence: analysis of teleseismic, local and field observations of the Tennant Creek, Australia, earthquakes of January 22, 1988. Journal of Geophysical Research 95, 6867–6882. https://doi.org/10.1029/JB095iB05p06867
Clark, D., (2018). What have we learned in the 50 years since the 1968 Meckering earthquake ? Geoscience Australia, Commonwealth of Australia, Canberra, Australia. http://pid.geoscience.gov.au/dataset/ga/123342
Clark, D., (2012). Neotectonic Features Database. Geoscience Australia, Commonwealth of Australia, Canberra, Australia. http://pid.geoscience.gov.au/dataset/ga/74056
164
Clark, D., (2010a). Identification of quaternary scarps in southwest and central west Western Australia using dem-based hill shading: Application to seismic hazard assessment and neotectonics. International Journal of Remote Sensing 31, 6297–6325. https://doi.org/10.1080/01431161003631592
Clark, D., (2010b). Large Earthquake Recurrance in New South Wales: Implications for Earthquake Hazard. Seismic Engineering - design for management for geohazards.
Clark, D., Allen, T., (2018). What have we learnt regarding cratonic earthquakes in the fifty
years since Meckering ? Proceedings of the Australian Earthquake Engineering Society Conference 2018, Nov 16-18, Perth, WA.
Clark, D., Cupper, M., Sandiford, M., Kiernan, K., (2011a). Style and timing of late Quaternary faulting on the Lake Edgar fault, southwest Tasmania, Australia: Implications for hazard assessment in intracratonic areas, in: Audemard M., F.A., Michetti, A.M., McCalpin, J.P. (Eds.), Geological Criteria for Evaluating Seismicity Revisited: Forty Years of Paleoseismic Investigations and the Natural Record of Past Earthquakes: Geological Society of America Special Paper 479. The Geological Society of America, Boulder, Colorado USA, pp. 109–131. 10.1130/2011.2479(05)
Clark, D., Dentith, M., Wyrwoll, K.-H., Yanchou, L., Dent, V.F., Featherstone, W.E., (2008). The Hyden fault scarp, Western Australia: paleoseismic evidence for repeated Quaternary displacement in an intracratonic setting. Australian Journal of Earth Sciences 55, 379–395. https://doi.org/10.1080/08120090701769498
Clark, D., Edwards, M., (2018). 50th anniversary of the 14th October 1968 Mw 6.5 (Ms 6.8) Meckering earthquake (GA Record 2018/39). Geoscience Australia, Commonwealth of Australia, Canberra, ACT. https://doi.org/10.11636/Record.2018.039
Clark, D., Leonard, M., Griffin, J., Stirling, M.W., Volti, T., (2016). Incorporating fault sources into the Australian National Seismic Hazard Assessment (NSHA) 2018, in: Proceedings of the Australian Earthquake Engineering Society Conference 2016, Nov 25-27, Melbourne, Vic.
Clark, D., McCue, K., (2003). Australian paleoseismology: Towards a better basis for seismic hazard estimation. Annals of Geophysics 46, 1087–1106. https://doi.org/http://hdl.handle.net/2122/1005
Clark, D., Mcpherson, A., (2013). A tale of two seisms: Ernabella 23/03/2012 (Mw5.4) and Mulga Park 09/06/2013 (Mw 5.6). Australian Earthquake Engineering Society Newsletter.
Clark, D., Mcpherson, A., Allen, T., De Kool, M., (2014). Coseismic surface deformation caused by the 23 March 2012 Mw 5.4 Ernabella (Pukatja) earthquake, central Australia: Implications for fault scaling relations in cratonic settings. Bulletin of the Seismological Society of America 104, 24–39. https://doi.org/10.1785/0120120361
Clark, D., Mcpherson, A., Collins, C., (2011b). Australia’s seismogenic neotectonic record: a case for heterogeneous intraplate deformation (GA Record 2011/11). Geoscience Australia, Commonwealth of Australia, Canberra, Australia. http://pid.geoscience.gov.au/dataset/ga/70288
Clark, D., McPherson, A., Van Dissen, R.J., (2012). Long-term behaviour of Australian stable continental region (SCR) faults. Tectonophysics 566–567, 1–30. https://doi.org/10.1016/j.tecto.2012.07.004
Clark, D.J., Brennand, S., Brenn, G., Allen, T.I., Garthwaite, M.C., Standen, S., (2019). The

165
2018 Lake Muir earthquake sequence, southwest Western Australia: rethinking Australian stable continental region earthquakes. Solid Earth (in review). https://doi.org/10.5194/se-2019-125
Clark, M.N., (1972). Intensity of shaking estimated from displaced stones, in: The Borrego Mountain Earthquake of April 9, 1968, U.S. Geological Survey Professional Paper 787. United States Geological Survey, Washington, USA, pp. 175–182.
Cleary, J.R., Simpson, D.W., (1971). Seismotectonics of the Australian continent. Nature 230, 239–241. https://doi.org/10.1038/230239a0
Cole, D.A., Lade, P. V., (1984). Influence zones in alluvium over dip-slip faults. Journal of Geotechnical Engineering 110, 599–615. https://doi.org/10.1061/(ASCE)0733-9410(1984)110:5(599)
Collins, B.D., Stock, G.M., (2016). Rockfall triggering by cyclic thermal stressing of exfoliation fractures. Nature Geoscience 9, 2686. https://doi.org/10.1038/ngeo2686
Conacher, A.J., Murray, I.D., (1969). The Meckering earthquake, Western Australia, 14 October 1968. Australian Geographer 11, 179–184. https://doi.org/10.1080/00049186908702551
Crone, A.J., De Martini, P.M., Machette, M.N., Okumura, K., Prescott, J.R., (2003). Paleoseismicity of Two Historically Quiescent Faults in Australia: Implications for Fault Behavior in Stable Continental Regions. Bulletin of the Seismological Society of America 93, 1913–1934. https://doi.org/10.1785/0120000094
Crone, A.J., Machette, M.N., Bowman, J.R., (1997). Episodic nature of earthquake activity in stable continental regions revealed by palaeoseismicity studies of Australian and North American quaternary faults. Australian Journal of Earth Sciences 44, 203–214. https://doi.org/10.1080/08120099708728304
Crone, A.J., Machette, M.N., Bowman, J.R., (1992). Geologic Investigations of the 1988 Tennant Creek, Australia, Earthquakes - Implications for Paleoseismicity in the Stable Continental Regions (USGS Bulletin 2032-A). U.S. Geological Survey, Washington, USA. https://doi.org/10.3133/b2032A
Dabaghi, M., Der Kiureghian, A., (2018). Simulation of orthogonal horizontal components of near-fault ground motion for specified earthquake source and site characteristics. Earthquake Engineering and Structural Dynamics 47, 1369–1393. https://doi.org/10.1002/eqe.3021
Dadras, E.Y., Yazdani, A., Nicknam, A., Eftekhari, S.N., (2017). Incorporating Source
Rupture Characteristics into the Near‐Fault Pulse Prediction Model. Bulletin of the Seismological Society of America 108, 200–209. https://doi.org/10.1785/0120170005
Dalguer, L.A., Irikura, K., Riera, J.D., Chiu, H.C., (2001). The importance of the dynamic source effects on strong ground motion during the 1999 Chi-Chi, Taiwan, earthquake: Brief interpretation of the damage distribution on buildings. Bulletin of the Seismological Society of America 91, 1112–1127. https://doi.org/10.1785/0120000705
Davis, J.C., (2002). Analysis of directional data; Chapter 5 - Spatial Analysis, in: Statistics and Data Analysis in Geology, 3rd Edition. Wiley, New York.
Dawson, J., Cummins, P.R., Tregoning, P., Leonard, M., (2008). Shallow intraplate earthquakes in Western Australia observed by Interferometric Synthetic Aperture Radar. Journal of Geophysical Research: Solid Earth 113, 1–19.

166
https://doi.org/10.1029/2008JB005807
Dawson, J., Tregoning, P., (2007). Uncertainty analysis of earthquake source parameters determined from InSAR: A simulation study. Journal of Geophysical Research: Solid Earth 112, 1–13. https://doi.org/10.1029/2007JB005209
Day, S.M., Gonzalez, S.H., Anooshehpoor, R., Brune, J.N., (2008). Scale-model and numerical simulations of near-fault seismic directivity. Bulletin of the Seismological Society of America 98, 1186–1206. https://doi.org/10.1785/0120070190
Denham, D., (1988). Australian seismicity - the puzzle of the not-so-stable continent. Seismological Research Letters 59, 235–240. https://doi.org/10.1785/gssrl.59.4.235
Denham, D., Alexander, L.G., Everingham, I.B., Gregson, P.J., McCaffrey, R., Enever, J.R., (1987). The 1979 Cadoux earthquake and intraplate stress in Western Australia. Australian Journal of Earth Sciences 34, 507–521. https://doi.org/10.1080/08120098708729429
Denham, D., Alexander, L.G., Worotnicki, G., (1980). The stress field near the sites of the Meckering (1968) and Calingiri (1970) earthquakes, Western Australia. Tectonophysics 67, 283–317. https://doi.org/10.1016/0040-1951(80)90271-1
Denham, D., Alexander, L.G., Worotnicki, G., (1979). Stresses in the Australian crust: evidence from earthquakes and in-situ stress measurements. BMR Journal of Australian Geology and Geophysics 4, 289–295. https://doi.org/http://pid.geoscience.gov.au/dataset/ga/81007
Dent, V.F., (2008). Improved Hypocentral estimates for two recent seismic events in south-western Western Australia, using temporary station data, in: Proceedings of the Australian Earthquake Engineering Society Conference 2008, Ballarat VIC, 21-23 November.
Dent, V.F., (1991). Hypocentre locations from a microearthquake survey, Cadoux, Western Australia, 1983. BMR Journal of Australian Geology and Geophysics 12, 1–4. https://doi.org/http://pid.geoscience.gov.au/dataset/ga/81278
Dent, V.F., (1990a). Foreshocks and aftershocks of the 17 Jan 1990 Meckering earthquake, in: Gregson, P.J. (Ed.), Recent Intraplate Seismicity Studies Symposium, Perth Western Australia (BMR Record 1990/44). Bureau of Mineral Resources, Geology and Geophysics, Canberra, ACT.
Dent, V.F., (1990b). Hypocentre Relocations Using Data from Temporary Seismograph Stations at Burakin and Wyalkatchem, Western Australia (BMR Record 1990/36). Bureau of Mineral Resources, Geology and Geophysics, Canberra, Australia. http://pid.geoscience.gov.au/dataset/ga/14327
Dent, V.F., (1988). The distribution of Cadoux aftershocks: Additional results from temporary stations near Cadoux, 1983 (BMR Record 1988/51). Bureau of Mineral Resources, Geology and Geophysics, Canberra, ACT. http://pid.geoscience.gov.au/dataset/ga/14238
Dent, V.F., Gregson, P.J., (1986). Cadoux microearthquake survey 1983 (BMR Report 1986/022), 1986/22. ed. Bureau of Mineral Resources, Geology and Geophysics, Canberra, ACT. http://pid.geoscience.gov.au/dataset/ga/14114
Dentith, M., Clark, D., Featherstone, W.E., (2009). Aeromagnetic mapping of Precambrian geological structures that controlled the 1968 Meckering earthquake (Ms 6.8): Implications for intraplate seismicity in Western Australia. Tectonophysics 475, 544–553.
167
https://doi.org/10.1016/j.tecto.2009.07.001
Dentith, M., Featherstone, W.E., (2003). Controls on intra-plate seismicity in southwestern Australia. Tectonophysics 376, 167–184. https://doi.org/10.1016/j.tecto.2003.10.002
Derbyshire, E., Dijkstra, T., Smalley, I.J., (2017). Genesis and properties of collapsible soils, in: Derbyshire, E., Dijkstra, T., Smalley, I.J. (Eds.), Proceedings of the NATO Advanced Research Workshop on Genesis and Properties of Collapsible Soil. Springer, Loughborough, UK, pp. 399–404.
Donnellan, N., (2013). Chapter 9: Warramunga Province, in: Ahmad, M., Munson, T.J. (Eds.), Geology and Mineral Resources of the Northern Territory, Special Publication 5. Northern Territory Geological Survey, Darwin, Australia.
Donnellan, N., Hussey, K.J., Morrisson, R.S., Kruse, P.D., (1998). Tennant Creek 1:250 000 Geology. Edition 2. Northern Territory Geological Survey, Darwin, Australia.
Donnelly, K.E., Morrison, R.S., Hussey, K.J., Ferenczi, P.A., Kruse, P.D., (1999). Tennant Creek 1:250000 Explanatory Notes, Geological Map Series. Northern Territory Geological Survey, Darwin, Australia. https://doi.org/10.1017/CBO9781107415324.004
Doyle, H.A., (1971). Seismicity and structure in Australia. Bulletin of the Royal Society of New Zealand 9.
Doyle, H.A., Everingham, I.B., Sutton, D.J., (1968). Seismicity of the Australian continent. Journal of the Geological Society of Australia 15, 295–312. https://doi.org/10.1080/00167616808728700
Dreger, D., Hurtado, G., Chopra, A.K., Larsen, S., (2011). Near-field across-fault seismic ground motions. Bulletin of the Seismological Society of America 101, 202–221. https://doi.org/10.1785/0120090271
Dunai, T.J., Lifton, N.A., (2014). The nuts and bolts of cosmogenic nuclide production. Elements 10, 347–350. https://doi.org/10.2113/gselements.10.5.347
Edgoose, C.J., Scrimgeour, I.R., Close, D.F., (2004). Geology of the Musgrave Block, Northern Territory (NTGS Report 15). Northern Territory Geological Survey, Darwin, Australia.
Elliott, J.R., Nissen, E.K., England, P., Jackson, J.A., Lamb, S., Li, Z., Oehlers, M., Parsons, B.E., (2012). Slip in the 2010-2011 Canterbury earthquakes, New Zealand. Journal of Geophysical Research: Solid Earth 117. https://doi.org/10.1029/2011JB008868
English, P., Spooner, N.A., Chappell, J., Questiaux, D.G., Hill, N.G., (2001). Lake Lewis
basin, central Australia : environmental evolution and OSL chronology. Quaternary International 83–85, 81–101.
Everingham, I.B., (1968). Preliminary Report on the 14 October 1968 Earthquake at Meckering, Western Australia (BMR Record 1968/142), 1968/142. ed. Canberra, ACT. http://pid.geoscience.gov.au/dataset/ga/12254
Everingham, I.B., Gregson, P.J., (1971). Mundaring Geophysical Observatory, Annual Report, 1968 (BMR Record 1971/12). Bureau of Mineral Resources, Geology and Geophysics, Canberra, Australia. http://pid.geoscience.gov.au/dataset/ga/12549
Everingham, I.B., Gregson, P.J., (1970). Meckering earthquake intensities and notes on earthquake risk for Western Australia (BMR Report 1970/97). Bureau of Mineral Resources, Geology and Geophysics, Canberra, ACT. http://pid.geoscience.gov.au/dataset/ga/12510
Everingham, I.B., Gregson, P.J., Doyle, H.A., (1969). Thrust Fault Scarp in the Western
168
Australian Shield. Nature 223, 701–703.
Everingham, I.B., McEwin, A.J., Denham, D., (1982). Atlas of isoseismal maps of Australian earthquakes. Bureau of Mineral Resources, Geology and Geophysics, Canberra, Australia. http://pid.geoscience.gov.au/dataset/ga/38
Everingham, I.B., Parkes, A., (1971). Intensity Data for Earthquakes at Landor (17 June 1969) and Calingiri (10 March 1970) and their Relationship to Previous Western Australian Observations (BMR Recrod 1971/80), 1971/80. ed. Bureau of Mineral Resources, Geology and Geophysics, Canberra, Australia. http://pid.geoscience.gov.au/dataset/ga/12617
Everingham, I.B., Smith, R.S., (1979). Implications of fault-plane solutions for Australian earthquakes on 4 July 1977, 6 May 1978 and 25 November 1978, in: BMR Journal of Australian Geology and Geophysics. Bureau of Mineral Resources, Geology and Geophysics, Canberra, Australia, pp. 297–301. http://pid.geoscience.gov.au/dataset/ga/81008
Faccioli, E., Anastasopoulos, I., Gazetas, G., Callerio, A., Paolucci, R., (2008). Fault rupture-foundation interaction: Selected case histories. Bulletin of Earthquake Engineering 6, 557–583. https://doi.org/10.1007/s10518-008-9089-y
Fairclough, M.C., Sprigg, R.C., Wilson, B., Coats, R.P., (2011). Alberga 1:250 000 Geological Map, Digital Edition. Geological Survey of South Australia, Adelaide, Australia.
Featherstone, W.E., Penna T, N., Leonard, M., Clark, D., Dawson, J., Dentith, M., Darby, D., McCarthy, R., (2004). GPS-geodetic deformation monitoring of the south-west seismic zone of Western Australia: review, d, description of methodology and results from epoch-one. Journal of the Royal Society of Western Australia 87, 1–8.
Finch, E., Hardy, S., Gawthorpe, R., (2003). Discrete-element modelling of contractional fault-propagation folding above rigid basement fault blocks. Journal of Structural Geology 25, 515–528. https://doi.org/10.1016/S0191-8141(02)00053-6
Fitch, T.J., Worthington, M.H., Everingham, I.B., (1973). Mechanisms of Australian earthquakes and contemporary stress in the Indian ocean plate. Earth and Planetary Science Letters 18, 345–356. https://doi.org/10.1016/0012-821X(73)90075-7
Fredrich, J., Mccaffrey, R., Denham, D., (1988). Source parameters of seven large Australian earthquakes determined by body waveform inversion. Geophysical Journal 95, 1–13. https://doi.org/10.1111/j.1365-246X.1988.tb00446.x
Gabuchian, V., Rosakis, A.J., Bhat, H.S., Madariaga, R., Kanamori, H., (2017). Experimental evidence that thrust earthquake ruptures might open faults. Nature 545, 336–339. https://doi.org/10.1038/nature22045
Ghasemi, H., Allen, T., (2018). Selection and ranking of ground-motion models for the 2018 National Seismic Hazard Assessment of Australia (GA Record 2018/029). Canberra, ACT.
Giner-Robles, J.L., Silva, P.G., Elez, J., Rodríguez-Pascua, M.A., Perez-Lopez, R., Rodríguez-Escudero, E., (2015). Relationships between the ESI-07 scale and expected PGA values from the analysis of two historical earthquakes (≥ VIII EMS) in East Spain: Tavernes 1396 AD and Estubeny 1748 AD events, in: 6th International INQUA Meeting in Paleoseismology, Active Tectonics and Archaeoseismology, 19-24 April 2015, Pescina, Fucino Basin, Italy.
Gold, R., Clark, D., King, T.R., Quigley, M.C., (2017). Surface rupture and vertical
169
deformation associated with 20 May 2016 M6 Petermann Ranges earthquake , Northern Territory , Australia, in: European Geosciences Union General Assembly:Vienna, Austria.
Gold, R.D., Clark, D., Barnhart, W.D., King, T.R., Quigley, M.C., Briggs, R.W., (2019). Surface rupture and distributed deformation revealed by optical satellite imagery: The intraplate 2016 Mw 6.0 Petermann Ranges earthquake, Australia. Geophysical Research Letters. https://doi.org/10.1029/2019GL084926
Gold, R.D., Reitman, N.G., Briggs, R.W., Barnhart, W.D., Hayes, G.P., Wilson, E., (2015). On- and off-fault deformation associated with the September 2013 Mw 7.7 Balochistan earthquake: Implications for geologic slip rate measurements. Tectonophysics 660, 65–78. https://doi.org/10.1016/j.tecto.2015.08.019
Gordon, F.R., (1971). Faulting during the earthquake at Meckering, Western Australia: 14 October 1968. Royal Society of New Zealand Bulletin 9, 85–93.
Gordon, F.R., (1970). Water level changes preceding the Meckering, Western Australia, earthquake of October 14, 1968. Bulletin of the Seismological Society of America 60, 1739–1740.
Gordon, F.R., (1968). Reconstruction of Meckering town, a geological appraisal (GSWA Record 1968/14). Geological Survey of Western Australia, Perth, Western Australia.
Gordon, F.R., Lewis, J.D., (1980). The Meckering and Calingiri earthquakes October 1968 and March 1970, Geological Survey of Western Australia Bulletin. Geological Survey of Western Australia, Perth, Australia.
Gordon, F.R., Wellman, H.W., (1971). A mechanism for the Meckering earthquake. Royal Society of New Zealand Bulletin 9, 95–96.
Gordon, S.J., Dorn, R.I., (2005). In situ weathering rind erosion. Geomorphology 67, 97–113. https://doi.org/10.1016/j.geomorph.2004.06.011
Gosse, J.C., Phillips, F.M., (2001). Terrestrial in situ cosmogenic nuclides: Theory and application. Quaternary Science Reviews 20, 1475–1560. https://doi.org/10.1016/S0277-3791(00)00171-2
Gregson, P.J. (Ed.), (1990). Recent intraplate seismicity studies symposium, Perth, Western Australia September 1990 (BMR Record 1990/44). Bureau of Mineral Resources, Geology and Geophysics, Canberra, ACT.
Gregson, P.J., (1971). Mundaring Geophysical Observatory Annual Report, 1970 (BMR Record 1971/77). Bureau of Mineral Resources, Geology and Geophysics, Canberra, Australia. http://pid.geoscience.gov.au/dataset/ga/12614
Gregson, P.J., McCue, K., Smith, R.S., (1972). An explanation of water level changes preceding the Meckering earthquake of 14 October 1968 (BMR Record 1972/101). Bureau of Mineral Resources, Geology and Geophysics, Canberra, Australia. http://pid.geoscience.gov.au/dataset/ga/12782
Gregson, P.J., Paull, E.P., (1979). Preliminary report on the Cadoux earthquake, Western Australia, 2 June 1979 (BMR Report 1979/215). Bureau of Mineral Resources, Geology and Geophysics, Canberra, ACT. http://pid.geoscience.gov.au/dataset/ga/15123
Griffin, J., Weatherill, G., Allen, T., (2017). Performance of national scale smoothed seismicity estimates of earthquake activity rates, in: Australian Earthquake Engineering

170
Society 2017 Conference, Nov 24-26, Canberra, ACT.
Grollimund, B.R., Zoback, M.D., (2001). Did deglaciation triger intraplate seismicity in the New Madrid seismic zone? Geology 29, 175. https://doi.org/10.1130/0091-7613(2001)029<0175:DDTISI>2.0.CO;2
Guerrieri, L., Tatevossian, R.E., Vittori, E., Comerci, V., Esposito, E., Michetti, A.M., Porfido, S., Serva, L., (2007). Earthquake environmental effects ( EEE ) and intensity
assessment : The INQUA scale project. Bollettino della Societa Geologica Italiana 126, 375–386.
Hamling, I.J., Hreinsdóttir, S., Clark, K.J., Elliott, J.R., Liang, C., Fielding, E.J., Litchfield, N.J., Villamor, P., Wallace, L., Wright, T.J., D’Anastasio, E., Bannister, S., Burbidge, D.R., Denys, P., Gentle, P., Howarth, J., Mueller, C., Palmer, N., Pearson, C., Power, W., Barnes, P.M., Barrell, D.J.A., Van Dissen, R.J., Langridge, R.M., Little, T.A., Nicol, A., Pettinga, J., Rowland, J., Stirling, M.W., (2017). Complex multifault rupture during the 2016 Mw7.8 Kaikōura earthquake, New Zealand. Science 356. https://doi.org/10.1126/science.aam7194
Heddar, A., Beldjoudi, H., Aurhemayou, C., SiBachir, R., Yelles-Chaouche, A., Boudiaf, A., (2016). Use of the ESI-2007 scale to evaluate the 2003 Boumerdès earthquake (North Algeria). Annals of Geophysics 59. https://doi.org/10.4401/ag-6926
Hejrani, B., Tkalčić, H., (2018). The 20 May 2016 Petermann Ranges earthquake: centroid location, magnitude and focal mechanism from full waveform modelling. Australian Journal of Earth Sciences 66, 37–45. https://doi.org/10.1080/08120099.2018.1525783
Hesse, P.P., (2010). The Australian desert dunefields: formation and evolution in an old, flat, dry continent. Geological Society, London, Special Publications 346, 141–164. https://doi.org/10.1144/SP346.9
Hesse, P.P., Magee, J.W., Kaars, S. Van Der, van der Kaars, S., (2004). Late Quaternary climates of the Australian arid zone: A review. Quaternary International 118–119, 87–102. https://doi.org/10.1016/S1040-6182(03)00132-0
Hesse, P.P., McTainsh, G.H., (2003). Australian dust deposits: Modern processes and the Quaternary record. Quaternary Science Reviews 22, 2007–2035. https://doi.org/10.1016/S0277-3791(03)00164-1
Hillis, R.R., Sandiford, M., Reynolds, S.D., Quigley, M.C., (2008). Present-day stresses, seismicity and Neogene-to-Recent tectonics of Australia’s “passive” margins: intraplate deformation controlled by plate boundary forces. Geological Society, London, Special Publications 306, 71–90. https://doi.org/10.1144/SP306.3
Holdgate, G.R., Wallace, M.W., Gallagher, S.J., Smith, A.J., Keene, J.B., Moore, D., Shafik, S., (2003). Plio-Pleistocene tectonics and eustacy in the Gippsland Basin, southeast Australia: evidence from magnetic imagery and marine geological data. Australian Journal of Earth Sciences 50, 403–426. https://doi.org/10.1046/j.1440-0952.2003.01004.x
Holdgate, G.R., Wallace, M.W., Gallagher, S.J., Wagstaff, B.E., Moore, D., (2008). No mountains to snow on: Major post-Eocene uplift of the East Victoria Highlands; evidence from Cenozoic deposits. Australian Journal of Earth Sciences 55, 211–234. https://doi.org/10.1080/08120090701689373
Holford, S.P., Hillis, R.R., Hand, M., Sandiford, M., (2011). Thermal weakening localizes intraplate deformation along the southern Australian continental margin. Earth and

171
Planetary Science Letters 305, 207–214. https://doi.org/10.1016/j.epsl.2011.02.056
Hone, I.G., (1974). Ground Geophysical Survey, Tennant Creek, Northern Territory, 1972 (BMR Record 1974/171). Bureau of Mineral Resources, Geology and Geophysics, Canberra, Australia. http://pid.geoscience.gov.au/dataset/ga/13211
Hornblow, S., Quigley, M., Nicol, A., Van Dissen, R., Wang, N., (2014). Paleoseismology of the 2010 Mw 7.1 Darfield (Canterbury) earthquake source, Greendale Fault, New Zealand. Tectonophysics 637, 178–190. https://doi.org/10.1016/j.tecto.2014.10.004
Housner, G.W., (1963). The behavior of inverted pendulum structures during earthquakes. Bulletin of the Seismological Society of America 53, 403–417. https://doi.org/10.1017/CBO9781107415324.004
Johnston, A., (1988). Fault Traces Australian Quakes. Eos, Transactions American Geophysical Union 69, 682–682. https://doi.org/10.1029/88EO00232
Johnston, A.C., (1994). Seismotectonic interpretations and conclusions from the stable continental region seismicity database, in: Johnston, A.C., Coppersmith, K.J., Kanter, L.R., Cornell, C.A. (Eds.), The Earthquakes of Stable Continental Regions—v. 1 Assessment of Large Earthquake Potential. Electric Power Research Institute, Palo Alto, California.
Johnston, A.C., Coppersmith, K.J., Cornell, C.A., (1994). The earthquakes of stable continental regions, in: Electric Power Research Institute Report TR-102261-VI. EPRI Distribution Centre, Palo Alto, California, USA.
Johnston, J.F., White, S.R., (2018). Understanding the Meckering earthquake: Western Australia, 14 october 1968. Geological Survey of Western Australia, Perth, Australia. https://doi.org/10.1080/00049186908702551
Johnstone, A., Donnellan, N., (2001). Tennant Creek 1:250 000 Integrated Interpretation of Geophysics and Mapped Geology. Edition 1. Northern Territory Geological Survey, Alice Springs, Alice Springs, Australia.
Jones, T., Gibson, G., McCue, K., Denham, D., Gregson, P.J., Bowman, J.R., (1991). Three large intraplate earthquakes near Tennant Creek, Northern Territory, on 22 January 1988. BMR Journal of Australian Geology and Geophysics 12, 339–343. https://doi.org/http://pid.geoscience.gov.au/dataset/ga/81300
Kaneda, H., Nakata, T., Tsutsumi, H., Kondo, H., Sugito, N., Awata, Y., Akhtar, S.S., Majid, A., Khattak, W., Awan, A.A., Yeats, R.S., Hussain, A., Ashraf, M., Wesnousky, S.G., Kausar, A.B., (2008). Surface rupture of the 2005 Kashmir, Pakistan, earthquake and its active tectonic implications, Bulletin of the Seismological Society of America. 10.1785/0120070073
Kearse, J., Little, T.A., Van Dissen, R.J., Barnes, P.M., Langridge, R.M., Mountjoy, J., Ries,
W., Villamor, P., Clark, K.J., Benson, A., Lamarche, G., Hill, M., Hemphill‐Haley, M.,
(2018). Onshore to Offshore Ground‐Surface and Seabed Rupture of the Jordan–Kekerengu–Needles Fault Network during the 2016 Mw 7.8 Kaikoura Earthquake, New Zealand. Bulletin of the Seismological Society of America 108, 1573–1595. https://doi.org/10.1785/0120170304
Kelson, K.I., Kang, K.H., Page, W.D., Lee, C.T., Cluff, L.S., (2001). Representative styles of deformation along the Chelungpu Fault from the 1999 Chi-Chi (Taiwan) earthquake: Geomorphic characteristics and responses of man-made structures. Bulletin of the Seismological Society of America 91, 930–952. https://doi.org/10.1785/0120000741

172
Kenner, S.J., Segall, P., (2000). A mechanical model for intraplate earthquakes: application to the New Madric Seismic Zone. Science 289, 2329–2332. https://doi.org/10.1126/science.289.5488.2329
Khajavi, N., Quigley, M.C., McColl, S.T., Rezanejad, A., (2012). Seismically induced boulder displacement in the Port Hills, New Zealand during the 2010 Darfield (Canterbury) earthquake. New Zealand Journal of Geology and Geophysics 55, 271–278. https://doi.org/10.1080/00288306.2012.698627
Kim, Y.S., Peacock, D.C.P., Sanderson, D.J., (2004). Fault damage zones. Journal of Structural Geology 26, 503–517. https://doi.org/10.1016/j.jsg.2003.08.002
King, T.R., Quigley, M.C., Clark, D., (2019a). Surface-rupturing historical earthquakes in Australia and their environmental effects: new insights from re-analyses of observational data. Geosciences 9, 1–34. https://doi.org/10.3390/geosciences9100408
King, T.R., Quigley, M.C., Clark, D., (2019b). Review paper: The 14th October 1968 Mw 6.6 Meckering surface rupturing earthquake, Australia. EarthArXiv Preprint 1–25. https://doi.org/10.31223/osf.io/2zgrn
King, T.R., Quigley, M.C., Clark, D., (2019c). Review paper: The 2nd June 1979 Mw 6.1 Cadoux surface rupturing earthquake, Australia. EarthArXiv Preprint 1–19. https://doi.org/10.31223/osf.io/9dhx8
King, T.R., Quigley, M.C., Clark, D., (2019d). Review paper: The 20th May 2016 Mw 6.1 Petermann surface rupturing earthquake, Australia. EarthArXiv Preprint 1–16. https://doi.org/10.31223/osf.io/gbp9t
King, T.R., Quigley, M.C., Clark, D., (2019e). Review paper: The 10th March 1970 Mw 5.0 Calingiri surface rupturing earthquake, Australia. EarthArXiv Preprint. https://doi.org/10.31223/osf.io/egw4c
King, T.R., Quigley, M.C., Clark, D., (2019f). Review paper: The 30th March 1968 Mw 5.7 Marryat Creek surface rupturing earthquake, Australia. EarthArXiv Preprint 1–17. https://doi.org/10.31223/osf.io/5ysfx
King, T.R., Quigley, M.C., Clark, D., (2019g). Review paper: The 23rd March 2012 Mw 5.2 Pukatja surface rupturing earthquake, Australia. EarthArXiv Preprint 1–13. https://doi.org/10.31223/osf.io/p73ae
King, T.R., Quigley, M.C., Clark, D., (2018). Earthquake environmental effects produced by the Mw 6.1, 20th May 2016 Petermann earthquake, Australia. Tectonophysics 747–748, 357–372. https://doi.org/10.1016/j.tecto.2018.10.010
King, T.R., Quigley, M.C., Clark, D., Valkaniotis, S., Mohammadi, H., Barnhart, W.D., (2019h). The 1987 to 2019 Tennant Creek, Australia, earthquake sequence: a protracted intraplate multi-mainshock sequence. EarthArXiv Preprint. https://doi.org/10.31223/osf.io/j4nk7
King, T.R., Quigley, M.C., Sandiford, M., (2017). Near-source strong ground motions inferred from displaced geologic objects, in: Australian Earthquake Engineering Society 2017 Conference, Nov 24-26, Canberra, ACT. Canberra, ACT.
Klinger, Y., Okubo, K., Vallage, A., Champenois, J., Delorme, A., Rougier, E., Lei, Z., Knight, E.E., Munjiza, A., Satriano, C., Baize, S., Langridge, R.M., Bhat, H.S., (2018). Earthquake Damage Patterns Resolve Complex Rupture Processes. Geophysical Research Letters 45, 10,279-10,287. https://doi.org/10.1029/2018GL078842

173
Kohrangi, M., Vamvatsikos, D., Bazzurro, P., (2019). Pulse-like versus non-pulse-like ground motion records: Spectral shape comparisons and record selection strategies. Earthquake Engineering and Structural Dynamics 48, 46–64. https://doi.org/10.1002/eqe.3122
Krapf, C.B.E., Sheard, M.J., (2018). Regolith hand specimen atlas for South Australia. Department of the Premier and Cabinet, Adelaide, Australia.
Lade, P. V., Cole, D.A., Cummings, D., (1984). Multiple failure surfaces over dip-slip faults. Journal of Geotechnical Engineering 110, 616–627. https://doi.org/10.1061/(ASCE)0733-9410(1984)110:5(616)
Lal, D., (1991). Cosmic ray labeling of erosion surfaces: in situ nuclide production rates and erosion models. Earth and Planetary Science Letters 104, 424–439. https://doi.org/10.1016/0012-821X(91)90220-C
Lambeck, K., McQueen, H.W.S., Stephenson, R.A., Denham, D., (1984). The state of stress within the Australian continent. Annals of Geophysics 2, 723–742.
Langston, C.A., (1987). Depth of Faulting during the 1968 Meckering, Australia, earthquake sequence determined from waveform analysis of local seismogram. Journal of Geophysical Research 92, 11561–11574. https://doi.org/10.1029/JB092iB11p11561
Lavrentiadis, G., Abrahamson, N., (2019). Generation of Surface‐Slip Profiles in the Wavenumber Domain. Bulletin of the Seismological Society of America 109, 888–907. https://doi.org/10.1785/0120180252
Lee, J.-C., Chen, W.-S., Chan, Y.-C., Chu, H.-T., Rubin, C., Chen, Y.-G., Sieh, K., Mueller, K., (2003). Quantitative analysis of movement along an earthquake thrust scarp: a case study of a vertical exposure of the 1999 surface rupture of the Chelungpu fault at Wufeng, Western Taiwan. Journal of Asian Earth Sciences 23, 263–273. https://doi.org/10.1016/s1367-9120(03)00122-6
Lee, J.W., Hamada, M., (2005). An experimental study on earthquake fault rupture propagation through a sandy soil deposit. Structural Engineering/Earthquake Engineering 22. https://doi.org/10.2208/jsceseee.22.1s
Leonard, M., (2014). Self-consistent earthquake fault-scaling relations: Update and extension to stable continental strike-slip faults. Bulletin of the Seismological Society of America 104, 2953–2965. https://doi.org/10.1785/0120140087
Leonard, M., (2010). Earthquake fault scaling: Self-consistent relating of rupture length, width, average displacement, and moment release. Bulletin of the Seismological Society of America 100, 1971–1988. https://doi.org/10.1785/0120090189
Leonard, M., (2008). One hundred years of earthquake recording in Australia. Bulletin of the Seismological Society of America 98, 1458–1470. https://doi.org/10.1785/0120050193
Leonard, M., Burbidge, D.R., Allen, T., Robinson, D.J., Mcpherson, A., Clark, D., Collins, C., (2014). The challenges of probabilistic seismic-hazard assessment in stable continental interiors: An Australian example. Bulletin of the Seismological Society of America 104, 3008–3028. https://doi.org/10.1785/0120130248
Leonard, M., Clark, D., (2011). A record of stable continental region earthquakes from Western Australia spanning the late Pleistocene: Insights for contemporary seismicity. Earth and Planetary Science Letters 309, 207–212. https://doi.org/10.1016/j.epsl.2011.06.035

174
Leonard, M., Ripper, I.D., Yue, L., (2002). Australian earthquake fault plane solutions (GA Record 2002/019), 2002/19. ed. Geoscience Australia, Canberra, ACT. http://pid.geoscience.gov.au/dataset/ga/37302
Lewis, J.D., (1990a). Meckering revisited, in: Recent Intraplate Seismicity Studies Symposium, Perth Western Australia (BMR Record 1990/44).
Lewis, J.D., (1990b). The Meckering earthquake of 17 January 1990 (GSWA Record 1990/6). Geological Survey of Western Australia, Perth, Western Australia.
Lewis, J.D., (1969). The geology of the country around Meckering (GSWA Record 1969/18). Geological Survey of Western Australia, Perth, Western Australia.
Lewis, J.D., Daetwyler, N.A., Bunting, J.A., Montcrieff, J.S., (1981). The Cadoux Earthquake (GSWA Report 11). Geological Survey of Western Australia, Perth, Australia.
Lifton, N., Sato, T., Dunai, T.J., (2014). Scaling in situ cosmogenic nuclide production rates using analytical approximations to atmospheric cosmic-ray fluxes. Earth and Planetary Science Letters 386, 149–160. https://doi.org/10.1016/j.epsl.2013.10.052
Lifton, N.A., Smart, D.F., Shea, M.A., (2008). Scaling time-integrated in situ cosmogenic nuclide production rates using a continuous geomagnetic model. Earth and Planetary Science Letters 268, 190–201. https://doi.org/10.1016/j.epsl.2008.01.021
Litchfield, N.J., Villamor, P., van Dissen, R.J., Nicol, A., Barnes, P.M., Barrell, D.J.A., Pettinga, J.R., Langridge, R.M., Little, T.A., Mountjoy, J.J., Ries, W.F., Rowland, J., Fenton, C., Stirling, M.W., Kearse, J., Berryman, K.R., Cochran, U.A., Clark, K.J.,
Hemphill‐Haley, M., Khajavi, N., Jones, K.E., Archibald, G., Upton, P., Asher, C., Benson, A., Cox, S.C., Gasston, C., Hale, D., Hall, B., Hatem, A.E., Heron, D.W., Howarth, J., Kane, T.J., Lamarche, G., Lawson, S., Lukovic, B., McColl, S.T., Madugo, C., Manousakis, J., Noble, D., Pedley, K., Sauer, K., Stahl, T., Strong, D.T., Townsend, D.B., Toy, V., Williams, J., Woelz, S., Zinke, R., (2018). Surface rupture of multiple crustal faults in the 2016 Mw7.8 Kaikōura, New Zealand, earthquake. Bulletin of the Seismological Society of America 108, 1496–1520. https://doi.org/10.1785/0120170300
Liu, M., Stein, S., (2016). Mid-continental earthquakes: Spatiotemporal occurrences, causes, and hazards. Earth-Science Reviews 162, 364–386. https://doi.org/10.1016/j.earscirev.2016.09.016
Liu, M., Stein, S., Wang, H., (2011). 2000 years of migrating earthquakes in North China: How earthquakes in midcontinents differ from those at plate boundaries. Lithosphere 3, 128–132. https://doi.org/10.1130/L129.1
Livio, F., Serva, L., Gürpinar, A., (2017). Locating distributed faulting: Contributions from InSAR imaging to Probabilistic Fault Displacement Hazard Analysis (PFDHA). Quaternary International 451, 223–233. https://doi.org/10.1016/j.quaint.2016.09.034
Livio, F.A., Ferrario, M.F., Frigerio, C., Zerboni, A., Michetti, A.M., (2020). Variable fault tip propagation rates affected by near-surface lithology and implications for fault displacement hazard assessment. Journal of Structural Geology 130, 103914. https://doi.org/10.1016/j.jsg.2019.103914
Loukidis, D., Bouckovalas, G.D., Papadimitriou, A.G., (2009). Analysis of fault rupture propagation through uniform soil cover. Soil Dynamics and Earthquake Engineering 29, 1389–1404. https://doi.org/10.1016/j.soildyn.2009.04.003
Machette, M.. M.N., Crone, A.. A.J., Bowman, J.R., (1993). Geologic investigations of the 1986

175
Marryat Creek, Australia, earthquake: implications for paleoseismicity in stable continental regions (USGS Bulletin 2032-B). U.S. Geological Survey, Washington, USA. https://doi.org/10.3133/b2032B
Machette, M.N., Crone, A.J., Bowman, J.R., Prescott, J.R., (1991). Surface ruptures and deformation associated with the 1988 Tennant Creek and 1986 Marryat Creek, Australia, intraplate earthquakes, in: Abstracts of the U.S. Geological Survey, Central Region; 1991 Poster Review. U.S. Geological Survey, Reston, VA, USA, p. 27.
Magee, J.W., (2009). Palaeovalley Groundwater Resources in Arid and Semi-Arid Australia A Literature Review Palaeovalley Groundwater Resources in Arid and Semi-Arid Australia - A literature review.
Martin Mai, P., Beroza, G.C., (2000). Source scaling properties from finite-fault-rupture models. Bulletin of the Seismological Society of America 90, 604–615. https://doi.org/10.1785/0119990126
McCaffrey, R., (1989). Teleseismic investigation of the January 22, 1988 Tennant Creek, Australia, earthquakes. Geophysical Research Letters 16, 413–416. https://doi.org/10.1029/GL016i005p00413
McCue, K., (1990). Australia’s large earthquakes and Recent fault scarps. Journal of Structural Geology 12, 761–766. https://doi.org/10.1016/0191-8141(90)90087-F
McCue, K., Jones, T., Michael-Leiba, M., Barlow, B.C., Denham, D., Gibson, G., (1987). Another chip off the old Australian block. Eos, Transactions American Geophysical Union 68, 609. https://doi.org/10.1029/eo068i026p00609
Mcpherson, A., Clark, D., Macphail, M., Cupper, M., (2014). Episodic post-rift deformation in the south-eastern Australian passive margin: Evidence from the Lapstone Structural Complex. Earth Surface Processes and Landforms 39, 1449–1466. https://doi.org/10.1002/esp.3535
Michael, A.J., Ross, S.L., Stenner, H.D., (2002). Displaced rocks, strong motion, and the mechanics of shallow faulting associated with the 1999 Hector Mine, California, earthquake. Bulletin of the Seismological Society of America 92, 1561–1569. https://doi.org/10.1785/0120000927
Michetti, A.M., Esposito, E., Guerrieri, L., Porfido, S., Serva, L., Tatevossian, R.E., Vittori, E., Audemard M., F.A., Azuma, T., Clague, J., Comerci, V., Gurpinar, A., McCalpin, J.P., Mohammadioun, B., Morner, N.A., Ota, Y., Roghozhin, E., (2007). Intensity Scale ESI 2007, Memorie Descrittive della Carta Geologica d’Italia, Special Volume 74. APAT, Rome 2007.
Mitchell, D., Paultre, P., Tinawi, R., Saatcioglu, M., Tremblay, R., Elwood, K., Adams, J., DeVall, R., (2010). Evolution of seismic design provisions in the National building code of Canada. Canadian Journal of Civil Engineering 37, 1157–1170. https://doi.org/10.1139/l10-054
Mohammadi, H., Quigley, M.C., Steacy, S., Duffy, B., (2019). Effects of source model variations on Coulomb stress analyses of a multi-fault intraplate earthquake sequence. Tectonophysics 766, 151–166. https://doi.org/10.1016/j.tecto.2019.06.007
Moss, R.E.S., Ross, Z.E., (2011). Probabilistic fault displacement hazard analysis for reverse faults. Bulletin of the Seismological Society of America 101, 1542–1553. https://doi.org/10.1785/0120100248

176
Nappi, R., Gaudiosi, G., Alessio, G., De Lucia, M., Porfido, S., (2017). The environmental effects of the 1743 Salento earthquake (Apulia, southern Italy): a contribution to seismic hazard assessment of the Salento Peninsula. Natural Hazards 86, S295–S324. https://doi.org/10.1007/s11069-016-2548-x
Neumann, N.L., (2013). Yilgarn Craton – Officer Basin – Musgrave Province Seismic and MT Workshop (GA Record 2013/28). Geoscience Australia, Commonwealth of Australia, Canberra, ACT. http://pid.geoscience.gov.au/dataset/ga/76664
Nishiizumi, K., Imamura, M., Caffee, M.W., Southon, J.R., Finkel, R.C., McAninch, J., (2007). Absolute calibration of10Be AMS standards. Nuclear Instruments and Methods in Physics Research, Section B: Beam Interactions with Materials and Atoms 258, 403–413. https://doi.org/10.1016/j.nimb.2007.01.297
Oettle, N.K., Bray, J.D., (2013). Fault rupture propagation through previously ruptured soil. Journal of Geotechnical and Geoenvironmental Engineering 139, 1637–1647. https://doi.org/10.1061/(ASCE)GT.1943-5606.0000919
Oettle, N.K., Bray, J.D., Dreger, D.S., (2015). Dynamic effects of surface fault rupture interaction with structures. Soil Dynamics and Earthquake Engineering 72, 37–47. https://doi.org/10.1016/j.soildyn.2015.01.019
Ohmachi, T., Midorikawa, S., (1992). Ground-motion intensity inferred from upthrow of boulders during the 1984 western Nagano Prefecture, Japan, earthquake. Bulletin of the Seismological Society of America 82, 44–60.
Ota, Y., Azuma, T., Lin, Y.N., (2009). Application of INQUA Environmental Seismic Intensity Scale to recent earthquakes in Japan and Taiwan. Geological Society, London, Special Publications 316, 55–71. https://doi.org/10.1144/SP316.4
Papanikolaou, I., Melaki, M., (2017). The Environmental Seismic Intensity Scale (ESI 2007) in Greece, addition of new events and its relationship with magnitude in Greece and the Mediterranean; preliminary attenuation relationships. Quaternary International 451, 37–55. https://doi.org/10.1016/j.quaint.2017.05.044
Papanikolaou, I.D., Papanikolaou, D.I., Lekkas, E.L., (2009). Advances and limitations of the Environmental Seismic Intensity scale (ESI 2007) regarding near-field and far-field effects from recent earthquakes in Greece: implications for the seismic hazard assessment. Geological Society, London, Special Publications 316, 11–30. https://doi.org/10.1144/SP316.2
Papathanassiou, G., Valkaniotis, S., Ganas, A., (2017). Evaluation of the macroseismic intensities triggered by the January/February 2014 Cephalonia, (Greece) earthquakes based on ESI-07 scale and their comparison to 1867 historical event. Quaternary International 451, 234–247. https://doi.org/10.1016/j.quaint.2016.09.039
Parks Australia, n.d. Fact Sheet: Uluru-Kata Tjuta National Park [WWW Document].
Philip, H., Meghraoui, M., (1983). Structural analysis and interpretation of the surface deformations of the El Asnam Earthquake of October 10, 1980. Tectonics 2, 17–49. https://doi.org/10.1029/TC002i001p00017
Pilia, S., Rawlinson, N., Direen, N.G., Cummins, P.R., Balfour, N.J., (2013). Structural controls on localized intraplate deformation and seismicity in Southern Australia: Insights from local earthquake tomography of the Flinders Ranges. Journal of Geophysical Research: Solid Earth 118, 2176–2190. https://doi.org/10.1002/jgrb.50168
177
Polcari, M., Albano, M., Atzori, S., Bignami, C., Stramondo, S., (2018). The Causative Fault of the 2016 Mwp 6.1 Petermann Ranges Intraplate Earthquake (Central Australia) Retrieved by C- and L-Band InSAR Data. Remote Sensing 10, 1311. https://doi.org/10.3390/rs10081311
Porfido, S., Esposito, E., Spiga, E., Sacchi, M., Molisso, F., Mazzola, S., (2015). Impact of Ground Effects for an Appropriate Mitigation Strategy in Seismic Area: The Example of Guatemala 1976 Earthquake, in: Lollino, G., Giordan, D., Crosta, G.B., Corominas, J., Azzam, R., Wasowski, J., Sciarra, N. (Eds.), Engineering Geology for Society and Territory - Volume 2: Landslide Processes. Springer International Publishing, Berlin, Germany, pp. 703–708. 10.1007/978-3-319-09057-3_117
Psycharis, I.N., Jennings, P.C., (1985). Upthrow of objects due to horizontal impulse excitation. Bulletin of the Seismological Society of America 75, 543–561.
Quentin de Gromard, R., Kirkland, C.L., Howard, H.M., Wingate, M.T.D., Jourdan, F., McInnes, B.I.A., Danišík, M., Evans, N.J., McDonald, B.J., Smithies, R.H., (2019). When will it end? Long-lived intracontinental reactivation in central Australia. Geoscience Frontiers 10, 149–164. https://doi.org/10.1016/j.gsf.2018.09.003
Quigley, M.C., Clark, D., Sandiford, M., (2010). Tectonic geomorphology of Australia. Geological Society, London, Special Publications 346, 243–265. https://doi.org/10.1144/SP346.13
Quigley, M.C., Cupper, M., Sandiford, M., (2006). Quaternary faults of south-central Australia: Palaeoseismicity, slip rates and origin. Australian Journal of Earth Sciences 53, 285–301. https://doi.org/10.1080/08120090500499271
Quigley, M.C., Hughes, M.W., Bradley, B.A., van Ballegooy, S., Reid, C., Morgenroth, J., Horton, T., Duffy, B., Pettinga, J.R., (2016). The 2010-2011 Canterbury Earthquake Sequence: Environmental effects, seismic triggering thresholds and geologic legacy. Tectonophysics 672–673, 228–274. https://doi.org/10.1016/j.tecto.2016.01.044
Quigley, M.C., Jiménez, A., Duffy, B., King, T.R., (2019). Physical and Statistical Behavior
of Multifault Earthquakes : Darfield Earthquake Case Study , New Zealand. Journal of Geophysical Research: Solid Earth 124. https://doi.org/10.1029/2019JB017508
Quigley, M.C., Jiménez, A., Duffy, B., King, T.R., (2018). An investigation of multi-fault rupture scenarios using a variety of Coulomb stress modelling criteria: methods paper and full results. EarthArXiv Preprint. https://doi.org/10.31223/osf.io/v8t3n
Quigley, M.C., Mohammadi, H., Jimenez, A., Duffy, B.G., (2017). Multi-fault earthquakes
with kinematic and geometric rupture complexity : how common ? INQUA Focus Group Earthquake Geology and Seismic Hazards, in: 8th International INQUA Meeting on Paleoseismology, Active Tectonics and Archeoseismology (PATA), 13 – 16 November, 2017, New Zealand.
Quigley, M.C., Sandiford, M., Cupper, M., (2007a). Distinguishing tectonic from climatic controls on range-front sedimentation. Basin Research 19, 491–505. https://doi.org/10.1111/j.1365-2117.2007.00336.x
Quigley, M.C., Sandiford, M., Fifield, L.K., Alimanovic, A., (2007b). Landscape responses to intraplate tectonism: Quantitative constraints from 10Be nuclide abundances. Earth and Planetary Science Letters 261, 120–133. https://doi.org/10.1016/j.epsl.2007.06.020
Raimondo, T., Collins, A.S., Hand, M., Walker-Hallam, A., Smithies, R.H., Evins, P.M.,
178
Howard, H.M., (2010). The anatomy of a deep intracontinental orogen. Tectonics 29. https://doi.org/10.1029/2009TC002504
Rajabi, M., Heidbach, O., Tingay, M., Reiter, K., (2017a). Prediction of the present-day stress field in the Australian continental crust using 3D geomechanical–numerical models. Australian Journal of Earth Sciences 64, 435–454. https://doi.org/10.1080/08120099.2017.1294109
Rajabi, M., Tingay, M., Heidbach, O., Hillis, R.R., Reynolds, S.D., (2017b). The present-day stress field of Australia. Earth-Science Reviews 168, 165–189. https://doi.org/10.1016/j.earscirev.2017.04.003
Raymond, O.L., Totterdell, J.M., Stewart, A.J., Woods, M.A., (2018). Australian Geological Provinces: 2018.01 edition [Digital Dataset]. Geoscience Australia, Commonwealth of Australia, Canberra, Australia. http://pid.geoscience.gov.au/dataset/ga/116823
Reicherter, K., Michetti, A.M., Silva, P.G., Silva Barroso, P.G., Barroso, P.G.S., (2009). Palaeoseismology: historical and prehistorical records of earthquake ground effects for seismic hazard assessment. Geological Society, London, Special Publications 316, 1–10. https://doi.org/10.1144/SP316.1
Robinson, A.C., Copely, P.B., Canty, P.D., Baker, L.M., Nesbitt, B.J., (2003). A Biological survey of the Anangu Pitjantjatjara Lands, South Australia 1991-2001. South Australian Department for Environment and Heritage, Adelaide.
Rodríguez-Pascua, M.A., Pérez-López, R., Garduño-Monroy, V.H., Perucha, M.A., Israde-Alcántara, I., (2017). Estimation of the epicentral area of the 1912 Acambay earthquake (M 6.9, Mexico) determined from the earthquake archaeological effects (EAE) and the ESI07 macroseismic scale. Quaternary International 451, 74–86. https://doi.org/10.1016/j.quaint.2017.06.045
Rogers, C.D.F., (1995). Types and distribution of collapsible soils, in: Derbyshire, E., Dijkstra, T., Smalley, I.J. (Eds.), Genesis and Properties of Collapsible Soils. Springer, Loughborough, UK, pp. 1–17.
Rynn, J.M.W., Denham, D., Greenhalgh, S.A., Jones, T., Gregson, P.J., McCue, K., Smith, R.S., (1987). Atlas of isoseismal maps of Australian earthquakes, Part 2. Bureau of Mineral Resources, Geology and Geophysics, Canberra, ACT. http://pid.geoscience.gov.au/dataset/ga/19
Sanchez, J.J., Maldonado, R.F., (2016). Application of the ESI 2007 scale to two large earthquakes: South Island, New Zealand (2010 Mw 7.1), and Tohoku, Japan (2011 Mw 9.0). Bulletin of the Seismological Society of America 106, 1151–1161. https://doi.org/10.1785/0120150188
Sandiford, M., (2003). Neotectonics of southeastern Australia: linking the Quaternary faulting record with seismicity and in situ stress. Special Paper 372: Evolution and Dynamics of the Australian Plate 372, 107–119. https://doi.org/10.1130/0-8137-2372-8.107
Sandiford, M., Egholm, D.L., (2008). Enhanced intraplate seismicity along continental margins: Some causes and consequences. Tectonophysics 457, 197–208. https://doi.org/10.1016/j.tecto.2008.06.004
Scrimgeour, I.R., Close, D.F., Edgoose, C.J., (1999a). Petermann Ranges SG52-7; explanatory notes. Northern Territory Geological Survey, Darwin, Australia.
Scrimgeour, I.R., Close, D.F., Edgoose, C.J., (1999b). Petermann Ranges 1:250 000 geological

179
map, Second Edition. Northern Territory Geological Survey, Darwin, Australia.
Serva, L., (2019). History of the Environmental Seismic Intensity Scale ESI-07. Geosciences 9, 210. https://doi.org/10.3390/geosciences9050210
Serva, L., Vittori, E., Comerci, V., Esposito, E., Guerrieri, L., Michetti, A.M., Mohammadioun, B., Mohammadioun, G.C., Porfido, S., Tatevossian, R.E., (2016). Earthquake Hazard and the Environmental Seismic Intensity (ESI) Scale. Pure and Applied Geophysics 173, 1479–1515. https://doi.org/10.1007/s00024-015-1177-8
Shahi, S.K., Baker, J.W., (2014). An efficient algorithm to identify strong-velocity pulses in multicomponent ground motions. Bulletin of the Seismological Society of America 104, 2456–2466. https://doi.org/10.1785/0120130191
Shahi, S.K., Baker, J.W., (2013). NGA-West2 Models for Ground-Motion Directionality. Berkeley.
Shahi, S.K., Baker, J.W., (2011). An Empirically Calibrated Framework for Including the Effects of Near-Fault Directivity in Probabilistic Seismic Hazard Analysis. Bulletin of the Seismological Society of America 101, 742–755. https://doi.org/10.1785/0120100090
Sheard, M.J., Lintern, M.J., Prescott, J.R., Huntley, D.J., (2006). Great Victoria Desert : new
dates for South Australia’s ?oldest desert dune system. MESA Journal.
Shi, B.B.P., Anooshehpoor, A., Zeng, Y., Brune, J.N., (1996). Rocking and overturning of precariously balanced rocks by earthquakes. Bulletin of the Seismological Society of America 86, 1364–1371. https://doi.org/10.1144/GSL.SP.1982.010.01.35
Silva, P.G., Reicherter, K., Grützner, C., Bardají, T., Lario, J., Goy, J.L., Zazo, C., Becker-Heidmann, P., (2009). Surface and subsurface palaeoseismic records at the ancient Roman city of Baelo Claudia and the Bolonia Bay area, Cádiz (south Spain). Geological Society, London, Special Publications 316, 93–121. https://doi.org/10.1144/SP316.6
Somerville, P.G., (2014). Scaling Relations between Seismic Moment and Rupture Area of Earthquakes in Stable Continental Regions. Peer Report 2014/14.
Somerville, P.G., (2010). Ground Motion Models for Australian earthquakes. Report to Geoscience Australia, 29 June 2009. 10.1061/40975(318)2
Somerville, P.G., Graves, R.W., Collins, N., Song, S.G., Ni, S., Cummins, P.R., (2009). Source and Ground Motion Models for Australian Earthquakes, in: Australian Earthquake Engineering Society 2009 Conference, Newcastle, Australia. Canberra.
Somerville, P.G., Irikura, K., Graves, R.W., Sawada, S., Wald, D.J., Abrahamson, N.A., Iwasaki, Y., Kagawa, N., Smith, N.F., Kowada, A., (2000). Characterizing earthquake slip models for the prediction of strong ground motion, in: 12th World Conference on Earthquake Engineering; Auckland, New Zealand, Sunday 30 January - Friday 4 February 2000.
Somerville, P.G., Irikura, K., Graves, R.W., Sawada, S., Wald, D.J., Abrahamson, N.A., Iwasaki, Y., Kagawa, T., Smith, N.F., Kowada, A., (1999). Characterizing Crustal Earthquake Slip Models for the Prediction of Strong Ground Motion. Seismological Research Letters 70, 59–80. https://doi.org/10.1785/gssrl.70.1.59
Somerville, P.G., Smith, N.F., Graves, R.W., Abrahamson, N.A., (1997). Modification of Empirical Strong Ground Motion Attenuation Relations to Include the Amplitude and Duration Effects of Rupture Directivity. Seismological Research Letters 68, 199–222.

180
https://doi.org/10.1785/gssrl.68.1.199
Spudich, P., Rowshandel, B., Shahi, S.K., Baker, J.W., Chiou, B.S.J., (2014). Comparison of NGA-West2 directivity models. Earthquake Spectra 30, 1199–1221. https://doi.org/10.1193/080313EQS222M
Stein, S., Liu, M., (2009). Long aftershock sequences within continents and implications for earthquake hazard assessment. Nature 462, 87–89. https://doi.org/10.1038/nature08502
Stone, J.O., (2000). Air pressure and cosmogenic isotope production. Journal of Geophysical Research, 105, 23,753-23,759. https://doi.org/10.1029/2000JB900181
Sykes, L.R., (1978). Intraplate seismicity, reactivation of preexisting zones of weakness, alkaline magmatism, and other tectonism postdating continental fragmentation. Reviews of Geophysics 16, 621–688. https://doi.org/10.1029/RG016i004p00621
Tarbali, K., Bradley, B.A., Baker, J.W., (2019). Ground motion selection in the near-fault region considering directivity-induced pulse effects. Earthquake Spectra 35, 759–786. https://doi.org/10.1193/102517EQS223M
Tchalenko, J.S., Ambraseys, N.N., (1970). Structural analysis of the Dasht-e Bayaz (Iran) earthquake fractures. Bulletin of the Geological Society of America 81, 41–60. https://doi.org/10.1130/0016-7606(1970)81[41:SAOTDB]2.0.CO;2
Thom, R., (1971). A recent fault scarp in the Lort River area, Ravensthorpe 1:250 000 sheet, in: Geological Survey of Western Australia Annual Report 1971. Geological Survey of Western Australia, Perth, Australia, pp. 58–59.
Tracey, R.M., (1982). Analysis of Repeat Levelling Measurements to Give Ground Deformation, Southwest Australia (BMR Record 1982/30). Bureau of Mineral Resources, Geology and Geophysics.
Tuttle, M.P., (2002). The Earthquake Potential of the New Madrid Seismic Zone. Bulletin of the Seismological Society of America 92, 2080–2089. https://doi.org/10.1785/0120010227
Twidale, C.R., Bourne, J.A., (2000). Rock bursts and associated neotectonic forms at Minnipa hill, northwestern Eyre Peninsula, South Australia. Environmental and Engineering Geoscience 6, 129–140.
Vallage, A., Klinger, Y., Grandin, R., Bhat, H.S., Pierrot-Deseilligny, M., (2015). Inelastic surface deformation during the 2013 Mw7.7 Balochistan, Pakistan, earthquake. Geology 43, 1079–1082. https://doi.org/10.1130/G37290.1
Verhoeven, T.J., Russell, P.W., (1981). Tennant Creek Water Supply 1979 - 1980 Source Investigation [Kelly Well] (Report 27/1981). Department of Transport and Works, Alice Springs, Australia. http://hdl.handle.net/10070/229202
Vogfjord, K.S., Langston, C.A., (1987). The Meckering earthquake of 14 October 1968: A possible downward propagating rupture. Bulletin of the Seismological Society of America 77, 1558–1578.
Wade, B.P., Kelsey, D.E., Hand, M., Barovich, K.M., (2008). The Musgrave Province: Stitching north, west and south Australia. Precambrian Research 166, 370–386. https://doi.org/10.1016/j.precamres.2007.05.007
Wallace, M.W., Dickinson, J.A., Moore, D.H., Sandiford, M., (2005). Late Neogene strandlines of southern Victoria: A unique record of eustasy and tectonics in southeast

181
Australia. Australian Journal of Earth Sciences 52, 279–297. https://doi.org/10.1080/08120090500139455
Walsh, F.J., Sparrow, A.D., Kendrick, P., Schofield, J., (2016). Fairy circles or ghosts of termitaria? Pavement termites as alternative causes of circular patterns in vegetation of desert Australia. Proceedings of the National Academy of Sciences 113, 201607860. https://doi.org/10.1073/pnas.1607860113
Wang, S., Xu, W., Xu, C., Yin, Z., Bürgmann, R., Liu, L., Jiang, G., (2019). Changes in groundwater level possibly encourage shallow earthquakes in central Australia: The 2016 Petermann Ranges earthquake. Geophysical Research Letters 46, 3189–3198. https://doi.org/10.1029/2018GL080510
Wells, D.L., Coppersmith, K.J., (1994). New Empirical Relationships among Magnitude, Rupture Length, Rupture Width, Rupture Area, and Surface Displacement. Bulletin of the Seismological Society of America 84, 974–1002.
Wesnousky, S.G., (2008). Displacement and geometrical characteristics of earthquake surface ruptures: Issues and implications for seismic-hazard analysis and the process of earthquake rupture. Bulletin of the Seismological Society of America 98, 1609–1632. https://doi.org/10.1785/0120070111
Wilde, S.A., Low, G.H., Lake, R.W., (1978). Perth 1:250 000 Geological Map Sheet. Geological Survey of Western Australia, Perth, Western Australia.
Wilde, S.A., Middleton, M.F., Evans, B.J., (1996). Terrane accretion in the southwestern Yilgarn Craton: evidence from a deep seismic crustal profile. Precambrian Research 78, 179–196. https://doi.org/10.1016/0301-9268(95)00077-1
Williams, I.R., (1978). Recent fault scarps in the Mount Narryer area, byro 1:250 000 sheet, in: Geological Survey of Western Australia Annual Report 1978. Geological Survey of Western Australia, Perth, Australia.
Xie, J., (2019). Strong-Motion Directionality and Evidence of Rupture Directivity Effects during the Chi-Chi M w 7 . 6 Earthquake. Bulletin of the Seismological Society of America XX, 1–17. https://doi.org/10.1785/0120190087
Yadav, K.K., Gupta, V.K., (2017). Near-fault fling-step ground motions: Characteristics and simulation. Soil Dynamics and Earthquake Engineering 101, 90–104. https://doi.org/10.1016/j.soildyn.2017.06.022
Yim, C.-S., Chopra, A.K., Penzien, J., (1980). Rocking response of rigid blocks to earthquakes. Earthquake Engineering and Structural Dynamics 8, 565–587. https://doi.org/10.1002/eqe.4290080606
Yu, G., Xu, X., Klinger, Y., Diao, G., Chen, G., Feng, X., Li, C., Zhu, A., Yuan, R., Guo, T., Sun, X., Tan, X., An, Y., (2010). Fault-Scarp Features and Cascading-Rupture Model for the Mw 7.9 Wenchuan Earthquake, Eastern Tibetan Plateau, China. Bulletin of the Seismological Society of America 100, 2590–2614. https://doi.org/10.1785/0120090255
Zhan, Y., Hou, G., Kusky, T., Gregg, P.M., (2016). Stress development in heterogenetic lithosphere: Insights into earthquake processes in the New Madrid Seismic Zone. Tectonophysics 671, 56–62. https://doi.org/10.1016/j.tecto.2016.01.016
Zondervan, A., Hauser, T.M., Kaiser, J., Kitchen, R.L., Turnbull, J.C., West, J.G., (2015). XCAMS: The compact 14C accelerator mass spectrometer extended for 10Be and 26Al at GNS Science, New Zealand. Nuclear Instruments and Methods in Physics Research, Section

182
B: Beam Interactions with Materials and Atoms 361, 25–33. https://doi.org/10.1016/j.nimb.2015.03.013
183
APPENDIX A: FIRST AUTHOR PREPRINT PAPERS
Seven preprints summarising available data for nine of the eleven historic Australian surface
rupturing earthquakes were written to act as accompanying review papers for King, Quigley,
& Clark (2019g). These are presented as appendices for Chapter 5 minor formatting changes.
All preprints are available on EarthArXiv.com. The preprint manuscripts are presented in
the following order:
Page 184: King, T. R., M. C. Quigley, and D. Clark (2019) Review paper: The 14th October 1968 Mw 6.6 Meckering surface rupturing earthquake, Australia, EarthArXiv Prepr., doi: https://doi.org/10.31223/osf.io/2zgrn.
Page 208: King, T. R., M. C. Quigley, and D. Clark (2019) Review paper: The 10th March 1970 Mw 5.0 Calingiri surface rupturing earthquake, Australia, EarthArXiv Prepr., doi: https://doi.org/10.31223/osf.io/egw4c.
Page 221: King, T. R., M. C. Quigley, and D. Clark (2019) Review paper: The 2nd June 1979 Mw 6.1 Cadoux surface rupturing earthquake, Australia, EarthArXiv Prepr., doi: https://doi.org/10.31223/osf.io/9dhx8.
Page 239: King, T. R., M. C. Quigley, and D. Clark (2019) Review paper: The 30th March 1968 Mw 5.7 Marryat Creek surface rupturing earthquake, Australia, EarthArXiv Prepr., doi: https://doi.org/10.31223/osf.io/5ysfx.
Page 255: King, T. R., M. C. Quigley, D. Clark, S. Valkaniotis, H. Mohammadi, and W. D. Barnhart (2019) The 1987 to 2019 Tennant Creek, Australia, earthquake sequence: a protracted intraplate multi-mainshock sequence, EarthArXiv Prepr., doi: https://doi.org/10.31223/osf.io/j4nk7.
Page 286: King, T. R., M. C. Quigley, and D. Clark (2019) Review paper: The 23rd March 2012 Mw 5.2 Pukatja surface rupturing earthquake, Australia, EarthArXiv Prepr., doi: https://doi.org/10.31223/osf.io/p73ae.
Page 297: King, T. R., M. C. Quigley, and D. Clark (2019) Review paper: The 20th May 2016 Mw 6.1 Petermann surface rupturing earthquake, Australia, EarthArXiv Prepr., doi: https://doi.org/10.31223/osf.io/gbp9t.
Page 311: Reference list for all preprint manuscripts
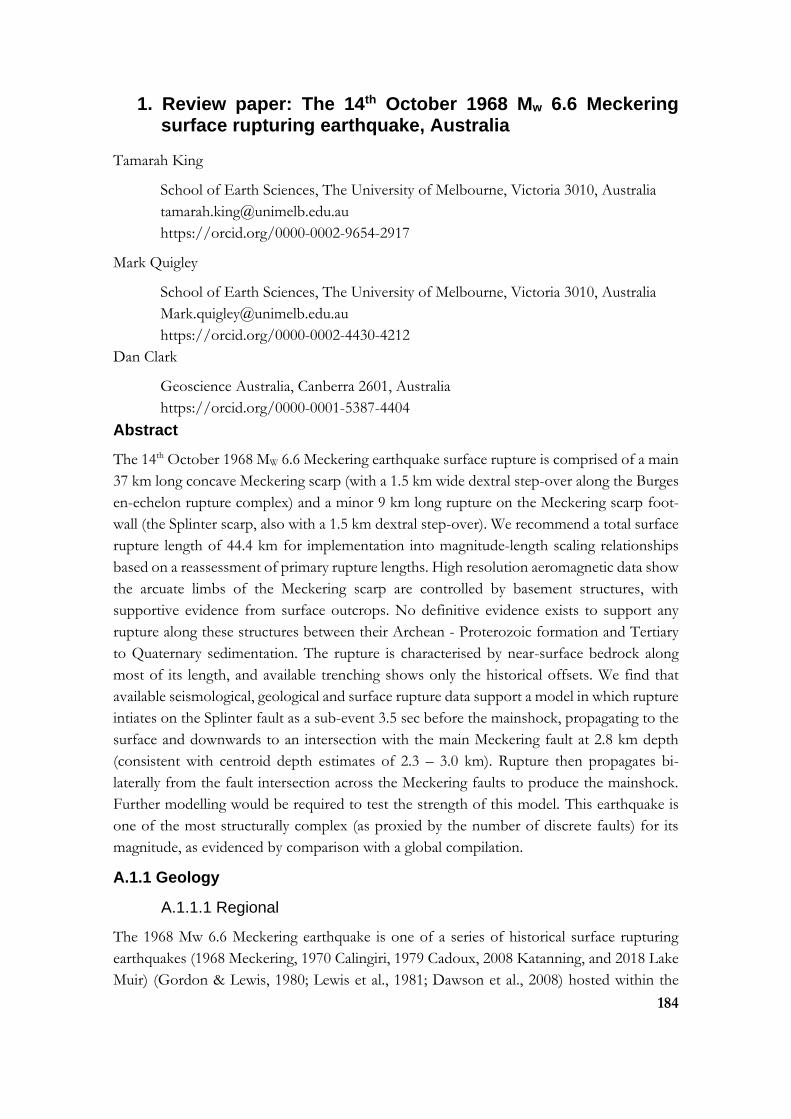
184
1. Review paper: The 14th October 1968 Mw 6.6 Meckering surface rupturing earthquake, Australia
Tamarah King
School of Earth Sciences, The University of Melbourne, Victoria 3010, Australia
https://orcid.org/0000-0002-9654-2917
Mark Quigley
School of Earth Sciences, The University of Melbourne, Victoria 3010, Australia
https://orcid.org/0000-0002-4430-4212
Dan Clark
Geoscience Australia, Canberra 2601, Australia
https://orcid.org/0000-0001-5387-4404
Abstract
The 14th October 1968 MW 6.6 Meckering earthquake surface rupture is comprised of a main
37 km long concave Meckering scarp (with a 1.5 km wide dextral step-over along the Burges
en-echelon rupture complex) and a minor 9 km long rupture on the Meckering scarp foot-
wall (the Splinter scarp, also with a 1.5 km dextral step-over). We recommend a total surface
rupture length of 44.4 km for implementation into magnitude-length scaling relationships
based on a reassessment of primary rupture lengths. High resolution aeromagnetic data show
the arcuate limbs of the Meckering scarp are controlled by basement structures, with
supportive evidence from surface outcrops. No definitive evidence exists to support any
rupture along these structures between their Archean - Proterozoic formation and Tertiary
to Quaternary sedimentation. The rupture is characterised by near-surface bedrock along
most of its length, and available trenching shows only the historical offsets. We find that
available seismological, geological and surface rupture data support a model in which rupture
intiates on the Splinter fault as a sub-event 3.5 sec before the mainshock, propagating to the
surface and downwards to an intersection with the main Meckering fault at 2.8 km depth
(consistent with centroid depth estimates of 2.3 – 3.0 km). Rupture then propagates bi-
laterally from the fault intersection across the Meckering faults to produce the mainshock.
Further modelling would be required to test the strength of this model. This earthquake is
one of the most structurally complex (as proxied by the number of discrete faults) for its
magnitude, as evidenced by comparison with a global compilation.
A.1.1 Geology
A.1.1.1 Regional
The 1968 Mw 6.6 Meckering earthquake is one of a series of historical surface rupturing
earthquakes (1968 Meckering, 1970 Calingiri, 1979 Cadoux, 2008 Katanning, and 2018 Lake
Muir) (Gordon & Lewis, 1980; Lewis et al., 1981; Dawson et al., 2008) hosted within the
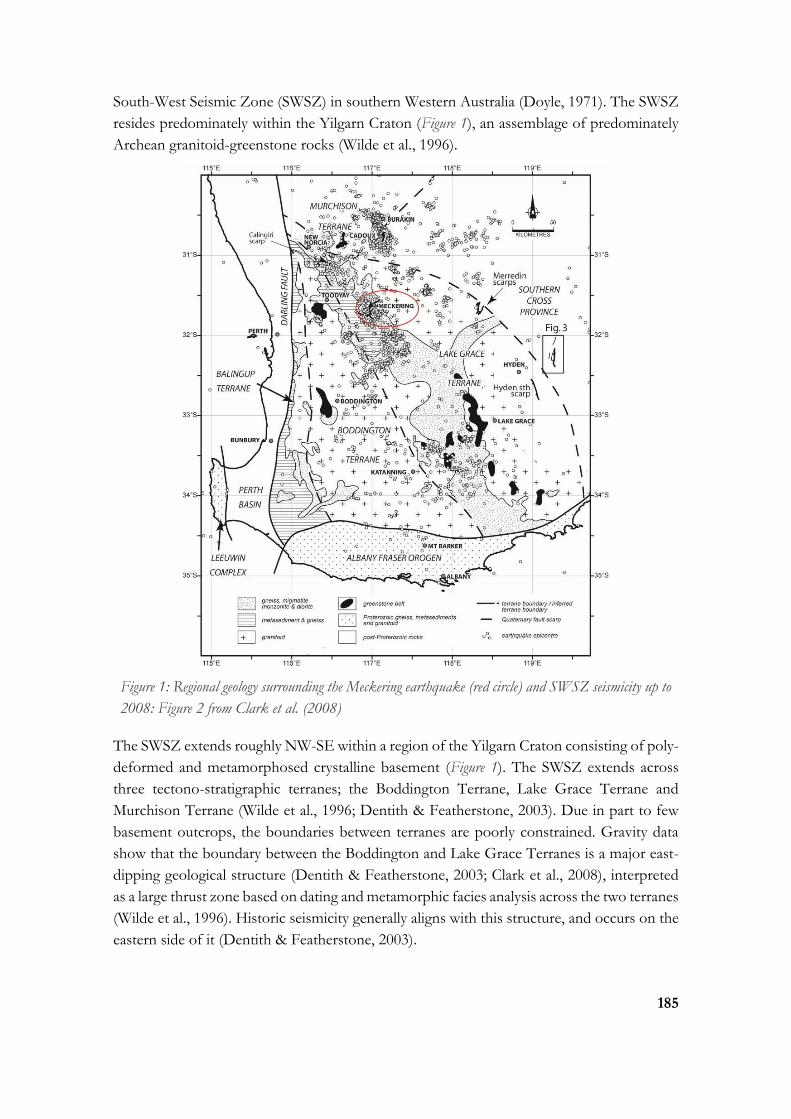
185
South-West Seismic Zone (SWSZ) in southern Western Australia (Doyle, 1971). The SWSZ
resides predominately within the Yilgarn Craton (Figure 1), an assemblage of predominately
Archean granitoid-greenstone rocks (Wilde et al., 1996).
Figure 1: Regional geology surrounding the Meckering earthquake (red circle) and SWSZ seismicity up to
2008: Figure 2 from Clark et al. (2008)
The SWSZ extends roughly NW-SE within a region of the Yilgarn Craton consisting of poly-
deformed and metamorphosed crystalline basement (Figure 1). The SWSZ extends across
three tectono-stratigraphic terranes; the Boddington Terrane, Lake Grace Terrane and
Murchison Terrane (Wilde et al., 1996; Dentith & Featherstone, 2003). Due in part to few
basement outcrops, the boundaries between terranes are poorly constrained. Gravity data
show that the boundary between the Boddington and Lake Grace Terranes is a major east-
dipping geological structure (Dentith & Featherstone, 2003; Clark et al., 2008), interpreted
as a large thrust zone based on dating and metamorphic facies analysis across the two terranes
(Wilde et al., 1996). Historic seismicity generally aligns with this structure, and occurs on the
eastern side of it (Dentith & Featherstone, 2003).

186
The Meckering and Calingiri events occurred along the edge of the Jimperding Metamorphic
Belt within the northern Lake Grace Terrane (Figure 1). The Jimperding belt consists of
“repeatedly deformed granitoids, gneisses, belts of metasedimentary rocks, small greenstone
belts and remnants of layered basic intrusions” (Dentith & Featherstone, 2003).
A.1.1.2 Local bedrock
Detailed geological mapping around Meckering identifies small bedrock outcrops of
predominately porphyritic or biotite granites, granitic gneiss and micro-monzogranite
including in close proximity to surface rupture (Lewis, 1969; Dentith et al., 2009) (See Fig. 5
of Dentith et al. (2009) for detailed map of near-rupture bedrock outcrops). High-resolution
aeromagnetic data collected across the Meckering area identified heterogenous bedrock
lithology and structure on a local scale (Dentith et al., 2009). Interpretation of this
geophysical data highlights two distinct near-vertical structural orientations, NW striking
layered rocks consistent with descriptions of the structure and lithology elsewhere in the
Jimperding Metamorphic Belt, and SW striking dikes and faults within a granitic area, that
overprint the layered rocks. The intersection of these structural grains occurs near the mid-
section of the Meckering surface rupture, coincident with the highest recorded vertical
displacements (Dentith et al., 2009). Figure 2 shows publicly available national total magnetic
intensity and bouguer gravity anomaly maps. The overall orientations of linear magnetic
anomalies identified by Dentith et al. (2009) are visible at the scale of this data, showing the
alignment of historic rupture and sets of linear magnetic anomalies. The southern section of
rupture is also aligned with a regional gravity anomaly associated with the east-dipping
boundary between the Boddington and Lake Grace Terranes.
Figure 2: Meckering scarp (black lines) relative to magnetic intensity and bouguer gravity anomaly maps.
National bouguer gravity anomaly map: http://pid.geoscience.gov.au/dataset/ga/101104 .
National total magnetic intensity map: http://pid.geoscience.gov.au/dataset/ga/89596. Higher
resolution magnetic data and interpretation in Dentith et al. (2009)
A.1.1.3 Surficial deposits
Bedrock is overlain with surface deposits of variable thickness including “massive ferricrete,
iron-rich pisolitic gravel and aeolian sand and alluvium” (Dentith et al., 2009) (Figure 3). A
trench dug in 1990 exposed > 2 m of “soil regolith derived from deep weathering of granitic
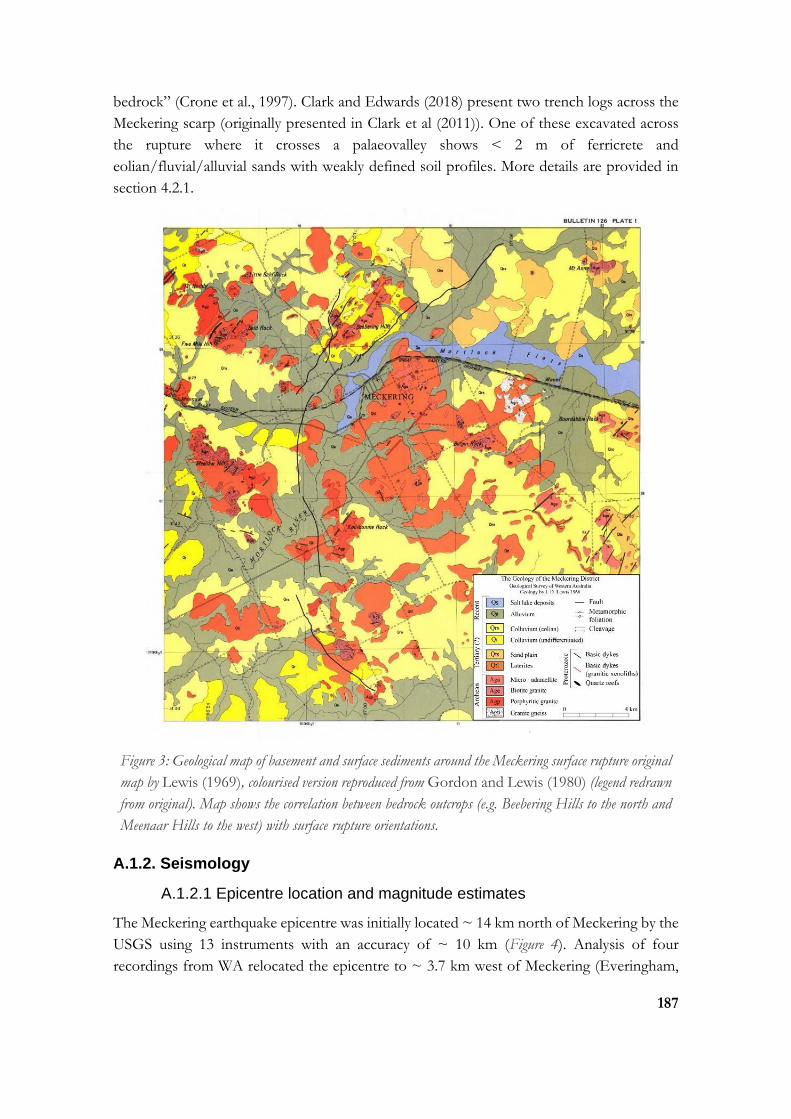
187
bedrock” (Crone et al., 1997). Clark and Edwards (2018) present two trench logs across the
Meckering scarp (originally presented in Clark et al (2011)). One of these excavated across
the rupture where it crosses a palaeovalley shows < 2 m of ferricrete and
eolian/fluvial/alluvial sands with weakly defined soil profiles. More details are provided in
section 4.2.1.
Figure 3: Geological map of basement and surface sediments around the Meckering surface rupture original
map by Lewis (1969), colourised version reproduced from Gordon and Lewis (1980) (legend redrawn
from original). Map shows the correlation between bedrock outcrops (e.g. Beebering Hills to the north and
Meenaar Hills to the west) with surface rupture orientations.
A.1.2. Seismology
A.1.2.1 Epicentre location and magnitude estimates
The Meckering earthquake epicentre was initially located ~ 14 km north of Meckering by the
USGS using 13 instruments with an accuracy of ~ 10 km (Figure 4). Analysis of four
recordings from WA relocated the epicentre to ~ 3.7 km west of Meckering (Everingham,
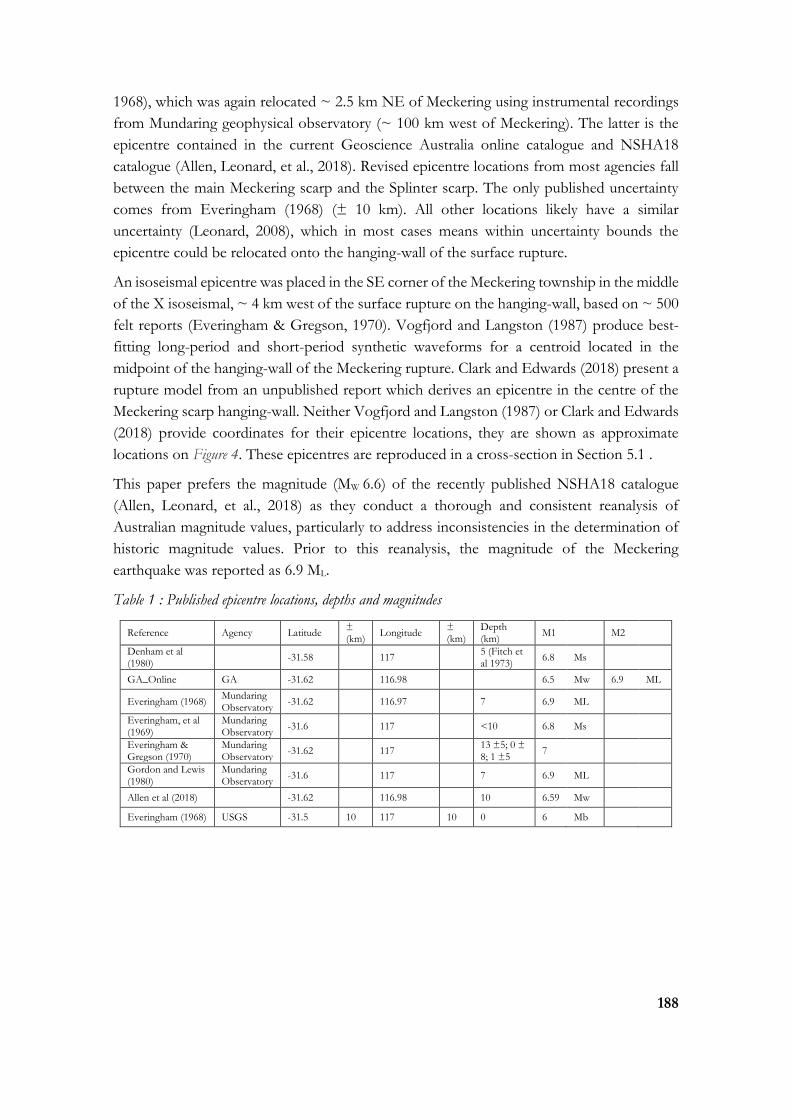
188
1968), which was again relocated ~ 2.5 km NE of Meckering using instrumental recordings
from Mundaring geophysical observatory (~ 100 km west of Meckering). The latter is the
epicentre contained in the current Geoscience Australia online catalogue and NSHA18
catalogue (Allen, Leonard, et al., 2018). Revised epicentre locations from most agencies fall
between the main Meckering scarp and the Splinter scarp. The only published uncertainty
comes from Everingham (1968) (± 10 km). All other locations likely have a similar
uncertainty (Leonard, 2008), which in most cases means within uncertainty bounds the
epicentre could be relocated onto the hanging-wall of the surface rupture.
An isoseismal epicentre was placed in the SE corner of the Meckering township in the middle
of the X isoseismal, ~ 4 km west of the surface rupture on the hanging-wall, based on ~ 500
felt reports (Everingham & Gregson, 1970). Vogfjord and Langston (1987) produce best-
fitting long-period and short-period synthetic waveforms for a centroid located in the
midpoint of the hanging-wall of the Meckering rupture. Clark and Edwards (2018) present a
rupture model from an unpublished report which derives an epicentre in the centre of the
Meckering scarp hanging-wall. Neither Vogfjord and Langston (1987) or Clark and Edwards
(2018) provide coordinates for their epicentre locations, they are shown as approximate
locations on Figure 4. These epicentres are reproduced in a cross-section in Section 5.1 .
This paper prefers the magnitude (MW 6.6) of the recently published NSHA18 catalogue
(Allen, Leonard, et al., 2018) as they conduct a thorough and consistent reanalysis of
Australian magnitude values, particularly to address inconsistencies in the determination of
historic magnitude values. Prior to this reanalysis, the magnitude of the Meckering
earthquake was reported as 6.9 ML.
Table 1 : Published epicentre locations, depths and magnitudes
Reference Agency Latitude ± (km)
Longitude ± (km)
Depth (km)
M1 M2
Denham et al (1980)
-31.58 117 5 (Fitch et al 1973)
6.8 Ms
GA_Online GA -31.62 116.98 6.5 Mw 6.9 ML
Everingham (1968) Mundaring Observatory
-31.62 116.97 7 6.9 ML
Everingham, et al (1969)
Mundaring Observatory
-31.6 117 <10 6.8 Ms
Everingham & Gregson (1970)
Mundaring Observatory
-31.62 117 13 ±5; 0 ± 8; 1 ±5
7
Gordon and Lewis (1980)
Mundaring Observatory
-31.6 117 7 6.9 ML
Allen et al (2018) -31.62 116.98 10 6.59 Mw
Everingham (1968) USGS -31.5 10 117 10 0 6 Mb
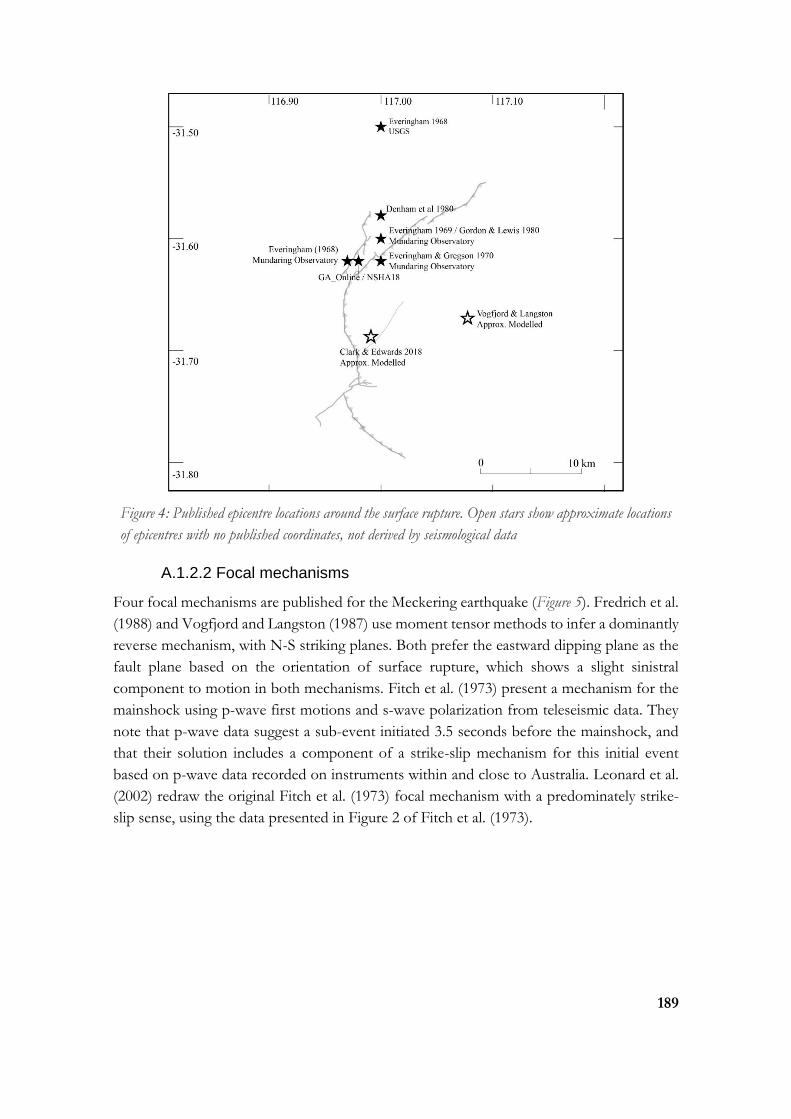
189
Figure 4: Published epicentre locations around the surface rupture. Open stars show approximate locations
of epicentres with no published coordinates, not derived by seismological data
A.1.2.2 Focal mechanisms
Four focal mechanisms are published for the Meckering earthquake (Figure 5). Fredrich et al.
(1988) and Vogfjord and Langston (1987) use moment tensor methods to infer a dominantly
reverse mechanism, with N-S striking planes. Both prefer the eastward dipping plane as the
fault plane based on the orientation of surface rupture, which shows a slight sinistral
component to motion in both mechanisms. Fitch et al. (1973) present a mechanism for the
mainshock using p-wave first motions and s-wave polarization from teleseismic data. They
note that p-wave data suggest a sub-event initiated 3.5 seconds before the mainshock, and
that their solution includes a component of a strike-slip mechanism for this initial event
based on p-wave data recorded on instruments within and close to Australia. Leonard et al.
(2002) redraw the original Fitch et al. (1973) focal mechanism with a predominately strike-
slip sense, using the data presented in Figure 2 of Fitch et al. (1973).

190
Figure 5: Published focal mechanisms and simplified surface rupture map, digitised from original sources.
Preferred plane of the reference publication is shown in red.
A.1.2.3 Depth
Hypocentral depth estimates from seismic analysis vary from 1 to 10 km, with Gordon and
Lewis (1980) describing initial depths of 0 ± 8 km from the USGS and 7 ± 5 from the
Mundaring Observatory (Everingham, 1968). Everingham and Gregson (1970) derive a 13
± 5 km focal depth based on isoseismal contours. These solutions are too deep to have
produced the observed surface rupture, based on seismic moment estimates. The
hypocentral depth from a rupture model presented in Clark and Edwards (2018) is roughly
2.5 km based on a 37° dip, with an epicentre in the central area of the Meckering scarp
hanging-wall.
Fitch et al. (1973) suggest aftershock locations support a mainshock depth < 10 km
(aftershock depths were not presented). Depth estimates of < 10 km were also made based
on interpretation of seismic data from four WA stations, 13 USGS stations, and
macroseismal intensities (Everingham et al., 1969). Reanalysis of seismic waveform data
suggested shallow fore- and aftershock events (1 - 2 km), which were used to support a
shallow hypocentre at 1.5 km (Langston, 1987; Vogfjord & Langston, 1987). Body wave
inversion methods were used to obtain an optimal centroid of moment release depth of 3
km and a scenario where a fault plane with maximum width 10 km (in the mid-point of the
surface rupture) ruptures down to a depth of 6 km (Vogfjord & Langston, 1987). Fredrich
et al. (1988) obtain a similar optimal centroid depth of 2.3 km by analysing the interaction of
SH and P waveform data.
A.1.2.4 Bi/uni lateral rupture
Vogfjord and Langston (1987) derive source parameters from body wave inversions and use
these to model two scenarios of either shallow earthquake initiation and downward
propagation of energy, or deeper initiation and upward propagation. They acknowledge that
long period waveforms match either model, but they favour a shallow initiation model based
on short-period waveform results and interpretation of the crustal setting of the earthquake.
They acknowledge that short-period records are not deterministic of exact initiation depth.

191
Clark and Edwards (2018) present a rupture model from an unpublished report which shows
rupture nucleation in the centre of the Meckering scarp hanging-wall, propagating bi-laterally
to create slip along the southernmost segment, and shallow slip in the northern segment.
Their model incorporates both teleseismic body waves and surface offset measurements
along three modelled faults aligned to the arcuate surface rupture.
We propose in this paper a model where rupture initiates on the Splinter fault producing the
sub-event which occurred 3.5 sec before the mainshock (Fitch et al., 1973; Vogfjord &
Langston, 1987; Fredrich et al., 1988). The Splinter scarp orientation matches well with the
Fitch et al. (1973) P-wave first motion focal mechanism. Fredrich et al. (1988) suggest that
the P-wave first motion data may describe a change in the fault plane orientation and dip
following rupture initiation related to multiple faults rupturing, but discount this as unlikely
(with no further discussion provided). We suggest that the data best match a model where
rupture initiates on the Splinter fault and propagates upwards to the surface and down to an
intersection with the central and/or northern faults of the Meckering fault system, before
propagating bi-laterally along all faults within the Meckering system (as defined in Section
3.2) producing the mainshock event.
Fredrich et al. (1988) derive a seismic moment which includes the sub-event and suggest that
their total seismic moment is approximately 25 % greater than seismic moment derived by
Vogfjord and Langston (1987) who omit the initial sub-event from their calculation. We
calculate width of the Splinter Fault (5.6 km) using W = Mo / µDL where:
• Mo is the difference of the Fredrich et al. (1988) and Vogfjord and Langston (1987)
solutions (10.4 * 1025 – 8.2 * 1025 dyne/cm = 2.2 * 1025 dyne/cm);
Note: Fredrich et al. (1988) report their Mo as 10.4 * 1018 Nm, but we assume they
mean 10.4 * 1025 dyne/cm as the reported units convert to an unreasonably low
seismic moment. There is some uncertainty in their seismic moment as we could not
replicate the reported value with the parameters they provide.
• L (length) is 9 km based on surface rupture length (Section 4.2);
• D is length-weighted average net-slip of 1.34 m (see King et al. (2019) (in review) for
details on the derivation of this value);
• µ is shear modulus (shear wave velocity squared x density) based on parameters from
Fredrich et al. (1988) (shear wave velocity = 3.4 km s-1, density = 2.8 g cm-3.
We test our model by assuming the Splinter fault meets the Meckering at the base of the
derived Splinter fault width (3.8 km). Assuming a planar geometry and applying a preferred
dip for the Splinter fault (30° ± 10°) and Meckering central / north faults (40° ± 10°) (based
on surface measurements see Section 3.4 and Gordon and Lewis (1980)) produces a depth
of intersection at 2.8 km (consistent with centroid depth estimates of 2.3 - 3 km(Vogfjord &
Langston, 1987; Fredrich et al., 1988)) at a distance of 3.3 km SE of the Meckering scarp
(almost directly underneath the town of Meckering).
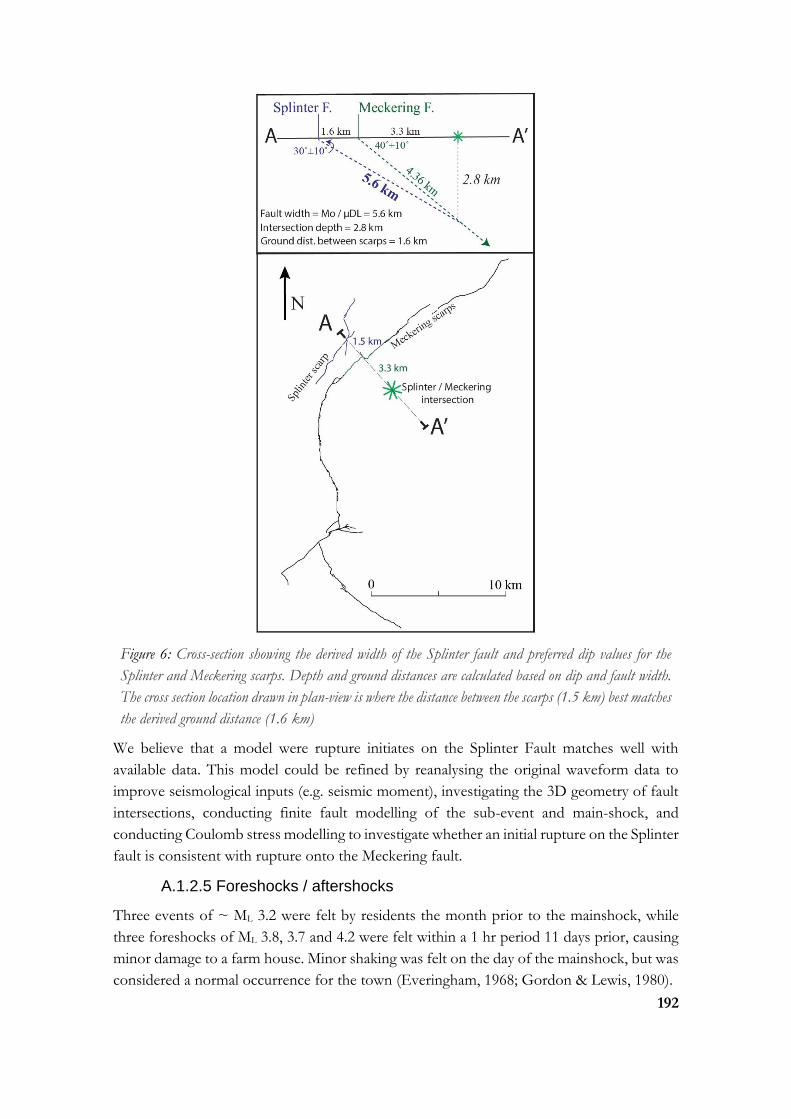
192
Figure 6: Cross-section showing the derived width of the Splinter fault and preferred dip values for the
Splinter and Meckering scarps. Depth and ground distances are calculated based on dip and fault width.
The cross section location drawn in plan-view is where the distance between the scarps (1.5 km) best matches
the derived ground distance (1.6 km)
We believe that a model were rupture initiates on the Splinter Fault matches well with
available data. This model could be refined by reanalysing the original waveform data to
improve seismological inputs (e.g. seismic moment), investigating the 3D geometry of fault
intersections, conducting finite fault modelling of the sub-event and main-shock, and
conducting Coulomb stress modelling to investigate whether an initial rupture on the Splinter
fault is consistent with rupture onto the Meckering fault.
A.1.2.5 Foreshocks / aftershocks
Three events of ~ ML 3.2 were felt by residents the month prior to the mainshock, while
three foreshocks of ML 3.8, 3.7 and 4.2 were felt within a 1 hr period 11 days prior, causing
minor damage to a farm house. Minor shaking was felt on the day of the mainshock, but was
considered a normal occurrence for the town (Everingham, 1968; Gordon & Lewis, 1980).

193
Two temporary seismometers were deployed by the Mundaring Geophysical Observatory
immediately following the earthquake (Everingham, 1968; Everingham & Gregson, 1971).
Between 1968 and 1976 the observatory published data for 142 aftershocks greater than ML
2.9, with the largest a ML 5.7 the day after the mainshock (Everingham & Gregson, 1971;
Gordon & Lewis, 1980). Locals reported damage caused by aftershock activity including new
surface cracking and damage to shop interiors following small magnitude events unrecorded
at the Mundaring Observatory (Gordon & Lewis, 1980). Given the damage described it is
assumed these aftershocks were very shallow events (< 1 km).
Original published aftershock data do not contain location uncertainties, and occur on both
the east and west sides of the rupture (e.g. on both the hanging-wall and foot-wall). Original
data also do not contain depth analysis, though reanalysis of aftershock waveforms using sP-
P ratios determined shallow depths (< 2 km) for aftershocks (Langston, 1987). This
reanalysis does not map the aftershocks relative to the surface rupture location or geometry.
Lewis (1990b) present analysis of a 1990 ML 5.5 earthquake located close to the rupture trace
on the hanging-wall of the Meckering scarp.
A.1.3 Surface rupture
A.1.3.1 Authors / map quality
The Meckering fault ruptured predominately across pastoral properties ~134 km from Perth
along a main highway. This event was easy to access, and thorough mapping of the rupture
was conducted directly onto aerial images during the months following the event
(Everingham, 1968; Lewis, 1969; Gordon & Lewis, 1980). The rupture trace was not
surveyed along, and only a few cadastral surveyed profiles were completed across the rupture
where it offset infrastructure. The highest resolution complete published map of the rupture
comes from a comprehensive 250-page report by Gordon and Lewis (1980) (Lewis (1990)
provides a 2-page summary of the main report) and is at a 1 : 50 000 scale, with two 1 : 500
detailed maps. The rupture trace from this map is reproduced in the GA Neotectonics
Features database (Clark, 2012), and sections of the rupture are visible in Google and Bing
satellite imagery, though they do not always align with the digitised rupture due to datum
transformation differences.
A.1.3.2 Length and shape
The surface rupture was mapped as 3 major faults, the Meckering fault, Splinter Fault and
Burges Fault Complex (Gordon, 1971; Gordon & Lewis, 1980). Other minor ‘faults’ include
Posterior Fault, Robinson Fault, Anterior Fault, Sudholz Fault and Chordal Fault (Gordon
& Lewis, 1980). Later historical Australian surface ruptures were classified as scarps, which
avoids confusion between topographic expression of surface deformation and underlying
geological structures (or seismological approximations of geological structures). To avoid
confusion, we adopt this nomenclature for the Meckering structures mapped as ‘faults’ and
refer to them as scarps when describing surface observations.

194
The 37 km long Meckering Scarp is the surface expression of the main rupture; it has an
arcuate shape which is concave relative to the hanging-wall and preferred epicentre location.
Authors prior to Gordon and Lewis (1980) variably describe the length as 32 km to 43 km
long (Everingham, 1968; Gordon, 1968; Conacher & Murray, 1969; Everingham et al., 1969).
The rupture has four 0.3 to 1.5 km wide step-overs separating strands of 6 to 11 km length,
with multiple < 300 m steps mapped along its length. The step-overs are all linked by
extensional fractures or rupture ramps as mapped on the 1 : 50 000 map (Gordon & Lewis,
1980).
The Splinter scarp is 9 km long and has a 1.5 km wide step-over between linear segment
lengths of ~ 1.6 and 4.8 km. It occurs on the foot-wall of the Meckering scarp, ~ 0.4 to 9
km to the NW, and is parallel for some of its length. The Splinter scarp hosts displacements
up to 0.67 m and is considered to be a primary rupture by this paper because it shows length,
displacement and orientation consistent with primary slip along basement structures
proximal to the main scarp. It is not counted in the original 37 km Meckering scarp length
(Figure 7b).
The ‘Burges Fault Complex’ is a set of complex ruptures, fractures and fissures comprising
the Burges scarp, Robinson scarp, Anterior scarp and Posterior scarp. The Burges scarp and
Anterior scarp are 1.8 km and 1.2 km long and run between the biggest step-over in the
Meckering scarp trace. These are best described as a network of dense short en-echelon
fracture/ramp structures along a semi-linear trend. Together they accommodate vertical
displacements up to 0.60 m and are considered primary rupture by this paper. They are not
counted in the original 37 km Meckering scarp length (Figure 7b).
The Robinson scarp is a ~ 3.7 km long extension of the Burgess scarp onto the foot-wall of
the Meckering scarp, and the Posterior scarp is a ~ 2 km long extension onto the hanging-
wall. These scarps accommodate minor offset and may better be defined as networks of
secondary fractures and fissures.
The “Chordal Fault” and “Sudholz Fault” are hanging-wall features ~ 6.5 km and 4 km long.
The Chordal scarp is associated with lateral and normal surface offset, and was only noted
by the land owner six weeks after the main rupture. It is interpreted by the Gordon and Lewis
(1980) as either aftershock related or a result of hanging-wall settling following the main
uplift and is probably better classified as a secondary extensional fracture or fissure. The
Sudholz scarp was recognised seven months after the mainshock as a 400 m long series of
discontinuous extensional fractures across the Mortlock River. Again, it may be better
described as secondary extensional fractures (potentially related to aftershock activity) rather
than primary rupture.
Figure 7 shows various measures of length along the Meckering scarp including the length
reported by Gordon and Lewis (1980), quoted in subsequent publications (Fig. 7b). This
length does not include the Splinter or Burges ruptures, though those two scarps have
displacement characteristics of primary ruptures. Including these features shows a length of
45.8 km (Fig. 7c). Figure 7d simplifies ruptures to straight traces and defines distinct faults

195
where mapped primary rupture has gaps/steps > 1 km and/or where strike changes by >
20° for distances > 1 km. This results in five faults being defined, explored in more detail in
King et al. (2019) (in review).
Figure 7e presents portions of the scarp where more than two vertical displacement
measurements of greater than 0.2 m occur within a distance of 1 km (data from Gordon and
Lewis (1980)). Applying cosmogenic erosion rates from lithologically and climatically
analogous settings of Australia (0.3 – 5 m/Myr; Bierman and Caffee, 2002) suggests that 0.2
m of scarp height could be removed within 35 – 660 kyrs, leaving 25 km of rupture length
(i.e., 25 km of residual surface rupture with relief ≥ 0.2m) visible in the landscape. This
suggests that the surface scarp may persist within this landscape as a mappable scarp, and
places some constraints on recurrence as no topography from prior rupture is visible in the
landscape today. In this calculation we assume that the scarp is shallowly underlain by
granitic bedrock and that the scarp erodes more rapidly than the surrounding terrain at rates
commensurate with Bierman and Caffee (2002). We do not account for erosion rates of any
duricrust which may overlie granitic bedrock or anthropogenically- and/or climatically-
modulated variations in erosion rates.
Figure 7: Measures of length for the Meckering surface rupture and underlying faults.
A.1.3.3 Scarp strike
The relatively linear northern section of the Meckering scarp has a general strike of 050°, the
central section is highly arcuate but has a general trend towards 005°, and the slightly less
arcuate southern section has a strike of 320°. The Splinter scarp has an overall strike of 030°
(the Meckering scarp strikes towards 045° where the two are coincident with each other).
The Burgess scarp complex strikes 045°, with a 40 - 50° inter-scarp angle compared to the
strike of the Meckering scarp in this location.
A.1.3.4 Dip
Measured dip of the surface rupture is highly variable between 15 – 54° (Figure 8) (Gordon
& Lewis, 1980). Authors recording dip suggest these variations occur based on type and
depth of surficial sediments (Everingham et al., 1969; Gordon & Lewis, 1980). Dip derived
based on the calculated slip direction (from measured lateral, vertical and horizontal/heave

196
offset) shows much more confined range of values, averaging 40°. Both sets of data seem to
show shallower dips on the southern portion of scarp (~ 20 - 30°), and steeper in the north
(~ 40 - 50°). Average dip of the Meckering Scarp has been reported as 35° (Everingham,
1968), 39° (Gordon & Lewis, 1980) and 42° (Lewis, 1990a). The Splinter fault shows a
measured dip of 30° and calculated dips of 24 - 41°, with a reported overall dip of 28°
(Gordon & Lewis, 1980). The unpublished rupture model presented in Clark and Edwards
(2018) uses a three fault model with dip constrained to 37° for each fault plane, possibly
derived from the focal mechanism of Vogfjord and Langston (1987), which has a preferred
dip of 37°.
Figure 8: Map of the Meckering scarps, fractures, and dip measurements. Surface data from Gordon and
Lewis (1980).
A.1.3.5 Morphology
The Meckering scarp has variable morphology including single discrete rupture, duplexing
discrete ruptures, back-thrusting, and broad warping of the hanging-wall relative to the foot-
wall (e.g. folding at the rupture trace rather than discrete rupture). Authors recognised that
197
these differences in rupture morphology correlate to differences in surficial sediment
composition (e.g. sandy river sediments vs. clay-rich ploughed fields) and thickness (e.g.
where bedrock was close to the surface) (Conacher & Murray, 1969; Everingham et al., 1969;
Gordon & Lewis, 1980). While these changes in morphology along short sections of scarp
are explored in detail in the text of Gordon and Lewis (1980), the complexity of rupture
morphology is not recorded on the 1 : 50 000 map. Aerial and ground images published in
various publications also show significantly more variation to the scarp morphology (e.g.
duplexing structures) than is shown on the 1 : 50 000 map, though this complexity is mapped
in detail for the Burgess scarp and Meckering town 1 : 500 maps (Gordon & Lewis, 1980).
These sections and aerial photos show that discontinuous discrete rupture, duplexing discrete
ruptures and small < 50 m wide step-overs were common along the Meckering scarp. Clark
and Allen (2018) digitise rupture traces visible in an aerial photograph published in Gordon
and Lewis (1980) to compare with modern drone derived imagery (Figure 12). They compare
the fine scale complexity visible 2-days after the rupture and how that complexity has
changed in the 50 years since rupture (Clark, 2018; Clark & Allen, 2018; Clark & Edwards,
2018).
Step-overs and breaks in the main rupture trace show dense fracture arrays connected
discontinuous discrete ruptures, and parallel extensional fractures are common along single
strands of discrete rupture. The other mapped scarps are characterised by less discrete
rupture and significantly more extensional fracturing, fractures with lateral displacement, and
fractures with no evident displacement, generally in linear en-echelon configurations to
define the scarp as mapped (Gordon & Lewis, 1980).
A.1.3.6 Lateral displacements
Dextral offset of the Meckering scarp was recorded where roads, train tracks, pipelines fences
and field furrows crossed the scarp, and from observed slickensides and relative movement
of fault segments and fracture networks (Figure 9). The maximum amount of dextral
displacement was 1.5 m recorded in the mid-section at the central apex of the curved rupture.
The four major stepovers between segments of the Meckering scarp show dextral
transtensional offset. The most prominent of these is the Burges scarp area which is
composed predominately of dextral en echelon fractures, related to transfer of compression
between segments of the Meckering scarp. Warped and bent train tracks that crossed the
scarp at an almost perpendicular angle clearly record the dextral movement. Gordon and
Lewis (1980) discount 16 of their 20 slickenside measurements as they do not appear to
match the sense of movement captured from surveyed displacements across the scarp. They
suggest these disparate results result from movement in two stages with pure thrust
propagation caused an opening between each side of the surface rupture prior to dextral
offset, so dextral slickensides were not be recorded (Gordon & Lewis, 1980). Alternate
explanations have not been proposed within the literature.
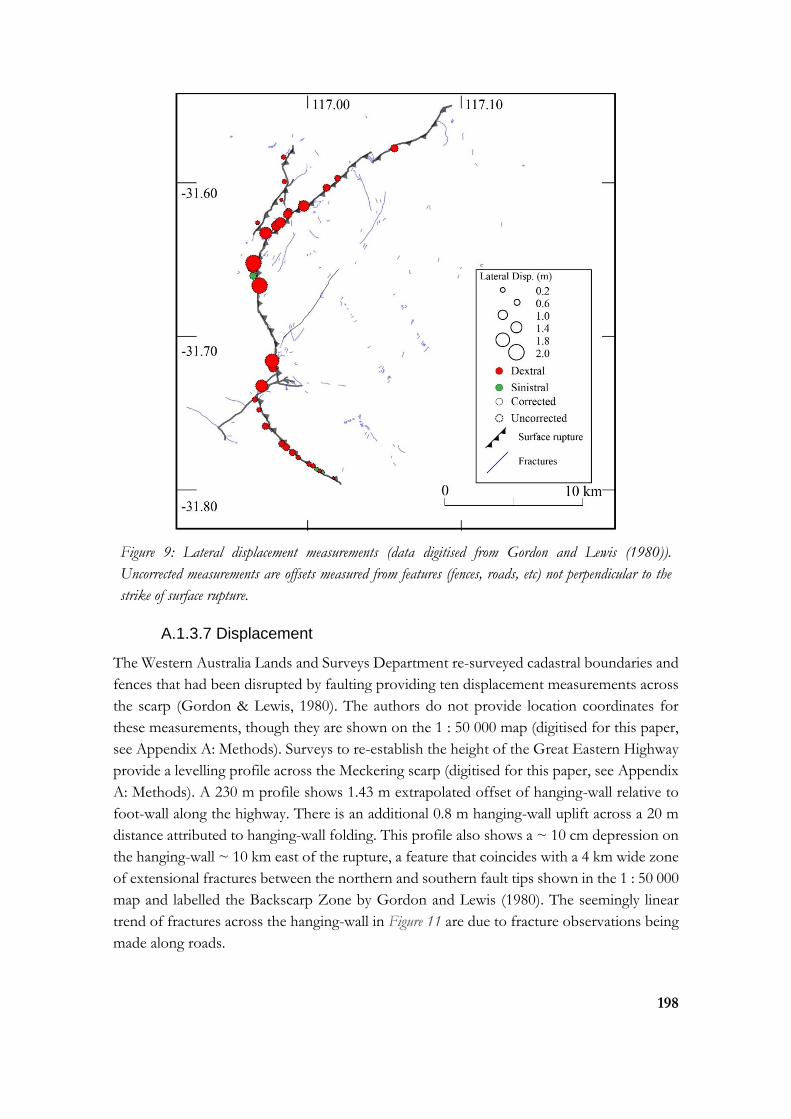
198
Figure 9: Lateral displacement measurements (data digitised from Gordon and Lewis (1980)).
Uncorrected measurements are offsets measured from features (fences, roads, etc) not perpendicular to the
strike of surface rupture.
A.1.3.7 Displacement
The Western Australia Lands and Surveys Department re-surveyed cadastral boundaries and
fences that had been disrupted by faulting providing ten displacement measurements across
the scarp (Gordon & Lewis, 1980). The authors do not provide location coordinates for
these measurements, though they are shown on the 1 : 50 000 map (digitised for this paper,
see Appendix A: Methods). Surveys to re-establish the height of the Great Eastern Highway
provide a levelling profile across the Meckering scarp (digitised for this paper, see Appendix
A: Methods). A 230 m profile shows 1.43 m extrapolated offset of hanging-wall relative to
foot-wall along the highway. There is an additional 0.8 m hanging-wall uplift across a 20 m
distance attributed to hanging-wall folding. This profile also shows a ~ 10 cm depression on
the hanging-wall ~ 10 km east of the rupture, a feature that coincides with a 4 km wide zone
of extensional fractures between the northern and southern fault tips shown in the 1 : 50 000
map and labelled the Backscarp Zone by Gordon and Lewis (1980). The seemingly linear
trend of fractures across the hanging-wall in Figure 11 are due to fracture observations being
made along roads.

199
Vertical displacement measured at displaced fence lines (tables 10 - 11 Gordon and Lewis
(1980), digitised for this paper) show a slightly asymmetrical along-fault displacement
envelope. Displacement values are at a maximum in the central parts of the rupture and
diminish where rupture curvature changes from N-S trending, to the NE-SW and SE-NW
trending limbs. Displacements south of the Burgess step-over are almost 50% lower on
average than those north of this feature (0.59 m and 1.21 m respectively). The displacement
envelope for the foot-wall Splinter scarp show maximum displacements along a 1.5 km NW-
SE trending step-over of the predominately NE-SW trending scarp, close to where the cross
section in Figure 6 is drawn.
Figure 10: displacement data along and across the Meckering scarp. Data digitised from Gordon and
Lewis (1980)
Figure 11: Vertical displacement measurements along the Meckering and Splinter scarps, digitised from
(Gordon & Lewis, 1980). (See Appendix A: Methods).

200
A.1.3.8 Environmental damage
Environmental damage is described by Gordon and Lewis (1980) and includes surface
rupture, fractures/cracking and fissures, landslides and rock falls, sand-blows, and
hydrological anomalies. The length and offset of the Meckering scarp fits the ESI-07 scale
classification X, which also fits descriptions of fissures developed along the rupture. Some
fractures/cracks have lengths and widths as described by ESI VIII, but most are better
characterised as ESI VI-VII.
Several small landslides were reported along road cuttings and gulleys in Perth (~ 140 km)
and south of Cunderdin (~ 25 km), and small rockfalls were reported along rail cuttings in
Avon Valley (~ 100 km) (Gordon & Lewis, 1980). Given a lack of information regarding
these events, we assign them ESI IV based on the number of reports and estimated
susceptibility of these environments to mass movements. A cave system at Yanchep 127 km
west of Meckering also reported damage to stalactite formations, with two caves closed due
to the damage (Gordon & Lewis, 1980). Several small sand blows were recorded on the
hanging-wall associated with salt-flats of the Mortlock River and groundwater flows adjacent
to railway tracks (Gordon & Lewis, 1980). We assign these to ESI V based on descriptions
in Serva et al. (2016). Three bore records from around Perth recorded the earthquake as a
vertical displacement of water height (Gordon, 1970; Everingham & Parkes, 1971; Gregson
et al., 1972; Gordon & Lewis, 1980), we assign these an ESI IV. Multiple authors note the
lack of damage to large trees within a few kilometres and along the rupture (Everingham,
1968; Everingham et al., 1969) and no shaking related vegetation damage could be seen in
any published photographs. Dead grass can be seen along the rupture in multiple
photographs, associated with root tear.
Gordon and Lewis (1980) document small ‘slumps’ which occur in proximity to extensional
features (e.g. the Chordal scarp on the hanging-wall) and seem to relate to internal
gravitational collapse from circular or arcuate extensional fractures (they may be similar to
‘polygonal cracking’ described in Fig 6. King et al. (2018). Gordon and Lewis (1980) describe
fractures identified near the 1970 Calingiri rupture ~ 100 km NE that appeared infilled and
many years old, which they suggest may relate to the 1968 Meckering earthquake, though the
evidence is circumstantial and unverified.
Gordon (1968) and later authors describe ~ 1.5 m vertical offset of the Mortlock River where
it crosses the fault, raising potential flood levels for Meckering township by 12 cm (Gordon
& Lewis, 1980). This and four other small offset drainages were cleared following the
earthquake to prevent future flooding events (Gordon & Lewis, 1980). Clark and Edwards
(2018) (Figure 12) present a comparison between rupture trace visible in a 1968 aerial
photograph, and the trace visible in 2018 drone derived imagery which shows significant
foot-wall ponding and sedimentation where the stream was offset. This geomorphic change
is also visible on Bing and Google satellite imagery. High resolution UAV derived elevation
models show the previous and new position of the tributary (Clark & Edwards, 2018).
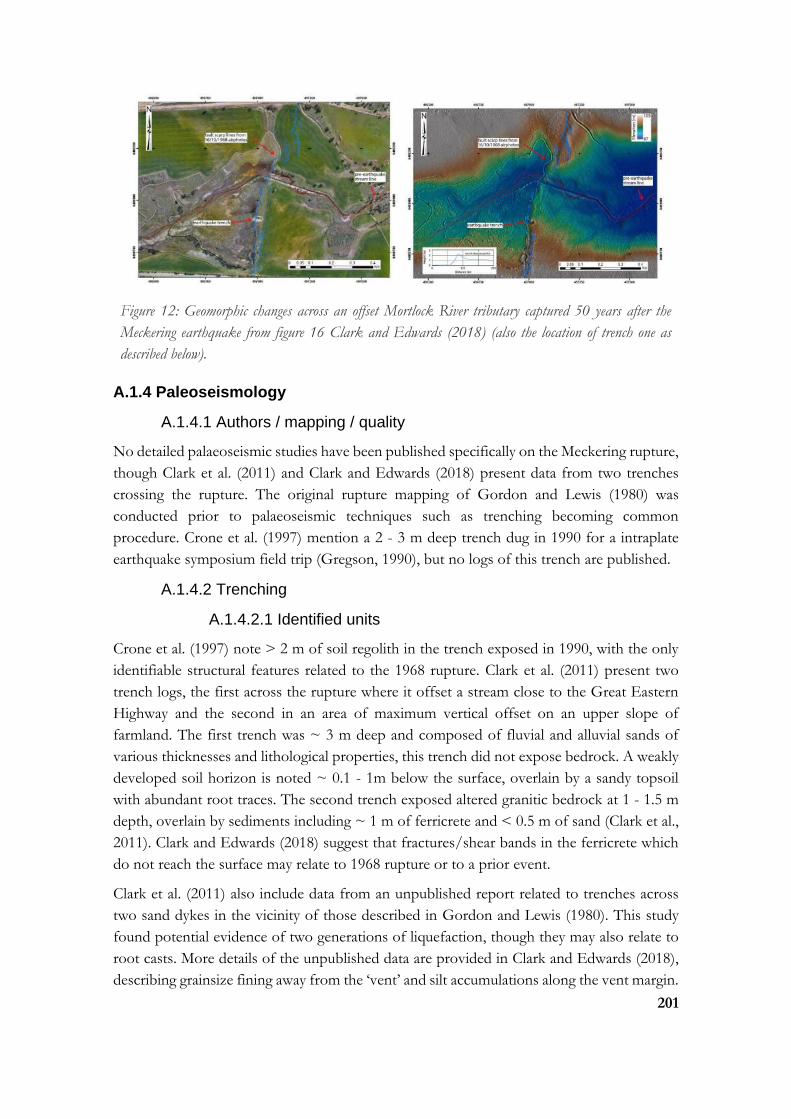
201
Figure 12: Geomorphic changes across an offset Mortlock River tributary captured 50 years after the
Meckering earthquake from figure 16 Clark and Edwards (2018) (also the location of trench one as
described below).
A.1.4 Paleoseismology
A.1.4.1 Authors / mapping / quality
No detailed palaeoseismic studies have been published specifically on the Meckering rupture,
though Clark et al. (2011) and Clark and Edwards (2018) present data from two trenches
crossing the rupture. The original rupture mapping of Gordon and Lewis (1980) was
conducted prior to palaeoseismic techniques such as trenching becoming common
procedure. Crone et al. (1997) mention a 2 - 3 m deep trench dug in 1990 for a intraplate
earthquake symposium field trip (Gregson, 1990), but no logs of this trench are published.
A.1.4.2 Trenching
A.1.4.2.1 Identified units
Crone et al. (1997) note > 2 m of soil regolith in the trench exposed in 1990, with the only
identifiable structural features related to the 1968 rupture. Clark et al. (2011) present two
trench logs, the first across the rupture where it offset a stream close to the Great Eastern
Highway and the second in an area of maximum vertical offset on an upper slope of
farmland. The first trench was ~ 3 m deep and composed of fluvial and alluvial sands of
various thicknesses and lithological properties, this trench did not expose bedrock. A weakly
developed soil horizon is noted ~ 0.1 - 1m below the surface, overlain by a sandy topsoil
with abundant root traces. The second trench exposed altered granitic bedrock at 1 - 1.5 m
depth, overlain by sediments including ~ 1 m of ferricrete and < 0.5 m of sand (Clark et al.,
2011). Clark and Edwards (2018) suggest that fractures/shear bands in the ferricrete which
do not reach the surface may relate to 1968 rupture or to a prior event.
Clark et al. (2011) also include data from an unpublished report related to trenches across
two sand dykes in the vicinity of those described in Gordon and Lewis (1980). This study
found potential evidence of two generations of liquefaction, though they may also relate to
root casts. More details of the unpublished data are provided in Clark and Edwards (2018),
describing grainsize fining away from the ‘vent’ and silt accumulations along the vent margin.

202
The authors note that these features are common in liquefaction-induced sand dykes, though
the features superficially resemble root-casts (Clark & Edwards, 2018).
Figure 13: Trench logs from unpublished study, included in (Clark et al., 2011), Clark and Edwards
(2018) and Clark (2018)
A.1.4.2.2 Structural interpretations
Structures exposed in the first trench shows historic displacement along three primary
rupture strands, with multiple tension fractures on the hanging-wall, and some minor
warping of buried sediments on the foot-wall (Figure 13). Displacement in the second trench
was concentrated in a single narrow band, associated with a single discrete rupture at this
location. Conjugate fractures are mapped in the bedrock on the hanging-wall, with one
fracture extending to the surface and infill of an extensional fissure extending down to
basement level. Some of the identified historical fracturing only occurs in the basement and
does not reach to surface level.
A.1.4.3 Topography
Several authors note that the Mortlock River changes from westerly flow to south-west flow
quite abruptly ~ 2 km from the Meckering rupture and flows roughly parallel to the rupture
for ~ 10 km before crossing the rupture (in the central region where offset is near-maximum)
and continuing SW (Lewis, 1969; Gordon & Lewis, 1980). The morphology and flow of the
river also changes from a shallow wide diffuse river bed with salt pans along its length, to a
narrower deeper ‘rejuvenated’ river channel. Yilgarn craton rivers to the north and south of
the Mortlock river show similar changes in morphology and direction, recognised as a major
drainage change within the Swan-Avon System (Jutson, 1934; Mulcahy, 1967) and attributed
to Eocene uplift along the Darling Fault (Salama, 1997; Beard, 1999; Jakica et al., 2011).

203
Clark and Edwards (2018) explore the relationship between the historic rupture, potential
prior seismic offset of the Mortlock River, bedrock/geophysical controls on river
morphology/direction, and larger scale drainage patterns. They include a high-resolution
drone derived DEM across where the Morlock River crosses the Meckering scarp. They find
no link between river morphology/direction and prior rupture, and no evidence in the
Quaternary floodplain for prior Quaternary rupture.
Figure 14: Google Earth satellite imagery showing the association of the Mortlock East river and Meckering
scarp and fractures (©2019 CNES / Airbus, Map Data, Google)
A.1.4.4 Other
Possible liquefaction features (e.g., two generations of sand-filled features that may be root
casts or sand dykes) were identified in trenches excavated proximal to the Meckering (Clark
et al., 2011; Clark & Edwards, 2018). Two OSL results are presented in Clark et al. (2011)
taken above (~ 0.5 m) and below (~ 0.8 m) one of the sand dykes identified on the hanging-
wall of the 1968 rupture. These bracket the sand feature between 17 - 20 ka. The second
sand feature overlies the sedimentary layer dated at 17 ka, giving an age bracket of 0.15 – 17
ka. These features, if seismically induced, are considered unrelated to prior rupture along the
Meckering scarp as trenching shows only historic offsets. The OSL ages do give some
constraint on sand accumulation between 0.03 – 0.1 m/kyr.

204
If induced by liquefaction, these features provide preliminary evidence for strong ground
motion intensities at this site that exceeded thresholds for liquefaction triggering. Typical
minimum peak ground acceleration thresholds for liquefaction initiation in highly susceptible
sediments are 0.1 to 0.15 g (e.g. Quigley (2013)). Using craton-specific ground motion
prediction equations (Somerville & Ni, 2010), possible maximum Joyner-Boore distances for
scenario earthquakes that could have generated sufficient PGAs to initiate liquefaction at this
site are Mw 5.5 (≤ 15 to 30 km), Mw 6.5 (≤ 37 to 60 km) and Mw 7.5 (≤ 100 to 150 km). Clark
and Edwards (2018) suggest that sediments in the SWSZ may have been more susceptible to
liquefaction prior to agricultural clearing and increasing induration of sediments from
salinification. Further research is required to determine whether an earthquake origin is the
most plausible interpretation for these features, and whether they may be of use for future
palaeoseismic studies in the area (Clark et al., 2011).
A.1.4.5 Slip rate
No strong evidence exists to support rupture along the Meckering scarp between 1968 and
the Pliocene(?) formation of ferruginous duricrusts developed in granite on hilltops (Clark et
al., 2011; Clark & Edwards, 2018). Recurrence on the underlying faults therefore cannot be
demonstrated. The complexity of the scarp does not favour recurrent slip as displacement
of intersections between the NE and NW trending basement structures/lithological trends
would tend to form a barrier to further slip (e.g. Talwani (1988)). If, instead of on the faults
that ruptured in 1968, recurrent slip is accommodated on proximal structure, low bedrock
erosion rates (< 5 m/Ma (Belton et al., 2004)) provides an upper constraint for relief
generation rates (e.g. Figure 7e).
A.1.5. Summary
A.1.5.1 Surface rupture relationship to geology
Detailed mapping of the Meckering area was conducted following the earthquake to
investigate geological relationships to the rupture (Lewis, 1969), the author found no
relationship between rupture orientation and granite foliation but an occasional correlation
between rupture and nearby dike orientations. Gordon and Lewis (1980) note that bedrock
granite outcrops at the surface as an almost continuous line on the hanging-wall of the
rupture, including a westward step of outcrop distribution around the location of the Burgess
fault stepover in the Meckering scarp (Figure 2, Figure 3). They also note that outcrops on the
western side are generally more highly weathered.
Dentith et al. (2009) conducted high resolution geophysical mapping across the area and
present strong evidence to suggest the location and direction of the Meckering rupture was
controlled by basement structures, including NW trending folds and foliation, and SW
trending dike systems. Several granitic gneiss basement outcrops exist proximal to the
Meckering rupture with foliation orientations aligned with geophysical basement structures,
and mapped mafic dykes have a predominately SW trend (Lewis, 1969)(Lewis, 1969).
205
Gordon and Lewis (1980) describe quartz fragments common at the surface along 6 km of
the southern section of scarp, and in at least one location the scarp is coincident with a
brecciated quartz outcrop (seen in either a creek cutting, or a hole dug across the scarp). They
also describe iron-rich soil that post-dates a quartz breccia identified 8 km SW of Meckering,
close to the 1968 rupture. They interpret these two observations to suggest the Meckering
rupture occurred along a pre-existing ancient fault. Dentith et al. (2009) interpret the
basement structure along this southern section as folded stratigraphy, and rupture may have
propagated along a lithological boundary.
A.1.5.2 Surface rupture relationship to seismology
The early faulting models developed to describe the seismological and surface data are dated,
relative to current understanding of fault rupture. Gordon (1968) describe faulting related to
an elevated dome block, Everingham (1968) describes “chipping…on a large scale” and
conchoidal fracture, Conacher and Murray (1969) suggest that rain had saturated the soil and
it “deformed plastically” along the rupture and Gordon and Lewis (1980) invoke a
complicated model related to the arcuate nature of rupture to describe the Meckering fault
as a portion of a saucer shaped ‘mobile block’.
A number of publications present fault rupture models more consistent with current theories
and models for fault rupture. Denham et al. (1980) propose that pore-water perturbations
may have been able to trigger an earthquake on a weathered fault plane, consistent with
mechanisms of fluid assisted seismicity (e.g. Balfour et al. (2015)). Dentith et al. (2009) use
high-resolution aeromagnetic data to provide a model of failure based on intersecting NE-
SW and SE-NW bedrock structures with a central N-S trending linking structure. Vogfjord
and Langston (1987) use a similar three-plane fault model to model long and short period
synthetic waveforms. They find this three-fault model fits the long period data well but does
not reproduce the observed short period data. Clark and Edwards (2018) present data from
an unpublished report which uses a three-fault model to derive a finite rupture model from
surface offset measurements and teleseismic body waves.
As discussed in Section 2.4, this paper prefers a model where rupture initiates on the Splinter
fault, producing a sub-event matching the observed P-wave first motion data, and
propagating onto the Meckering faults to produce the observed mainshock data. Fault
geometry based on surface rupture measurements (and assuming planar faults) produces a
fault intersection at 2.8 km, consistent with available estimates of centroid depth at 2.3 - 3
km (Vogfjord & Langston, 1987; Fredrich et al., 1988).
The number of distinct faults that are hypothesized to have ruptured in this earthquake (n=4,
or n=8 if including the Splinter fault), based on the criteria stated herein, is the highest
estimate of multi-fault earthquakes at this magnitude as ascertained from a recent global
compilation (Figure 15) (Quigley et al., 2017).

206
Figure 15: From Fig. 5 of Quigley et al. (2017), Meckering earthquake (red box) plotted against recent
global compilation of number of geometrically-distinguished fault ruptures vs. Mw.
A.1.6 Appendix A: Methods
A.1.6.1 Digitising vertical and lateral displacement data and benchmark
data
The locations of vertical and lateral displacement data collected by Gordon and Lewis (1980)
by measuring offset fences, farm furrows, tracks, etc, are shown on Figure 39 of that
document. The figure was georeferenced against the digitised fault scarp, points were created
at all locations and extracted as a CSV file with x-y coordinates. The location numbers and
associated vertical displacement are published in Table 10 of Gordon and Lewis (1980).
These were extracted from a pdf into excel, and thoroughly checked for copy errors in the
data. Location numbers from the GIS process were cross referenced to location numbers in
Table 10, to attach x-y coordinates to each offset measurement. These were imported to
GIS. A simplified fault trace was created for the Meckering and Splinter scarps, and a short
script2 was used in QGIS attribute manager field calculator to extract the distance of each
vertical offset measurement along the simplified fault trace. The shape file was again
extracted into a final CSV with x-y coordinates, vertical offset measurements, and distance
along fault data.
Offset benchmark data are not published in a table, but appear as graphs in Figures 69 and
70 of Gordon and Lewis (1980), with the x-axis being distance along the Great Eastern
Highway between Northam-Meckering-Cunderdin. Centimetre grids were drawn across the
graphs in Adobe Illustrator, and x-y data were read off into a CSV file. The national road
network shape file was used to extract the Great Eastern Highway between Northam-
Meckering-Cunderdin and QGIS’s “points along lines” was used to extract points at 1 km
2 line_locate_point( geometry:=geometry(get_feature('Line', 'id', '1')), point:=$geometry)

207
intervals. These data were extracted as a CSV with x-y coordinates, and matched against the
X axis read from the graphs in Figures 69-70 of Gordon and Lewis (1980). The data were
then reimported to QGIS to create a shapefile showing offset of benchmarks as measured
and shown graphically in Gordon and Lewis (1980).
A.1.6.2 Digitising dip data
Dip measurements were digitised from a georeferenced version of Plate 2 of Gordon and
Lewis (1980) which presents both measured dips (from trenches, holes across the scarp,
exposed rupture planes) and calculated (from displacements). Dip data were collected as
attributes in a line shapefile (with the line drawn along the strike of the rupture at the
measurement location). Strike values were extracted from lines using a short script3 and the
shapefile was converted into points using “points along lines” (GDAL process in QGIS).
Points were extracted into a CSV file with x-y coordinates. Dip directions were calculated in
the CSV file.
3 Case when yat(-1)-yat(0) < 0 or yat(-1)-yat(0) > 0 then (atan((xat(-1)-xat(0))/(yat(-1)-yat(0)))) *
180/3.14159 + (180 * (((yat(-1)-yat(0)) < 0) + (((xat(-1)-xat(0)) < 0 AND (yat(-1) - yat(0)) >0)*2) )) when
((yat(-1)-yat(0)) = 0 and (xat(-1) - xat(0)) >0) then 90 when ((yat(-1)-yat(0)) = 0 and (xat(-1) - xat(0)) <0)
then 270 end

208
2. Review paper: The 10th March 1970 Mw 5.0 Calingiri surface rupturing earthquake, Australia
Tamarah King
School of Earth Sciences, The University of Melbourne, Victoria 3010, Australia
https://orcid.org/0000-0002-9654-2917
Mark Quigley
School of Earth Sciences, The University of Melbourne, Victoria 3010, Australia
https://orcid.org/0000-0002-4430-4212
Dan Clark
Geoscience Australia, Canberra 2601, Australia
https://orcid.org/0000-0001-5387-4404
Abstract
The 10th March 1970 moment magnitude (MW) 5.0 Calingiri earthquake surface rupture is 3.3
km long with a maximum vertical displacement of 0.4 m. The fault as defined by surface
measurements is a shallow-dipping reverse fault (~ 20° east) with a probable shallow
hypocentre (< 1 km). This is consistent with published hypocentral depths, though large
uncertainties exist within the seismological data. The finest-resolution geological map
available for the epicentral area (1:250 000) indicates the presence of granitic gneiss and
migmatite outcrops within a few kilometres of the surface rupture with foliations striking
sub-parallel to the surface rupture trace but with near-vertical dips. The rupture is subparallel
to linear geophysical anomalies suggesting a bedrock structural control to faulting. There is
no evidence to suggest prior Pleistocene surface rupture along the Calingiri scarp, although
no detailed palaeoseismic investigations have been conducted.
A.2.1. Geology
A.2.1.1. Regional
The 1970 Mw 5.0 Calingiri earthquake is one of a series of historical surface rupturing
earthquakes (1968 Meckering, 1970 Calingiri, 1979 Cadoux, 2008 Katanning, and 2018 Lake
Muir) (Gordon & Lewis, 1980; Lewis et al., 1981; Dawson et al., 2008) hosted within the
South-West Seismic Zone (SWSZ) in southern Western Australia (Doyle, 1971). The SWSZ
resides predominately within the Yilgarn Craton (Figure 1), an assemblage of predominately
Archean granitoid-greenstone rocks (Wilde et al., 1996).
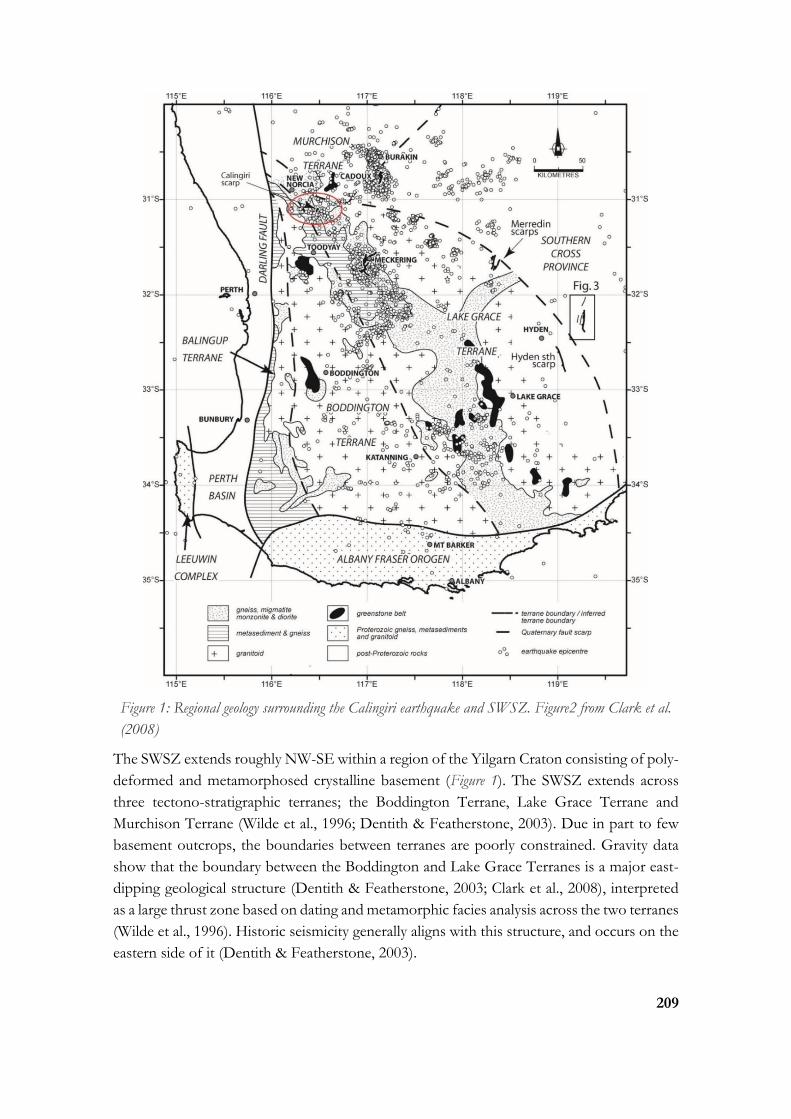
209
Figure 1: Regional geology surrounding the Calingiri earthquake and SWSZ. Figure2 from Clark et al.
(2008)
The SWSZ extends roughly NW-SE within a region of the Yilgarn Craton consisting of poly-
deformed and metamorphosed crystalline basement (Figure 1). The SWSZ extends across
three tectono-stratigraphic terranes; the Boddington Terrane, Lake Grace Terrane and
Murchison Terrane (Wilde et al., 1996; Dentith & Featherstone, 2003). Due in part to few
basement outcrops, the boundaries between terranes are poorly constrained. Gravity data
show that the boundary between the Boddington and Lake Grace Terranes is a major east-
dipping geological structure (Dentith & Featherstone, 2003; Clark et al., 2008), interpreted
as a large thrust zone based on dating and metamorphic facies analysis across the two terranes
(Wilde et al., 1996). Historic seismicity generally aligns with this structure, and occurs on the
eastern side of it (Dentith & Featherstone, 2003).
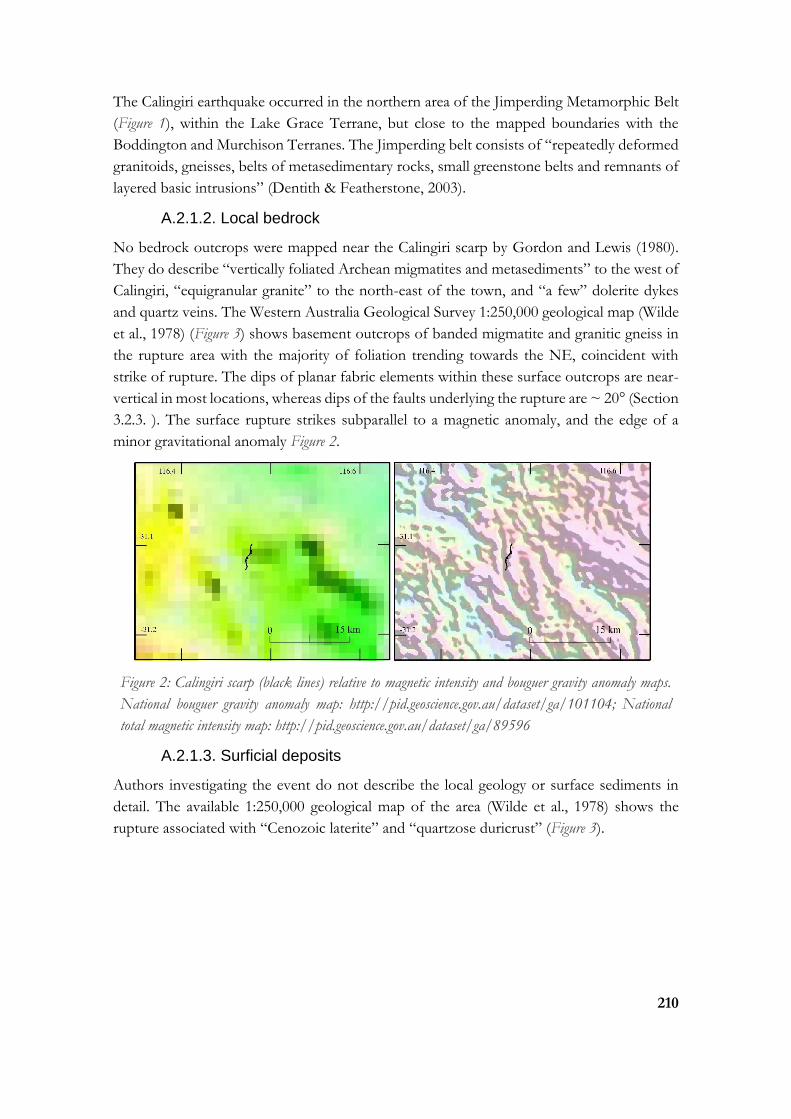
210
The Calingiri earthquake occurred in the northern area of the Jimperding Metamorphic Belt
(Figure 1), within the Lake Grace Terrane, but close to the mapped boundaries with the
Boddington and Murchison Terranes. The Jimperding belt consists of “repeatedly deformed
granitoids, gneisses, belts of metasedimentary rocks, small greenstone belts and remnants of
layered basic intrusions” (Dentith & Featherstone, 2003).
A.2.1.2. Local bedrock
No bedrock outcrops were mapped near the Calingiri scarp by Gordon and Lewis (1980).
They do describe “vertically foliated Archean migmatites and metasediments” to the west of
Calingiri, “equigranular granite” to the north-east of the town, and “a few” dolerite dykes
and quartz veins. The Western Australia Geological Survey 1:250,000 geological map (Wilde
et al., 1978) (Figure 3) shows basement outcrops of banded migmatite and granitic gneiss in
the rupture area with the majority of foliation trending towards the NE, coincident with
strike of rupture. The dips of planar fabric elements within these surface outcrops are near-
vertical in most locations, whereas dips of the faults underlying the rupture are ~ 20° (Section
3.2.3. ). The surface rupture strikes subparallel to a magnetic anomaly, and the edge of a
minor gravitational anomaly Figure 2.
Figure 2: Calingiri scarp (black lines) relative to magnetic intensity and bouguer gravity anomaly maps.
National bouguer gravity anomaly map: http://pid.geoscience.gov.au/dataset/ga/101104; National
total magnetic intensity map: http://pid.geoscience.gov.au/dataset/ga/89596
A.2.1.3. Surficial deposits
Authors investigating the event do not describe the local geology or surface sediments in
detail. The available 1:250,000 geological map of the area (Wilde et al., 1978) shows the
rupture associated with “Cenozoic laterite” and “quartzose duricrust” (Figure 3).
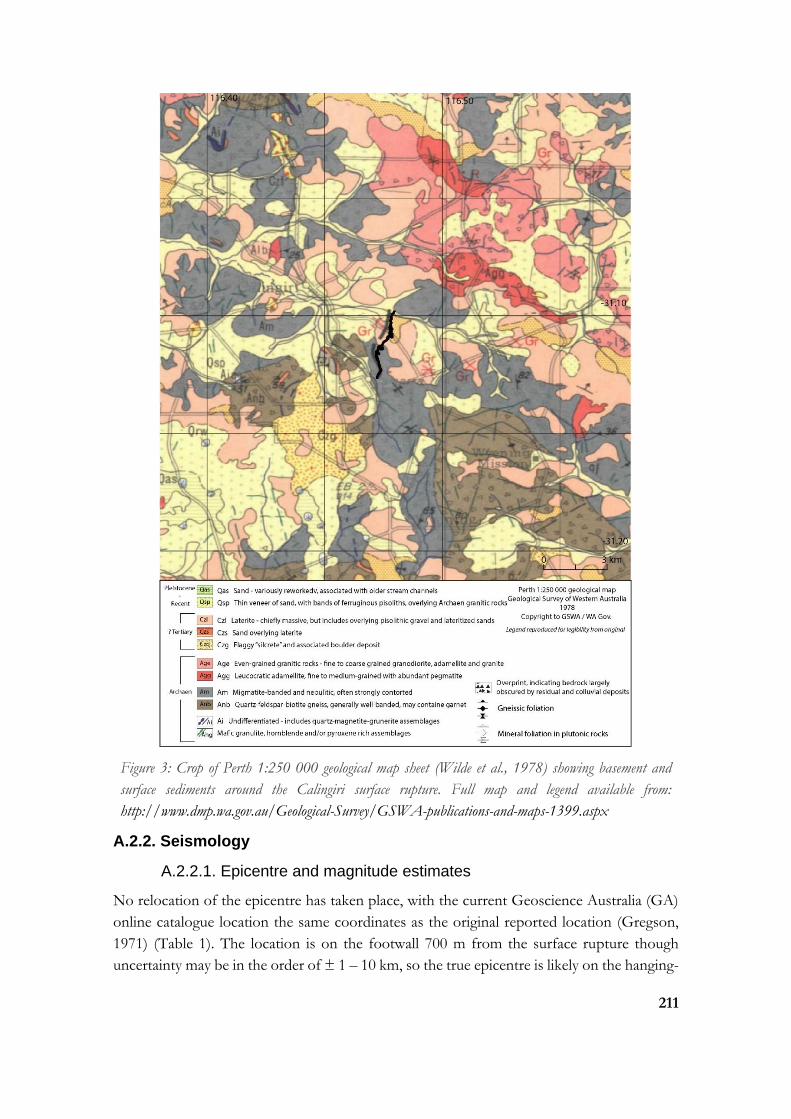
211
Figure 3: Crop of Perth 1:250 000 geological map sheet (Wilde et al., 1978) showing basement and
surface sediments around the Calingiri surface rupture. Full map and legend available from:
http://www.dmp.wa.gov.au/Geological-Survey/GSWA-publications-and-maps-1399.aspx
A.2.2. Seismology
A.2.2.1. Epicentre and magnitude estimates
No relocation of the epicentre has taken place, with the current Geoscience Australia (GA)
online catalogue location the same coordinates as the original reported location (Gregson,
1971) (Table 1). The location is on the footwall 700 m from the surface rupture though
uncertainty may be in the order of ± 1 – 10 km, so the true epicentre is likely on the hanging-
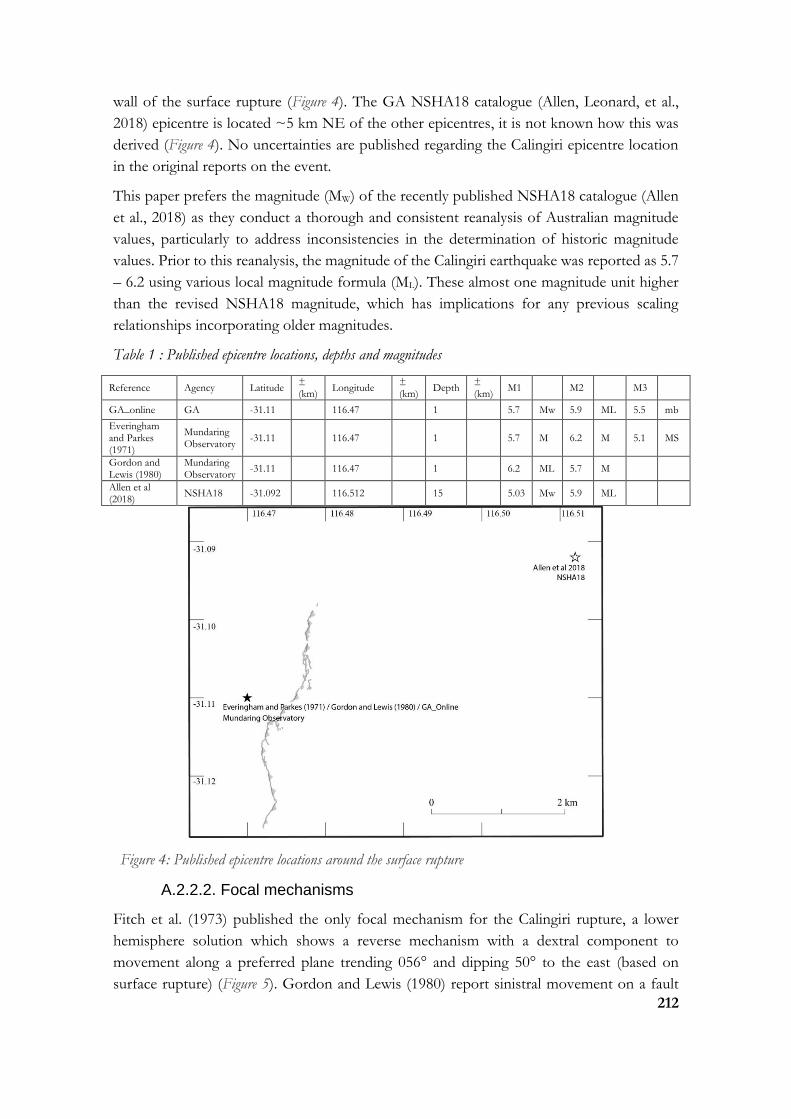
212
wall of the surface rupture (Figure 4). The GA NSHA18 catalogue (Allen, Leonard, et al.,
2018) epicentre is located ~5 km NE of the other epicentres, it is not known how this was
derived (Figure 4). No uncertainties are published regarding the Calingiri epicentre location
in the original reports on the event.
This paper prefers the magnitude (MW) of the recently published NSHA18 catalogue (Allen
et al., 2018) as they conduct a thorough and consistent reanalysis of Australian magnitude
values, particularly to address inconsistencies in the determination of historic magnitude
values. Prior to this reanalysis, the magnitude of the Calingiri earthquake was reported as 5.7
– 6.2 using various local magnitude formula (ML). These almost one magnitude unit higher
than the revised NSHA18 magnitude, which has implications for any previous scaling
relationships incorporating older magnitudes.
Table 1 : Published epicentre locations, depths and magnitudes
Reference Agency Latitude ± (km)
Longitude ± (km)
Depth ± (km)
M1 M2 M3
GA_online GA -31.11 116.47 1 5.7 Mw 5.9 ML 5.5 mb
Everingham and Parkes (1971)
Mundaring Observatory
-31.11 116.47 1 5.7 M 6.2 M 5.1 MS
Gordon and Lewis (1980)
Mundaring Observatory
-31.11 116.47 1 6.2 ML 5.7 M
Allen et al (2018)
NSHA18 -31.092 116.512 15 5.03 Mw 5.9 ML
Figure 4: Published epicentre locations around the surface rupture
A.2.2.2. Focal mechanisms
Fitch et al. (1973) published the only focal mechanism for the Calingiri rupture, a lower
hemisphere solution which shows a reverse mechanism with a dextral component to
movement along a preferred plane trending 056° and dipping 50° to the east (based on
surface rupture) (Figure 5). Gordon and Lewis (1980) report sinistral movement on a fault
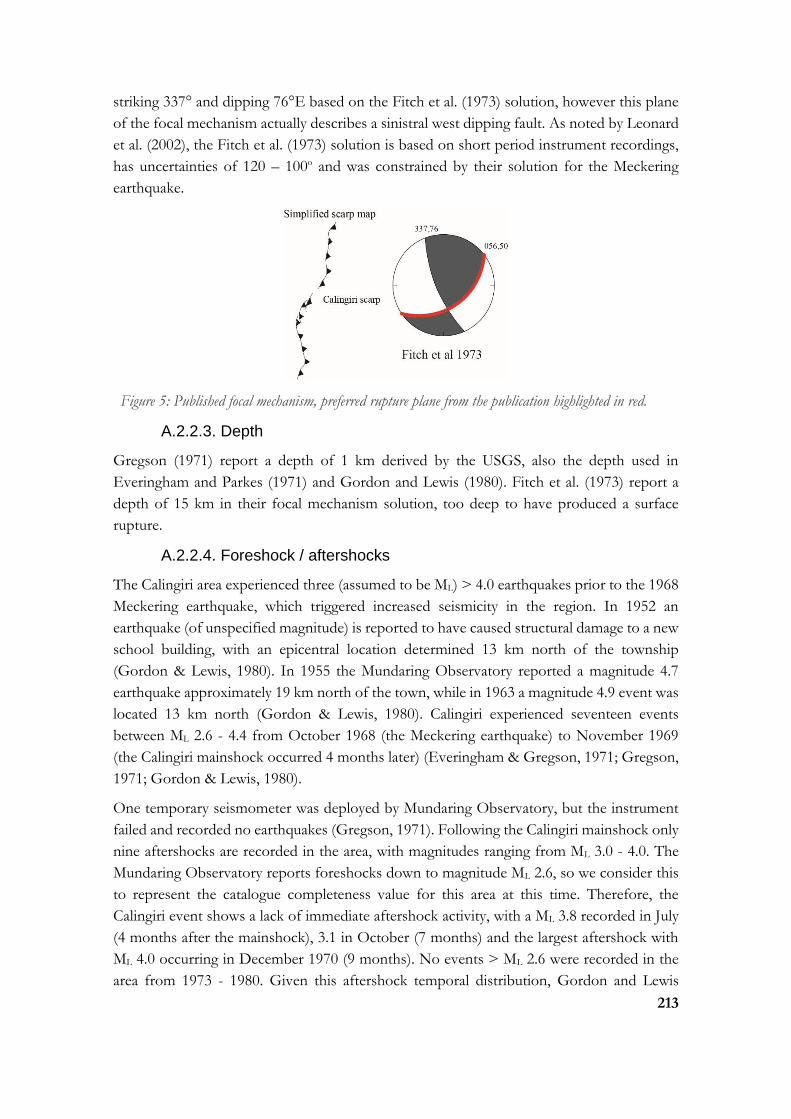
213
striking 337° and dipping 76°E based on the Fitch et al. (1973) solution, however this plane
of the focal mechanism actually describes a sinistral west dipping fault. As noted by Leonard
et al. (2002), the Fitch et al. (1973) solution is based on short period instrument recordings,
has uncertainties of 120 – 100o and was constrained by their solution for the Meckering
earthquake.
Figure 5: Published focal mechanism, preferred rupture plane from the publication highlighted in red.
A.2.2.3. Depth
Gregson (1971) report a depth of 1 km derived by the USGS, also the depth used in
Everingham and Parkes (1971) and Gordon and Lewis (1980). Fitch et al. (1973) report a
depth of 15 km in their focal mechanism solution, too deep to have produced a surface
rupture.
A.2.2.4. Foreshock / aftershocks
The Calingiri area experienced three (assumed to be ML) > 4.0 earthquakes prior to the 1968
Meckering earthquake, which triggered increased seismicity in the region. In 1952 an
earthquake (of unspecified magnitude) is reported to have caused structural damage to a new
school building, with an epicentral location determined 13 km north of the township
(Gordon & Lewis, 1980). In 1955 the Mundaring Observatory reported a magnitude 4.7
earthquake approximately 19 km north of the town, while in 1963 a magnitude 4.9 event was
located 13 km north (Gordon & Lewis, 1980). Calingiri experienced seventeen events
between ML 2.6 - 4.4 from October 1968 (the Meckering earthquake) to November 1969
(the Calingiri mainshock occurred 4 months later) (Everingham & Gregson, 1971; Gregson,
1971; Gordon & Lewis, 1980).
One temporary seismometer was deployed by Mundaring Observatory, but the instrument
failed and recorded no earthquakes (Gregson, 1971). Following the Calingiri mainshock only
nine aftershocks are recorded in the area, with magnitudes ranging from ML 3.0 - 4.0. The
Mundaring Observatory reports foreshocks down to magnitude ML 2.6, so we consider this
to represent the catalogue completeness value for this area at this time. Therefore, the
Calingiri event shows a lack of immediate aftershock activity, with a ML 3.8 recorded in July
(4 months after the mainshock), 3.1 in October (7 months) and the largest aftershock with
ML 4.0 occurring in December 1970 (9 months). No events > ML 2.6 were recorded in the
area from 1973 - 1980. Given this aftershock temporal distribution, Gordon and Lewis

214
(1980) consider the Calingiri mainshock as an aftershock to the larger Meckering event,
though this is not consistent with current methods for determining maximum distances of
aftershocks (e.g. those used in Allen et al. (2018)).
A.2.3. Surface Rupture
A.2.3.1. Authors / map quality
The Calingiri rupture is located on a pastoral property 152 km drive north of Perth. The first
descriptions of the Calingiri surface rupture come from seismological reports from the
Mundaring Geophysical observatory, located 120 km south of the rupture (Everingham &
Gregson, 1971; Gregson, 1971). The only published detailed mapping of the rupture is a
1:10,000 map in Gordon and Lewis (1980) with mapping conducted 1 - 2 months after the
rupture. The rupture trace from this map is reproduced in the GA Neotectonics Features
database (Clark, 2012). Gordon and Lewis (1980) note that farming had removed surficial
evidence of rupture, though some sections of are still visible in Google and Bing satellite
imagery. The rupture trace from the GA Neotectonics Features and sections visible in
Google and Bing satellite imagery do not align (e.g. -31.12, 116.47) due to datum
transformation issues and simplification of fine-scale morphology in the original map.
Figure 6: Map of the Calingiri scarp, fractures, vertical offset measurements, and dip measurements (data
digitised from Gordon and Lewis (1980))
A.2.3.2. Length and shape
215
Initial reports describe a 5 km long rupture (Everingham & Gregson, 1971; Gregson, 1971),
however Gordon and Lewis (1980) describe 3.3 km long scarp, and this is the length reported
in subsequent publications (Figure 7b). This length results from measuring the rupture from
north to south along a straight line. Applying a criteria which simplifies ruptures to straight
traces and defines distinct faults where mapped primary rupture has gaps/steps > 1 km
and/or where strike changes by > 20° for distances > 1 km (e.g. (Quigley et al., 2017)) results
in the same length (explored in more detail in King et al. (2019) (in review)). The length of
the causative fault, assuming a relatively straight plane, is likely to be slightly longer than the
simplified 3.3 km long trace, as the fault will not have ruptured to the surface along its full
length.
Figure 7c maps portions of the scarp where more than two vertical displacement
measurements of greater than 0.2 m occur within a distance of 1 km (data from Gordon and
Lewis (1980)). Given granitic basement cosmogenic erosion rates in equivalent arid settings
of Australia of 0.3 – 5 m/Myr (Bierman & Caffee, 2002), 0.2 m of scarp height would be
removed within 35 – 660 kyrs, leaving ~1 km of rupture still visible in the landscape. This
indicates that the feature is unlikely to be persistent in the landscape over the time frame
typical of the recurrence interval observed on nearby faults in the SWSZ (e.g. Hyden,
Dumbleyung (Estrada et al., 2006; Clark et al., 2008)). In this calculation we do not account
for erosion rates of any duricrust which may overlie granitic bedrock, for differential erosion
rates across the rupture topography, or increased erosion from past climatic changes or
modern processes.
The mapped surface rupture trace by Gordon and Lewis (1980) shows discontinuous
segments of 50 – 500 m in length with breaks up to 150 m (Figure 6, Figure 7). It has an overall
shape that is slightly concave, with concavity defined by short (< 500m) oblique linear
segments. Longer Australia surface ruptures (e.g. Meckering, Cadoux) have similar deviations
of strike orientation across short distances (e.g. < 500 m).
A 600 m long secondary scarp (the ‘Calingiri Chordal Fault’) is mapped on the hanging-wall
~1 km away from the northern tip of the main rupture (Figure 6, Figure 7). Gordon and Lewis
(1980) report that the property owner observed this scarp six weeks following the main
rupture and stated that it had not been visible on multiple previous visits to the field. This
scarp is mapped as a series of en echelon extensional fractures and may better be described
as secondary extensional fractures related to hanging-wall relaxation rather than a primary
rupture, although its possible genesis from an aftershock cannot be dismissed.

216
Figure 7: Various measures of length for the Calingiri rupture and underlying fault as described in the
text.
A.2.3.3. Strike
The rupture trends towards 011° on average, with deviations along its length describing
trends between 346 – 030°. The secondary extensional fracture (‘chordal fault’) trends toward
306°.
A.2.3.4. Dip
Gordon and Lewis (1980) show dip measurements along the rupture ranging from 12 - 31°
on their map of the rupture (Figure 6), with an average of 19°. The report mentions shallower
dips of 10° measured where the rupture crosses a stream and drain. They relate dip variations
to surficial sediment competency. They calculate an overall dip of 40° east based on slip
(horizontal and vertical components of displacement).
The only reported seismologically derived dip comes from Fitch et al. (1973) who find a 50°
dip on the east dipping plane (Figure 5). As previously described, Gordon and Lewis (1980)
identify the incorrect plane of the Fitch et al. (1973) solution and describe the dip as 76° NE,
which matches the SW dipping plane. The Fitch et al. (1973) solution for dip has uncertainties
as described for the focal mechanism.
A.2.3.5. Morphology
The southern section of the Calingiri scarp generally shows a single discrete rupture with
short step-overs or ramp structures (Gordon & Lewis, 1980). The northern section is
characterized by single discrete ruptures or pressure ridges, often discontinuous over short
distances, or with multiple duplexing discrete ruptures. As with the Meckering scarp, Gordon
and Lewis (1980) note that the rupture morphology seemed related to surficial sediments,
low compression ridges in sandy soil and larger discrete ruptures in lateritic soils.

217
Figure 8: Lateral displacement measurements (in cm) digitised from Gordon and Lewis (1980).
Uncorrected measurements (all measurements) are offsets measured from features (fences, roads, etc) not
perpendicular to the strike of surface rupture.
A.2.3.6. Kinematics
Gordon and Lewis (1980) describe the Calingiri fault as a sinistral thrust, recording
predominately sinistral movement where measurements were taken of offset features (Figure
8). All measurements are uncorrected for the horizontal angle between the rupture and offset
feature, so true lateral offset is unknown (e.g. if not perpendicular, lateral offset may appear
greater or less than true offset). Stepovers and fractures in the central and southern sections
of rupture support a sinistral compressional step, though the breaks between segments in the
northern section show a dextral extensional sense of movement, and step overs in the
northern segment could be either dextral compression or sinistral extension.
A.2.3.7. Displacement
Vertical and lateral offset along the rupture is mapped in plate 6 of Gordon and Lewis (1980),
but no description exists for how these measurements were obtained, so we cannot estimate
measurement uncertainty. No levelling profiles were published for this rupture, and no
surveying along the scarp is described in published sources. The digitised data (methods in
Appendix A) show an asymmetrical along-rupture displacement envelope concentrated on

218
the southern scarp, with maximum offset in the central most arcuate section of rupture
(Figure 9). Only three offset measurements are recorded along the northern section of scarp,
though the text describes offsets of 7 – 8 cm along the majority of the scarp.
Figure 9: Vertical and lateral displacement measurements along the Calingiri scarps, digitised from
(Gordon & Lewis, 1980). Methods described in Appendix A
A.2.3.8. Environmental damage
Based on length and maximum offset, the Calingiri surface rupture fits an ESI-07 scale
measure of IX, while fractures/cracking as described by Gordon and Lewis (1980) fits ESI
V-VI (Michetti et al., 2007). No other environmental damage is specifically documented that
falls within the ESI-07 scale. Gordon and Lewis (1980) note a single location where circular
extensional cracking surrounded a small tree, similar to descriptions of the Meckering rupture
(Gordon & Lewis, 1980) and Petermann rupture (King et al., 2018). Gordon and Lewis
(1980) describe cracking identified near the Calingiri rupture that appeared infilled and many
years old, they suggest this may relate to the 1968 Meckering earthquake based on the
observed infill and level of degradation.
A.2.4. Paleoseismology
No palaeoseismic investigations of the Calingiri rupture have been published. Gordon and
Lewis (1980) report scattered quartz fragments and thicker soil horizons in holes dug on the
footwall compared to several “missing” soil horizons on the hanging-wall, which they
interpreted as supportive evidence for past movement along a pre-existing fault. This
evidence is circumstantial and could be explained by several processes including differential
weathering across lithological contacts or faults, or a soil catena along the low relief hillslope
which is coincident with the historic rupture.
A.2.4.1. Slip rate
There is no evidence geological or geomorphic evidence to support prior rupture along the
Calingiri fault. The rupture is either the first neotectonic event, or the recurrence interval is
sufficiently long that all relief relating to prior event(s) was eroded prior to 1979 (e.g. 35 –
660 kyrs as discussed in Section 3.2.1). If recurrence is assumed, vertical relief generation
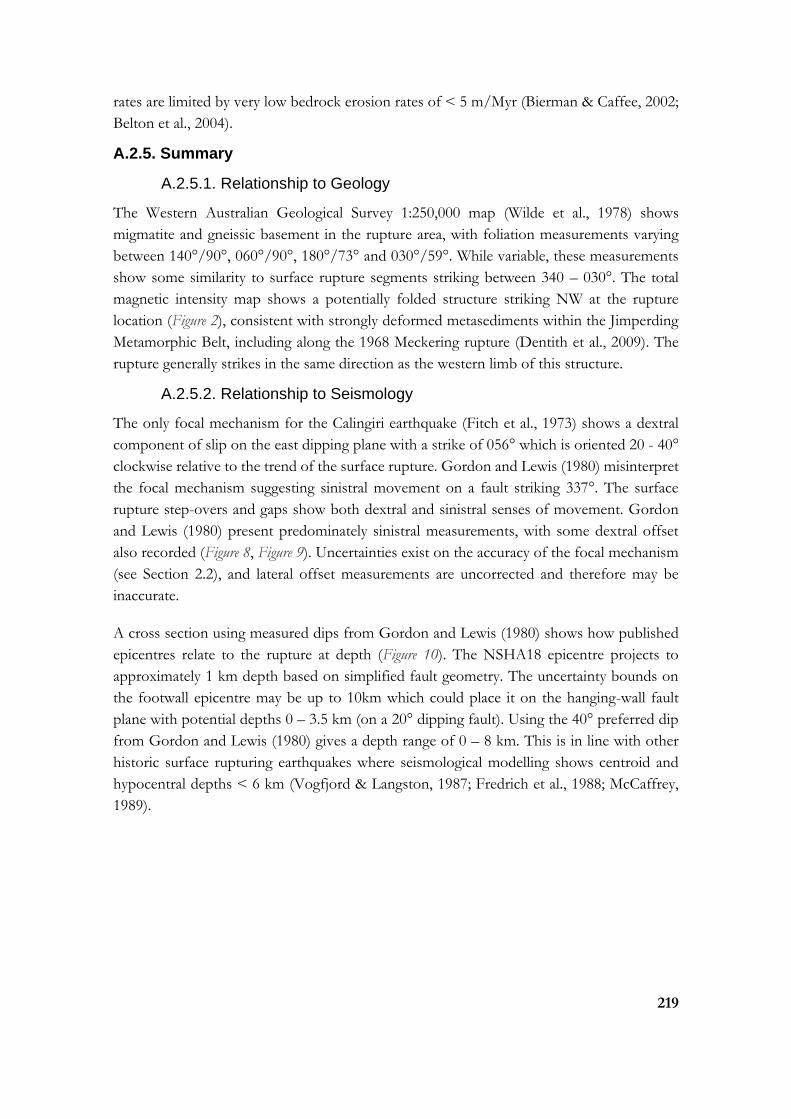
219
rates are limited by very low bedrock erosion rates of < 5 m/Myr (Bierman & Caffee, 2002;
Belton et al., 2004).
A.2.5. Summary
A.2.5.1. Relationship to Geology
The Western Australian Geological Survey 1:250,000 map (Wilde et al., 1978) shows
migmatite and gneissic basement in the rupture area, with foliation measurements varying
between 140°/90°, 060°/90°, 180°/73° and 030°/59°. While variable, these measurements
show some similarity to surface rupture segments striking between 340 – 030°. The total
magnetic intensity map shows a potentially folded structure striking NW at the rupture
location (Figure 2), consistent with strongly deformed metasediments within the Jimperding
Metamorphic Belt, including along the 1968 Meckering rupture (Dentith et al., 2009). The
rupture generally strikes in the same direction as the western limb of this structure.
A.2.5.2. Relationship to Seismology
The only focal mechanism for the Calingiri earthquake (Fitch et al., 1973) shows a dextral
component of slip on the east dipping plane with a strike of 056° which is oriented 20 - 40°
clockwise relative to the trend of the surface rupture. Gordon and Lewis (1980) misinterpret
the focal mechanism suggesting sinistral movement on a fault striking 337°. The surface
rupture step-overs and gaps show both dextral and sinistral senses of movement. Gordon
and Lewis (1980) present predominately sinistral measurements, with some dextral offset
also recorded (Figure 8, Figure 9). Uncertainties exist on the accuracy of the focal mechanism
(see Section 2.2), and lateral offset measurements are uncorrected and therefore may be
inaccurate.
A cross section using measured dips from Gordon and Lewis (1980) shows how published
epicentres relate to the rupture at depth (Figure 10). The NSHA18 epicentre projects to
approximately 1 km depth based on simplified fault geometry. The uncertainty bounds on
the footwall epicentre may be up to 10km which could place it on the hanging-wall fault
plane with potential depths 0 – 3.5 km (on a 20° dipping fault). Using the 40° preferred dip
from Gordon and Lewis (1980) gives a depth range of 0 – 8 km. This is in line with other
historic surface rupturing earthquakes where seismological modelling shows centroid and
hypocentral depths < 6 km (Vogfjord & Langston, 1987; Fredrich et al., 1988; McCaffrey,
1989).
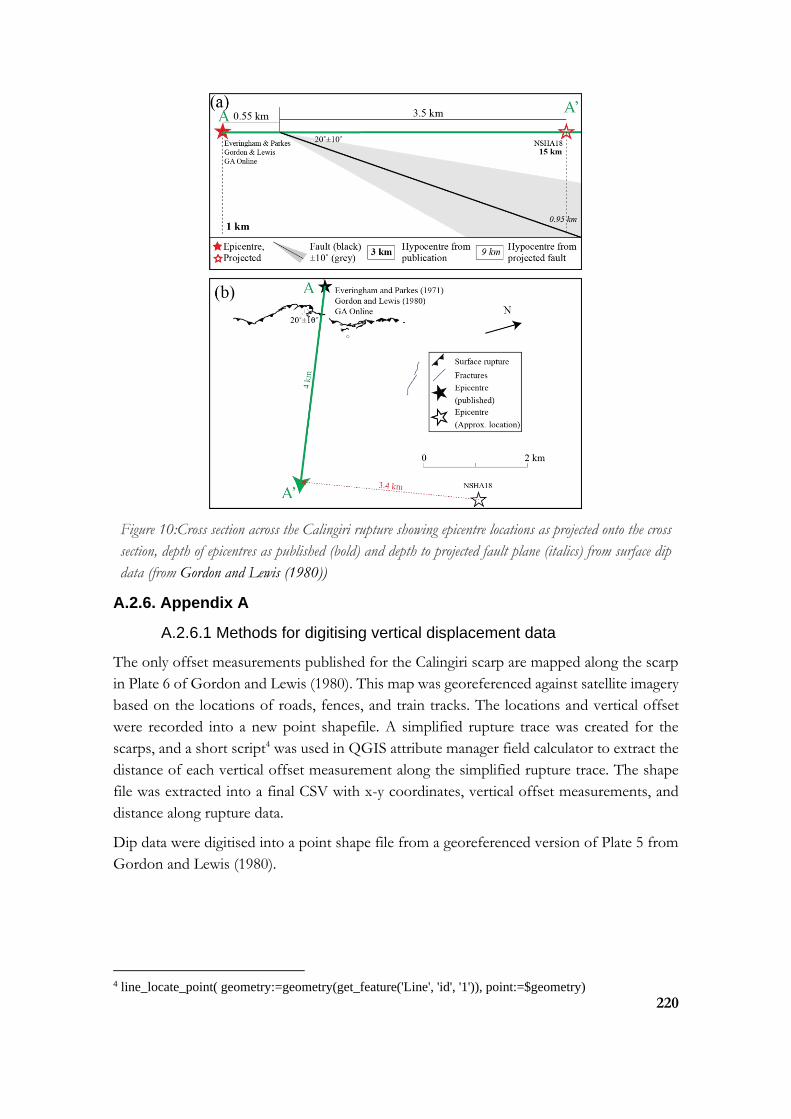
220
Figure 10:Cross section across the Calingiri rupture showing epicentre locations as projected onto the cross
section, depth of epicentres as published (bold) and depth to projected fault plane (italics) from surface dip
data (from Gordon and Lewis (1980))
A.2.6. Appendix A
A.2.6.1 Methods for digitising vertical displacement data
The only offset measurements published for the Calingiri scarp are mapped along the scarp
in Plate 6 of Gordon and Lewis (1980). This map was georeferenced against satellite imagery
based on the locations of roads, fences, and train tracks. The locations and vertical offset
were recorded into a new point shapefile. A simplified rupture trace was created for the
scarps, and a short script4 was used in QGIS attribute manager field calculator to extract the
distance of each vertical offset measurement along the simplified rupture trace. The shape
file was extracted into a final CSV with x-y coordinates, vertical offset measurements, and
distance along rupture data.
Dip data were digitised into a point shape file from a georeferenced version of Plate 5 from
Gordon and Lewis (1980).
4 line_locate_point( geometry:=geometry(get_feature('Line', 'id', '1')), point:=$geometry)

221
3. Review paper: The 2nd June 1979 MW 6.1 Cadoux surface rupturing earthquake, Australia
Tamarah King
School of Earth Sciences, The University of Melbourne, Victoria 3010, Australia
https://orcid.org/0000-0002-9654-2917
Mark Quigley
School of Earth Sciences, The University of Melbourne, Victoria 3010, Australia
https://orcid.org/0000-0002-4430-4212
Dan Clark
Geoscience Australia, Canberra 2601, Australia
https://orcid.org/0000-0001-5387-4404
Abstract
The 2nd June 1979 moment magnitude (MW) 6.1 Cadoux earthquake caused a complex, multi-
fault surface rupture consisting of six mapped scarps: (from south to north) the 8 km long
west dipping Robb scarp, 3 km long south dipping Cumming scarp, the Lone Tree, Carter
and Tank scarps (which together define an east-dipping arcuate rupture) and the 2.5 km long
southwest-dipping Kalajzic scarp. Surface ruptures are classified as six intersecting faults
using kinematic and orientation criteria, with a total simplified surface rupture length of 20.6
km (47% greater than lengths previously published in earthquake scaling relationship
analyses). These faults align with structural trends in basement geology as mapped from
surface outcrops and geophysical maps. No prior attempts have been made to reconcile
seismological data with the geometrically complex surface rupture in order to investigate
rupture initiation and propagation. We speculate that this earthquake ruptured unilaterally
(from south to north) towards an area of increased structural complexity, within which the
rupture eventually terminated. Aftershock locations have large epistemic uncertainties and
do not enable accurate constructions of sub-surface fault geometry. Descriptions of shallow
trenches across the Carter and Tank scarps suggest no prior rupture along at least some of
the Calingiri scarps between the formation of basement structures (Archean – Proterozoic)
and Tertiary – Quaternary surface sedimentation. The Cadoux earthquake is one of the most
structurally complex earthquakes globally for this moderate (i.e., Mw ≤ 6.1) magnitude.
A.3.1 Geology
A.3.1.1 Regional / background
The 1979 Mw 6.1 Cadoux earthquake is one of a series of historical surface rupturing
earthquakes (1968 Meckering, 1970 Calingiri, 1979 Cadoux, 2008 Katanning, and 2018 Lake
Muir) (Gordon & Lewis, 1980; Lewis et al., 1981; Dawson et al., 2008) hosted within the
222
South-West Seismic Zone (SWSZ) in southern Western Australia (Doyle, 1971). The SWSZ
resides predominately within the Yilgarn Craton (Figure 1), an assemblage of predominately
Archean granitoid-greenstone rocks (Wilde et al., 1996).
Figure 1: Regional geology surrounding the Cadoux earthquake (red circle) and SWSZ seismicity up to
2008: Figure 2 from Clark et al. (2008)
The SWSZ extends roughly NW-SE within a region of the Yilgarn Craton consisting of poly-
deformed and metamorphosed crystalline basement (Figure 1). The SWSZ extends across
three tectono-stratigraphic terranes; the Boddington Terrane, Lake Grace Terrane and
Murchison Terrane (Wilde et al., 1996; Dentith & Featherstone, 2003). Due in part to few
basement outcrops, the boundaries between terranes are poorly constrained. Gravity data
show that the boundary between the Boddington and Lake Grace Terranes is a major east-
dipping geological structure (Dentith & Featherstone, 2003; Clark et al., 2008), interpreted
as a large thrust zone based on dating and metamorphic facies analysis across the two terranes
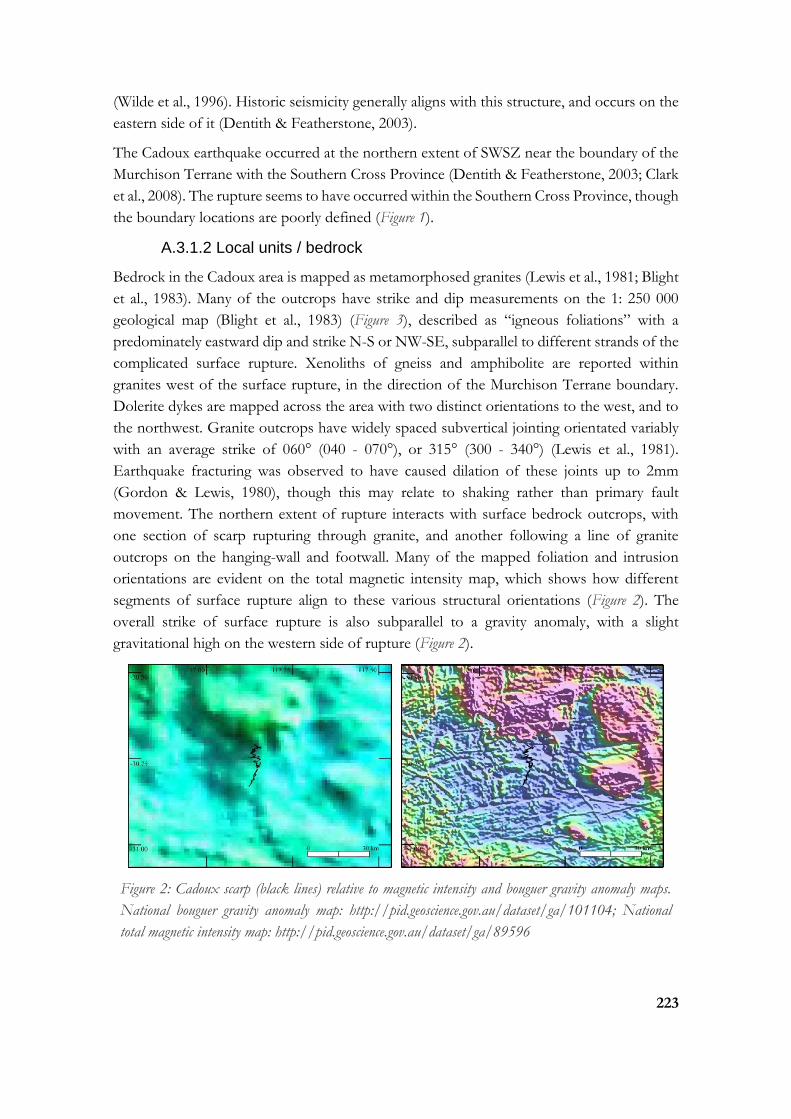
223
(Wilde et al., 1996). Historic seismicity generally aligns with this structure, and occurs on the
eastern side of it (Dentith & Featherstone, 2003).
The Cadoux earthquake occurred at the northern extent of SWSZ near the boundary of the
Murchison Terrane with the Southern Cross Province (Dentith & Featherstone, 2003; Clark
et al., 2008). The rupture seems to have occurred within the Southern Cross Province, though
the boundary locations are poorly defined (Figure 1).
A.3.1.2 Local units / bedrock
Bedrock in the Cadoux area is mapped as metamorphosed granites (Lewis et al., 1981; Blight
et al., 1983). Many of the outcrops have strike and dip measurements on the 1: 250 000
geological map (Blight et al., 1983) (Figure 3), described as “igneous foliations” with a
predominately eastward dip and strike N-S or NW-SE, subparallel to different strands of the
complicated surface rupture. Xenoliths of gneiss and amphibolite are reported within
granites west of the surface rupture, in the direction of the Murchison Terrane boundary.
Dolerite dykes are mapped across the area with two distinct orientations to the west, and to
the northwest. Granite outcrops have widely spaced subvertical jointing orientated variably
with an average strike of 060° (040 - 070°), or 315° (300 - 340°) (Lewis et al., 1981).
Earthquake fracturing was observed to have caused dilation of these joints up to 2mm
(Gordon & Lewis, 1980), though this may relate to shaking rather than primary fault
movement. The northern extent of rupture interacts with surface bedrock outcrops, with
one section of scarp rupturing through granite, and another following a line of granite
outcrops on the hanging-wall and footwall. Many of the mapped foliation and intrusion
orientations are evident on the total magnetic intensity map, which shows how different
segments of surface rupture align to these various structural orientations (Figure 2). The
overall strike of surface rupture is also subparallel to a gravity anomaly, with a slight
gravitational high on the western side of rupture (Figure 2).
Figure 2: Cadoux scarp (black lines) relative to magnetic intensity and bouguer gravity anomaly maps.
National bouguer gravity anomaly map: http://pid.geoscience.gov.au/dataset/ga/101104; National
total magnetic intensity map: http://pid.geoscience.gov.au/dataset/ga/89596
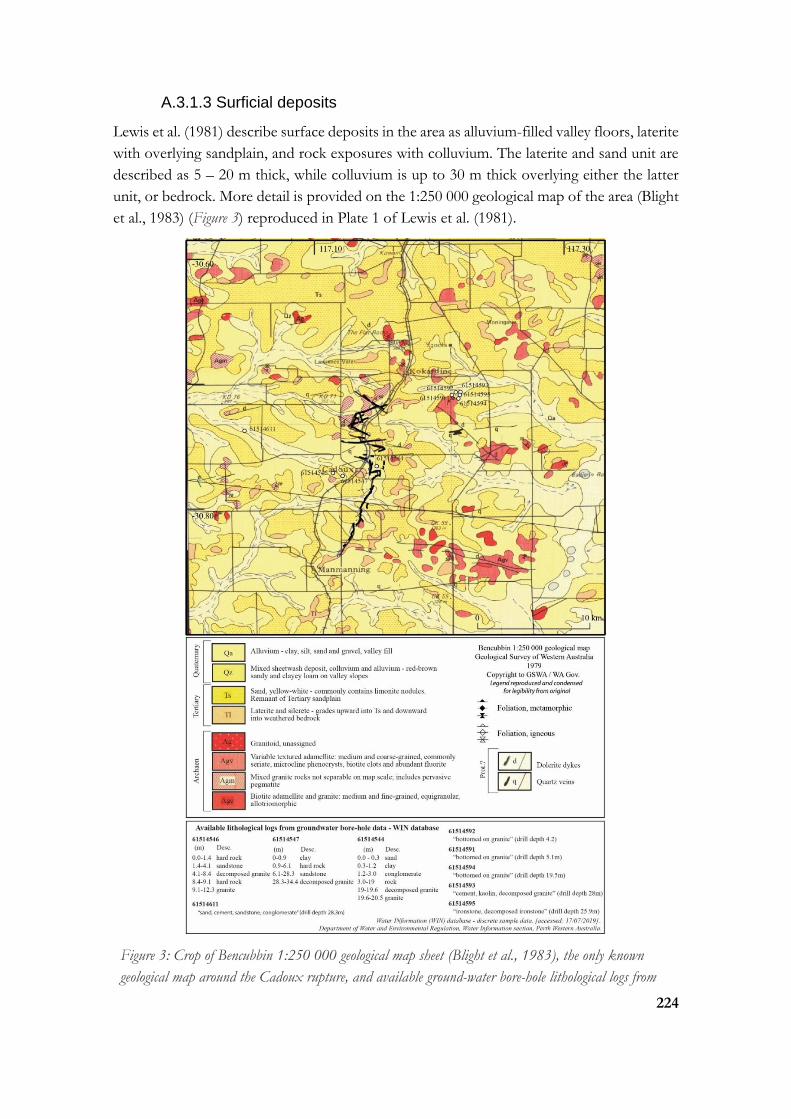
224
A.3.1.3 Surficial deposits
Lewis et al. (1981) describe surface deposits in the area as alluvium-filled valley floors, laterite
with overlying sandplain, and rock exposures with colluvium. The laterite and sand unit are
described as 5 – 20 m thick, while colluvium is up to 30 m thick overlying either the latter
unit, or bedrock. More detail is provided on the 1:250 000 geological map of the area (Blight
et al., 1983) (Figure 3) reproduced in Plate 1 of Lewis et al. (1981).
Figure 3: Crop of Bencubbin 1:250 000 geological map sheet (Blight et al., 1983), the only known
geological map around the Cadoux rupture, and available ground-water bore-hole lithological logs from

225
the area. Full map and legend available from: http://www.dmp.wa.gov.au/Geological-Survey/GSWA-
publications-and-maps-1399.aspx. Full groundwater data available from:
http://wir.water.wa.gov.au/Pages/Water-Information-Reporting.aspx. Lewis et al. (1981) reproduce
this map in greyscale in Plate 1 of that report.
A.3.2.1Seismology
A.3.2.1 Epicentre and magnitude estimates
Table 1 lists published epicentre coordinates, hypocentral depths and magnitude values for
the Cadoux earthquake. The epicentral location in the current Geoscience Australia (GA)
online catalogue is derived from Denham et al. (1987) who recalculated parameters from
Australian stations based on an updated velocity model. This location is 4 km SW of the
original USGS location, and 3 km east of the originally reported location from the Mundaring
Geophysical Observatory (Gregson & Paull, 1979; Lewis et al., 1981). Denham et al. (1987)
report epicentral uncertainties of ± 2 km which are relatively low considering the
instrumental density available at the time of the event (Leonard, 2008). The GA NSHA18
catalogue (Allen, Leonard, et al., 2018) has a location 8.3 km west of the GA online catalogue,
making it the only epicentre on the western side of the scarps (Figure 4). We favour a southern
location for the epicentre, relative to the entire observed length of the surface rupture zone,
given the increased density of proposed and more precisely constrained (due to increased
seismic analysis including relocations) epicentral locations placed in this area.
This paper prefers the magnitude (MW) of the recently published NSHA18 catalogue (Allen,
Leonard, et al., 2018) as they conduct a thorough and consistent reanalysis of Australian
magnitude values, particularly to address inconsistencies in the determination of historic
magnitude values. Prior to this reanalysis, the magnitude of the Cadoux earthquake was
reported as 5.9 – 6.2 using various local magnitude formula (ML), and up to 6.4 surface wave
magnitude (MS).
Table 1 : Published epicentre locations, depths and magnitudes
Reference Agency Latitude ± (km)
Longitude ± (km)
Depth ± (km)
M1 M2 M3
(Denham et al., 1987)
-30.83 117.18 6 5.9 ML 6 Ms 6.2 ML
GA_online GA -30.827 117.179 3 6.1 Mw 6.2 ML 6 Mb
(Gregson & Paull, 1979)
GA -30.83 117.15 15 6.2 ML
(Denham et al., 1987)
USGS -30.73 117.2 6
(Lewis et al., 1981)
-30.83 2 117.15 2 15 5 6.2 ML 6.4 Ms 6.3 Mb
(Allen, Leonard, et al., 2018)
-30.821 117.104 3 6.1 Mw
(Denham et al., 1987)
USGS -30.8 117.2

226
Figure 4: Published epicentre locations around the surface rupture. NSHA18 open star shows an
unknown derivation of epicentre location within that catalogue.
A.3.2.2 Focal mechanisms
Three published focal mechanisms exist for the Cadoux mainshock (Denham et al., 1987;
Fredrich et al., 1988, CMT Harvard catalogue) and one unpublished mechanism is discussed
in Lewis et al. (1981) attributed to “Everingham and Smith” (Figure 5). Denham et al. (1987)
and Fredrich et al. (1988) use teleseismic P- and SH- waves in their solution. There are no
descriptions in Lewis et al. (1981) describing the methods used by Everingham and Smith to
derive their focal mechanism. The published mechanisms show predominately reverse
movement on a roughly N-S orientated fault. The Fredrich et al. (1988) solution shows pure
thrust, while the Denham et al. (1987) and CMT solutions show opposing minor lateral
components. Lewis et al. (1981) prefer the southwest dipping solution with a sinistral sense
of movement, though they note that the N-S dextral thrust solution fits the strike of observed
rupture better.
Choosing a preferred plane and deriving a dip from seismological data is highly uncertain as
segments of surface rupture show both west over east, and east over west senses of
movement (Section 3.2). Denham et al. (1987) prefer an overall east over west movement
which matches their steeper 67° east dipping plane while Fredrich et al. (1988) show results
for the shallower 34° (± 7) west dipping plane. Lewis et al. (1981) prefer a south-west dipping
mechanism solution with a 64° dip. Section 3.5 describes how surface rupture geometry,

227
surface displacement measurements, and aftershock distribution relate to seismologically
derived dip measurements.
Figure 5: Published focal mechanism and simplified scarp map.
A.3.2.3 Depth
Fredrich et al. (1988) suggest a centroid depth of 4 – 6 km based on best-fit inversions of
synthetic and observed long period data from nearby seismometers. Denham et al. (1987)
present a hypocentral depth of 6 km in their relocation using an updated velocity model. The
original hypocentre depth reported by the Mundaring Observatory is 15 ± 5 km (Gregson
& Paull, 1979; Lewis et al., 1981) which is too deep to produce a surface rupture.
A.3.2.4 Foreshock / aftershocks
One ML 3.6 was recorded in late 1978 (seven months prior), four earthquakes of ML 3.1 - 3.9
in March 1979 (three months prior), three small earthquakes ML 2.0 - 3.9 in April-May 1979
(two-one month), and 12 hours prior to the mainshock a ML 5.2 was recorded followed by
five ML 3.0 - 3.8 earthquakes (Gregson & Paull, 1979; Lewis et al., 1981). Foreshocks are
mapped south of the town in the vicinity of the mainshock with uncertainties of ~10km
estimated by Denham et al. (1987). Lewis et al. (1981) suggest that increased foreshock
activity in the months preceding the mainshock could have been noted as anomalous.
However, Gregson and Paull (1979) note that no other SWSZ earthquakes had had similar
sized foreshocks. The location of foreshock activity is relatively scattered across the east and
west sides of the 1979 surface rupture.
The largest aftershocks of ML 5.3, 5.5, and 4.3 occurred one, five and eight days following
the mainshock. Within the first twelve days, the Mundaring Geophysical Observatory
recorded 123 aftershocks ML > 2.4. A dense array of temporary seismometers operated
during Oct-Nov 1983 (four years following the mainshock) allowed high accuracy location
of ~35 aftershocks ML < 2.4 (Dent, 1988). Aftershocks in the months following the
mainshock are mapped on the eastern side of the rupture (Lewis et al., 1981), though these
locations have higher uncertainties. Relocated aftershock locations from national data
(Denham et al., 1987) shows seismicity from 1980 – 1983 increasingly around the northern

228
and southern extents of surface rupture. Locations from a dense aftershock array (Dent &
Gregson, 1986; Dent, 1988) show increased seismicity on the western side of the rupture in
1983. These later studies show migrating zones of high seismicity in the years following the
Cadoux mainshock, though they also highlight high uncertainties in the original aftershock
locations.
A.3.3 Surface Rupture
A.3.3.1 Authors / map quality
The Cadoux surface rupture occurred through pastoral properties a 220 km drive from Perth
and is therefore accessible by road. Surface rupture mapping and investigations were
undertaking in the six weeks following the earthquake by Geological Survey of Western
Australia employees (Gregson & Paull, 1979; Lewis et al., 1981). The only published map of
the surface rupture is in Lewis et al. (1981) at a 1:25,000 scale. The rupture trace from this
map is reproduced in the GA Neotectonics Features database (Clark, 2012). Lewis et al.
(1981) note that observable surficial rupture had been destroyed by farming, however some
sections of the rupture are still visible across ploughed fields in Google and Bing satellite
imagery (e.g. -30.79, 117.14 to -30.78, 117.144).
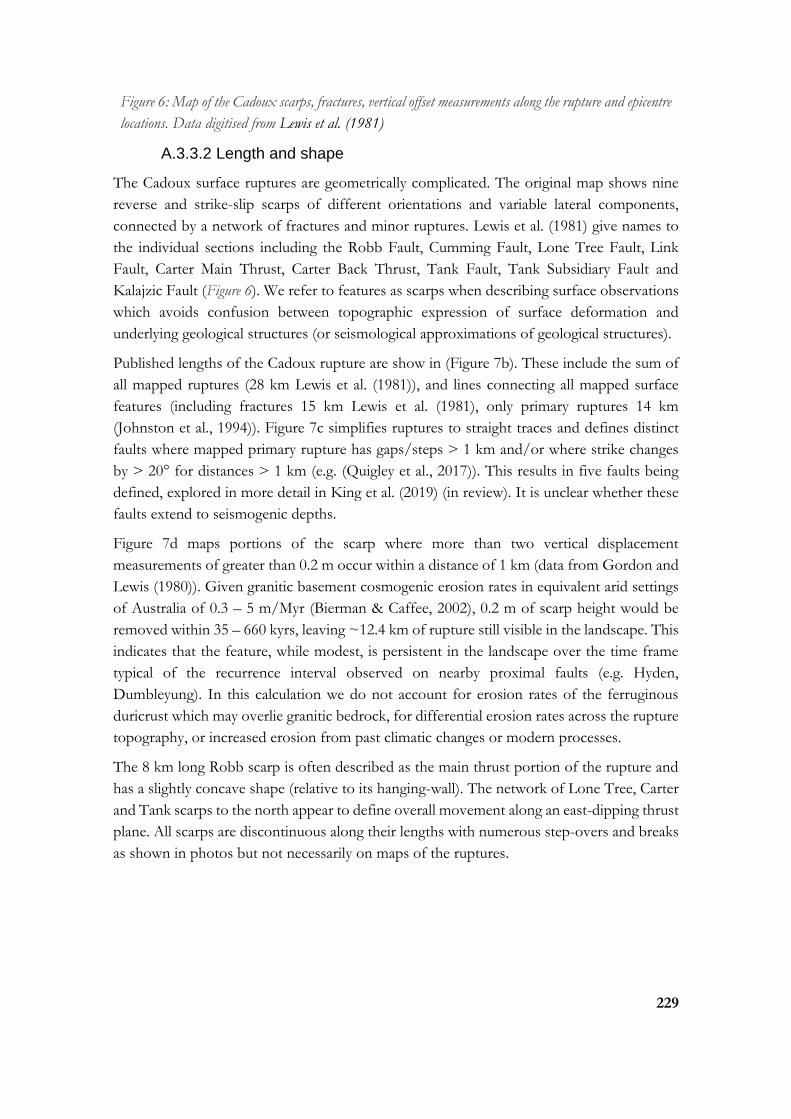
229
Figure 6: Map of the Cadoux scarps, fractures, vertical offset measurements along the rupture and epicentre
locations. Data digitised from Lewis et al. (1981)
A.3.3.2 Length and shape
The Cadoux surface ruptures are geometrically complicated. The original map shows nine
reverse and strike-slip scarps of different orientations and variable lateral components,
connected by a network of fractures and minor ruptures. Lewis et al. (1981) give names to
the individual sections including the Robb Fault, Cumming Fault, Lone Tree Fault, Link
Fault, Carter Main Thrust, Carter Back Thrust, Tank Fault, Tank Subsidiary Fault and
Kalajzic Fault (Figure 6). We refer to features as scarps when describing surface observations
which avoids confusion between topographic expression of surface deformation and
underlying geological structures (or seismological approximations of geological structures).
Published lengths of the Cadoux rupture are show in (Figure 7b). These include the sum of
all mapped ruptures (28 km Lewis et al. (1981)), and lines connecting all mapped surface
features (including fractures 15 km Lewis et al. (1981), only primary ruptures 14 km
(Johnston et al., 1994)). Figure 7c simplifies ruptures to straight traces and defines distinct
faults where mapped primary rupture has gaps/steps > 1 km and/or where strike changes
by > 20° for distances > 1 km (e.g. (Quigley et al., 2017)). This results in five faults being
defined, explored in more detail in King et al. (2019) (in review). It is unclear whether these
faults extend to seismogenic depths.
Figure 7d maps portions of the scarp where more than two vertical displacement
measurements of greater than 0.2 m occur within a distance of 1 km (data from Gordon and
Lewis (1980)). Given granitic basement cosmogenic erosion rates in equivalent arid settings
of Australia of 0.3 – 5 m/Myr (Bierman & Caffee, 2002), 0.2 m of scarp height would be
removed within 35 – 660 kyrs, leaving ~12.4 km of rupture still visible in the landscape. This
indicates that the feature, while modest, is persistent in the landscape over the time frame
typical of the recurrence interval observed on nearby proximal faults (e.g. Hyden,
Dumbleyung). In this calculation we do not account for erosion rates of the ferruginous
duricrust which may overlie granitic bedrock, for differential erosion rates across the rupture
topography, or increased erosion from past climatic changes or modern processes.
The 8 km long Robb scarp is often described as the main thrust portion of the rupture and
has a slightly concave shape (relative to its hanging-wall). The network of Lone Tree, Carter
and Tank scarps to the north appear to define overall movement along an east-dipping thrust
plane. All scarps are discontinuous along their lengths with numerous step-overs and breaks
as shown in photos but not necessarily on maps of the ruptures.
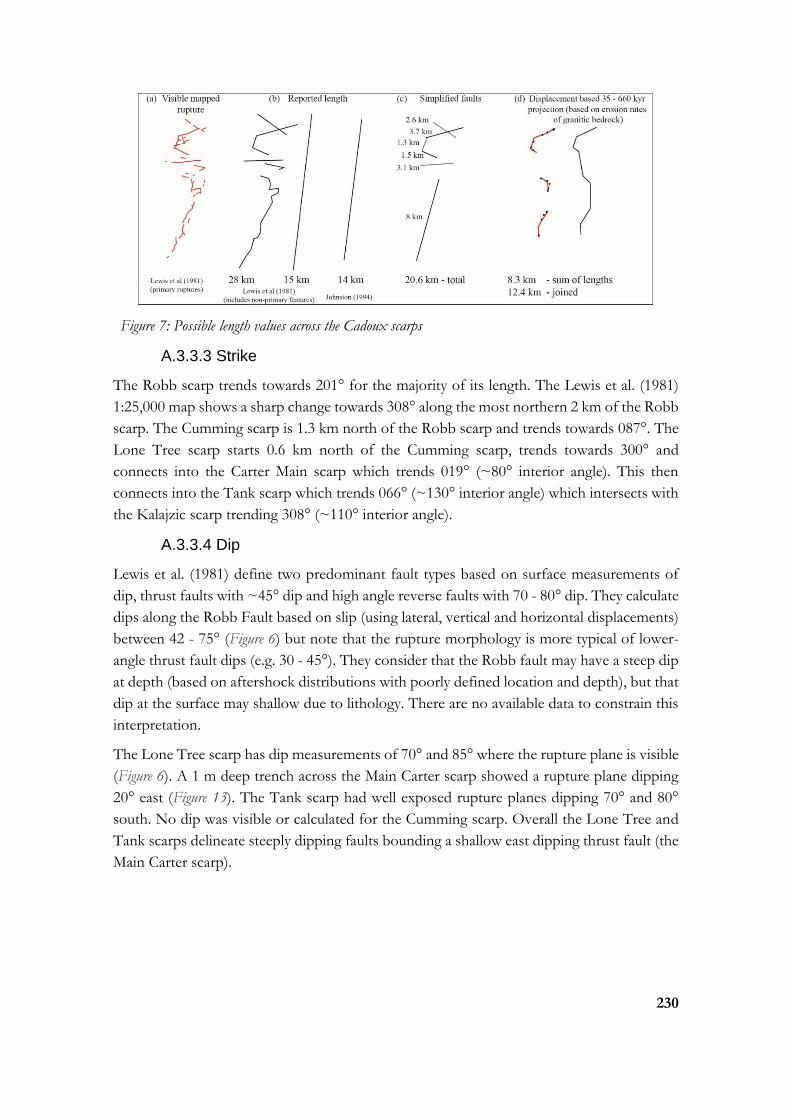
230
Figure 7: Possible length values across the Cadoux scarps
A.3.3.3 Strike
The Robb scarp trends towards 201° for the majority of its length. The Lewis et al. (1981)
1:25,000 map shows a sharp change towards 308° along the most northern 2 km of the Robb
scarp. The Cumming scarp is 1.3 km north of the Robb scarp and trends towards 087°. The
Lone Tree scarp starts 0.6 km north of the Cumming scarp, trends towards 300° and
connects into the Carter Main scarp which trends 019° (~80° interior angle). This then
connects into the Tank scarp which trends 066° (~130° interior angle) which intersects with
the Kalajzic scarp trending 308° (~110° interior angle).
A.3.3.4 Dip
Lewis et al. (1981) define two predominant fault types based on surface measurements of
dip, thrust faults with ~45° dip and high angle reverse faults with 70 - 80° dip. They calculate
dips along the Robb Fault based on slip (using lateral, vertical and horizontal displacements)
between 42 - 75° (Figure 6) but note that the rupture morphology is more typical of lower-
angle thrust fault dips (e.g. 30 - 45°). They consider that the Robb fault may have a steep dip
at depth (based on aftershock distributions with poorly defined location and depth), but that
dip at the surface may shallow due to lithology. There are no available data to constrain this
interpretation.
The Lone Tree scarp has dip measurements of 70° and 85° where the rupture plane is visible
(Figure 6). A 1 m deep trench across the Main Carter scarp showed a rupture plane dipping
20° east (Figure 13). The Tank scarp had well exposed rupture planes dipping 70° and 80°
south. No dip was visible or calculated for the Cumming scarp. Overall the Lone Tree and
Tank scarps delineate steeply dipping faults bounding a shallow east dipping thrust fault (the
Main Carter scarp).
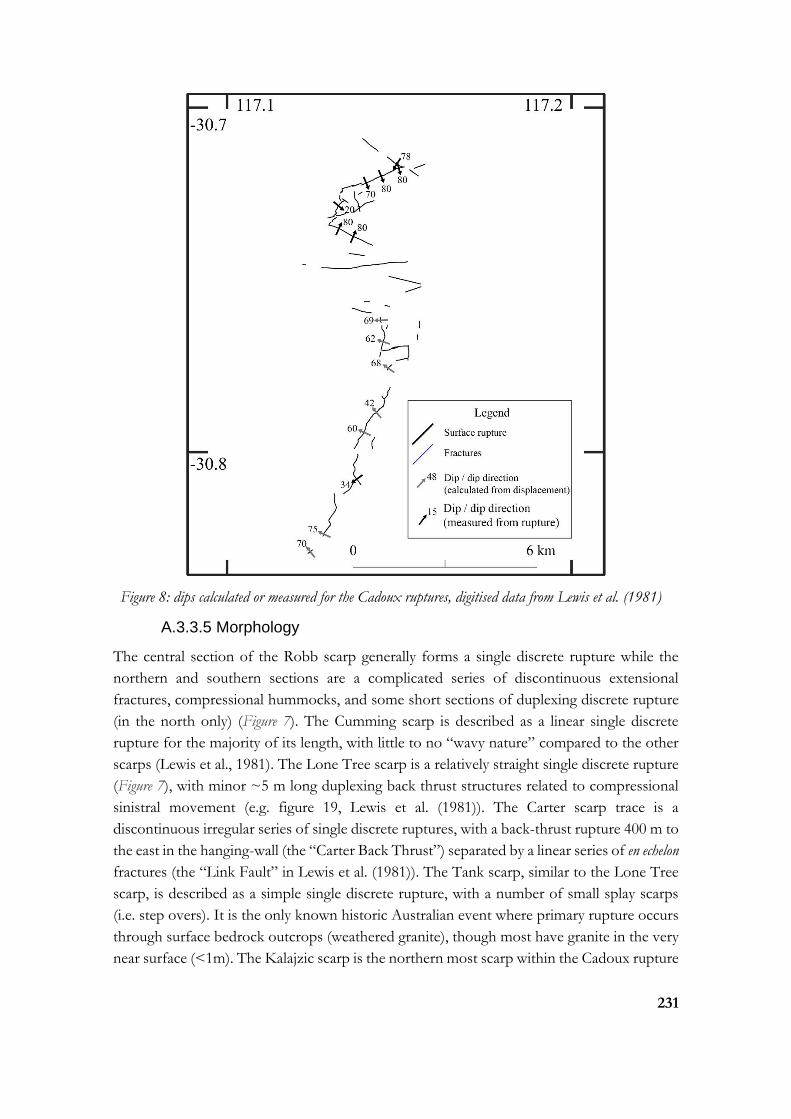
231
Figure 8: dips calculated or measured for the Cadoux ruptures, digitised data from Lewis et al. (1981)
A.3.3.5 Morphology
The central section of the Robb scarp generally forms a single discrete rupture while the
northern and southern sections are a complicated series of discontinuous extensional
fractures, compressional hummocks, and some short sections of duplexing discrete rupture
(in the north only) (Figure 7). The Cumming scarp is described as a linear single discrete
rupture for the majority of its length, with little to no “wavy nature” compared to the other
scarps (Lewis et al., 1981). The Lone Tree scarp is a relatively straight single discrete rupture
(Figure 7), with minor ~5 m long duplexing back thrust structures related to compressional
sinistral movement (e.g. figure 19, Lewis et al. (1981)). The Carter scarp trace is a
discontinuous irregular series of single discrete ruptures, with a back-thrust rupture 400 m to
the east in the hanging-wall (the “Carter Back Thrust”) separated by a linear series of en echelon
fractures (the “Link Fault” in Lewis et al. (1981)). The Tank scarp, similar to the Lone Tree
scarp, is described as a simple single discrete rupture, with a number of small splay scarps
(i.e. step overs). It is the only known historic Australian event where primary rupture occurs
through surface bedrock outcrops (weathered granite), though most have granite in the very
near surface (<1m). The Kalajzic scarp is the northern most scarp within the Cadoux rupture

232
complex, and is described as both a simple single discrete rupture, and a series of extensional
fractures and hanging-wall warping.
A.3.3.6 Kinematics
Predominately dextral movement is recorded from offset fences, roads, farm furrows and en
echelon extensional fracture directions along the west dipping Robb scarp (Figure 10, Figure
11). No lateral movement was observed along the south-west dipping Cumming scarp. The
Lone Tree scarp dips to the north-east with sinistral offsets up to 0.65 m recorded. No lateral
displacement is measured along the Carter scarp. The south dipping Tank scarp shows
dextral movement where it crosses a rail line and farm furrows, and step-over structures also
support dextral compression. The Lone Tree, Carter and Tank scarps are described as a
“fault block which moved upwards and westward”, describing a conjugate fault relative to
the west dipping Robb scarp. The Lone Tree and Tank scarps accommodate lateral
movement (sinistral and dextral respectively) related to hanging-wall uplift towards the west,
with the Carter scarp defining the overall direction of compression and main rupture tip. The
Kalajzic scarp shows sinistral offset where it crossed pipelines, rail lines, roads and fences
Figure 9: Lateral displacements digitised from Lewis et al. (1981). Uncorrected measurements are offsets
measured from features (fences, roads, etc) not perpendicular to the strike of surface rupture.
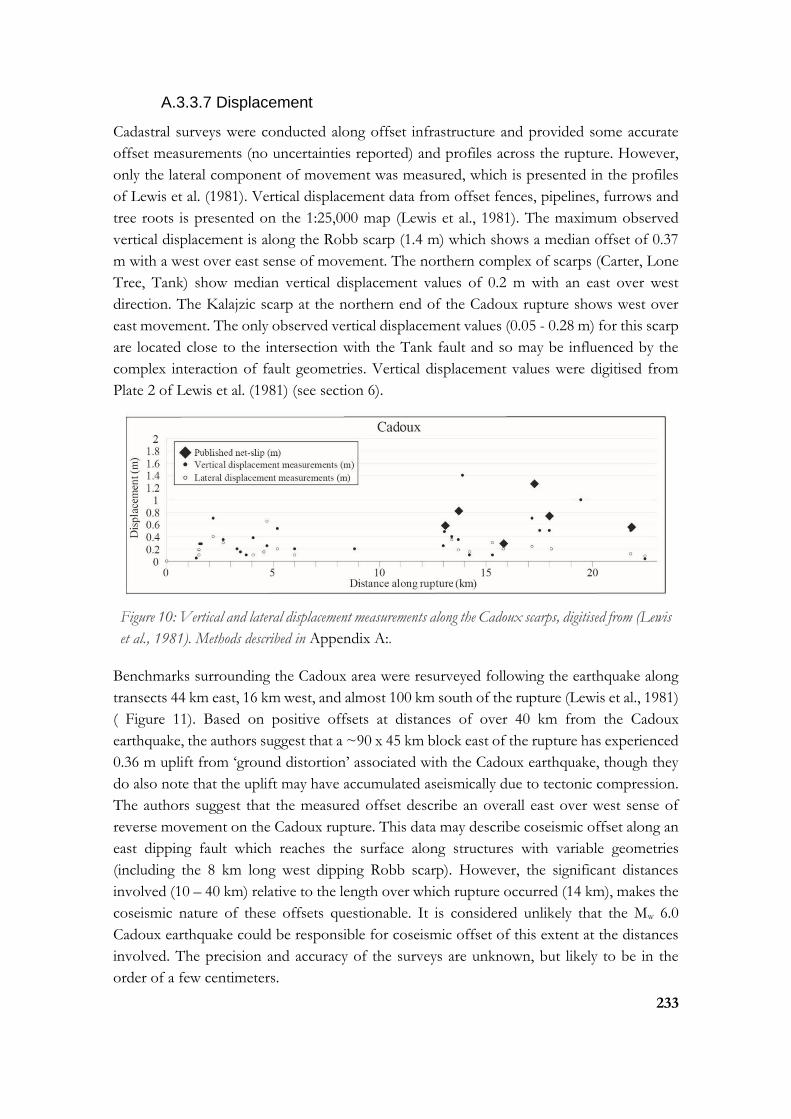
233
A.3.3.7 Displacement
Cadastral surveys were conducted along offset infrastructure and provided some accurate
offset measurements (no uncertainties reported) and profiles across the rupture. However,
only the lateral component of movement was measured, which is presented in the profiles
of Lewis et al. (1981). Vertical displacement data from offset fences, pipelines, furrows and
tree roots is presented on the 1:25,000 map (Lewis et al., 1981). The maximum observed
vertical displacement is along the Robb scarp (1.4 m) which shows a median offset of 0.37
m with a west over east sense of movement. The northern complex of scarps (Carter, Lone
Tree, Tank) show median vertical displacement values of 0.2 m with an east over west
direction. The Kalajzic scarp at the northern end of the Cadoux rupture shows west over
east movement. The only observed vertical displacement values (0.05 - 0.28 m) for this scarp
are located close to the intersection with the Tank fault and so may be influenced by the
complex interaction of fault geometries. Vertical displacement values were digitised from
Plate 2 of Lewis et al. (1981) (see section 6).
Figure 10: Vertical and lateral displacement measurements along the Cadoux scarps, digitised from (Lewis
et al., 1981). Methods described in Appendix A:.
Benchmarks surrounding the Cadoux area were resurveyed following the earthquake along
transects 44 km east, 16 km west, and almost 100 km south of the rupture (Lewis et al., 1981)
( Figure 11). Based on positive offsets at distances of over 40 km from the Cadoux
earthquake, the authors suggest that a ~90 x 45 km block east of the rupture has experienced
0.36 m uplift from ‘ground distortion’ associated with the Cadoux earthquake, though they
do also note that the uplift may have accumulated aseismically due to tectonic compression.
The authors suggest that the measured offset describe an overall east over west sense of
reverse movement on the Cadoux rupture. This data may describe coseismic offset along an
east dipping fault which reaches the surface along structures with variable geometries
(including the 8 km long west dipping Robb scarp). However, the significant distances
involved (10 – 40 km) relative to the length over which rupture occurred (14 km), makes the
coseismic nature of these offsets questionable. It is considered unlikely that the Mw 6.0
Cadoux earthquake could be responsible for coseismic offset of this extent at the distances
involved. The precision and accuracy of the surveys are unknown, but likely to be in the
order of a few centimeters.
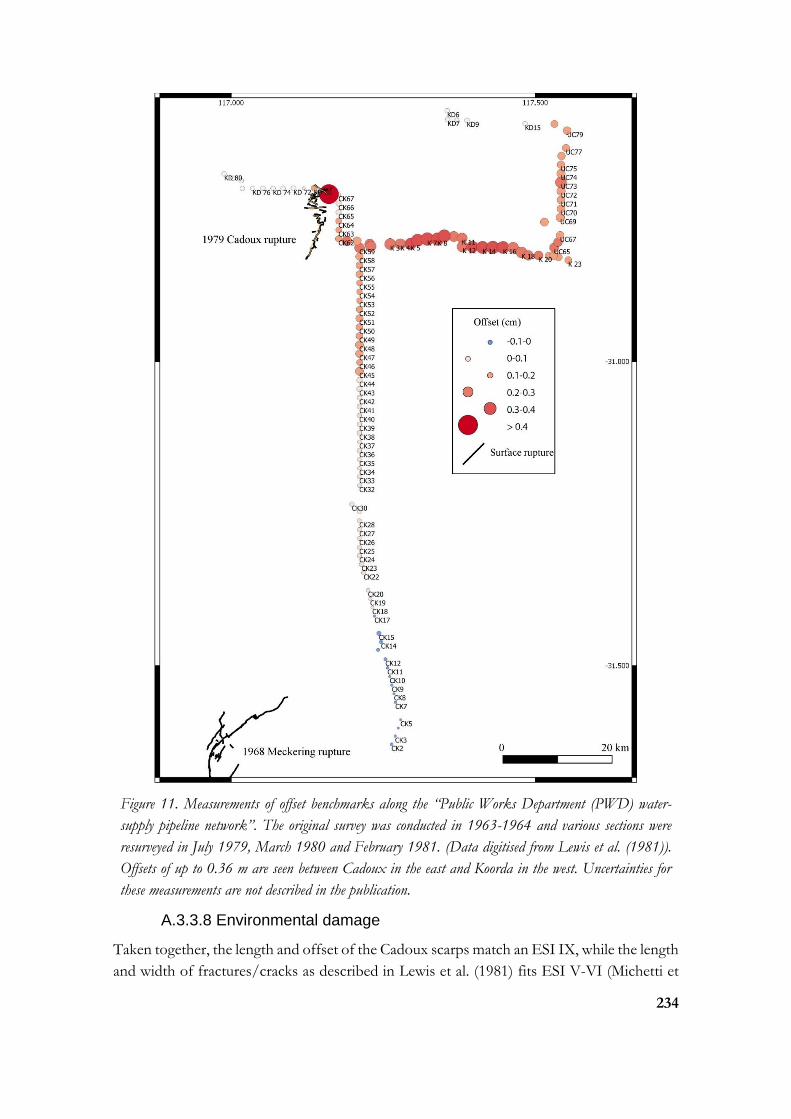
234
Figure 11. Measurements of offset benchmarks along the “Public Works Department (PWD) water-
supply pipeline network”. The original survey was conducted in 1963-1964 and various sections were
resurveyed in July 1979, March 1980 and February 1981. (Data digitised from Lewis et al. (1981)).
Offsets of up to 0.36 m are seen between Cadoux in the east and Koorda in the west. Uncertainties for
these measurements are not described in the publication.
A.3.3.8 Environmental damage
Taken together, the length and offset of the Cadoux scarps match an ESI IX, while the length
and width of fractures/cracks as described in Lewis et al. (1981) fits ESI V-VI (Michetti et
235
al., 2007). Lewis et al. (1981) investigate bore data from around Western Australia and find
that water levels in confined and unconfined aquifers in the Perth Basin and Murchison
district show anomalous deviations coinciding with the timing of the Cadoux mainshock.
The data for the Murchison district (~500 km north) are less convincing than that of the
Perth Basin (~200 km west) (Lewis et al., 1981). If earthquake related, these hydrological
events relate to an ESI IV (“Rare occurrence of small variations in water level in wells and/or the flow-
rate of springs”) (Michetti et al., 2007; Serva et al., 2016). No other environmental damage is
specifically documented that falls within the ESI-07 scale. Holes are described along the
hanging-wall of the Carter thrust block unrelated to extensional cracking. Similar features are
described in King et al. (2018) as related to failure of ‘collapsible soils’ due to seismic shaking
(e.g. Rogers (1995)).
A.3.4 Paleoseismology
No detailed palaeoseismic investigations of the Cadoux fault have been published. Lewis et
al. (1981) describe a 1 m deep trench across the Carter scarp which exposed ~0.5 m of
surficial sediments (~0.4 m sand, 0.1 m brown soil) overlying “clayey weathered granite”.
These sands are described as Tertiary in age on the available 1:250 000 geological map (Blight
et al., 1983). They found offset confined to a single rupture through the granite which split
to three ruptures in a narrow band through the sand and to the surface. Bedrock offset in
the trench matches offsets at the surface, and the authors describe no pre-existing structures
/ fault gouge / shear zones in the bedrock, suggesting no relief existed across bedrock prior
to 1979.
A second trench is described across the Tank scarp which showed rupture occurred along
the edge of a pre-existing quartz vein in the basement granite. The authors interpret this as
evidence that at least in this location, faulting was controlled by pre-existing structures. No
further information is provided about this trench. Based on the description there is no
evidence to suggest the quartz vein was related to prior rupture along this fault. It likely
relates to Proterozoic – Archean formation and/or metamorphism and/or deformation of
the granite, suggesting no prior rupture in the Cenozoic.
Lewis et al. (1981) note that the Cadoux rupture is roughly coincident with a drainage divide
between the North Mortlock River to the west, and salt playas to the east. This topographic
divide runs for at least 30 km NNE-SSW.
A.3.4.1 Slip rate
Strong evidence exists to suggest that the northern Cadoux scarps (Lone Tree, Carter Main,
Tank and Kalajzic) were controlled by basement structures, including the observation of the
Tank scarp rupturing along a pre-existing quartz vein within granite and the Kalajzic
rupturing coincident with outcrops of granite. This is consistent with previous work across
the SWSZ and 1968 Meckering surface rupture (Dentith & Featherstone, 2003; Dentith et
al., 2009). No evidence exists to suggest prior Cenozoic rupture on the structures that hosted
displacement in the 1979 Cadoux earthquake. The rupture is either the first neotectonic

236
event, or the recurrence interval is sufficiently long that all relief relating to prior event(s) was
eroded prior to 1979. If recurrence is assumed, vertical relief generation rates are limited by
very low bedrock erosion rates of < 5 m/Myr (Bierman & Caffee, 2002; Belton et al., 2004).
A.3.5 Summary
A.3.5.1 Surface rupture relationship to Geology
The Tank scarp ruptures through both exposed and thinly covered granite for much of its
length. The Kalajzic scarp ruptures within 50 m of weathered and fresh surface outcrops of
granite on both the hanging-wall and footwall (the scarp is visible on Google and Bing
satellite imagery where fields have not been tilled, -30.71, 117.14 to -30.70, 117.14)). The
majority of the surface outcrop falls on the hanging-wall of this scarp. The Cadoux scarps
roughly align with magnetic anomalies, with a very slight magnetic high on the Robb fault
hanging-wall (west side) (Figure 2).
Surface bedrock structural fabric measurements align favourably with the northern scarp
geometries, but not to the southern Robb Scarp. The steeply dipping Lone Tree and Kalajzic
scarps strike in the same approximate direction as bedrock foliations observed to have
vertical dips ~8 – 10 km north of the ruptures. The steeply dipping Tank scarp aligns roughly
with nearby dykes, with presumed steep intrusion boundaries. The shallow dipping Main
Carter scarp strikes in the same direction as nearby outcrop foliations, but these show steeper
dips of 50 - 65°. Only one mapped structural measurement shows a westerly dip, ~10 km
east of the southern limit of the Robb scarp. East dipping measurements are mapped at a
similar distance on the west side of the west dipping Robb scarp.
A.3.5.2 Surface rupture relationship to Seismology
Measurements of surface scarps suggest interacting west, east and south dipping faults and
lithological trends along the Cadoux ruptures (Lewis et al., 1981). If the resurveyed
benchmarks capture true coseismic distributed deformation related to this earthquake they
suggest an overall east over west movement, while the longest section of continuous surface
rupture (the 8 km Robb scarp) shows a west over east movement. Lewis et al. (1981) show
the mainshock and majority of aftershocks recording up to June 1980 on the east side of the
rupture, though these data have high location and depth uncertainties. Relocations of original
aftershock data, and data from temporary seismic arrays in the years following the mainshock
(1980 – 1983) show zones of high seismicity to the north and south of the ruptures (Denham
et al., 1987) and depths supportive of a west dip for the Robb fault (Dent & Gregson, 1986;
Dent, 1988). Focal mechanism planes that best match the overall NNE strike of rupture fit
steep east dipping (unpublished described in (Lewis et al., 1981)), steep east or west dipping
(Fredrich et al., 1988), and steep west dipping solutions (Denham et al., 1987). Boatwright
and Choy (1992) analyse P-wave acceleration spectra for the Cadoux earthquake and suggest
that broadband time domain records show complex rupture processes.
If each of the Cadoux scarps correspond to through-going faults at depth, the rupture pattern
highlights a complex geometry of up to six interacting structures which accommodated
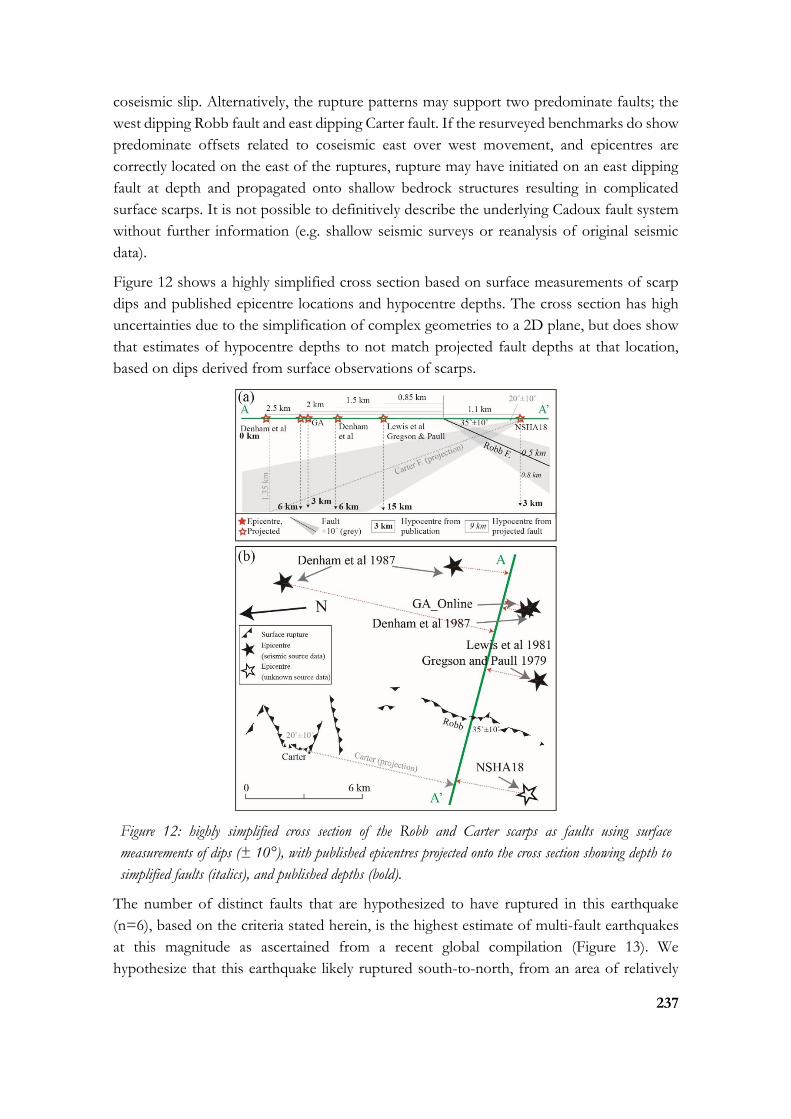
237
coseismic slip. Alternatively, the rupture patterns may support two predominate faults; the
west dipping Robb fault and east dipping Carter fault. If the resurveyed benchmarks do show
predominate offsets related to coseismic east over west movement, and epicentres are
correctly located on the east of the ruptures, rupture may have initiated on an east dipping
fault at depth and propagated onto shallow bedrock structures resulting in complicated
surface scarps. It is not possible to definitively describe the underlying Cadoux fault system
without further information (e.g. shallow seismic surveys or reanalysis of original seismic
data).
Figure 12 shows a highly simplified cross section based on surface measurements of scarp
dips and published epicentre locations and hypocentre depths. The cross section has high
uncertainties due to the simplification of complex geometries to a 2D plane, but does show
that estimates of hypocentre depths to not match projected fault depths at that location,
based on dips derived from surface observations of scarps.
Figure 12: highly simplified cross section of the Robb and Carter scarps as faults using surface
measurements of dips (± 10°), with published epicentres projected onto the cross section showing depth to
simplified faults (italics), and published depths (bold).
The number of distinct faults that are hypothesized to have ruptured in this earthquake
(n=6), based on the criteria stated herein, is the highest estimate of multi-fault earthquakes
at this magnitude as ascertained from a recent global compilation (Figure 13). We
hypothesize that this earthquake likely ruptured south-to-north, from an area of relatively

238
simple (Robb fault) to relatively complex crustal structure, that caused a multi-fault rupture
cascade.
Figure 13:From Fig. 5 of Quigley et al. (2017), Cadoux earthquake (red box) plotted against recent
global compilation of number of geometrically-distinguished fault ruptures vs. Mw.
A.3.6 Appendix A:
A.3.6.1 Methods for digitising vertical displacement data and benchmark
data
Vertical offset measurements for the Cadoux scarp are mapped along the scarp in Plate 2
Lewis et al. (1981). This map was georeferenced against satellite imagery based on the
locations of roads, fences, and train tracks. The locations and vertical offset were recorded
into a new point shapefile. A simplified fault trace was created for the scarps, and a short
script5 was used in QGIS attribute manager field calculator to extract the distance of each
vertical offset measurement along the simplified fault trace. The shape file was extracted into
a final CSV with x-y coordinates, vertical offset measurements, and distance along fault data.
Vertical differencing from resurveyed offset benchmarks across the Cadoux-Koorda area are
presented in Table 12 of Lewis et al. (1981). These show the benchmark name, but no x-y
coordinates. The benchmark name and vertical difference data were extracted from a pdf
into excel, and thoroughly checked for copy errors in the data. Benchmark locations for the
Cadoux region were selected from the Western Australia Geodetic Survey Marks shapefile6
and extracted into a CSV file. These benchmark names were cross-referenced against digitise
data from Table 12 (Lewis et al., 1981) to assign x-y coordinates of benchmarks to vertical
difference measurements.
5 line_locate_point( geometry:=geometry(get_feature('Line', 'id', '1')), point:=$geometry) 6 https://catalogue.data.wa.gov.au/dataset/geodetic-survey-marks-point
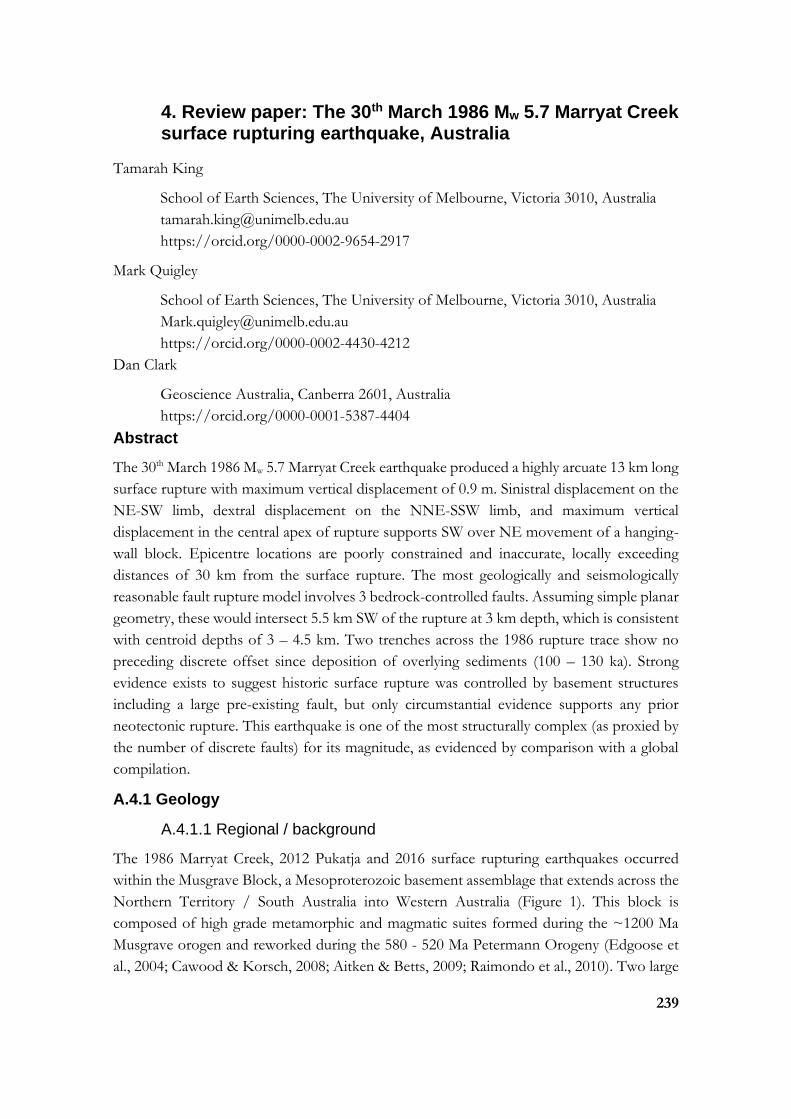
239
4. Review paper: The 30th March 1986 Mw 5.7 Marryat Creek surface rupturing earthquake, Australia
Tamarah King
School of Earth Sciences, The University of Melbourne, Victoria 3010, Australia
https://orcid.org/0000-0002-9654-2917
Mark Quigley
School of Earth Sciences, The University of Melbourne, Victoria 3010, Australia
https://orcid.org/0000-0002-4430-4212
Dan Clark
Geoscience Australia, Canberra 2601, Australia
https://orcid.org/0000-0001-5387-4404
Abstract
The 30th March 1986 Mw 5.7 Marryat Creek earthquake produced a highly arcuate 13 km long
surface rupture with maximum vertical displacement of 0.9 m. Sinistral displacement on the
NE-SW limb, dextral displacement on the NNE-SSW limb, and maximum vertical
displacement in the central apex of rupture supports SW over NE movement of a hanging-
wall block. Epicentre locations are poorly constrained and inaccurate, locally exceeding
distances of 30 km from the surface rupture. The most geologically and seismologically
reasonable fault rupture model involves 3 bedrock-controlled faults. Assuming simple planar
geometry, these would intersect 5.5 km SW of the rupture at 3 km depth, which is consistent
with centroid depths of 3 – 4.5 km. Two trenches across the 1986 rupture trace show no
preceding discrete offset since deposition of overlying sediments (100 – 130 ka). Strong
evidence exists to suggest historic surface rupture was controlled by basement structures
including a large pre-existing fault, but only circumstantial evidence supports any prior
neotectonic rupture. This earthquake is one of the most structurally complex (as proxied by
the number of discrete faults) for its magnitude, as evidenced by comparison with a global
compilation.
A.4.1 Geology
A.4.1.1 Regional / background
The 1986 Marryat Creek, 2012 Pukatja and 2016 surface rupturing earthquakes occurred
within the Musgrave Block, a Mesoproterozoic basement assemblage that extends across the
Northern Territory / South Australia into Western Australia (Figure 1). This block is
composed of high grade metamorphic and magmatic suites formed during the ~1200 Ma
Musgrave orogen and reworked during the 580 - 520 Ma Petermann Orogeny (Edgoose et
al., 2004; Cawood & Korsch, 2008; Aitken & Betts, 2009; Raimondo et al., 2010). Two large
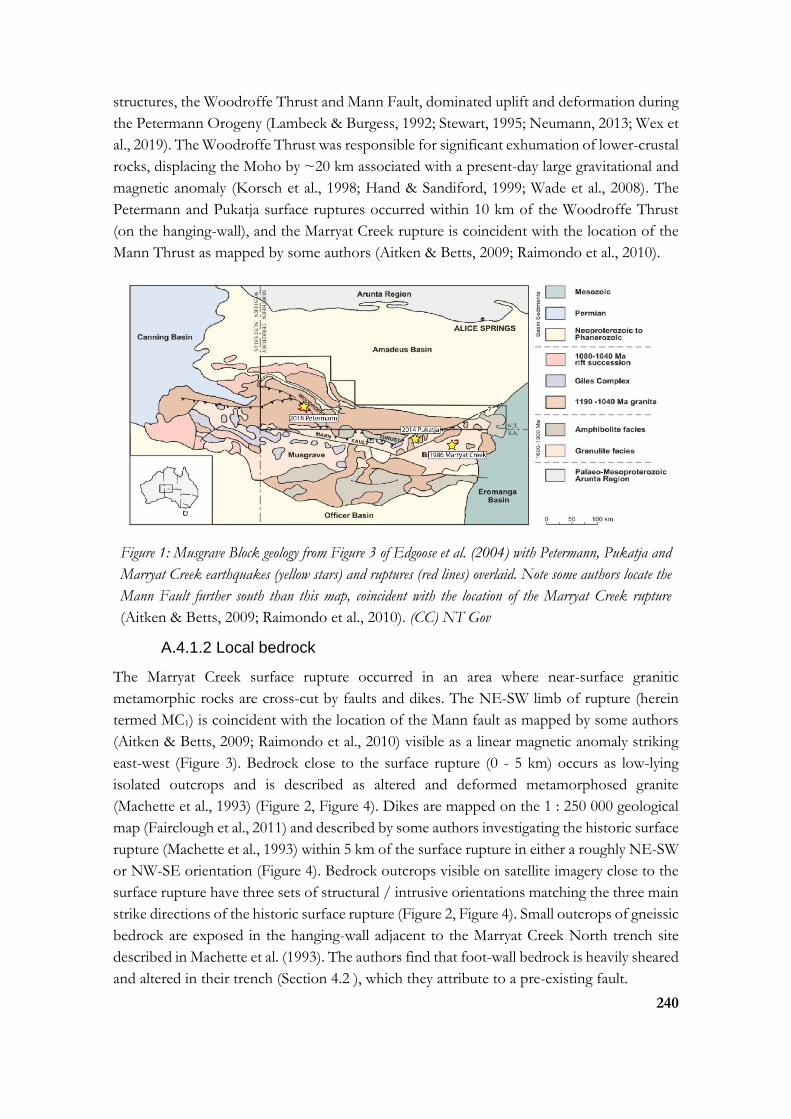
240
structures, the Woodroffe Thrust and Mann Fault, dominated uplift and deformation during
the Petermann Orogeny (Lambeck & Burgess, 1992; Stewart, 1995; Neumann, 2013; Wex et
al., 2019). The Woodroffe Thrust was responsible for significant exhumation of lower-crustal
rocks, displacing the Moho by ~20 km associated with a present-day large gravitational and
magnetic anomaly (Korsch et al., 1998; Hand & Sandiford, 1999; Wade et al., 2008). The
Petermann and Pukatja surface ruptures occurred within 10 km of the Woodroffe Thrust
(on the hanging-wall), and the Marryat Creek rupture is coincident with the location of the
Mann Thrust as mapped by some authors (Aitken & Betts, 2009; Raimondo et al., 2010).
Figure 1: Musgrave Block geology from Figure 3 of Edgoose et al. (2004) with Petermann, Pukatja and
Marryat Creek earthquakes (yellow stars) and ruptures (red lines) overlaid. Note some authors locate the
Mann Fault further south than this map, coincident with the location of the Marryat Creek rupture
(Aitken & Betts, 2009; Raimondo et al., 2010). (CC) NT Gov
A.4.1.2 Local bedrock
The Marryat Creek surface rupture occurred in an area where near-surface granitic
metamorphic rocks are cross-cut by faults and dikes. The NE-SW limb of rupture (herein
termed MC1) is coincident with the location of the Mann fault as mapped by some authors
(Aitken & Betts, 2009; Raimondo et al., 2010) visible as a linear magnetic anomaly striking
east-west (Figure 3). Bedrock close to the surface rupture (0 - 5 km) occurs as low-lying
isolated outcrops and is described as altered and deformed metamorphosed granite
(Machette et al., 1993) (Figure 2, Figure 4). Dikes are mapped on the 1 : 250 000 geological
map (Fairclough et al., 2011) and described by some authors investigating the historic surface
rupture (Machette et al., 1993) within 5 km of the surface rupture in either a roughly NE-SW
or NW-SE orientation (Figure 4). Bedrock outcrops visible on satellite imagery close to the
surface rupture have three sets of structural / intrusive orientations matching the three main
strike directions of the historic surface rupture (Figure 2, Figure 4). Small outcrops of gneissic
bedrock are exposed in the hanging-wall adjacent to the Marryat Creek North trench site
described in Machette et al. (1993). The authors find that foot-wall bedrock is heavily sheared
and altered in their trench (Section 4.2 ), which they attribute to a pre-existing fault.
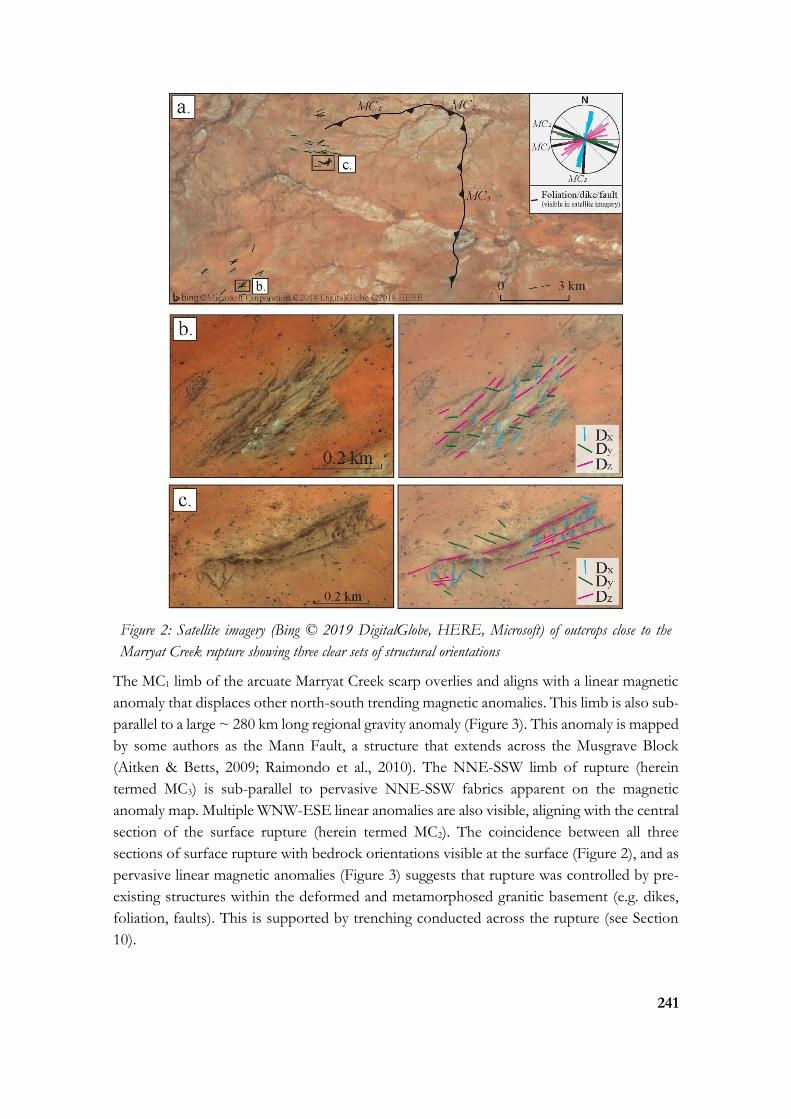
241
Figure 2: Satellite imagery (Bing © 2019 DigitalGlobe, HERE, Microsoft) of outcrops close to the
Marryat Creek rupture showing three clear sets of structural orientations
The MC1 limb of the arcuate Marryat Creek scarp overlies and aligns with a linear magnetic
anomaly that displaces other north-south trending magnetic anomalies. This limb is also sub-
parallel to a large ~ 280 km long regional gravity anomaly (Figure 3). This anomaly is mapped
by some authors as the Mann Fault, a structure that extends across the Musgrave Block
(Aitken & Betts, 2009; Raimondo et al., 2010). The NNE-SSW limb of rupture (herein
termed MC3) is sub-parallel to pervasive NNE-SSW fabrics apparent on the magnetic
anomaly map. Multiple WNW-ESE linear anomalies are also visible, aligning with the central
section of the surface rupture (herein termed MC2). The coincidence between all three
sections of surface rupture with bedrock orientations visible at the surface (Figure 2), and as
pervasive linear magnetic anomalies (Figure 3) suggests that rupture was controlled by pre-
existing structures within the deformed and metamorphosed granitic basement (e.g. dikes,
foliation, faults). This is supported by trenching conducted across the rupture (see Section
10).

242
Figure 3: Marryat Creek scarp (black lines) relative to magnetic anomaly and bouguer gravity anomaly
maps. National bouguer gravity anomaly map: http://pid.geoscience.gov.au/dataset/ga/101104.
National total magnetic intensity map: http://pid.geoscience.gov.au/dataset/ga/89596
A.4.1.3 Surficial deposits
Bedrock is overlain by clastic alluvial, colluvial and aeolian sediments and soils (Figure 4) up
to 10 m thick in dunes and drainages , but generally < 3 m thick and underlain by gneissic or
granulite basement (as logged in water bore-hole data7 surrounding the surface rupture at <
15 km distance).
Figure 4: Crop of Alberga 1:250 000 digital edition geological map sheet (Fairclough et al., 2011) showing
basement and surface sediments around the Marryat Creek surface rupture. Full map and legend available
from Government of South Australia, Department for Energy and Mining:
http://www.energymining.sa.gov.au/minerals/online_tools/free_data_delivery_and_publication_download
s/digital_maps_and_data
7 https://www.waterconnect.sa.gov.au/Systems/GD/Pages/Default.aspx

243
A.4.2. Seismology
A.4.2.1 Epicentre and magnitude
The Marryat Creek earthquake occurred more than 300 km from the nearest seismometer
(Alice Springs). Some instrumental recordings were omitted from epicentral determinations
due to high negative travel time residuals (between 5 – 17 degrees) (Barlow et al., 1986). The
first published locations (Barlow et al., 1986) for the USGS place the epicentre ~ 15 km SW
of the surface rupture, and for GA (then BMR) ~35 km SW of the rupture (this location is
the current GA epicentre in the online catalogue). A revised location was published by
McCue et al. (1987) ~ 5 km west of the surface rupture on the hanging-wall, but they do not
elaborate on how this revision was made (it is assumed they located it relative to the surface
rupture hanging-wall). Denham (1988) provide updated locations from the USGS, GA and
one based on the surface rupture location. The recently published NSHA18 catalogue (Allen,
Leonard, et al., 2018) places the epicentre ~ 15 km south-west of the rupture, it is unknown
how this location was derived. The GA, USGS and NSHA18 epicentres do not lie close
enough to the surface rupture location to be considered accurate. The only published
uncertainty values are in the GA_online catalogue (± 1 km), and are considered lower that
what is reasonable given the instrumental density (statistical uncertainties are considered to
be closer to ± 10 km (Leonard, 2008)). The mis-location of seismological epicentres away
from the surface rupture is a considered to be a combination of the velocity model used by
each agency, and other epistemic uncertainties. These large epistemic uncertainties in
epicentre location also affected foreshock and aftershock distributions (discussed below).
This paper prefers the magnitude (MW 5.7) of the recently published NSHA18 catalogue
(Allen, Leonard, et al., 2018) as they conduct a thorough and consistent reanalysis of
Australian magnitude values, particularly to address inconsistencies in the determination of
historic magnitude values. This is generally consistent with previously reported magnitude
values (ML/Mb/Ms 5.7 - 5.8).
Table 1 : Published epicentre locations, depths and magnitudes
Reference Agency Latitude ± (km)
Longitude ± (km)
Depth (km)
± (km)
M1 M2
GA_online GA -26.333 1 132.517 1 5 5.7 Mw 6 ML
Barlow et al (1986)
GA -26.33 132.52 0
McCue et al (1987)
Rupture based
-26.22 132.82
5.7 Mb 5.8 Ms,
Allen et al (2018)
-26.31 132.734 5
5.7 Mw
Barlow et al (1986)
Rupture based
-26.199 132.83
Barlow et al (1986)
“South Australia”
-26.285 133.019 19
5.2 ML
Barlow et al (1986)
USGS -26.23 132.7 10
5.8 Ms 5.7 Mb
Denham (1988)
Rupture based
-26.2 132.8
5.8 Ms
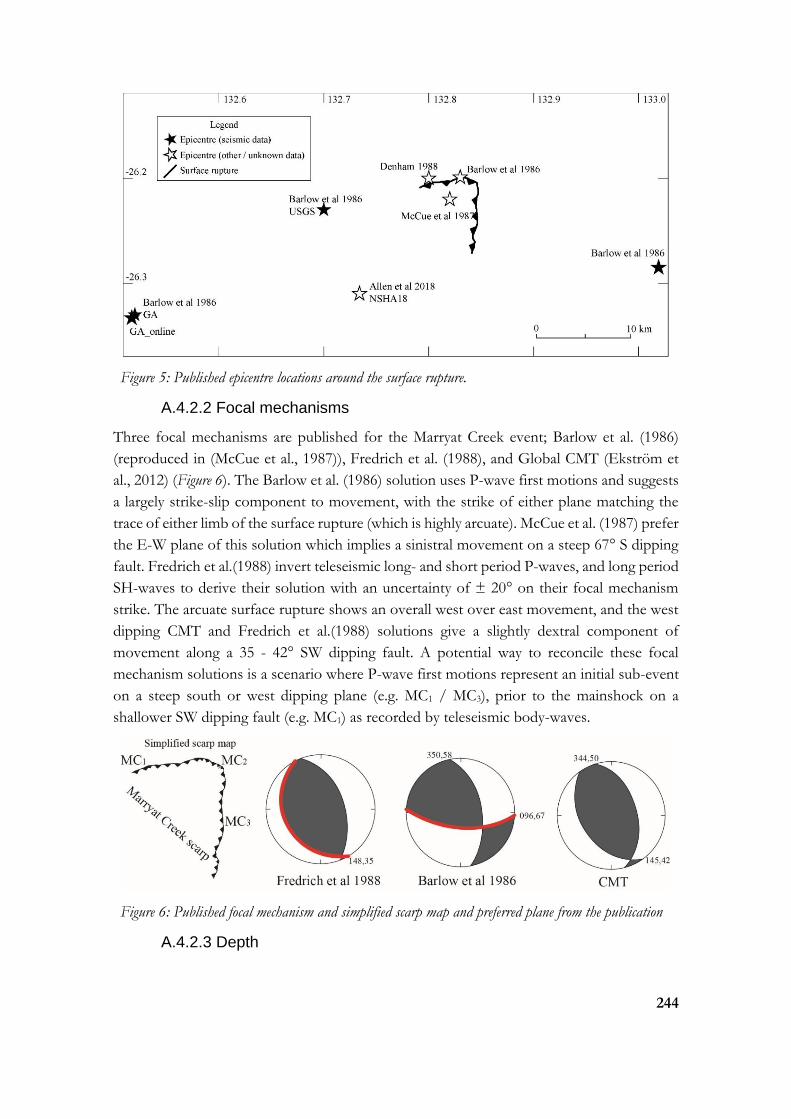
244
Figure 5: Published epicentre locations around the surface rupture.
A.4.2.2 Focal mechanisms
Three focal mechanisms are published for the Marryat Creek event; Barlow et al. (1986)
(reproduced in (McCue et al., 1987)), Fredrich et al. (1988), and Global CMT (Ekström et
al., 2012) (Figure 6). The Barlow et al. (1986) solution uses P-wave first motions and suggests
a largely strike-slip component to movement, with the strike of either plane matching the
trace of either limb of the surface rupture (which is highly arcuate). McCue et al. (1987) prefer
the E-W plane of this solution which implies a sinistral movement on a steep 67° S dipping
fault. Fredrich et al.(1988) invert teleseismic long- and short period P-waves, and long period
SH-waves to derive their solution with an uncertainty of ± 20° on their focal mechanism
strike. The arcuate surface rupture shows an overall west over east movement, and the west
dipping CMT and Fredrich et al.(1988) solutions give a slightly dextral component of
movement along a 35 - 42° SW dipping fault. A potential way to reconcile these focal
mechanism solutions is a scenario where P-wave first motions represent an initial sub-event
on a steep south or west dipping plane (e.g. MC1 / MC3), prior to the mainshock on a
shallower SW dipping fault (e.g. MC1) as recorded by teleseismic body-waves.
Figure 6: Published focal mechanism and simplified scarp map and preferred plane from the publication
A.4.2.3 Depth
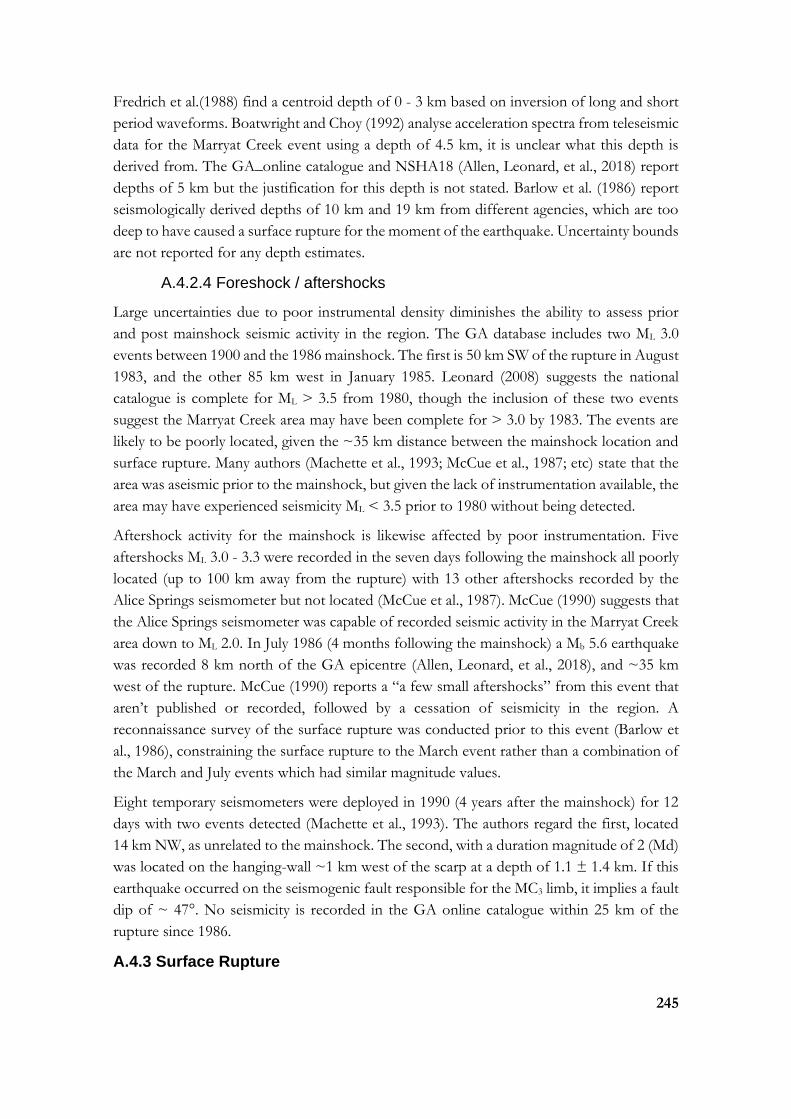
245
Fredrich et al.(1988) find a centroid depth of 0 - 3 km based on inversion of long and short
period waveforms. Boatwright and Choy (1992) analyse acceleration spectra from teleseismic
data for the Marryat Creek event using a depth of 4.5 km, it is unclear what this depth is
derived from. The GA_online catalogue and NSHA18 (Allen, Leonard, et al., 2018) report
depths of 5 km but the justification for this depth is not stated. Barlow et al. (1986) report
seismologically derived depths of 10 km and 19 km from different agencies, which are too
deep to have caused a surface rupture for the moment of the earthquake. Uncertainty bounds
are not reported for any depth estimates.
A.4.2.4 Foreshock / aftershocks
Large uncertainties due to poor instrumental density diminishes the ability to assess prior
and post mainshock seismic activity in the region. The GA database includes two ML 3.0
events between 1900 and the 1986 mainshock. The first is 50 km SW of the rupture in August
1983, and the other 85 km west in January 1985. Leonard (2008) suggests the national
catalogue is complete for ML > 3.5 from 1980, though the inclusion of these two events
suggest the Marryat Creek area may have been complete for > 3.0 by 1983. The events are
likely to be poorly located, given the ~35 km distance between the mainshock location and
surface rupture. Many authors (Machette et al., 1993; McCue et al., 1987; etc) state that the
area was aseismic prior to the mainshock, but given the lack of instrumentation available, the
area may have experienced seismicity ML < 3.5 prior to 1980 without being detected.
Aftershock activity for the mainshock is likewise affected by poor instrumentation. Five
aftershocks ML 3.0 - 3.3 were recorded in the seven days following the mainshock all poorly
located (up to 100 km away from the rupture) with 13 other aftershocks recorded by the
Alice Springs seismometer but not located (McCue et al., 1987). McCue (1990) suggests that
the Alice Springs seismometer was capable of recorded seismic activity in the Marryat Creek
area down to ML 2.0. In July 1986 (4 months following the mainshock) a Mb 5.6 earthquake
was recorded 8 km north of the GA epicentre (Allen, Leonard, et al., 2018), and ~35 km
west of the rupture. McCue (1990) reports a “a few small aftershocks” from this event that
aren’t published or recorded, followed by a cessation of seismicity in the region. A
reconnaissance survey of the surface rupture was conducted prior to this event (Barlow et
al., 1986), constraining the surface rupture to the March event rather than a combination of
the March and July events which had similar magnitude values.
Eight temporary seismometers were deployed in 1990 (4 years after the mainshock) for 12
days with two events detected (Machette et al., 1993). The authors regard the first, located
14 km NW, as unrelated to the mainshock. The second, with a duration magnitude of 2 (Md)
was located on the hanging-wall ~1 km west of the scarp at a depth of 1.1 ± 1.4 km. If this
earthquake occurred on the seismogenic fault responsible for the MC3 limb, it implies a fault
dip of ~ 47°. No seismicity is recorded in the GA online catalogue within 25 km of the
rupture since 1986.
A.4.3 Surface Rupture

246
A.4.3.1 Authors / map quality
The Marryat Creek surface rupture is one of the least accessible of all historic Australian
ruptures, a 370 km drive south of Alice Springs or 1300 km north from Adelaide. The rupture
occurred within the Anangu Pitjantjatjara Yankunytjatjara (APY) area of South Australia,
making access dependant on permits. Despite the remoteness, detailed surveying was
conducted along the length of rupture to characterise offset (Bowman & Barlow, 1991), aerial
photography was obtained to help map the rupture, and multiple trenches were dug to
characterise geometry and palaeoseismicity (Machette et al., 1993). The few published aerial
images of the scarp (e.g. figure 8 Machette et al. (1993)) and 1:500 maps (Plate 2 (Machette
et al., 1993)) show rupture complexity with duplexing ruptures, hanging-wall folding /
cracking, and small < 20 m steps in rupture. This complexity is not captured in the published
1 : 10 000 and 1 : 50 000 maps of the rupture (e.g. (Bowman & Barlow, 1991; Machette et
al., 1993)). The rupture trace from the GA Neotectonics Features database (Clark et al., 2012)
and sections visible in Google and Bing satellite imagery do not align, due to datum
transformation issues and simplification of fine-scale morphology in the original map.
A.4.3.2 Length and shape
The Marryat Creek scarp is highly arcuate in a concave direction (relative to the hanging-
wall) with an 8 km distance between end points. The trace length of published maps of the
rupture (Figure 7a) is between 13.8 -14.2 km (Bowman & Barlow, 1991; Machette et al.,
1993). Bowman and Barlow (1991) describe lengths of 5.5 km for MC1 and 7.5 km for the
MC3 (13 km total) where the mid-section of rupture (MC2) is captured in the length of MC1
(Figure 7b). A length of 13 km is used across publications describing the rupture (Barlow et
al., 1986; McCue et al., 1987; McCue, 1990; Machette et al., 1993). Applying a criteria which
simplifies ruptures to straight traces and defines distinct faults where mapped primary
rupture has gaps/steps > 1 km and/or where strike changes by > 20° for distances > 1 km
(e.g. (Quigley et al., 2017)) results in three faults with a total length of 13.6 km (Figure 7c)
(explored in more detail in King et al. (2019) (in review)).
Figure 7d presents portions of the scarp where more than two vertical displacement
measurements of greater than 0.2 m occur within a distance of 1 km (data from Bowman
and Barlow (1991)). Applying cosmogenic erosion rates from lithologically and climatically
analogous settings of Australia (0.3 – 5 m/Myr; Bierman and Caffee, 2002) suggests that 0.2
m of scarp height could be removed within 35 – 660 kyrs, leaving just 1 km of rupture length
(i.e., 1 km of residual surface rupture with relief ≥ 0.2m) visible in the landscape. This
suggests that the surface scarp may not persist within this landscape as a mappable scarp,
unless recurrence intervals are < 0.5 to 1 Myr. Potential recurrence on this fault is limited by
trenching results (Section 4) to > 130 ka (Machette et al., 1993). In this calculation we assume
that the scarp is shallowly underlain by granitic bedrock and that the scarp erodes more
rapidly than the surrounding terrain at rates commensurate with Bierman and Caffee (2002).
We do not account for erosion rates of any duricrust which may overlie granitic bedrock or
anthropogenically- and/or climatically-modulated variations in erosion rates.
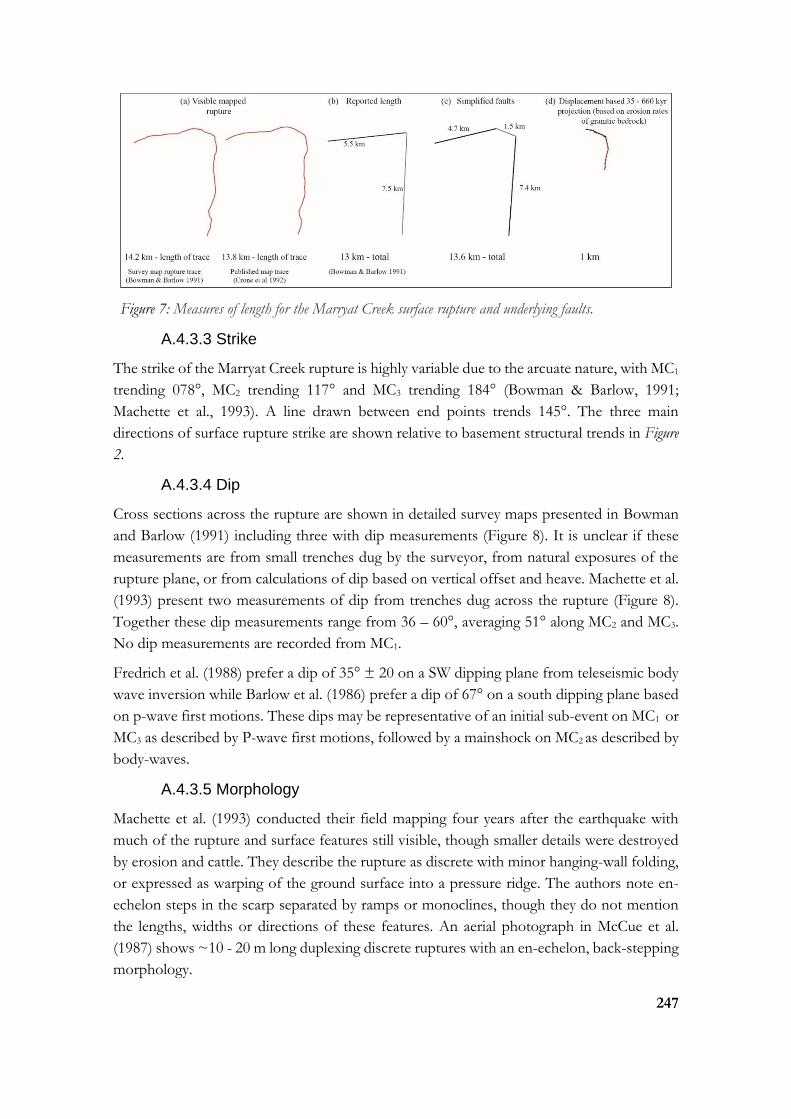
247
Figure 7: Measures of length for the Marryat Creek surface rupture and underlying faults.
A.4.3.3 Strike
The strike of the Marryat Creek rupture is highly variable due to the arcuate nature, with MC1
trending 078°, MC2 trending 117° and MC3 trending 184° (Bowman & Barlow, 1991;
Machette et al., 1993). A line drawn between end points trends 145°. The three main
directions of surface rupture strike are shown relative to basement structural trends in Figure
2.
A.4.3.4 Dip
Cross sections across the rupture are shown in detailed survey maps presented in Bowman
and Barlow (1991) including three with dip measurements (Figure 8). It is unclear if these
measurements are from small trenches dug by the surveyor, from natural exposures of the
rupture plane, or from calculations of dip based on vertical offset and heave. Machette et al.
(1993) present two measurements of dip from trenches dug across the rupture (Figure 8).
Together these dip measurements range from 36 – 60°, averaging 51° along MC2 and MC3.
No dip measurements are recorded from MC1.
Fredrich et al. (1988) prefer a dip of 35° ± 20 on a SW dipping plane from teleseismic body
wave inversion while Barlow et al. (1986) prefer a dip of 67° on a south dipping plane based
on p-wave first motions. These dips may be representative of an initial sub-event on MC1 or
MC3 as described by P-wave first motions, followed by a mainshock on MC2 as described by
body-waves.
A.4.3.5 Morphology
Machette et al. (1993) conducted their field mapping four years after the earthquake with
much of the rupture and surface features still visible, though smaller details were destroyed
by erosion and cattle. They describe the rupture as discrete with minor hanging-wall folding,
or expressed as warping of the ground surface into a pressure ridge. The authors note en-
echelon steps in the scarp separated by ramps or monoclines, though they do not mention
the lengths, widths or directions of these features. An aerial photograph in McCue et al.
(1987) shows ~10 - 20 m long duplexing discrete ruptures with an en-echelon, back-stepping
morphology.
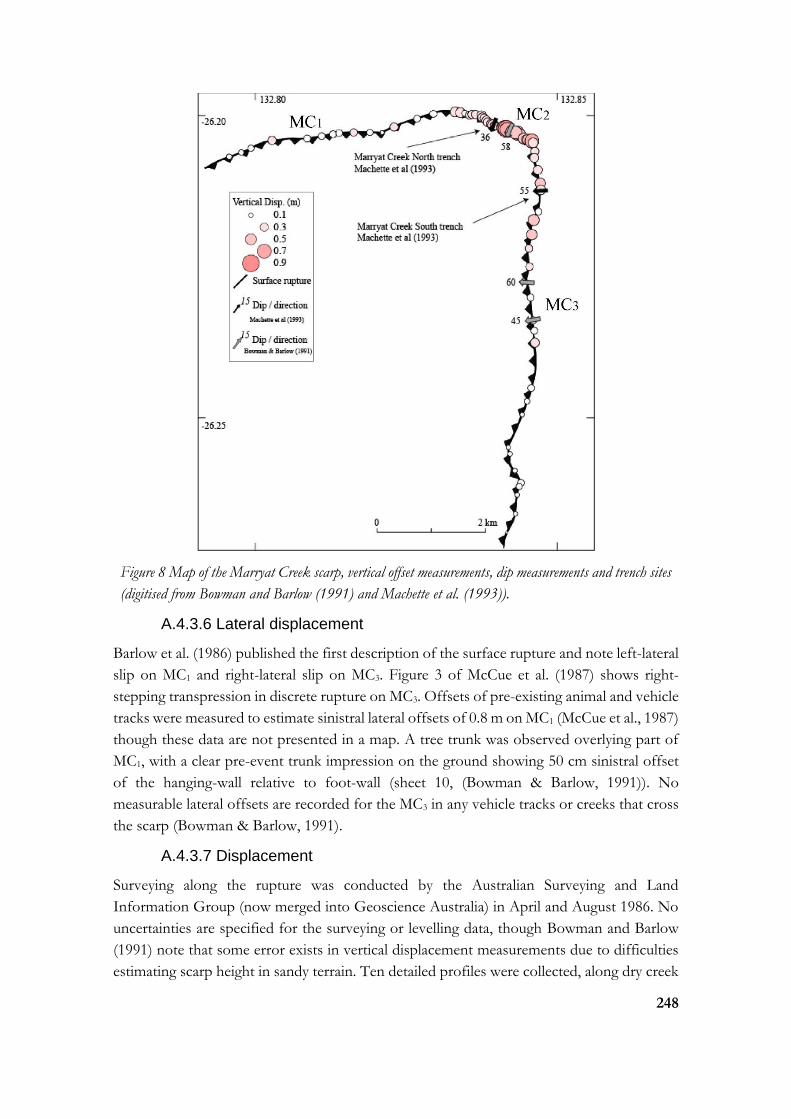
248
Figure 8 Map of the Marryat Creek scarp, vertical offset measurements, dip measurements and trench sites
(digitised from Bowman and Barlow (1991) and Machette et al. (1993)).
A.4.3.6 Lateral displacement
Barlow et al. (1986) published the first description of the surface rupture and note left-lateral
slip on MC1 and right-lateral slip on MC3. Figure 3 of McCue et al. (1987) shows right-
stepping transpression in discrete rupture on MC3. Offsets of pre-existing animal and vehicle
tracks were measured to estimate sinistral lateral offsets of 0.8 m on MC1 (McCue et al., 1987)
though these data are not presented in a map. A tree trunk was observed overlying part of
MC1, with a clear pre-event trunk impression on the ground showing 50 cm sinistral offset
of the hanging-wall relative to foot-wall (sheet 10, (Bowman & Barlow, 1991)). No
measurable lateral offsets are recorded for the MC3 in any vehicle tracks or creeks that cross
the scarp (Bowman & Barlow, 1991).
A.4.3.7 Displacement
Surveying along the rupture was conducted by the Australian Surveying and Land
Information Group (now merged into Geoscience Australia) in April and August 1986. No
uncertainties are specified for the surveying or levelling data, though Bowman and Barlow
(1991) note that some error exists in vertical displacement measurements due to difficulties
estimating scarp height in sandy terrain. Ten detailed profiles were collected, along dry creek

249
beds where possible. Vertical displacement measurements and profiles shows that vertical
displacement reaches a maximums of 0.5 - 0.9 m across 700 m along MC2 and diminishes to
< 0.25 m for the last 4 km of each limb.
Machette et al. (1993) appear to incorrectly reproduce some of the Bowman and Barlow
(1991) displacement data due to conversion errors. This data is replicated in scaling
relationships of Wesnousky (2008) and subsequent publications. We recommend referring
to the data tables in Bowman and Barlow (1991), or King et al. (2019) (in review).
Due to the remote nature, no absolute offset measurements are available from resurveyed
benchmarks, and no data regarding distributed deformation exist in the literature.
Figure 9 Vertical displacement measurements along the Marryat Creek scarp, digitised from Bowman and
Barlow (1991). Methods described in Appendix A.
A.4.3.8 Environmental damage
Offset and length of the Marryat Creek surface rupture matches ESI IX – X (Michetti et al.,
2007). Minimal fracturing is described in field studies of this earthquake, and none is shown
on the maps. From descriptions and published images of the rupture, fracture lengths and
widths are assigned ESI VII within a few meters of the surface rupture. Multiple authors
describe grass and bushes killed from root tear on the hanging-wall at distances of 5 m
(McCue et al., 1987; Bowman & Barlow, 1991). Rabbit warrens on the hanging-wall within
~10 m were observed to have collapsed, though warrens at similar distances on the foot-wall
were intact (McCue et al., 1987). This vegetation and surface damage does not fall within the
scope of the ESI-07 scale (Michetti et al., 2007). No authors report investigating bedrock
outcrops in the area, so it is unknown whether rockfalls occurred or not. Similarly, no
publications discuss hydrological anomalies in any nearby bores.
A.4.4 Paleoseismology
A.4.4.1 Summary
Machette et al. (1993) present detailed analysis of two trenches and eight samples taken for
grain size analysis, uranium trend analysis and thermoluminescence dating. This work is also
described in Crone et al. (1997).

250
A.4.4.2 Trenching
A.4.4.2.1 Identified units
Machette et al. (1993) includes comprehensive descriptions of units identified in two trenches
(Marryat Creek South across MC3 and Marryat Creek West across MC2, Figure 8) and present
a summary of exposed units alongside interpreted trench logs in Plate 1 of that report. The
trenches are located on either side of the apex of rupture, in the area of maximum vertical
offset. The western trench is ~10 m north of a dry creek bed, and the trench cuts across a
small, low outcrop of “sheared granite” (granitic gneiss) on the hanging-wall. The southern
trench is located just north of a very small dry tributary that eventually feeds into the Marryat
Creek. Both trenches were 2 - 2.5 m deep with exposed bedrock at 0.3 and 1.25 m (west and
south respectively). The authors interpret both trenches to show evidence of “ancient”
(presumedly 580 - 520 Ma Petermann Orogeny) faulting, but no evidence of prior Cenozoic
movement.
Bedrock in the MC2 trench is described as ‘fractured’, ‘sheared’ and ‘altered’ granite. The
fractured granite is described as having recognisable fabric and mineralogy, the sheared
portions retain only some original granitic fabric and mineralogy, and the ‘altered’ granite is
described as “extensively altered and sheared into light-greenish-gray clay”. The altered
granite is more abundant on the foot-wall, while the fresher granite is all on the hanging-wall.
Bedrock in the MC3 trench is assumed to be originally basaltic and described as “altered rock
(greenstone)”, “sheared rock (greenstone)” and “fractured rock (greenstone)” with the same
designation of ‘fractured’, ‘altered’ and ‘sheared’ as in the MC2 trench granites. Unlike the
MC2 trench, the majority of ‘fractured’ greenstone (i.e. freshest) is found on the foot-wall of
the modern rupture. The authors suggest that the extreme brecciation of the foot-wall
bedrock in both trenches provides evidence of ancient faulting with “significant amount of
differential movement” considering the width and extent of foot-wall alteration (>10’s of
meters). They identify that while some blocks of fresher granite are gradational into altered
granite, some blocks with significantly different alteration levels are juxtaposed together
along planes with the same geometry as the 1986 rupture.
Surficial sediments in the MC2 trench are 15 - 30 cm thick and include 10 - 20 cm of eolian
sand and 14 - 30 cm of poorly sorted fluvial gravel with 2 - 3 cm subangular to subrounded
gravel clasts (Machette et al., 1993). The authors describe a weakly formed soil profile
through the eolian sand and fluvial gravel and suggest that the soil profile is less developed
on the hanging-wall of the rupture. Surficial sediments in the MC3 trench are 0.7 - 1.2 m thick
and include 10 - 20 cm of eolian sand, 0.05 - 0.75 m of poorly sorted sandy colluvial and
fluvial gravel consisting of 1 - 2 cm clasts (up to 20 cm), and 0.75 - 1.25 m of poorly sorted
gravel with clasts reflecting local bedrock. The authors identify a soil profile in the gravels
that predates deposition of the eolian sands, but efforts to date the sediments using uranium
trend analysis were unsuccessful, and no suitable material was found for radiocarbon dating.
The authors instead use clay content, stratification and formation rates of calcium carbonate

251
in the soil to estimate a 52 - 130 ka oldest depositional age for the quaternary sediments
identified, with a preference for the older estimate.
A.4.4.2.2 Structural interpretations
In the MC2 trench Machette et al. (1993) interpret basement geology to show that
displacement in the 1986 earthquake was accommodated on a single fault plane that aligns
to a pre-existing ancient fault. Extensional fractures on the hanging-wall are identified within
1.25 m of the rupture related to collapse of the hanging-wall block. The authors measure 46
- 47 cm of displacement across the base of surficial sediments, with additional offset from
minor hanging-wall folding.
A similar set of structures are observed in the MC3 trench, with displacement confined to a
single 25 - 30 cm wide fault zone with the same orientation as gouge and calcium carbonate
veins found in the heavily altered greenstone basement. No cracking or jointing is identified
in this trench.
Displacements identified in the trenches match those measured at the surface, showing only
historic offset of sediments overlying a bedrock fault structure presumably related to the
Petermann orogeny (see Section 1.1 ).
A.4.4.3 Topography
McCue et al. (1987) note that the N-S rupture limb follows a linear topographic ‘mound’ for
a few kilometres and suggest this may provide geomorphic evidence for a prior relief-
generating event. However, Machette et al. (1993) consider the ridge to delineate differential
erosion across resistant bedrock as it is not a persistent feature along the rupture, and their
trench observations show no evidence of prior offset. Crone et al. (1997) suggest that the
linear topographic high combined with a greater number of low sporadic bedrock outcrops
on the hanging-wall compared to the foot-wall provide circumstantial evidence for prior
Quaternary rupture. The distribution of bedrock on the hanging-wall compared to the foot-
wall is consistent with differential erosion of bedrock affected by substantial Proterozoic
fault movement and is not considered diagnostic of Quaternary rupture.
A.4.4.4 Slip rate
The strongest evidence for prior rupture comes from distinct boundaries between some
semi-coherent basement blocks and heavily altered basement in trenches described by
Machette et al. (1993). These semi-coherent blocks may have been faulted against altered
material by prior Quaternary ruptures, though this evidence is circumstantial and may also
relate to older faulting. Overall, there is no strong evidence to show any prior Quaternary
rupture along the faults that hosted the 1986 Marryat Creek earthquake, and trenching shows
an absence of rupture since 130 ka (the preferred depositional age described in Machette et
al. (1993)).
The rupture is either the first Neotectonic event, or the recurrence interval is sufficiently
long that all relief relating to prior event(s) was eroded prior to 130 ka. If recurrence is
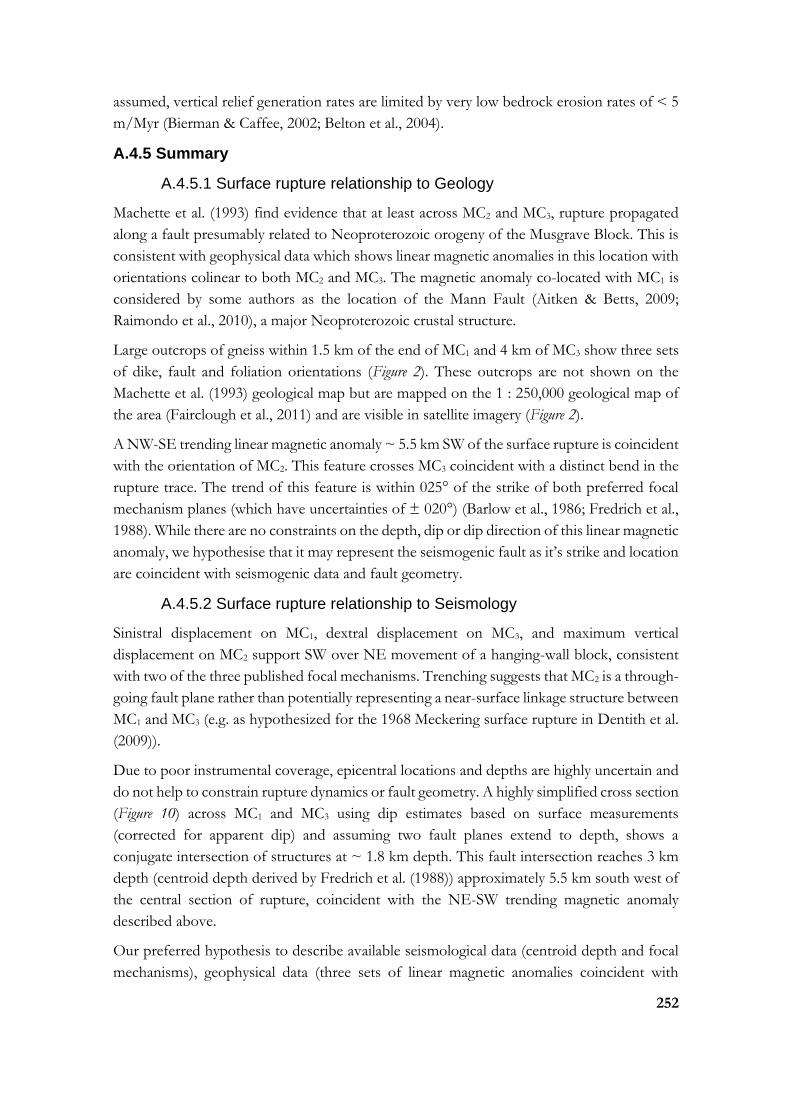
252
assumed, vertical relief generation rates are limited by very low bedrock erosion rates of < 5
m/Myr (Bierman & Caffee, 2002; Belton et al., 2004).
A.4.5 Summary
A.4.5.1 Surface rupture relationship to Geology
Machette et al. (1993) find evidence that at least across MC2 and MC3, rupture propagated
along a fault presumably related to Neoproterozoic orogeny of the Musgrave Block. This is
consistent with geophysical data which shows linear magnetic anomalies in this location with
orientations colinear to both MC2 and MC3. The magnetic anomaly co-located with MC1 is
considered by some authors as the location of the Mann Fault (Aitken & Betts, 2009;
Raimondo et al., 2010), a major Neoproterozoic crustal structure.
Large outcrops of gneiss within 1.5 km of the end of MC1 and 4 km of MC3 show three sets
of dike, fault and foliation orientations (Figure 2). These outcrops are not shown on the
Machette et al. (1993) geological map but are mapped on the 1 : 250,000 geological map of
the area (Fairclough et al., 2011) and are visible in satellite imagery (Figure 2).
A NW-SE trending linear magnetic anomaly ~ 5.5 km SW of the surface rupture is coincident
with the orientation of MC2. This feature crosses MC3 coincident with a distinct bend in the
rupture trace. The trend of this feature is within 025° of the strike of both preferred focal
mechanism planes (which have uncertainties of ± 020°) (Barlow et al., 1986; Fredrich et al.,
1988). While there are no constraints on the depth, dip or dip direction of this linear magnetic
anomaly, we hypothesise that it may represent the seismogenic fault as it’s strike and location
are coincident with seismogenic data and fault geometry.
A.4.5.2 Surface rupture relationship to Seismology
Sinistral displacement on MC1, dextral displacement on MC3, and maximum vertical
displacement on MC2 support SW over NE movement of a hanging-wall block, consistent
with two of the three published focal mechanisms. Trenching suggests that MC2 is a through-
going fault plane rather than potentially representing a near-surface linkage structure between
MC1 and MC3 (e.g. as hypothesized for the 1968 Meckering surface rupture in Dentith et al.
(2009)).
Due to poor instrumental coverage, epicentral locations and depths are highly uncertain and
do not help to constrain rupture dynamics or fault geometry. A highly simplified cross section
(Figure 10) across MC1 and MC3 using dip estimates based on surface measurements
(corrected for apparent dip) and assuming two fault planes extend to depth, shows a
conjugate intersection of structures at ~ 1.8 km depth. This fault intersection reaches 3 km
depth (centroid depth derived by Fredrich et al. (1988)) approximately 5.5 km south west of
the central section of rupture, coincident with the NE-SW trending magnetic anomaly
described above.
Our preferred hypothesis to describe available seismological data (centroid depth and focal
mechanisms), geophysical data (three sets of linear magnetic anomalies coincident with
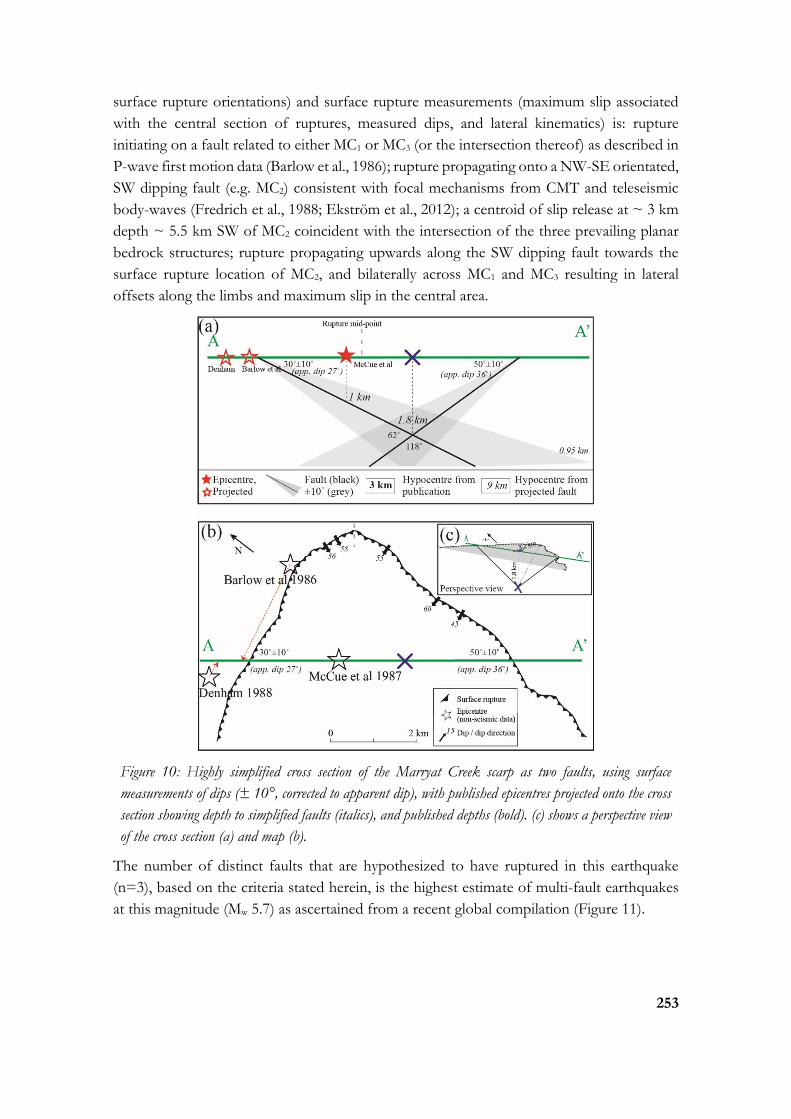
253
surface rupture orientations) and surface rupture measurements (maximum slip associated
with the central section of ruptures, measured dips, and lateral kinematics) is: rupture
initiating on a fault related to either MC1 or MC3 (or the intersection thereof) as described in
P-wave first motion data (Barlow et al., 1986); rupture propagating onto a NW-SE orientated,
SW dipping fault (e.g. MC2) consistent with focal mechanisms from CMT and teleseismic
body-waves (Fredrich et al., 1988; Ekström et al., 2012); a centroid of slip release at ~ 3 km
depth ~ 5.5 km SW of MC2 coincident with the intersection of the three prevailing planar
bedrock structures; rupture propagating upwards along the SW dipping fault towards the
surface rupture location of MC2, and bilaterally across MC1 and MC3 resulting in lateral
offsets along the limbs and maximum slip in the central area.
Figure 10: Highly simplified cross section of the Marryat Creek scarp as two faults, using surface
measurements of dips (± 10°, corrected to apparent dip), with published epicentres projected onto the cross
section showing depth to simplified faults (italics), and published depths (bold). (c) shows a perspective view
of the cross section (a) and map (b).
The number of distinct faults that are hypothesized to have ruptured in this earthquake
(n=3), based on the criteria stated herein, is the highest estimate of multi-fault earthquakes
at this magnitude (Mw 5.7) as ascertained from a recent global compilation (Figure 11).
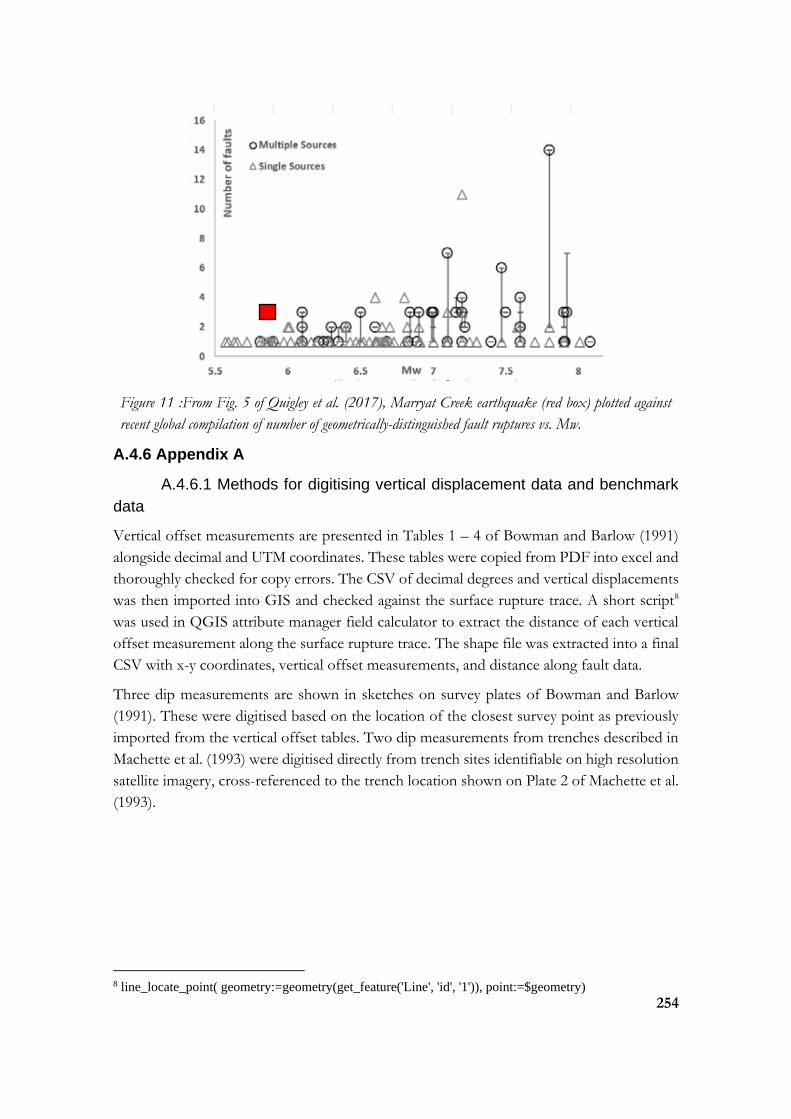
254
Figure 11 :From Fig. 5 of Quigley et al. (2017), Marryat Creek earthquake (red box) plotted against
recent global compilation of number of geometrically-distinguished fault ruptures vs. Mw.
A.4.6 Appendix A
A.4.6.1 Methods for digitising vertical displacement data and benchmark
data
Vertical offset measurements are presented in Tables 1 – 4 of Bowman and Barlow (1991)
alongside decimal and UTM coordinates. These tables were copied from PDF into excel and
thoroughly checked for copy errors. The CSV of decimal degrees and vertical displacements
was then imported into GIS and checked against the surface rupture trace. A short script8
was used in QGIS attribute manager field calculator to extract the distance of each vertical
offset measurement along the surface rupture trace. The shape file was extracted into a final
CSV with x-y coordinates, vertical offset measurements, and distance along fault data.
Three dip measurements are shown in sketches on survey plates of Bowman and Barlow
(1991). These were digitised based on the location of the closest survey point as previously
imported from the vertical offset tables. Two dip measurements from trenches described in
Machette et al. (1993) were digitised directly from trench sites identifiable on high resolution
satellite imagery, cross-referenced to the trench location shown on Plate 2 of Machette et al.
(1993).
8 line_locate_point( geometry:=geometry(get_feature('Line', 'id', '1')), point:=$geometry)
255
5. The 1987 to 2019 Tennant Creek, Australia, earthquake sequence: a protracted intraplate multi-mainshock sequence
Tamarah R. King
School of Earth Sciences, The University of Melbourne, Victoria 3010, Australia
https://orcid.org/0000-0002-9654-2917
Mark Quigley
School of Earth Sciences, The University of Melbourne, Victoria 3010, Australia
https://orcid.org/0000-0002-4430-4212
Dan Clark
Geoscience Australia, Canberra, ACT 2601, Australia
https://orcid.org/0000-0001-5387-4404
Sotiris N. Valkaniotis
Koronidos 9, 42131 Trikala, Greece
https://orcid.org/0000-0003-0003-2902
Hiwa Mohammadi
School of Earth Sciences, The University of Melbourne, Victoria 3010, Australia
William Barnhart
Department of Earth and Environmental Sciences, The University of Iowa, USA
https://orcid.org/0000-0003-0498-169
Abstract
The 1987 to 2019 Tennant Creek earthquake sequence comprises three 1988 surface-
rupturing mainshocks (moment magnitude (Mw 6.2, 6.3, and 6.5) that occurred within a 12-
hour period, a preceding foreshock sequence commencing in 1987, and a prolonged
aftershock sequence including a Mw 5.0 earthquake on the 1st August 2019. Each surface
rupturing event produced a distinct scarp; the south-dipping Kunayungku scarp, north-
dipping Lake Surprise west scarp and south-dipping Lake Surprise east scarp. Fault
geometries were confirmed by trenches across the rupture traces, levelling surveys across the
rupture traces, newly acquired satellite-derived high-resolution elevation data, and well-
located aftershocks. Focal mechanisms and modelling using available seismic data support
the hypothesis that the first mainshock ruptured the Kunayungku fault, the second
mainshock ruptured the Lake Surprise west fault (and potentially rupturing across multiple
other blind faults), and the third mainshock ruptured the Lake Surprise east fault. Trenching
across all three ruptures found no evidence of prior rupture along the Lake Surprise east and
256
Kunayungku faults. Potential evidence of prior rupture on the Lake Surprise west scarp has
been reported. However, we consider this evidence to be circumstantial and to equally
support an alternative interpretation; that the pre-1988 topography relates to a paleo-channel
along underlying bedrock topography. Surface rupture locations and orientations are strongly
aligned to underlying linear geophysical anomalies, suggesting strong control of bedrock
structure on contemporary seismicity. Almost 31 years after the initial sequence, a Mw 5.0
aftershock was recorded near the western tip of the West Lake Surprise rupture. InSAR fault
modelling suggests this occurred on a shallow blind fault (< 2 km depth to top of fault). This
structure is also aligned with linear geophysical anomalies, providing further support that
pre-existing basement structures are providing strong controls on the location and geometry
of faulting in this intraplate stable continental region.
A.5.1 Introduction
On the 22nd January 1988, three earthquakes of Mw 6.3, 6.4 and 6.6 occurred within a 12hr
period and 5 – 10 km radius of each other 30 km south-west of Tennant Creek (Figure 1), a
remote town in the Northern Territory of Australia. These were the fifth, sixth and seventh
instrumentally recorded surface rupturing events within Australia, forming the south-west
dipping Kunayungku scarp, north-west dipping Lake Surprise west scarp, and south-west
dipping Lake Surprise east scarp reported as 10.2, 6.7 and 16 km long respectively (Crone et
al., 1992). These events were preceded by six ML 4.0 - 5.0 events from 5 – 9th January 1987
(12 months prior to the mainshocks). Up to 1,100 aftershocks from this seismic sequence
were recorded in the 12 months leading up to the 22nd January 1988 mainshocks Bowman
(1997). Over 20,000 aftershocks were recorded between 1988 and 1992 (Bowman, 1992)
following the three 1988 mainshocks. The largest of these include a Mb 5.8 (Mw 5.3) event
recorded nine hours after the third mainshock, a Mb 5.5 (Mw 5.4) seven days later, and a Mb
5.2 (Mw 4.9) eight months later (Mw values from (Allen, Leonard, et al., 2018)). Since 1990,
there have been four Mw > 5.0 aftershocks, in 1990, 1991, 1994 and 1999 (from the NSHA18
catalogue (Allen, Leonard, et al., 2018)).
On the 1st August 2019, a Mw 5.0 (Mb 5.4 USGS, ML 5.3 GA) aftershock occurred, the largest
since 1999, with five ML 2.5 – 3.6 events in the 20 days following the event (up to 20th August
2019, Geoscience Australia online catalogue). InSAR data shows this earthquake ruptured a
shallow NW-SE trending fault west of the 1988 Lake Surprise west scarp, and south of the
1988 Kunayungku scarp, but did not produce a surface rupture.
In this contribution we review available geological, seismological, surface observations and
paleoseismology for the 1988 mainshocks, and provide InSAR derived fault models and
preliminary Coulomb stress modelling to describe the 2019 aftershock. The sequence
provides a prime example of a ‘multiple mainshock’ type of intraplate earthquake (Choy &
Bowman, 1990), and a prolonged (multi-decade) aftershock sequence as observed in other
intraplate stable continental regions (e.g. New Madrid, USA) (Stein & Liu, 2009).
A.5.2 Geology
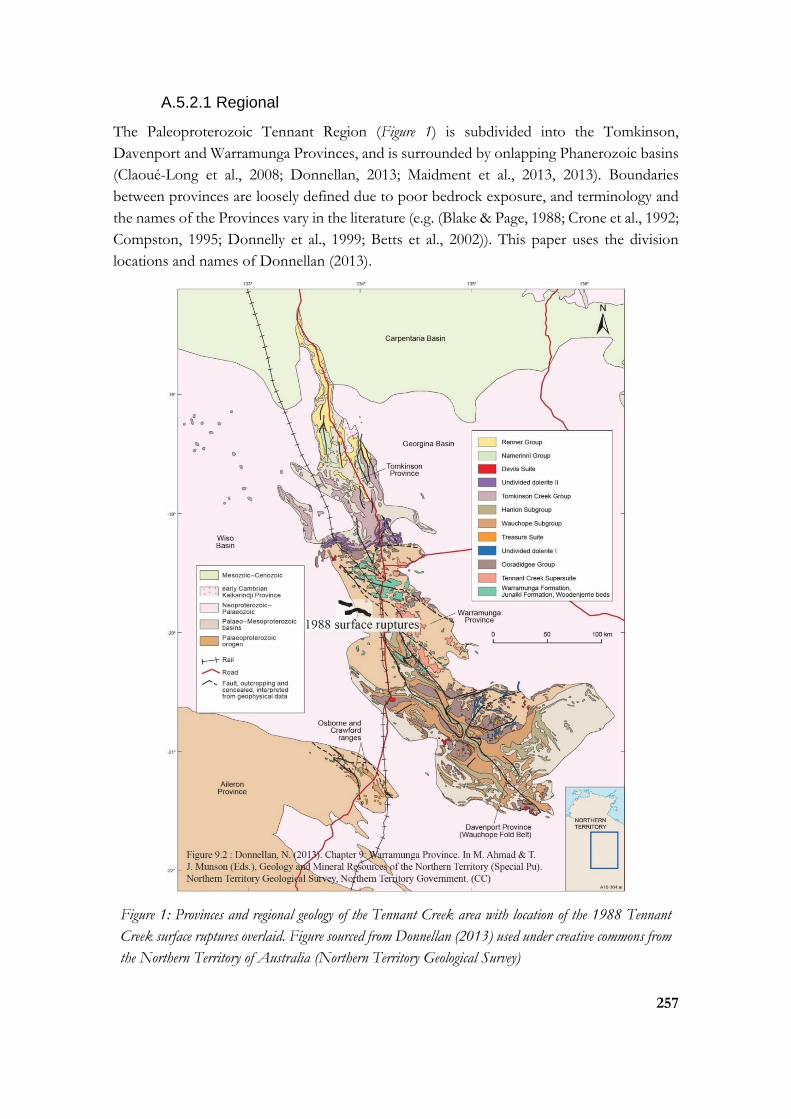
257
A.5.2.1 Regional
The Paleoproterozoic Tennant Region (Figure 1) is subdivided into the Tomkinson,
Davenport and Warramunga Provinces, and is surrounded by onlapping Phanerozoic basins
(Claoué-Long et al., 2008; Donnellan, 2013; Maidment et al., 2013, 2013). Boundaries
between provinces are loosely defined due to poor bedrock exposure, and terminology and
the names of the Provinces vary in the literature (e.g. (Blake & Page, 1988; Crone et al., 1992;
Compston, 1995; Donnelly et al., 1999; Betts et al., 2002)). This paper uses the division
locations and names of Donnellan (2013).
Figure 1: Provinces and regional geology of the Tennant Creek area with location of the 1988 Tennant
Creek surface ruptures overlaid. Figure sourced from Donnellan (2013) used under creative commons from
the Northern Territory of Australia (Northern Territory Geological Survey)
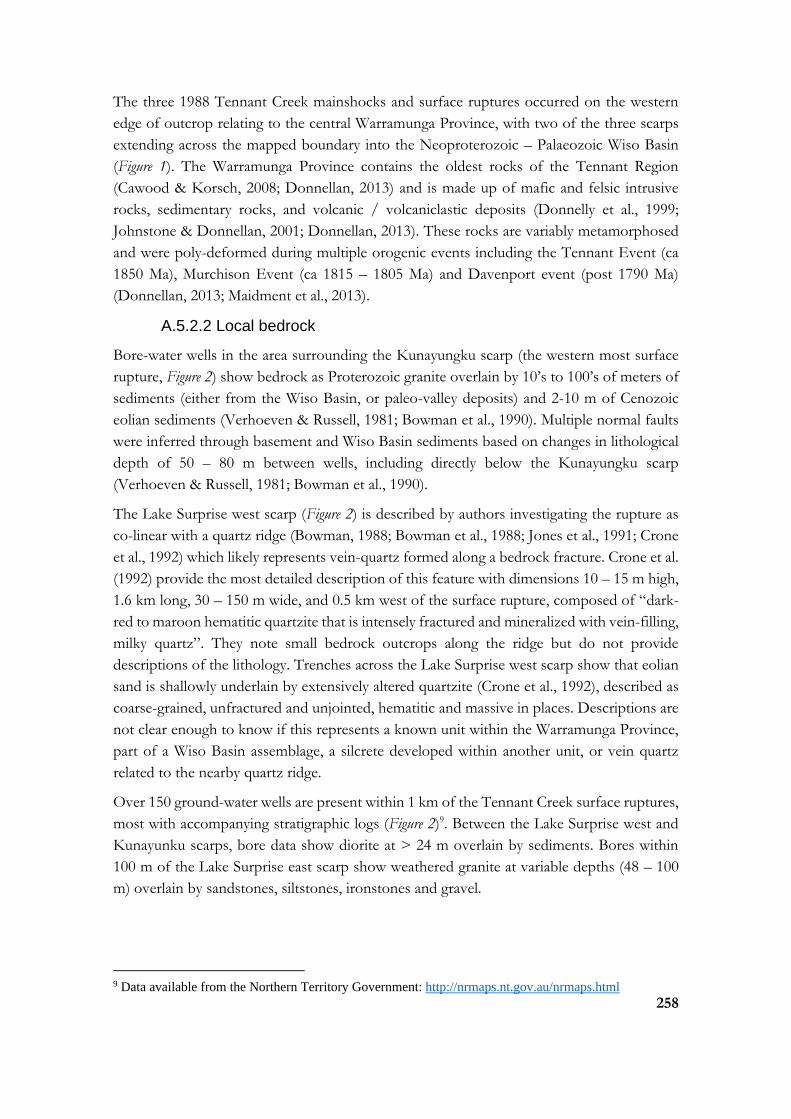
258
The three 1988 Tennant Creek mainshocks and surface ruptures occurred on the western
edge of outcrop relating to the central Warramunga Province, with two of the three scarps
extending across the mapped boundary into the Neoproterozoic – Palaeozoic Wiso Basin
(Figure 1). The Warramunga Province contains the oldest rocks of the Tennant Region
(Cawood & Korsch, 2008; Donnellan, 2013) and is made up of mafic and felsic intrusive
rocks, sedimentary rocks, and volcanic / volcaniclastic deposits (Donnelly et al., 1999;
Johnstone & Donnellan, 2001; Donnellan, 2013). These rocks are variably metamorphosed
and were poly-deformed during multiple orogenic events including the Tennant Event (ca
1850 Ma), Murchison Event (ca 1815 – 1805 Ma) and Davenport event (post 1790 Ma)
(Donnellan, 2013; Maidment et al., 2013).
A.5.2.2 Local bedrock
Bore-water wells in the area surrounding the Kunayungku scarp (the western most surface
rupture, Figure 2) show bedrock as Proterozoic granite overlain by 10’s to 100’s of meters of
sediments (either from the Wiso Basin, or paleo-valley deposits) and 2-10 m of Cenozoic
eolian sediments (Verhoeven & Russell, 1981; Bowman et al., 1990). Multiple normal faults
were inferred through basement and Wiso Basin sediments based on changes in lithological
depth of 50 – 80 m between wells, including directly below the Kunayungku scarp
(Verhoeven & Russell, 1981; Bowman et al., 1990).
The Lake Surprise west scarp (Figure 2) is described by authors investigating the rupture as
co-linear with a quartz ridge (Bowman, 1988; Bowman et al., 1988; Jones et al., 1991; Crone
et al., 1992) which likely represents vein-quartz formed along a bedrock fracture. Crone et al.
(1992) provide the most detailed description of this feature with dimensions 10 – 15 m high,
1.6 km long, 30 – 150 m wide, and 0.5 km west of the surface rupture, composed of “dark-
red to maroon hematitic quartzite that is intensely fractured and mineralized with vein-filling,
milky quartz”. They note small bedrock outcrops along the ridge but do not provide
descriptions of the lithology. Trenches across the Lake Surprise west scarp show that eolian
sand is shallowly underlain by extensively altered quartzite (Crone et al., 1992), described as
coarse-grained, unfractured and unjointed, hematitic and massive in places. Descriptions are
not clear enough to know if this represents a known unit within the Warramunga Province,
part of a Wiso Basin assemblage, a silcrete developed within another unit, or vein quartz
related to the nearby quartz ridge.
Over 150 ground-water wells are present within 1 km of the Tennant Creek surface ruptures,
most with accompanying stratigraphic logs (Figure 2)9. Between the Lake Surprise west and
Kunayunku scarps, bore data show diorite at > 24 m overlain by sediments. Bores within
100 m of the Lake Surprise east scarp show weathered granite at variable depths (48 – 100
m) overlain by sandstones, siltstones, ironstones and gravel.
9 Data available from the Northern Territory Government: http://nrmaps.nt.gov.au/nrmaps.html

259
Figure 2. Crop of 1 : 250 000 Tennant Creek interpreted basement geology map (Johnstone & Donnellan,
2001) with Tennant Creek scarps, trench sites of Crone et al. (2003) and bore-hole locations (NT Gov). Original
map and legend (Johnstone & Donnellan, 2001) used under creative commons from the Northern Territory
of Australia (Northern Territory Geological Survey)
Bedrock distribution interpreted from geophysical data and mapped geology (Johnstone &
Donnellan, 2001) (Figure 2) shows undifferentiated granite underlying Wiso Basin sediments
beneath the Kunayungku scarp. Basement underlying the Lake Surprise scarp is interpreted
to consist of volcanoclastic and sedimentary units in faulted contact with each other and
intruded by granites of the Tennant Creek Supersuite and Devils Suite. A large through-going
basement structure is mapped ~200 – 500 m north of the Kunayungku and Lake Surprise
east scarps (Figure 2), visible as both a gravity and magnetic anomaly (Figure 3). The geometry
of these faults and lithological / intrusive boundaries is unknown, but presumably could be
better constrained by analysis of available bore-hole lithological logs.
A gravity high occurs between the Kunayungku and Lake Surprise west scarps (Figure 3), with
a NW-SE trending boundary coincident with the Kunayungku surface rupture trend and
location (Bowman et al., 1990; Johnstone & Donnellan, 2001). This was originally modelled
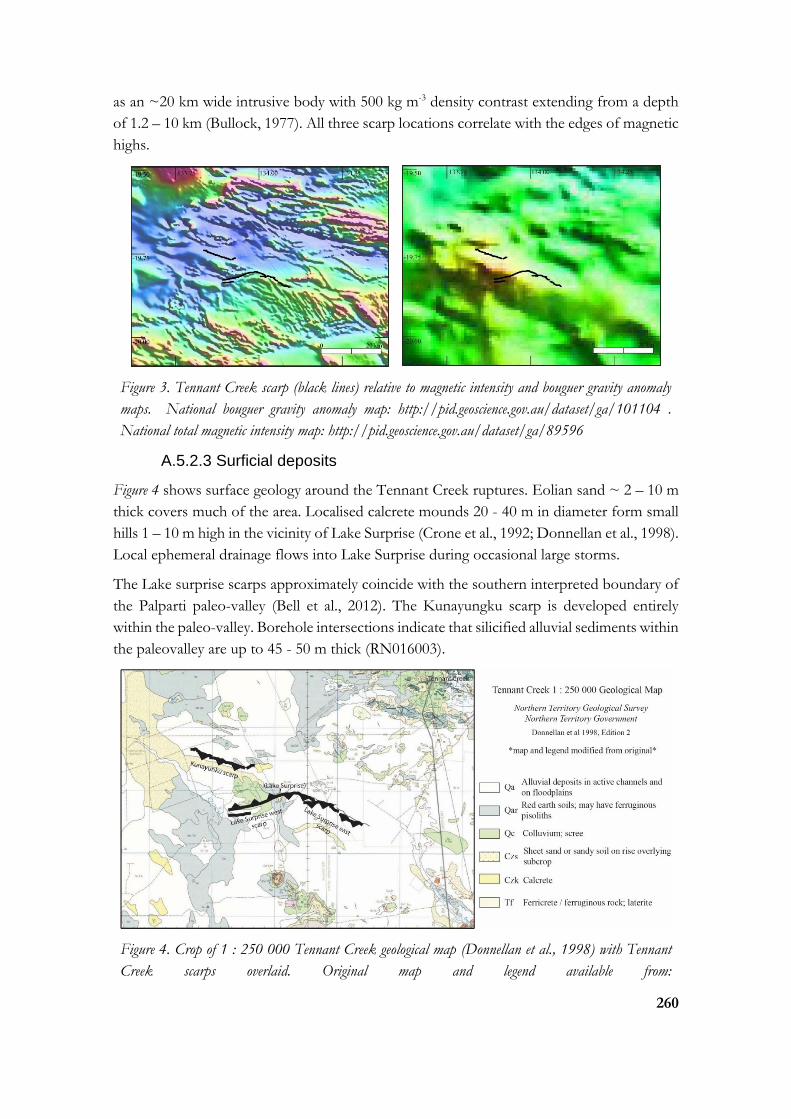
260
as an ~20 km wide intrusive body with 500 kg m-3 density contrast extending from a depth
of 1.2 – 10 km (Bullock, 1977). All three scarp locations correlate with the edges of magnetic
highs.
Figure 3. Tennant Creek scarp (black lines) relative to magnetic intensity and bouguer gravity anomaly
maps. National bouguer gravity anomaly map: http://pid.geoscience.gov.au/dataset/ga/101104 .
National total magnetic intensity map: http://pid.geoscience.gov.au/dataset/ga/89596
A.5.2.3 Surficial deposits
Figure 4 shows surface geology around the Tennant Creek ruptures. Eolian sand ~ 2 – 10 m
thick covers much of the area. Localised calcrete mounds 20 - 40 m in diameter form small
hills 1 – 10 m high in the vicinity of Lake Surprise (Crone et al., 1992; Donnellan et al., 1998).
Local ephemeral drainage flows into Lake Surprise during occasional large storms.
The Lake surprise scarps approximately coincide with the southern interpreted boundary of
the Palparti paleo-valley (Bell et al., 2012). The Kunayungku scarp is developed entirely
within the paleo-valley. Borehole intersections indicate that silicified alluvial sediments within
the paleovalley are up to 45 - 50 m thick (RN016003).
Figure 4. Crop of 1 : 250 000 Tennant Creek geological map (Donnellan et al., 1998) with Tennant
Creek scarps overlaid. Original map and legend available from:
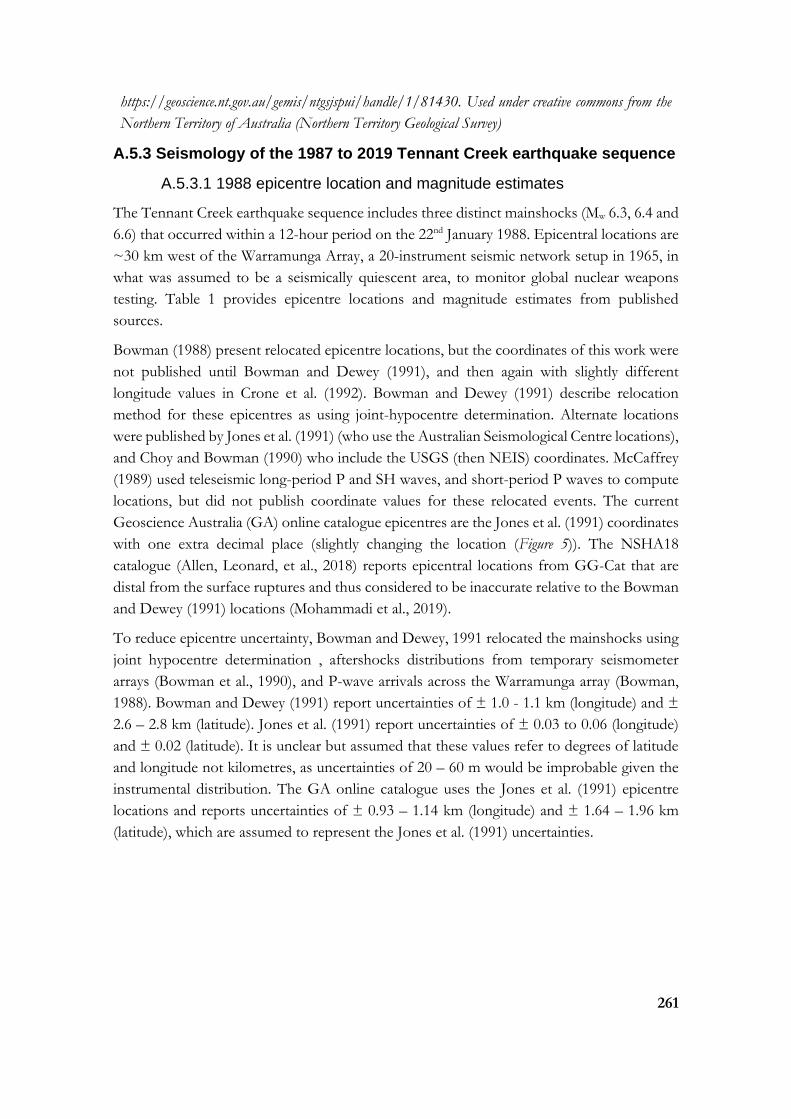
261
https://geoscience.nt.gov.au/gemis/ntgsjspui/handle/1/81430. Used under creative commons from the
Northern Territory of Australia (Northern Territory Geological Survey)
A.5.3 Seismology of the 1987 to 2019 Tennant Creek earthquake sequence
A.5.3.1 1988 epicentre location and magnitude estimates
The Tennant Creek earthquake sequence includes three distinct mainshocks (Mw 6.3, 6.4 and
6.6) that occurred within a 12-hour period on the 22nd January 1988. Epicentral locations are
~30 km west of the Warramunga Array, a 20-instrument seismic network setup in 1965, in
what was assumed to be a seismically quiescent area, to monitor global nuclear weapons
testing. Table 1 provides epicentre locations and magnitude estimates from published
sources.
Bowman (1988) present relocated epicentre locations, but the coordinates of this work were
not published until Bowman and Dewey (1991), and then again with slightly different
longitude values in Crone et al. (1992). Bowman and Dewey (1991) describe relocation
method for these epicentres as using joint-hypocentre determination. Alternate locations
were published by Jones et al. (1991) (who use the Australian Seismological Centre locations),
and Choy and Bowman (1990) who include the USGS (then NEIS) coordinates. McCaffrey
(1989) used teleseismic long-period P and SH waves, and short-period P waves to compute
locations, but did not publish coordinate values for these relocated events. The current
Geoscience Australia (GA) online catalogue epicentres are the Jones et al. (1991) coordinates
with one extra decimal place (slightly changing the location (Figure 5)). The NSHA18
catalogue (Allen, Leonard, et al., 2018) reports epicentral locations from GG-Cat that are
distal from the surface ruptures and thus considered to be inaccurate relative to the Bowman
and Dewey (1991) locations (Mohammadi et al., 2019).
To reduce epicentre uncertainty, Bowman and Dewey, 1991 relocated the mainshocks using
joint hypocentre determination , aftershocks distributions from temporary seismometer
arrays (Bowman et al., 1990), and P-wave arrivals across the Warramunga array (Bowman,
1988). Bowman and Dewey (1991) report uncertainties of ± 1.0 - 1.1 km (longitude) and ±
2.6 – 2.8 km (latitude). Jones et al. (1991) report uncertainties of ± 0.03 to 0.06 (longitude)
and ± 0.02 (latitude). It is unclear but assumed that these values refer to degrees of latitude
and longitude not kilometres, as uncertainties of 20 – 60 m would be improbable given the
instrumental distribution. The GA online catalogue uses the Jones et al. (1991) epicentre
locations and reports uncertainties of ± 0.93 – 1.14 km (longitude) and ± 1.64 – 1.96 km
(latitude), which are assumed to represent the Jones et al. (1991) uncertainties.
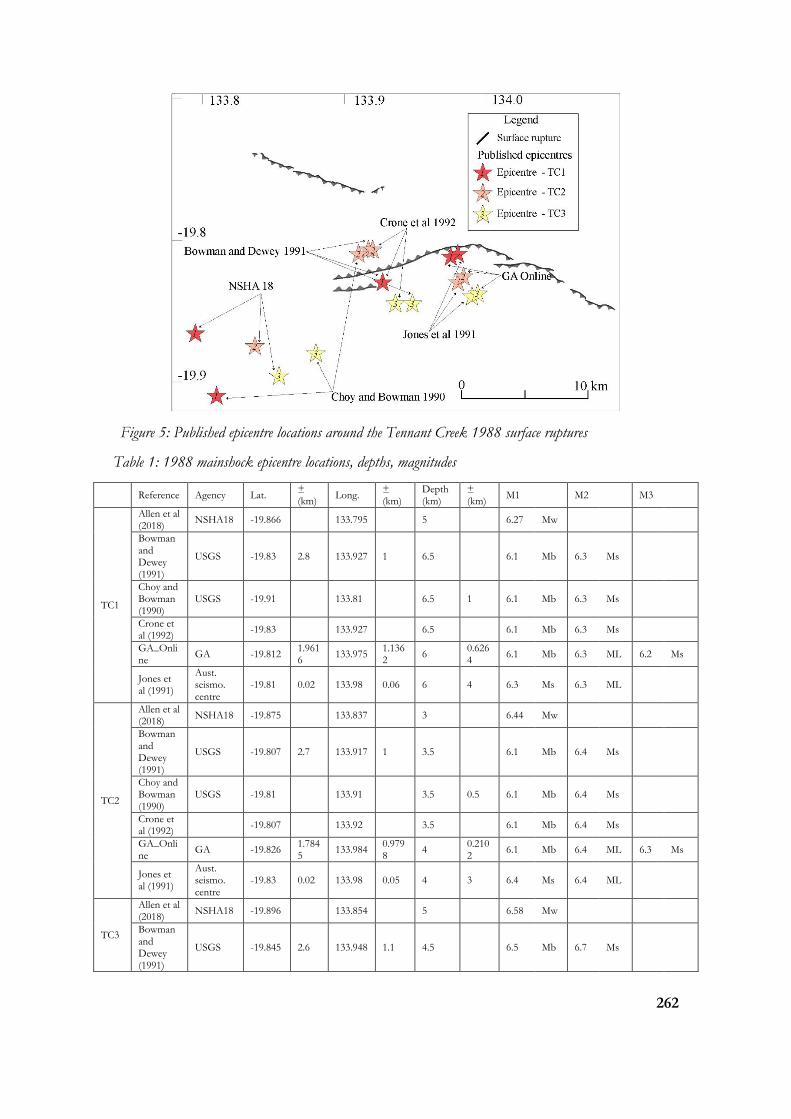
262
Figure 5: Published epicentre locations around the Tennant Creek 1988 surface ruptures
Table 1: 1988 mainshock epicentre locations, depths, magnitudes
Reference Agency Lat. ± (km)
Long. ± (km)
Depth (km)
± (km)
M1 M2 M3
TC1
Allen et al (2018)
NSHA18 -19.866 133.795 5 6.27 Mw
Bowman and Dewey (1991)
USGS -19.83 2.8 133.927 1 6.5 6.1 Mb 6.3 Ms
Choy and Bowman (1990)
USGS -19.91 133.81 6.5 1 6.1 Mb 6.3 Ms
Crone et al (1992)
-19.83 133.927 6.5 6.1 Mb 6.3 Ms
GA_Online
GA -19.812 1.9616
133.975 1.1362
6 0.6264
6.1 Mb 6.3 ML 6.2 Ms
Jones et al (1991)
Aust. seismo. centre
-19.81 0.02 133.98 0.06 6 4 6.3 Ms 6.3 ML
TC2
Allen et al (2018)
NSHA18 -19.875 133.837 3 6.44 Mw
Bowman and Dewey (1991)
USGS -19.807 2.7 133.917 1 3.5 6.1 Mb 6.4 Ms
Choy and Bowman (1990)
USGS -19.81 133.91 3.5 0.5 6.1 Mb 6.4 Ms
Crone et al (1992)
-19.807 133.92 3.5 6.1 Mb 6.4 Ms
GA_Online
GA -19.826 1.7845
133.984 0.9798
4 0.2102
6.1 Mb 6.4 ML 6.3 Ms
Jones et al (1991)
Aust. seismo. centre
-19.83 0.02 133.98 0.05 4 3 6.4 Ms 6.4 ML
TC3
Allen et al (2018)
NSHA18 -19.896 133.854 5 6.58 Mw
Bowman and Dewey (1991)
USGS -19.845 2.6 133.948 1.1 4.5 6.5 Mb 6.7 Ms

263
Choy and Bowman (1990)
USGS -19.88 133.88 4.5 0.5 6.5 Mb 6.3 Ms
Crone et al (1992)
-19.845 133.936 4.5 6.5 Mb 6.7 Ms
GA_Online
GA -19.838 1.6378
133.994 0.9271
5 0.1816
6.5 Mb 6.7 ML 6.5 Ms
Jones et al (1991)
Aust. seismo. centre
-19.84 0.02 133.99 0.03 5 3 6.7 Ms 6.7 ML
Bowman and Dewey (1991) (and subsequent authors) show TC1 between TC2 (to the west)
and TC3 (to the east) (Figure 5). Bowman (1992) notes that the first two mainshocks have
overlapping uncertainty bounds and this order is constrained by P-wave arrivals at the
Warramunga array (Bowman, 1988). Other authors (Jones et al., 1991) show the epicentres
occurring sequentially from west to east (Figure 5).
A gas pipeline offset by the Lake Surprise east scarp was found to be undamaged when
inspected by a worker following the first mainshock (TC1). Some uncertainty exists as to
when this inspection took place relative to the three events. Bowman (1988) describe the
observation between the TC1 and TC3, while Jones et al. (1991) state that it was between
TC1 and TC2. Some authors use this observation to directly relate the TC3 event to the Lake
Surprise east scarp (Choy & Bowman, 1990) however based on varying descriptions, this
observation only rules out the TC1 event.
McCaffrey (1989) discusses alternate scenarios where individual mainshocks may have
ruptured multiple faults at once, with later mainshocks potentially re-rupturing faults. Or
where the Lake Surprise west scarp is related to post-seismic failure of the hanging-wall,
which seems unlikely given geodetic and seismic modelling published following this paper
(Choy & Bowman, 1990; Bowman, 1991). Field observations (Bowman, 1991; Bowman &
Jones, 1991; Machette et al., 1991; Crone et al., 1992), aftershocks (Bowman et al., 1990) and
seismic modelling (Choy & Bowman, 1990) are interpreted to show that the Lake Surprise
west scarp corresponds to a north-dipping fault, while the Kunayungku and Lake Surprise
east scarps correspond to south-dipping faults.
Mohammadi et al. (2019) use Coulomb stress change modelling to assess the validity of
published hypocentre locations and fault models from Choy and Bowman (1990), McCaffrey
(1989), Leonard et al. (2002) (which uses the Jones et al. (1991) solutions), and Bowman
(1991). Fault geometries are defined either from the source publication, or derived from the
intraplate Mw to fault area scaling relationships of Leonard (2014). The authors find that
within the uncertainties of hypocentral location, all faults in all models have regions of
positive coulomb stress changes from the previous rupture (using rupture sequences from
the original publications). They prefer the data integrated fault model of Bowman (1991),
with slightly modified fault parameters (within error of the original parameters) as the
hypocentres from Choy and Bowman (1990) do not intersect with modelled faults from
Bowman (1991).
A.5.3.2 1988 mainshock focal mechanisms
264
Focal mechanisms for the three 1988 mainshocks were published by McCaffrey (1989), Jones
et al. (1991), Choy and Bowman (1990), and the Global Centroid Moment Tensor catalog
(GCMT) (Ekström et al., 2012) (Figure 6). McCaffrey (1989) uses least-squares inversion on
short-period P-wave and long-period P- and SH-waves to derive source parameters and focal
mechanism. Jones et al. (1991) derive preliminary focal mechanisms from long-period P-
wave arrivals, while Choy and Bowman (1990) use broadband body waves rather than long-
period data to derive their mechanisms. A summary of mainshock focal mechanisms is
presented in Fig. 12 of Bowman (1992).
Focal mechanisms were also derived by GCMT for a 5.4 ML earthquake in January 1987 that
preceded the mainshock sequence by a year (Ekström et al., 2012), and for the largest
aftershock on the 22nd Jan 1988 by Choy and Bowman (1990) and Jones et al. (1991).
Leonard et al. (2002) collates mechanisms for fore-, main- and aftershocks from Jones et al.
(1991) and GCMT, but not Choy and Bowman (1990) or McCaffrey (1989). Mohammadi et
al. (2019) use focal mechanisms from the 1987 foreshock and original publications
(McCaffrey, 1989; Choy & Bowman, 1990; Jones et al., 1991) in their Coulomb stress change
models.
Focal mechanisms for TC1 are predominately thrust mechanisms with WNW-ESE striking
planes in all publications. Surface rupture, aftershock depths and waveform data are
interpreted to suggest this event ruptured the Kunayungku scarp, on a south-dipping plane
(Choy & Bowman, 1990; Bowman, 1992). The south-dipping plane is consistently steeper
on all solutions at 50-55°.
Focal mechanisms for TC2 are the most variable across different publications. Bowman
(1992) suggests this may be because rupture involved complex faulting on conjugate or non-
planar fault surfaces. McCaffrey (1989) interprets TC2 to have ruptured either / both of the
Kunayungku and Lake Surprise west scarps, while Jones et al. (1991) suggest TC2 is
responsible only for the Lake Surprise west scarp on a north-dipping plane. Surface
observations and seismological data are interpreted by Choy and Bowman (1990) to suggest
that TC2 ruptured the Lake Surprise west scarp on a north-dipping plane.
The McCaffrey (1989) and CMT solutions for TC2 provide a pure thrust mechanism with a
WNW-ESE trend, with north planes dipping at 61° and 52° respectively. The Jones et al.
(1991) solution shows dominantly strike-slip movement, with dextral movement on the
north-dipping plane which trends NW. Choy and Bowman (1990) preferred an interpretation
that TC2 was associated with three sub-events of moment release along faults with variable
geometries. The first two events of this model do not reach the surface and have mechanisms
similar to the McCaffrey (1989) solution. The third sub-event is identified as the north-
dipping fault responsible for the Lake Surprise west scarp. The second sub-event in this
series is considered the dominant solution, with highest seismic moment release on a thrust
with a relatively large strike slip component. The third minor solution is largely thrust with a
NE-SW trend and minor dextral movement on the north-dipping plane (fig. 4 of Choy and
Bowman (1990) shows mechanisms for these two subevents) (Bowman et al., 1990; Choy &

265
Bowman, 1990; Bowman, 1991). Mohammadi et al. (2019) split TC2 into the two potential
sub-event geometries from the Choy and Bowman (1990) solution for their Coulomb stress
change modelling, and find that both models for TC2 are consistent with positive Coulomb
stress changes from the preceding events.
Figure 6: Published focal mechanism and simplified scarp maps. Red lines show the preferred plane of
rupture based on the work of (Choy & Bowman, 1990)
266
Focal mechanisms for TC3 are the most consistent across publications, showing an almost
pure reverse mechanism on a WNW - ESE trending plane. Scientific consensus is that this
event ruptured the Lake Surprise east scarp on a south-dipping fault (McCaffrey, 1989; Choy
& Bowman, 1990; Jones et al., 1991; Bowman, 1992)(Bowman, 1988). North-dipping planes
range from dips of 36-45°.
A.5.3.3 Depth estimates of 1988 mainshocks
Hypocentral depths are estimated from a variety of sources including primary seismological
data, aftershock distributions and focal mechanisms. Jones et al. (1991) report depths from
the USGS of 6 ± 4 km, 4 ± 3 km and 4 ± 3 km for TC1, TC2 and TC3 respectively. These
depths are included in the current online Geoscience Australia catalogue, though the current
USGS online catalogue reports 5 km depths for all events (both accessed 23/07/2019).
Choy and Bowman (1990) prefer a hypocentral depth of 6.5 ± 1.0 km for TC1, 3 ± 0.5 km
for TC2, and 4.5 ± 0.5 km for TC3 based on analysis of teleseismic broadband P-wave
inversions. Depth estimates of Choy and Bowman (1990) are within error of planes
delineated by well-constrained aftershock depths (Bowman et al., 1990). These place TC1 at
6 - 8 km depth on a south-dipping plane, TC2 at 2 - 4 km depth on a north-dipping plane,
and TC3 at 3 - 5 km depth on a south-dipping plane (e.g. Figure 9 in Bowman et al. (1990)).
McCaffrey (1989) find centroid best-fit depths of 2.7 ± 2.6 km, 3.0 ± 1.3 km and 4.2 ± 1.9
km for TC1, TC2 and TC3 respectively based on teleseismic waveform inversion, with all
centroids constrained to < 6 km. Attempts to model centroids down to 9 km depth based
on aftershock zones (Bowman, 1988) resulted in a poorer fit.
A.5.3.4 Bi/Uni lateral rupture
McCaffrey (1989) propose that short period P-wave data show north-west unilateral
propagating rupture for TC1. They suggest that this supports TC1 rupture of the south-
dipping Kunayungku fault. They describe the TC2 source-time function (related to seismic
moment) as small for the first 3 sec and doubling in the next 3 sec, relating to a sudden
doubling of either fault slip or fault area. This is interpreted to show bilateral rupture initiating
between the Kunayungku and Lake Surprise west scarps, with a sudden increase in slip after
initiation allowing for rupture to the surface along one or both of those scarps. McCaffrey
(1989) do not comment on TC3 rupture propagation.
Jones et al. (1991) support unilateral NW rupture propagation for TC1. They suggest that
TC2 initiated at the midpoint of the Lake Surprise scarps and ruptured bilaterally onto both
limbs of the Lake Surprise fault, on faults with opposing geometries. Finally, they suggest
TC3 initiated on a SW dipping fault to cause the Lake Surprise east scarp, and based on the
magnitude, may have re-ruptured the entire fault trace (including Kunayungku and Lake
Surprise west) implying bilateral rupture propagation. It is unclear what methods were used
to derive these rupture propagation directions.
267
Choy and Bowman (1990) use first motion P-wave complexity to infer rupture complexity
and direction for all three mainshocks. They suggest that TC1 initiated at a depth of 6.5 km
at the location of previous foreshock seismicity and propagated towards the NW to rupture
the surface at the Kunayungku scarp. Waveforms for TC2 was complex and had no
observable directivity to rupture propagation, it is inferred to have initiated in the same
vicinity as TC1 and ruptured in a conjugate sense to the Kunayungku fault, forming the
Western Lake Surprise scarp. The final event, TC3, is interpreted to have initiated at 4.5 km
depth east of the other events, and propagated in a SE direction to rupture the surface along
the Eastern Lake Surprise scarp. Choy and Bowman (1990) present the most comprehensive
analysis of seismological and surface observations to derive their preferred rupture
propagation directions.
A.5.3.5 Foreshocks to the 1988 mainshocks
Bowman (1997) presents data to suggest seismicity was anomalously high in the year
preceding the mainshocks. This includes six ML 4.0 - 5.0 events 12 months prior, and 1100
small events. The nearby Warramunga Array had been operational since 1965, with no
seismic activity recorded in the vicinity of the surface ruptures prior to 1981 (from personal
communications with site seismologists (Bowman & Yong, 1997)). Based on seismicity rates
from 1981 - 1986 compared to 1986 - 1988, Bowman (1997) argues that Tennant Creek
experienced precursor seismicity in the immediate vicinity of the 1988 mainshocks. A lack
of national instrumentation prior to 1980 may have affected catalogue completeness for
events ML <2.0 (Leonard, 2008), but the location of the Warramunga Array proximal to this
region suggests minimal seismicity prior to 1986.
Following four earthquakes of ML 4.9 - 5.4 from 5 - 9th January 1987 (12 months prior to
the mainshocks), three temporary seismometers were installed in the area for two months,
with 116 events recorded, and 50 located with high accuracy (Bouniot et al., 1990). Based on
the temporal decay of total seismic moment release and number of earthquakes, the authors
conclude precursor seismicity gave no indication of the three mainshocks to come. The 1987
seismicity is noted to lie in the ‘gap’ between the Lake Surprise west and Kunayungku
ruptures (Bouniot et al., 1990) which some authors consider coincident with the location of
TC1 (Jones et al., 1991). Bowman and Dewey (1991) relocate as many 1987 events as possible
using joint hypocentre determination, and consider the focal depths not sufficiently precise
to constrain if they occurred on the fault that eventually ruptured in TC1. A single foreshock
of MD 3.6 is reported by some authors 6 minutes prior to the first mainshock (Bowman,
1988, 1992; Bowman & Dewey, 1991).
Mohammadi et al. (2019) use Coulomb stress change modelling to test whether the largest
1987 foreshock (Mb 5.2 magnitude from Bowman and Dewey (1991)) produced stress
changes that contributed to the rupture of the TC1 fault (as modelled in a variety of original
sources (McCaffrey, 1989; Choy & Bowman, 1990; Bowman, 1991; Jones et al., 1991)). They
suggest that dynamic stress changes from the foreshock are unlikely to have imparted the
primary control on the TC1 event given the time lag between these events, but that static

268
stress changes are consistent with advancement of TC1 towards failure. They note that their
modelling does not account for potential post-seismic stress changes (visco-elastic, afterslip
or poroelastic rebound) between the foreshock and TC1. While this supports the assertion
of Bowman (1997) that precursor seismicity was causally related to the eventual 1988 events,
it does not provide a potential forecast mechanism for future seismicity given the faults that
failed in 1988 were unknown prior to rupture.
A.5.3.6 Aftershocks following the 1988 mainshocks
Over 20,000 aftershocks were recorded from 1988 - 1992 (Bowman, 1992). The largest of
these include a Mb 5.8 aftershock recorded nine hours after the third mainshock, a Mb 5.5
seven days later, and a Mb 5.2 eight months later. A temporary seismometer array was
installed two days after the mainshock and operated for sixteen months until May 1988
(details in Table 1 of Bowman et al. (1990)). Aftershocks locations in the year following the
mainshocks concentrate south of the Kunayungku and Lake Surprise east scarps, and north
of the Lake Surprise west scarp. These are used as supportive evidence, along with a variety
of geological and seismological data, to suggest the three mainshocks ruptured three
conjugate faults (Bowman, 1991). Estimates for uncertainties on these locations range from
1.3 - 2.7 km. Bouniot et al. (1990) consider their 1987 seismicity to have uncertainties < ± 2
km. Bowman and Dewey (1991) present all relocated foreshock, mainshock and aftershock
epicentres with < ± 8 km uncertainty, with some having uncertainties down to ± 1 km.
The recently published NSHA18 catalogue (Allen, Leonard, et al., 2018) (which includes
revised Mw values for all events) shows four Mw > 5.0 aftershocks between 1990 and 2017
(the catalogue cut-off year) within a 50 km radius of the 1988 mainshocks (Figure 7). It also
includes 28 Mw 3.0 – 4.0 aftershocks within a 100 km radius, with the most recent in 2011.
Figure 7: Count of aftershocks per year per magnitude range from the NSHA 18 catalogue (Allen,
Leonard, et al., 2018), 1990 to 2017 (the catalogue cut-off year)
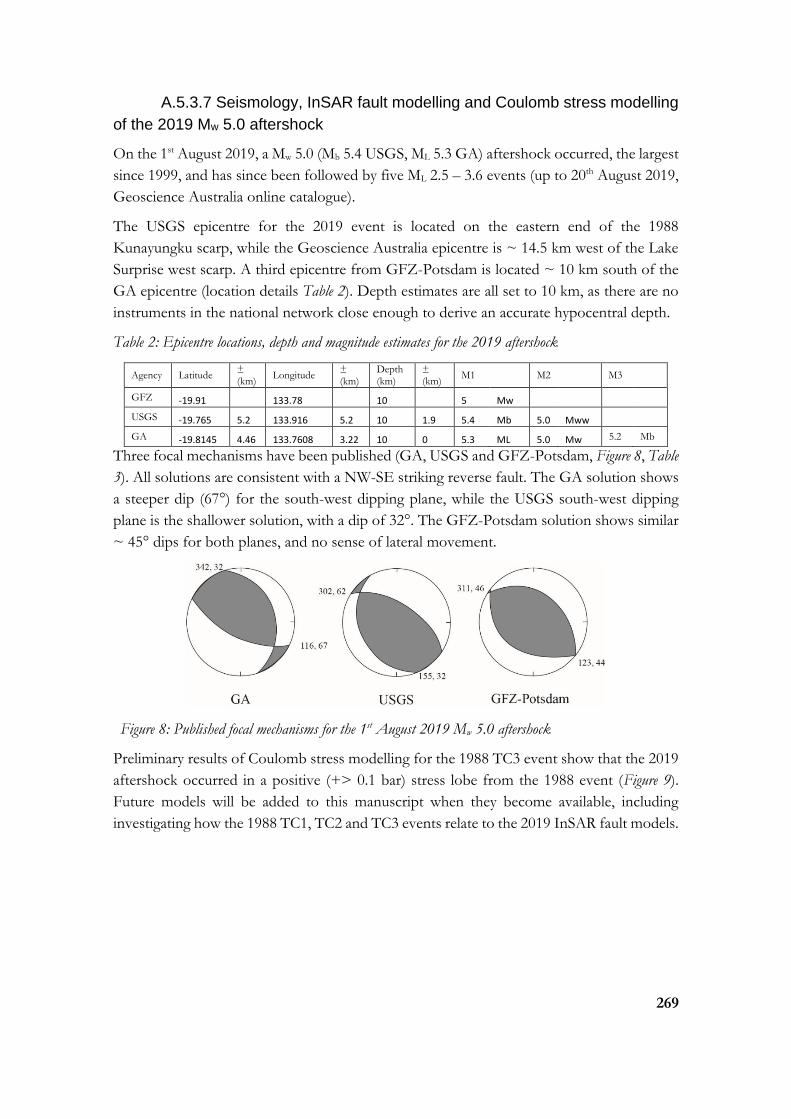
269
A.5.3.7 Seismology, InSAR fault modelling and Coulomb stress modelling
of the 2019 Mw 5.0 aftershock
On the 1st August 2019, a Mw 5.0 (Mb 5.4 USGS, ML 5.3 GA) aftershock occurred, the largest
since 1999, and has since been followed by five ML 2.5 – 3.6 events (up to 20th August 2019,
Geoscience Australia online catalogue).
The USGS epicentre for the 2019 event is located on the eastern end of the 1988
Kunayungku scarp, while the Geoscience Australia epicentre is ~ 14.5 km west of the Lake
Surprise west scarp. A third epicentre from GFZ-Potsdam is located ~ 10 km south of the
GA epicentre (location details Table 2). Depth estimates are all set to 10 km, as there are no
instruments in the national network close enough to derive an accurate hypocentral depth.
Table 2: Epicentre locations, depth and magnitude estimates for the 2019 aftershock
Agency Latitude ± (km)
Longitude ± (km)
Depth (km)
± (km)
M1 M2 M3
GFZ -19.91 133.78 10 5 Mw
USGS -19.765 5.2 133.916 5.2 10 1.9 5.4 Mb 5.0 Mww
GA -19.8145 4.46 133.7608 3.22 10 0 5.3 ML 5.0 Mw 5.2 Mb
Three focal mechanisms have been published (GA, USGS and GFZ-Potsdam, Figure 8, Table
3). All solutions are consistent with a NW-SE striking reverse fault. The GA solution shows
a steeper dip (67°) for the south-west dipping plane, while the USGS south-west dipping
plane is the shallower solution, with a dip of 32°. The GFZ-Potsdam solution shows similar
~ 45° dips for both planes, and no sense of lateral movement.
Figure 8: Published focal mechanisms for the 1st August 2019 Mw 5.0 aftershock
Preliminary results of Coulomb stress modelling for the 1988 TC3 event show that the 2019
aftershock occurred in a positive (+> 0.1 bar) stress lobe from the 1988 event (Figure 9).
Future models will be added to this manuscript when they become available, including
investigating how the 1988 TC1, TC2 and TC3 events relate to the 2019 InSAR fault models.
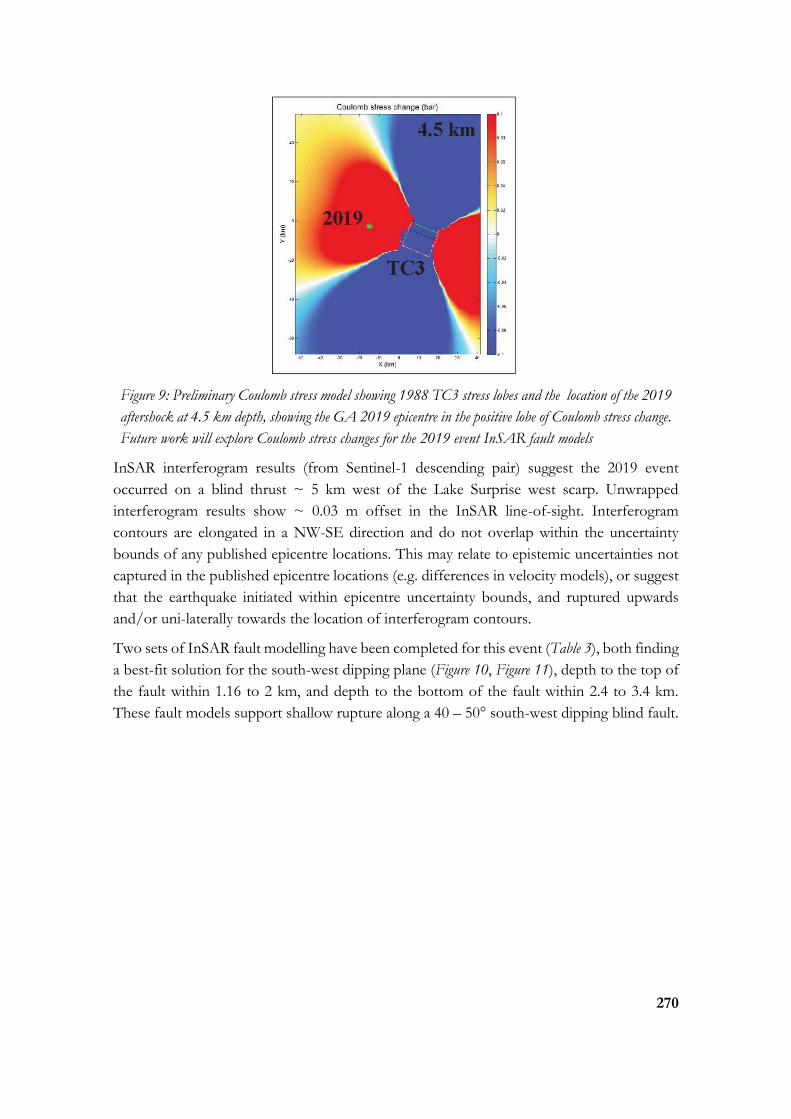
270
Figure 9: Preliminary Coulomb stress model showing 1988 TC3 stress lobes and the location of the 2019
aftershock at 4.5 km depth, showing the GA 2019 epicentre in the positive lobe of Coulomb stress change.
Future work will explore Coulomb stress changes for the 2019 event InSAR fault models
InSAR interferogram results (from Sentinel-1 descending pair) suggest the 2019 event
occurred on a blind thrust ~ 5 km west of the Lake Surprise west scarp. Unwrapped
interferogram results show ~ 0.03 m offset in the InSAR line-of-sight. Interferogram
contours are elongated in a NW-SE direction and do not overlap within the uncertainty
bounds of any published epicentre locations. This may relate to epistemic uncertainties not
captured in the published epicentre locations (e.g. differences in velocity models), or suggest
that the earthquake initiated within epicentre uncertainty bounds, and ruptured upwards
and/or uni-laterally towards the location of interferogram contours.
Two sets of InSAR fault modelling have been completed for this event (Table 3), both finding
a best-fit solution for the south-west dipping plane (Figure 10, Figure 11), depth to the top of
the fault within 1.16 to 2 km, and depth to the bottom of the fault within 2.4 to 3.4 km.
These fault models support shallow rupture along a 40 – 50° south-west dipping blind fault.

271
Figure 10: (a) InSAR interferogram from Sentinel-1 descending pairs (b) Unwrapped interferogram LOS
displacement map, second panel in (a) and (b) shows best-fit fault model location on a south-west dipping
fault (fault plane parameters at bottom of figure and in Table 3)
Table 3: Centroid moment focal mechanism and InSAR fault model solutions
Nodal plane 1 Nodal plane 2 InSAR Fault model
Agency Strike Dip Rake Strike Dip Rake Length (km)
Width (km)
Slip (m)
Depth to top
Depth to bottom
GFZ 132 44 84 311 46 96
USGS 155 32 119 302 62 73
GA 116 67 68 342 32 132
S. Valkaniotis
123 45 96 3.5 2 0.2 1.7 - 2 3.1 - 3.4
W. Barnhart 295 32 3.3 2.3 1.16 2.4
W. Barnhart 130 57 3 1 1.75 2.59
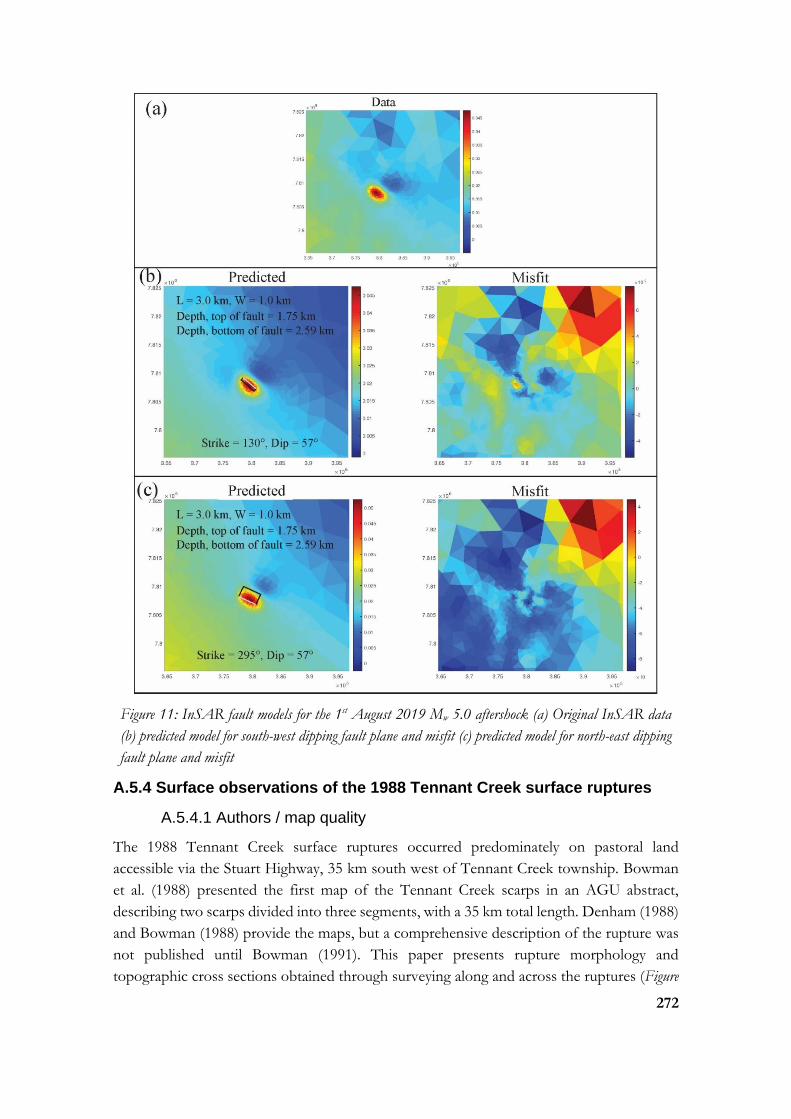
272
Figure 11: InSAR fault models for the 1st August 2019 Mw 5.0 aftershock (a) Original InSAR data
(b) predicted model for south-west dipping fault plane and misfit (c) predicted model for north-east dipping
fault plane and misfit
A.5.4 Surface observations of the 1988 Tennant Creek surface ruptures
A.5.4.1 Authors / map quality
The 1988 Tennant Creek surface ruptures occurred predominately on pastoral land
accessible via the Stuart Highway, 35 km south west of Tennant Creek township. Bowman
et al. (1988) presented the first map of the Tennant Creek scarps in an AGU abstract,
describing two scarps divided into three segments, with a 35 km total length. Denham (1988)
and Bowman (1988) provide the maps, but a comprehensive description of the rupture was
not published until Bowman (1991). This paper presents rupture morphology and
topographic cross sections obtained through surveying along and across the ruptures (Figure
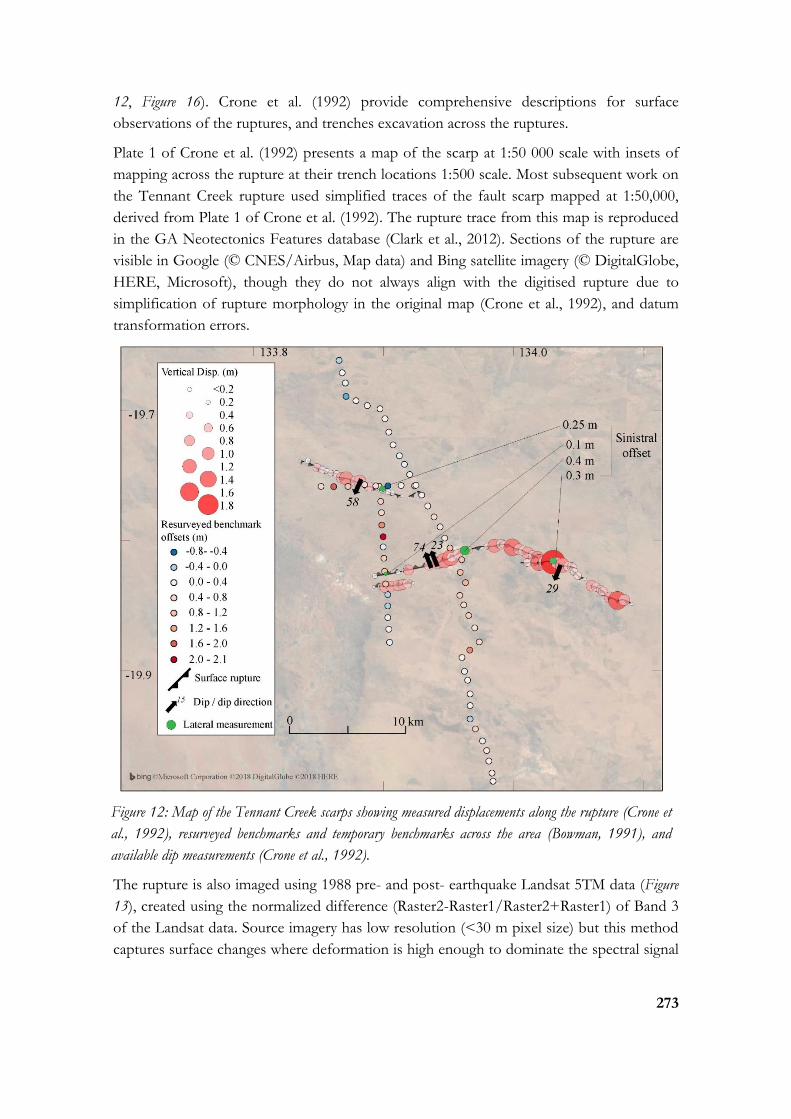
273
12, Figure 16). Crone et al. (1992) provide comprehensive descriptions for surface
observations of the ruptures, and trenches excavation across the ruptures.
Plate 1 of Crone et al. (1992) presents a map of the scarp at 1:50 000 scale with insets of
mapping across the rupture at their trench locations 1:500 scale. Most subsequent work on
the Tennant Creek rupture used simplified traces of the fault scarp mapped at 1:50,000,
derived from Plate 1 of Crone et al. (1992). The rupture trace from this map is reproduced
in the GA Neotectonics Features database (Clark et al., 2012). Sections of the rupture are
visible in Google (© CNES/Airbus, Map data) and Bing satellite imagery (© DigitalGlobe,
HERE, Microsoft), though they do not always align with the digitised rupture due to
simplification of rupture morphology in the original map (Crone et al., 1992), and datum
transformation errors.
Figure 12: Map of the Tennant Creek scarps showing measured displacements along the rupture (Crone et
al., 1992), resurveyed benchmarks and temporary benchmarks across the area (Bowman, 1991), and
available dip measurements (Crone et al., 1992).
The rupture is also imaged using 1988 pre- and post- earthquake Landsat 5TM data (Figure
13), created using the normalized difference (Raster2-Raster1/Raster2+Raster1) of Band 3
of the Landsat data. Source imagery has low resolution (<30 m pixel size) but this method
captures surface changes where deformation is high enough to dominate the spectral signal
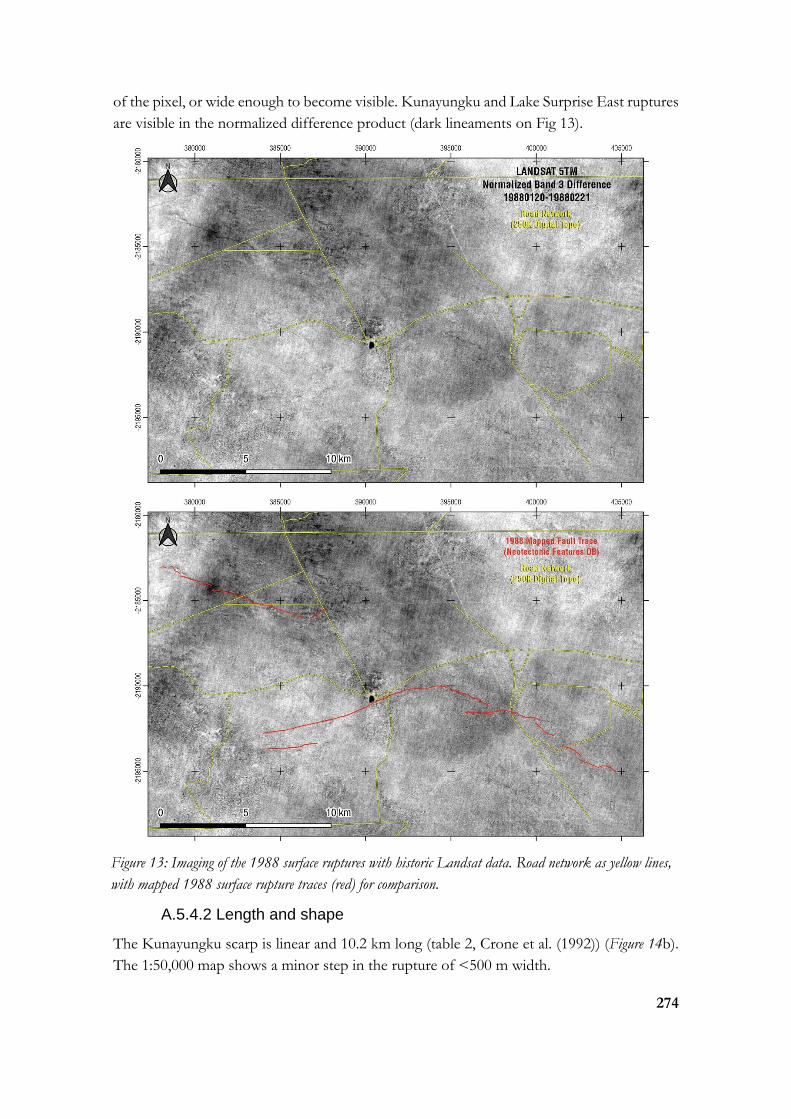
274
of the pixel, or wide enough to become visible. Kunayungku and Lake Surprise East ruptures
are visible in the normalized difference product (dark lineaments on Fig 13).
Figure 13: Imaging of the 1988 surface ruptures with historic Landsat data. Road network as yellow lines,
with mapped 1988 surface rupture traces (red) for comparison.
A.5.4.2 Length and shape
The Kunayungku scarp is linear and 10.2 km long (table 2, Crone et al. (1992)) (Figure 14b).
The 1:50,000 map shows a minor step in the rupture of <500 m width.
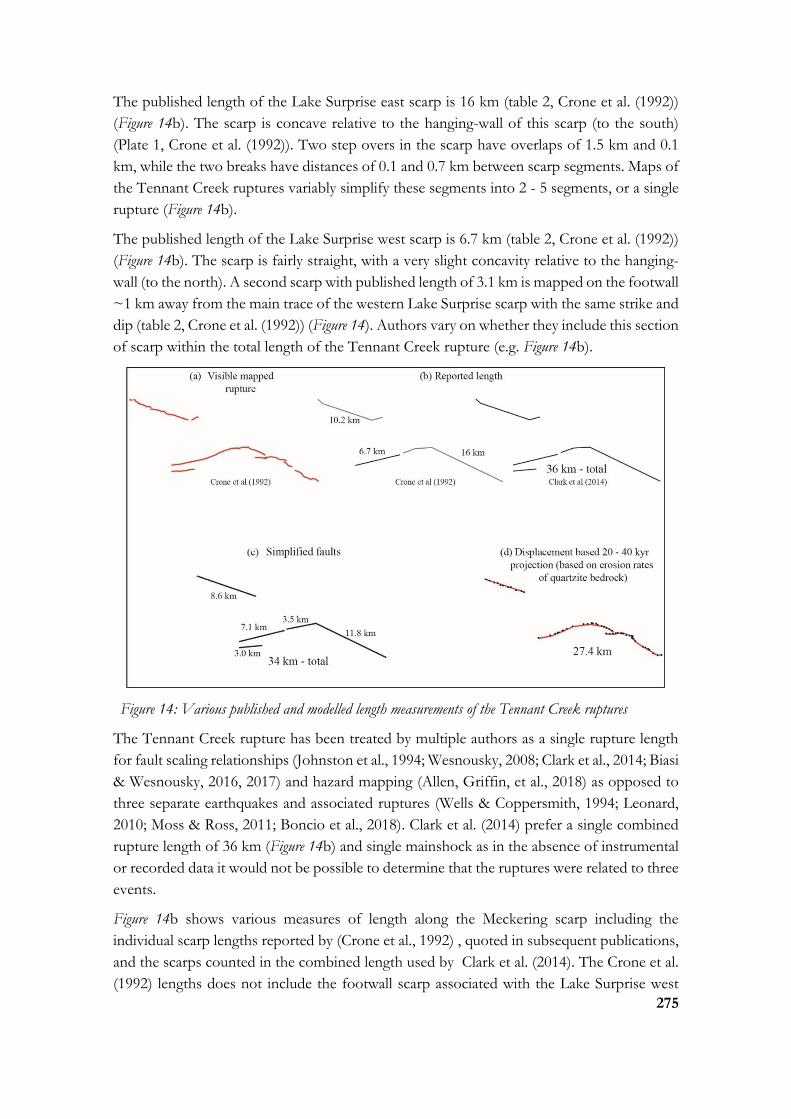
275
The published length of the Lake Surprise east scarp is 16 km (table 2, Crone et al. (1992))
(Figure 14b). The scarp is concave relative to the hanging-wall of this scarp (to the south)
(Plate 1, Crone et al. (1992)). Two step overs in the scarp have overlaps of 1.5 km and 0.1
km, while the two breaks have distances of 0.1 and 0.7 km between scarp segments. Maps of
the Tennant Creek ruptures variably simplify these segments into 2 - 5 segments, or a single
rupture (Figure 14b).
The published length of the Lake Surprise west scarp is 6.7 km (table 2, Crone et al. (1992))
(Figure 14b). The scarp is fairly straight, with a very slight concavity relative to the hanging-
wall (to the north). A second scarp with published length of 3.1 km is mapped on the footwall
~1 km away from the main trace of the western Lake Surprise scarp with the same strike and
dip (table 2, Crone et al. (1992)) (Figure 14). Authors vary on whether they include this section
of scarp within the total length of the Tennant Creek rupture (e.g. Figure 14b).
Figure 14: Various published and modelled length measurements of the Tennant Creek ruptures
The Tennant Creek rupture has been treated by multiple authors as a single rupture length
for fault scaling relationships (Johnston et al., 1994; Wesnousky, 2008; Clark et al., 2014; Biasi
& Wesnousky, 2016, 2017) and hazard mapping (Allen, Griffin, et al., 2018) as opposed to
three separate earthquakes and associated ruptures (Wells & Coppersmith, 1994; Leonard,
2010; Moss & Ross, 2011; Boncio et al., 2018). Clark et al. (2014) prefer a single combined
rupture length of 36 km (Figure 14b) and single mainshock as in the absence of instrumental
or recorded data it would not be possible to determine that the ruptures were related to three
events.
Figure 14b shows various measures of length along the Meckering scarp including the
individual scarp lengths reported by (Crone et al., 1992) , quoted in subsequent publications,
and the scarps counted in the combined length used by Clark et al. (2014). The Crone et al.
(1992) lengths does not include the footwall scarp associated with the Lake Surprise west

276
rupture, though this scarp has length and displacement characteristics of primary rupture.
Including this feature shows a length of 10.1 km for the Lake Surprise west scarp (Figure 14c).
Figure 14c simplifies ruptures to straight traces and defines distinct faults where mapped
primary rupture has gaps/steps > 1 km and/or where strike changes by > 20° for distances
> 1 km (e.g. (Quigley et al., 2017)). This results in five total faults defined, or one fault for
the Kunayungku rupture, two for the Lake Surprise west rupture, and two for the Lake
Surprise east rupture, explored in more detail in King et al. (2019) (in review).
Figure 14d presents portions of the scarp where more than two vertical displacement
measurements of greater than 0.2 m occur within a distance of 1 km (data from (Bowman,
1991)). Applying cosmogenic erosion rates from lithologically and climatically analogous
settings of Australia (5 – 10 m Myr-1 Quigley et al. (2007)) suggests that 0.2 m of scarp height
could be removed within 20 – 40 kyrs, leaving 27.4 km of rupture length (i.e., 27.4 km of
residual surface rupture with relief ≥ 0.2m) visible in the landscape. Based on these erosion
rate estimates, the maximum recorded vertical offset (1.8 m, Lake Surprise east) would be
removed within 180 – 360 kyrs. Recurrence along the Lake Surprise east rupture is limited
by trenching results (Section 5.2) to > 46 kyrs based on the earliest date for deposition of
undeformed Eolian sediments (Crone et al., 1992). In this erosion rate calculation we assume
that the scarp is shallowly underlain by quartzite bedrock and that the scarp erodes more
rapidly than the surrounding terrain at rates commensurate with Quigley et al. (2007).
A.5.4.3 Strike
The average strike of the Kunayungku scarp is 109°, and a 1 km long segment at its eastern
end strikes 063°. The western Lake Surprise scarp strikes on average 254°, not accounting
for the very slight concavity through the middle of the rupture. The smaller length of rupture
on the footwall of the western scarp strikes 264°. A line drawn between the point of dip
inflection and the first step-over in the eastern Lake Surprise scarp has a strike of 098° (I.e.
the area of greatest curvature has a general E-W trend). A line drawn between the first step
over and last segment of the eastern lake surprise scarp has a strike of 118°. This measure
discounts significant internal strike variation for each segment, including an average strike of
094° for the first segment.
A.5.4.4 Dip
Most authors prefer fault dips based on aftershock defined planes and seismological data,
rather than surface observations. Preferred dips from multiple primary sources using a variety
of data are summarised in Table 4.
Only four surface measurements of dip are published, from four trenches described by Crone
et al. (1992) (reproduced in Figure 12). The Kunayungku trench exposed multiple planes that
accommodated slip dipping both NE and SW, but the authors believe the dominant fault is
represented by a plane dipping 58° towards the SW. The two trenches across the Lake
Surprise west scarp were only 375 m apart but provide disparate dip measurements of 74°
(dip ranges between 65 - 84° along a well-defined plane) and 23° towards the NW. The latter
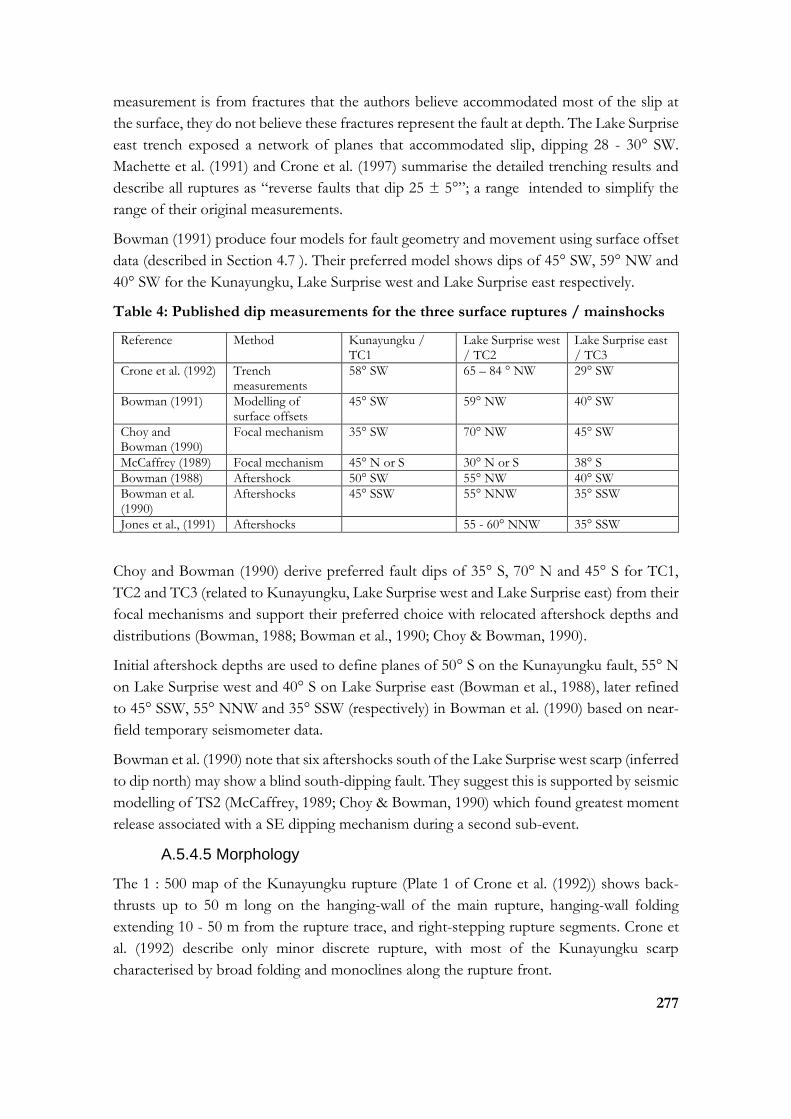
277
measurement is from fractures that the authors believe accommodated most of the slip at
the surface, they do not believe these fractures represent the fault at depth. The Lake Surprise
east trench exposed a network of planes that accommodated slip, dipping 28 - 30° SW.
Machette et al. (1991) and Crone et al. (1997) summarise the detailed trenching results and
describe all ruptures as “reverse faults that dip 25 ± 5°”; a range intended to simplify the
range of their original measurements.
Bowman (1991) produce four models for fault geometry and movement using surface offset
data (described in Section 4.7 ). Their preferred model shows dips of 45° SW, 59° NW and
40° SW for the Kunayungku, Lake Surprise west and Lake Surprise east respectively.
Table 4: Published dip measurements for the three surface ruptures / mainshocks
Reference Method Kunayungku / TC1
Lake Surprise west / TC2
Lake Surprise east / TC3
Crone et al. (1992) Trench measurements
58° SW 65 – 84 ° NW 29° SW
Bowman (1991) Modelling of surface offsets
45° SW 59° NW 40° SW
Choy and Bowman (1990)
Focal mechanism 35° SW 70° NW 45° SW
McCaffrey (1989) Focal mechanism 45° N or S 30° N or S 38° S
Bowman (1988) Aftershock 50° SW 55° NW 40° SW
Bowman et al. (1990)
Aftershocks 45° SSW 55° NNW 35° SSW
Jones et al., (1991) Aftershocks 55 - 60° NNW 35° SSW
Choy and Bowman (1990) derive preferred fault dips of 35° S, 70° N and 45° S for TC1,
TC2 and TC3 (related to Kunayungku, Lake Surprise west and Lake Surprise east) from their
focal mechanisms and support their preferred choice with relocated aftershock depths and
distributions (Bowman, 1988; Bowman et al., 1990; Choy & Bowman, 1990).
Initial aftershock depths are used to define planes of 50° S on the Kunayungku fault, 55° N
on Lake Surprise west and 40° S on Lake Surprise east (Bowman et al., 1988), later refined
to 45° SSW, 55° NNW and 35° SSW (respectively) in Bowman et al. (1990) based on near-
field temporary seismometer data.
Bowman et al. (1990) note that six aftershocks south of the Lake Surprise west scarp (inferred
to dip north) may show a blind south-dipping fault. They suggest this is supported by seismic
modelling of TS2 (McCaffrey, 1989; Choy & Bowman, 1990) which found greatest moment
release associated with a SE dipping mechanism during a second sub-event.
A.5.4.5 Morphology
The 1 : 500 map of the Kunayungku rupture (Plate 1 of Crone et al. (1992)) shows back-
thrusts up to 50 m long on the hanging-wall of the main rupture, hanging-wall folding
extending 10 - 50 m from the rupture trace, and right-stepping rupture segments. Crone et
al. (1992) describe only minor discrete rupture, with most of the Kunayungku scarp
characterised by broad folding and monoclines along the rupture front.

278
Two 1 : 500 maps are presented for Lake Surprise west, with one showing continuous NW
dipping rupture along a 150 m length and the other showing discontinuous SE dipping
rupture segments 10 - 20 m long (Plate 1 of Crone et al. (1992)). Both maps show 40 – 100
m fractures 5 - 10 m north of the rupture, parallel to them and associated with back thrusts
on the hanging-wall (Plate 1 of Crone et al. (1992)). A single 1 : 500 map of the eastern Lake
Surprise scarp is produced, showing a continuous south-dipping rupture with two sections
of duplexing rupture 10 - 30 m long, and three sections of back thrust 10 – 40 m long (Plate
1 of Crone et al. (1992)).
Crone et al. (1992) provide descriptions of scarp morphology only as relates to the sections
in the immediate vicinity of four trenches. The Lake Surprise east rupture morphology is
described as a predominately continuous discrete rupture. This section represents the area of
maximum vertical offset of all three scarp sections. The authors describe discrete rupture
diminishing in height towards the ends of each segment, until the scarp is visible only as a
gentle warping. Where the rupture duplexes, most of the offset is captured in the furthest
segment (relative to the hanging-wall). For the Lake Surprise west scarps, rupture consists of
both small discrete ruptures or very broad ground warping across 10’s of meters (maps and
profiles on Plate 1 of Crone et al. (1992)). The shorter scarp mapped on the footwall of the
western Lake Surprise scarp is described as a “gentle but pronounced steepening of the
ground surface across a 20 - 50 m wide zone and, locally, as discontinuous mole track
furrows” (Crone et al., 1992).
A.5.4.6 Kinematics
Folds and monoclines of the Kunayungku scarp are described as right-stepping en-echelon
features (Crone et al., 1992), evident in the 1 : 500 map (plate 1, Crone et al. (1992)). Where
the scarp displaces a road berm 25 cm of lateral offset is measured (Table 3, Crone et al.
(1992), reproduced in Figure 12). The Lake Surprise west scarp is mapped as continuous with
no step-overs, and the 1 : 500 maps show extensional cracks parallel to rupture with no
indication of lateral movement or extension. Crone et al. (1992) record 10 cm of sinistral
offset measured from an offset crack through a termite mound.
The Lake Surprise east scarp shows multiple large scale right-stepping segments which may
indicate a component of right lateral movement to thrusting. However, 20 cm and 40 cm of
left-lateral movement are recorded in roads in the eastern and central portions of the scarp
respectively (Crone et al., 1992). A pipeline that crosses the eastern Lake Surprise scarp was
shortened by 1 m and showed no lateral component to shortening. Overall recorded lateral
offsets are considered to have high uncertainties given the nature of offset features (road
berms and termite mounds) and unknown method of measurement.
A.5.4.7 Displacement
The Tennant Creek rupture was documented with field work that included an aerial
photographic survey, three 3 km and eighty 0.2 km levelling profiles across the rupture, and
GPS located photos and field observations (Bowman, 1991). This work was conducted by
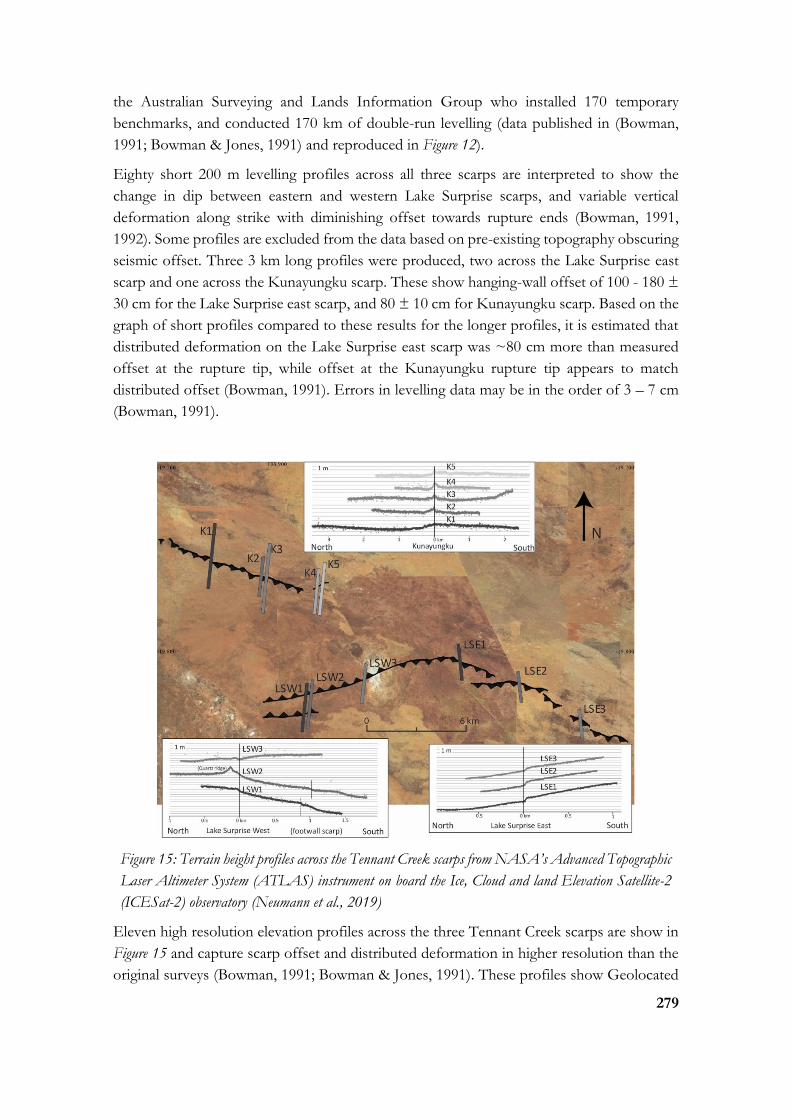
279
the Australian Surveying and Lands Information Group who installed 170 temporary
benchmarks, and conducted 170 km of double-run levelling (data published in (Bowman,
1991; Bowman & Jones, 1991) and reproduced in Figure 12).
Eighty short 200 m levelling profiles across all three scarps are interpreted to show the
change in dip between eastern and western Lake Surprise scarps, and variable vertical
deformation along strike with diminishing offset towards rupture ends (Bowman, 1991,
1992). Some profiles are excluded from the data based on pre-existing topography obscuring
seismic offset. Three 3 km long profiles were produced, two across the Lake Surprise east
scarp and one across the Kunayungku scarp. These show hanging-wall offset of 100 - 180 ±
30 cm for the Lake Surprise east scarp, and 80 ± 10 cm for Kunayungku scarp. Based on the
graph of short profiles compared to these results for the longer profiles, it is estimated that
distributed deformation on the Lake Surprise east scarp was ~80 cm more than measured
offset at the rupture tip, while offset at the Kunayungku rupture tip appears to match
distributed offset (Bowman, 1991). Errors in levelling data may be in the order of 3 – 7 cm
(Bowman, 1991).
Figure 15: Terrain height profiles across the Tennant Creek scarps from NASA’s Advanced Topographic
Laser Altimeter System (ATLAS) instrument on board the Ice, Cloud and land Elevation Satellite-2
(ICESat-2) observatory (Neumann et al., 2019)
Eleven high resolution elevation profiles across the three Tennant Creek scarps are show in
Figure 15 and capture scarp offset and distributed deformation in higher resolution than the
original surveys (Bowman, 1991; Bowman & Jones, 1991). These profiles show Geolocated
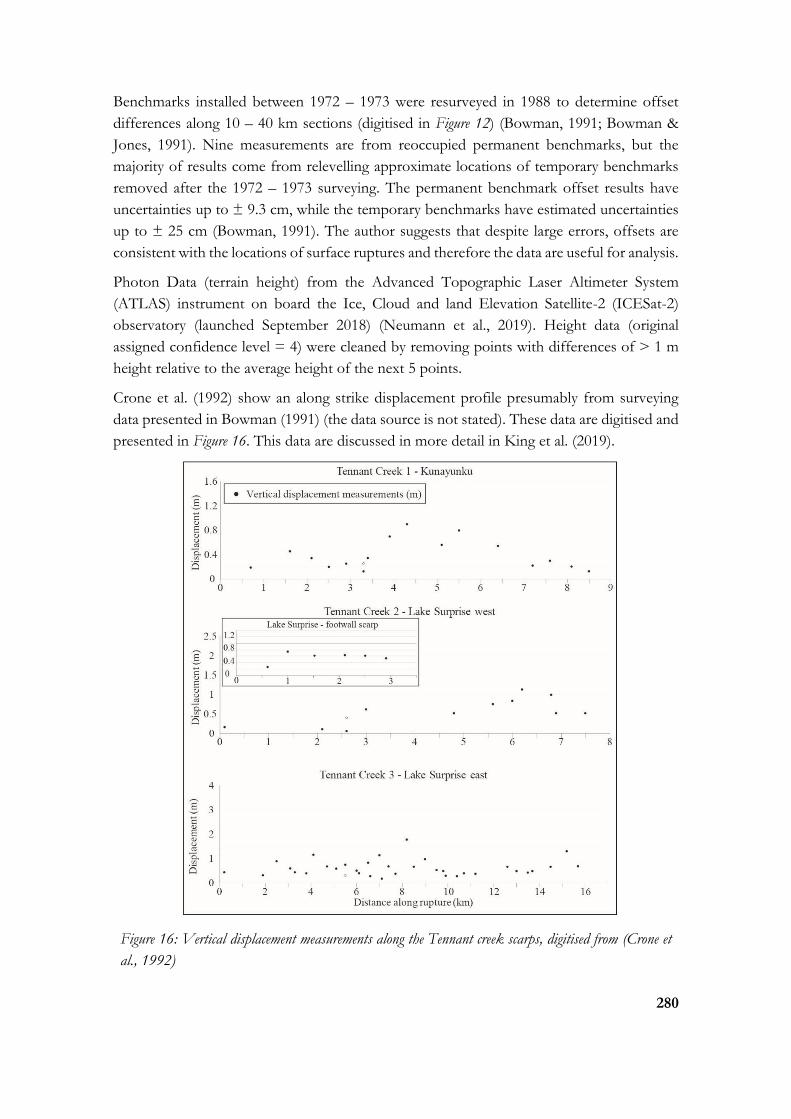
280
Benchmarks installed between 1972 – 1973 were resurveyed in 1988 to determine offset
differences along 10 – 40 km sections (digitised in Figure 12) (Bowman, 1991; Bowman &
Jones, 1991). Nine measurements are from reoccupied permanent benchmarks, but the
majority of results come from relevelling approximate locations of temporary benchmarks
removed after the 1972 – 1973 surveying. The permanent benchmark offset results have
uncertainties up to ± 9.3 cm, while the temporary benchmarks have estimated uncertainties
up to ± 25 cm (Bowman, 1991). The author suggests that despite large errors, offsets are
consistent with the locations of surface ruptures and therefore the data are useful for analysis.
Photon Data (terrain height) from the Advanced Topographic Laser Altimeter System
(ATLAS) instrument on board the Ice, Cloud and land Elevation Satellite-2 (ICESat-2)
observatory (launched September 2018) (Neumann et al., 2019). Height data (original
assigned confidence level = 4) were cleaned by removing points with differences of > 1 m
height relative to the average height of the next 5 points.
Crone et al. (1992) show an along strike displacement profile presumably from surveying
data presented in Bowman (1991) (the data source is not stated). These data are digitised and
presented in Figure 16. This data are discussed in more detail in King et al. (2019).
Figure 16: Vertical displacement measurements along the Tennant creek scarps, digitised from (Crone et
al., 1992)

281
A.5.4.8 Environmental damage
The length and offsets of Tennant Creek scarps individually and together match descriptions
for ESI X (Michetti et al., 2007). The length, offsets and descriptions of surface fractures /
cracking as mapped in Crone et al. (1992) is classified as ESI VI - VII, with fissures up to
ESI VIII. Vegetation damage is noted in the form of dead grasses and bushes resulting from
root tear (Crone et al., 1992), these do not fit into the ESI-07 categories. No bedrock
outcrops in the area were observed to have experienced rock falls, and nearby well data were
analysed but no hydrological anomalies were documented (Bowman et al., 1990).
A.5.5 Paleoseismic investigations of the 1988 Tennant Creek surface
ruptures
A.5.5.1 Authors / mapping quality
Crone et al. (1992) present comprehensive descriptions of four trenches dug across the
ruptures and provide details of 54 samples taken for grain size analysis, electron-spin
resonance, thermoluminescence, U-trend and U-series analysis, uranium isotope analysis,
radiocarbon analysis, and chemical analysis (Table 8, Crone et al. (1992)). This data is
summarised in Crone et al. (1997). Jones et al. (1991) note two trenches dug across the eastern
Lake Surprise rupture that seem to be distinct to the Crone et al. (1992) trenches, but no
descriptions of these two trenches are published.
A.5.5.2 Trenching
A.5.5.2.1 Identified units
The trench logs of Crone et al. (1992) are comprehensive in their descriptions of units,
including significant sampling to quantify grain size, age and deposition rate. Plate 2 of Crone
et al. (1992) provides a summary of exposed units alongside interpreted trench logs.
The Crone et al. (1992) trench log across the Kunayungku scarp shows ‘altered rock’ at ~2
m as bedrock, described as claystone with minor sand and carbonate nodules. These rocks
likely relate to Proterozoic Wiso Basin sediments, or silicified paleochannel deposits (Magee,
2009; Bell et al., 2012), rather than Warramunga Province basement. There is no significant
difference in the thickness of eolian sand, or depth to bedrock, across the Kunayungku scarp.
Two trenches across the Lake Surprise west scarp show significantly more lithological
complexity than the Kunayungku trench. Bedrock in this location is described as ‘quartzite’
and ‘iron-rich bedrock’ and is exposed only on the hanging-wall sides of each trench. The
bedrock is extensively oxidised and weathered, with the trench log showing a complex
interaction of bedrock blocks that are interpreted to include shear bands and jointing
fractures. Borehole logs on the hanging-wall of the rupture ~2 km west of the trench
locations show Wiso Basin or paleochannel sediments to 30 m (RN017672), ~4 km north of
the trench show diorite at 24 m (RN011688) and ~5 km south-west on the footwall of the
rupture limestone and clay to 36 m depth (RN013204) (limestone may be calcrete associated
282
with paleo-channel deposits) (see Section 2). The authors interpret the fractured nature of
bedrock exposed in the trench to indicate potential prior faulting in this location.
Surficial sediments are much thicker on the southern (footwall) sides of each trench and
include eolian sand, angular gravels, ferricrete gravels and ferricrete. The gravels on the
hanging-wall are interpreted to relate to a thin debris flow from the nearby quartz ridge from
a high rainfall event prior to very thin (~10 cm) deposition of eolian sand. In the second
trench, angular gravels are seen to fill a small pocket in the underlying ferricrete. The authors
interpret this as a fissure predating eolian deposition potentially relating to prior rupture
(Crone et al., 1992), though it may also relate to any number of other surface erosional
processes.
Relative to the northern, hanging-wall side of the trench, footwall eolian sand is ~2 m thick
in the first trench and ~0.7 m thick in the second trench. In the second trench sand overlies
angular debris, interpreted to be derived from basement blocks exposed on the hanging-wall
of the trench. For both trenches, the height of bedrock on the northern side of the trench
and thickness of eolian sediment on the south side is interpreted as a bedrock scarp of
uncertain origin prior to the start of eolian deposition (Crone et al., 1992, 1997). The authors
propose that the bedrock scarp could relate to a surface rupturing event, or represent an
erosional feature from a palaeodrainage system. Quaternary deposits show no evidence of
faulting or deformation prior to historic rupture.
The Lake Surprise east trench does not expose bedrock, with 2 - 3 m of eolian sand underlain
with ferricrete extending to the bottom of the 4 m deep trench. The authors suggest that
bedrock may exist at 4 - 5 m depth based on observations at the other trenches. A water-well
drilled ~200 m north of the trench site (on the footwall) shows sediments down to 230 m
(RN010166). Another bore ~6 km SE of the trench (on the hanging-wall) shows weathered
granites at 38 m (hard granite at 69 m) overlain with clays and sandstone (RN012140). The
deepest sample of eolian sand from this trench (2.5 m) shows a thermoluminescence age of
52 ± 4 ka, interpreted to show eolian sediments began depositing in this area in the late
Pleistocene. Thermoluminescence data from this and other trenches are used to derive a
deposition rate of 3.2 - 4.8 cm / ka.
A.5.5.2.1 Structural interpretations
Trenching across the Kunayungku scarp shows that most of the uplift identified in levelling
profiles (80 ±10 cm (Bowman, 1991)) is accommodated through hanging-wall folding rather
than discrete slip along a confined, singular rupture plane. Offset is accommodated via
multiple low to high angle reverse fault strands in both the direction of overall fault dip and
as back thrusts, generally with < 10 cm individual offset (Crone et al., 1992). The main fault
is a south-dipping structure that offsets bedrock by up to 30 cm and is central to a network
of small faults and joints. The authors note that dip on this fault changes from 16° to 58° at
the interface between eolian sands and claystone, indicating rheological control on faulting
in the near-surface. Similarly, extensional cracking associated with hanging-wall folding is

283
best expressed in the eolian sediments, and is generally not evident in the underlying
claystone. The authors find no structural evidence to suggest prior faulting in this location.
The two Lake Surprise west trenches show more structural complexity than the Kunayungku
trench. Levelling profiles indicate up to 1 m of offset along a north-dipping fault (Bowman,
1991). However, in the first trench the only significant north-dipping structure mapped is a
joint through eolian sand with no apparent offset. A south-dipping reverse fault is mapped
on the trench log between disjointed bedrock units interpreted as an ancient south-dipping
shear zone which accommodated some of the shortening related to the north-dipping
historical event (Crone et al., 1992). The second trench shows steep north-dipping structures
through bedrock, which the authors interpret as Precambrian shear as they do not extend
into the overlying ferricrete (Crone et al., 1992). They suggest that most of the 1988 offset is
accommodated in a ~10 cm wide brecciated zone dipping 65 - 84° north, with no measurable
offsets due to the weathered nature of bedrock.
Similar to the Kunayungku scarp, the Lake Surprise east trench shows multiple south-dipping
rupture strands accommodating offset, connected by networks of small north-dipping joints.
Only two of these strands are shown to rupture to the surface at the location of the discrete
rupture. The other strands terminate at a mapped soil layer and the authors note that the
minimal system of roots in this topmost layer may have constrained deformation to the
subsurface, except along the main fault strand. Near vertical extensional cracks are mapped
on the hanging-wall due to minor folding. The authors interpret all the identified structures
to relate to the 1988 event, with no evidence of prior rupture.
Crone et al. (1992) suggest that the location of Lake Surprise at the dip inflection point and
change in strike between eastern and western Lake Surprise ruptures is evidence of structural
complexities in the subsurface. They note that calcrete mounds around the lake show
evidence of active ground water flow which may relate to subsurface structures, and suggest
that Lake Surprise showed the lowest offset measurements from levelling profiles supportive
of structural complexity creating a rupture barrier. The authors imply that this barrier may
have prevented any prior rupture along the Lake Surprise west scarp (as postulated based on
the pre-existing bedrock scarp) propagating across to the Lake Surprise east or Kunayungku
scarps (which show no evidence of prior rupture) (Crone et al., 1992).
A.5.5.3 Summary of evidence for prior rupture along the Lake Surprise
west scarp
The Lake Surprise west scarp runs along a ~4.8 km long quartz ridge (Bowman et al., 1990;
Bowman, 1992; Crone et al., 1992). Most authors describe this quartz ridge as an “ancient
mineralized fault or fault zone” (Crone et al., 1992) and infer this coincidence of location to
suggest the Lake Surprise west fault either reactivated, or at least was controlled by, this
geological feature. Slip is accommodated along north and south-dipping fractures in the first
trench, and steeply north-dipping narrow shear band in the second trench. Both trenches
show a distinct basement scarp of complex jointed and altered basement under thin eolian
cover on the north side, with thick eolian cover on the south side including evidence of

284
alluvium derived from the bedrock (Crone et al., 1992). This may relate to palaeodrainage
erosion along a pre-existing basement structure (as indicated by the quartz ridge, and
geophysical interpretation of bedrock (Figure 2)), or to prior neotectonic reactivation prior to
the deposition of Quaternary sediments.
Three lines of evidence are presented to support prior rupture along the Lake Surprise west
scarps: an infilled hole above bedrock and below eolian sands suggested to be an infilled
coseismic fissure; fractures that extend through bedrock into some, but not all, quaternary
sediment layers; and the inferred height of pre-existing bedrock scarp (> 1.65 m) suggesting
the pre-existing scarp was “at least equal in size to the historical scarp”. This third piece of
evidence shows a bedrock scarp at least twice as high as the historic scarp (0.8 m) after
undergoing an unknown length of erosion prior to sediment deposition (i.e. the scarp may
have been much higher). The second piece of evidence may support prior rupture, but
fractures which do not extend to the surface are observed in the Lake Surprise east scarp and
at least one other historic surface rupturing event (Meckering (Clark & Edwards, 2018)).
A.5.6 Discussion
A.5.6.1 Basement structural controls on the 1987 – 2019 Tennant Creek
sequence
Available geological and geophysical data suggests that pre-existing basement structures
imparted strong controls on the fault location and orientation of all three 1988 surface
ruptures, and the 2019 aftershock. All historically rupturing faults, as documented as surface
ruptures, or imaged in InSAR, are sub-parallel to linear gravity anomalies, coincident with
the edges of a magnetic high and coincident with basement structures identified in the
interpreted geology map of Johnstone and Donnellan (2001) (Figure 17). All three surface
ruptures and the 2019 fault coincide with the location of the Palparti paleo-valley (Bell et al.,
2012), which is expressed in the mapped surface geology (Figure 17d). Shallow geophysical
techniques and drill logs across paleo-valley sediments may provide an opportunity to
investigate prior paleoseismic activity of these faults.

285
Figure 17: (a) map of 1988 surface ruptures, 2019 Mw 5.0 epicentres, and InSAR contours and best-fit fault model for
2019 event (b)-(e) same map components as (a) showing (b) national bouguer gravity anomaly map (c) national total
magnetic intensity (d) surface geology map (see Figure 4, for legend and details) (e) interpreted basement geology (see Figure
2 for legend and details)
A.5.7 Conclusions
The Tennant Creek seismic sequence began with four earthquakes of ML 4.9 - 5.4 in January
1987, includes the three Mw 6.3, 6.4 and 6.6 surface rupturing events of 22nd January 1988,
and includes a prolonged aftershock sequence punctuated by a Mw 5.0 event on a shallow
blind fault on 1st August 2019. Available data suggests that the seismicity is occurring along
or coincident with pre-existing basement structures, and there is no strong evidence to
support prior Cenozoic rupture along these features.

286
6. Review paper: The 23rd March 2012 Mw 5.2 Pukatja surface rupturing earthquake, Australia
Tamarah King
School of Earth Sciences, The University of Melbourne, Victoria 3010, Australia
https://orcid.org/0000-0002-9654-2917
Mark Quigley
School of Earth Sciences, The University of Melbourne, Victoria 3010, Australia
https://orcid.org/0000-0002-4430-4212
Dan Clark
Geoscience Australia, Canberra 2601, Australia
https://orcid.org/0000-0001-5387-4404
Abstract
The 23rd March 2012 Mw 5.2 Pukatja earthquake produced an arcuate surface rupture 1.6 km
long with a maximum vertical offset of 0.48 m. We reclassify its length to 1 km based on
application of orientation and kinematic criteria used previously to measure other historic
Australian surface ruptures. Epicentres are poorly constrained and inaccurate, located up to
17 km from the surface rupture with no reported uncertainties. Published interpretations of
available seismological data do not provide constraints on rupture processes, hypocentre
depth, and fault geometry. Sections of the surface rupture match the strike and dip of an
intrusive contact as mapped in the field < 500 m from the rupture. This feature is evident as
a linear magnetic anomaly co-located and parallel to the surface rupture, suggesting a strong
bedrock control on the location and orientation of surface rupture. There is no topographic
expression of prior rupture, and a shallow hand-dug trench shows evidence of only the
historic rupture. However, erosion rates estimates suggest that residency time of any prior
ruptures in the landscape may have been < 50 kyrs, and hence topographic evidence may
have been removed prior to deposition of overlying sediments. Investigations of rock falls
surrounding the historic rupture may provide estimates of strong ground motion recurrence
in the absence of other paleoseismic data.
A.6.1 Geology
A.6.1.1 Regional / background
The 2012 Pukatja, 1986 Marryat Creek and 2016 Petermann surface rupturing earthquakes
occurred within the Musgrave Block, a Mesoproterozoic basement assemblage that extends
across the Northern Territory / South Australia border into Western Australia (Figure 1).
This block is composed of high grade metamorphic and magmatic suites formed during the
~1200 Ma Musgrave orogen and reworked during the 580 - 520 Ma Petermann Orogeny
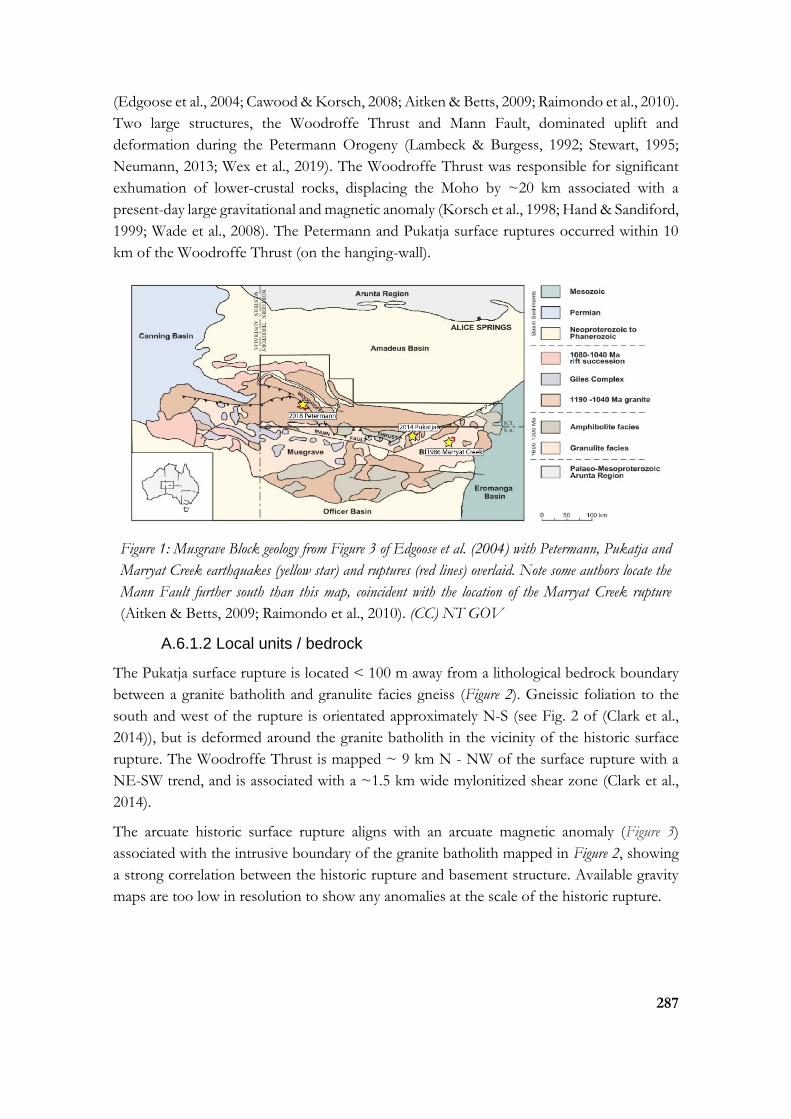
287
(Edgoose et al., 2004; Cawood & Korsch, 2008; Aitken & Betts, 2009; Raimondo et al., 2010).
Two large structures, the Woodroffe Thrust and Mann Fault, dominated uplift and
deformation during the Petermann Orogeny (Lambeck & Burgess, 1992; Stewart, 1995;
Neumann, 2013; Wex et al., 2019). The Woodroffe Thrust was responsible for significant
exhumation of lower-crustal rocks, displacing the Moho by ~20 km associated with a
present-day large gravitational and magnetic anomaly (Korsch et al., 1998; Hand & Sandiford,
1999; Wade et al., 2008). The Petermann and Pukatja surface ruptures occurred within 10
km of the Woodroffe Thrust (on the hanging-wall).
Figure 1: Musgrave Block geology from Figure 3 of Edgoose et al. (2004) with Petermann, Pukatja and
Marryat Creek earthquakes (yellow star) and ruptures (red lines) overlaid. Note some authors locate the
Mann Fault further south than this map, coincident with the location of the Marryat Creek rupture
(Aitken & Betts, 2009; Raimondo et al., 2010). (CC) NT GOV
A.6.1.2 Local units / bedrock
The Pukatja surface rupture is located < 100 m away from a lithological bedrock boundary
between a granite batholith and granulite facies gneiss (Figure 2). Gneissic foliation to the
south and west of the rupture is orientated approximately N-S (see Fig. 2 of (Clark et al.,
2014)), but is deformed around the granite batholith in the vicinity of the historic surface
rupture. The Woodroffe Thrust is mapped ~ 9 km N - NW of the surface rupture with a
NE-SW trend, and is associated with a ~1.5 km wide mylonitized shear zone (Clark et al.,
2014).
The arcuate historic surface rupture aligns with an arcuate magnetic anomaly (Figure 3)
associated with the intrusive boundary of the granite batholith mapped in Figure 2, showing
a strong correlation between the historic rupture and basement structure. Available gravity
maps are too low in resolution to show any anomalies at the scale of the historic rupture.
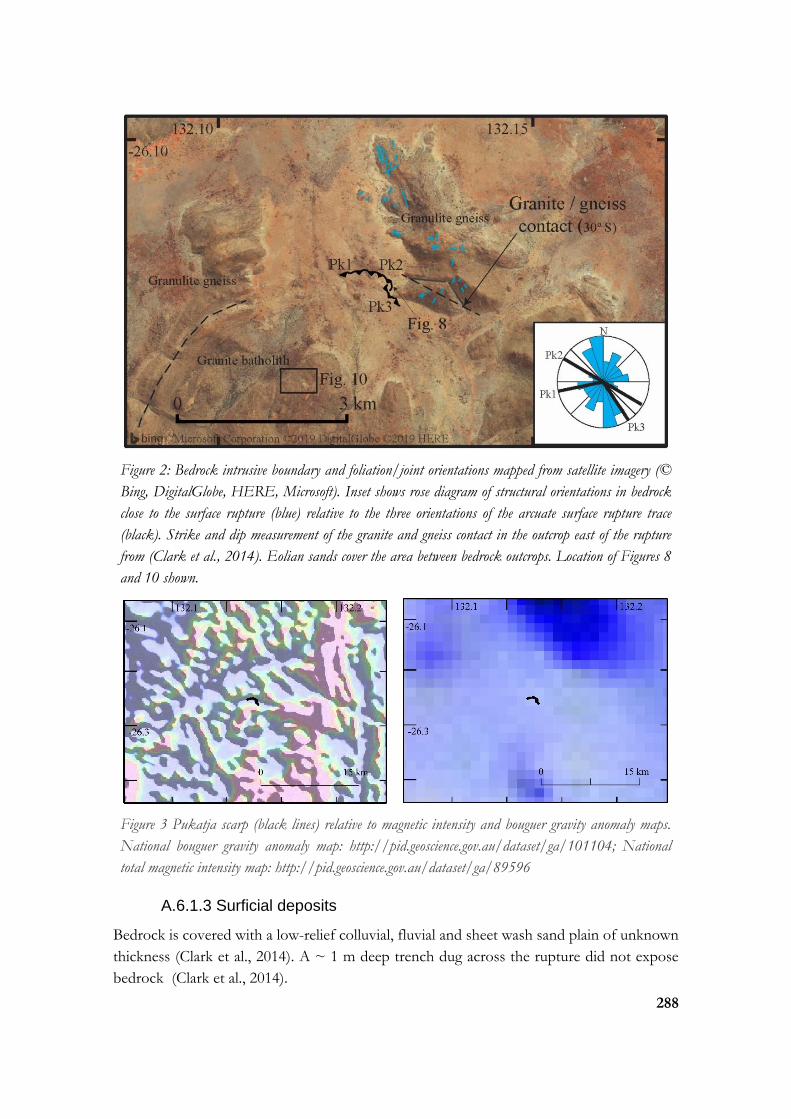
288
Figure 2: Bedrock intrusive boundary and foliation/joint orientations mapped from satellite imagery (©
Bing, DigitalGlobe, HERE, Microsoft). Inset shows rose diagram of structural orientations in bedrock
close to the surface rupture (blue) relative to the three orientations of the arcuate surface rupture trace
(black). Strike and dip measurement of the granite and gneiss contact in the outcrop east of the rupture
from (Clark et al., 2014). Eolian sands cover the area between bedrock outcrops. Location of Figures 8
and 10 shown.
Figure 3 Pukatja scarp (black lines) relative to magnetic intensity and bouguer gravity anomaly maps.
National bouguer gravity anomaly map: http://pid.geoscience.gov.au/dataset/ga/101104; National
total magnetic intensity map: http://pid.geoscience.gov.au/dataset/ga/89596
A.6.1.3 Surficial deposits
Bedrock is covered with a low-relief colluvial, fluvial and sheet wash sand plain of unknown
thickness (Clark et al., 2014). A ~ 1 m deep trench dug across the rupture did not expose
bedrock (Clark et al., 2014).

289
A.6.2 Seismology
A.6.2.1 Epicentre
Clark et al. (2014) publish four epicentre locations (Table 1, Figure 4). The GA_online
catalogue location was revised in 2015 to lie on the hanging-wall of the surface rupture. The
original GA location (Clark et al., 2014) lies 17 km to the west of the surface rupture, which
is the also the current location in the USGS online catalogue (assumedly updated since the
USGS location in Clark et al. (2014) was published). The other three solutions (GCMT,
USGS, and St Louis University) are 4, 7, and 6 km N and NW from the most proximal part
of the surface rupture. The recently published NSHA18 catalogue (Allen, Leonard, et al.,
2018) epicentre is located ~ 2 km SE of the original GA location; it is unknown how this
location was derived.
The only published uncertainty values are in the GA_online catalogue (± 4 - 6 km) which
describe statistical uncertainty (precision) but not epistemic (accuracy). The mis-location of
seismological epicentres up to 17km from the surface rupture is a considered to be a
combination of epistemic uncertainties including the velocity model used by each agency.
These large epistemic uncertainties in epicentre location also effect foreshock and aftershock
locations (discussed below).
This paper prefers the magnitude (MW 5.2) of the recently published NSHA18 catalogue
(Allen, Leonard, et al., 2018) as they conduct a thorough and consistent reanalysis of
Australian magnitude values. This is slightly lower than the originally published Mw value
(5.4), but they are likely within error of each other (no magnitude uncertainty values are
published).
Table 1 : Published epicentre locations, depths and magnitudes
Reference Agency Latitude ± (km)
Longitude ± (km)
Depth (km)
± (km)
M1 M2
Clark et al (2014) GA -26.16 131.95 4 5.4 Mw 5.7 ML
GA online GA -26.124 ~6 132.124 ~4 0 16 5.4 Mw 5.7 ML
Clark et al (2014) GCMT -26.11 132.08 12 5.3 Mw 5.6 mb
Allen et al (2018) NSHA18 -26.178 131.971 10 5.18 Mw
Clark et al (2014) St Louis University
-26.07 132.12
20 5.3 Mw
Clark et al (2014) USGS -26.06 132.12 11 5.3 Mw 5.6 Mb
USGS online USGS -26.163 131.955 7 5.3 Mwc 5.7 ML
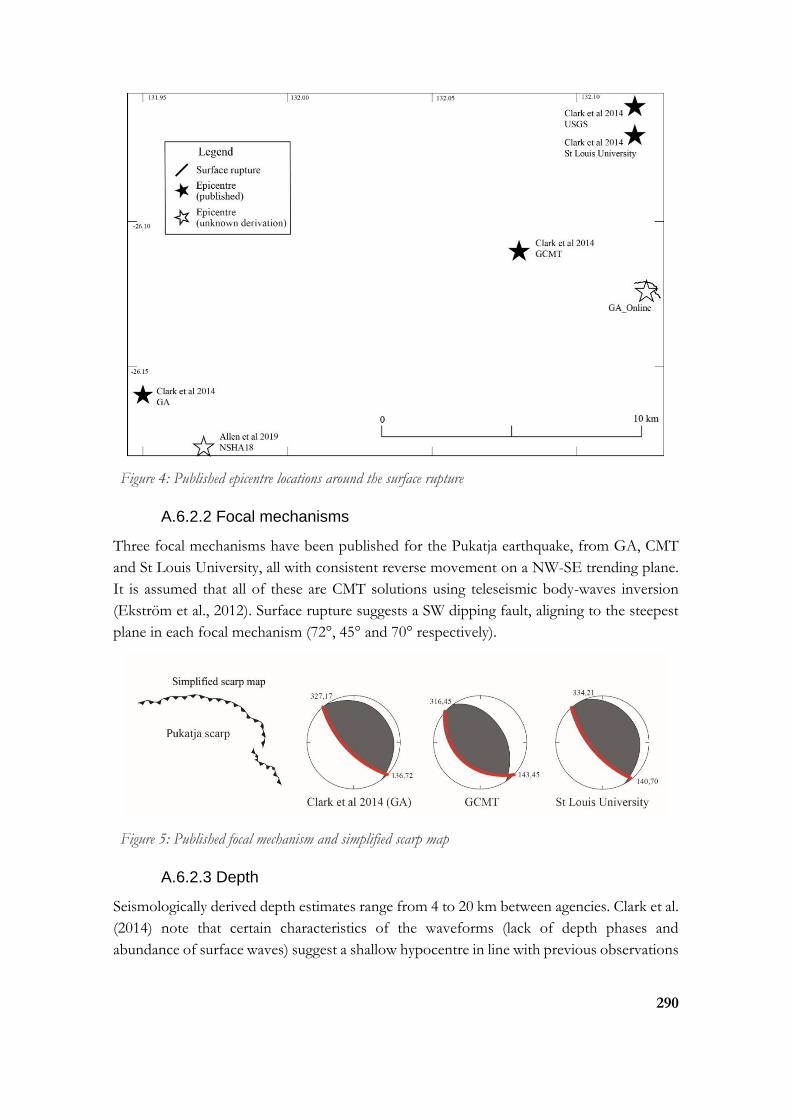
290
Figure 4: Published epicentre locations around the surface rupture
A.6.2.2 Focal mechanisms
Three focal mechanisms have been published for the Pukatja earthquake, from GA, CMT
and St Louis University, all with consistent reverse movement on a NW-SE trending plane.
It is assumed that all of these are CMT solutions using teleseismic body-waves inversion
(Ekström et al., 2012). Surface rupture suggests a SW dipping fault, aligning to the steepest
plane in each focal mechanism (72°, 45° and 70° respectively).
Figure 5: Published focal mechanism and simplified scarp map
A.6.2.3 Depth
Seismologically derived depth estimates range from 4 to 20 km between agencies. Clark et al.
(2014) note that certain characteristics of the waveforms (lack of depth phases and
abundance of surface waves) suggest a shallow hypocentre in line with previous observations

291
for historic Australian surface rupturing earthquakes. No specific seismological analysis of
hypocentral or centroid depth is available for this event.
A.6.2.4 Foreshock / aftershocks
Prior to 2012, the GA online catalogue shows five events in the 30 km surrounding the
Pukatja earthquake with four in 1985-1986, and one in 1995. Three of the events from 1986
have no magnitude estimates, and were likely poorly recorded earthquakes following the 1986
Marryat Creek surface rupturing earthquake. Clark et al. (2014) report two foreshocks of ML
3.9 and 4.3 in the two weeks prior to the mainshock, though only one of these events (ML
3.8, three days prior) is recorded in the GA catalogue.
In the fourteen months following the Pukatja earthquake, five earthquakes of ML 2.97 - 3.66
are recorded in the GA catalogue within a 22 km radius, with the closest 6.5 km to the south
of the rupture. Clark et al. (2014) report 39 small unlocatable aftershocks in the first 24 hrs
following the mainshock, and many subsequent aftershocks that cannot be accurately
located.
Fifteen months after the Pukatja earthquake, another Mw 5.7 event known as the Mulga Park
earthquake occurred 13 km to the west (Clark & Mcpherson, 2013). Three ML 2.9 - 3.3 2013
earthquakes are located 14 – 25 km north of both the Pukatja and Mulga Park earthquakes.
Four more earthquakes between ML 2.9 - 3.3 occurred in 2015, between 18 and 25 km north
of the two 2012-2013 events. In 2017, ML 2.9 and 3.6 earthquakes were recorded 4 and 6 km
west of the Mulga Park earthquake location. No seismicity has been recorded in the area
since 2017.
A.6.3 Surface Rupture
A.6.3.1 Authors / map quality
The Pukatja surface rupture occurred 17 km north of Pukatja community (also called
Ernabella), 420 km south of Alice Springs, which is within the Anangu Pitjantjatjara
Yankunytjatjara (APY) area of South Australia, making access dependant on permits. The
Pukatja surface rupture is described in Clark et al. (2014) with additional details in a
conference paper (Clark & Mcpherson, 2013). No InSAR was derived for this event due to
poor coverage over the earthquake location at the time. The map from Clark et al. (2014) is
digitised and available in GAs Neotectonics Database (Clark, 2012). The rupture is not visible
on Google or Bing satellite imagery. Bing satellite imagery does record rockfalls related to
the 2012 earthquake (Figure 10).
A.6.3.2 Length and shape
The Pukatja surface rupture has a highly arcuate concave shape (relative to the hanging-wall)
and the published length based on visible rupture is 1.6 km. Approximately 30 m from its
eastern most tip, the rupture has a ~55 m wide step-over, before continuing in a concave
direction towards the north and west.
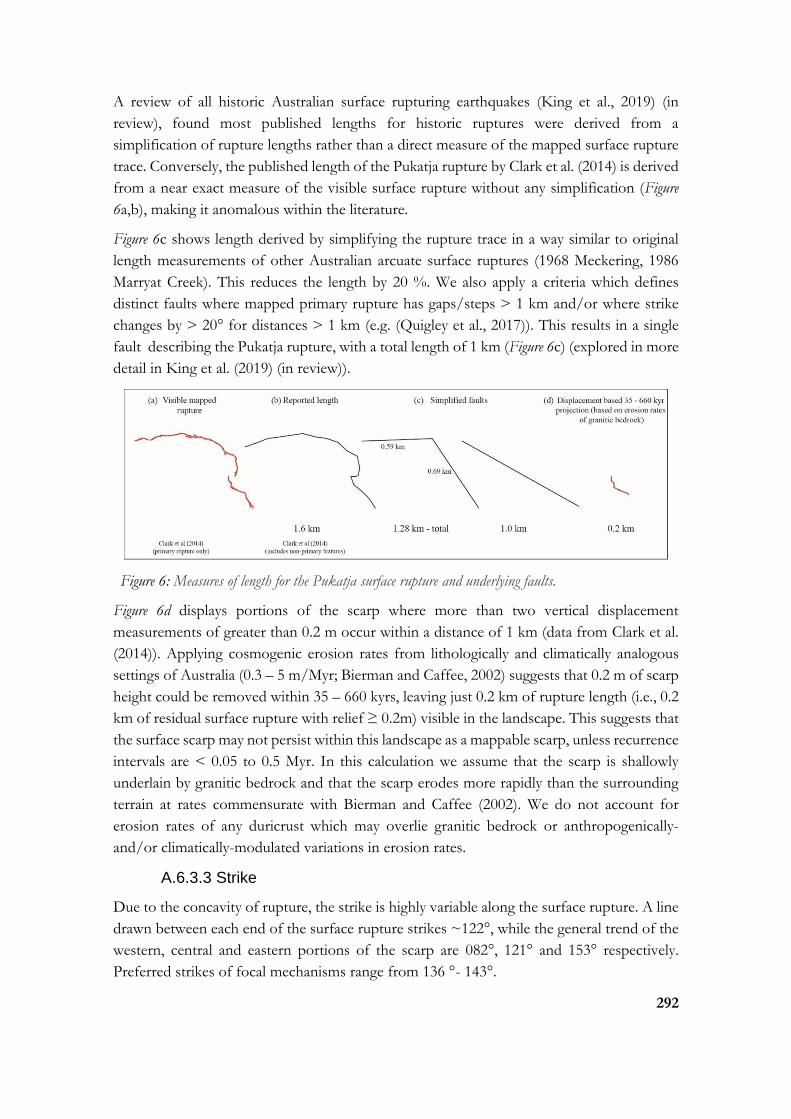
292
A review of all historic Australian surface rupturing earthquakes (King et al., 2019) (in
review), found most published lengths for historic ruptures were derived from a
simplification of rupture lengths rather than a direct measure of the mapped surface rupture
trace. Conversely, the published length of the Pukatja rupture by Clark et al. (2014) is derived
from a near exact measure of the visible surface rupture without any simplification (Figure
6a,b), making it anomalous within the literature.
Figure 6c shows length derived by simplifying the rupture trace in a way similar to original
length measurements of other Australian arcuate surface ruptures (1968 Meckering, 1986
Marryat Creek). This reduces the length by 20 %. We also apply a criteria which defines
distinct faults where mapped primary rupture has gaps/steps > 1 km and/or where strike
changes by > 20° for distances > 1 km (e.g. (Quigley et al., 2017)). This results in a single
fault describing the Pukatja rupture, with a total length of 1 km (Figure 6c) (explored in more
detail in King et al. (2019) (in review)).
Figure 6: Measures of length for the Pukatja surface rupture and underlying faults.
Figure 6d displays portions of the scarp where more than two vertical displacement
measurements of greater than 0.2 m occur within a distance of 1 km (data from Clark et al.
(2014)). Applying cosmogenic erosion rates from lithologically and climatically analogous
settings of Australia (0.3 – 5 m/Myr; Bierman and Caffee, 2002) suggests that 0.2 m of scarp
height could be removed within 35 – 660 kyrs, leaving just 0.2 km of rupture length (i.e., 0.2
km of residual surface rupture with relief ≥ 0.2m) visible in the landscape. This suggests that
the surface scarp may not persist within this landscape as a mappable scarp, unless recurrence
intervals are < 0.05 to 0.5 Myr. In this calculation we assume that the scarp is shallowly
underlain by granitic bedrock and that the scarp erodes more rapidly than the surrounding
terrain at rates commensurate with Bierman and Caffee (2002). We do not account for
erosion rates of any duricrust which may overlie granitic bedrock or anthropogenically-
and/or climatically-modulated variations in erosion rates.
A.6.3.3 Strike
Due to the concavity of rupture, the strike is highly variable along the surface rupture. A line
drawn between each end of the surface rupture strikes ~122°, while the general trend of the
western, central and eastern portions of the scarp are 082°, 121° and 153° respectively.
Preferred strikes of focal mechanisms range from 136 °- 143°.
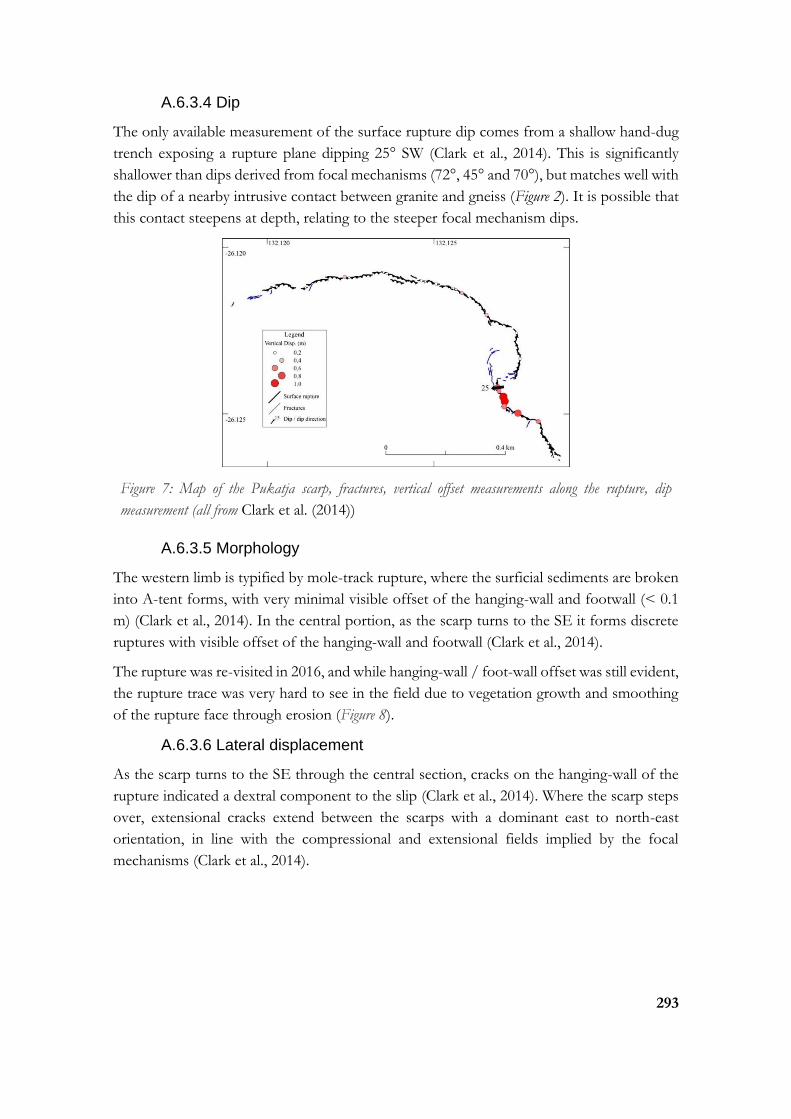
293
A.6.3.4 Dip
The only available measurement of the surface rupture dip comes from a shallow hand-dug
trench exposing a rupture plane dipping 25° SW (Clark et al., 2014). This is significantly
shallower than dips derived from focal mechanisms (72°, 45° and 70°), but matches well with
the dip of a nearby intrusive contact between granite and gneiss (Figure 2). It is possible that
this contact steepens at depth, relating to the steeper focal mechanism dips.
Figure 7: Map of the Pukatja scarp, fractures, vertical offset measurements along the rupture, dip
measurement (all from Clark et al. (2014))
A.6.3.5 Morphology
The western limb is typified by mole-track rupture, where the surficial sediments are broken
into A-tent forms, with very minimal visible offset of the hanging-wall and footwall (< 0.1
m) (Clark et al., 2014). In the central portion, as the scarp turns to the SE it forms discrete
ruptures with visible offset of the hanging-wall and footwall (Clark et al., 2014).
The rupture was re-visited in 2016, and while hanging-wall / foot-wall offset was still evident,
the rupture trace was very hard to see in the field due to vegetation growth and smoothing
of the rupture face through erosion (Figure 8).
A.6.3.6 Lateral displacement
As the scarp turns to the SE through the central section, cracks on the hanging-wall of the
rupture indicated a dextral component to the slip (Clark et al., 2014). Where the scarp steps
over, extensional cracks extend between the scarps with a dominant east to north-east
orientation, in line with the compressional and extensional fields implied by the focal
mechanisms (Clark et al., 2014).
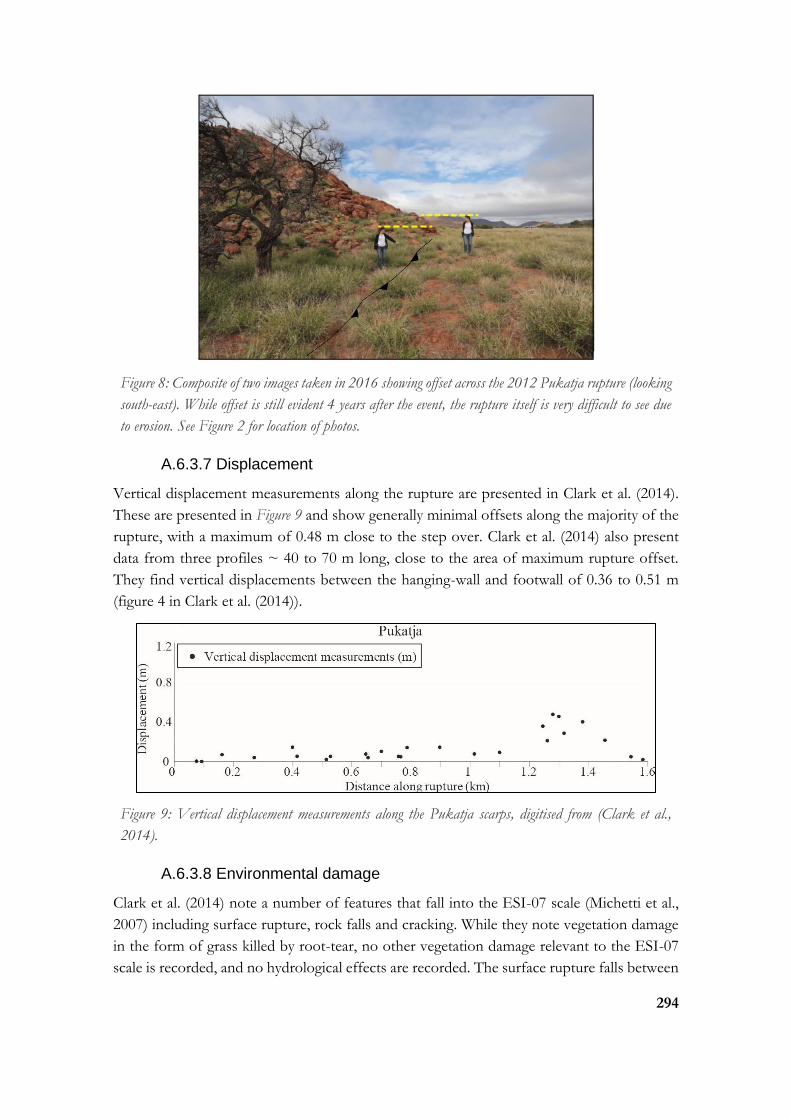
294
Figure 8: Composite of two images taken in 2016 showing offset across the 2012 Pukatja rupture (looking
south-east). While offset is still evident 4 years after the event, the rupture itself is very difficult to see due
to erosion. See Figure 2 for location of photos.
A.6.3.7 Displacement
Vertical displacement measurements along the rupture are presented in Clark et al. (2014).
These are presented in Figure 9 and show generally minimal offsets along the majority of the
rupture, with a maximum of 0.48 m close to the step over. Clark et al. (2014) also present
data from three profiles ~ 40 to 70 m long, close to the area of maximum rupture offset.
They find vertical displacements between the hanging-wall and footwall of 0.36 to 0.51 m
(figure 4 in Clark et al. (2014)).
Figure 9: Vertical displacement measurements along the Pukatja scarps, digitised from (Clark et al.,
2014).
A.6.3.8 Environmental damage
Clark et al. (2014) note a number of features that fall into the ESI-07 scale (Michetti et al.,
2007) including surface rupture, rock falls and cracking. While they note vegetation damage
in the form of grass killed by root-tear, no other vegetation damage relevant to the ESI-07
scale is recorded, and no hydrological effects are recorded. The surface rupture falls between
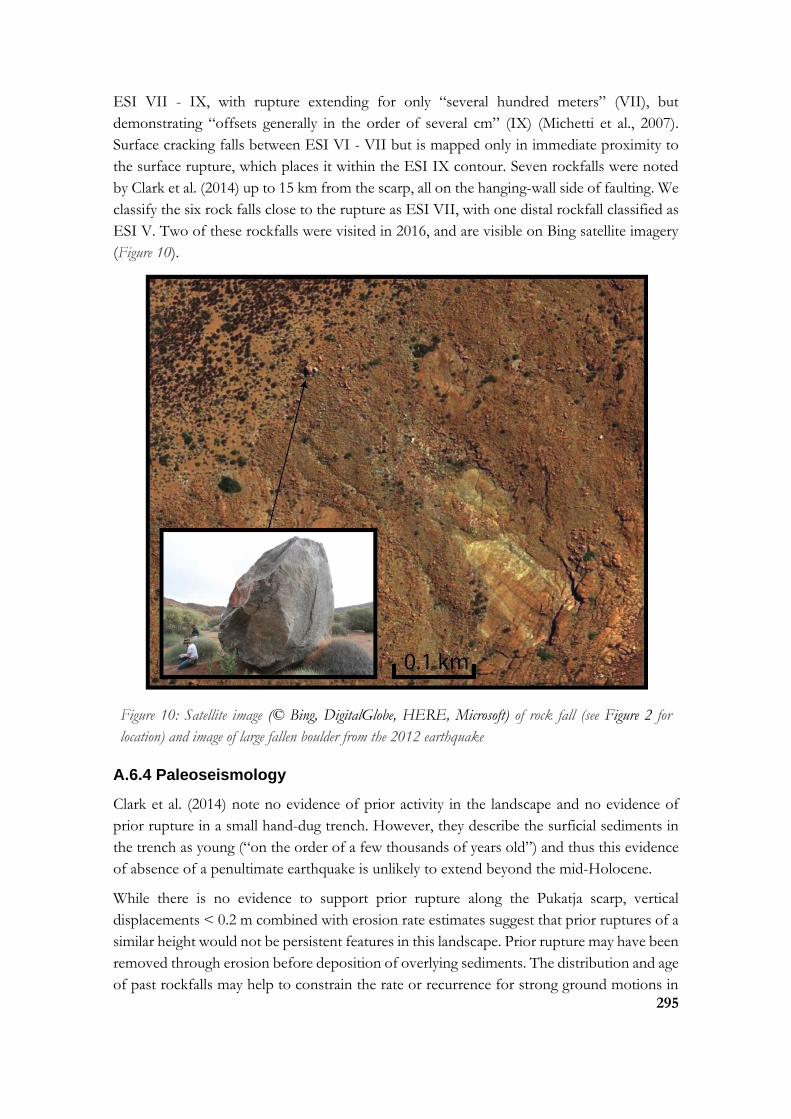
295
ESI VII - IX, with rupture extending for only “several hundred meters” (VII), but
demonstrating “offsets generally in the order of several cm” (IX) (Michetti et al., 2007).
Surface cracking falls between ESI VI - VII but is mapped only in immediate proximity to
the surface rupture, which places it within the ESI IX contour. Seven rockfalls were noted
by Clark et al. (2014) up to 15 km from the scarp, all on the hanging-wall side of faulting. We
classify the six rock falls close to the rupture as ESI VII, with one distal rockfall classified as
ESI V. Two of these rockfalls were visited in 2016, and are visible on Bing satellite imagery
(Figure 10).
Figure 10: Satellite image (© Bing, DigitalGlobe, HERE, Microsoft) of rock fall (see Figure 2 for
location) and image of large fallen boulder from the 2012 earthquake
A.6.4 Paleoseismology
Clark et al. (2014) note no evidence of prior activity in the landscape and no evidence of
prior rupture in a small hand-dug trench. However, they describe the surficial sediments in
the trench as young (“on the order of a few thousands of years old”) and thus this evidence
of absence of a penultimate earthquake is unlikely to extend beyond the mid-Holocene.
While there is no evidence to support prior rupture along the Pukatja scarp, vertical
displacements < 0.2 m combined with erosion rate estimates suggest that prior ruptures of a
similar height would not be persistent features in this landscape. Prior rupture may have been
removed through erosion before deposition of overlying sediments. The distribution and age
of past rockfalls may help to constrain the rate or recurrence for strong ground motions in
296
the area exceeding a certain threshold, providing some constraint on recurrence in the
absence of topographic or trenching evidence.
A.6.5 Summary
A.6.5.1 Surface rupture relationship to Geology
At the eastern edge of the rupture, a large outcrop of granite occurs in a hill on the footwall,
with a smaller outcrop on the hanging-wall. The step over in the rupture occurs coincident
with this gap between the main outcrop and smaller outcrop. A lithological contact between
the granitoid and granulite facies gneisses is mapped in the outcrop, dipping SW 30°. A
projection of this lithological contact coincides with where rupture curves from a northerly
trend (the eastern segment) to an E-W trend (central and western segments), matching the
strike of the intrusive contact as seen in outcrop and as a arcuate magnetic anomaly. Surface
geology and geophysical data suggest a strong bedrock lithological control on the historic
rupture.
A.6.5.2 Relationship to Seismology
Clark et al. (2014) derive a fault area in the order of 4.3 (L) × 3.4 (W) km (14.6 km2) using
scaling relationships of Leonard (2010). This length is 63 – 77% longer than observed surface
rupture length. There is also a discrepancy between the dip measured along the surface
rupture (25°) and the fault dip derived by focal mechanisms (72°, 45° and 70°).
Other historic surface rupturing events that are highly arcuate (1968 Meckering, 1986
Marryat Creek) have P-wave first motion focal mechanisms that suggest rupture may have
initiated on a minor fault before propagating through a fault intersection to produce the
centroid moment tensor, mainshock event and surface rupture. Available focal mechanism
for the Pukatja event describe a centroid that best matches the SE section of scarp. No P-
wave first motion focal mechanisms are published, but they may help to constrain a rupture
model for the Pukatja event. There are currently no published seismological or slip modelling
data which help to constrain a fault rupture model for this event, or to resolve the
discrepancies between surface observations and available seismological data.

297
7. Review paper: The 20th May 2016 Mw 6.1 Petermann surface rupturing earthquake, Australia
Tamarah King
School of Earth Sciences, The University of Melbourne, Victoria 3010, Australia
https://orcid.org/0000-0002-9654-2917
Mark Quigley
School of Earth Sciences, The University of Melbourne, Victoria 3010, Australia
https://orcid.org/0000-0002-4430-4212
Dan Clark
Geoscience Australia, Canberra 2601, Australia
https://orcid.org/0000-0001-5387-4404
Abstract
The 20th May 2016 Mw 6.1 Petermann earthquake produced a 21 km long surface rupture
with a maximum vertical offset of 0.9 m. Geological and geophysical data provide strong
evidence that rupture occurred along a mylonite foliation plane with an orientation defined
by deformation from the nearby Woodroffe Thrust, a major Neoproterozoic terrane suture.
The most geologically and seismologically reasonable fault model involves 2 bedrock-
controlled faults with slightly oblique orientations. In this model, rupture propagates from a
hypocentre at ≤ 4 km depth, with a centroid of slip located at the inferred intersection of the
two faults at 1 km depth. No evidence of prior rupture has been identified in the landscape
or in shallow trenches crossing the rupture.
A.7.1 Geology
A.7.1.1 Regional / background
The 2016 Petermann, 2012 Pukatja and 1986 Marryat Creek surface rupturing earthquakes
occurred within the Musgrave Block, a Mesoproterozoic basement assemblage that extends
across the Northern Territory / South Australia border into Western Australia (Figure 1).
This block is composed of high grade metamorphic and magmatic suites formed during the
~1200 Ma Musgrave orogen and reworked during the 580 - 520 Ma Petermann Orogeny
(Edgoose et al., 2004; Cawood & Korsch, 2008; Aitken & Betts, 2009; Raimondo et al., 2010).
Two large structures, the Woodroffe Thrust and Mann Fault, dominated uplift and
deformation during the Petermann Orogeny (Lambeck & Burgess, 1992; Stewart, 1995;
Neumann, 2013; Wex et al., 2019). The Woodroffe Thrust was responsible for significant
exhumation of lower-crustal rocks, displacing the Moho by ~20 km associated with a
present-day large gravitational and magnetic anomaly (Korsch et al., 1998; Hand & Sandiford,
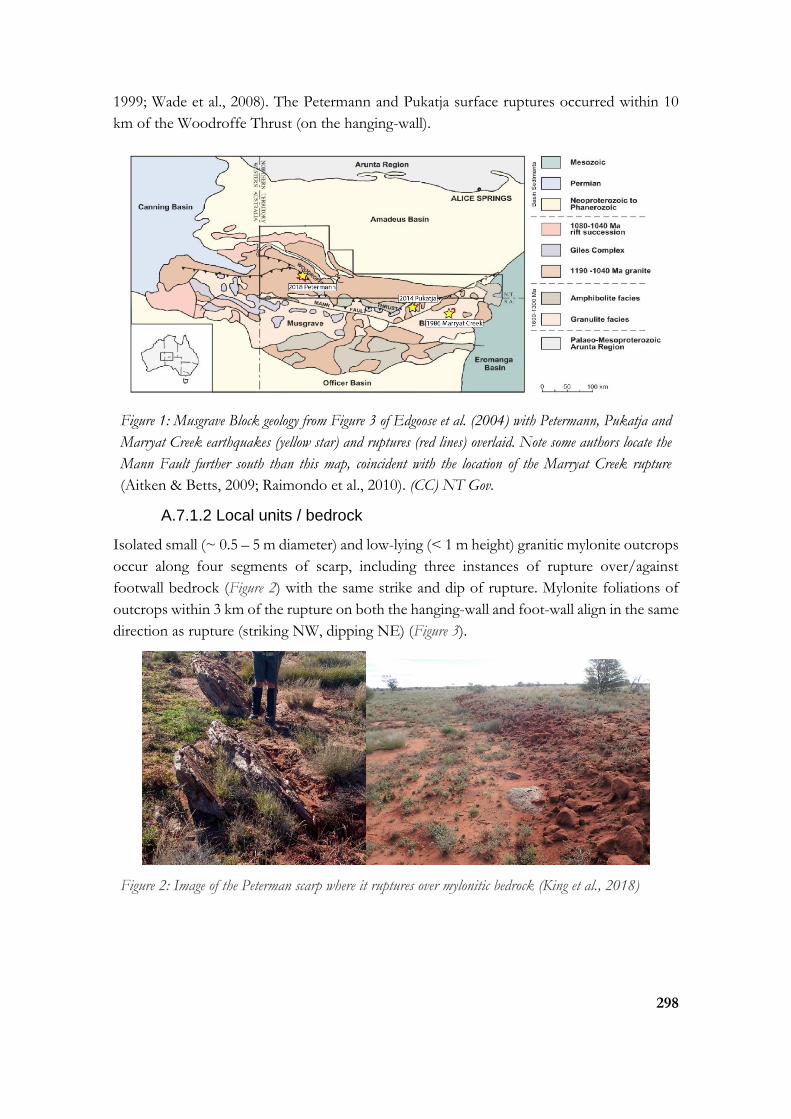
298
1999; Wade et al., 2008). The Petermann and Pukatja surface ruptures occurred within 10
km of the Woodroffe Thrust (on the hanging-wall).
Figure 1: Musgrave Block geology from Figure 3 of Edgoose et al. (2004) with Petermann, Pukatja and
Marryat Creek earthquakes (yellow star) and ruptures (red lines) overlaid. Note some authors locate the
Mann Fault further south than this map, coincident with the location of the Marryat Creek rupture
(Aitken & Betts, 2009; Raimondo et al., 2010). (CC) NT Gov.
A.7.1.2 Local units / bedrock
Isolated small (~ 0.5 – 5 m diameter) and low-lying (< 1 m height) granitic mylonite outcrops
occur along four segments of scarp, including three instances of rupture over/against
footwall bedrock (Figure 2) with the same strike and dip of rupture. Mylonite foliations of
outcrops within 3 km of the rupture on both the hanging-wall and foot-wall align in the same
direction as rupture (striking NW, dipping NE) (Figure 3).
Figure 2: Image of the Peterman scarp where it ruptures over mylonitic bedrock (King et al., 2018)
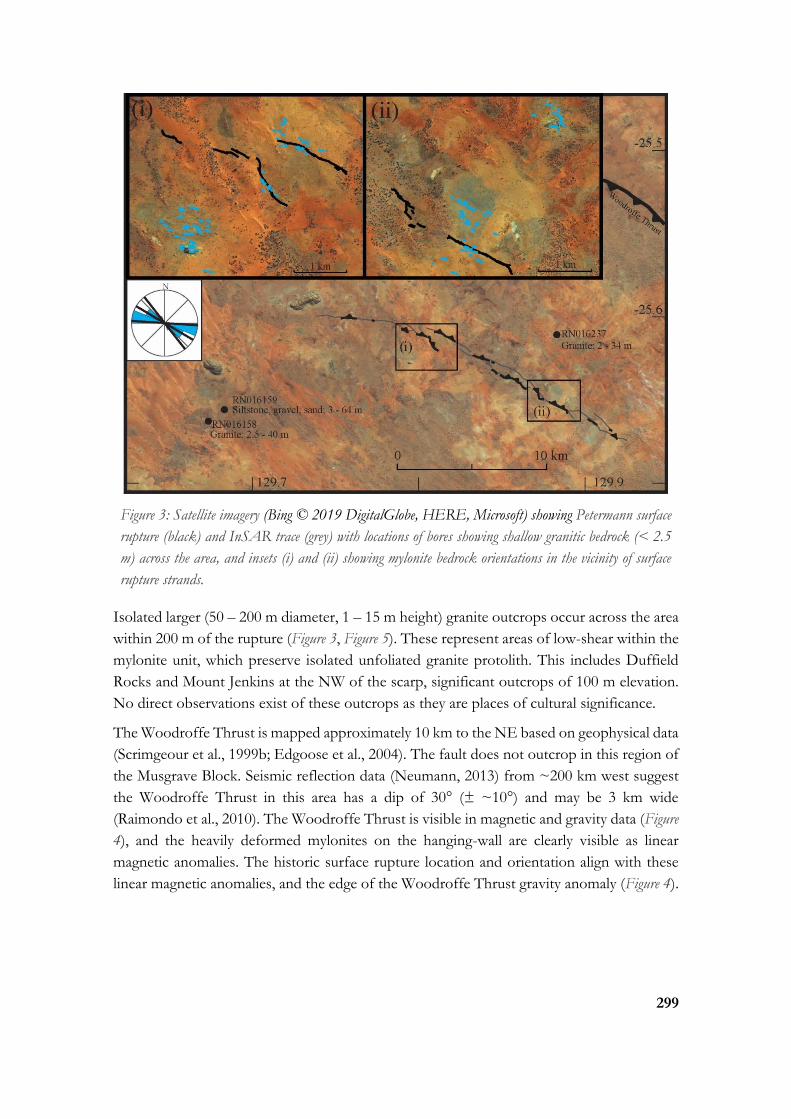
299
Figure 3: Satellite imagery (Bing © 2019 DigitalGlobe, HERE, Microsoft) showing Petermann surface
rupture (black) and InSAR trace (grey) with locations of bores showing shallow granitic bedrock (< 2.5
m) across the area, and insets (i) and (ii) showing mylonite bedrock orientations in the vicinity of surface
rupture strands.
Isolated larger (50 – 200 m diameter, 1 – 15 m height) granite outcrops occur across the area
within 200 m of the rupture (Figure 3, Figure 5). These represent areas of low-shear within the
mylonite unit, which preserve isolated unfoliated granite protolith. This includes Duffield
Rocks and Mount Jenkins at the NW of the scarp, significant outcrops of 100 m elevation.
No direct observations exist of these outcrops as they are places of cultural significance.
The Woodroffe Thrust is mapped approximately 10 km to the NE based on geophysical data
(Scrimgeour et al., 1999b; Edgoose et al., 2004). The fault does not outcrop in this region of
the Musgrave Block. Seismic reflection data (Neumann, 2013) from ~200 km west suggest
the Woodroffe Thrust in this area has a dip of 30° (± ~10°) and may be 3 km wide
(Raimondo et al., 2010). The Woodroffe Thrust is visible in magnetic and gravity data (Figure
4), and the heavily deformed mylonites on the hanging-wall are clearly visible as linear
magnetic anomalies. The historic surface rupture location and orientation align with these
linear magnetic anomalies, and the edge of the Woodroffe Thrust gravity anomaly (Figure 4).

300
Figure 4: Petermann scarp (black lines) relative to magnetic intensity and bouguer gravity anomaly maps.
National bouguer gravity anomaly map: http://pid.geoscience.gov.au/dataset/ga/101104; National
total magnetic intensity map: http://pid.geoscience.gov.au/dataset/ga/89596
A.7.1.3 Surficial deposits
Stable Pleistocene sand dunes up to 8 m high aligned NE-SW cover the area. Colluvium and
calcrete exist in the inter-dune areas between, and covering, bedrock outcrops (Figure 5).
Figure 5: Crop of Petermann 1:250 000 geological map sheet (Scrimgeour et al., 1999a) showing
basement and surface sediments around the Petermann surface rupture. Full map and legend available
from: https://geoscience.nt.gov.au/gemis/, (CC) NT Gov.
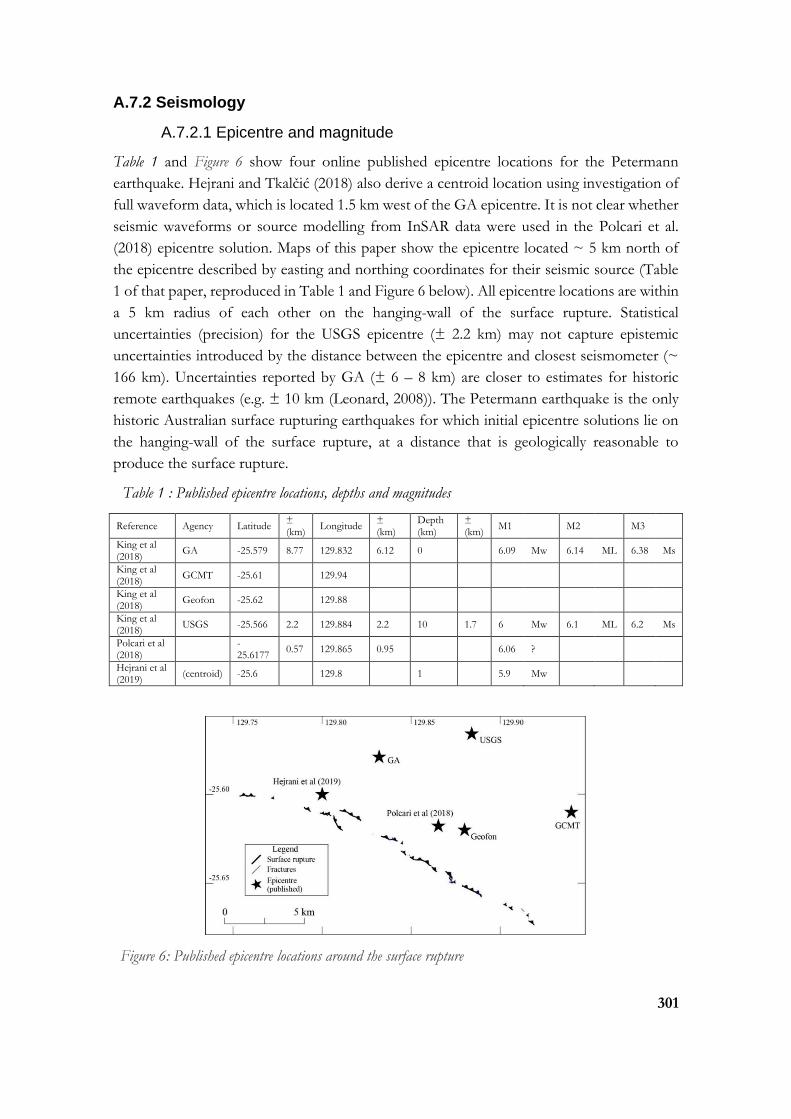
301
A.7.2 Seismology
A.7.2.1 Epicentre and magnitude
Table 1 and Figure 6 show four online published epicentre locations for the Petermann
earthquake. Hejrani and Tkalčić (2018) also derive a centroid location using investigation of
full waveform data, which is located 1.5 km west of the GA epicentre. It is not clear whether
seismic waveforms or source modelling from InSAR data were used in the Polcari et al.
(2018) epicentre solution. Maps of this paper show the epicentre located ~ 5 km north of
the epicentre described by easting and northing coordinates for their seismic source (Table
1 of that paper, reproduced in Table 1 and Figure 6 below). All epicentre locations are within
a 5 km radius of each other on the hanging-wall of the surface rupture. Statistical
uncertainties (precision) for the USGS epicentre (± 2.2 km) may not capture epistemic
uncertainties introduced by the distance between the epicentre and closest seismometer (~
166 km). Uncertainties reported by GA (± 6 – 8 km) are closer to estimates for historic
remote earthquakes (e.g. ± 10 km (Leonard, 2008)). The Petermann earthquake is the only
historic Australian surface rupturing earthquakes for which initial epicentre solutions lie on
the hanging-wall of the surface rupture, at a distance that is geologically reasonable to
produce the surface rupture.
Table 1 : Published epicentre locations, depths and magnitudes
Reference Agency Latitude ± (km)
Longitude ± (km)
Depth (km)
± (km)
M1 M2 M3
King et al (2018)
GA -25.579 8.77 129.832 6.12 0 6.09 Mw 6.14 ML 6.38 Ms
King et al (2018)
GCMT -25.61 129.94
King et al (2018)
Geofon -25.62 129.88
King et al (2018)
USGS -25.566 2.2 129.884 2.2 10 1.7 6 Mw 6.1 ML 6.2 Ms
Polcari et al (2018)
-25.6177
0.57 129.865 0.95 6.06 ?
Hejrani et al (2019)
(centroid) -25.6 129.8 1 5.9 Mw
Figure 6: Published epicentre locations around the surface rupture
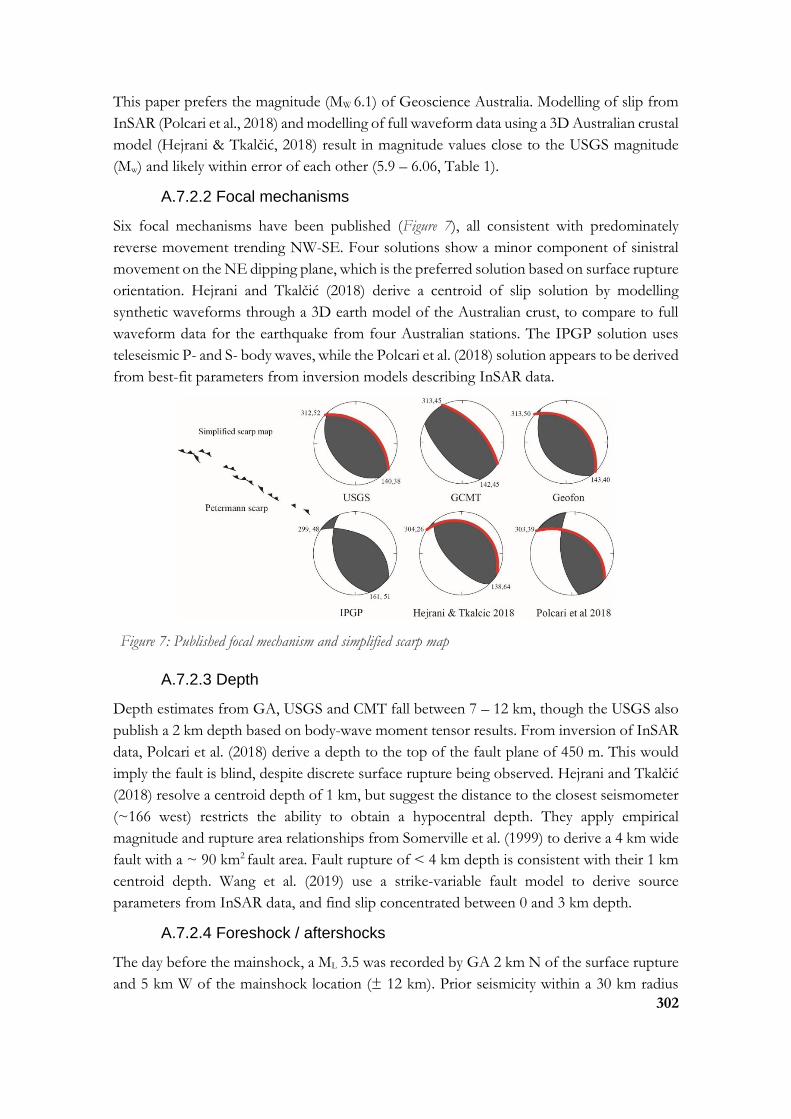
302
This paper prefers the magnitude (MW 6.1) of Geoscience Australia. Modelling of slip from
InSAR (Polcari et al., 2018) and modelling of full waveform data using a 3D Australian crustal
model (Hejrani & Tkalčić, 2018) result in magnitude values close to the USGS magnitude
(Mw) and likely within error of each other (5.9 – 6.06, Table 1).
A.7.2.2 Focal mechanisms
Six focal mechanisms have been published (Figure 7), all consistent with predominately
reverse movement trending NW-SE. Four solutions show a minor component of sinistral
movement on the NE dipping plane, which is the preferred solution based on surface rupture
orientation. Hejrani and Tkalčić (2018) derive a centroid of slip solution by modelling
synthetic waveforms through a 3D earth model of the Australian crust, to compare to full
waveform data for the earthquake from four Australian stations. The IPGP solution uses
teleseismic P- and S- body waves, while the Polcari et al. (2018) solution appears to be derived
from best-fit parameters from inversion models describing InSAR data.
Figure 7: Published focal mechanism and simplified scarp map
A.7.2.3 Depth
Depth estimates from GA, USGS and CMT fall between 7 – 12 km, though the USGS also
publish a 2 km depth based on body-wave moment tensor results. From inversion of InSAR
data, Polcari et al. (2018) derive a depth to the top of the fault plane of 450 m. This would
imply the fault is blind, despite discrete surface rupture being observed. Hejrani and Tkalčić
(2018) resolve a centroid depth of 1 km, but suggest the distance to the closest seismometer
(~166 west) restricts the ability to obtain a hypocentral depth. They apply empirical
magnitude and rupture area relationships from Somerville et al. (1999) to derive a 4 km wide
fault with a ~ 90 km2 fault area. Fault rupture of < 4 km depth is consistent with their 1 km
centroid depth. Wang et al. (2019) use a strike-variable fault model to derive source
parameters from InSAR data, and find slip concentrated between 0 and 3 km depth.
A.7.2.4 Foreshock / aftershocks
The day before the mainshock, a ML 3.5 was recorded by GA 2 km N of the surface rupture
and 5 km W of the mainshock location (± 12 km). Prior seismicity within a 30 km radius

303
includes four ML 3.2 - 4.4 events between 1986 - 1993, 24 – 27 km north of the epicentre. It
is estimated that the GA catalogue is complete for ML >3.5 by ~1980 (Leonard, 2008)
however epicentres in this remote area have large epistemic uncertainties resulting in
inaccurate locations. This is exemplified by mis-location of the 2012 Pukajta earthquake
epicentre 17 km away from the surface rupture location, and the 1986 Musgrave earthquake
30 km away from its surface rupture.
A temporary seismometer array was deployed by GA within 3 days of the mainshock, with
extra seismometers added to the network by University of Melbourne seismologists
approximately two weeks later. For the 15 months that this array was deployed and active,
hundreds of aftershocks were recorded, though only 143 have been located to date. Of those
located aftershocks, 65 have depths, shown in Figure 1 of King et al. (2018). These project
to a 2D plane dipping 10° - 30° that does not project to the surface at the location of surface
rupture. This may be due to (a) mainshock rupture propagating along the plane defined by
aftershocks but changing to a different plane in the near-surface, producing the surface
rupture at that location (b) rupture propagating upwards along the plane defined by
aftershocks with the plane significantly steepening close to the surface rupture (c) aftershocks
do not define the mainshock fault plane, but represent redistribution of stress on adjacent
foliation planes (d) aftershocks occurred on multiple planes that are not well imaged when
aftershocks are projected to a 2D plane. Available aftershock data may be affected by
selection bias, as not all of the data from the temporary seismometer array has been processed
yet.
A.7.3 Surface Rupture
A.7.3.1 Authors / map quality
The Petermann surface rupture occurred 156 km away from Yulara (Uluru) with access via
a dirt track which runs between Yulara and the APY lands near the NT/SA
/WA border. The area is protected under the Indigenous land rights act. At the time of
writing, one paper has been published on ground observations from the Petermann
earthquake (King et al., 2018), and one of InSAR deformation defining a surface rupture
(Polcari et al., 2018). Gold et al. (2017) describes a Worldview (c) satellite derived surface
rupture trace, this data is currently in review for publication.
A.7.3.2 Length and shape
The Petermann surface rupture was mapped by field work, satellite and drone imagery (Figure
8a) defining a 20.3 km long rupture from tip to tip along a simplified trace (Figure 8b). The
scarp consists of two main rupture strands with a 1.2 km long overlap ~ 8 km from its north-
western most tip which define a slightly convex shape (relative to the hanging-wall). The
distance between scarp strands at this step over is 0.6 – 0.8 km. The visible rupture trace is
highly discontinuous relative to the trace defined by InSAR (Figure 8a). The trace of InSAR
displacement also extends 1.4 km longer than visible rupture at the north-western end and

304
0.6 km longer at the south-eastern end (Figure 8a). The InSAR length end to end along a
simplified trace is 22.6 km (Figure 8b), 10% longer than the visible rupture simplified length.
Applying a criteria which simplifies ruptures to straight traces and defines distinct faults
where mapped primary rupture has gaps/steps > 1 km and/or where strike changes by >
20° for distances > 1 km (c.f., (Quigley et al., 2017)) results in three faults for visible rupture
length with a sum length of 21 km, and two faults for InSAR with a sum length of 21.5 km
(Figure 8c). The specified criteria separate the north-western strand of visible rupture into
two faults with a short 1 km section at the location of step-over, due to an inter-rupture angle
> 20°. We prefer a fault model where this section is a single fault based on the InSAR trace
and the length of this segment which only just reaches the criteria (1.02 km). In our preferred
model, the Petermann rupture defines two faults with a sum length of 21 km.
Figure 8; Measures of length for the Petermann rupture as described in the text
Figure 8d maps portions of the scarp where more than two vertical displacement
measurements of greater than 0.2 m occur within a distance of 1 km (data from Attanayake
et al. (2019) and Gold et al. (2019) in review). Applying cosmogenic erosion rates from
lithologically and climatically analogous settings of Australia (0.3 – 5 m/Myr; Bierman and
Caffee, 2002) suggests that 0.2 m of scarp height could be removed within 35 – 660 kyrs,
leaving ~ 12.2 km of rupture length visible in the landscape (this is a sum length of four
discontinuous rupture traces which show offsets > 0.2 m) (Figure 8d). This suggests that the
surface scarp may not persist within this landscape as a mappable scarp, unless recurrence
intervals are < 0.5 to 1 Myr. Due to the climate and geography of the rupture location, we
prefer a degradation rate on the longer end of this range. In this calculation we assume that
the scarp is shallowly underlain by granitic bedrock and that the scarp erodes more rapidly
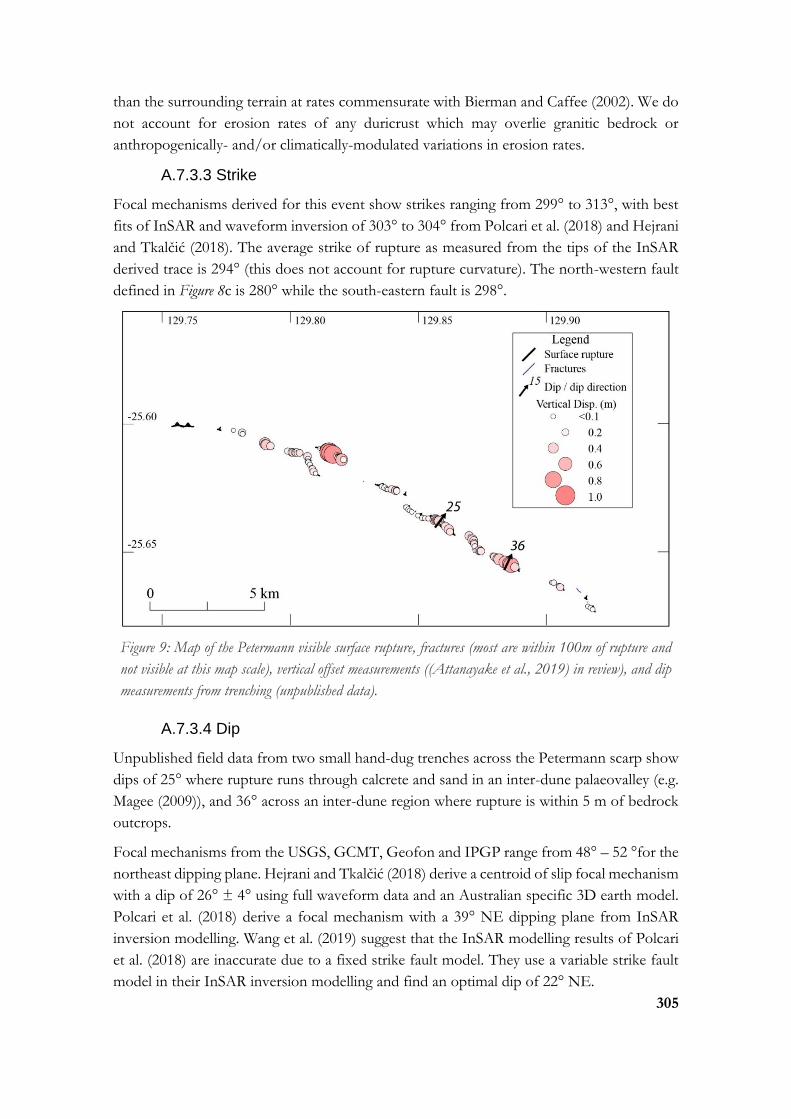
305
than the surrounding terrain at rates commensurate with Bierman and Caffee (2002). We do
not account for erosion rates of any duricrust which may overlie granitic bedrock or
anthropogenically- and/or climatically-modulated variations in erosion rates.
A.7.3.3 Strike
Focal mechanisms derived for this event show strikes ranging from 299° to 313°, with best
fits of InSAR and waveform inversion of 303° to 304° from Polcari et al. (2018) and Hejrani
and Tkalčić (2018). The average strike of rupture as measured from the tips of the InSAR
derived trace is 294° (this does not account for rupture curvature). The north-western fault
defined in Figure 8c is 280° while the south-eastern fault is 298°.
Figure 9: Map of the Petermann visible surface rupture, fractures (most are within 100m of rupture and
not visible at this map scale), vertical offset measurements ((Attanayake et al., 2019) in review), and dip
measurements from trenching (unpublished data).
A.7.3.4 Dip
Unpublished field data from two small hand-dug trenches across the Petermann scarp show
dips of 25° where rupture runs through calcrete and sand in an inter-dune palaeovalley (e.g.
Magee (2009)), and 36° across an inter-dune region where rupture is within 5 m of bedrock
outcrops.
Focal mechanisms from the USGS, GCMT, Geofon and IPGP range from 48° – 52 °for the
northeast dipping plane. Hejrani and Tkalčić (2018) derive a centroid of slip focal mechanism
with a dip of 26° ± 4° using full waveform data and an Australian specific 3D earth model.
Polcari et al. (2018) derive a focal mechanism with a 39° NE dipping plane from InSAR
inversion modelling. Wang et al. (2019) suggest that the InSAR modelling results of Polcari
et al. (2018) are inaccurate due to a fixed strike fault model. They use a variable strike fault
model in their InSAR inversion modelling and find an optimal dip of 22° NE.

306
Aftershocks define a plane dipping 10° - 30° that does not intersect with surface rupture, or
a dip of 30° – 40° if the plane defined by aftershocks is forced to intersect with the surface
rupture.
Figure 10: Images of the Petermann scarp where (a) scarp consists of moletrack style rupture through loose
calcrete and sand (b) drone-derived imagery showing 5 – 10 m left stepping rupture connected by ramps (c)
satellite view (Bing © 2019 DigitalGlobe, HERE, Microsoft) showing effect of sand dunes on visible
surface rupture trace relative to InSAR trace.
A.7.3.5 Morphology
As described in King et al. (2018), offset of the hanging-wall relative to the footwall was
observable as discrete rupture, mole tracks (Figure 10a) and warping or folding of the hanging-
wall sediments over the footwall sediments (e.g. Figure 4 of King et al. (2018)). Rupture is
discontinuous in the field with variable strike and morphology on a smaller scale (i.e. 100 -
101 m). Discrete rupture was observed to progress into gentle warping or mole-tracks at the
ends of segments, often terminating at the edges of sand dunes (Figure 10c). Figure 4 of King
et al. (2018) shows duplexing discrete ruptures stepping backwards on the hanging-wall, with
(a) (b)
(c)

307
most offset captured by the furthest strand (relative to the hanging-wall). Discrete rupture
was also evident as rupture steps with limited overlap of sections (Figure 10b) separated by
ramps. Where rupture passed through significant sand dunes (Figure 10c) it became difficult
to see in the field and optical imagery (satellite, drone) (King et al., 2018). InSAR shows
vertical offsets near the NW end of rupture that are not visible in the field, potentially due
to deformation being distributed across a broader area (e.g. tens to hundreds of meters)
rather than a discrete scarp.
A.7.3.6 Lateral offsets
No detailed analysis of kinematics based on surface observations has been published, though
three of five focal mechanisms show a minor sinistral component. The only linear features
crossing the scarp are a single camel track (Figure 11) and the vehicle track in the NW, neither
of which had observable lateral offsets.
Figure 11: Image of a camel track that crosses the Petermann scarp, the only linear feature offset by rupture,
which shows no clear sign of lateral displacement
A.7.3.7 Displacement
King et al. (2018) describe highly variable vertical offset along the visible surface rupture
traces, with offset measurements from 0.05 -0.9 m shown in Figure 4 (measured with an
RTK GPS). The Gold et al. (2017) abstract describes vertical offsets between 0.2 - 0.6 m
using pre- and post- event digital terrain models derived from Worldview satellite imagery.
Unlike the RTK measurements which record offset only at the surface rupture interface, the
satellite data show vertical offsets across 0.1 – 1 km lengths across the rupture, and therefore
capture some distributed deformation.
ALOS-2 ascending wrapped interferograms and displacement maps show ~60 cm of
displacement on the hanging-wall and ~12 cm displacement on the footwall (Polcari et al.,
2018) while the Sentinel-1 descending data show 13 cm hanging-wall, and 6 cm footwall
displacement. The differences in these measures derive from the different line of sights
(LOS) for the satellites with the ALOS-2 LOS ~140° from the rupture (almost
perpendicular) and Sentinel-1 LOS ~10° from the rupture (almost parallel). Displacements
measured by InSAR show a combined vertical, lateral and heave measurement. InSAR shows
that displacement extends for ~7 km on the hanging-wall and ~3 km on the footwall away
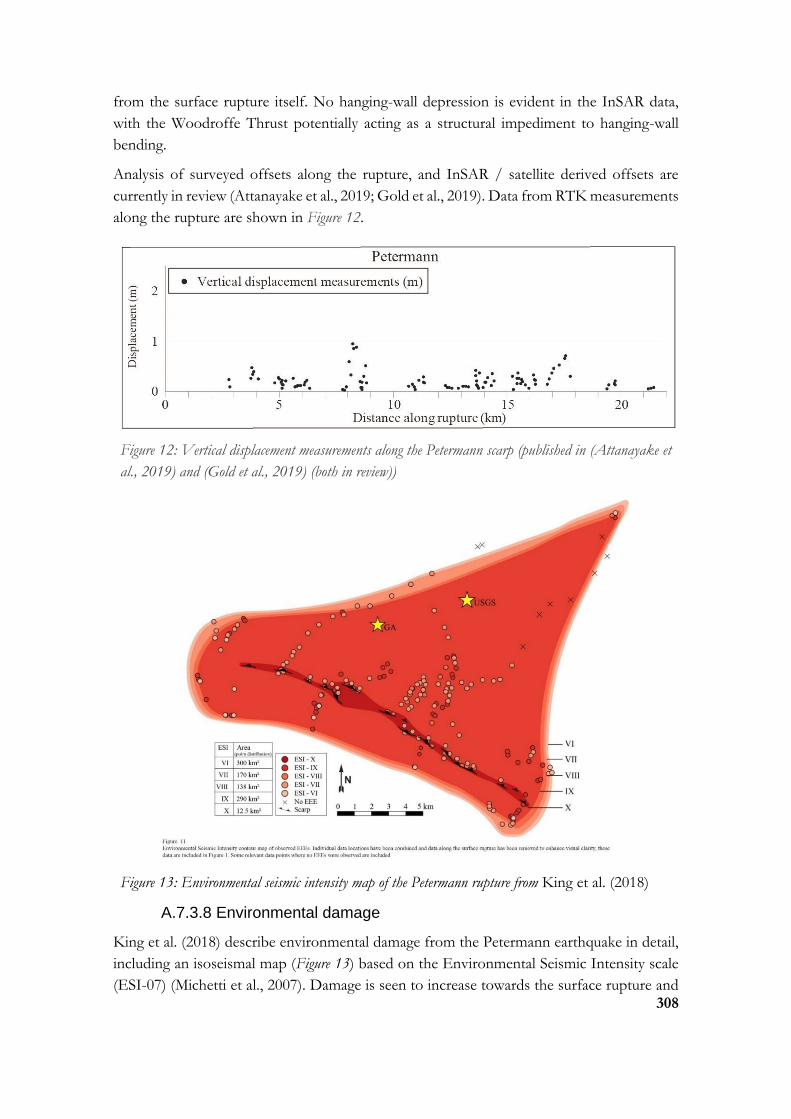
308
from the surface rupture itself. No hanging-wall depression is evident in the InSAR data,
with the Woodroffe Thrust potentially acting as a structural impediment to hanging-wall
bending.
Analysis of surveyed offsets along the rupture, and InSAR / satellite derived offsets are
currently in review (Attanayake et al., 2019; Gold et al., 2019). Data from RTK measurements
along the rupture are shown in Figure 12.
Figure 12: Vertical displacement measurements along the Petermann scarp (published in (Attanayake et
al., 2019) and (Gold et al., 2019) (both in review))
Figure 13: Environmental seismic intensity map of the Petermann rupture from King et al. (2018)
A.7.3.8 Environmental damage
King et al. (2018) describe environmental damage from the Petermann earthquake in detail,
including an isoseismal map (Figure 13) based on the Environmental Seismic Intensity scale
(ESI-07) (Michetti et al., 2007). Damage is seen to increase towards the surface rupture and

309
is more extensive on the hanging-wall than the footwall. Observed damage includes fissures,
surface cracking, fallen trees and limbs, trees killed through root-tear along the hanging-wall,
holes in the soil close to the surface rupture, minor rock falls and displaced rock chips.
A.7.4 Paleoseismology
No papers have explored the palaeoseismicity of the Petermann earthquake or surface
rupture. There is no topographic or geomorphic evidence of prior rupture along the
Petermann scarp within the time constraints imposed by erosion rates of < 5 m / Myr
(Bierman & Caffee, 2002) (Section 3.2.1). Two hand dug trenches across the rupture
(unpublished data) found no displacement of the calcrete underlying eolian sediments.
Calcrete in this area is thought to date from wetter conditions potentially during the last
glacial maximum (dated at ~ 8 - 17 ka in Australia) (Denniston et al., 2013; Field et al., 2017).
A.7.4.1 Slip rate
No topographic evidence exists to suggest prior rupture along the Petermann scarp, and no
evidence of prior rupture was observed in shallow hand-dug trenches (unpublished field
data). The rupture is either the first event on this fault (previously a foliation plane), or the
recurrence interval is sufficiently long that all relief relating to prior event(s) was eroded prior
to the formation of calcrete exposed in trenches, and deposition of overlying eolian sediment.
If recurrence is assumed, vertical relief generation rates are limited by very low bedrock
erosion rates of < 5 m/Myr (Bierman & Caffee, 2002; Belton et al., 2004) (Figure 8).
A.7.5 Summary
A.7.5.1 Surface rupture relationship to Geology
All available evidence suggests that the Petermann earthquake ruptured along a mylonite
foliation plane with an orientation related to Woodroffe Thrust deformation. Geophysical
data and geological mapping
(King et al., 2018; Scrimgeour et al., 1999b) show the Woodroffe Thrust hanging-wall in this
location is composed of metamorphosed granite heavily deformed into mylonite except in
isolated larger outcrops of low shear where granitic textures are retained. Where dip is
measurable in outcrop, the mylonite dips NE towards the SW dipping Woodroffe Thrust.
In multiple locations the surface rupture is coincident with mylonite outcrops on the
hanging-wall and foot-wall within 0 – 1 km of the scarp. Surface rupture is observed to
rupture against and over outcrops of mylonite with the same strike and dip as the rupture
(King et al., 2018). Surface rupture measurements and seismologically derived source
parameters show that the earthquake ruptured a plane dipping in a conjugate sense to the SE
dipping Woodroffe Thrust (Hejrani & Tkalčić, 2018; King et al., 2018; Polcari et al., 2018).
A.7.5.2 Surface rupture relationship to Seismology
The strike of the longest south-eastern section of rupture matches best with waveform
modelling and InSAR derived strikes of 303° to 304° (Hejrani & Tkalčić, 2018; Polcari et al.,
2018). Maximum vertical offsets are observed at the north-western end (where the scarp
310
step-over occurs) and mid-section of this rupture segment (Figure 9). In comparison, the
north-western section of rupture is not visible in the field along much of its length due to
distributed deformation rather than discrete rupture. This may imply that the south-western
segment hosted the majority of seismic slip and moment release, before rupture propagated
onto a second fault at the location of scarp stepover. This theory is further supported by the
centroid location and depth obtained by Hejrani and Tkalčić (2018) in close proximity to the
step-over, potentially related to rupture propagating onto a second fault with a similar but
slightly oblique orientation.
Polcari et al. (2018) derive a fault length of 11 km and width of 4 km from InSAR inversion
modelling, which does not match with observed rupture length of 21 km. Hejrani and Tkalčić
(2018) suggest fault dimensions of 20 km (L) x 4 km (W) based on their derived magnitude
value. Aftershock data with well constrained depth measurements show a tight cluster from
2 – 3 km depth and 0 – 4 km ground distance from the rupture. Aftershocks beyond 4 km
have a greater range of depth values with a less well-defined planar structure. This may be
influence by selection bias as not all of the aftershock data has been processed to date, and
interpretation of the data would be improved by a 3D analysis of aftershock distributions.
Despite these uncertainties, the data appear to support a roughly 4 km wide fault plane down
to ~ 3 km depth, in line with the Hejrani and Tkalčić (2018) solution.
311
References
Aitken, A., and P. G. Betts, 2009, Constraints on the Proterozoic supercontinent cycle from the structural evolution of the south-central Musgrave Province, central Australia, Precambrian Res., 168, nos. 3–4, 284–300, doi: 10.1016/j.precamres.2008.10.006.
Allen, T., J. Griffin, and D. Clark, 2018, The 2018 National Seismic Hazard Assessment: Model input files (GA Record 2018/032), Geoscience Australia, Canberra, ACT.
Allen, T., M. Leonard, H. Ghasemi, and G. Gibson, 2018, The 2018 National Seismic Hazard Assesment: Earthquake epicentre catalogue (GA Record 2018/30), Geoscience Australia, Commonwealth of Australia, Canberra, ACT.
Attanayake, J., T. R. King, M. C. Quigley, G. Gibson, D. Clark, A. Jones, and M. Sandiford, 2019, Rupture Characteristics and the Structural Control of the 2016 Mwp 6.1 Intraplate Earthquake in the Petermann Ranges, Australia, Bull. Seismol. Soc. Am.
Balfour, N. J., P. R. Cummins, S. Pilia, and D. Love, 2015, Localization of intraplate deformation through fluid-assisted faulting in the lower-crust: The Flinders Ranges, South Australia, Tectonophysics, 655, 97–106, doi: 10.1016/j.tecto.2015.05.014.
Barlow, B. C., D. Denham, T. Jones, and K. McCue, 1986, The Musgrave Ranges earthquake of March 30, 1986, Trans. R. Soc. South Aust., 110, 187–189, doi: 10.1126/science.97.2526.482-a.
Beard, J. S., 1999, Evolution of the river systems of the south-west drainage division, Western Australia, J. R. Soc. West. Aust., 82, 147–164.
Bell, J. G., P. L. Kilgour, P. M. English, M. F. Woodgate, S. J. Lewis, and J. D. H. Wischusen, 2012, WASANT Palaeovalley Map - Distribution of Palaeovalleys in Arid and Semi-arid WA-SA-NT, Geoscience Australia.
Belton, D. X., R. W. Brown, B. P. Kohn, D. Fink, and K. A. Farley, 2004, Quantitative resolution of the debate over antiquity of the central Australian landscape: Implications for the tectonic and geomorphic stability of cratonic interiors, Earth Planet. Sci. Lett., 219, nos. 1–2, 21–34, doi: 10.1016/S0012-821X(03)00705-2.
Betts, P. G., D. Giles, G. S. Lister, and L. R. Frick, 2002, Evolution of the Australian lithosphere, Aust. J. Earth Sci., 49, no. 4, 661–695, doi: 10.1046/j.1440-0952.2002.00948.x.
Biasi, G. P., and S. G. Wesnousky, 2017, Bends and ends of surface ruptures, Bull. Seismol. Soc. Am., 107, no. 6, 2543–2560, doi: 10.1785/0120160292.
Biasi, G. P., and S. G. Wesnousky, 2016, Steps and gaps in ground ruptures: Empirical bounds on rupture propagation, Bull. Seismol. Soc. Am., 106, no. 3, 1110–1124, doi: 10.1785/0120150175.
Bierman, P. R., and M. W. Caffee, 2002, Cosmogenic exposure and erosion history of Australian bedrock landforms, Bull. Geol. Soc. Am., 114, no. 7, 787–803, doi: 10.1130/0016-7606(2002)114<0787:CEAEHO>2.0.CO;2.
Blake, D. H., and R. W. Page, 1988, The Proterozoic Davenport province, central Australia: regional geology and geochronology, Precambrian Res., 40–41, no. C, 329–340, doi: 10.1016/0301-9268(88)90074-5.
Blight, D. F., R. J. Chin, R. A. Smith, J. A. Bunting, and M. Elias, 1983, Bencubbin 1:250 000 Geological Map Sheet, Geological Survey of Western Australia, Perth, Australia.
Boatwright, J., and G. L. Choy, 1992, Acceleration source spectra anticipated for large earthquakes in northeastern North America, Bull. Seismol. Soc. Am., 82, no. 2, 660–682.
Boncio, P., F. Liberi, M. Caldarella, and F. C. Nurminen, 2018, Width of surface rupture zone for thrust earthquakes: Implications for earthquake fault zoning, Nat. Hazards Earth Syst. Sci., 18, no. 1, 241–256, doi: 10.5194/nhess-18-241-2018.
312
Bouniot, E., T. Jones, and K. McCue, 1990, The pattern of 1987 sequence at Tennant Creek, NT, in Recent intraplate seismicity studies symposium, Perth Western Australia (BMR Record 1990/44) P. J. Gregson (Editor), Bureau of Mineral Resources, Geology and Geophysics, Canberra, ACT.
Bowman, J. R., 1988, Constraints on locations of large intraplate earthquakes in the Northern Territory, Australia from observations at the Warramunga seismic array, Geophys. Res. Lett., 15, no. 13, 1475–1478, doi: 10.1029/GL015i013p01475.
Bowman, J. R., 1991, Geodetic evidence for conjugate faulting during the 1988 Tennant Creek, Australia earthquake sequence, Geophys. J. Int., 107, no. 1, 47–56, doi: 10.1111/j.1365-246X.1991.tb01155.x.
Bowman, J. R., 1992, The 1988 Tennant Creek, Northern Territory, earthquakes: A synthesis, Aust. J. Earth Sci., 39, no. 5, 651–669, doi: 10.1080/08120099208728056.
Bowman, J. R., and B. C. Barlow, 1991, Surveys of the Fault Scarp of the 1986 Marryat Creek, South Australia, Earthquake (BMR Record 1991/109), Australian Seismological Centre, Bureau of Mineral Resources, Canberra, ACT.
Bowman, J. R., and J. W. Dewey, 1991, Relocation of teleseismically recorded earthquakes near Tennant Creek, Australia: Implications for midplate seismogenesis, J. Geophys. Res., 96, no. B7, 11,973-11,979, doi: 10.1029/91JB00923.
Bowman, J. R., G. Gibson, and T. Jones, 1990, Aftershocks of the 1988 January 22 Tennant Creek,
Australia Intraplate Earthquakes: Evidence For A Complex Thrust‐Fault Geometry, Geophys. J. Int., 100, no. 1, 87–97, doi: 10.1111/j.1365-246X.1990.tb04570.x.
Bowman, J. R., G. Gibson, and T. Jones, 1988, Faulting process of the January 22, 1988 Tennant Creek, Northern Territory, Australia earthquakes, in Abstracts for the AGU Fall Meeting 1988: EoS Transactions, American Geophysical Union, 1301.
Bowman, J. R., and T. Jones, 1991, Post-seismic surveys of the epicentral area of the 1988 Tennant Creek, N.T., earthquakes (BMR Record 1992/002), Bureau of Mineral Resources, Geology and Geophysics, Canberra, Australia.
Bowman, J. R., and C. Yong, 1997, Case 22 A Seismicity Precursor to a Sequence of M 6.3-6.7 Midplate Earthquakes in Australia, Pure Appl. Geophys., 149, 61–78, doi: 10.1007/BF00945161.
Bullock, P. W. B., 1977, Tennant Creek gravity and magnetic survey, Northern Territory, 1973 (BMR Record 1977/30), Bureau of Mineral Resources, Geology and Geophysics, Canberra, Australia.
Cawood, P. A., and R. J. Korsch, 2008, Assembling Australia: Proterozoic building of a continent, Precambrian Res., 166, nos. 1–4, 1–35, doi: 10.1016/j.precamres.2008.08.006.
Choy, G. L., and J. R. Bowman, 1990, Rupture process of a multiple main shock sequence: analysis of teleseismic, local and field observations of the Tennant Creek, Australia, earthquakes of January 22, 1988, J. Geophys. Res., 95, no. B5, 6867–6882, doi: 10.1029/JB095iB05p06867.
Claoué-Long, J., D. Maidment, and N. Donnellan, 2008, Stratigraphic timing constraints in the Davenport Province, central Australia: A basis for Palaeoproterozoic correlations, Precambrian Res., 166, nos. 1–4, 204–218, doi: 10.1016/j.precamres.2007.06.021.
Clark, D., 2012, Neotectonic Features Database, Geoscience Australia, Commonwealth of Australia, Canberra, Australia.
Clark, D., 2018, What have we learned in the 50 years since the 1968 Meckering earthquake ?, Geoscience Australia, Commonwealth of Australia, Canberra, Australia.
Clark, D., and T. Allen, 2018, What have we learnt regarding cratonic earthquakes in the fifty years
since Meckering ?, Proc. Aust. Earthq. Eng. Soc. Conf. 2018, Nov 16-18, Perth, WA.
Clark, D., M. Dentith, K.-H. Wyrwoll, L. Yanchou, V. F. Dent, and W. E. Featherstone, 2008, The Hyden fault scarp, Western Australia: paleoseismic evidence for repeated Quaternary displacement in an intracratonic setting, Aust. J. Earth Sci., 55, no. 3, 379–395, doi:
313
10.1080/08120090701769498.
Clark, D., and M. Edwards, 2018, 50th anniversary of the 14th October 1968 Mw 6.5 (Ms 6.8) Meckering earthquake (GA Record 2018/39), Geoscience Australia, Commonwealth of Australia, Canberra, ACT.
Clark, D., and A. Mcpherson, 2013, A tale of two seisms: Ernabella 23/03/2012 (Mw5.4) and Mulga Park 09/06/2013 (Mw 5.6).
Clark, D., A. Mcpherson, T. Allen, and M. De Kool, 2014, Coseismic surface deformation caused by the 23 March 2012 Mw 5.4 Ernabella (Pukatja) earthquake, central Australia: Implications for fault scaling relations in cratonic settings, Bull. Seismol. Soc. Am., 104, no. 1, 24–39, doi: 10.1785/0120120361.
Clark, D., A. Mcpherson, and C. Collins, 2011, Australia’s seismogenic neotectonic record: a case for heterogeneous intraplate deformation (GA Record 2011/11), Geoscience Australia, Commonwealth of Australia, Canberra, Australia.
Clark, D., A. McPherson, and R. J. Van Dissen, 2012, Long-term behaviour of Australian stable continental region (SCR) faults, Tectonophysics, 566–567, 1–30, doi: 10.1016/j.tecto.2012.07.004.
Compston, D. M., 1995, Time constraints on the evolution of the Tennant Creek Block, northern Australia, Precambrian Res., 71, nos. 1–4, 107–129, doi: 10.1016/0301-9268(94)00058-Y.
Conacher, A. J., and I. D. Murray, 1969, The Meckering earthquake, Western Australia, 14 October 1968, Aust. Geogr., 11, no. 2, 179–184, doi: 10.1080/00049186908702551.
Crone, A. J., M. N. Machette, and J. R. Bowman, 1997, Episodic nature of earthquake activity in stable continental regions revealed by palaeoseismicity studies of Australian and North American quaternary faults, Aust. J. Earth Sci., 44, no. 2, 203–214, doi: 10.1080/08120099708728304.
Crone, A. J., M. N. Machette, and J. R. Bowman, 1992, Geologic Investigations of the 1988 Tennant Creek, Australia, Earthquakes - Implications for Paleoseismicity in the Stable Continental Regions (USGS Bulletin 2032-A), U.S. Geological Survey, Washington, USA.
Crone, A. J., P. M. De Martini, M. N. Machette, K. Okumura, and J. R. Prescott, 2003, Paleoseismicity of Two Historically Quiescent Faults in Australia: Implications for Fault Behavior in Stable Continental Regions, Bull. Seismol. Soc. Am., 93, no. 5, 1913–1934, doi: 10.1785/0120000094.
Dawson, J., P. R. Cummins, P. Tregoning, and M. Leonard, 2008, Shallow intraplate earthquakes in Western Australia observed by Interferometric Synthetic Aperture Radar, J. Geophys. Res. Solid Earth, 113, no. 11, 1–19, doi: 10.1029/2008JB005807.
Denham, D., 1988, Australian seismicity - the puzzle of the not-so-stable continent, Seismol. Res. Lett., 59, no. 4, 235–240, doi: https://doi.org/10.1785/gssrl.59.4.235.
Denham, D., L. G. Alexander, I. B. Everingham, P. J. Gregson, R. McCaffrey, and J. R. Enever, 1987, The 1979 Cadoux earthquake and intraplate stress in Western Australia, Aust. J. Earth Sci., 34, no. 4, 507–521, doi: 10.1080/08120098708729429.
Denham, D., L. G. Alexander, and G. Worotnicki, 1980, The stress field near the sites of the Meckering (1968) and Calingiri (1970) earthquakes, Western Australia, Tectonophysics, 67, 283–317, doi: https://doi.org/10.1016/0040-1951(80)90271-1.
Denniston, R. F., Y. Asmerom, M. Lachniet, V. J. Polyak, P. Hope, N. An, K. Rodzinyak, and W. F. Humphreys, 2013, A Last Glacial Maximum through middle Holocene stalagmite record of coastal Western Australia climate, Quat. Sci. Rev., 77, 101–112, doi: 10.1016/j.quascirev.2013.07.002.
Dent, V. F., 1988, The distribution of Cadoux aftershocks: Additional results from temporary stations near Cadoux, 1983 (BMR Record 1988/51), Bureau of Mineral Resources, Geology and Geophysics, Canberra, ACT.
314
Dent, V. F., and P. J. Gregson, 1986, Cadoux microearthquake survey 1983 (BMR Report 1986/022), Bureau of Mineral Resources, Geology and Geophysics, Canberra, ACT.
Dentith, M., D. Clark, and W. E. Featherstone, 2009, Aeromagnetic mapping of Precambrian geological structures that controlled the 1968 Meckering earthquake (Ms 6.8): Implications for intraplate seismicity in Western Australia, Tectonophysics, 475, nos. 3–4, 544–553, doi: 10.1016/j.tecto.2009.07.001.
Dentith, M., and W. E. Featherstone, 2003, Controls on intra-plate seismicity in southwestern Australia, Tectonophysics, 376, nos. 3–4, 167–184, doi: 10.1016/j.tecto.2003.10.002.
Donnellan, N., 2013, Chapter 9: Warramunga Province, in Geology and Mineral Resources of the Northern Territory, Special Publication 5 M. Ahmad, and T. J. Munson (Editors), Northern Territory Geological Survey, Darwin, Australia.
Donnellan, N., K. J. Hussey, R. S. Morrisson, and P. D. Kruse, 1998, Tennant Creek 1:250 000 Geology. Edition 2., Northern Territory Geological Survey, Darwin, Australia.
Donnelly, K. E., R. S. Morrison, K. J. Hussey, P. A. Ferenczi, and P. D. Kruse, 1999, Tennant Creek 1:250000 Explanatory Notes, Northern Territory Geological Survey, Darwin, Australia.
Doyle, H. A., 1971, Seismicity and structure in Australia, Bull. R. Soc. New Zeal., 9, nos. 149–152.
Edgoose, C. J., I. R. Scrimgeour, and D. F. Close, 2004, Geology of the Musgrave Block, Northern Territory (NTGS Report 15), Northern Territory Geological Survey, Darwin, Australia.
Ekström, G., M. Nettles, and A. M. Dziewoński, 2012, The global CMT project 2004-2010: Centroid-moment tensors for 13,017 earthquakes, Phys. Earth Planet. Inter., 200–201, 1–9, doi: 10.1016/j.pepi.2012.04.002.
Estrada, B., D. Clark, K.-H. Wyrwoll, and M. Dentith, 2006, Paleoseismic investigation of a recently identified Quaternary fault in Western Australia: the Dumbleyung Fault., Proc. Aust. Earthq. Eng. Soc. Canberra ACT, Novemb. 2006, 189–194.
Everingham, I. B., 1968, Preliminary Report on the 14 October 1968 Earthquake at Meckering, Western Australia (BMR Record 1968/142), Canberra, ACT.
Everingham, I. B., and P. J. Gregson, 1970, Meckering earthquake intensities and notes on earthquake risk for Western Australia (BMR Report 1970/97), Bureau of Mineral Resources, Geology and Geophysics, Canberra, ACT.
Everingham, I. B., and P. J. Gregson, 1971, Mundaring Geophysical Observatory, Annual Report, 1968 (BMR Record 1971/12), Bureau of Mineral Resources, Geology and Geophysics, Canberra, Australia.
Everingham, I. B., P. J. Gregson, and H. A. Doyle, 1969, Thrust Fault Scarp in the Western Australian Shield, Nature, 223, 701–703.
Everingham, I. B., and A. Parkes, 1971, Intensity Data for Earthquakes at Landor (17 June 1969) and Calingiri (10 March 1970) and their Relationship to Previous Western Australian Observations (BMR Recrod 1971/80), Bureau of Mineral Resources, Geology and Geophysics, Canberra, Australia.
Fairclough, M. C., R. C. Sprigg, B. Wilson, and R. P. Coats, 2011, Alberga 1:250 000 Geological Map, Digital Edition, Geological Survey of South Australia, Adelaide, Australia.
Field, E., H. A. McGowan, P. T. Moss, and S. K. Marx, 2017, A late Quaternary record of monsoon variability in the northwest Kimberley, Australia, Quat. Int., 449, 119–135, doi: 10.1016/j.quaint.2017.02.019.
Fitch, T. J., M. H. Worthington, and I. B. Everingham, 1973, Mechanisms of Australian earthquakes and contemporary stress in the Indian ocean plate, Earth Planet. Sci. Lett., 18, no. 2, 345–356, doi: 10.1016/0012-821X(73)90075-7.
Fredrich, J., R. Mccaffrey, and D. Denham, 1988, Source parameters of seven large Australian
315
earthquakes determined by body waveform inversion, Geophys. J., 95, 1–13, doi: https://doi.org/10.1111/j.1365-246X.1988.tb00446.x.
Gold, R. D., D. Clark, W. D. Barnhart, T. R. King, M. C. Quigley, and R. W. Briggs, 2019, Surface rupture and distributed deformation revealed by optical satellite imagery: The intraplate 2016 Mw 6.0 Petermann Ranges earthquake, Australia, Geophys. Res. Lett., doi: 10.1029/2019GL084926.
Gold, R., D. Clark, T. R. King, and M. C. Quigley, 2017, Surface rupture and vertical deformation associated with 20 May 2016 M6 Petermann Ranges earthquake , Northern Territory , Australia, in European Geosciences Union General Assembly:Vienna, Austria.
Gordon, F. R., 1971, Faulting during the earthquake at Meckering, Western Australia: 14 October 1968, R. Soc. New Zeal., Bulletin 9, 85–93.
Gordon, F. R., 1968, Reconstruction of Meckering town, a geological appraisal (GSWA Record 1968/14), Geological Survey of Western Australia, Perth, Western Australia.
Gordon, F. R., 1970, Water level changes preceding the Meckering, Western Australia, earthquake of October 14, 1968, Bull. Seismol. Soc. Am., 60, no. 5, 1739–1740.
Gordon, F. R., and J. D. Lewis, 1980, The Meckering and Calingiri earthquakes October 1968 and March 1970, Geological Survey of Western Australia, Perth, Australia.
Gregson, P. J., 1971, Mundaring Geophysical Observatory Annual Report, 1970 (BMR Record 1971/77), Bureau of Mineral Resources, Geology and Geophysics, Canberra, Australia.
Gregson, P. J. (ed.), 1990, Recent intraplate seismicity studies symposium, Perth, Western Australia September 1990 (BMR Record 1990/44).
Gregson, P. J., K. McCue, and R. S. Smith, 1972, An explanation of water level changes preceding the Meckering earthquake of 14 October 1968 (BMR Record 1972/101), Bureau of Mineral Resources, Geology and Geophysics, Canberra, Australia.
Gregson, P. J., and E. P. Paull, 1979, Preliminary report on the Cadoux earthquake, Western Australia, 2 June 1979 (BMR Report 1979/215), Bureau of Mineral Resources, Geology and Geophysics, Canberra, ACT.
Hand, M., and M. Sandiford, 1999, Intraplate deformation in central Australia, the link between subsidence and fault reactivation, Tectonophysics, 305, nos. 1–3, 121–140, doi: 10.1016/S0040-1951(99)00009-8.
Hejrani, B., and H. Tkalčić, 2018, The 20 May 2016 Petermann Ranges earthquake: centroid location, magnitude and focal mechanism from full waveform modelling, Aust. J. Earth Sci., 66, no. 1, 37–45, doi: 10.1080/08120099.2018.1525783.
Jakica, S., M. C. Quigley, M. Sandiford, D. Clark, L. K. Fifield, and A. Alimanovic, 2011, Geomorphic and cosmogenic nuclide constraints on escarpment evolution in an intraplate setting, Darling Escarpment, Western Australia, Earth Surf. Process. Landforms, 36, no. 4, 449–459, doi: 10.1002/esp.2058.
Johnston, A. C., K. J. Coppersmith, and C. A. Cornell, 1994, The earthquakes of stable continental regions, in Electric Power Research Institute Report TR-102261-VI, EPRI Distribution Centre, Palo Alto, California, USA.
Johnstone, A., and N. Donnellan, 2001, Tennant Creek 1:250 000 Integrated Interpretation of Geophysics and Mapped Geology. Edition 1, Northern Territory Geological Survey, Alice Springs, Alice Springs, Australia.
Jones, T., G. Gibson, K. McCue, D. Denham, P. J. Gregson, and J. R. Bowman, 1991, Three large intraplate earthquakes near Tennant Creek, Northern Territory, on 22 January 1988, BMR J. Aust. Geol. Geophys., 12, 339–343, doi: http://pid.geoscience.gov.au/dataset/ga/81300.
Jutson, J. T., 1934, The physiography (geomorphology) of Western Australia (Bulletin No. 95), Geological Survey of Western Australia, Perth, Western Australia.
316
King, T. R., M. C. Quigley, and D. Clark, 2018, Earthquake environmental effects produced by the Mw 6.1, 20th May 2016 Petermann earthquake, Australia, Tectonophysics, 747–748, no. October, 357–372, doi: 10.1016/j.tecto.2018.10.010.
King, T. R., M. C. Quigley, and D. Clark, 2019, Surface-rupturing historical earthquakes in Australia and their environmental effects: new insights from re-analyses of observational data, Geosciences, 9, no. 10, doi: 10.3390/geosciences9100408.
Korsch, R. J., B. R. Goleby, J. H. Leven, and B. J. Drummond, 1998, Crustal architecture of central Australia based on deep seismic reflection profiling, Tectonophysics, 288, nos. 1–4, 57–69, doi: 10.1016/S0040-1951(97)00283-7.
Lambeck, K., and G. Burgess, 1992, Deep crustal structure of the musgrave block, central australia: Results from teleseismic travel-time anomalies, Aust. J. Earth Sci., 39, no. 1, 1–19, doi: 10.1080/08120099208727996.
Langston, C. A., 1987, Depth of Faulting during the 1968 Meckering, Australia, earthquake sequence determined from waveform analysis of local seismogram, J. Geophys. Res., 92, no. B11, 11561–11574, doi: 10.1029/JB092iB11p11561.
Leonard, M., 2010, Earthquake fault scaling: Self-consistent relating of rupture length, width, average displacement, and moment release, Bull. Seismol. Soc. Am., 100, no. 5 A, 1971–1988, doi: 10.1785/0120090189.
Leonard, M., 2008, One hundred years of earthquake recording in Australia, Bull. Seismol. Soc. Am., 98, no. 3, 1458–1470, doi: 10.1785/0120050193.
Leonard, M., 2014, Self-consistent earthquake fault-scaling relations: Update and extension to stable continental strike-slip faults, Bull. Seismol. Soc. Am., 104, no. 6, 2953–2965, doi: 10.1785/0120140087.
Leonard, M., I. D. Ripper, and L. Yue, 2002, Australian earthquake fault plane solutions (GA Record 2002/019), Geoscience Australia, Canberra, ACT.
Lewis, J. D., 1990a, Meckering revisited, in Recent intraplate seismicity studies symposium, Perth Western Australia (BMR Record 1990/44).
Lewis, J. D., 1969, The geology of the country around Meckering (GSWA Record 1969/18), Geological Survey of Western Australia, Perth, Western Australia.
Lewis, J. D., 1990b, The Meckering earthquake of 17 January 1990 (GSWA Record 1990/6), Geological Survey of Western Australia, Perth, Western Australia.
Lewis, J. D., N. A. Daetwyler, J. A. Bunting, and J. S. Montcrieff, 1981, The Cadoux Earthqauke (GSWA Report 11), Geological Survey of Western Australia, Perth, Australia.
Machette, M. . M. N., A. . A. J. Crone, J. R. Bowman, R. J. Bowman, and J. R. Bowman, 1993, Geologic investigations of the 1986 Marryat Creek, Australia, earthquake: implications for paleoseismicity in stable continental regions (USGS Bulletin 2032-B), U.S. Geological Survey, Washington, USA.
Machette, M. N., A. J. Crone, J. R. Bowman, and J. R. Prescott, 1991, Surface ruptures and deformation associated with the 1988 Tennant Creek and 1986 Marryat Creek, Australia, intraplate earthquakes, in Abstracts of the U.S. Geological Survey, central region; 1991 poster review, U.S. Geological Survey, 27.
Magee, J. W., 2009, Palaeovalley Groundwater Resources in Arid and Semi-Arid Australia A Literature Review Palaeovalley Groundwater Resources in Arid and Semi-Arid Australia - A literature review.
Maidment, D. W., D. L. Huston, N. Donnellan, and A. Lambeck, 2013, Constraints on the timing of the Tennant Event and associated Au-Cu-Bi mineralisation in the Tennant Region, Northern Territory, Precambrian Res., 237, 51–63, doi: 10.1016/j.precamres.2013.07.020.
McCaffrey, R., 1989, Teleseismic investigation of the January 22, 1988 Tennant Creek, Australia,
317
earthquakes, Geophys. Res. Lett., 16, no. 5, 413–416, doi: 10.1029/GL016i005p00413.
McCue, K., 1990, Australia’s large earthquakes and Recent fault scarps, J. Struct. Geol., 12, nos. 5–6, 761–766, doi: 10.1016/0191-8141(90)90087-F.
McCue, K., T. Jones, M. Michael-Leiba, B. C. Barlow, D. Denham, and G. Gibson, 1987, Another chip off the old Australian block, Eos, Trans. Am. Geophys. Union, 68, no. 26, 609, doi: 10.1029/eo068i026p00609.
Michetti, A. M. et al., 2007, Intensity Scale ESI 2007, APAT, Rome 2007.
Mohammadi, H., M. C. Quigley, S. Steacy, and B. Duffy, 2019, Effects of source model variations on Coulomb stress analyses of a multi-fault intraplate earthquake sequence, Tectonophysics, 766, no. February, 151–166, doi: 10.1016/j.tecto.2019.06.007.
Moss, R. E. S., and Z. E. Ross, 2011, Probabilistic fault displacement hazard analysis for reverse faults, Bull. Seismol. Soc. Am., 101, no. 4, 1542–1553, doi: 10.1785/0120100248.
Mulcahy, M. J., 1967, Landscapes, Laterites and Soils in Southwestern Australia, in Landform Studies from Australian and New Zealand J. N. Jennings, and J. A. Mabbutt (Editors), Australian National University Press, Canberra.
Neumann, N. L., 2013, Yilgarn Craton – Officer Basin – Musgrave Province Seismic and MT Workshop (GA Record 2013/28), Geoscience Australia, Commonwealth of Australia, Canberra, ACT.
Neumann, T. A., A. Brenner, D. Hancock, J. Robbins, S. B. Luthcke, K. Harbeck, J. Lee, A. Gibbons, J. Saba, and K. Brunt, 2019, ATLAS/ICESat-2 L2A Global Geolocated Photon Data, Version 1, NSIDC: National Snow and Ice Data Center, Boulder, Colorado USA.
Polcari, M., M. Albano, S. Atzori, C. Bignami, S. Stramondo, M. Polcari, M. Albano, S. Atzori, C. Bignami, and S. Stramondo, 2018, The Causative Fault of the 2016 Mwp 6.1 Petermann Ranges Intraplate Earthquake (Central Australia) Retrieved by C- and L-Band InSAR Data, Remote Sens., 10, no. 8, 1311, doi: 10.3390/rs10081311.
Quigley, M. C., 2013, Earthquake clustering, complex fault ruptures, and the geological record, Geosociety Blog.
Quigley, M. C., H. Mohammadi, A. Jimenez, and B. G. Duffy, 2017, Multi-fault earthquakes with
kinematic and geometric rupture complexity : how common ? INQUA Focus Group Earthquake Geology and Seismic Hazards, in 8th International INQUA Meeting on Paleoseismology, Active Tectonics and Archeoseismology (PATA), 13 – 16 November, 2017, New Zealand.
Quigley, M. C., M. Sandiford, L. K. Fifield, and A. Alimanovic, 2007, Landscape responses to intraplate tectonism: Quantitative constraints from 10Be nuclide abundances, Earth Planet. Sci. Lett., 261, nos. 1–2, 120–133, doi: 10.1016/j.epsl.2007.06.020.
Raimondo, T., A. S. Collins, M. Hand, A. Walker-Hallam, R. H. Smithies, P. M. Evins, and H. M. Howard, 2010, The anatomy of a deep intracontinental orogen, Tectonics, 29, no. 4, doi: 10.1029/2009TC002504.
Rogers, C. D. F., 1995, Types and distribution of collapsible soils, in Genesis and Properties of Collapsible Soils E. Derbyshire, T. Dijkstra, and I. J. Smalley (Editors), Springer, Loughborough, UK, 1–17.
Salama, R. B., 1997, Geomorphology, geology and palaeohydrology of the broad alluvial valleys of the Salt River System, Western Australia, Aust. J. Earth Sci., 44, no. 6, 751–765, doi: 10.1080/08120099708728352.
Scrimgeour, I. R., D. F. Close, and C. J. Edgoose, 1999a, Petermann Ranges 1:250 000 geological map, Second Edition, Northern Territory Geological Survey, Darwin, Australia.
Scrimgeour, I. R., D. F. Close, and C. J. Edgoose, 1999b, Petermann Ranges SG52-7; explanatory notes, Northern Territory Geological Survey, Darwin, Australia.

318
Serva, L., E. Vittori, V. Comerci, E. Esposito, L. Guerrieri, A. M. Michetti, B. Mohammadioun, G. C. Mohammadioun, S. Porfido, and R. E. Tatevossian, 2016, Earthquake Hazard and the Environmental Seismic Intensity (ESI) Scale, Pure Appl. Geophys., 173, no. 5, 1479–1515, doi: 10.1007/s00024-015-1177-8.
Somerville, P. G., K. Irikura, R. W. Graves, S. Sawada, D. J. Wald, N. A. Abrahamson, Y. Iwasaki, N. Kagawa, N. F. Smith, and A. Kowada, 1999, Characterizing earthquake slip models for the prediction of strong ground motion, Seismol. Res. Lett., 70, no. 1, 59–80.
Somerville, P., and S. Ni, 2010, Contrast in Seismic Wave Propagation and Ground Motion Models between Cratonic and Other Regions of Australia, in Proceedings of the Australian Earthquake Engineering Society 2010 Conference, Perth, Western Australia.
Stein, S., and M. Liu, 2009, Long aftershock sequences within continents and implications for earthquake hazard assessment, Nature, 462, no. 7269, 87–89, doi: 10.1038/nature08502.
Stewart, A. J., 1995, Western extension of the Woodroffe Thrust, Musgrave Block, central Australia, AGSO J. Aust. Geol. Geophys., 16, no. 1/2, 147–153.
Talwani, P., 1988, The intersection model for intraplate earthquakes, Seismol. Res. Lett., 59, no. 4, 305–310, doi: https://doi.org/10.1785/gssrl.59.4.305.
Verhoeven, T. J., and P. W. Russell, 1981, Tennant Creek Water Supply 1979 - 1980 Source Investigation [Kelly Well] (Report 27/1981), Department of Transport and Works, Alice Springs, Australia.
Vogfjord, K. S., and C. A. Langston, 1987, The Meckering earthquake of 14 October 1968: A possible downward propagating rupture, Bull. Seismol. Soc. Am., 77, no. 5, 1558–1578.
Wade, B. P., D. E. Kelsey, M. Hand, and K. M. Barovich, 2008, The Musgrave Province: Stitching north, west and south Australia, Precambrian Res., 166, nos. 1–4, 370–386, doi: 10.1016/j.precamres.2007.05.007.
Wang, S., W. Xu, C. Xu, Z. Yin, R. Bürgmann, L. Liu, and G. Jiang, 2019, Changes in groundwater level possibly encourage shallow earthquakes in central Australia: The 2016 Petermann Ranges earthquake, Geophys. Res. Lett., 46, no. 6, 3189–3198, doi: 10.1029/2018GL080510.
Wells, D. L., and K. J. Coppersmith, 1994, New Empirical Relationships among Magnitude, Rupture Length, Rupture Width, Rupture Area, and Surface Displacement, Bull. Seismol. Soc. Am., 84, no. 4, 974–1002.
Wesnousky, S. G., 2008, Displacement and geometrical characteristics of earthquake surface ruptures: Issues and implications for seismic-hazard analysis and the process of earthquake rupture, Bull. Seismol. Soc. Am., 98, no. 4, 1609–1632, doi: 10.1785/0120070111.
Wex, S., N. S. Mancktelow, A. Camacho, and G. Pennacchioni, 2019, Interplay between seismic fracture and aseismic creep in the Woodroffe Thrust, central Australia – Inferences for the rheology of relatively dry continental mid-crustal levels, Tectonophysics, 758, no. July 2018, 55–72, doi: 10.1016/j.tecto.2018.10.024.
Wilde, S. A., G. H. Low, and R. W. Lake, 1978, Perth 1:250 000 Geological Map Sheet, Geological Survey of Western Australia, Perth, Western Australia.
Wilde, S. A., M. F. Middleton, and B. J. Evans, 1996, Terrane accretion in the southwestern Yilgarn Craton: evidence from a deep seismic crustal profile, Precambrian Res., 78, nos. 1–3, 179–196, doi: 10.1016/0301-9268(95)00077-1.
319
APPENDIX B: CO-AUTHORED PAPERS AND PRE-PRINTS
Research conducted during the course of this doctoral research contributed to three other
manuscripts (Attanayake et al., (2019); Gold et al., (2019); Quigley et al., (2019)), and one
accompanying preprint (Quigley et al., (2018)).
The full references for these manuscripts are as follows:
1. Gold et al. (2019) Surface rupture and distributed deformation revealed by optical satellite imagery: The intraplate 2016 Mw 6.0 Petermann Ranges earthquake, Australia Geophysical Research
Letters, doi: 10.1029/2019GL084926.
2. Attanayake et al. (2019) Rupture Characteristics and the Structural Control of the 2016 Mwp 6.1 Intraplate Earthquake in the Petermann Ranges, Australia Bulletin of the Seismological
Society of America (in review)
3. Quigley et al. (2019) Physical and Statistical Behaviour of Multifault Earthquakes : Darfield Earthquake Case Study Journal of Geophysical Research: Solid Earth, 124, doi:
10.1029/2019JB017508.
3. Quigley et al. (2018) An investigation of multi-fault rupture scenarios using a variety of Coulomb stress modelling criteria: methods paper and full results EarthArXiv Preprints, doi:
10.31223/osf.io/v8t3n.
These appendices have been removed from the final library version of this thesis to avoid copyright
infringement.
Related Documents