BGC ENGINEERING INC. 500-980 Howe Street, Vancouver, BC Canada V6Z 0C8 Tel: 604.684.5900 Fax: 604.684.5909 COLUMBIA SHUSWAP REGIONAL DISTRICT Geohazard Risk Prioritization FINAL April 16, 2020 Project No.: 1899001 Prepared by BGC Engineering Inc. for: Columbia Shuswap Regional District

Welcome message from author
This document is posted to help you gain knowledge. Please leave a comment to let me know what you think about it! Share it to your friends and learn new things together.
Transcript

BGC ENGINEERING INC. 500-980 Howe Street, Vancouver, BC Canada V6Z 0C8 Tel: 604.684.5900 Fax: 604.684.5909
COLUMBIA SHUSWAP REGIONAL DISTRICT
Geohazard Risk Prioritization FINAL April 16, 2020
Project No.: 1899001
Prepared by BGC Engineering Inc. for: Columbia Shuswap Regional District
BGC ENGINEERING INC.
AN APPLIED EARTH SCIENCES COMPANY Suite 500 - 980 Howe Street Vancouver, BC Canada V6Z 0C8 Telephone (604) 684-5900 Fax (604) 684-5909
April 16, 2020 Project No.: 1899001
Jan Thingsted, Planner Columbia Shuswap Regional District 555 Harbourfront Drive NE PO Box 978 Salmon Arm, BC V1E 4P1
Dear Mr. Thingsted,
Re: Geohazard Risk Prioritization – FINAL BGC is pleased to provide you with the following geohazard risk prioritization for the Columbia-Shuswap Regional District. The web application accompanying this report can be accessed at www.cambiocommunities.ca. Those without a username and password should click “Register for Access”.
Should you have any questions, please do not hesitate to contact the undersigned. We appreciate the opportunity to collaborate with you on this challenging and interesting study.
Yours sincerely,
BGC ENGINEERING INC. per:
Sarah Kimball, M.A.Sc., P.Eng., P.Geo. Senior Geological Engineer
Columbia Shuswap Regional District April 16, 2020 Geohazard Risk Prioritization - FINAL Project No.: 1899001
BGC ENGINEERING INC. Page i
TABLE OF REVISIONS
ISSUE DATE REV REMARKS
DRAFT March 10, 2020 Original issue
FINAL April 16, 2020 Original issue
CREDITS AND ACKNOWLEDGEMENTS BGC would like to express gratitude to the Columbia Shuswap Regional District for providing background information, guidance and support throughout this project. Key CSRD staff providing leadership and support included:
• Jan Thingsted, Planner • David Major, IT/GIS Coordinator • Tom Hansen, Emergency Program Coordinator • Derek Sutherland, Manager of Protective Services • Gerald Christie, Manager Development Services • Corey Paiement, Team Leader, Planning Services.
The following BGC personnel were part of the study team:
• Kris Holm (Project Director) • Sarah Kimball (Project Manager) • Richard Carter • Matthew Buchanan • Matthieu Sturzenegger • Elisa Scordo • Patrick Grover • Philip LeSueur • Midori Telles-Langdon • Alistair Beck.

Columbia Shuswap Regional District April 16, 2020 Geohazard Risk Prioritization - FINAL Project No.: 1899001
BGC ENGINEERING INC. Page ii
LIMITATIONS BGC Engineering Inc. (BGC) prepared this document for the account of Columbia Shuswap Regional District. The material in it reflects the judgment of BGC staff in light of the information available to BGC at the time of document preparation. Any use which a third party makes of this document or any reliance on decisions to be based on it is the responsibility of such third parties. BGC accepts no responsibility for damages, if any, suffered by any third party as a result of decisions made or actions based on this document.
As a mutual protection to our client, the public, and ourselves, all documents and drawings are submitted for the confidential information of our client for a specific project. Authorization for any use and/or publication of this document or any data, statements, conclusions or abstracts from or regarding our documents and drawings, through any form of print or electronic media, including without limitation, posting or reproduction of same on any website, is reserved pending BGC’s written approval. A record copy of this document is on file at BGC. That copy takes precedence over any other copy or reproduction of this document.
Columbia Shuswap Regional District April 16, 2020 Geohazard Risk Prioritization - FINAL Project No.: 1899001
BGC ENGINEERING INC. Page iii
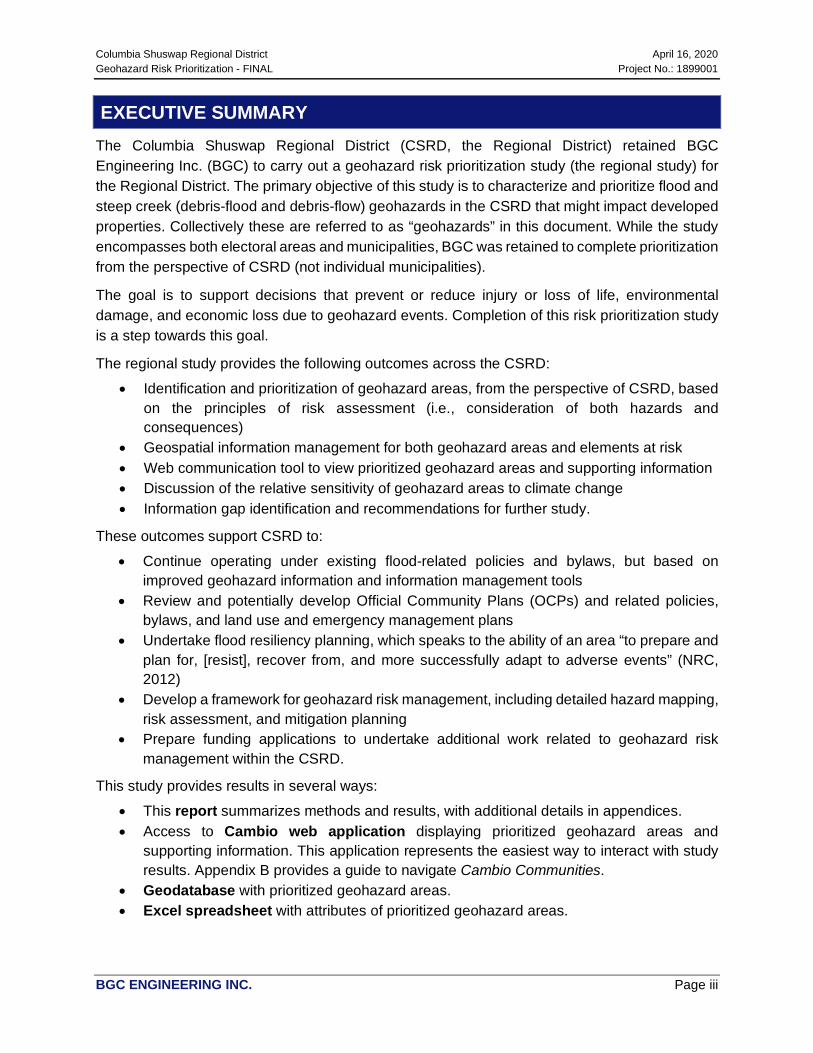
EXECUTIVE SUMMARY The Columbia Shuswap Regional District (CSRD, the Regional District) retained BGC Engineering Inc. (BGC) to carry out a geohazard risk prioritization study (the regional study) for the Regional District. The primary objective of this study is to characterize and prioritize flood and steep creek (debris-flood and debris-flow) geohazards in the CSRD that might impact developed properties. Collectively these are referred to as “geohazards” in this document. While the study encompasses both electoral areas and municipalities, BGC was retained to complete prioritization from the perspective of CSRD (not individual municipalities).
The goal is to support decisions that prevent or reduce injury or loss of life, environmental damage, and economic loss due to geohazard events. Completion of this risk prioritization study is a step towards this goal.
The regional study provides the following outcomes across the CSRD:
• Identification and prioritization of geohazard areas, from the perspective of CSRD, based on the principles of risk assessment (i.e., consideration of both hazards and consequences)
• Geospatial information management for both geohazard areas and elements at risk • Web communication tool to view prioritized geohazard areas and supporting information • Discussion of the relative sensitivity of geohazard areas to climate change • Information gap identification and recommendations for further study.
These outcomes support CSRD to:
• Continue operating under existing flood-related policies and bylaws, but based on improved geohazard information and information management tools
• Review and potentially develop Official Community Plans (OCPs) and related policies, bylaws, and land use and emergency management plans
• Undertake flood resiliency planning, which speaks to the ability of an area “to prepare and plan for, [resist], recover from, and more successfully adapt to adverse events” (NRC, 2012)
• Develop a framework for geohazard risk management, including detailed hazard mapping, risk assessment, and mitigation planning
• Prepare funding applications to undertake additional work related to geohazard risk management within the CSRD.
This study provides results in several ways:
• This report summarizes methods and results, with additional details in appendices. • Access to Cambio web application displaying prioritized geohazard areas and
supporting information. This application represents the easiest way to interact with study results. Appendix B provides a guide to navigate Cambio Communities.
• Geodatabase with prioritized geohazard areas. • Excel spreadsheet with attributes of prioritized geohazard areas.

Columbia Shuswap Regional District April 16, 2020 Geohazard Risk Prioritization - FINAL Project No.: 1899001
BGC ENGINEERING INC. Page iv
In total, BGC identified and prioritized 1446 geohazard areas encompassing over 1946 km2 of the CSRD (Table E-1, Figure E-1).
Table E-1. Number of prioritized areas in the CSRD, by geohazard type.
Geohazard Type Priority Level
Grand Total Very
High High Moderate Low Very Low
Clear-Water Floods (water courses and water bodies) 0 58 92 846 0 996
Steep Creeks (Fans) 11 120 104 166 49 450
Grand Total (Count) 11 178 196 1012 49 1446
Grand Total (%) 1% 12% 14% 70% 3% 100%
Table E-3 highlights clear-water flood and steep creek geohazard areas considered high priority for further assessment. The full list of prioritized areas should be reviewed for decision making. BGC emphasizes that the baseline priority ratings are not equivalent to an absolute level of risk, and CSRD will need to consider additional factors in decisions about next steps at any site (i.e., evaluation of costs and benefits to advance the steps of risk management).
Table E-2 lists the results worksheets, which are provided in Appendix H. These worksheets can be filtered and sorted to view ranked hazard areas by any field in the worksheets. When reviewing results, local authorities may wish to consider other factors outside the scope of this assessment but that also affect risk management decision making. For example, additional factors include the level of risk reduction already achieved by existing structural mitigation (dikes), the level of flood resiliency in different areas, and comparison of the risk reduction benefit to the cost of new or upgraded flood risk reduction measures.
Appendix F provides the example Risk Assessment Information Template (RAIT) form required by the National Disaster Mitigation Program (NDMP).
Table E-2. Results worksheets provided in Appendix H.
Appendix H (Excel Worksheet Name)
Contents
Study Area Metrics Summary statistics of select elements at risk (count of presence in geohazard areas).
Study Area Hazard Summary Summary statistics of elements at risk, according to their presence in geohazard areas.
Study Area Hazard Type Summary Summary statistics of geohazard areas, according to the presence of elements at risk.
Priority by Jurisdiction Summary statistics of prioritization results by jurisdiction.
Steep Creek Hazard Attributes Attributes for all steep creek geohazard areas.
Clear-water Flood Hazard Attributes Attributes for all clear-water flood geohazard areas.

Columbia Shuswap Regional District April 16, 2020 Geohazard Risk Prioritization - FINAL Project No.: 1899001
BGC ENGINEERING INC. Page v
Figure E-1. Number of prioritized areas in each jurisdiction within the CSRD

Columbia Shuswap Regional District April 16, 2020 Geohazard Risk Prioritization - FINAL Project No.: 1899001
BGC ENGINEERING INC. Page vi
Table E-3. Geohazard areas highlighted as high priority for more detailed assessment.
Note: 1. BGC has completed a detailed hazard assessment of the East Gate Landslide with proposed mitigation.
Hazard Code Hazard Type Geohazard Process Name Geohazard Rating Consequence Rating Priority Rating
9291 / 9301 / 9302 / 9299 Clear-water Flood Shuswap Lake Moderate Very High High
9142 / 9305 / 9285 / 9281 / 9183 / 9280 / 9282 Clear-water Flood Eagle River Moderate Very High High
9303 Clear-water Flood Mara Lake Moderate Very High High
9139 / 9395 / 9330 / 9432 / 9509 Clear-water Flood / Reservoir Columbia River at Golden Moderate Very High High
9140 / 9383 Clear-water Flood / Reservoir Columbia River at Revelstoke Moderate Very High High
9566 / 9579 / 9366 Clear-water Flood Kicking Horse River Moderate Very High High
9665 Clear-water Flood Adams River Moderate Very High High
9469 / 9456 Clear-water Flood Kinbasket Lake Moderate Very High High
9664 Clear-water Flood Adams Lake Moderate Very High High
9307 Clear-water Flood Little Shuswap Lake Moderate High High
9143 Clear-water Flood Salmon River Moderate High High
9602 / 9365 Clear-water Flood Illecillewaet River Moderate High High
9498 Clear-water Flood / Reservoir Upper Arrow Lake High High High
584 Steep Creek Debris Flood Sicamous Creek Very High High Very High
655 Steep Creek Debris Flood Yard Creek High Very High Very High
1267 Steep Creek Debris Flow Camp Creek Very High Very High Very High
1534 Steep Creek Debris Flow Hummingbird Creek High Very High Very High
8951 Steep Creek Debris Flow Unnamed Creek (near Rogers Pass) High Very High Very High
8986 Steep Creek Debris Flood Loop Brook Very High High Very High
8924 Steep Creek Debris Flow Unnamed Creek (near Blaeberry) Very High High Very High
8874 Steep Creek Debris Flow East Gate Landslide1 Very High High Very High
8930 Steep Creek Debris Flow Unnamed Creek (near Field) Very High High Very High
9030 Steep Creek Debris Flow Cathedral Gulch High Very High Very High
9082 Steep Creek Debris Flow Stephen Creek Very High Very High Very High

Columbia Shuswap Regional District April 16, 2020 Geohazard Risk Prioritization - FINAL Project No.: 1899001
BGC ENGINEERING INC. Page vii
Table E-4 lists recommendations for consideration by CSRD and local, regional, and provincial authorities. The rationale for each recommendation is described in more detail in the report. BGC encourages CSRD and stakeholders to review this assessment and web tools from the perspective of supporting long-term geohazard risk and information management within the Regional District. This effort would be greatly facilitated by long-term provincial support and by coordinated resource sharing between the private and public sectors.
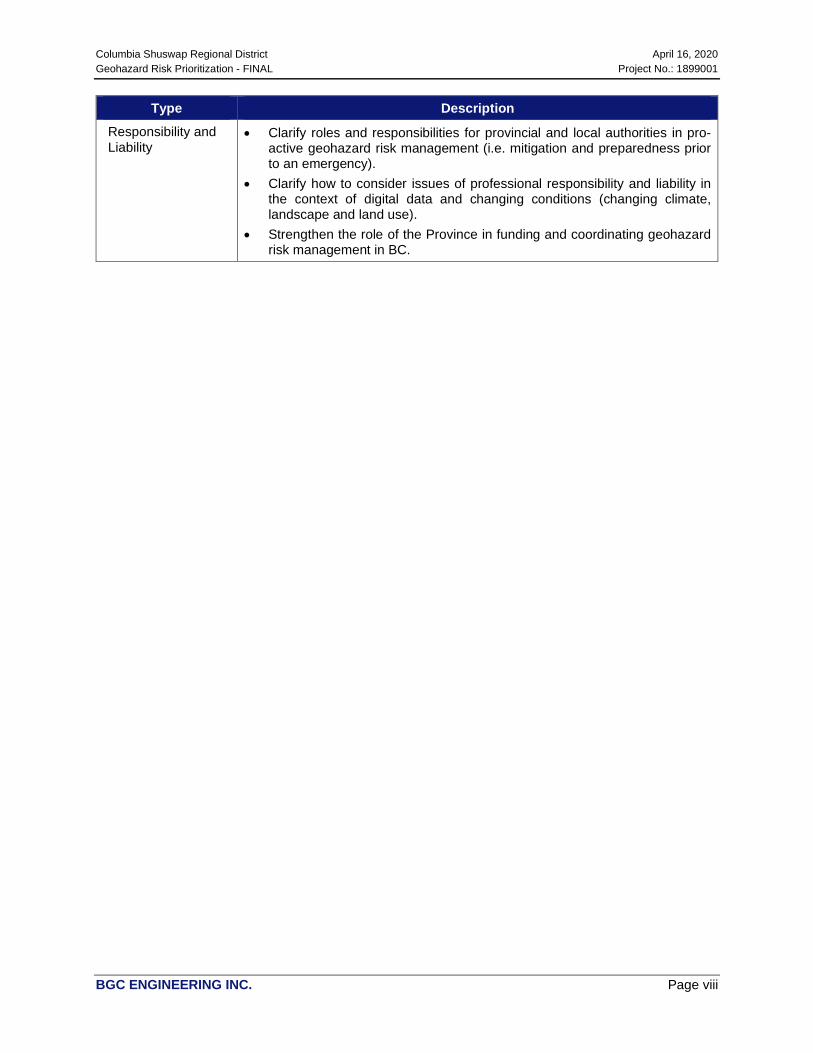
Table E-4. List of recommendations.
Type Description
Data Gaps • Develop a plan to resolve the baseline data gaps outlined in this study, including gaps related to baseline data; geohazard sources, controls, and triggers; geohazard frequency- magnitude relationships, flood protection measures and flood conveyance infrastructure, and hazard exposure (elements at risk).
Further Geohazards Assessments
• Geohazard areas: complete more detailed assessments for areas chosen by the CSRD or stakeholders as top priority, following review of this assessment.
Long-term Geohazard Risk Management
• Consider long-term geohazard risk management programs that would build on the results of this study.
Geohazards Monitoring
• Develop criteria for hydroclimatic monitoring and alert systems informing emergency management.
Policy Integration • Review Development Permit Areas (DPAs) following review of geohazard areas defined by this study.
• Review OCP land-use designations in CSRD following review of geohazard areas defined by this study.
• Review recommendations for flood-related policy and bylaw modernization provided in Appendix I.
• BGC recommends CSRD review the asset exposure weightings when developing risk assessment policy.
Training, Public and Stakeholder Communication
• Provide training to CSRD staff who may rely on study results, tools and data services.
• Develop and implement a strategy to communicate the study results to the public.
• Work with communities in the prioritized hazard areas to develop flood resiliency plans informed by stakeholder and public engagement.
Digital Information Sharing
• Collaborate with private and public sector agencies within and outside the CSRD to share information, methods, and resources about pro-active geohazard risk and emergency management.
Multi-Stakeholder Resource Sharing
• Connect private and public resources for geohazard and risk management that amplify their effectiveness to reduce risk beyond what can be accomplished in isolation.
Columbia Shuswap Regional District April 16, 2020 Geohazard Risk Prioritization - FINAL Project No.: 1899001
BGC ENGINEERING INC. Page viii
Type Description Responsibility and Liability
• Clarify roles and responsibilities for provincial and local authorities in pro-active geohazard risk management (i.e. mitigation and preparedness prior to an emergency).
• Clarify how to consider issues of professional responsibility and liability in the context of digital data and changing conditions (changing climate, landscape and land use).
• Strengthen the role of the Province in funding and coordinating geohazard risk management in BC.

Columbia Shuswap Regional District April 16, 2020 Geohazard Risk Prioritization - FINAL Project No.: 1899001
BGC ENGINEERING INC. Page ix
TABLE OF CONTENTS TABLE OF REVISIONS .............................................................................................................. i CREDITS AND ACKNOWLEDGEMENTS ................................................................................. i LIMITATIONS ............................................................................................................................. ii EXECUTIVE SUMMARY ........................................................................................................... iii TABLE OF CONTENTS ............................................................................................................ ix LIST OF TABLES ...................................................................................................................... xi LIST OF FIGURES ................................................................................................................... xii LIST OF APPENDICES ........................................................................................................... xiii 1. INTRODUCTION ............................................................................................................ 1 1.1. Objectives ...................................................................................................................... 1 1.2. Why This Study? ........................................................................................................... 4 1.3. Terminology................................................................................................................... 6 1.4. Scope of Work ............................................................................................................... 7 1.4.1. Summary ...................................................................................................................... 7 1.4.2. Geohazard Types Assessed ...................................................................................... 10 1.5. Deliverables / Web Map .............................................................................................. 11 2. BACKGROUND ............................................................................................................ 13 2.1. Administration ............................................................................................................. 13 2.2. Physiography .............................................................................................................. 13 2.3. Ecoregions................................................................................................................... 14 2.4. Geological History ...................................................................................................... 18 2.4.1. Bedrock Geology ........................................................................................................ 18 2.4.2. Surficial Geology ........................................................................................................ 20 2.5. Hydroclimate ............................................................................................................... 20 2.5.1. Regional-Scale Climate Factors ................................................................................. 21 2.5.2. Hydroclimate Conditions ............................................................................................ 21 2.5.3. Climate Change .......................................................................................................... 24 2.6. Hydrology .................................................................................................................... 27 2.6.1. Hydrological Regimes ................................................................................................ 27 2.6.2. Flow Regulation .......................................................................................................... 30 2.6.3. Ice Jams ..................................................................................................................... 30 2.7. Historical Event Inventory ......................................................................................... 31 2.8. Flood and Steep Creek Policy and Bylaws .............................................................. 31 3. GEOHAZARD ASSESSMENT ..................................................................................... 33 3.1. Clear-water Flood Geohazards.................................................................................. 33 3.1.1. Hazard Area Delineation and Characterization Overview ......................................... 33 3.1.2. Geohazard Process Type........................................................................................... 34 3.1.3. Hazard Likelihood ....................................................................................................... 35 3.1.4. Hazard Intensity .......................................................................................................... 35 3.2. Steep Creek Geohazards ........................................................................................... 35 3.2.1. Overview ..................................................................................................................... 36

Columbia Shuswap Regional District April 16, 2020 Geohazard Risk Prioritization - FINAL Project No.: 1899001
BGC ENGINEERING INC. Page x
3.2.2. Alluvial Fan Inventory ................................................................................................. 37 3.2.3. Process Type Identification ........................................................................................ 39 3.2.4. Hazard Likelihood Estimation ..................................................................................... 40 3.2.5. Impact Likelihood Estimation ..................................................................................... 40 3.2.6. Intensity Estimation .................................................................................................... 40 4. EXPOSURE ASSESSMENT ........................................................................................ 41 5. GEOHAZARD RISK PRIORITIZATION....................................................................... 46 5.1. Introduction ................................................................................................................. 46 5.2. Geohazard Rating ....................................................................................................... 47 5.3. Consequence Rating .................................................................................................. 48 5.3.1. Exposure Rating ......................................................................................................... 48 5.3.2. Hazard Intensity Rating .............................................................................................. 49 5.3.3. Consequence Rating .................................................................................................. 49 5.4. Priority Rating ............................................................................................................. 50 6. RESULTS ..................................................................................................................... 51 7. RECOMMENDATIONS ................................................................................................ 53 7.1. Data Gaps .................................................................................................................... 53 7.2. Further Geohazards Assessments ........................................................................... 57 7.2.1. Clear-water Floodplain Mapping ................................................................................ 59 7.2.2. Reservoirs and Waterbodies ...................................................................................... 59 7.2.3. Steep Creek Geohazards Assessments .................................................................... 59 7.3. Long-Term Geohazard Risk Management ............................................................... 60 7.4. Geohazards Monitoring .............................................................................................. 62 7.5. Policy Integration ........................................................................................................ 65 7.5.1. Development Permit Areas (DPAs) ........................................................................... 65 7.5.2. Land-Use Review ....................................................................................................... 66 7.5.3. Policy Review ............................................................................................................. 66 7.5.4. Hazard Exposure Evaluation ...................................................................................... 67 7.6. Training and Stakeholder Communication .............................................................. 67 7.7. Digital Information Sharing ....................................................................................... 68 7.8. Multi-Stakeholder Resource Sharing ....................................................................... 69 7.9. Responsibility and Liability ....................................................................................... 70 8. CLOSURE ..................................................................................................................... 72 REFERENCES ......................................................................................................................... 73
Columbia Shuswap Regional District April 16, 2020 Geohazard Risk Prioritization - FINAL Project No.: 1899001
BGC ENGINEERING INC. Page xi
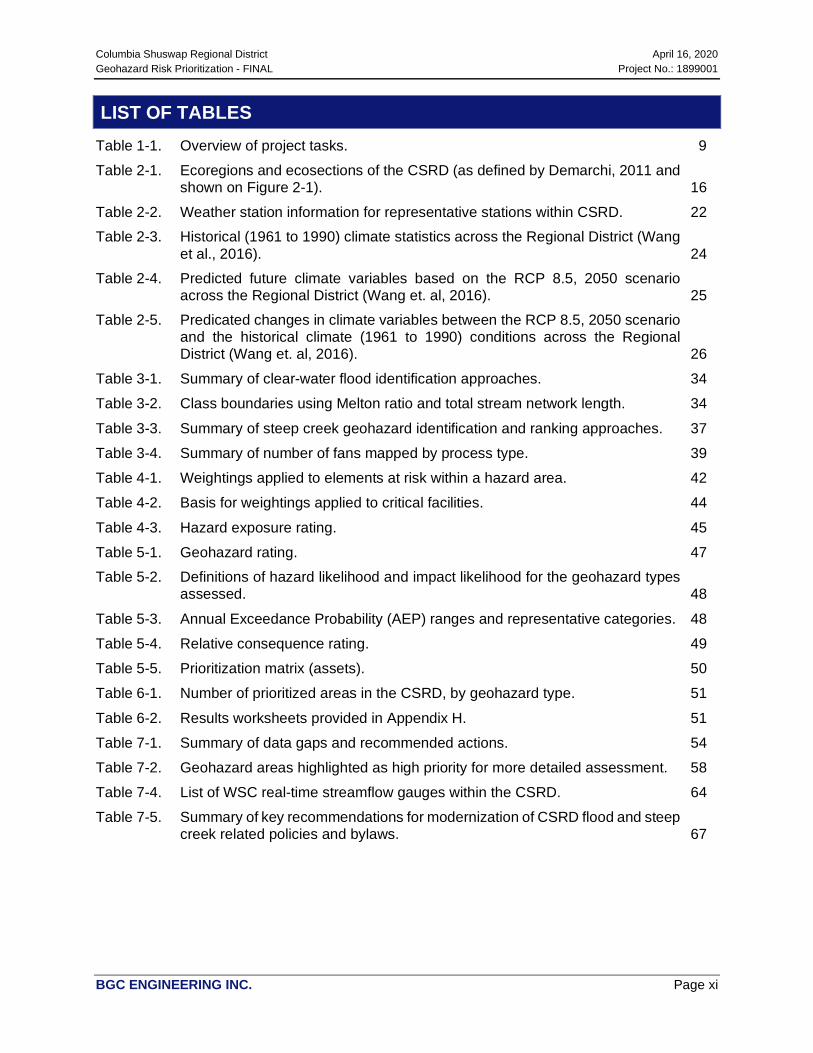
LIST OF TABLES Table 1-1. Overview of project tasks. 9
Table 2-1. Ecoregions and ecosections of the CSRD (as defined by Demarchi, 2011 and shown on Figure 2-1). 16
Table 2-2. Weather station information for representative stations within CSRD. 22
Table 2-3. Historical (1961 to 1990) climate statistics across the Regional District (Wang et al., 2016). 24
Table 2-4. Predicted future climate variables based on the RCP 8.5, 2050 scenario across the Regional District (Wang et. al, 2016). 25
Table 2-5. Predicated changes in climate variables between the RCP 8.5, 2050 scenario and the historical climate (1961 to 1990) conditions across the Regional District (Wang et. al, 2016). 26
Table 3-1. Summary of clear-water flood identification approaches. 34
Table 3-2. Class boundaries using Melton ratio and total stream network length. 34
Table 3-3. Summary of steep creek geohazard identification and ranking approaches. 37
Table 3-4. Summary of number of fans mapped by process type. 39
Table 4-1. Weightings applied to elements at risk within a hazard area. 42
Table 4-2. Basis for weightings applied to critical facilities. 44
Table 4-3. Hazard exposure rating. 45
Table 5-1. Geohazard rating. 47
Table 5-2. Definitions of hazard likelihood and impact likelihood for the geohazard types assessed. 48
Table 5-3. Annual Exceedance Probability (AEP) ranges and representative categories. 48
Table 5-4. Relative consequence rating. 49
Table 5-5. Prioritization matrix (assets). 50
Table 6-1. Number of prioritized areas in the CSRD, by geohazard type. 51
Table 6-2. Results worksheets provided in Appendix H. 51
Table 7-1. Summary of data gaps and recommended actions. 54
Table 7-2. Geohazard areas highlighted as high priority for more detailed assessment. 58
Table 7-4. List of WSC real-time streamflow gauges within the CSRD. 64
Table 7-5. Summary of key recommendations for modernization of CSRD flood and steep creek related policies and bylaws. 67

Columbia Shuswap Regional District April 16, 2020 Geohazard Risk Prioritization - FINAL Project No.: 1899001
BGC ENGINEERING INC. Page xii
LIST OF FIGURES Figure 1-1. CSRD study area. 3
Figure 1-2. Illustration showing Strahler stream order (Montgomery, 1990). 7
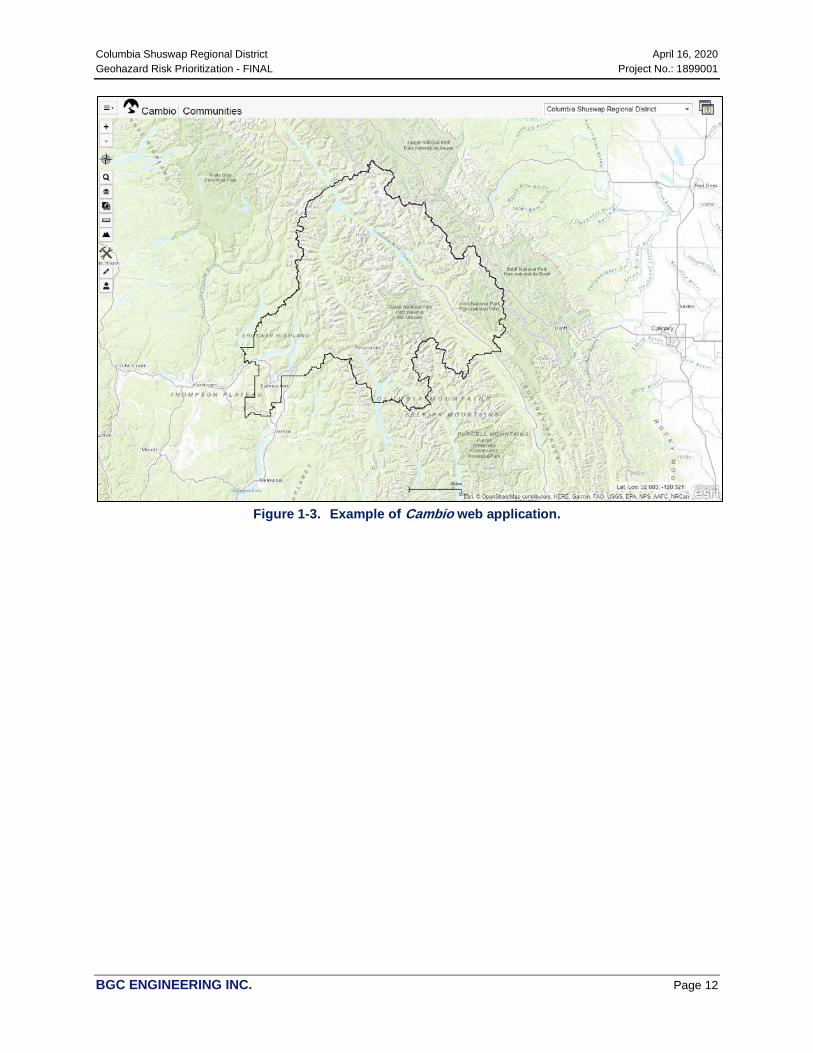
Figure 1-3. Example of Cambio web application. 12
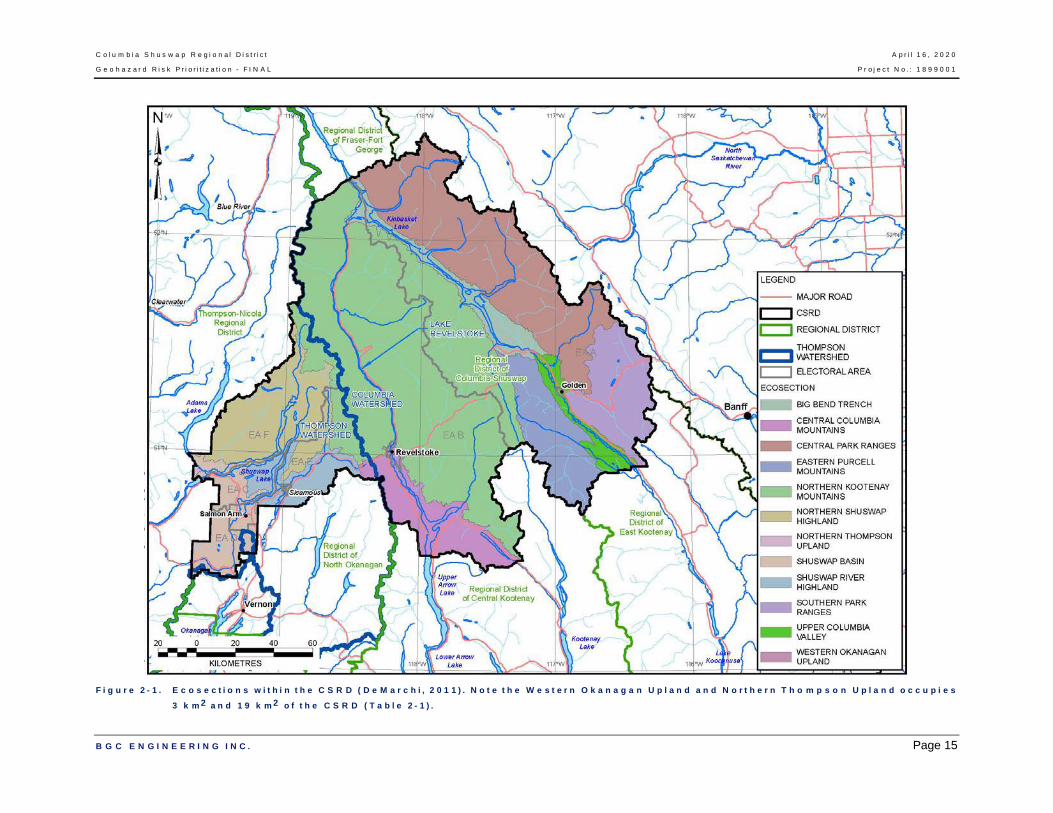
Figure 2-1. Ecosections within the CSRD (DeMarchi, 2011). Note the Western Okanagan Upland and Northern Thompson Upland occupies 3 km2 and 19 km2 of the CSRD (Table 2-1). 15
Figure 2-2. Bedrock geology of the CSRD. Digital mapping and bedrock classes from Cui et al. (2017). 19
Figure 2-3. Historical precipitation and temperature the period 1981 to 2010 at the climate stations Golden A, Glacier NP Rogers Pass and Salmon Arm A. 23
Figure 2-4. Comparison of historical (1961 to 1990) and projected (RCP 8.5, 2041 to 2070) climate variables across the Regional District including a. Historical MAT; b. Projected MAT; c. Change in MAT; d. Historical MAP; e. Projected MAP; f. Change in MAP; g. Historical PAS; h. Projected PAS; i. Change in PAS. 26
Figure 2-5. Time series of daily discharge data for WSC hydrometric station 08ND013 (Illecillewaet River at Greeley). Illecillewaet River represents a snowmelt-dominated hydrologic regime. Statistics correspond to 55 years of data recorded from 1963 to 2017. 28
Figure 2-6. Time series of daily discharge data for WSC hydrometric station 08ND019 (Kirbyville Creek near the Mouth). Kirbyville Creek represents a snowmelt-dominated hydrologic regime. Statistics correspond to 33 years of data recorded from 1973 to 2005. 29
Figure 2-7. Time series of daily discharge data for WSC hydrometric station 08LE077 (Corning Creek near Squilax). Corning Creek represents a snowmelt-dominated hydrologic regime. Statistics correspond to 38 years of data recorded from 1966 to 2015. 30
Figure 3-1. Main factors contributing to hydrogeomorphic hazards. 36
Figure 3-2. Main types of steep creek hazards. 36
Figure 3-3. Example alluvial fan boundary at Ross Creek, along the northern edge of Shuswap Lake. 38
Figure 4-1. Distribution of exposure scores in the CSRD and definition of associated exposure ratings. 45
Figure 5-1. Elements of the prioritization approach. 46
Figure 6-1. Number of prioritized areas in each jurisdiction within the CSRD. 52
Figure 7-1. Schematic of multi-site risk management approach. 61
Figure 7-2. Example of 24-hour accumulated precipitation in southern British Columbia on November 3, 2018. Source: EC-MSC Canadian Precipitation Analysis (CaPA) (2018, via BGC RNT™). 62
Figure 7-3. Screen capture of BGC RNT™ showing real-time streamflow gauge on the Columbia River (08NA002). Source: WSC (2020, via BGC RNT™). 63
Columbia Shuswap Regional District April 16, 2020 Geohazard Risk Prioritization - FINAL Project No.: 1899001
BGC ENGINEERING INC. Page xiii
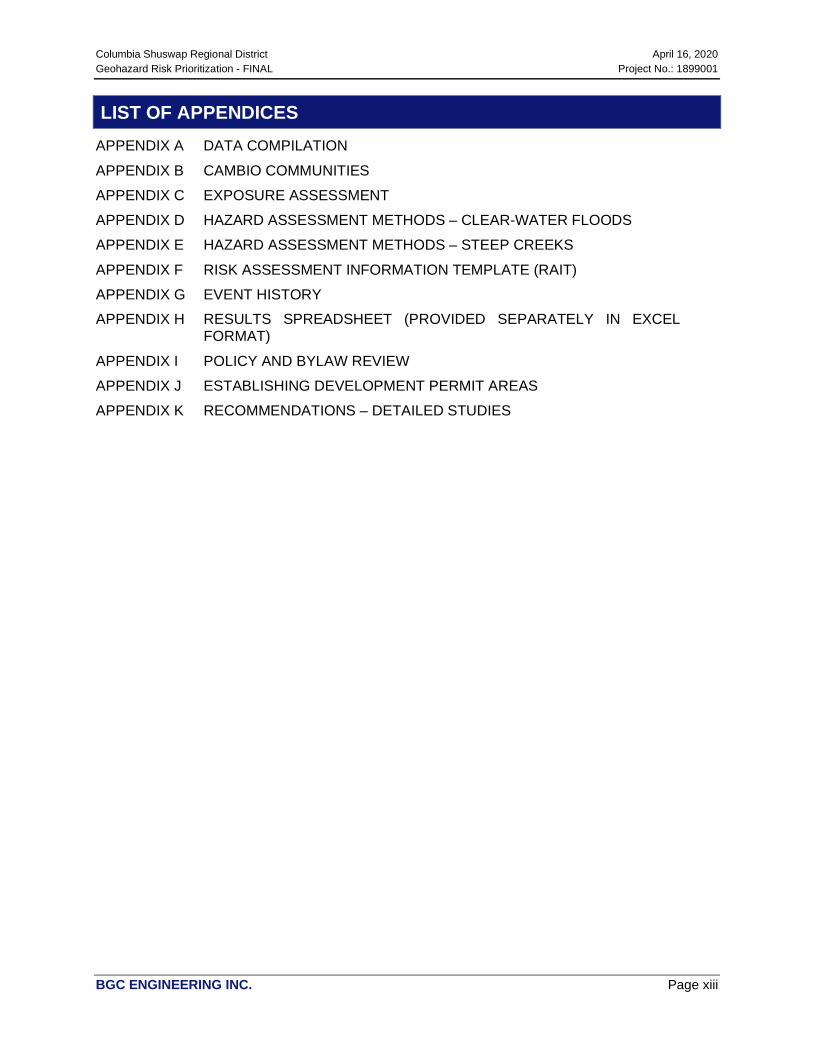
LIST OF APPENDICES APPENDIX A DATA COMPILATION
APPENDIX B CAMBIO COMMUNITIES
APPENDIX C EXPOSURE ASSESSMENT
APPENDIX D HAZARD ASSESSMENT METHODS – CLEAR-WATER FLOODS
APPENDIX E HAZARD ASSESSMENT METHODS – STEEP CREEKS
APPENDIX F RISK ASSESSMENT INFORMATION TEMPLATE (RAIT) APPENDIX G EVENT HISTORY
APPENDIX H RESULTS SPREADSHEET (PROVIDED SEPARATELY IN EXCEL FORMAT)
APPENDIX I POLICY AND BYLAW REVIEW
APPENDIX J ESTABLISHING DEVELOPMENT PERMIT AREAS
APPENDIX K RECOMMENDATIONS – DETAILED STUDIES
Columbia Shuswap Regional District April 16, 2020 Geohazard Risk Prioritization - FINAL Project No.: 1899001
BGC ENGINEERING INC. Page 1
1. INTRODUCTION
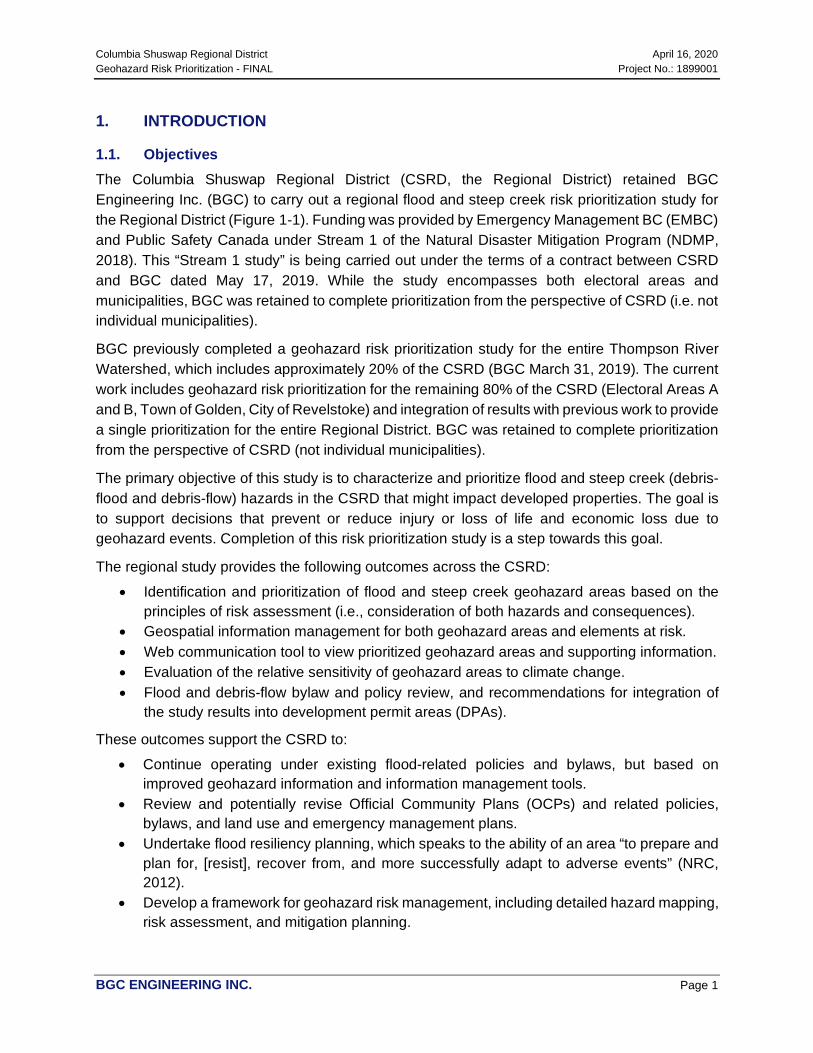
1.1. Objectives The Columbia Shuswap Regional District (CSRD, the Regional District) retained BGC Engineering Inc. (BGC) to carry out a regional flood and steep creek risk prioritization study for the Regional District (Figure 1-1). Funding was provided by Emergency Management BC (EMBC) and Public Safety Canada under Stream 1 of the Natural Disaster Mitigation Program (NDMP, 2018). This “Stream 1 study” is being carried out under the terms of a contract between CSRD and BGC dated May 17, 2019. While the study encompasses both electoral areas and municipalities, BGC was retained to complete prioritization from the perspective of CSRD (i.e. not individual municipalities).
BGC previously completed a geohazard risk prioritization study for the entire Thompson River Watershed, which includes approximately 20% of the CSRD (BGC March 31, 2019). The current work includes geohazard risk prioritization for the remaining 80% of the CSRD (Electoral Areas A and B, Town of Golden, City of Revelstoke) and integration of results with previous work to provide a single prioritization for the entire Regional District. BGC was retained to complete prioritization from the perspective of CSRD (not individual municipalities).
The primary objective of this study is to characterize and prioritize flood and steep creek (debris-flood and debris-flow) hazards in the CSRD that might impact developed properties. The goal is to support decisions that prevent or reduce injury or loss of life and economic loss due to geohazard events. Completion of this risk prioritization study is a step towards this goal.
The regional study provides the following outcomes across the CSRD:
• Identification and prioritization of flood and steep creek geohazard areas based on the principles of risk assessment (i.e., consideration of both hazards and consequences).
• Geospatial information management for both geohazard areas and elements at risk. • Web communication tool to view prioritized geohazard areas and supporting information. • Evaluation of the relative sensitivity of geohazard areas to climate change. • Flood and debris-flow bylaw and policy review, and recommendations for integration of
the study results into development permit areas (DPAs).
These outcomes support the CSRD to:
• Continue operating under existing flood-related policies and bylaws, but based on improved geohazard information and information management tools.
• Review and potentially revise Official Community Plans (OCPs) and related policies, bylaws, and land use and emergency management plans.
• Undertake flood resiliency planning, which speaks to the ability of an area “to prepare and plan for, [resist], recover from, and more successfully adapt to adverse events” (NRC, 2012).
• Develop a framework for geohazard risk management, including detailed hazard mapping, risk assessment, and mitigation planning.

Columbia Shuswap Regional District April 16, 2020 Geohazard Risk Prioritization - FINAL Project No.: 1899001
BGC ENGINEERING INC. Page 2
• Prepare funding applications to undertake additional work related to geohazard risk management within the CSRD.

C o l u m b i a S h u s w a p R e g i o n a l D i s t r i c t A p r i l 1 6 , 2 0 2 0
G e o h a z a r d R i s k P r i o r i t i z a t i o n - F I N A L P r o j e c t N o . : 1 8 9 9 0 0 1
B G C E N G I N E E R I N G I N C . Page 3
F i g u r e 1 - 1 . C S R D s t u d y a r e a .

Columbia Shuswap Regional District April 16, 2020 Geohazard Risk Prioritization - FINAL Project No.: 1899001
BGC ENGINEERING INC. Page 4
The work considered the Engineers and Geoscientists BC (EGBC) Professional Practice Guidelines for Legislated Flood Assessments in a Changing Climate in BC (EGBC, 2018) and Flood Mapping in BC Professional Practice Guidelines (EGBC, 2017). The study framework also considered the United Nations International Strategy for Disaster Reduction (UNISDR) Sendai Framework (UNISDR, 2015). Specifically, it focuses on the first UNISDR priority for action, understanding disaster risk, and is a starting point for the remaining priorities, which focus on strengthening disaster risk governance, improving resilience, and enhancing disaster preparedness.
1.2. Why This Study? In February 2018, the Fraser Basin Council (FBC) launched a geohazard risk prioritization study for the entire Thompson River Watershed (TRW) at a Community to Community Forum in Kamloops, British Columbia with participation of local government (including the CSRD) and First Nations. Approximately 20% of the CSRD was included in the TRW study area (Electoral Areas C, D, E, & F). Through the TRW project, the CSRD recognized the value of extending the study across the remainder of the Regional District (including the portion within the Columbia River Watershed). Additional NDMP funding in 2018 allowed for Areas A & B to be added.
Many communities exist in areas subject to flood or landslide hazards within the CSRD. While efforts have been made to compile hazard information, gaps exist that have challenged the CSRD to make land development decisions in hazard areas. The projected hydro-climatic effects of climate change are an added complication to this effort.
Specific gaps identified at the outset of this regional study included:
• Incomplete extent: many areas subject to flood-related hazards had not yet been identified in the CSRD.
• Process range insufficiently identified: flood processes are highly diverse. Particularly at high return periods (greater than 100 years), issues such as extensive bank erosion, debris flows and debris floods may dominate the flood hazard.
• Inconsistent methods and scale: flood and steep creek hazards have not been assessed and/or mapped with consistent methods or level of detail across the entire CSRD.
• Inconsistent hazard ratings: prior to the current regional study, no region-wide, geospatial dataset existed or consistent ratings for flood geohazards type, likelihood, magnitude or intensity had been established (destructive potential).
• Incomplete classification of elements at risk: for example, building footprints that could be used to assess flood vulnerability are only available for select buildings in the study area, and some cadastral parcels contain residential buildings that have not been identified and included in BC Assessment data.
• Inconvenient format: some clear-water flood and steep creek hazard data exist within pdf format reports that cannot easily be georeferenced and integrated together to build a common knowledge base.
• Not risk-based: prior to the current study, information had not been available to support flood management decisions based on systematic assessment of both flood hazards and relative consequences at the scale of the entire CSRD.
Columbia Shuswap Regional District April 16, 2020 Geohazard Risk Prioritization - FINAL Project No.: 1899001
BGC ENGINEERING INC. Page 5
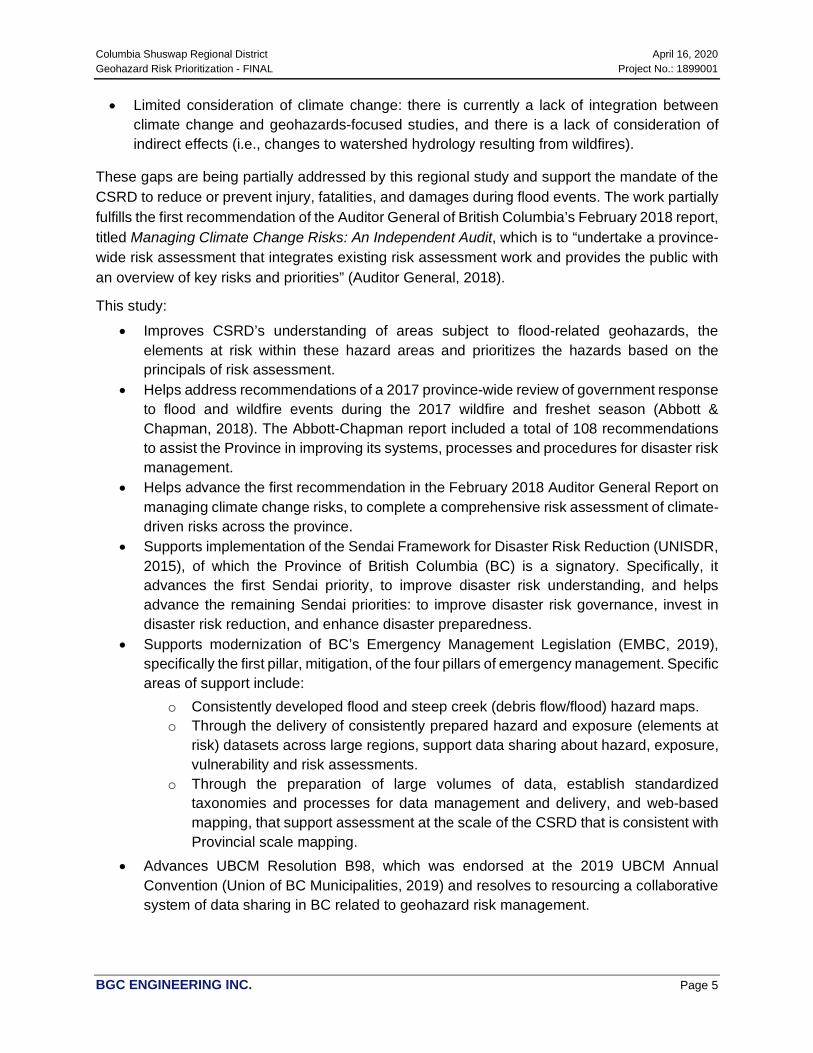
• Limited consideration of climate change: there is currently a lack of integration between climate change and geohazards-focused studies, and there is a lack of consideration of indirect effects (i.e., changes to watershed hydrology resulting from wildfires).
These gaps are being partially addressed by this regional study and support the mandate of the CSRD to reduce or prevent injury, fatalities, and damages during flood events. The work partially fulfills the first recommendation of the Auditor General of British Columbia’s February 2018 report, titled Managing Climate Change Risks: An Independent Audit, which is to “undertake a province-wide risk assessment that integrates existing risk assessment work and provides the public with an overview of key risks and priorities” (Auditor General, 2018).
This study:
• Improves CSRD’s understanding of areas subject to flood-related geohazards, the elements at risk within these hazard areas and prioritizes the hazards based on the principals of risk assessment.
• Helps address recommendations of a 2017 province-wide review of government response to flood and wildfire events during the 2017 wildfire and freshet season (Abbott & Chapman, 2018). The Abbott-Chapman report included a total of 108 recommendations to assist the Province in improving its systems, processes and procedures for disaster risk management.
• Helps advance the first recommendation in the February 2018 Auditor General Report on managing climate change risks, to complete a comprehensive risk assessment of climate-driven risks across the province.
• Supports implementation of the Sendai Framework for Disaster Risk Reduction (UNISDR, 2015), of which the Province of British Columbia (BC) is a signatory. Specifically, it advances the first Sendai priority, to improve disaster risk understanding, and helps advance the remaining Sendai priorities: to improve disaster risk governance, invest in disaster risk reduction, and enhance disaster preparedness.
• Supports modernization of BC’s Emergency Management Legislation (EMBC, 2019), specifically the first pillar, mitigation, of the four pillars of emergency management. Specific areas of support include:
o Consistently developed flood and steep creek (debris flow/flood) hazard maps. o Through the delivery of consistently prepared hazard and exposure (elements at
risk) datasets across large regions, support data sharing about hazard, exposure, vulnerability and risk assessments.
o Through the preparation of large volumes of data, establish standardized taxonomies and processes for data management and delivery, and web-based mapping, that support assessment at the scale of the CSRD that is consistent with Provincial scale mapping.
• Advances UBCM Resolution B98, which was endorsed at the 2019 UBCM Annual Convention (Union of BC Municipalities, 2019) and resolves to resourcing a collaborative system of data sharing in BC related to geohazard risk management.

Columbia Shuswap Regional District April 16, 2020 Geohazard Risk Prioritization - FINAL Project No.: 1899001
BGC ENGINEERING INC. Page 6
1.3. Terminology This report refers to the following key definitions1:
• Asset: anything of value, including both anthropogenic and natural assets2, and items of economic or intangible value.
• Annual Exceedance Probability (AEP): chance that a flood magnitude is exceeded in any year. For example, a flood with a 0.5% AEP has a one in two hundred chance (i.e., 200-year return period) of being exceeded in any year. While AEP is increasingly replacing the use of the term ‘return period’ to describe flood recurrence intervals, both terms are used in this document.
• Clear-water floods: riverine and lake flooding resulting from inundation due to an excess of clear-water discharge in a watercourse or body of water such that land outside the natural or artificial banks which is not normally under water is submerged. While called “clear-water floods”, such floods still transport sediment, but at a lower concentration by volume than debris floods or debris flows. Appendix D provides a more comprehensive description of clear-water flood processes.
• Steep-creek processes: rapid flow of water and debris in a steep channel, often associated with avulsions and strong bank erosion. Most stream channels within the CSRD are tributary creeks subject to steep creek processes that carry larger volumetric concentrations of debris than clear-water floods. The term steep creek processes is used in this report as a collective term for debris flows and debris floods. Appendix E provides a comprehensive description of steep creek processes.
• Consequence: formally, the conditional probability that elements at risk will suffer some severity of damage or loss, given geohazard impact with a certain intensity (destructive potential). In this study, the term was simplified to reflect the level of detail of assessment. Consequence refers to the relative potential for loss between hazard areas. Consequence ratings considers the value of elements at risk and intensity (destructive potential) of a geohazard, but do not provide an absolute estimate of loss.
• Elements at Risk: assets exposed to potential consequences of geohazard events. • Exposure model: organized geospatial data about the location and characteristics of
elements at risk. • Flood Construction Level (FCL): a designated flood level plus freeboard, or where a
designated flood level cannot be determined, a specified height above a natural boundary, natural ground elevation, or any obstruction that could cause flooding.
• Flood mapping: delineation of flood lines and elevations on a base map, typically taking the form of flood lines on a map that show the area that will be covered by water, or the elevation that water would reach during a flood event. For more complex scenarios, the data shown on the maps may also include flow velocities, depth, other hazard parameters, and vulnerabilities.
• Flood setback: the required minimum distance from the natural boundary of a watercourse or waterbody to maintain a floodway and allow for potential erosion.
1 CSA (1997), EGBC (2017, 2018). 2 Assets of the natural environment: these consist of biological assets (produced or wild), land and water areas with
their ecosystems, subsoil assets and air (UNSD, 1997).
Columbia Shuswap Regional District April 16, 2020 Geohazard Risk Prioritization - FINAL Project No.: 1899001
BGC ENGINEERING INC. Page 7
• Geohazard: all geophysical processes with the potential to result in some undesirable outcome, including floods and other types of geohazards.
• Hazardous flood: a flood that is a source of potential harm. • Resilience: the ability of a system, community or society exposed to hazards to resist,
absorb, accommodate to, and recover from the effects of a hazard in a timely and efficient manner, including through the preservation and restoration of its essential basic structures and functions.
• Risk: a measure of the probability of a specific geohazard event occurring and the consequence of that event.
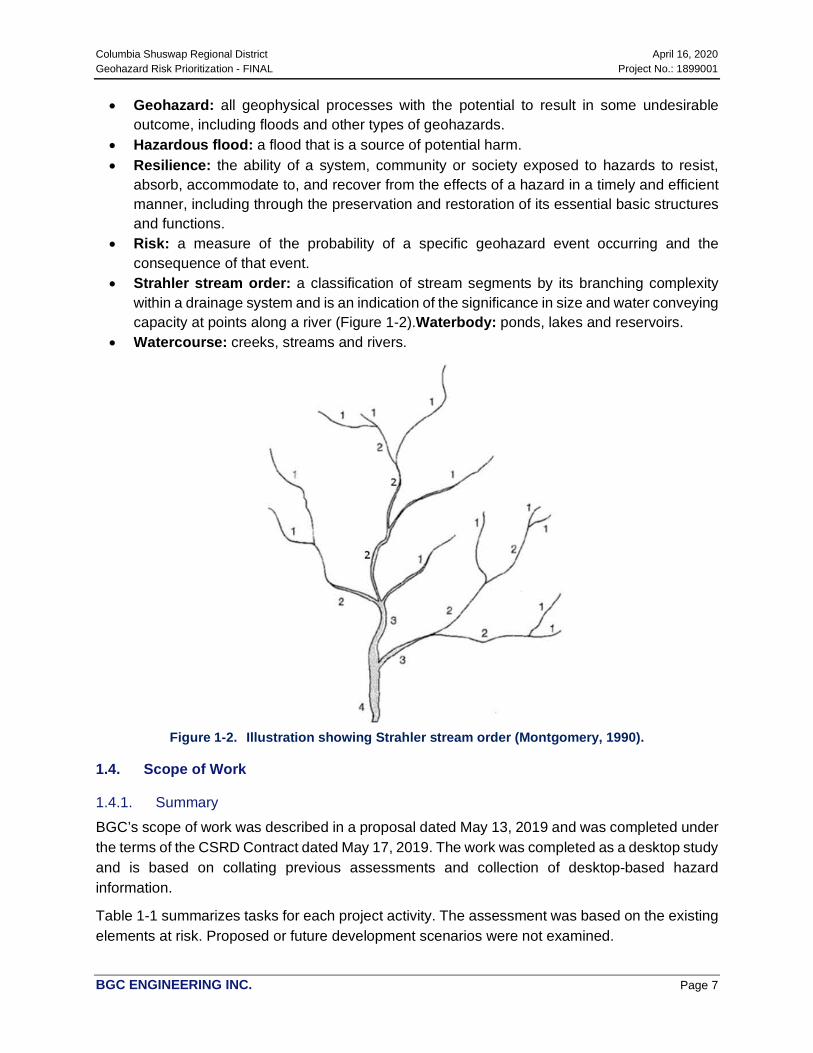
• Strahler stream order: a classification of stream segments by its branching complexity within a drainage system and is an indication of the significance in size and water conveying capacity at points along a river (Figure 1-2).Waterbody: ponds, lakes and reservoirs.
• Watercourse: creeks, streams and rivers.
Figure 1-2. Illustration showing Strahler stream order (Montgomery, 1990).
1.4. Scope of Work
1.4.1. Summary BGC’s scope of work was described in a proposal dated May 13, 2019 and was completed under the terms of the CSRD Contract dated May 17, 2019. The work was completed as a desktop study and is based on collating previous assessments and collection of desktop-based hazard information.
Table 1-1 summarizes tasks for each project activity. The assessment was based on the existing elements at risk. Proposed or future development scenarios were not examined.

Columbia Shuswap Regional District April 16, 2020 Geohazard Risk Prioritization - FINAL Project No.: 1899001
BGC ENGINEERING INC. Page 8
Outcomes of this study include both documentation (this report) and digital deliverables. Digital format results are provided for download, and through a web application called Cambio Communities™ (Cambio). The web application will be provided until March 31, 2021 and thereafter hosted for a license fee if requested by CSRD or on behalf of CSRD by other agencies (i.e., Province of BC).
Columbia Shuswap Regional District April 16, 2020 Geohazard Risk Prioritization - FINAL Project No.: 1899001
BGC ENGINEERING INC. Page 9
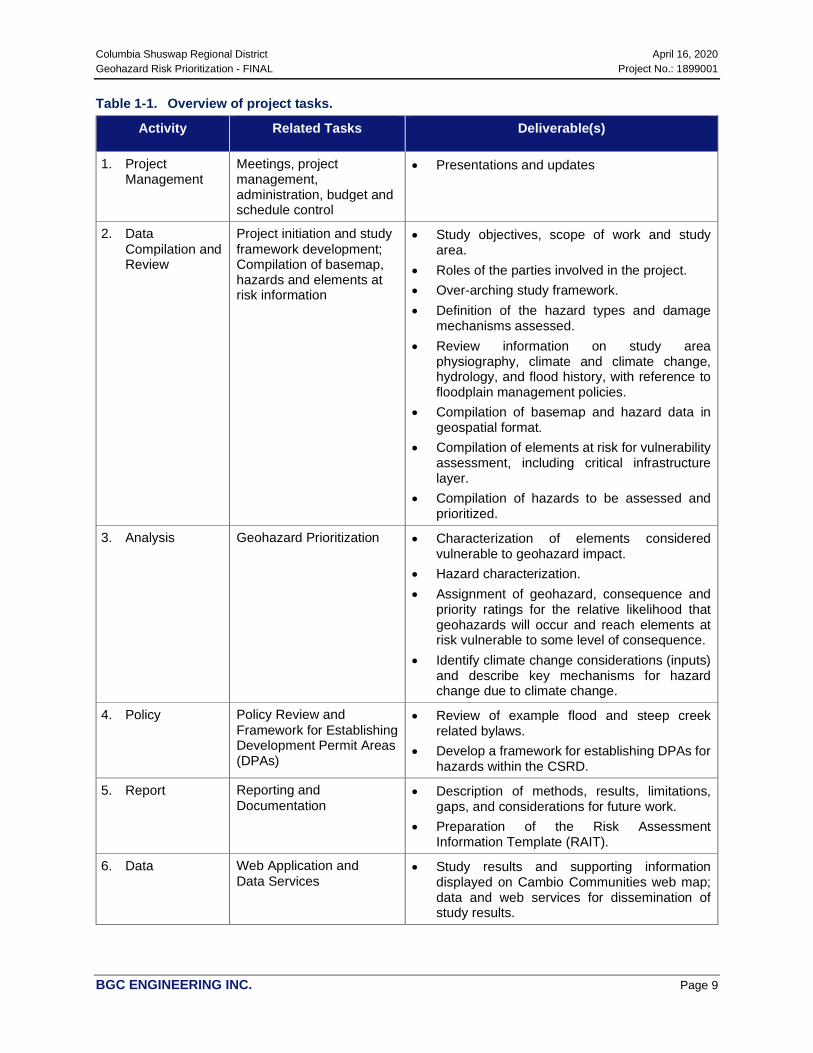
Table 1-1. Overview of project tasks.
Activity Related Tasks Deliverable(s)
1. Project Management
Meetings, project management, administration, budget and schedule control
• Presentations and updates
2. Data Compilation and Review
Project initiation and study framework development; Compilation of basemap, hazards and elements at risk information
• Study objectives, scope of work and study area.
• Roles of the parties involved in the project. • Over-arching study framework. • Definition of the hazard types and damage
mechanisms assessed. • Review information on study area
physiography, climate and climate change, hydrology, and flood history, with reference to floodplain management policies.
• Compilation of basemap and hazard data in geospatial format.
• Compilation of elements at risk for vulnerability assessment, including critical infrastructure layer.
• Compilation of hazards to be assessed and prioritized.
3. Analysis Geohazard Prioritization • Characterization of elements considered vulnerable to geohazard impact.
• Hazard characterization. • Assignment of geohazard, consequence and
priority ratings for the relative likelihood that geohazards will occur and reach elements at risk vulnerable to some level of consequence.
• Identify climate change considerations (inputs) and describe key mechanisms for hazard change due to climate change.
4. Policy Policy Review and Framework for Establishing Development Permit Areas (DPAs)
• Review of example flood and steep creek related bylaws.
• Develop a framework for establishing DPAs for hazards within the CSRD.
5. Report Reporting and Documentation
• Description of methods, results, limitations, gaps, and considerations for future work.
• Preparation of the Risk Assessment Information Template (RAIT).
6. Data Web Application and Data Services
• Study results and supporting information displayed on Cambio Communities web map; data and web services for dissemination of study results.
Columbia Shuswap Regional District April 16, 2020 Geohazard Risk Prioritization - FINAL Project No.: 1899001
BGC ENGINEERING INC. Page 10
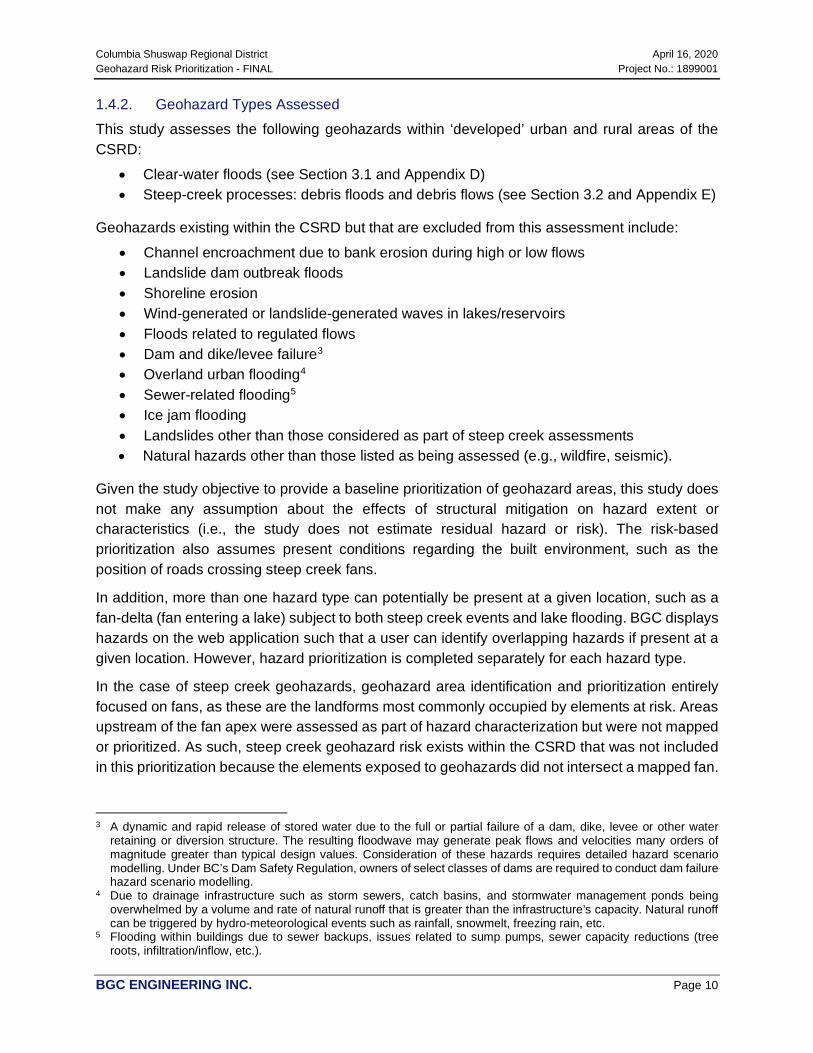
1.4.2. Geohazard Types Assessed This study assesses the following geohazards within ‘developed’ urban and rural areas of the CSRD:
• Clear-water floods (see Section 3.1 and Appendix D) • Steep-creek processes: debris floods and debris flows (see Section 3.2 and Appendix E)
Geohazards existing within the CSRD but that are excluded from this assessment include:
• Channel encroachment due to bank erosion during high or low flows • Landslide dam outbreak floods • Shoreline erosion • Wind-generated or landslide-generated waves in lakes/reservoirs • Floods related to regulated flows • Dam and dike/levee failure3 • Overland urban flooding4 • Sewer-related flooding5 • Ice jam flooding • Landslides other than those considered as part of steep creek assessments • Natural hazards other than those listed as being assessed (e.g., wildfire, seismic).
Given the study objective to provide a baseline prioritization of geohazard areas, this study does not make any assumption about the effects of structural mitigation on hazard extent or characteristics (i.e., the study does not estimate residual hazard or risk). The risk-based prioritization also assumes present conditions regarding the built environment, such as the position of roads crossing steep creek fans.
In addition, more than one hazard type can potentially be present at a given location, such as a fan-delta (fan entering a lake) subject to both steep creek events and lake flooding. BGC displays hazards on the web application such that a user can identify overlapping hazards if present at a given location. However, hazard prioritization is completed separately for each hazard type.
In the case of steep creek geohazards, geohazard area identification and prioritization entirely focused on fans, as these are the landforms most commonly occupied by elements at risk. Areas upstream of the fan apex were assessed as part of hazard characterization but were not mapped or prioritized. As such, steep creek geohazard risk exists within the CSRD that was not included in this prioritization because the elements exposed to geohazards did not intersect a mapped fan.
3 A dynamic and rapid release of stored water due to the full or partial failure of a dam, dike, levee or other water
retaining or diversion structure. The resulting floodwave may generate peak flows and velocities many orders of magnitude greater than typical design values. Consideration of these hazards requires detailed hazard scenario modelling. Under BC’s Dam Safety Regulation, owners of select classes of dams are required to conduct dam failure hazard scenario modelling.
4 Due to drainage infrastructure such as storm sewers, catch basins, and stormwater management ponds being overwhelmed by a volume and rate of natural runoff that is greater than the infrastructure’s capacity. Natural runoff can be triggered by hydro-meteorological events such as rainfall, snowmelt, freezing rain, etc.
5 Flooding within buildings due to sewer backups, issues related to sump pumps, sewer capacity reductions (tree roots, infiltration/inflow, etc.).
Columbia Shuswap Regional District April 16, 2020 Geohazard Risk Prioritization - FINAL Project No.: 1899001
BGC ENGINEERING INC. Page 11
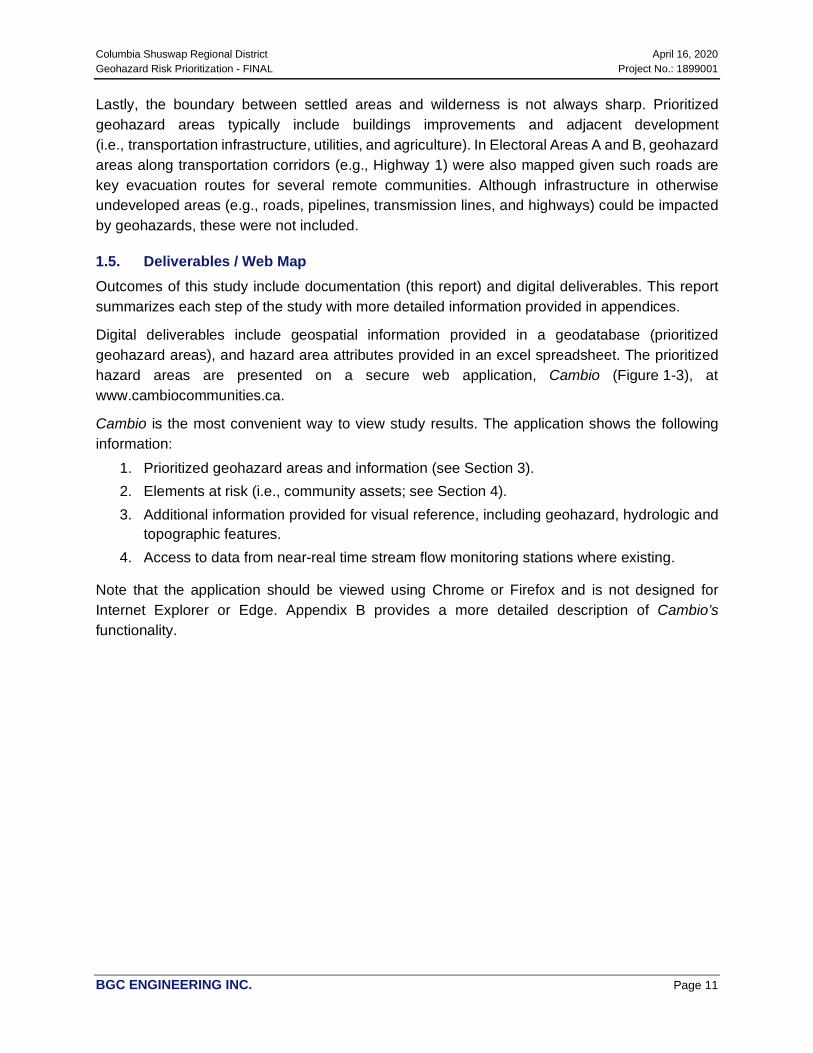
Lastly, the boundary between settled areas and wilderness is not always sharp. Prioritized geohazard areas typically include buildings improvements and adjacent development (i.e., transportation infrastructure, utilities, and agriculture). In Electoral Areas A and B, geohazard areas along transportation corridors (e.g., Highway 1) were also mapped given such roads are key evacuation routes for several remote communities. Although infrastructure in otherwise undeveloped areas (e.g., roads, pipelines, transmission lines, and highways) could be impacted by geohazards, these were not included.
1.5. Deliverables / Web Map Outcomes of this study include documentation (this report) and digital deliverables. This report summarizes each step of the study with more detailed information provided in appendices.
Digital deliverables include geospatial information provided in a geodatabase (prioritized geohazard areas), and hazard area attributes provided in an excel spreadsheet. The prioritized hazard areas are presented on a secure web application, Cambio (Figure 1-3), at www.cambiocommunities.ca.
Cambio is the most convenient way to view study results. The application shows the following information:
1. Prioritized geohazard areas and information (see Section 3). 2. Elements at risk (i.e., community assets; see Section 4). 3. Additional information provided for visual reference, including geohazard, hydrologic and
topographic features. 4. Access to data from near-real time stream flow monitoring stations where existing.
Note that the application should be viewed using Chrome or Firefox and is not designed for Internet Explorer or Edge. Appendix B provides a more detailed description of Cambio’s
functionality.
Columbia Shuswap Regional District April 16, 2020 Geohazard Risk Prioritization - FINAL Project No.: 1899001
BGC ENGINEERING INC. Page 12
Figure 1-3. Example of Cambio web application.
Columbia Shuswap Regional District April 16, 2020 Geohazard Risk Prioritization - FINAL Project No.: 1899001
BGC ENGINEERING INC. Page 13
2. BACKGROUND
2.1. Administration The CSRD covers approximately 30,000 km2 in southwestern British Columbia. The CSRD is divided into six electoral districts (A to F) and the following four municipalities (Figure 1-1):
• Town of Golden • City of Revelstoke • District of Sicamous • City of Salmon Arm.
The total Census population is approximately 51,400 people (Statistics Canada, 2016), with most people residing along the Columbia Valley near Golden, BC, in the vicinity of Revelstoke, or throughout “The Shuswap”, which includes areas around Shuswap Lake and Salmon Arm. The region contains building improvements with an assessed value of $9.4 billion (BC Assessment, 2018).
The CSRD contains three regulated hydroelectric reservoirs: Upper Arrow Lake which is impounded by the Keenleyside Dam; Revelstoke Lake, which is impounded by the Revelstoke Dam; and Kinbasket Lake, which is impounded by the Mica Dam. These facilities are operated by BC Hydro and control flows on the Columbia River.
2.2. Physiography The CSRD lies within the generalized physiographic regions of the Columbia Mountains and Southern Rockies, and the Interior Plateau (Holland, 1976).
The Columbia Mountains and Southern Rockies physiographic region is located through central and eastern CSRD and spans 80% of the Regional District. This region is characterized by steep and high-relief slopes of the Columbia and Rocky Mountain Ranges. The Columbia Range is further divided into the Monashee, Selkirk, and Purcell Ranges. The highest peaks are generally concentrated along the eastern margin of CSRD and reach elevations up to 3,600 m (i.e., Mount Clemenceau). Valleys containing rivers and lakes divide the steep mountain slopes. These valleys predominantly trend northeast-southwest or northwest-southeast. The Columbia Valley divides the Columbia and Rocky Mountain ranges and is the broadest (>10 km wide) and most extensive valley within the CSRD.
The Interior Plateau physiographic region is located in western CSRD and spans the Shuswap area. This area is characterized by rolling mountainous terrain and more moderate slopes in comparison to the Columbia and Rocky Mountain physiographic region. The highest peaks reach elevations of approximately 2,000 m. Valleys divide the mountain peaks and contain varied river morphologies from V-shaped to relatively flat plains such as those near Salmon Arm. Shuswap Lake occupies several valleys in this region.

Columbia Shuswap Regional District April 16, 2020 Geohazard Risk Prioritization - FINAL Project No.: 1899001
BGC ENGINEERING INC. Page 14
2.3. Ecoregions The CSRD spans twelve ecosections6 that divide six ecoregions7 (DeMarchi, 2011). Figure 2-1 illustrates the boundaries of each ecosection. Table 2-1 provides a summary of the characteristics of the ecosections within CSRD.
6 Ecosections are areas with minor physiographic and macroclimatic or oceanographic variation. Eco-sections are
typically mapped at a 1:250,000 scale for resource emphasis and area planning (DeMarchi ,2011). 7 Ecoregions are areas with major physiographic and minor macroclimatic or oceanographic variation. Ecoregions
are typically mapped at 1:500,000 scales for strategic planning (DeMarchi, 2011).
C o l u m b i a S h u s w a p R e g i o n a l D i s t r i c t A p r i l 1 6 , 2 0 2 0
G e o h a z a r d R i s k P r i o r i t i z a t i o n - F I N A L P r o j e c t N o . : 1 8 9 9 0 0 1
B G C E N G I N E E R I N G I N C . Page 15
F i g u r e 2 - 1 . E c o s e c t i o n s w i t h i n t h e C S R D ( D e M a r c h i , 2 0 1 1 ) . N o t e t h e W e s t e r n O k a n a g a n U p l a n d a n d N o r t h e r n T h o m p s o n U p l a n d o c c u p i e s
3 k m 2 a n d 1 9 k m 2 o f t h e C S R D ( T a b l e 2 - 1 ) .

Columbia Shuswap Regional District April 16, 2020 Geohazard Risk Prioritization - FINAL Project No.: 1899001
BGC ENGINEERING INC. Page 16
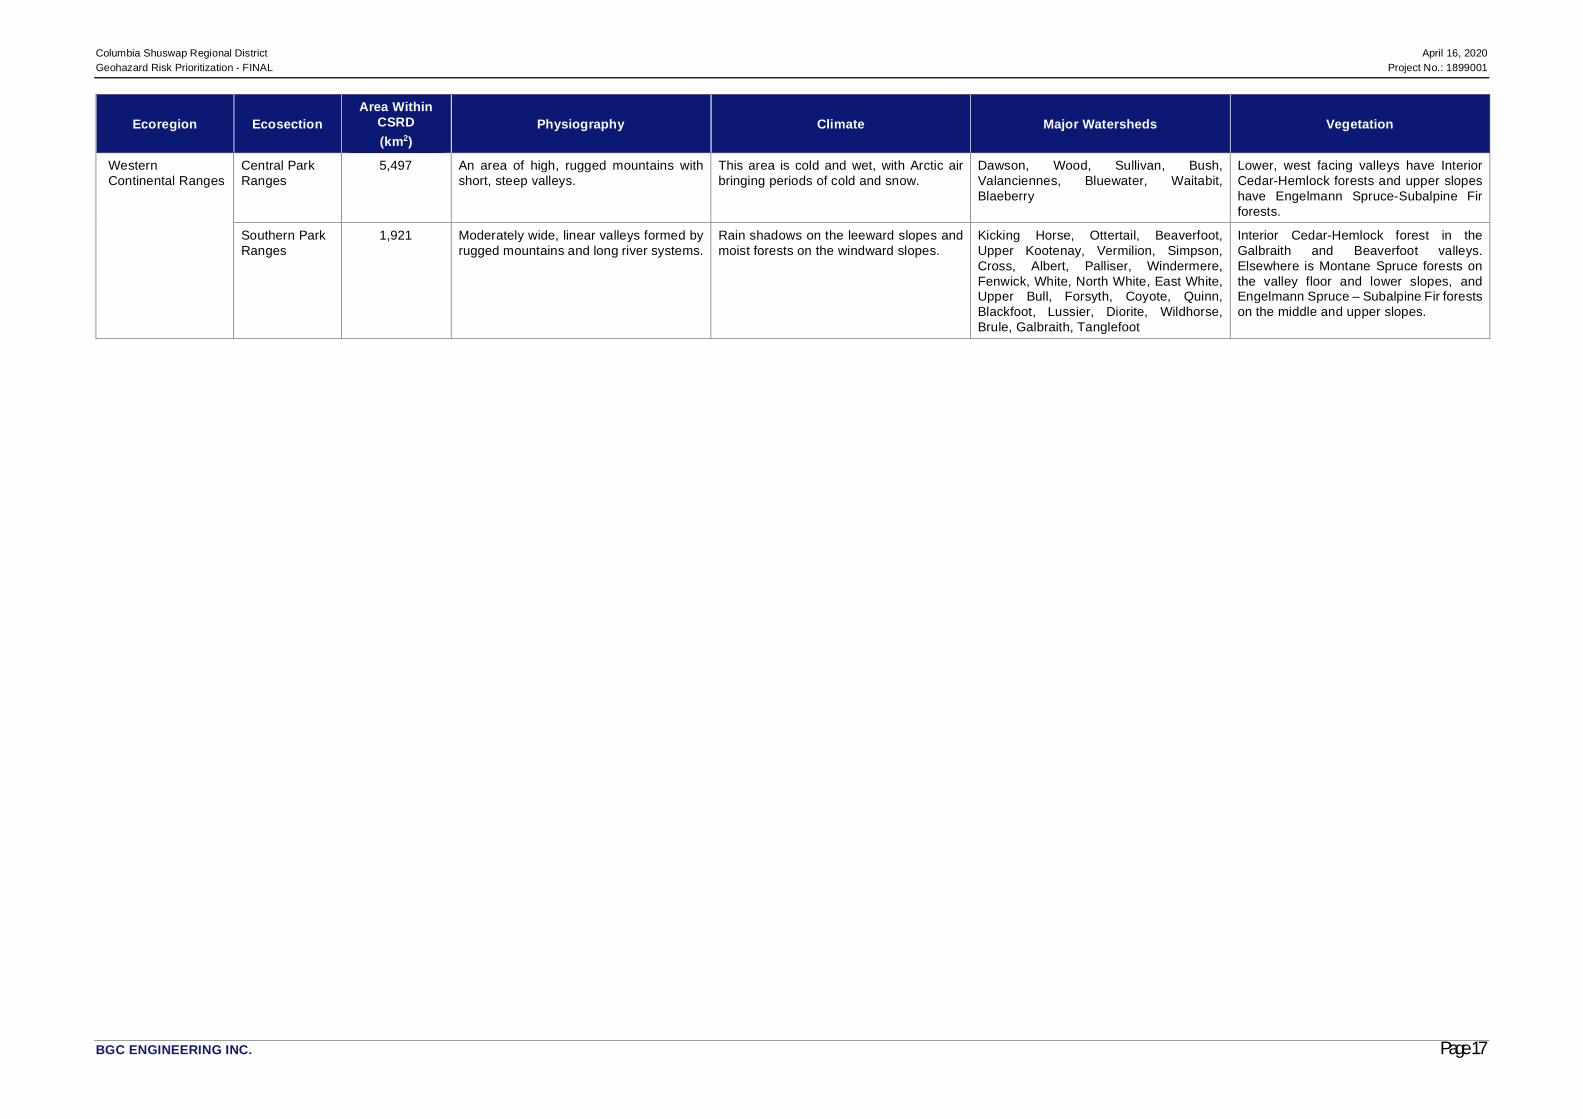
Table 2-1. Ecoregions and ecosections of the CSRD (as defined by Demarchi, 2011 and shown on Figure 2-1).
Ecoregion Ecosection Area Within
CSRD (km2)
Physiography Climate Major Watersheds Vegetation
Thompson-Okanagan Plateau
Northern Thompson Upland
19 An area of rolling upland and high overall relief, valley sides are steep due to glacial erosion.
Warm, dry summers and wet, cool winters with high snowfall.
North Thompson River, McGillivray, Lewis, Nisconlith, Sinmax, Barriere, Chu Chua, Joseph
Complex vegetation zones, including rising moist air in the east, winter Arctic air outbreaks from the northwest, and dry valley climates in the summer.
Shuswap Basin 1,424 Rolling plateau uplands, steep side plateau walls, large inter-plateau lowlands.
Dry montane climate, colder and more moist at high elevations.
Salmon River, Little, Shuswap, Deep, Chase, Monte
Sagebrush-steppe on the slopes, Cedar-Hemlock forests in shaded areas, Lodgepole pine forests in the uplands, and Engelmann Spruce-Subalpine Fir at higher elevations.
Western Okanagan Upland
3 Rounded upland area, rising steeply to the east and more gently to the west. Intergrades into ranges to the south and north.
Generally cool and moist, except for hot, dry periods during the summer. Frequent rain in the summer and fall, and snow in the winter.
Trepanier, Lambly, Shorts, Whitman, Equesis, Salmon River, Nicola, Quilchena, Pothole
Forests are primarily Douglas Fir, Montane Spruce, and Engelmann Spruce-Subalpine Fir. Areas of Interior Cedar-Hemlock on the northeast slopes.
Columbia Highlands
Northern Shuswap Highland
2,614 A gentle to moderately sloping highland, with rounded summits and ridges and steep valley sides due to glacial activity.
Warmer, with milder winters and significant rain or snow.
Clearwater, North Thompson, Adams, Seymour, Eagle, Raft, Mud, Barriere, Cayenne, Kwikoit
Interior Cedar-Hemlock forests along valley bottoms and lower slopes. Engelmann Spruce-Subalpine Fir forests along middle and upper slopes.
Shuswap River Highland
1,057 Rolling uplands ranging from gentle to steep-sided, cut by the Shuswap River, Shuswap Lake, and associated waterways.
Valleys alternate between rain shadow conditions and heavy precipitation, and in winter heavy snowfall.
Eagle, Shuswap, Sicamous, Kingfisher, Tsuis
Interior Cedar-Hemlock forests along valleys and lower slopes. Engelmann Spruce-Subalpine Fir forests along upper slopes and ridges.
Northern Columbia Mountains
Central Columbia Mountains
1,785 High ridges and mountains with narrow valleys.
High humidity and rain in the summer, heavy snow in the winter.
Lardeau, Lake, Glacier, Hamill, Fry, Carney, Campbell, Kaslo, Keen, Kokanee, Slocan River, Burton, Snow, Goathaven, Caribou, Slewiskin, Kuskanax, Halfway, Crawford, Begbie, Mulvehill, Cranberry, Fosthall, Arrow Park, Whatshan
Interior Cedar-Hemlock forests along valleys and lower slopes. Engelmann Spruce-Subalpine Fir forests along middle mountain slopes.
Northern Kootenay Mountains
12,092 High, rugged mountains. High rainfall and snowfall, and generally humid conditions.
Mud Creek, Adams River, Seymour, Crazy, Foster, Encampment, Windy, Bachelor, Beaver, Bigmouth, Goldstream, Downie, Scrip, Pat, Soards, Nagle, Duncan, Westfall, Geigdrich, Lake, Healy, Lardeau, Howser, Illecillewaet, Tangier, Incomappleux, Akolkglex
Interior Cedar-Hemlock forests along lower slopes. Engelmann Spruce-Subalpine Fir forests along upper slopes.
Purcell Transitional Ranges
Eastern Purcell Mountains
1,831 Rugged, mountainous area with high valleys and rounded foothills.
Located within a rain shadow producing relatively dry conditions. Extreme cold weather and snow can occur in the winter due to buildup of Arctic air masses.
Mather, Skookumchuck, Findlay, Dutch, Toby, Horsethief, Forster, Francis, Bugaboo, Vowell, Spillimacheen, Quartz
Dry interior Douglas-fir forests in the low, outer areas, and wet Interior Cedar-Hemlock forests to the north. Elsewhere are Montane Spruce in the main valleys and Engelmann Spruce-Subalpine Fir on the upper mountain slopes.
Southern Rocky Mountain Trench
Big Bend Trench
1,131 The narrowest section of the Southern Rocky Mountain Trench mostly flooded by the Kinbasket Lake reservoir.
Subject to high precipitation. Succour, Whitepine creeks Dry, silty/sandy benchlands have Interior Douglas-fir forests. Higher benches have Montane Spruce forests. Interior Cedar-Hemlock forests occur along higher benches in the northern portion of the section.
Upper Columbia Valley
683 A broad intermountain plain, narrowing to the north.
Located in a rain shadow, this area has high temperatures and clear skies in the summer. In the winter, trapped Arctic air masses cause dense cloud cover.
Dutch, Toby, Horsethief, Francis, Forester, Bugaboo, Bobbie Burns Spillamacheen, Kicking Horse, Blaeberry, Kindersley, Sinclair, Stoddart, Shuswap, Windermere
Columbia Shuswap Regional District April 16, 2020 Geohazard Risk Prioritization - FINAL Project No.: 1899001
BGC ENGINEERING INC. Page 17
Ecoregion Ecosection Area Within
CSRD (km2)
Physiography Climate Major Watersheds Vegetation
Western Continental Ranges
Central Park Ranges
5,497 An area of high, rugged mountains with short, steep valleys.
This area is cold and wet, with Arctic air bringing periods of cold and snow.
Dawson, Wood, Sullivan, Bush, Valanciennes, Bluewater, Waitabit, Blaeberry
Lower, west facing valleys have Interior Cedar-Hemlock forests and upper slopes have Engelmann Spruce-Subalpine Fir forests.
Southern Park Ranges
1,921 Moderately wide, linear valleys formed by rugged mountains and long river systems.
Rain shadows on the leeward slopes and moist forests on the windward slopes.
Kicking Horse, Ottertail, Beaverfoot, Upper Kootenay, Vermilion, Simpson, Cross, Albert, Palliser, Windermere, Fenwick, White, North White, East White, Upper Bull, Forsyth, Coyote, Quinn, Blackfoot, Lussier, Diorite, Wildhorse, Brule, Galbraith, Tanglefoot
Interior Cedar-Hemlock forest in the Galbraith and Beaverfoot valleys. Elsewhere is Montane Spruce forests on the valley floor and lower slopes, and Engelmann Spruce – Subalpine Fir forests on the middle and upper slopes.
Columbia Shuswap Regional District April 16, 2020 Geohazard Risk Prioritization - FINAL Project No.: 1899001
BGC ENGINEERING INC. Page 18
2.4. Geological History
This section summarizes bedrock and surficial geology in the CSRD to provide context on the fundamental earth processes that built the landscape assessed in this study.
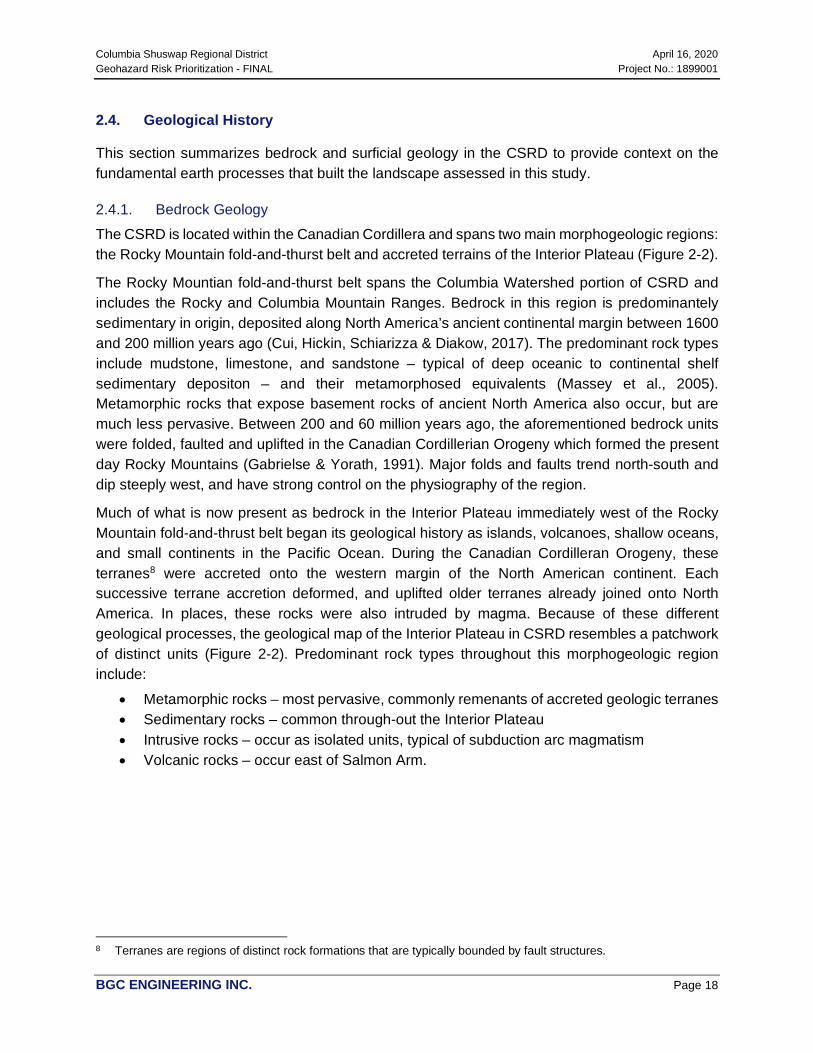
2.4.1. Bedrock Geology The CSRD is located within the Canadian Cordillera and spans two main morphogeologic regions: the Rocky Mountain fold-and-thurst belt and accreted terrains of the Interior Plateau (Figure 2-2).
The Rocky Mountian fold-and-thurst belt spans the Columbia Watershed portion of CSRD and includes the Rocky and Columbia Mountain Ranges. Bedrock in this region is predominantely sedimentary in origin, deposited along North America’s ancient continental margin between 1600 and 200 million years ago (Cui, Hickin, Schiarizza & Diakow, 2017). The predominant rock types include mudstone, limestone, and sandstone – typical of deep oceanic to continental shelf sedimentary depositon – and their metamorphosed equivalents (Massey et al., 2005). Metamorphic rocks that expose basement rocks of ancient North America also occur, but are much less pervasive. Between 200 and 60 million years ago, the aforementioned bedrock units were folded, faulted and uplifted in the Canadian Cordillerian Orogeny which formed the present day Rocky Mountains (Gabrielse & Yorath, 1991). Major folds and faults trend north-south and dip steeply west, and have strong control on the physiography of the region.
Much of what is now present as bedrock in the Interior Plateau immediately west of the Rocky Mountain fold-and-thrust belt began its geological history as islands, volcanoes, shallow oceans, and small continents in the Pacific Ocean. During the Canadian Cordilleran Orogeny, these terranes8 were accreted onto the western margin of the North American continent. Each successive terrane accretion deformed, and uplifted older terranes already joined onto North America. In places, these rocks were also intruded by magma. Because of these different geological processes, the geological map of the Interior Plateau in CSRD resembles a patchwork of distinct units (Figure 2-2). Predominant rock types throughout this morphogeologic region include:
• Metamorphic rocks – most pervasive, commonly remenants of accreted geologic terranes • Sedimentary rocks – common through-out the Interior Plateau • Intrusive rocks – occur as isolated units, typical of subduction arc magmatism • Volcanic rocks – occur east of Salmon Arm.
8 Terranes are regions of distinct rock formations that are typically bounded by fault structures.

C o l u m b i a S h u s w a p R e g i o n a l D i s t r i c t A p r i l 1 6 , 2 0 2 0
G e o h a z a r d R i s k P r i o r i t i z a t i o n - F I N A L P r o j e c t N o . : 1 8 9 9 0 0 1
B G C E N G I N E E R I N G I N C . Page 19
F i g u r e 2 - 2 . B e d r o c k g e o l o g y o f t h e C S R D . D i g i t a l m a p p i n g a n d b e d r o c k c l a s s e s f r o m C u i e t a l . ( 2 0 1 7 ) .

Columbia Shuswap Regional District April 16, 2020 Geohazard Risk Prioritization - FINAL Project No.: 1899001
BGC ENGINEERING INC. Page 20
2.4.2. Surficial Geology While the geologic history of the region is the basis for the landscape observed within CSRD, the present-day surficial material and topography is primarily a result of glacial activity and post glacial processes since deglaciation. The Late Pleistocene and early Holocene epochs (approximately 126,000 to 11,700 years before present) represents a time of repeated advances and retreats of glaciers across North America. Thick glaciers covered most of the CSRD during the most recent glaciation, which occurred approximately 25,000 to 10,000 years ago (Holland, 1976; Church & Ryder, 2010; Clague & Ward, 2011). The region was influenced by montane glaciers advancing from local peaks, coalescing in valley bottoms, and subsequently retreating. As glaciers flowed across the landscape, they sculpted the bedrock into cirques, horns, comb ridges, and “U”-shaped valleys. Reduced montane glaciers and ice fields are still present within alpine areas of the Rocky and Columbia Mountains.
As the glaciers began to melt, they left extensive till and ice-contact deposits on mountain flanks and in plains elevated above contemporary river levels. Valley bottoms were typically covered with successions of advance-outwash gravel, diamictic sandy silt and gravel till, and recessional-outwash gravel.
Retreating glacial ice also dammed river valleys throughout CSRD, forming extensive glacial lakes (e.g., Sawicki & Smith, 1991). These glacial lakes filled the major river valleys and deposited sediment, primarily silt, sand, and clay onto the valley floors (Fulton, 1965; Ryder et al., 1991).
Post-glacial streams and rivers eroded into the glacial and glacial lake deposits, leaving terraces flanked by steep slopes. These terraces are present within the broadest valleys (e.g., the Columbia Valley) but have been heavily eroded in some smaller valley systems.
A dendritic network of creeks and rivers drain steep slopes within the CSRD and transport sediment forming Holocene aged deposits. Sediment carried along rivers and creeks is delivered to floodplains and alluvial fans, before ultimately being deposited into large lake basins or carried further downstream by large rivers. Slopes that were oversteepend by glacial processes release material and form colluvial deposits at the base of steep slopes, these occur extensively throughout exposed mountainous areas of the Rocky Mountains.
2.5. Hydroclimate Climate is the average weather conditions that occur in an area over time. Climate is often described in terms of variables such as average temperature, precipitation and seasonal changes9. Climate change is a significant systematic shift in the long-term statistics of climate variables over several decades or longer due to natural or human induced forces10. An important distinction between climate variability and climate change is the persistence of unusual conditions, such as previously rare events occurring more frequently. For the CSRD, climate change can
9 http://www.wmo.int/pages/prog/wcp/ccl/faq/faq_doc_en.html. Accessed June 18, 2018. 10 According to the World Meteorological Organization, The United Nations Framework Convention on Climate Change
(UNFCCC) defines climate change in more specific terms as: “a change of climate which is attributed directly or indirectly to human activity that alters the composition of the global atmosphere and which is in addition to natural climate variability observed over comparable time periods”.

Columbia Shuswap Regional District April 16, 2020 Geohazard Risk Prioritization - FINAL Project No.: 1899001
BGC ENGINEERING INC. Page 21
result in a chance in the persistence of extreme events such as snow and ice storms, heavy rains, heat waves, thunder, lightning and wind storms. These events can contribute to a shift in the magnitude, rate and timing of rainfall and snowmelt, which can impact flood and steep creek hazards.
The following sections describes the regional-scale climatic conditions for CSRD, climate normals and projected climate impacts due to climate change.
2.5.1. Regional-Scale Climate Factors
Global air circulation patterns are driven by temperature differences found between different parts of the oceans and land. In British Columbia, the resultant air patterns cause weather to typically move from west to east, bringing moist, marine air across the province from the Pacific Ocean. In winter, weather generally arrives from the southwest compared to the summer, where it generally arrives from the northwest11. The approximately northwest-southeast orientation of the Columbia Mountains in the CSRD act as a barrier on these air patterns, forcing air to rise, cool and condense on the west side of the mountains. Mountains in this area are the wettest mountains of the BC Interior due to this orographic effect. The Rocky Mountains block arctic air originating from the north, although it can still enter valleys from the Rocky Mountain Trench under stronger pressures and cause enhanced frost and fog in these low-lying areas (DeMarchi, 2011).
Across the Columbia and Southern Rocky Mountains region, the climate within the CSRD is characteristic of mountainous terrain with cold, snowy winters and warm summers that can be wet or dry. The Regional District experiences a wide range of climatic conditions due to the physiographic variability outlined in Section 2.3. For example, precipitation is much lower in Golden, nestled within the Rocky Mountain Trench, compared to Mica Creek which is in the northwestern section of the CSRD. Mica Creek receives more rain from the orographic effect while Golden is on the lee side of the Columbia Mountains and is less exposed to such effects. The Rocky Mountains also lead to strong variations in the local climate due to variations in elevation, slope, and exposure.
2.5.2. Hydroclimate Conditions
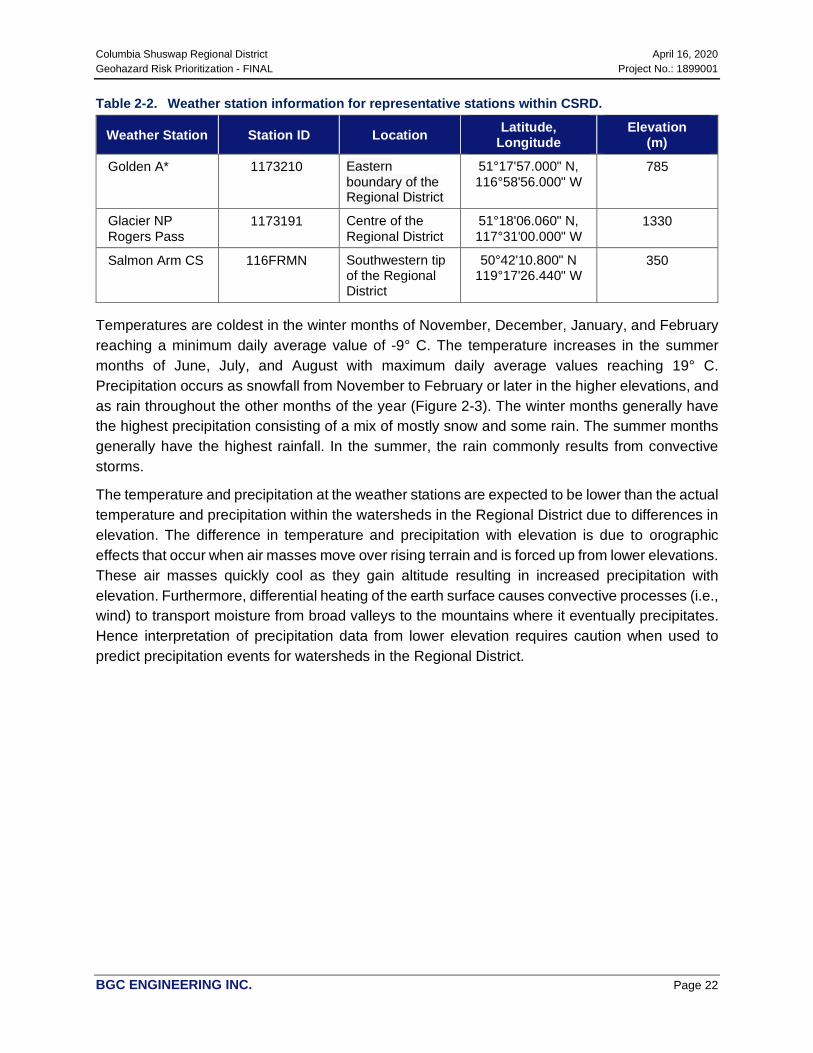
Table 2-2 lists representative weather stations reviewed to depict the range of temperature and precipitation conditions across the Regional District. These conditions are shown in Figure 2-7.
11 http://www.navcanada.ca/EN/media/Publications/Local%20Area%20Weather%20Manuals/LAWM-BC-3-EN.pdf.
Columbia Shuswap Regional District April 16, 2020 Geohazard Risk Prioritization - FINAL Project No.: 1899001
BGC ENGINEERING INC. Page 22
Table 2-2. Weather station information for representative stations within CSRD.
Weather Station Station ID Location Latitude, Longitude
Elevation (m)
Golden A* 1173210 Eastern boundary of the Regional District
51°17'57.000" N, 116°58'56.000" W
785
Glacier NP Rogers Pass
1173191 Centre of the Regional District
51°18'06.060" N, 117°31'00.000" W
1330
Salmon Arm CS 116FRMN Southwestern tip of the Regional District
50°42'10.800" N 119°17'26.440" W
350
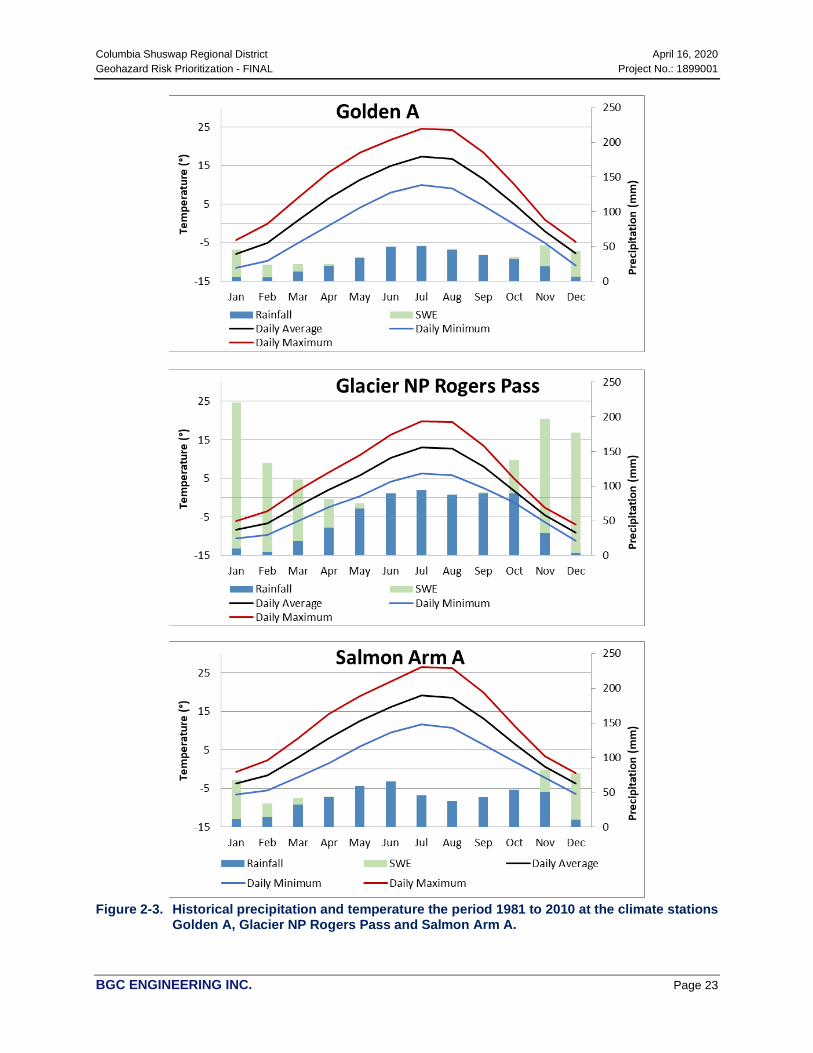
Temperatures are coldest in the winter months of November, December, January, and February reaching a minimum daily average value of -9° C. The temperature increases in the summer months of June, July, and August with maximum daily average values reaching 19° C. Precipitation occurs as snowfall from November to February or later in the higher elevations, and as rain throughout the other months of the year (Figure 2-3). The winter months generally have the highest precipitation consisting of a mix of mostly snow and some rain. The summer months generally have the highest rainfall. In the summer, the rain commonly results from convective storms.
The temperature and precipitation at the weather stations are expected to be lower than the actual temperature and precipitation within the watersheds in the Regional District due to differences in elevation. The difference in temperature and precipitation with elevation is due to orographic effects that occur when air masses move over rising terrain and is forced up from lower elevations. These air masses quickly cool as they gain altitude resulting in increased precipitation with elevation. Furthermore, differential heating of the earth surface causes convective processes (i.e., wind) to transport moisture from broad valleys to the mountains where it eventually precipitates. Hence interpretation of precipitation data from lower elevation requires caution when used to predict precipitation events for watersheds in the Regional District.
Columbia Shuswap Regional District April 16, 2020 Geohazard Risk Prioritization - FINAL Project No.: 1899001
BGC ENGINEERING INC. Page 23
Figure 2-3. Historical precipitation and temperature the period 1981 to 2010 at the climate stations
Golden A, Glacier NP Rogers Pass and Salmon Arm A.
Columbia Shuswap Regional District April 16, 2020 Geohazard Risk Prioritization - FINAL Project No.: 1899001
BGC ENGINEERING INC. Page 24
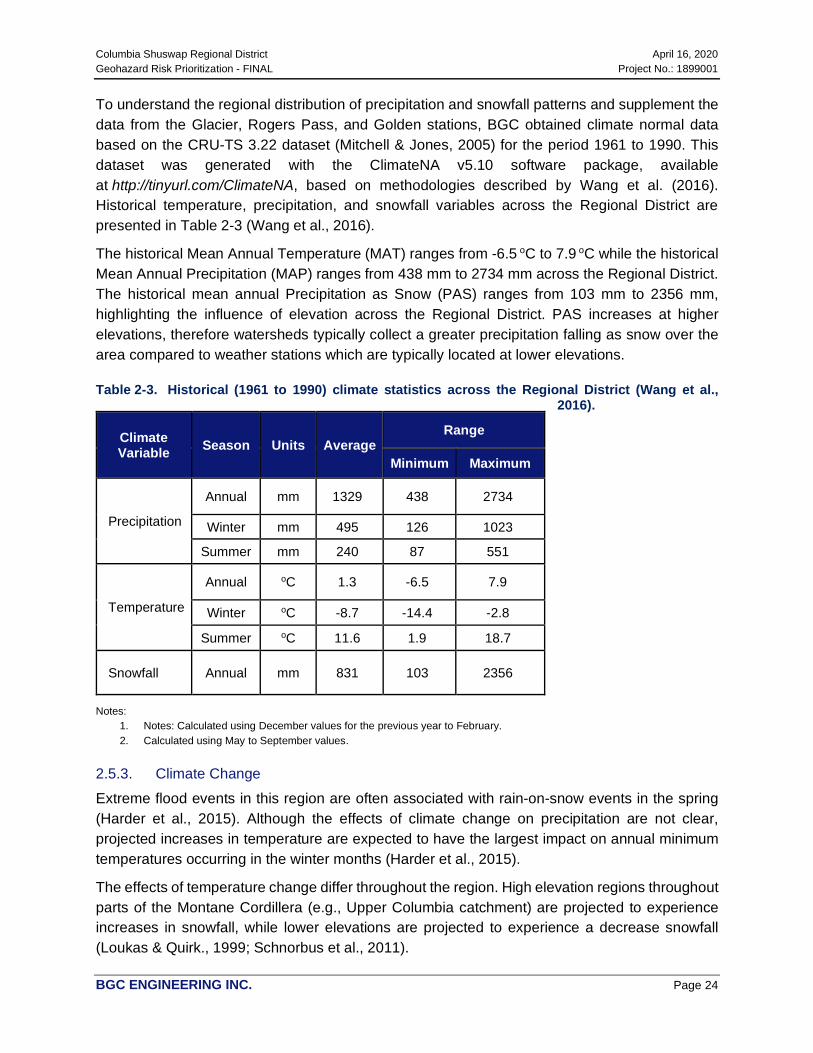
To understand the regional distribution of precipitation and snowfall patterns and supplement the data from the Glacier, Rogers Pass, and Golden stations, BGC obtained climate normal data based on the CRU-TS 3.22 dataset (Mitchell & Jones, 2005) for the period 1961 to 1990. This dataset was generated with the ClimateNA v5.10 software package, available at http://tinyurl.com/ClimateNA, based on methodologies described by Wang et al. (2016). Historical temperature, precipitation, and snowfall variables across the Regional District are presented in Table 2-3 (Wang et al., 2016).
The historical Mean Annual Temperature (MAT) ranges from -6.5 oC to 7.9 oC while the historical Mean Annual Precipitation (MAP) ranges from 438 mm to 2734 mm across the Regional District. The historical mean annual Precipitation as Snow (PAS) ranges from 103 mm to 2356 mm, highlighting the influence of elevation across the Regional District. PAS increases at higher elevations, therefore watersheds typically collect a greater precipitation falling as snow over the area compared to weather stations which are typically located at lower elevations.
Table 2-3. Historical (1961 to 1990) climate statistics across the Regional District (Wang et al., 2016).
Notes:
1. Notes: Calculated using December values for the previous year to February. 2. Calculated using May to September values.
2.5.3. Climate Change Extreme flood events in this region are often associated with rain-on-snow events in the spring (Harder et al., 2015). Although the effects of climate change on precipitation are not clear, projected increases in temperature are expected to have the largest impact on annual minimum temperatures occurring in the winter months (Harder et al., 2015).
The effects of temperature change differ throughout the region. High elevation regions throughout parts of the Montane Cordillera (e.g., Upper Columbia catchment) are projected to experience increases in snowfall, while lower elevations are projected to experience a decrease snowfall (Loukas & Quirk., 1999; Schnorbus et al., 2011).
Climate Variable Season Units Average
Range
Minimum Maximum
Precipitation
Annual mm 1329 438 2734
Winter mm 495 126 1023
Summer mm 240 87 551
Temperature
Annual oC 1.3 -6.5 7.9
Winter oC -8.7 -14.4 -2.8
Summer oC 11.6 1.9 18.7
Snowfall Annual mm 831 103 2356

Columbia Shuswap Regional District April 16, 2020 Geohazard Risk Prioritization - FINAL Project No.: 1899001
BGC ENGINEERING INC. Page 25
The Climate NA model provides downscaled climate projections for future conditions (Wang et al., 2016). The future climate projections are based on the average of an ensemble of 15 Global Climate Models (GCMs) of the CMIP512 multimodel dataset corresponding to the IPCC Assessment Report 5 (2013). The ClimateNA data for RCP 8.513 for 2050 suggests that the MAT in the Regional District is projected to increase from a historical value of 1.3⁰C to 4.9⁰C by 2050 (average between 2041 to 2070). The historical MAP is projected to increase from 1329 mm to 1429 mm while historical PAS is projected to decrease from 831 mm to 672 mm in the Regional District (Figure 2-4). Projected climate variables across the Regional District from the model are presented in Table 2-4 and Figure 2-4 (Wang et al., 2016).
Table 2-4. Predicted future climate variables based on the RCP 8.5, 2050 scenario across the Regional District (Wang et. al, 2016).
Climate Variable Season Units Average
Range
Minimum Maximum
Precipitation Annual mm 1429 456 2954
Winter mm 536 138 1112
Summer mm 224 84 521
Temperature Annual oC 5 -3 12
Winter oC -5 -11 1
Summer oC 16 6 23
Snowfall Annual mm 672 47 2384
The projected changes between the historic climate normals and the projected climate normals for the RCP 8.5 2050s scenario are summarized in Table 2-5. The magnitude of warming is projected to be greatest on the western portion compared to the eastern portion of the Regional District. This warming results in the largest change in MAP and PAS in the western area of the Regional District. The impacts of climate change may be moderated in areas of higher elevation where the MAT is projected to remain below the freezing threshold.
12 Coupled model intercomparison project phase 5 (Taylor, Stouffer, and Meehl, 2012). 13 RCP 8.5 (representative concentration pathway) corresponds to a high greenhouse gas emissions scenario, and is
generally the most relevant scenario for infrastructure design and assessment in British Columbia (EGBC, 2019)

Columbia Shuswap Regional District April 16, 2020 Geohazard Risk Prioritization - FINAL Project No.: 1899001
BGC ENGINEERING INC. Page 26
Table 2-5. Predicated changes in climate variables between the RCP 8.5, 2050 scenario and the historical climate (1961 to 1990) conditions across the Regional District (Wang et. al, 2016).
Figure 2-4. Comparison of historical (1961 to 1990) and projected (RCP 8.5, 2041 to 2070) climate
variables across the Regional District including a. Historical MAT; b. Projected MAT; c. Change in MAT; d. Historical MAP; e. Projected MAP; f. Change in MAP; g. Historical PAS; h. Projected PAS; i. Change in PAS.
Climate Variable Season Units Average Change
Range
Minimum Maximum
Change in Precipitation
Annual mm 100 18 220
Winter mm 42 12 89
Summer mm -16 -3 -30
Change in Temperature
Annual oC 3.5 3 4
Winter oC 3 3.4 3.8
Summer oC 4 4.1 4.3
Change in Snowfall Annual mm -159 -56 28

Columbia Shuswap Regional District April 16, 2020 Geohazard Risk Prioritization - FINAL Project No.: 1899001
BGC ENGINEERING INC. Page 27
Changes in discharge will vary spatially and seasonally based on snow and precipitation changes and topography-based temperature gradients. Researchers anticipate that streamflow will increase in the winter and spring in this region due to earlier snowmelt and more frequent rain-on-snow events, while an earlier timing of the peak discharge is expected in many rivers (Schnorbus et al., 2014; Farjad et al., 2016). Increases in streamflow in specific watersheds in winter and spring will result in proportional increases in flood and bank erosion hazards on rivers and steep creeks. It may also shift the debris-flow season from June or July in the CSRD to the fall months or create a second peak of debris flow activity (Appendix E, Section E.1.3).
2.6. Hydrology
2.6.1. Hydrological Regimes
Hydrologic regimes are controlled primarily by seasonal patterns of temperature and precipitation distribution across watersheds. Watershed characteristics also influence the temporal distribution of streamflow. For example, mountainous watersheds have an extended freshet period caused by the gradual melting of snow from lower to higher elevations. The presence of lakes, ponds, and wetlands can attenuate high flows as water goes into storage. Permeable bedrock will tend to have more water recharging groundwater during rain and melt events decreasing runoff but also moderating flows during dry periods. Alternatively, many glaciated areas have shallow soils underlain by compacted till which is relatively impermeable, thereby promoting runoff. Hydrologic regimes may also depend on the watershed scale particularly in areas of high relief. Small watersheds (less than a few km2) tend to have higher mean elevations than larger watersheds leading to a delayed seasonal melt freshet compared to larger watersheds (Eaton & Moore, 2010).
Annual river flow distribution in BC can be classified into one of five streamflow regimes (Ministry of Forests and Range, 2010):
• Pluvial (rain driven) • Pluvial-dominant hybrid (rain dominant) • Nival-dominant hybrid (snowmelt driven) • Nival (snowmelt dominant) • Glacial-supported nival (snowmelt driven in spring and glacial melt driven in summer).
The CSRD covers an area where the watercourses are characterized by nival-dominant hydrid and nival hydrologic regimes. Substantial orographic uplift occurs in this area due to the Columbia Mountains resulting in two (of the five) hydrologic regimes (nival-dominant hydrid and nival regimes). In some cases, extreme floods can result from rain-on-snow events in the spring (Harder et al., 2015). Winter precipitation typically falls as snow across the CSRD and remains stored until the spring melt period. Snowmelt hydrologic regimes exhibit low flows throughout the winter and high flows in May, June, and July (peak in June). Flows typically decline continuously after the peak reaching low flows between December and March. Low flows also occur in late summer and fall as a result of low precipitation inputs and the depletion of the snowpack water supply. The monthly discharge pattern is generally similar from year to year because snowmelt-
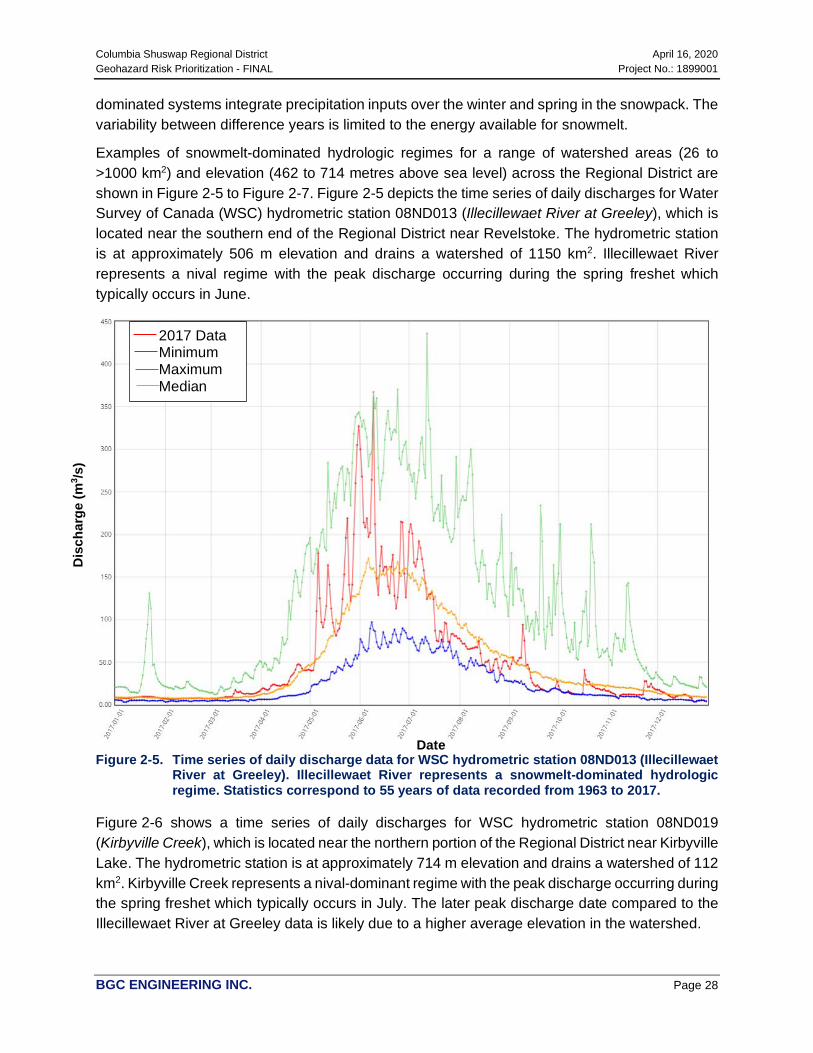
Columbia Shuswap Regional District April 16, 2020 Geohazard Risk Prioritization - FINAL Project No.: 1899001
BGC ENGINEERING INC. Page 28
dominated systems integrate precipitation inputs over the winter and spring in the snowpack. The variability between difference years is limited to the energy available for snowmelt.
Examples of snowmelt-dominated hydrologic regimes for a range of watershed areas (26 to >1000 km2) and elevation (462 to 714 metres above sea level) across the Regional District are shown in Figure 2-5 to Figure 2-7. Figure 2-5 depicts the time series of daily discharges for Water Survey of Canada (WSC) hydrometric station 08ND013 (Illecillewaet River at Greeley), which is located near the southern end of the Regional District near Revelstoke. The hydrometric station is at approximately 506 m elevation and drains a watershed of 1150 km2. Illecillewaet River represents a nival regime with the peak discharge occurring during the spring freshet which typically occurs in June.
Figure 2-5. Time series of daily discharge data for WSC hydrometric station 08ND013 (Illecillewaet
River at Greeley). Illecillewaet River represents a snowmelt-dominated hydrologic regime. Statistics correspond to 55 years of data recorded from 1963 to 2017.
Figure 2-6 shows a time series of daily discharges for WSC hydrometric station 08ND019 (Kirbyville Creek), which is located near the northern portion of the Regional District near Kirbyville Lake. The hydrometric station is at approximately 714 m elevation and drains a watershed of 112 km2. Kirbyville Creek represents a nival-dominant regime with the peak discharge occurring during the spring freshet which typically occurs in July. The later peak discharge date compared to the Illecillewaet River at Greeley data is likely due to a higher average elevation in the watershed.
Date
Dis
char
ge (m
3 /s)
2017 Data Minimum Maximum Median
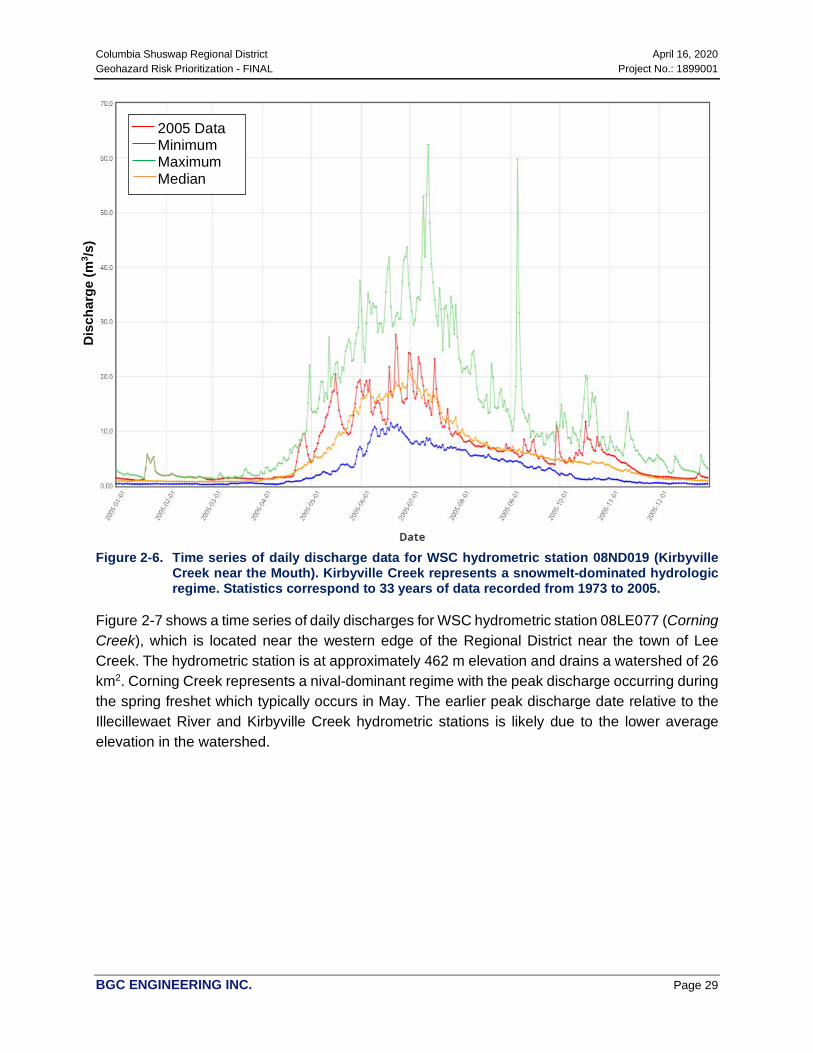
Columbia Shuswap Regional District April 16, 2020 Geohazard Risk Prioritization - FINAL Project No.: 1899001
BGC ENGINEERING INC. Page 29
Figure 2-6. Time series of daily discharge data for WSC hydrometric station 08ND019 (Kirbyville
Creek near the Mouth). Kirbyville Creek represents a snowmelt-dominated hydrologic regime. Statistics correspond to 33 years of data recorded from 1973 to 2005.
Figure 2-7 shows a time series of daily discharges for WSC hydrometric station 08LE077 (Corning Creek), which is located near the western edge of the Regional District near the town of Lee Creek. The hydrometric station is at approximately 462 m elevation and drains a watershed of 26 km2. Corning Creek represents a nival-dominant regime with the peak discharge occurring during the spring freshet which typically occurs in May. The earlier peak discharge date relative to the Illecillewaet River and Kirbyville Creek hydrometric stations is likely due to the lower average elevation in the watershed.
Dis
char
ge (m
3 /s)
2005 Data Minimum Maximum Median
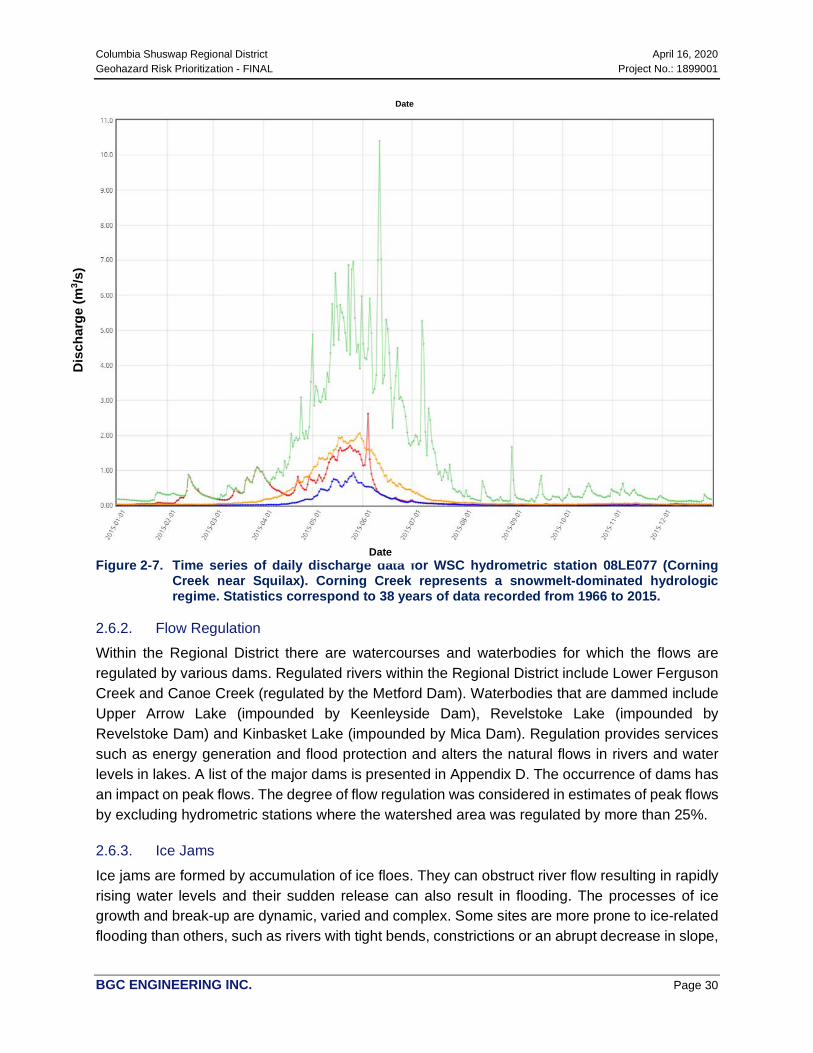
Columbia Shuswap Regional District April 16, 2020 Geohazard Risk Prioritization - FINAL Project No.: 1899001
BGC ENGINEERING INC. Page 30
Figure 2-7. Time series of daily discharge data for WSC hydrometric station 08LE077 (Corning
Creek near Squilax). Corning Creek represents a snowmelt-dominated hydrologic regime. Statistics correspond to 38 years of data recorded from 1966 to 2015.
2.6.2. Flow Regulation Within the Regional District there are watercourses and waterbodies for which the flows are regulated by various dams. Regulated rivers within the Regional District include Lower Ferguson Creek and Canoe Creek (regulated by the Metford Dam). Waterbodies that are dammed include Upper Arrow Lake (impounded by Keenleyside Dam), Revelstoke Lake (impounded by Revelstoke Dam) and Kinbasket Lake (impounded by Mica Dam). Regulation provides services such as energy generation and flood protection and alters the natural flows in rivers and water levels in lakes. A list of the major dams is presented in Appendix D. The occurrence of dams has an impact on peak flows. The degree of flow regulation was considered in estimates of peak flows by excluding hydrometric stations where the watershed area was regulated by more than 25%.
2.6.3. Ice Jams
Ice jams are formed by accumulation of ice floes. They can obstruct river flow resulting in rapidly rising water levels and their sudden release can also result in flooding. The processes of ice growth and break-up are dynamic, varied and complex. Some sites are more prone to ice-related flooding than others, such as rivers with tight bends, constrictions or an abrupt decrease in slope,
Date
Date
Dis
char
ge (m
3 /s)
Columbia Shuswap Regional District April 16, 2020 Geohazard Risk Prioritization - FINAL Project No.: 1899001
BGC ENGINEERING INC. Page 31
or where the upstream reaches warm and melt before the downstream reaches (such as north-flowing rivers). Other sites that can be more prone to ice-related flooding are culverts on small streams, where the small winter flows can freeze to the culvert wall. Over a prolonged cold period, significant ice accumulations can develop which reduce the capacity of the culvert to convey spring runoff. Matrix (2018) found that ice jams on the Kicking Horse River have historically presented a substantial flood risk to the Town of Golden. On average since the 1880s, there has been one ice jam flood every six winters; however, there were five ice jam flood events recorded in the are between 2004 and 2014. Ice jams were not specifically accounted for in the flood hazard assessment and risk prioritization.
2.7. Historical Event Inventory BGC reviewed historical accounts of flood, debris flood and debris flow events across the CSRD (Appendix G). Event information was related to point locations at the location of the event (or general vicinity, in the case of geohazard events with large extent or where exact location was not given).
Large region-wide data sources of historical events include:
• A text compilation of media reports of flooding, landslide, and avalanche events from 1808 to 2006 (Septer, 2007)
• DriveBC data for mud slides and washouts across the major highways of the study area, compiled by BGC from 2006 to 2018
• Geotechnical reports where available • Available academic sources.
Data bias is typically inherent in historical accounts of past events due to gaps in recorded storms or geohazard events, because media reports tend to generalize effects of large region-wide events (e.g., 1936 region-wide floods) rather than smaller and more localized impacts. The historical event inventory is not exhaustive, but the information contained within it can be used to identify the location of past geohazards events and associated consequences of these events. These locations were referenced during geohazard identification (Section 3). Recorded events at steep creek fans are listed in supporting information for a given site on Cambio.
2.8. Flood and Steep Creek Policy and Bylaws The CSRD is responsible for planning in the six rural Electoral Areas, of which some have complete Official Community Plans (OCPs) and Zoning (e.g, Area F and B), and others have only very limited policies and regulations (Area A)14. This information is mainly documented in a set of jurisdiction specific zoning bylaws and OCPs. In addition, the following documents include some reference to flood related information:
• The Salmon Valley Floodplain Management Bylaw No. 2600 • Subdivision Servicing Bylaw No. 641 • Development Services Procedures Bylaw No. 4001
14 The four member municipalities (Town of Golden, City of Revelstoke, District of Sicamous, City of Salmon Arm)
develop and administer their own Official Community Plans, zoning bylaws, and building regulations.
Columbia Shuswap Regional District April 16, 2020 Geohazard Risk Prioritization - FINAL Project No.: 1899001
BGC ENGINEERING INC. Page 32
• Building Bylaw No 660. • Flood plain setback and exemptions (CSRD, 2012).
The OCP bylaws provide the longer-term vision for each jurisdiction by stating the objectives and policies to guide decisions on planning and land use management. The zoning or land-use bylaws then implement those planning visions by regulating how land, buildings, and other structures may be used or developed. BGC also notes that the BC Ministry of Transportation and Infrastructure (MOTI) is the approving authority for new subdivisions, and thus plays an important role in the regulation of development across large portions of the Regional District.
In relation to flood and steep creek hazards, Electoral Areas (governed by the CSRD) and municipalities (governed by themselves) share a common objective of identifying and regulating development in areas potentially prone to flood and steep creek hazards. Zoning bylaws, in areas where they are applicable, then generally outline flood protection requirements commonly with the use of Flood Construction Levels (FCLs) and floodplain setbacks.
Appendix I provides an overview and review of specific CSRD policies and bylaws related to flood and steep creek hazards.
Columbia Shuswap Regional District April 16, 2020 Geohazard Risk Prioritization - FINAL Project No.: 1899001
BGC ENGINEERING INC. Page 33
3. GEOHAZARD ASSESSMENT This section summarizes how BGC identified and characterized the geohazard extents prioritized in this study. Areas considered in this inventory contained both cadastral parcels of interest15 and were subject to clear-water flood or steep creek processes. Appendices D and E provide further details on geohazard identification and characterization for clear-water flood and steep creek geohazards.
3.1. Clear-water Flood Geohazards
3.1.1. Hazard Area Delineation and Characterization Overview Table 3-1 summarizes the approaches used to identify and characterize different types of clear-water flood hazard areas, including watercourses, lakes, and regulated reservoirs. Hazard areas were generated from the methods shown in Table 3-1 and amalgamated16 into geohazard areas for prioritization. The resulting geohazard areas for prioritization are shown on the web application accompanying this report. Also shown on the web application are all mapped stream segments and their associated geohazard process type, as well as historical mapped floodplains and flood depth results from the screening-level hydraulic models.
Appendix D provides further details on the methodology and associated limitations.
15 Cadastral parcels of interest were defined as those parcels identified in the BC Assessment dataset for 2019 as
having a gross general improvement value greater than $0, and a land use code not equal to 428 (Managed Forest (Improved)).
16 Amalgamation was based on the concept of “consultation zones”, which define a geographic area considered for geohazard safety assessment (Geotechnical Engineering Office, 1998; Porter et al, 2009). Geographic areas were selected on the basis of hazard type and characteristics, jurisdiction/community continuity, future detailed study funding considerations and study efficiencies. See Section 5.4 for further comments on prioritization areas.
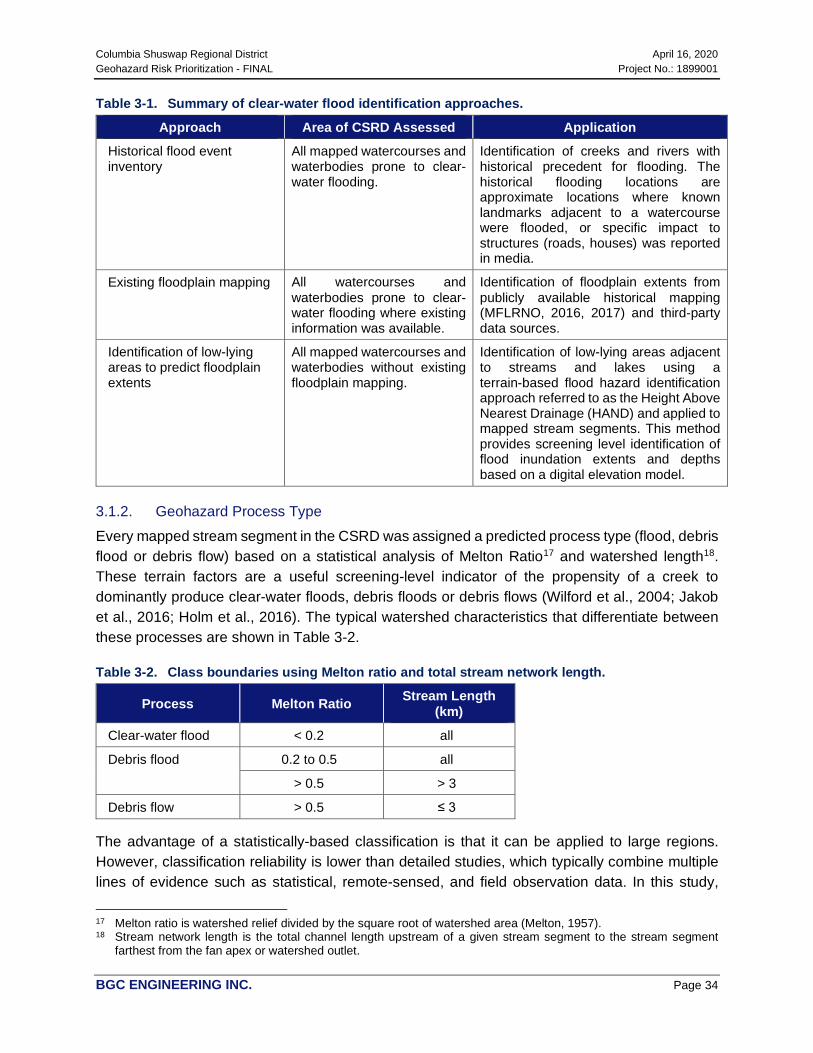
Columbia Shuswap Regional District April 16, 2020 Geohazard Risk Prioritization - FINAL Project No.: 1899001
BGC ENGINEERING INC. Page 34
Table 3-1. Summary of clear-water flood identification approaches.
Approach Area of CSRD Assessed Application Historical flood event inventory
All mapped watercourses and waterbodies prone to clear-water flooding.
Identification of creeks and rivers with historical precedent for flooding. The historical flooding locations are approximate locations where known landmarks adjacent to a watercourse were flooded, or specific impact to structures (roads, houses) was reported in media.
Existing floodplain mapping All watercourses and waterbodies prone to clear-water flooding where existing information was available.
Identification of floodplain extents from publicly available historical mapping (MFLRNO, 2016, 2017) and third-party data sources.
Identification of low-lying areas to predict floodplain extents
All mapped watercourses and waterbodies without existing floodplain mapping.
Identification of low-lying areas adjacent to streams and lakes using a terrain-based flood hazard identification approach referred to as the Height Above Nearest Drainage (HAND) and applied to mapped stream segments. This method provides screening level identification of flood inundation extents and depths based on a digital elevation model.
3.1.2. Geohazard Process Type Every mapped stream segment in the CSRD was assigned a predicted process type (flood, debris flood or debris flow) based on a statistical analysis of Melton Ratio17 and watershed length18. These terrain factors are a useful screening-level indicator of the propensity of a creek to dominantly produce clear-water floods, debris floods or debris flows (Wilford et al., 2004; Jakob et al., 2016; Holm et al., 2016). The typical watershed characteristics that differentiate between these processes are shown in Table 3-2.
Table 3-2. Class boundaries using Melton ratio and total stream network length.
Process Melton Ratio Stream Length (km)
Clear-water flood < 0.2 all
Debris flood 0.2 to 0.5 all
> 0.5 > 3
Debris flow > 0.5 ≤ 3
The advantage of a statistically-based classification is that it can be applied to large regions. However, classification reliability is lower than detailed studies, which typically combine multiple lines of evidence such as statistical, remote-sensed, and field observation data. In this study,
17 Melton ratio is watershed relief divided by the square root of watershed area (Melton, 1957). 18 Stream network length is the total channel length upstream of a given stream segment to the stream segment
farthest from the fan apex or watershed outlet.
Columbia Shuswap Regional District April 16, 2020 Geohazard Risk Prioritization - FINAL Project No.: 1899001
BGC ENGINEERING INC. Page 35
process type identification should be considered more reliable for creeks with mapped fans than those without mapped fans.
Classifying every stream segment in the CSRD into one of three likely process-types (i.e., clear-water, debris-flood or debris flow hazards) also does not recognize that there is a continuum between clear-water floods and steep-creek processes that is not accounted for in morphometrics. Watershed-specific characteristics can also affect the types of processes that may occur. For example, a longer watershed with a steep tributary near its outlet could produce both debris floods and debris flows capable of reaching the fan. To capture this uncertainty, a probabilistic approach was also used to determine the likelihood that a stream segment falls within each of the three categories, as described in Appendix D.
3.1.3. Hazard Likelihood Frequency analysis estimates how often geohazard events occur, on average. Historical floodplain maps are typically based on the designated flood as represented by the 0.5% AEP (200-year return period) event. Therefore, the 200-year flood event likelihood was used to prioritize clear-water flood sites across the CSRD. Appendix D provides further description of methods and uncertainties. BGC notes that one of these uncertainties is climate change, which is expected to influence the timing and likelihood of flood hazard occurrence (Section 2.5.3).
3.1.4. Hazard Intensity Hazard intensity describes the destructive potential of uncontrolled flows that could impact elements at risk (as defined by cadastral parcels of interest). Hazard intensity ratings were used to define a consequence rating for each hazard area, as described in Section 5.3.3.
In a detailed hazard assessment, hazard intensity is quantified by parameters such as flow depth and velocity. At regional scale, these parameters are difficult to estimate, because they are site-specific. To address this limitation, at the scale of the CSRD and in the context of the current prioritization study, BGC used the estimated maximum flood depth derived from the screening-level flood hazard mapping (i.e., a terrain-based flood hazard identification approach using the Height Above Nearest Drainage (HAND)). Appendix D provides further details about the mapping approach (see Section D.2.4) and the approach used to assign intensity ratings (see Section D.3.1).
3.2. Steep Creek Geohazards Steep creek or hydrogeomorphic hazards are natural hazards that involve a mixture of water (“hydro”) and debris or sediment (“geo”) (Figure 3-1). These hazards typically occur on creeks and steep rivers with small watersheds (usually less than 100 km2) in mountainous terrain, usually after intense or long rainfall events, sometimes aided by snowmelt and often worsened by previous forest fires.
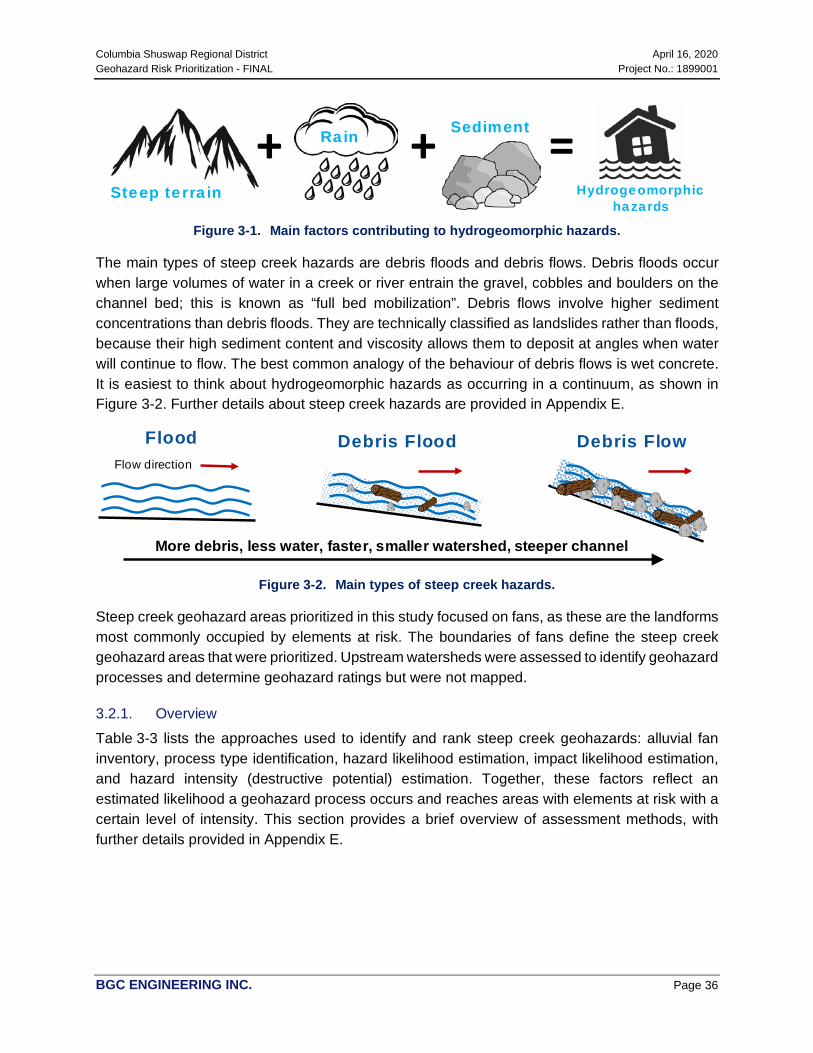
Columbia Shuswap Regional District April 16, 2020 Geohazard Risk Prioritization - FINAL Project No.: 1899001
BGC ENGINEERING INC. Page 36
Figure 3-1. Main factors contributing to hydrogeomorphic hazards.
The main types of steep creek hazards are debris floods and debris flows. Debris floods occur when large volumes of water in a creek or river entrain the gravel, cobbles and boulders on the channel bed; this is known as “full bed mobilization”. Debris flows involve higher sediment concentrations than debris floods. They are technically classified as landslides rather than floods, because their high sediment content and viscosity allows them to deposit at angles when water will continue to flow. The best common analogy of the behaviour of debris flows is wet concrete. It is easiest to think about hydrogeomorphic hazards as occurring in a continuum, as shown in Figure 3-2. Further details about steep creek hazards are provided in Appendix E.
Figure 3-2. Main types of steep creek hazards.
Steep creek geohazard areas prioritized in this study focused on fans, as these are the landforms most commonly occupied by elements at risk. The boundaries of fans define the steep creek geohazard areas that were prioritized. Upstream watersheds were assessed to identify geohazard processes and determine geohazard ratings but were not mapped.
3.2.1. Overview Table 3-3 lists the approaches used to identify and rank steep creek geohazards: alluvial fan inventory, process type identification, hazard likelihood estimation, impact likelihood estimation, and hazard intensity (destructive potential) estimation. Together, these factors reflect an estimated likelihood a geohazard process occurs and reaches areas with elements at risk with a certain level of intensity. This section provides a brief overview of assessment methods, with further details provided in Appendix E.
Steep terrain
Rain + = Hydrogeomorphic
hazards
+ Sediment
Flow direction
Flood Debris Flood Debris Flow
More debris, less water, faster, smaller watershed, steeper channel

Columbia Shuswap Regional District April 16, 2020 Geohazard Risk Prioritization - FINAL Project No.: 1899001
BGC ENGINEERING INC. Page 37
Table 3-3. Summary of steep creek geohazard identification and ranking approaches.
Approach Area Assessed Application
Alluvial fan Inventory Prioritized geohazard areas Delineation of alluvial fans to be prioritized; interpretation of terrain characteristics used to assign geohazard ratings.
Process type identification
All creeks Classification of creeks as dominantly subject to clear-water floods, debris floods, or debris flows.
Hazard likelihood estimation
All prioritized geohazard areas prone to debris flows or debris floods
Screening level identification and estimate of geohazard likelihood for all prioritized geohazard areas; basis to assign geohazard ratings to prioritized geohazard areas.
Impact likelihood estimation
All prioritized geohazard areas prone to debris flows or debris floods
Screening level estimate of impact likelihood for all prioritized geohazard areas; basis to assign geohazard ratings to prioritized geohazard areas.
Intensity estimation All prioritized geohazard areas prone to debris flows or debris floods
Screening level estimate of relative geohazard intensity (destructive potential) of debris flows, debris floods or clear-water floods; in combination with hazard exposure (elements at risk) formed the basis to assign consequence ratings to prioritized geohazard areas.
3.2.2. Alluvial Fan Inventory The boundary of alluvial fans (e.g., Figure 3-3) represents the steep creek geohazard areas prioritized in this study. BGC mapped a total of 450 developed fans, based on the interpretation of available aerial and satellite imagery, Lidar Digital Elevation Models (DEM), and review of previous fan mapping (see Appendix A). Geobase terrain models and satellite imagery available within the ESRI web map and Google Earth were used for terrain interpretations where Lidar was not available. Previous reports used as reference can be downloaded by clicking on a given fan in Cambio.
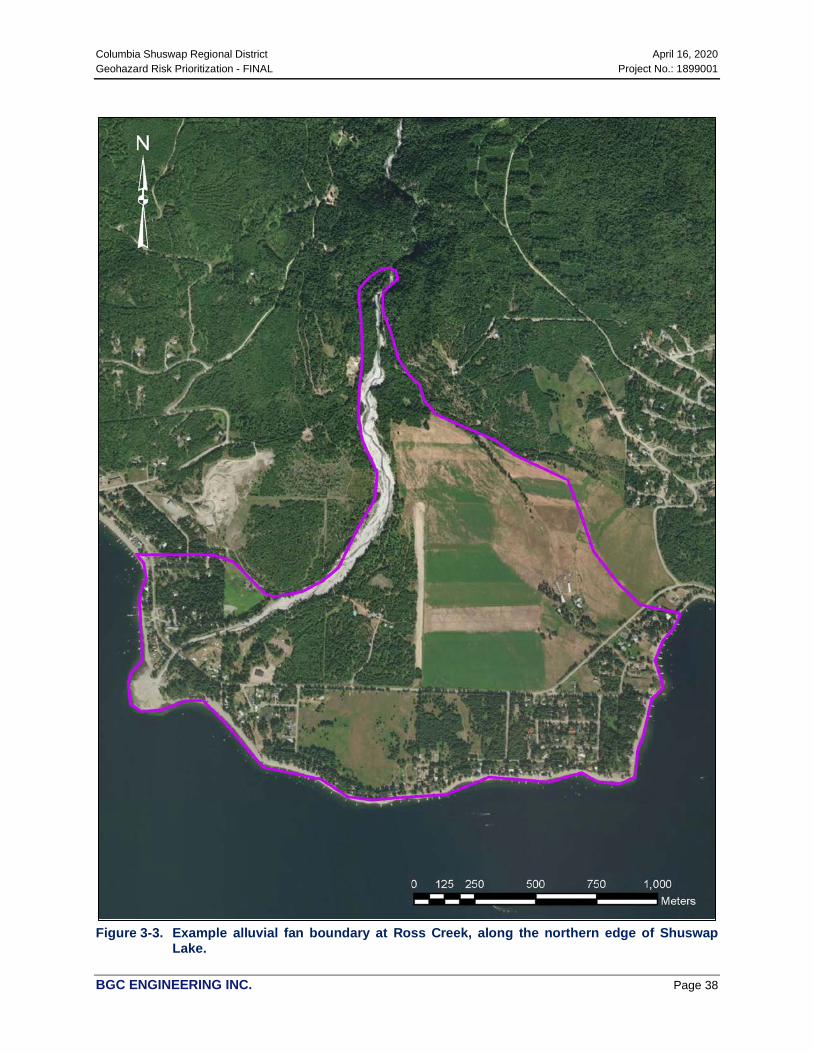
Columbia Shuswap Regional District April 16, 2020 Geohazard Risk Prioritization - FINAL Project No.: 1899001
BGC ENGINEERING INC. Page 38
Figure 3-3. Example alluvial fan boundary at Ross Creek, along the northern edge of Shuswap
Lake.
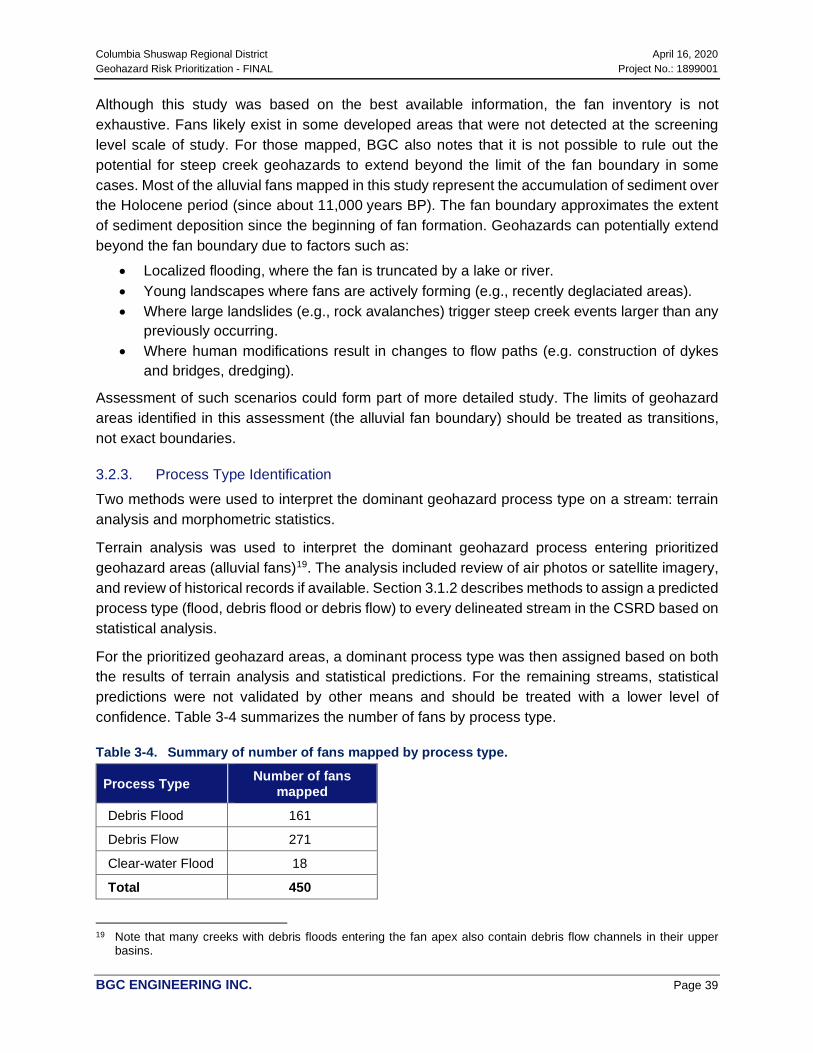
Columbia Shuswap Regional District April 16, 2020 Geohazard Risk Prioritization - FINAL Project No.: 1899001
BGC ENGINEERING INC. Page 39
Although this study was based on the best available information, the fan inventory is not exhaustive. Fans likely exist in some developed areas that were not detected at the screening level scale of study. For those mapped, BGC also notes that it is not possible to rule out the potential for steep creek geohazards to extend beyond the limit of the fan boundary in some cases. Most of the alluvial fans mapped in this study represent the accumulation of sediment over the Holocene period (since about 11,000 years BP). The fan boundary approximates the extent of sediment deposition since the beginning of fan formation. Geohazards can potentially extend beyond the fan boundary due to factors such as:
• Localized flooding, where the fan is truncated by a lake or river. • Young landscapes where fans are actively forming (e.g., recently deglaciated areas). • Where large landslides (e.g., rock avalanches) trigger steep creek events larger than any
previously occurring. • Where human modifications result in changes to flow paths (e.g. construction of dykes
and bridges, dredging).
Assessment of such scenarios could form part of more detailed study. The limits of geohazard areas identified in this assessment (the alluvial fan boundary) should be treated as transitions, not exact boundaries.
3.2.3. Process Type Identification Two methods were used to interpret the dominant geohazard process type on a stream: terrain analysis and morphometric statistics.
Terrain analysis was used to interpret the dominant geohazard process entering prioritized geohazard areas (alluvial fans)19. The analysis included review of air photos or satellite imagery, and review of historical records if available. Section 3.1.2 describes methods to assign a predicted process type (flood, debris flood or debris flow) to every delineated stream in the CSRD based on statistical analysis.
For the prioritized geohazard areas, a dominant process type was then assigned based on both the results of terrain analysis and statistical predictions. For the remaining streams, statistical predictions were not validated by other means and should be treated with a lower level of confidence. Table 3-4 summarizes the number of fans by process type.
Table 3-4. Summary of number of fans mapped by process type.
Process Type Number of fans mapped
Debris Flood 161
Debris Flow 271
Clear-water Flood 18
Total 450
19 Note that many creeks with debris floods entering the fan apex also contain debris flow channels in their upper
basins.

Columbia Shuswap Regional District April 16, 2020 Geohazard Risk Prioritization - FINAL Project No.: 1899001
BGC ENGINEERING INC. Page 40
3.2.4. Hazard Likelihood Estimation Hazard likelihood was estimated based on terrain interpretation considering both basin and fan activity. Basin activity considered parameters such as identifiable source areas, the nature of channels, and whether watersheds are sediment supply-limited or unlimited. Fan activity focused on evidence of fresh deposits and lobes on the fan, and the type of vegetation. Basin and fan activity criteria were combined in a matrix to estimate hazard likelihood rating. Appendix E provides further description of methods to estimate geohazard likelihood and describes limitations and uncertainties.
3.2.5. Impact Likelihood Estimation
BGC estimated the relative likelihood that debris flows, debris floods or clear-water floods will result in avulsions on fans, given occurrence of a geohazard. Impact likelihood is estimated based on a combination of susceptibility modeling and terrain mapping of avulsion activity. Previous assessments and event records were also referenced where available. In the susceptibility modelling method, BGC used a semi-automated approach based on River Network Tool™ (RNT)20, morphometric statistics (Section 3.1.2), and the Flow-R model21 developed by Horton et al. (2013) to identify debris flow or debris flood hazards and model their runout susceptibility. Appendix E provides further description of methods to estimate impact likelihood and describes limitations and uncertainties. The results of susceptibility modelling are shown as a layer on Cambio.
3.2.6. Intensity Estimation In a detailed steep creek analysis, destructive potential is characterized based on intensity, which is quantified by parameters such as flow depth and velocity. At a regional scale, these parameters are difficult to estimate, because they are specific to individual watersheds. To address this limitation, at the scale of the CSRD, and in the context of the current prioritization study, BGC used peak discharge as a proxy for flow intensity. Appendix E provides further details about the approach used for determination of intensity ratings.
20 RNT is BGC’s versatile web-based application for analyzing hydrotechnical geohazards associated with rivers and
streams. 21 "Flow-R" refers to "Flow path assessment of gravitational hazards at a Regional scale". See http://www.flow-r.org.
Columbia Shuswap Regional District April 16, 2020 Geohazard Risk Prioritization - FINAL Project No.: 1899001
BGC ENGINEERING INC. Page 41
4. EXPOSURE ASSESSMENT This section describes how BGC identified elements at risk in geohazard areas and assigned exposure ratings to a given area. Section 5 describes how exposure ratings were used as inputs for risk prioritization.
The objective of assigning exposure ratings is to compare the overall exposure of diverse elements at risk to the geohazards considered in this study. In the absence of detailed consequence or risk estimation, higher exposure ratings imply a greater potential for losses due to geohazards. Table 4-1 lists the elements at risk considered in this study, and weightings used to compare the types and value of elements in different hazard areas. Appendix C describes methods to compile and organize these data.
The exposure weightings were assigned by BGC and are subject to review by CSRD. They weigh the relative importance of elements at risk from a regional perspective with reference to the response goals of the BC Emergency Management System (BCEMS) (Government of BC, 2016). BCEMS goals are ordered by priority as follows:
1. Ensure the health and safety of responders. 2. Save lives. 3. Reduce suffering. 4. Protect public health. 5. Protect infrastructure. 6. Protect property. 7. Protect the environment. 8. Protect economic and social losses.
Weightings also considered loss indicators cited by the United Nations in the areas of public safety, economic loss, services disruption, environmental loss, or social loss (culture, loss of security) (United Nations, 2016; UNISDR, 2015).
BGC used the following steps to assign a hazard exposure rating to each area: 1. Identify the presence of elements at risk. 2. Calculate their value and weight according to the categories listed in Table 4-1. 3. Sum the weightings to achieve a total for each area. 4. Assign exposure ratings to areas based on their percentile rank compared to other areas.
BGC notes that different weightings could result in adjustments to hazard area priority ratings. Table 4-2 provides a more detailed breakdown of how weightings were assigned to critical facilities based on the BCEMS response goals (Government of BC, 2016).
Software developed by BGC was used to automate the identification of elements at risk within geohazard areas. The elements at risk compiled for risk prioritization are not exhaustive and did not include a complete inventory of municipal infrastructure (e.g., complete inventory of utility

Columbia Shuswap Regional District April 16, 2020 Geohazard Risk Prioritization - FINAL Project No.: 1899001
BGC ENGINEERING INC. Page 42
networks). Elements where loss can be intangible, such as objects of cultural value, were not included in the inventory.
Table 4-1. Weightings applied to elements at risk within a hazard area.
Element at Risk Description Value Weight
People Total Census (2016) Population (Census Dissemination Block)1
1-10 5
11 – 100 10
101 – 1,000 20
1,001 – 10,000 40
>10,000 80
Buildings Building Improvement Value2 (summed by parcel)
<$100k 1
$100k - $1M 5
$1M - $10M 10
$10M - $50M 20
$50M - $100M 40
Critical Facilities Critical Facilities3 (point locations)
Emergency Response Services 36
Emergency Response Resources 10
Utilities 18
Communication 18
Medical Facilities 36
Transportation 22
Environmental 18
Community 36
Businesses Business annual revenue (summed) (point locations)
<$100k Annual Revenue or 1 Business 1
$100k - $1M Annual Revenue or 2-5 Businesses 5
$1M - $10M Annual Revenue or 6-10 Businesses 10
$10M - $50M Annual Revenue or 11-25 Businesses 20
$50M - $100M Annual Revenue or 26-100 Businesses 40
>$100M annual revenue or >100 businesses 80
Lifelines3 Roads (centerline) Road present; no traffic data 1
Highway present; no traffic data 5

Columbia Shuswap Regional District April 16, 2020 Geohazard Risk Prioritization - FINAL Project No.: 1899001
BGC ENGINEERING INC. Page 43
Element at Risk Description Value Weight
0-10 vehicles/day (Class 7) 1
10-100 vehicles/day (Class 6) 5
100-500 vehicles/day (Class 5) 10
500-1000 vehicles/day (Class 4) 20
> 1000 vehicles/day (Class <4) 40
Railway Presence of 10
Petroleum Infrastructure Presence of 15
Electrical Infrastructure Presence of 10
Communication Infrastructure Presence of 10
Water Infrastructure Presence of 10
Sanitary Infrastructure Presence of 10
Drainage Infrastructure Presence of 10
Environmental Values
Active Agricultural Area Presence of 15
Fisheries Presence of 15
Species and Ecosystems at risk Presence of 15 Notes:
1. Census population was scaled according to the proportion of census block area intersecting a hazard area. For example, if the hazard area intersected half the census block, then half the population was assigned. The estimate does not account for spatial variation of population density within the census block.
2. Large parcels with only minor outbuildings or cabins, typically in remote areas, were not included in the assessment. 3. Critical facilities and lifelines were assigned a weighting based on the presence of at least one of a given type within the
hazard area. For example, if a geohazard area contained two critical facility elements classed as “utilities”, the weighting was applied once (not multiplied by the number of elements). Where more than one is present, the maximum weighting is applied. This approach reflects how some elements are represented as geospatial features, to avoid accidental double counting where a single facility is spatially represented by multiple parts.
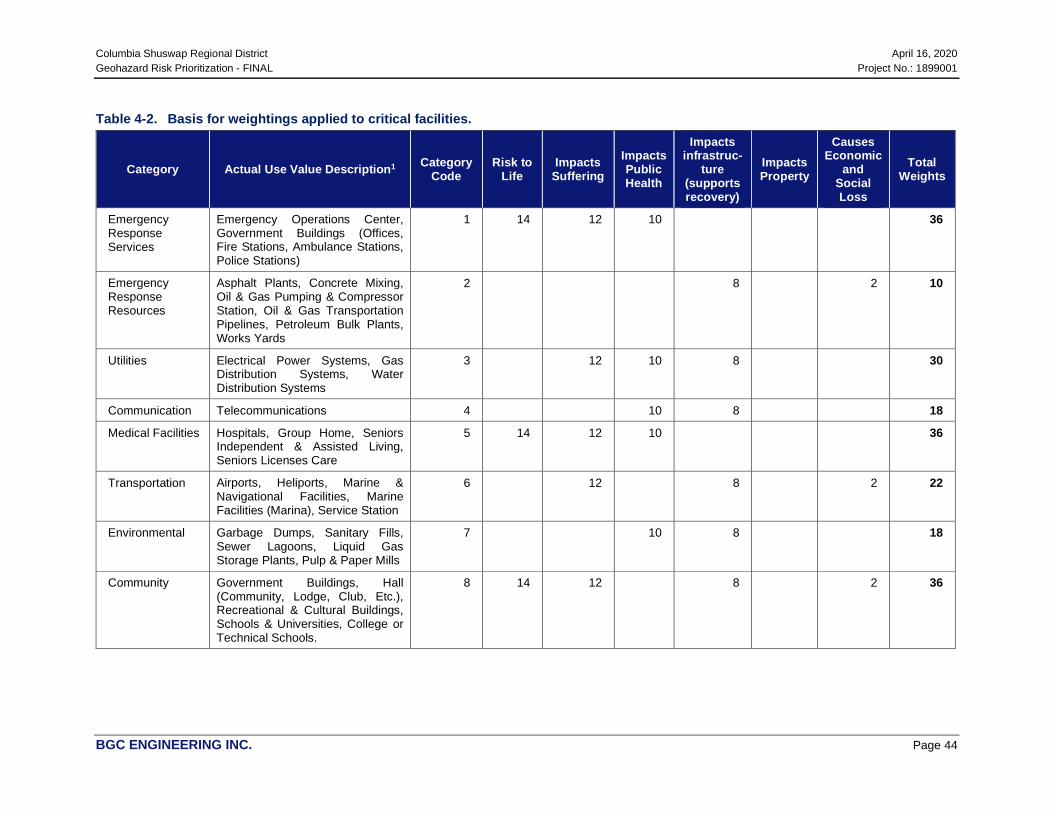
Columbia Shuswap Regional District April 16, 2020 Geohazard Risk Prioritization - FINAL Project No.: 1899001
BGC ENGINEERING INC. Page 44
Table 4-2. Basis for weightings applied to critical facilities.
Category Actual Use Value Description1 Category Code
Risk to Life
Impacts Suffering
Impacts Public Health
Impacts infrastruc-
ture (supports recovery)
Impacts Property
Causes Economic
and Social Loss
Total Weights
Emergency Response Services
Emergency Operations Center, Government Buildings (Offices, Fire Stations, Ambulance Stations, Police Stations)
1 14 12 10
36
Emergency Response Resources
Asphalt Plants, Concrete Mixing, Oil & Gas Pumping & Compressor Station, Oil & Gas Transportation Pipelines, Petroleum Bulk Plants, Works Yards
2
8
2 10
Utilities Electrical Power Systems, Gas Distribution Systems, Water Distribution Systems
3
12 10 8
30
Communication Telecommunications 4
10 8
18
Medical Facilities Hospitals, Group Home, Seniors Independent & Assisted Living, Seniors Licenses Care
5 14 12 10
36
Transportation Airports, Heliports, Marine & Navigational Facilities, Marine Facilities (Marina), Service Station
6
12
8
2 22
Environmental Garbage Dumps, Sanitary Fills, Sewer Lagoons, Liquid Gas Storage Plants, Pulp & Paper Mills
7
10 8
18
Community Government Buildings, Hall (Community, Lodge, Club, Etc.), Recreational & Cultural Buildings, Schools & Universities, College or Technical Schools.
8 14 12
8
2 36

Columbia Shuswap Regional District April 16, 2020 Geohazard Risk Prioritization - FINAL Project No.: 1899001
BGC ENGINEERING INC. Page 45
Figure 4-1 shows the distribution of exposure scores for all geohazard areas, and Figure 4-1 and Table 4-3 shows how total weightings were grouped by percentile to assign exposure ratings.
For consistency and application at provincial scale, BGC has applied the same ratings criteria (percentile thresholds) across multiple risk prioritization studies for Regional Districts in BC22. However, BGC notes that the distribution of exposure scores is relative to the study area (CSRD), to compare the level of development between different geohazard areas inside this study area. Different choices of study area would affect this relative rating.
Figure 4-1. Distribution of exposure scores in the CSRD and definition of associated exposure
ratings.
Table 4-3. Hazard exposure rating.
Hazard Exposure Rating Criteria Total Weighting Value
Very High Greater than 95th percentile > 147
High Between 80th and 95th percentile 65 to 146
Moderate Between 60th and 80th percentile 26 to 64
Low Between 20th and 60th percentile 6 to 25
Very Low Smaller 20th percentile 0 to 5
22 To date, this includes the CSRD, Regional District of Central Kootenay, Squamish-Lillooet Regional District,
Regional District of North Okanagan, Thompson-Nicola Regional District, and Cariboo Regional District.
0
50
100
150
200
250
300
0 10 20 30 40 50 60 70 80 90 100
110
120
130
140
150
160
170
180
190
200
Mor
e
Coun
t
Exposure Score
Very High High Moderate Low Very Low

Columbia Shuswap Regional District April 16, 2020 Geohazard Risk Prioritization - FINAL Project No.: 1899001
BGC ENGINEERING INC. Page 46
5. GEOHAZARD RISK PRIORITIZATION
5.1. Introduction This section describes how geohazard areas were prioritized across the CSRD. The prioritization approach is consistent across the range of geohazards assessed, where methods to estimate input values are specific to each hazard type.
The prioritization framework used in this study is based on the following general principles:
• Support decision making, but with the recognition that additional factors for risk management and policy making exist that are outside the scope of this assessment
• Provide results to incorporate into steep creek and flood risk management policy • Provide a framework that can be expanded to other types of geohazards (i.e., landslides) • Apply an approach that can be refined and improved in the future without duplicating effort.
Figure 5-1 illustrates the three components of the risk prioritization framework used in this study: hazard, exposure, and vulnerability. The combination of exposure and vulnerability represents consequences, and all three components together represent risk. Each of these components is estimated separately and combined to form a priority rating for a given site.
Figure 5-1. Elements of the prioritization approach.

Columbia Shuswap Regional District April 16, 2020 Geohazard Risk Prioritization - FINAL Project No.: 1899001
BGC ENGINEERING INC. Page 47
The approach uses matrices to arrive at separate ratings for hazard and consequence, which are then combined to provide a priority rating for each hazard area. Higher ratings generally reflect a higher estimated likelihood that more destructive flows will impact more extensive development. This three-part approach facilitates risk management planning and policy implementation in that it is relatively simple while still identifying each factor contributing to risk.
At the same time, the results are aggregate ratings that support, but do not replace, more detailed risk management and resiliency planning. Inputs used to generate each rating are provided on the web map and via data services and downloads. These original data can be used to include additional or different combinations of factors in risk management plans.
Sections 5.2 to 5.4 describe the steps used to determine geohazard, consequence, and priority ratings for each area. Appendices D and E provide detailed description of methods to determine geohazard ratings for clear-water and steep creek geohazard areas, respectively.
5.2. Geohazard Rating
Table 5-1 presents the qualitative geohazard rating system used in this study. It combines hazard and impact likelihood ratings to rate the potential for events to occur and – if they occur – impact elements at risk. The ratings assume that elements at risk are present within the hazard zone at the time of impact, as would be expected for buildings, lifelines, critical facilities, and other immobile features that are the subject of this study.
Table 5-1. Geohazard rating.
Hazard Likelihood Geohazard Rating
Very High M H H VH VH
High L M H H VH
Moderate L L M H H
Low VL L L M H
Very Low VL VL L L M
Impact Likelihood Very Low Low Moderate High Very High
Table 5-2 describes how hazard and impact likelihood were defined for each hazard type. Table 5-3 defines approximate frequency and return period ranges for hazard likelihood categories23. Appendix D and Appendix E describe the methods used to assign each rating.
23 Note that geohazard events outside the ranges shown are possible, such as the occurrence of extremely rare
events. The categories included reflect the objectives of this study and types of geohazards assessed.

Columbia Shuswap Regional District April 16, 2020 Geohazard Risk Prioritization - FINAL Project No.: 1899001
BGC ENGINEERING INC. Page 48
Table 5-2. Definitions of hazard likelihood and impact likelihood for the geohazard types assessed.
Factor Geohazard Type Definition Hazard Likelihood
Steep creeks geohazards. Likelihood of a geohazard event of enough magnitude to potentially impact elements at risk.
Clear-water floods 0.5% AEP (200-year) flood
Impact Likelihood
Steep creeks geohazards. Estimated likelihood of an uncontrolled flow reaching elements at risk, given that a geohazard event occurs.
Clear-water floods Assumed impact likelihood of High (Table 5-1) within the flood extent, given occurrence of the 0.005 AEP (200-year) flood.
Table 5-3. Annual Exceedance Probability (AEP) ranges and representative categories.
Geohazard Likelihood AEP Range (%)(1) Representative AEP Representative Return Period (years)
Very High >10% 20% 5
High >10% - <3.3% 5% 20
Moderate >3.3% - 1% 2% 50
Low >1% - <0.33% 0.5% 200
Very Low <0.33% - 0.1% 0.2% 500
Note: 1. AEP ranges are consistent with those identified in EGBC (2018).
5.3. Consequence Rating Consequence combines the value of the element at risk with its vulnerability to damage or loss, given impact by that hazard. Formally, it is the conditional probability that elements at risk will suffer some severity of damage or loss, given geohazard impact with a certain severity. In detailed studies, consequences can be measured qualitatively or quantitatively for areas such as public safety (i.e., probability of loss of life), economic loss, services disruption, environmental loss, or social loss (culture, loss of security) (United Nations, 2016; UNISDR, 2015).
The same principles apply to this study, but with some simplification that reflects the level of detail of assessment. Consequence ratings were assigned that compare the relative potential for loss between hazard areas, given hazard impact. They consider the presence and value of elements at risk within the hazard area, and the intensity of flows that could impact elements at risk. Higher value or greater number of elements at risk, combined with the potential for more highly destructive flows, results in a higher consequence rating for a given area. BGC assigned consequence ratings by combining two factors rating the exposure of elements at risk (exposure rating) to destructive flows (vulnerability rating).
5.3.1. Exposure Rating The exposure rating is based on weightings assigned based on the value or presence of the elements at risk listed in Table 4-1. BGC developed in-house software tools to identify the

Columbia Shuswap Regional District April 16, 2020 Geohazard Risk Prioritization - FINAL Project No.: 1899001
BGC ENGINEERING INC. Page 49
presence and value of elements at risk within hazard areas and calculate weightings. As noted in Section 4, the exposure rating is subjective and aims to weight the importance of elements at risk from a regional perspective, with reference to the response goals of the BC Emergency Management System (BCEMS) (Government of BC, 2016).
5.3.2. Hazard Intensity Rating Elements at risk can be vulnerable to flood and steep creek processes through direct impact by water or debris and through secondary processes such as channel avulsion, channel aggradation or scour, bank erosion, channel encroachment, or landslides. This study primarily focused on direct flood inundation and debris impact.
The elements at risk considered in this study have different vulnerabilities to flood impact, and some simplification is required to arrive at aggregate ratings for a given area. The vulnerability of specific elements at risk was not estimated. BGC assumed that elements at risk would be generally more vulnerable to more highly destructive flows and used average estimates of flow intensity as a proxy for relative vulnerability.
As noted in Sections 3.1.4 and 3.2.6, Appendices D and E provide further description of methods to estimate destructive potential and assign ratings for each geohazard type.
5.3.3. Consequence Rating Table 5-4 displays the matrix used to combine hazard exposure and intensity ratings, to arrive at a consequence rating. The two axes help clarify the source of consequence for mitigation planning. For example, land use and emergency response planning can manage hazard exposure (vertical access), whereas risk control measures (i.e., increased flood storage) can control hazard intensity (horizontal axis).
Table 5-4. Relative consequence rating.
Hazard Exposure Relative Consequence Rating
Very High M H H VH VH
High L M H H VH
Moderate L L M H H
Low VL L L M H
Very Low VL VL L L M
Hazard Intensity Very Low Low Moderate High Very High
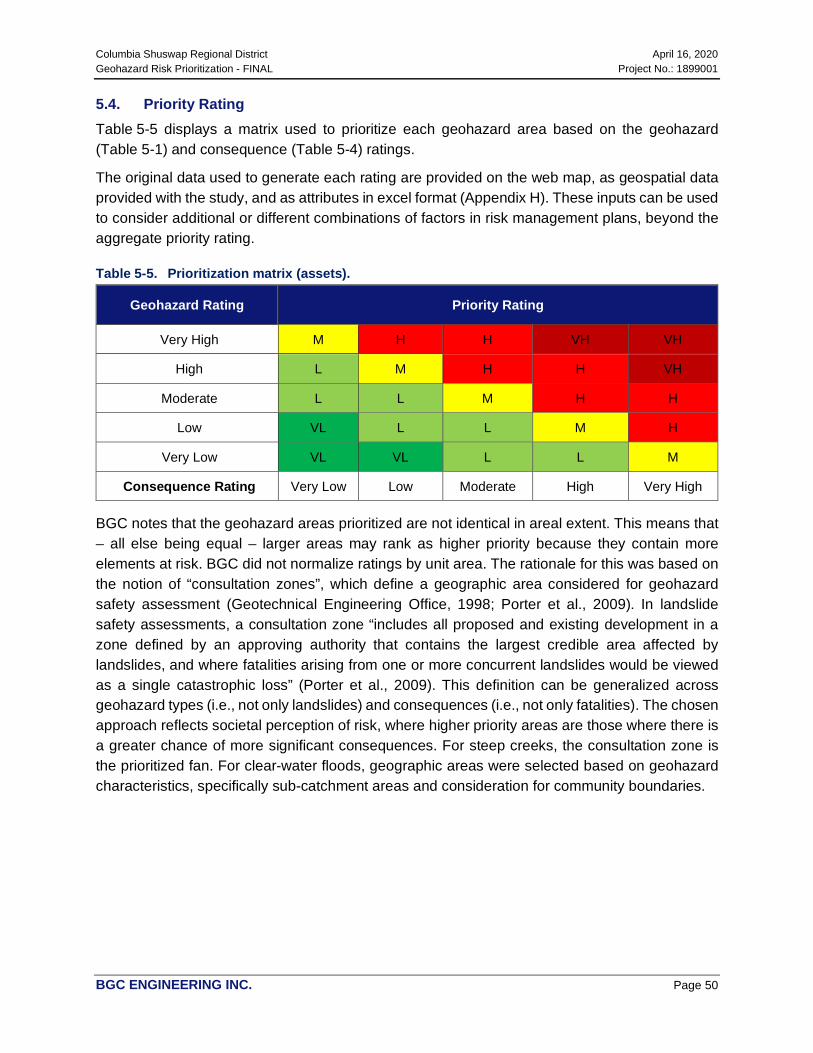
Columbia Shuswap Regional District April 16, 2020 Geohazard Risk Prioritization - FINAL Project No.: 1899001
BGC ENGINEERING INC. Page 50
5.4. Priority Rating Table 5-5 displays a matrix used to prioritize each geohazard area based on the geohazard (Table 5-1) and consequence (Table 5-4) ratings.
The original data used to generate each rating are provided on the web map, as geospatial data provided with the study, and as attributes in excel format (Appendix H). These inputs can be used to consider additional or different combinations of factors in risk management plans, beyond the aggregate priority rating.
Table 5-5. Prioritization matrix (assets).
Geohazard Rating Priority Rating
Very High M H H VH VH
High L M H H VH
Moderate L L M H H
Low VL L L M H
Very Low VL VL L L M
Consequence Rating Very Low Low Moderate High Very High
BGC notes that the geohazard areas prioritized are not identical in areal extent. This means that – all else being equal – larger areas may rank as higher priority because they contain more elements at risk. BGC did not normalize ratings by unit area. The rationale for this was based on the notion of “consultation zones”, which define a geographic area considered for geohazard safety assessment (Geotechnical Engineering Office, 1998; Porter et al., 2009). In landslide safety assessments, a consultation zone “includes all proposed and existing development in a zone defined by an approving authority that contains the largest credible area affected by landslides, and where fatalities arising from one or more concurrent landslides would be viewed as a single catastrophic loss” (Porter et al., 2009). This definition can be generalized across geohazard types (i.e., not only landslides) and consequences (i.e., not only fatalities). The chosen approach reflects societal perception of risk, where higher priority areas are those where there is a greater chance of more significant consequences. For steep creeks, the consultation zone is the prioritized fan. For clear-water floods, geographic areas were selected based on geohazard characteristics, specifically sub-catchment areas and consideration for community boundaries.

Columbia Shuswap Regional District April 16, 2020 Geohazard Risk Prioritization - FINAL Project No.: 1899001
BGC ENGINEERING INC. Page 51
6. RESULTS This study provides baseline results in several ways:
• This report section provides a summary overview of results. • Cambio (www.cambiocommunities.ca) displays all geohazard areas and is the easiest
way to interact with study results. Users can see large areas at a glance or view results for a single site. Appendix B provides a guide to navigate Cambio.
• Appendix H provides an Excel spreadsheet with tabulated results. • Data download of prioritized, attributed geohazard areas in geodatabase format.
In total, BGC prioritized about 1446 geohazard areas encompassing about 1946 km2 of the CSRD (Table 6-1). Table 6-2 lists the results worksheets provided in Appendix H, and Figure 6-1 provides summary statistics by jurisdiction. Appendix F provides the example Risk Assessment Information Template (RAIT) form required by the NDMP.
Table 6-1. Number of prioritized areas in the CSRD, by geohazard type.
Geohazard Type Priority Level
Grand Total Very
High High Mod. Low Very Low
Clear-Water Floods (water courses and water bodies) 0 58 92 846 0 996
Steep Creeks (alluvial fans) 11 120 104 166 49 450
Grand Total (Count) 11 178 196 1012 49 1446
Grand Total (%) 1% 12% 14% 70% 3% 100%
Table 6-2. Results worksheets provided in Appendix H. Appendix H (Excel Worksheet Name) Contents
Study Area Metrics Summary statistics of select elements at risk (count of presence in geohazard areas).
Study Area Hazard Summary Summary statistics of elements at risk, according to their presence in geohazard areas.
Study Area Hazard Type Summary Summary statistics of geohazard areas, according to the presence of elements at risk.
Priority by Jurisdiction Summary statistics of prioritization results by jurisdiction (digital version of Table 6-1).
Steep Creek Hazard Attributes Attributes displayed in the information sidebar on Cambio for all steep creek geohazard areas.
Clear-water Flood Hazard Attributes Attributes displayed in the information sidebar on Cambio for all clear-water flood geohazard areas.
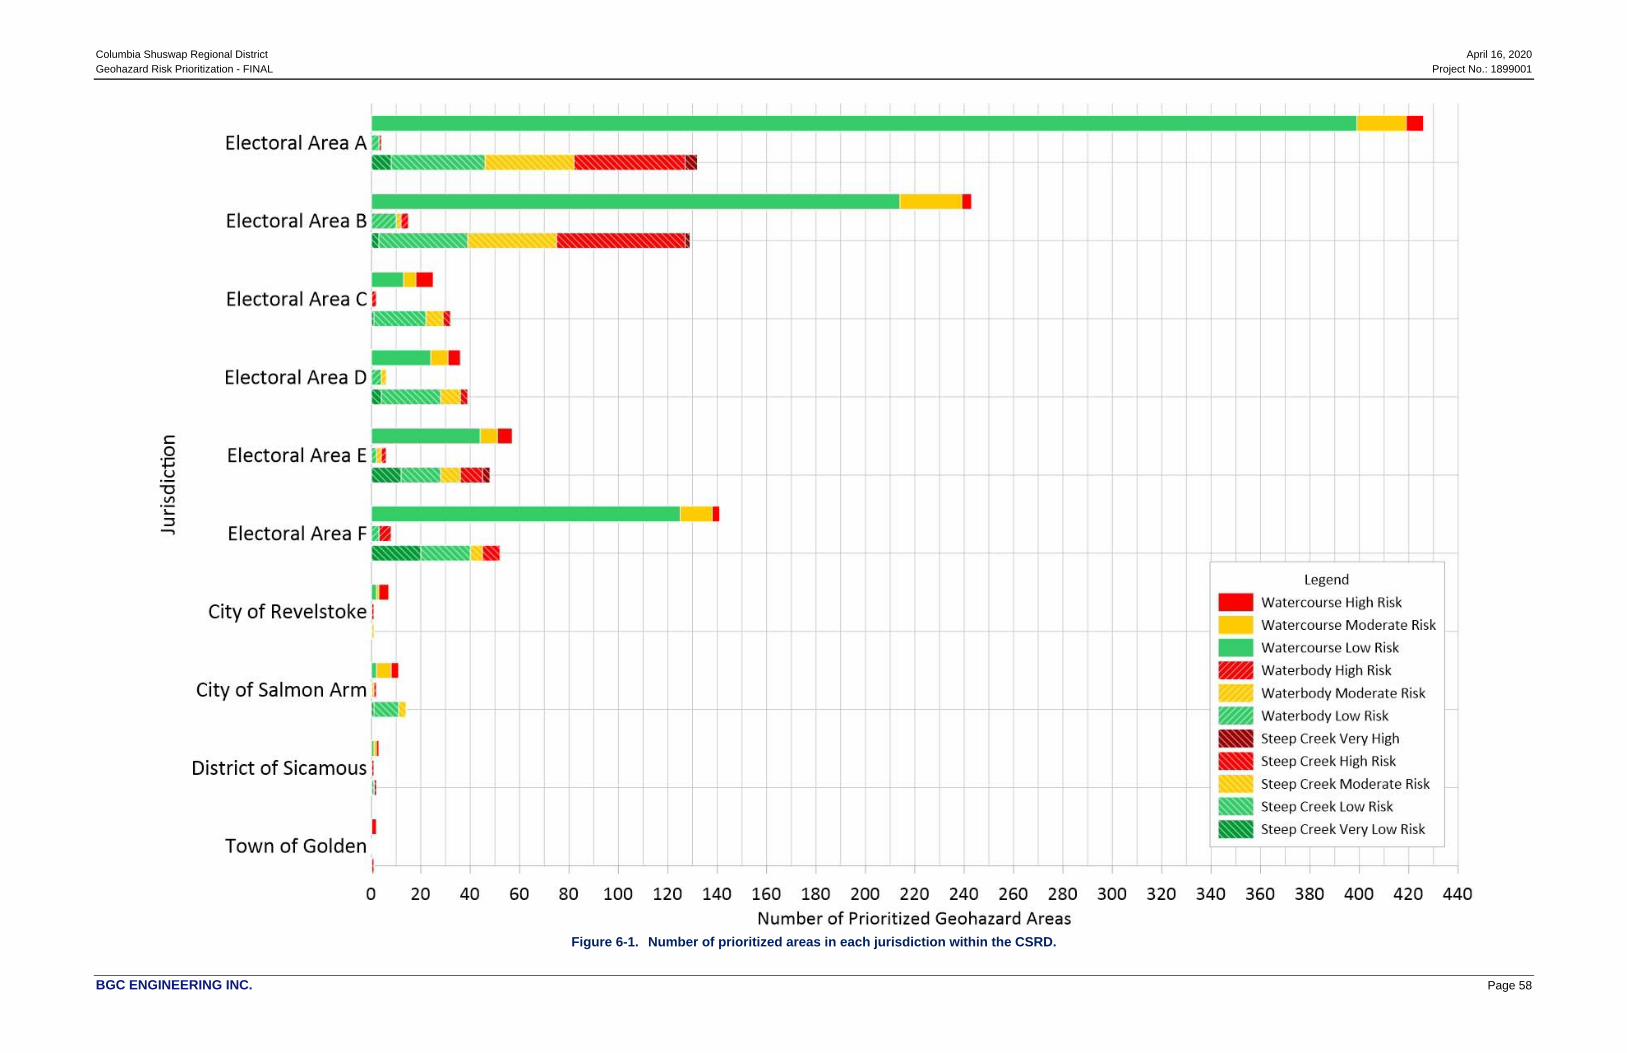
Columbia Shuswap Regional District April 16, 2020 Geohazard Risk Prioritization - FINAL Project No.: 1899001
BGC ENGINEERING INC. Page 58
Figure 6-1. Number of prioritized areas in each jurisdiction within the CSRD.
Columbia Shuswap Regional District April 16, 2020 Geohazard Risk Prioritization - FINAL Project No.: 1899001
BGC ENGINEERING INC. Page 53
7. RECOMMENDATIONS The following sections provide recommendations for consideration by the CSRD. The recommendations may require review by different groups within the CSRD, including board members, managers, planners, emergency management staff, and geomatics staff.
Each section starts with an italicized, bulleted list of recommendations, followed by background and justification. Appendix K provides further detail on recommended approaches and tasks for clear-water flood and steep creek geohazard assessments.
7.1. Data Gaps Recommendation:
• Develop a plan to resolve the baseline data gaps outlined in this section.
Table 7-1 summarizes gaps in baseline data that informed the current risk prioritization study and provides recommendations to resolve these gaps.

Columbia Shuswap Regional District April 16, 2020 Geohazard Risk Prioritization - FINAL Project No.: 1899001
BGC ENGINEERING INC. Page 60
Table 7-1. Summary of data gaps and recommended actions.
Input Description Implication (Factor Affected) Recommended Actions to Resolve Gaps
Topography Lidar coverage is available for areas around Salmon Arm, and in some locations along the margins of Upper Arrow Lake and Trout Lake. Otherwise, Lidar data are not available. In these areas, the lack of detailed topography (Lidar) limited the accuracy of terrain analysis for steep creek fans and for clear-water flood hazard area delineation and characterization.
Precision and accuracy of estimated geohazard location/extents, likelihood, and intensity.
Lidar acquisition and processing. Note that Lidar topography will become available in Spring 2020 that encompasses most of the prioritized flood and steep creek hazard areas in the Thompson River Watershed portion of the CSRD (Terra Remote Sensing, 2020).
Review and update to terrain analyses (i.e., fan boundary delineation) following Lidar acquisition.
Consider re-evaluating geohazard area delineation and characterization once Lidar data are available.
Bathymetry Clear-water flood hazard assessment did not consider the channel geometry or river bathymetry.
Precision and accuracy of estimated geohazard location/extents and intensity.
For more detailed, site-specific studies, bathymetry would be required such as high priority sites identified in Table 7-2 that do not have an existing detailed assessment.
Stream network Not all watercourses present within the CSRD are contained within provincial (TRIM) or national river networks, and some have changed location since mapping (i.e., due to channel avulsion or migration). Mapped watercourses may or may not be consistent with the definition of watercourse contained in Floodplain Management Bylaws. In this study, floodplain identification was based on “Height over Nearest Drainage” (HAND) modelling that involved topographic-based modelling of stream flow. The HAND modelling was performed on the 30m resolution DEM produced by the Shuttle RADAR Topography Mission (SRTM) (Farr et al., 2007). The flow networks defined using HAND modelling may not be consistent with TRIM or national river networks.
Gap in hydrologic analyses for fans not intersecting mapped streams
Watercourses that have moved since the original stream network mapping may lead to an apparent inconsistency between HAND modelling outputs and mapped river channels.
Low resolution of the DEM used in the HAND modelling may also result in inconsistencies between the HAND modelling outputs and the mapped river channels.
Manual revisions to stream networks may be required to facilitate hydrologic, hydraulic, and geomorphic analyses required for geohazard risk management.
Consider running algorithms on region-wide Lidar to identify watercourse and bank locations, and to identify stream segments that are consistent with the bylaw definition for watercourse.
Geohazard Sources / Controls / Triggers
Gaps exist in the inventory of geohazards within the CSRD that represent sources, controls, or triggers for flood and steep creek geohazards. For example, landslides represent triggers for steep creek geohazards, and wildfires alter watershed hydrology in ways that can temporarily affect flood response and sediment transport. Landslides can also create temporary dams and associated inundation and outburst floods, as well as floods from waves triggered by landslides into lakes and reservoirs. Those have not been considered.
Ability to identify sources, controls, or triggers for flood and steep creek geohazard. For example - identification of landslide hazards informing the development of frequency-magnitude relationships for detailed steep creek geohazards assessments.
Given that not all studies can be completed at the same time, maintain a data information management system that integrates existing knowledge, with tools to grow an accessible knowledge base over time as funding permits. Organizing geospatial data so that all studies take advantage of a common resource will greatly reduce the costs of data compilation.
Require assessments to provide results in geospatial formats when generated during a study and provide data standards that facilitate their inclusion in a larger data model.
Initiate citizen science initiatives24 to capture geohazards information, particularly events, in near-real time. A web application is currently being developed by Public Safety Canada that is anticipated to support this action for clear-water floods.
Regional Flood Frequency Analysis
Not all watercourses within the CSRD are gauged and others do not have sufficient periods of records to accurately estimate flood quantiles from at-site data only. Regional flood frequency analysis (RFFA) can be used to estimate flood quantiles for ungauged watercourses and also to help improve estimates of quantiles for sites with short streamflow records. An RFFA is a statistical modelling process which pools information from nearby (regional) gauge stations which are ‘similar’ to the site of interest to determine the flood quantiles.
Precision and accuracy of flood hazard location/extents, likelihood, and intensity.
BGC has conducted an RFFA for southern British Columbia which included over 1,100 hydrometric stations from both Canada and the United States based on the index flood method (Dalrymple, 1960). The study has identified a number of hydrologically homogeneous regions which have been verified using statistical measures of homogeneity.
The homogenous regions within the CSRD have not yet been processed. Next steps would be to develop the regional growth curves (dimensionless flood frequency curves) for each of the regions and
24 i.e., collaborations between professionals and volunteer members of the public, to expand opportunities for data collection and to engage with community members.
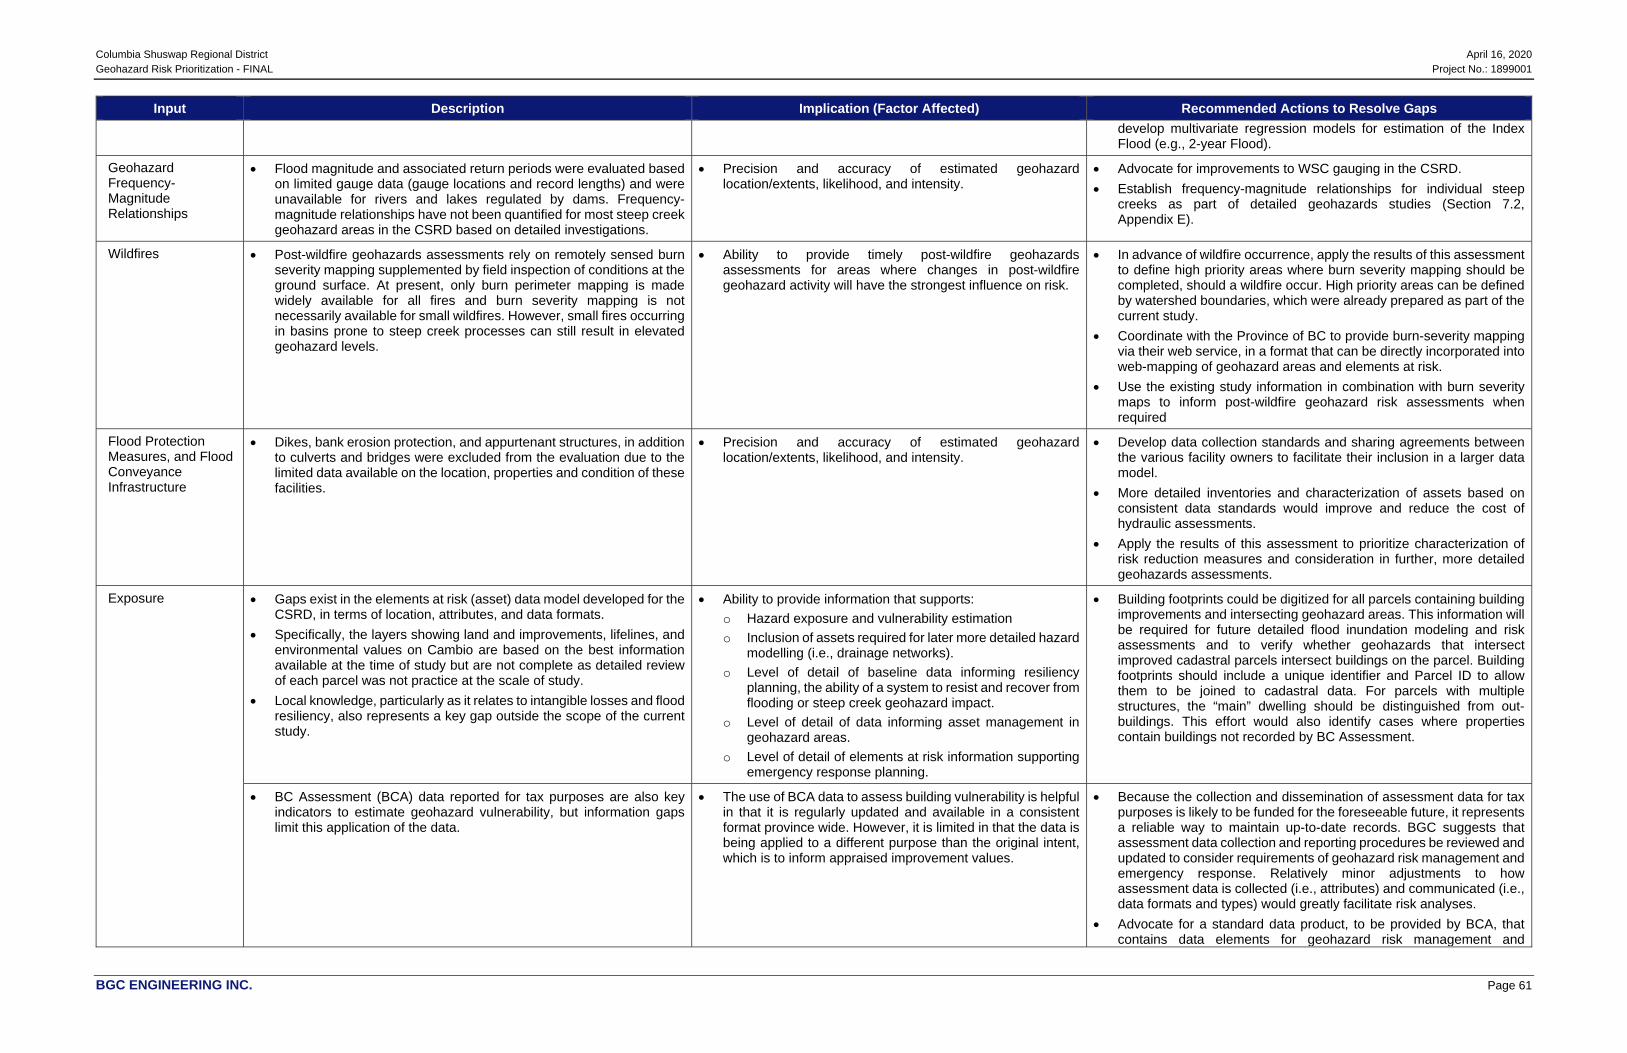
Columbia Shuswap Regional District April 16, 2020 Geohazard Risk Prioritization - FINAL Project No.: 1899001
BGC ENGINEERING INC. Page 61
Input Description Implication (Factor Affected) Recommended Actions to Resolve Gaps develop multivariate regression models for estimation of the Index Flood (e.g., 2-year Flood).
Geohazard Frequency-Magnitude Relationships
Flood magnitude and associated return periods were evaluated based on limited gauge data (gauge locations and record lengths) and were unavailable for rivers and lakes regulated by dams. Frequency-magnitude relationships have not been quantified for most steep creek geohazard areas in the CSRD based on detailed investigations.
Precision and accuracy of estimated geohazard location/extents, likelihood, and intensity.
Advocate for improvements to WSC gauging in the CSRD. Establish frequency-magnitude relationships for individual steep
creeks as part of detailed geohazards studies (Section 7.2, Appendix E).
Wildfires Post-wildfire geohazards assessments rely on remotely sensed burn severity mapping supplemented by field inspection of conditions at the ground surface. At present, only burn perimeter mapping is made widely available for all fires and burn severity mapping is not necessarily available for small wildfires. However, small fires occurring in basins prone to steep creek processes can still result in elevated geohazard levels.
Ability to provide timely post-wildfire geohazards assessments for areas where changes in post-wildfire geohazard activity will have the strongest influence on risk.
In advance of wildfire occurrence, apply the results of this assessment to define high priority areas where burn severity mapping should be completed, should a wildfire occur. High priority areas can be defined by watershed boundaries, which were already prepared as part of the current study.
Coordinate with the Province of BC to provide burn-severity mapping via their web service, in a format that can be directly incorporated into web-mapping of geohazard areas and elements at risk.
Use the existing study information in combination with burn severity maps to inform post-wildfire geohazard risk assessments when required
Flood Protection Measures, and Flood Conveyance Infrastructure
Dikes, bank erosion protection, and appurtenant structures, in addition to culverts and bridges were excluded from the evaluation due to the limited data available on the location, properties and condition of these facilities.
Precision and accuracy of estimated geohazard location/extents, likelihood, and intensity.
Develop data collection standards and sharing agreements between the various facility owners to facilitate their inclusion in a larger data model.
More detailed inventories and characterization of assets based on consistent data standards would improve and reduce the cost of hydraulic assessments.
Apply the results of this assessment to prioritize characterization of risk reduction measures and consideration in further, more detailed geohazards assessments.
Exposure Gaps exist in the elements at risk (asset) data model developed for the CSRD, in terms of location, attributes, and data formats.
Specifically, the layers showing land and improvements, lifelines, and environmental values on Cambio are based on the best information available at the time of study but are not complete as detailed review of each parcel was not practice at the scale of study.
Local knowledge, particularly as it relates to intangible losses and flood resiliency, also represents a key gap outside the scope of the current study.
Ability to provide information that supports: o Hazard exposure and vulnerability estimation o Inclusion of assets required for later more detailed hazard
modelling (i.e., drainage networks). o Level of detail of baseline data informing resiliency
planning, the ability of a system to resist and recover from flooding or steep creek geohazard impact.
o Level of detail of data informing asset management in geohazard areas.
o Level of detail of elements at risk information supporting emergency response planning.
Building footprints could be digitized for all parcels containing building improvements and intersecting geohazard areas. This information will be required for future detailed flood inundation modeling and risk assessments and to verify whether geohazards that intersect improved cadastral parcels intersect buildings on the parcel. Building footprints should include a unique identifier and Parcel ID to allow them to be joined to cadastral data. For parcels with multiple structures, the “main” dwelling should be distinguished from out-buildings. This effort would also identify cases where properties contain buildings not recorded by BC Assessment.
BC Assessment (BCA) data reported for tax purposes are also key indicators to estimate geohazard vulnerability, but information gaps limit this application of the data.
The use of BCA data to assess building vulnerability is helpful in that it is regularly updated and available in a consistent format province wide. However, it is limited in that the data is being applied to a different purpose than the original intent, which is to inform appraised improvement values.
Because the collection and dissemination of assessment data for tax purposes is likely to be funded for the foreseeable future, it represents a reliable way to maintain up-to-date records. BGC suggests that assessment data collection and reporting procedures be reviewed and updated to consider requirements of geohazard risk management and emergency response. Relatively minor adjustments to how assessment data is collected (i.e., attributes) and communicated (i.e., data formats and types) would greatly facilitate risk analyses.
Advocate for a standard data product, to be provided by BCA, that contains data elements for geohazard risk management and
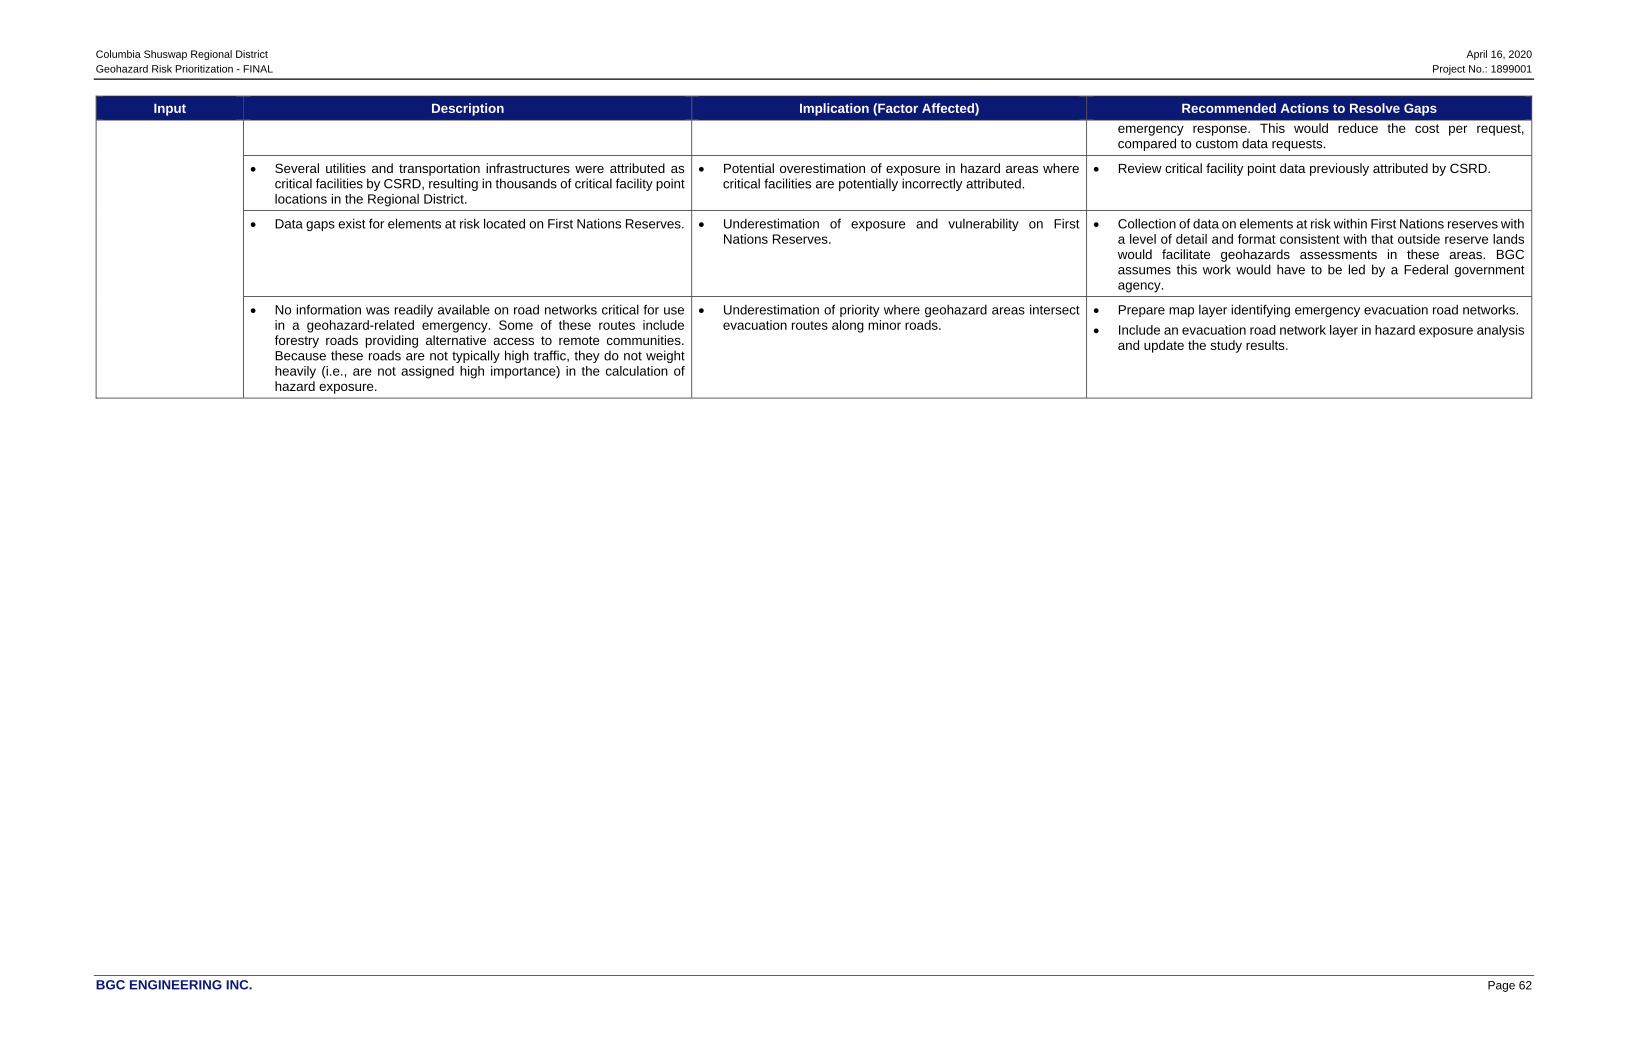
Columbia Shuswap Regional District April 16, 2020 Geohazard Risk Prioritization - FINAL Project No.: 1899001
BGC ENGINEERING INC. Page 62
Input Description Implication (Factor Affected) Recommended Actions to Resolve Gaps emergency response. This would reduce the cost per request, compared to custom data requests.
Several utilities and transportation infrastructures were attributed as critical facilities by CSRD, resulting in thousands of critical facility point locations in the Regional District.
Potential overestimation of exposure in hazard areas where critical facilities are potentially incorrectly attributed.
Review critical facility point data previously attributed by CSRD.
Data gaps exist for elements at risk located on First Nations Reserves. Underestimation of exposure and vulnerability on First Nations Reserves.
Collection of data on elements at risk within First Nations reserves with a level of detail and format consistent with that outside reserve lands would facilitate geohazards assessments in these areas. BGC assumes this work would have to be led by a Federal government agency.
No information was readily available on road networks critical for use in a geohazard-related emergency. Some of these routes include forestry roads providing alternative access to remote communities. Because these roads are not typically high traffic, they do not weight heavily (i.e., are not assigned high importance) in the calculation of hazard exposure.
Underestimation of priority where geohazard areas intersect evacuation routes along minor roads.
Prepare map layer identifying emergency evacuation road networks. Include an evacuation road network layer in hazard exposure analysis
and update the study results.
Columbia Shuswap Regional District April 16, 2020 Geohazard Risk Prioritization - FINAL Project No.: 1899001
BGC ENGINEERING INC. Page 57
7.2. Further Geohazards Assessments Recommendation:
• Complete more detailed assessments for geohazard areas chosen by CSRD as top priority, following review of the results of this assessment.
Table 7-2 highlights clear-water flood and steep creek geohazard areas considered high priority for further assessment. The full list of prioritized areas should be reviewed for decision making. BGC emphasizes that the baseline priority ratings are not equivalent to an absolute level of risk, and CSRD will need to consider additional factors in decisions about next steps at any site (i.e., evaluation of costs and benefits to advance the steps of risk management). The prioritized geohazard areas listed in Appendix H can be sorted based on any factor listed in the tables, for consideration alongside other factors outside the scope of this assessment that CSRD may consider.
Sections 7.2.1 to 7.2.3 summarize the rationale for further studies of clear-water flood hazards, regulated water bodies (reservoirs), and steep creeks. Appendix K provides further detail on recommended approaches and tasks for clear-water flood and steep creek geohazard assessments.
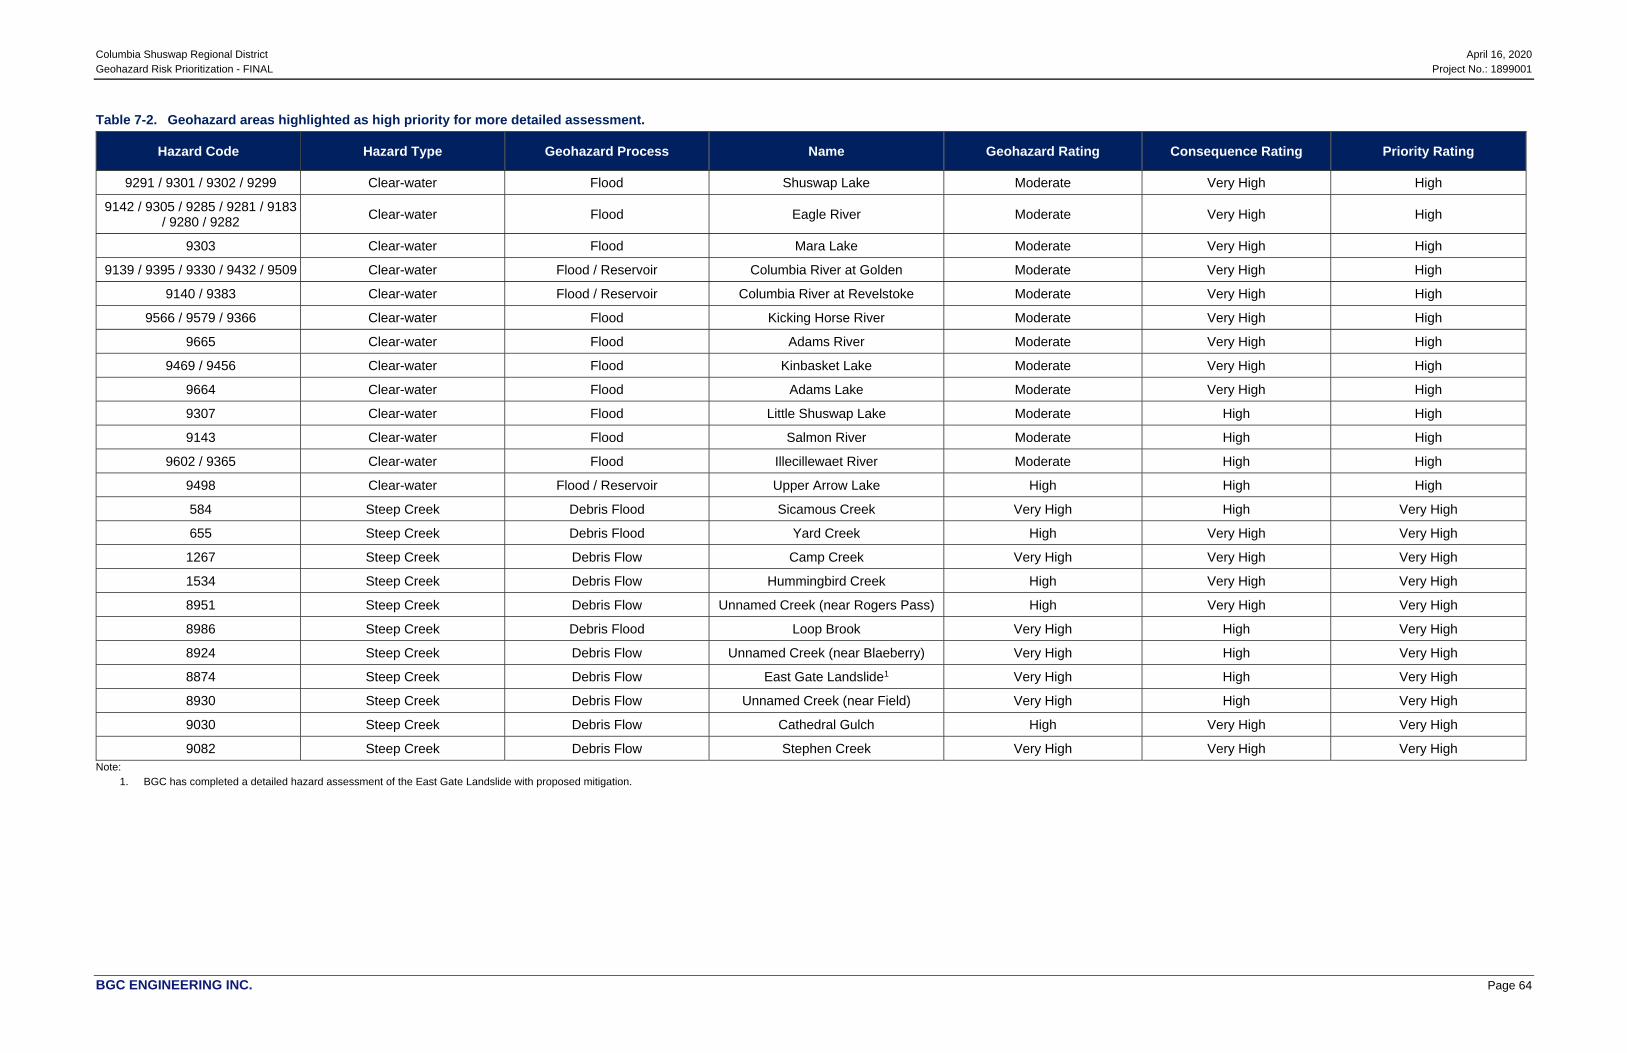
Columbia Shuswap Regional District April 16, 2020 Geohazard Risk Prioritization - FINAL Project No.: 1899001
BGC ENGINEERING INC. Page 64
Table 7-2. Geohazard areas highlighted as high priority for more detailed assessment.
Note: 1. BGC has completed a detailed hazard assessment of the East Gate Landslide with proposed mitigation.
Hazard Code Hazard Type Geohazard Process Name Geohazard Rating Consequence Rating Priority Rating
9291 / 9301 / 9302 / 9299 Clear-water Flood Shuswap Lake Moderate Very High High
9142 / 9305 / 9285 / 9281 / 9183 / 9280 / 9282 Clear-water Flood Eagle River Moderate Very High High
9303 Clear-water Flood Mara Lake Moderate Very High High
9139 / 9395 / 9330 / 9432 / 9509 Clear-water Flood / Reservoir Columbia River at Golden Moderate Very High High
9140 / 9383 Clear-water Flood / Reservoir Columbia River at Revelstoke Moderate Very High High
9566 / 9579 / 9366 Clear-water Flood Kicking Horse River Moderate Very High High
9665 Clear-water Flood Adams River Moderate Very High High
9469 / 9456 Clear-water Flood Kinbasket Lake Moderate Very High High
9664 Clear-water Flood Adams Lake Moderate Very High High
9307 Clear-water Flood Little Shuswap Lake Moderate High High
9143 Clear-water Flood Salmon River Moderate High High
9602 / 9365 Clear-water Flood Illecillewaet River Moderate High High
9498 Clear-water Flood / Reservoir Upper Arrow Lake High High High
584 Steep Creek Debris Flood Sicamous Creek Very High High Very High
655 Steep Creek Debris Flood Yard Creek High Very High Very High
1267 Steep Creek Debris Flow Camp Creek Very High Very High Very High
1534 Steep Creek Debris Flow Hummingbird Creek High Very High Very High
8951 Steep Creek Debris Flow Unnamed Creek (near Rogers Pass) High Very High Very High
8986 Steep Creek Debris Flood Loop Brook Very High High Very High
8924 Steep Creek Debris Flow Unnamed Creek (near Blaeberry) Very High High Very High
8874 Steep Creek Debris Flow East Gate Landslide1 Very High High Very High
8930 Steep Creek Debris Flow Unnamed Creek (near Field) Very High High Very High
9030 Steep Creek Debris Flow Cathedral Gulch High Very High Very High
9082 Steep Creek Debris Flow Stephen Creek Very High Very High Very High
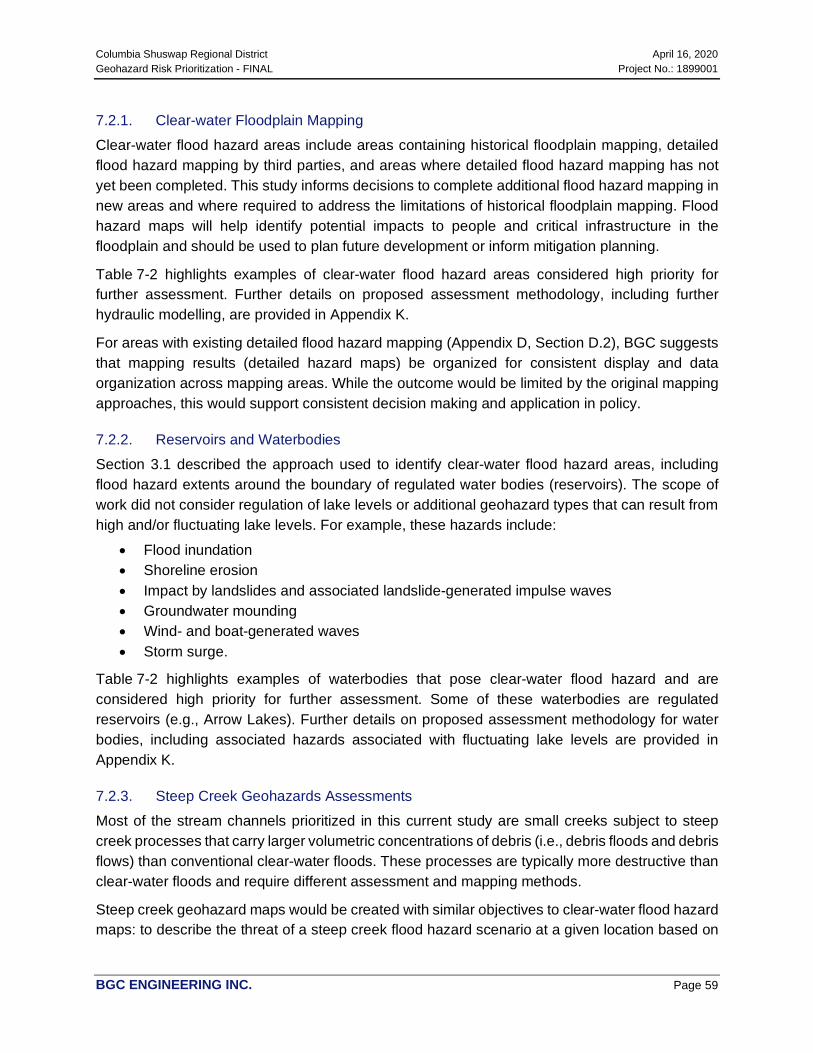
Columbia Shuswap Regional District April 16, 2020 Geohazard Risk Prioritization - FINAL Project No.: 1899001
BGC ENGINEERING INC. Page 59
7.2.1. Clear-water Floodplain Mapping Clear-water flood hazard areas include areas containing historical floodplain mapping, detailed flood hazard mapping by third parties, and areas where detailed flood hazard mapping has not yet been completed. This study informs decisions to complete additional flood hazard mapping in new areas and where required to address the limitations of historical floodplain mapping. Flood hazard maps will help identify potential impacts to people and critical infrastructure in the floodplain and should be used to plan future development or inform mitigation planning.
Table 7-2 highlights examples of clear-water flood hazard areas considered high priority for further assessment. Further details on proposed assessment methodology, including further hydraulic modelling, are provided in Appendix K.
For areas with existing detailed flood hazard mapping (Appendix D, Section D.2), BGC suggests that mapping results (detailed hazard maps) be organized for consistent display and data organization across mapping areas. While the outcome would be limited by the original mapping approaches, this would support consistent decision making and application in policy.
7.2.2. Reservoirs and Waterbodies Section 3.1 described the approach used to identify clear-water flood hazard areas, including flood hazard extents around the boundary of regulated water bodies (reservoirs). The scope of work did not consider regulation of lake levels or additional geohazard types that can result from high and/or fluctuating lake levels. For example, these hazards include:
• Flood inundation • Shoreline erosion • Impact by landslides and associated landslide-generated impulse waves • Groundwater mounding • Wind- and boat-generated waves • Storm surge.
Table 7-2 highlights examples of waterbodies that pose clear-water flood hazard and are considered high priority for further assessment. Some of these waterbodies are regulated reservoirs (e.g., Arrow Lakes). Further details on proposed assessment methodology for water bodies, including associated hazards associated with fluctuating lake levels are provided in Appendix K.
7.2.3. Steep Creek Geohazards Assessments Most of the stream channels prioritized in this current study are small creeks subject to steep creek processes that carry larger volumetric concentrations of debris (i.e., debris floods and debris flows) than conventional clear-water floods. These processes are typically more destructive than clear-water floods and require different assessment and mapping methods.
Steep creek geohazard maps would be created with similar objectives to clear-water flood hazard maps: to describe the threat of a steep creek flood hazard scenario at a given location based on
Columbia Shuswap Regional District April 16, 2020 Geohazard Risk Prioritization - FINAL Project No.: 1899001
BGC ENGINEERING INC. Page 60
its anticipated extent and intensity (destructive potential). Intensity is a function of flow depth, velocity, scour and debris deposition, all of which vary depending on hazard magnitude and its probability of occurrence.
Table 7-2 highlights examples of steep creek hazard areas considered high priority for further assessment. The list is not exhaustive, and the full list of inventoried steep creek fans should be reviewed when selecting sites for further work. It should be
The purpose of the steep creek flood hazard maps would be to support:
• Land use regulatory planning, including bylaw implementation and revisions • Emergency planning and operations • Flood risk management, including prevention and mitigation.
Further details on proposed assessment methodology are provided in Appendix K.
7.3. Long-Term Geohazard Risk Management Recommendation:
• Adopt the list of prioritized geohazard areas as a preliminary risk register and develop a path forward for long-term geohazard risk management of these sites.
The results of this study help the CSRD and stakeholders identify the need and level of effort required for further assessments based on existing hazards and elements at risk. However, the assessment is a snapshot in time. It will require regular updates and maintenance to remain useful for decision making over the long term. Procedures to identify requirements for updates and maintenance would need to consider factors such as:
• Data gaps such as those identified in this study • Landscape changes affecting hazard levels (e.g., forest fires, new hazard events, or the
construction of mitigation measures) • Changes to elements at risk (e.g., new development) • Future geohazards studies that should be incorporated into the integrated knowledge
base.
This section summarizes points of consideration for long-term geohazard risk management that would build on the results of this study. A key objective is to support an iterative approach to long-term, multi-stage risk management that:
• Dynamically addresses changing conditions (landscape, hydro-climate, and land use). • Is not dependent on any single large grant for implementation (i.e., moves away from
major, grant-funded studies towards annual maintenance of a knowledge base). • Considers not only risk tolerance criteria, but a structured approach to determine how far
can risk can be reduced with available resources.
This framework encompasses applying a continuous algorithm of relative risk-based assessment between hazard areas (e.g., building from this study), then iterative management of at-risk sites based on their stage in the risk management process (ISO 31000:2009; Figure 7-1).
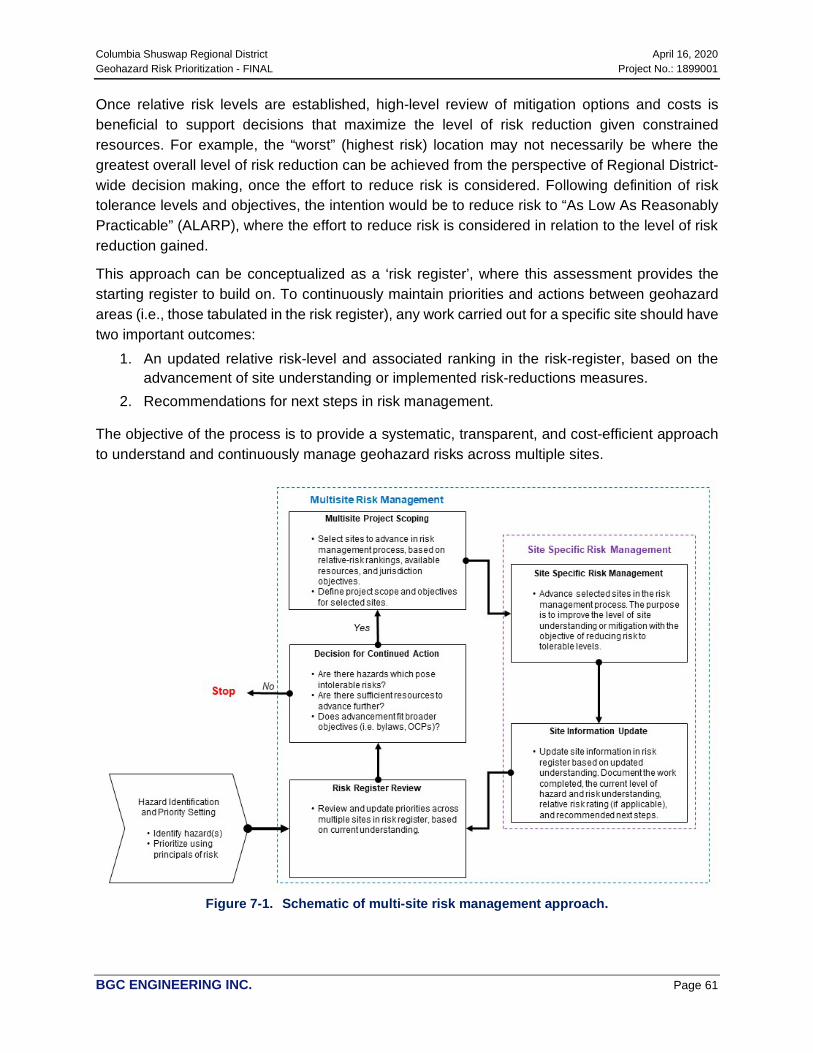
Columbia Shuswap Regional District April 16, 2020 Geohazard Risk Prioritization - FINAL Project No.: 1899001
BGC ENGINEERING INC. Page 61
Once relative risk levels are established, high-level review of mitigation options and costs is beneficial to support decisions that maximize the level of risk reduction given constrained resources. For example, the “worst” (highest risk) location may not necessarily be where the greatest overall level of risk reduction can be achieved from the perspective of Regional District-wide decision making, once the effort to reduce risk is considered. Following definition of risk tolerance levels and objectives, the intention would be to reduce risk to “As Low As Reasonably Practicable” (ALARP), where the effort to reduce risk is considered in relation to the level of risk reduction gained.
This approach can be conceptualized as a ‘risk register’, where this assessment provides the starting register to build on. To continuously maintain priorities and actions between geohazard areas (i.e., those tabulated in the risk register), any work carried out for a specific site should have two important outcomes:
1. An updated relative risk-level and associated ranking in the risk-register, based on the advancement of site understanding or implemented risk-reductions measures.
2. Recommendations for next steps in risk management.
The objective of the process is to provide a systematic, transparent, and cost-efficient approach to understand and continuously manage geohazard risks across multiple sites.
Figure 7-1. Schematic of multi-site risk management approach.

Columbia Shuswap Regional District April 16, 2020 Geohazard Risk Prioritization - FINAL Project No.: 1899001
BGC ENGINEERING INC. Page 62
7.4. Geohazards Monitoring Recommendation:
• Develop a path to design and implement geohazard monitoring and warning systems.
Real-time precipitation and stream flow monitoring are key inputs informing flood-related emergency monitoring and response.
Environment and Climate Change Canada (ECCC) maintains the Canadian Precipitation Analysis (CaPA) system, which provides objective estimates of precipitation in 10 km by 10 km (at 60° N) grids across North America. Figure 7-2 shows an example of 24-hour accumulated precipitation in southern British Columbia, reported via BGC’s RNT25. ECCC also provides the Regional Deterministic Prediction System (RDPS), which is a 48 hour forecast data (at an hourly timestep) that is produced four times a day at similar resolution to the CaPA data. The forecast dataset includes many climate variables, including forecasted precipitation.
Figure 7-2. Example of 24-hour accumulated precipitation in southern British Columbia on
November 3, 2018. Source: EC-MSC Canadian Precipitation Analysis (CaPA) (2018, via BGC RNT™).
The WSC maintains approximately 1900 real-time stream flow gauges across Canada, of which 13 are located in the CSRD (Table 7-4). Figure 7-3 shows example screen shots of a real-time flow gauge location and metadata from BGCs RNT™. BGC notes that Cambio provides access to real-time26 stream flow and lake level monitoring data sourced from the Water Survey of Canada (WSC) (Figure 7-3).
25 Results anticipated to soon be made available at finer resolution (1-3 km grid). 26 i.e., information-refresh each time flow monitoring data is updated and provided by third parties.
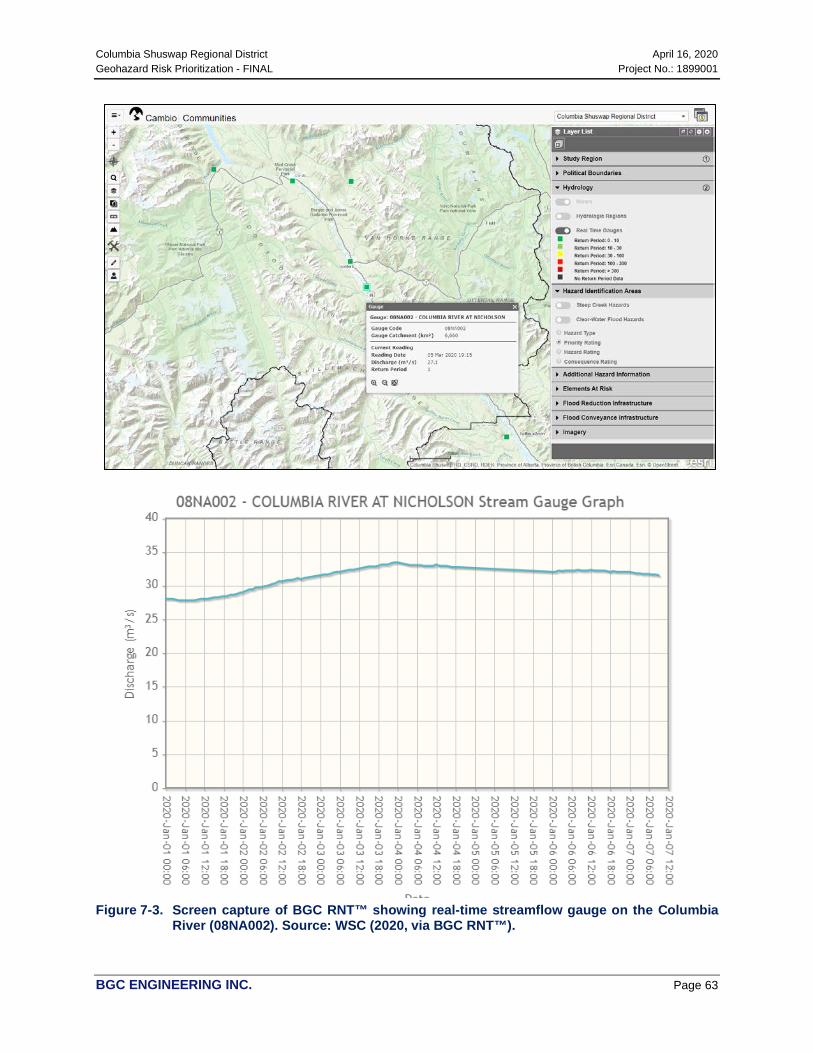
Columbia Shuswap Regional District April 16, 2020 Geohazard Risk Prioritization - FINAL Project No.: 1899001
BGC ENGINEERING INC. Page 63
Figure 7-3. Screen capture of BGC RNT™ showing real-time streamflow gauge on the Columbia
River (08NA002). Source: WSC (2020, via BGC RNT™).
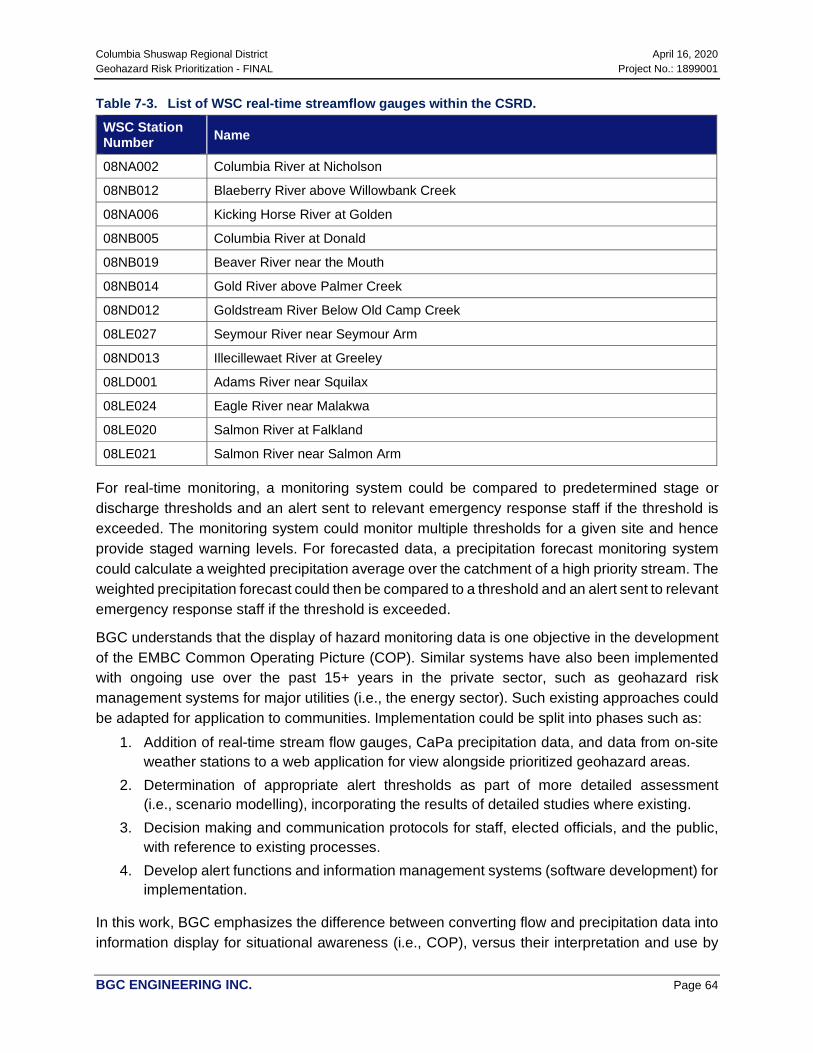
Columbia Shuswap Regional District April 16, 2020 Geohazard Risk Prioritization - FINAL Project No.: 1899001
BGC ENGINEERING INC. Page 64
Table 7-3. List of WSC real-time streamflow gauges within the CSRD. WSC Station Number Name
08NA002 Columbia River at Nicholson
08NB012 Blaeberry River above Willowbank Creek
08NA006 Kicking Horse River at Golden
08NB005 Columbia River at Donald
08NB019 Beaver River near the Mouth
08NB014 Gold River above Palmer Creek
08ND012 Goldstream River Below Old Camp Creek
08LE027 Seymour River near Seymour Arm
08ND013 Illecillewaet River at Greeley
08LD001 Adams River near Squilax
08LE024 Eagle River near Malakwa
08LE020 Salmon River at Falkland
08LE021 Salmon River near Salmon Arm
For real-time monitoring, a monitoring system could be compared to predetermined stage or discharge thresholds and an alert sent to relevant emergency response staff if the threshold is exceeded. The monitoring system could monitor multiple thresholds for a given site and hence provide staged warning levels. For forecasted data, a precipitation forecast monitoring system could calculate a weighted precipitation average over the catchment of a high priority stream. The weighted precipitation forecast could then be compared to a threshold and an alert sent to relevant emergency response staff if the threshold is exceeded.
BGC understands that the display of hazard monitoring data is one objective in the development of the EMBC Common Operating Picture (COP). Similar systems have also been implemented with ongoing use over the past 15+ years in the private sector, such as geohazard risk management systems for major utilities (i.e., the energy sector). Such existing approaches could be adapted for application to communities. Implementation could be split into phases such as:
1. Addition of real-time stream flow gauges, CaPa precipitation data, and data from on-site weather stations to a web application for view alongside prioritized geohazard areas.
2. Determination of appropriate alert thresholds as part of more detailed assessment (i.e., scenario modelling), incorporating the results of detailed studies where existing.
3. Decision making and communication protocols for staff, elected officials, and the public, with reference to existing processes.
4. Develop alert functions and information management systems (software development) for implementation.
In this work, BGC emphasizes the difference between converting flow and precipitation data into information display for situational awareness (i.e., COP), versus their interpretation and use by
Columbia Shuswap Regional District April 16, 2020 Geohazard Risk Prioritization - FINAL Project No.: 1899001
BGC ENGINEERING INC. Page 65
subject matter specialists for hazard warning, communication, and decision making. Determining alert thresholds would require more detailed geohazard assessment to determine input requirements, estimate thresholds and evaluate limitations and uncertainties. This work could also include estimation of alert thresholds for post-wildfire geohazard monitoring.
BGC also notes that there are substantial efficiencies of scale in hazard monitoring and warning systems. Prior to initiating such work, BGC suggests review of existing approaches and multi-stakeholder engagement to define interest and resources in supporting such work.
7.5. Policy Integration Recommendations:
• Review Development Permit Areas (DPAs) within the CSRD, in light of the hazard extents identified in this study.
• Review OCP land-use designations within the CSRD, in light of the hazard extents identified in this study.
• Review recommendations in Appendix I regarding modernization of flood and steep creek related bylaws and policies.
• BGC recommends CSRD review the asset exposure weightings when developing risk assessment policy.
7.5.1. Development Permit Areas (DPAs) DPAs are areas designated by an OCP where special requirements and guidelines for any development or alteration of the land are in effect. In such areas, permits are typically required to ensure that development or land alteration is consistent with objectives outlined within applicable OCPs.
Appendix J provides a framework for how the CSRD may consider establishing DPAs for hazardous lands in the Regional District. This includes an iterative approach where the level of hazard understanding to delineate DPA boundaries and define associated policies and bylaws improves in phases. The purpose is to advance from an initial phase of hazard identification (i.e., this study) through to detailed mapping by focusing effort on the relatively higher risk areas.
BGC recommends that government jurisdictions within the CSRD review the prioritized geohazard areas from the perspective of defining flood and steep creek DPAs, and in the context of the framework summarized in Appendix J. The following two sections provides guidance on how to translate mapping in this study into steep creek and clearwater DPAs.
Steep Creek Hazards
For steep creek hazards, the delineated fan boundaries should be considered as a basis to define a preliminary set of steep creek DPAs in the CSRD. Application of study results to define DPAs should consider geohazard mapping uncertainties and the limitations listed in Appendix E.

Columbia Shuswap Regional District April 16, 2020 Geohazard Risk Prioritization - FINAL Project No.: 1899001
BGC ENGINEERING INC. Page 66
The steep creek mapping should not be considered exhaustive, as the fan inventory only considers ‘developed’ fans. Areas located upstream of a fan apex, or along fans that are ‘undeveloped’ and are not mapped could be prone to steep creek hazards.
BGC mapped areas susceptible to debris floods and debris flows using topographic susceptibility modelling (Appendix E). These areas are shown as “CSRD Debris Flood Susceptibility” and “CSRD Debris Flow Susceptibility” on Cambio under the “Additional Hazard Information” dropdown in the layer list. BGC recommends the CSRD consider the application of these results to defining steep creek DPAs for areas potentially prone to steep creek hazards but are not included in the fan inventory. BGC notes that establishing DPA boundaries is typically highly uncertain until at least a screening level assessment has been completed and requires defining a level of reasonable caution given uncertainties.
Clear-water Hazards
For clear-water hazards, the mapped floodplain boundaries derived from historical floodplain mapping and screening-level hydraulic modelling can be used for defining DPAs. The screening-level-mapping modelling has limitations particularly due to the accuracy of the underlying Digital Elevation Model. As such, these results may be suitable for defining the extent of a DPA, but further assessment (base-level hazard mapping, detailed hazard mapping and site-specific assessment) is required by a Qualified Engineering Professional (QEP) in permitting approvals.
7.5.2. Land-Use Review CSRD is responsible for land-use planning in electoral areas, but not within limits of it’s member municipalities. Land use designations are established in OCP’s which are then administered by the responsible jurisdictions. These designations are intended to implement municipal and regional district land use planning visions.
BGC recommends that CSRD review land-use designations against the prioritized geohazard areas. The objective would be to identify areas that were previously unknown as prone to flood or steep creek hazards and compare them to current land-use. BGC notes that the Electoral Area F (North Shuswap) OCP, Section 2.4, establishes a policy for discouraging high-intensity land use in areas designated as hazardous lands. The purpose of this task is to support this and similar policy objectives, where limiting potential exposure to hazards is a key principal.
7.5.3. Policy Review
CSRD administers OCP Bylaws and Zoning Bylaws that govern development in flood and steep creek hazard areas. Appendix I provides a review of three CSRD bylaws27, as well as recommendations for their modernization from the perspective of:
• Developing an approach that aligns with current flood and steep creek risk management. • Achieving consistency between jurisdicitons within CSRD. • Developing a risk-informed approach to geohazards management.
27 Electoral Area F OCP Bylaw No. 830; Scotch Creek/Lee Creek Zoning Bylaw No. 825; Rural Sicamous Land Use
Bylaw No. 2000.
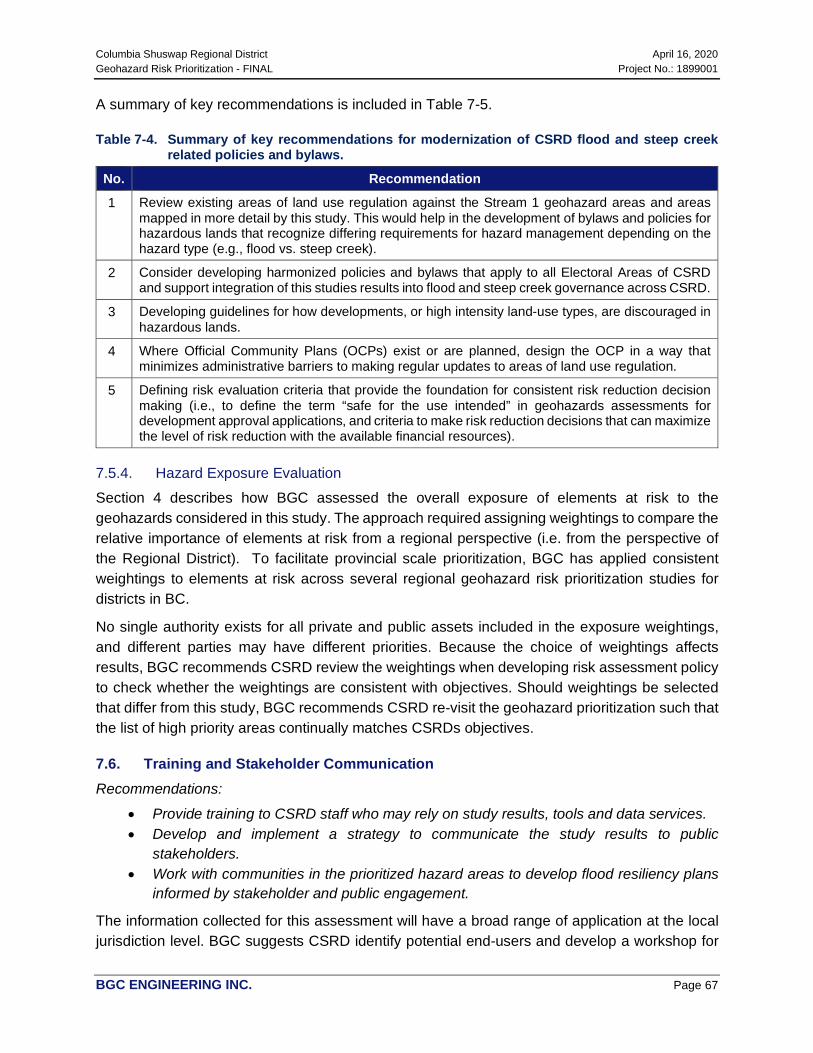
Columbia Shuswap Regional District April 16, 2020 Geohazard Risk Prioritization - FINAL Project No.: 1899001
BGC ENGINEERING INC. Page 67
A summary of key recommendations is included in Table 7-5.
Table 7-4. Summary of key recommendations for modernization of CSRD flood and steep creek related policies and bylaws.
No. Recommendation
1 Review existing areas of land use regulation against the Stream 1 geohazard areas and areas mapped in more detail by this study. This would help in the development of bylaws and policies for hazardous lands that recognize differing requirements for hazard management depending on the hazard type (e.g., flood vs. steep creek).
2 Consider developing harmonized policies and bylaws that apply to all Electoral Areas of CSRD and support integration of this studies results into flood and steep creek governance across CSRD.
3 Developing guidelines for how developments, or high intensity land-use types, are discouraged in hazardous lands.
4 Where Official Community Plans (OCPs) exist or are planned, design the OCP in a way that minimizes administrative barriers to making regular updates to areas of land use regulation.
5 Defining risk evaluation criteria that provide the foundation for consistent risk reduction decision making (i.e., to define the term “safe for the use intended” in geohazards assessments for development approval applications, and criteria to make risk reduction decisions that can maximize the level of risk reduction with the available financial resources).
7.5.4. Hazard Exposure Evaluation Section 4 describes how BGC assessed the overall exposure of elements at risk to the geohazards considered in this study. The approach required assigning weightings to compare the relative importance of elements at risk from a regional perspective (i.e. from the perspective of the Regional District). To facilitate provincial scale prioritization, BGC has applied consistent weightings to elements at risk across several regional geohazard risk prioritization studies for districts in BC.
No single authority exists for all private and public assets included in the exposure weightings, and different parties may have different priorities. Because the choice of weightings affects results, BGC recommends CSRD review the weightings when developing risk assessment policy to check whether the weightings are consistent with objectives. Should weightings be selected that differ from this study, BGC recommends CSRD re-visit the geohazard prioritization such that the list of high priority areas continually matches CSRDs objectives.
7.6. Training and Stakeholder Communication Recommendations:
• Provide training to CSRD staff who may rely on study results, tools and data services. • Develop and implement a strategy to communicate the study results to public
stakeholders. • Work with communities in the prioritized hazard areas to develop flood resiliency plans
informed by stakeholder and public engagement.
The information collected for this assessment will have a broad range of application at the local jurisdiction level. BGC suggests CSRD identify potential end-users and develop a workshop for
Columbia Shuswap Regional District April 16, 2020 Geohazard Risk Prioritization - FINAL Project No.: 1899001
BGC ENGINEERING INC. Page 68
communication and training. For example, potential end-users could include planners, building permit officers, geomatics/GIS support staff, and emergency response workers. Such a workshop could include the following:
• Overview of steps to identify, assess, and manage clear-water flood and steep creek risks as part of land use planning and development permitting
• Discussion of the use of information (maps and ratings) provided in this study • Information sharing between local jurisdictions and provincial staff.
Workshops would also provide a forum to gather additional local information on hazard events and consequences to local communities that might otherwise be undetected.
7.7. Digital Information Sharing Recommendation:
• Collaborate with private and public sector agencies within and outside the CSRD to share information, methods, and resources about pro-active geohazard risk and emergency management.
The following comments apply to information sharing and liability in the context of geohazard risk management within the CSRD and more broadly across BC:
• Increasingly, much of the data supporting different aspects of geohazard risk and emergency management is spatial, delivered digitally, and changes over time. For example, EMBC and GeoBC have initiated a data management portal (BC Emergency Management Common Operating Picture), and BGC is delivering the results of both Stream 1 and Stream 2 studies via a web application, Cambio. Such applications may be linked in future through online data services. Where capacity exists, we suggest that local and First Nations goverments make the management of spatial data (data services) a key priority when considering investments in information management, including systems for identifying revisions and tracking evolving data versions. Being able to consume and deliver data in forms that can readily be incorporated into web applications will increase their utility for decision making, especially when adapting to change (e.g., changing climate, watershed conditions and land use). For local and First Nations governments without the capacity to consume data into their own internal systems, Cambio or similar systems can provide access to all study information via a standard web browser.
• Under a professional reliance model, hazard, vulnerability and risk assessments in British Columbia are mostly completed by Qualified Professionals (QPs). The results tend to be delivered with inconsistent formats between practioners, which makes it costly for governments to manage hazard, vulnerability, and risk information in a common knowledge base. As tools for data sharing improve, we anticipate that QPs may increasingly use digital (web) processes to obtain data from multiple sources, add value in their area of expertise, and then deliver updated information in a more dynamic way (i.e., via licensed data services). Local governments may wish to consider these changes when allocating budgets to maintain geohazard risk management programs. Section 4.7
Columbia Shuswap Regional District April 16, 2020 Geohazard Risk Prioritization - FINAL Project No.: 1899001
BGC ENGINEERING INC. Page 69
describes approaches to collaborate and share costs with other parties with shared objectives (i.e., private stakeholders; different levels and branches of government).
• All vulnerability and risk assessments require spatial data about assets (e.g., buildings and infrastructure). BGC’s Stream 1 required an asset inventory that was resource intensive to compile, and will require continued resources to be kept up to date. We suggest that, with increased provincial support, the Integrated Cadastral Information (ICI) Society could collect and disseminate a comprehensive inventory of asset data suitable for vulnerability and risk assessment. BGC recommends that requirements for this integrated dataset (e.g. asset taxonomies, information level of detail), as well as operational programs to maintain it, be developed collaboratively with specialists in emergency management, planning, asset management, and risk assessment.
7.8. Multi-Stakeholder Resource Sharing Recommendation:
• Connect private and public resources for geohazard and risk management that amplify their effectiveness to reduce risk beyond what can be accomplished in isolation.
Section 3.2 notes that the Stream 1 and this study are applicable to a wide range of private and public stakeholders. Different branches and levels of government, non-governmental organizations, and owner-operators of major assets (e.g., transportation and energy generation and transmission) in a given hazard area will commonly have shared requirements to understand and manage geohazard risk, and decisions by any single owner may have downstream implications (e.g., potential risk transfer).
BGC suggests that CSRD define shared objectives for hazard and risk information management not only with public stakeholders, but with the private sector. BGC suggests the following for consideration:
• Consider approaches that leverage public-private information sharing without necessarily requiring any changes to existing organizational structures, responsibilities, or funding mechanisms.
• Consider the different strengths contributed by each stakeholder in terms of sharing both information and processes. For example, dynamically (semi-continuously) managed approaches to geohazard risk and asset management, including software-supported hazard monitoring and field inspection programs, are well established for linear infrastructure in ways that readily transfer to community applications with long-term maintenance supported through cost-sharing. Conversely, a spatial understanding of hazards (e.g., hazard maps) are rare along linear corridors in BC and contain attributes readily transferable to risk management for linear assets.
• Consider the assessment and management of service disruption as an intersection of needs between communities and the owners/regulators of lifelines (transportation and utility networks).
Given the professional reliance model for geohazards practice in BC, Qualified Professionals are positioned to act as a bridge between the private and public sector. BGC currently works with

Columbia Shuswap Regional District April 16, 2020 Geohazard Risk Prioritization - FINAL Project No.: 1899001
BGC ENGINEERING INC. Page 70
several operators of major utilities within the CSRD and can help identify areas where the study results could be applied in stakeholder collaborations, on request.
7.9. Responsibility and Liability Recommendations:
• Clarify roles and responsibilities for government in geohazard and risk management. • Clarify how to consider issues of professional responsibility and liability in the context of
digital data and changing conditions (changing climate, landscape and land use). • Strengthen the role of the Province in funding and coordinating geohazard risk
management in BC.
Currently, responsibilities for geohazard risk management are spread across multiple levels and branches of government in British Columbia. However, local governments may lack control or authority over parts of the land base upon which geohazards exist. These issues create challenges when defining roles, responsibilities and liabilities related to geohazard risk management in British Columbia. For example, hazards could cross jurisdictional boundaries, or the same geographic area could require different levels or branches of government to plan land use, approve subdivisions, pay for structural mitigation, and plan and pay for emergency response. These issues can potentially foster decision paralysis or create conflicting interests, such as a desire to densify development in a hazard area to create tax revenue required for mitigation planning.
Professional responsibility and liability issues need to be explicitly addressed as part of the professional reliance model applied by local governments for most geohazards-related work. Relying on geohazards maps and related knowledge in the context of climate change and landscape-altering events (e.g., wildfires or geohazard occurrence) raises additional questions related to professional responsibility and liability.
The dynamic delivery of online digital information under a changing climate and changing land use provides both an opportunity (to address change) and a challenge (given it is an ever-evolving area of practice). A distinction ought to be made between disseminating data and information, compared to the interpreted knowledge relied upon to make risk management decisions. A government data hub may also disseminate information without taking on the responsibilities of a Qualified Professional. BGC has proposed to establish a working group with EGBC to address this topic and we suggest CSRD obtain advice from a law firm with related subject-matter expertise. BGC is happy to discuss further on request.
As part of BC’s currently ongoing updates to the Emergency Management Act, BGC suggests strengthening the role of the Province in funding and coordinating geohazard risk management in BC. This would help clarify divisions of responsibility and could establish a more consistent level of service across local and First Nations governments, particularly for rural areas. While decisions about the role of the Province are not controlled by local government, the Thompson advisory committee convened by Fraser Basin Council is proving to be an effective example of defining
Columbia Shuswap Regional District April 16, 2020 Geohazard Risk Prioritization - FINAL Project No.: 1899001
BGC ENGINEERING INC. Page 71
and advance priorities in the Thompson River Watershed. BGC suggests that a similar advisory committee be struck for jurisdictions in the Canadian portion of the Columbia River Watershed.

Columbia Shuswap Regional District April 16, 2020 Geohazard Risk Prioritization - FINAL Project No.: 1899001
BGC ENGINEERING INC. Page 72
8. CLOSURE We trust the above satisfies your requirements at this time. Should you have any questions or comments, please do not hesitate to contact us.
Yours sincerely,
BGC ENGINEERING INC. per:
Philip LeSueur, M.Sc., P.Geo. Elisa Scordo, M.Sc., P.Geo. Engineering Geologist Senior Hydrologist
Midori Telles-Langdon, B.A.Sc., P.Geo., P.Eng. Sarah Kimball, M.A.Sc., P.Eng., P.Geo. Geological Engineer Senior Geological Engineer
Reviewed by:
Hamish Weatherly, M.Sc., P.Geo. Kris Holm, M.Sc., P.Geo. Principal Hydrologist Principal Geoscientist
SK/HW/mjp/syt
Final Stamp and Signature Version to replace this page once COVID-19 restrictions are lifted.

Columbia Shuswap Regional District April 16, 2020 Geohazard Risk Prioritization - FINAL Project No.: 1899001
BGC ENGINEERING INC. Page 73
REFERENCES Abbott, G. & Chapman, M. (2018, April 30). Addressing the New Normal: 21st Century Disaster
Management in British Columbia [Report]. Prepared for Premier John Horgan.
Auditor General of British Columbia. (2018). Managing Climate Change Risks: An Independent Audit. Report of the Auditor General of British Columbia dated November 28, 2017, published February 2018. 117 pp.
Canadian Standards Association (CSA). (1997). CAN/CSA – Q859-97 Risk Management: Guideline for Decision Makers. CSA Group, Toronto, ON, pp. 55.
Church, M. and Ryder, J.M. (2010). Physiography of British Columbia. Chapter 2, p. 17-45. Available at: https://www.for.gov.bc.ca/hfd/pubs/Docs/Lmh/Lmh66/Lmh66_ch02.pdf.
Clague, J. and Ward, B. (2011). Pleistocene Glaciation of British Columbia. Developments in Quaternary Science. 15:563-573.
Columbia Shuswap Regional District (CSRD). 2019. Flood Plain Setbacks and Exemptions, P-19. Available at: https://www.csrd.bc.ca/sites/default/files/policies/P-19%20Floodplain%20 Exemption%20Policy_0.pdf
Cui, Y., Miller, D., Schiarizza, P., & Diakow, L.J. (2017). British Columbia digital geology. British Columbia Ministry of Energy, Mines and Petroleum Resources, British Columbia Geological Survey Open File 2017-8, 9p. Data version 2019-12-19.
Dalrymple, T. (1960). Flood frequency analyses. US Geological Survey Water Supply Paper 1543-A.
Demarchi, D.A. (2011). Ecoregions of British Columbia, Third Edition.
Eaton B. & Moore, R.D. (2010). Chapter 4 – Regional Hydrology. In R.G. Pike, T.E. Redding, R.D. Moore, R.D. Winkler, and K.D. Bladon (Eds.), Compendium of Forest Hydrology and Geomorphology in British Columbia. B.C. Ministry of Forests and Range Research Branch, Victoria, B.C. and FORREX Forest Research Extension Partnership, Kamloops, B.C. Land Management Handbook (TBD). URL: http://www.forrex.org/program/water/compendium.asp.
Emergency Management BC (EMBC). (2019). Discussion Paper: Modernizing BC’s Emergency Management Legislation. Web link: https://www2.gov.bc.ca/assets/gov/public-safety-and-emergency-services/emergency-preparedness-response-recovery/modernizing_bcs_emergencymanagement_legislation.pdf.
Engineers and Geoscientists of BC (EGBC). (2017). Guidelines for Flood Mapping in BC. Web link: https://www.egbc.ca/getmedia/8748e1cf-3a80-458d-8f73-94d6460f310f/APEGBC-Guidelines-for-Flood-Mapping-in-BC.pdf.aspx.
Engineers and Geoscientists of BC (EGBC). (2018). Guidelines for Legislated Flood Assessments in a Changing Climate in BC. Version 2.1. August 28.Web link: https://www.egbc.ca/getmedia/f5c2d7e9-26ad-4cb3-b528-940b3aaa9069/Legislated-Flood-Assessments-in-BC.pdf.aspx.

Columbia Shuswap Regional District April 16, 2020 Geohazard Risk Prioritization - FINAL Project No.: 1899001
BGC ENGINEERING INC. Page 74
Engineers and Geoscientists of BC (EGBC). (2019). Overview of Climate Change, Tools and Resources for Adaption. Web link: https://www.egbc.ca/getmedia/9c627049-9af9-4125-82cc-b67795571a27/Appendix-C-Overview-of-Climate-Change-Tools-Resources-for-Adaptation-20191203.pdf.aspx
Farjad, B., Gupta, A., & Marceau, D.J. (2016). Annual and seasonal variations of hydrological processes under climate change scenarios in two sub-catchments of a complex watershed. Water Resources Management, 30(8), 2851-2865. https://doi.org/10.1007/s11269-016-1329-3.
Farr, T. G., Rosen, P. A., Caro, E., Crippen, R., Duren, R., Hensley, S., . Alsdorf, D. (2007). The Shuttle Radar Topography Mission. Reviews of Geophysics, 45(2). https://doi.org/10.1029/2005RG000183.
Fulton, R.J. (1965). Silt deposition in late-glacial lakes of Southern British Columbia. American Journal of Science, 263, 553-570.
Gabrielse, H. & Yorath, C.J. (1991). Geology of the Cordilleran Orogen in Canada. Geological Survey of Canada, Geology of Canada Series no. 4, 844 p.
GEO (Geotechnical Engineering Office, Hong Kong Government). (1998). Landslides and Boulder Falls from Natural Terrain: Interim Risk Guidelines. Government of the Hong Kong Special Administrative Region, Geotechnical Engineering Office, GEO Report No.75.
Government of British Columbia (BC). (2016). British Columbia Emergency Management System (BCEMS) document. Available online at:: https://www2.gov.bc.ca/assets/gov/public-safety-and-emergency-services/emergency-preparedness-response-recovery/embc/bcems/bcems_guide_2016_final_fillable.pdf [accessed; 09/14/2018].
Government of Canada. (2016). Canadian Digital Elevation Model (CDEM) Product Specifications. Available online at http://ftp.geogratis.gc.ca, accessed December 2018.
Harder, P., Pomeroy, J.W., and Westbrook, C.J. (2015). Hydrological resilience of a Canadian Rockies headwaters basin subject to changing climate, extreme weather, and forest management. Hydrological Processes, 29, 3905-3924. https://doi.org/10.1002/hyp.10596.
Holland, S. R. (1976). Landforms of British Columbia: a physiographic outline. A.Sutton, Printer to the Queen. Bulletin (British Columbia Department of Mines and Petroleum Resource); no. 48.
Holm, K., Jakob, M. and Scordo, S. (2016). An inventory and risk-based prioritization of steep creek fans in Alberta. 3rd European Conference on Flood Risk Management: Innovation, Implementation, Integration. 18-20 October 2016, Lyon France.
Horton, P., Jaboyedoff, M., Rudaz, B., & Zimmermann, M. (2013). Flow-R, a model for susceptibility mapping of debris flows and other gravitational hazards at regional scale. Natural Hazards Earth System Sciences, 13, 869-885.
International Organization for Standardization (ISO). (2009). ISO 31000:2009.
Columbia Shuswap Regional District April 16, 2020 Geohazard Risk Prioritization - FINAL Project No.: 1899001
BGC ENGINEERING INC. Page 75
Jakob, M., Clague, J., & Church M. (2016). Rare and dangerous: recognizing extra-ordinary events in stream channels. Canadian Water Resources Journal, 41(1-2), 161-173. https://doi.org/10.1080/07011784.2015.1028451.
Loukas, A. & Quick, M.C. (1999). The effect of climate change on floods in British Columbia. Nordic Hydrology, 30(3), 231-256. https://doi.org/10.2166/nh.1999.0013.
Massey, N.W.D., MacIntyre, D.G., Desjardins, P.J., & Cooney, R.T. (2005). British Columbia Digital Geology (Open File 2005-2) [Map]. British Columbia Geological Society.
Matrix Solutions Inc. (Matrix). (2018). Kicking Horse River Climate Change Adaption Ice Jamming and Gravel Deposition, Town of Golden, British Columbia [Report]. Prepared for Town of Golden.
Melton, M.A. (1957). An analysis of the relation among elements of climate, surface properties and geomorphology. Office of Nav Res Dept Geol Columbia Univ, NY. Tech Rep 11.
Ministry of Forests and Range (MFR). (2010). Compendium of Forest Hydrology and Geomorphology in British Columbia; Volume 1 of 2. Land Management Handbook 66.
Ministry of Forests, Lands and Natural Resource Operations (MFLNRO), Water Management Branch. (2016). Floodplain Maps. Available online at: www.env.gov.bc.ca/wsd/public_safety/flood/fhm-2012/landuse_floodplain_maps.html [accessed: 07/10/2018].
Ministry of Forests, Lands and Natural Resource Operations (MFLNRO), Water Management Branch. (2017). BC Dams. Available online at: www.env.gov.bc.ca/wsd/public_safety/flood/fhm-2012/landuse_floodplain_maps.html [accessed: 07/10/2018].
Mitchell TD & Jones PD. (2005). An improved method of constructing a database of monthly climate observations and associated high-resolution grids. International Journal of Climatology, 25(6), 693–712. https://doi.org/10.1002/joc.1181PMID: WOS:000229688800001.
Montgomery, C.W. (1990). Physical Geology, 2nd edition. WCB Publishers, Dubuque, IA, USA.
National Disaster Mitigation Program (NDMP). (2018). Program Overview. Website accessed July 2018: https://www.publicsafety.gc.ca/cnt/mrgnc-mngmnt/dsstr-prvntn-mtgtn/ndmp/index-en.aspx.
National Research Council (NRC). (2012). Disaster Resilience: A National Imperative. Washington, DC: The National Academies Press. https://doi.org/10.17226/1345.
Porter, M., Jakob, M., & Holm, K. (2009). Proposed Landslide Risk Tolerance Criteria. Proceedings of the 2009 Canadian Geotechnical Conference, Halifax, Canada. September 20-24, 2009.
Public Safety Canada, n.d. Canadian Disaster Database. https://www.publicsafety.gc.ca/cnt/rsrcs/cndn-dsstr-dtbs/index-en.aspx.
Columbia Shuswap Regional District April 16, 2020 Geohazard Risk Prioritization - FINAL Project No.: 1899001
BGC ENGINEERING INC. Page 76
Ryder, J.M., Fulton, R.J., & Clague, J.J. (1991). The Cordilleran ice sheet and glacial geomorphology of southern and central British Columbia. Géographie physique et Quaternarie, 45, 365-377.
Sawicki, O. & Smith, D.G. (1991). Glacial Lake Invermere, upper Columbia River valley, British Columbia: a paleogeographic reconstruction. Canadian Journal of Earth Sciences, 29, 687-692. https://doi.org/10.1139/e92-059.
Schnorbus, M., Bennett, K., Werner, A., & Berland, A. (2011). Hydrologic Impacts of Climate Change in the Peace, Campbell and Columbia Watersheds, British Columbia, Canada. Hydrologic Modelling Project Final Report (Part II). Victoria: Pacific Climate Impacts Consortium.
Schnorbus, M., Werner, A., & Bennett, K. (2014). Impacts of climate change in three hydrologic regimes in British Columbia, Canada. Hydrological Processes, 28, 1170-1189. https://doi.org/10.1002/hyp.9661.
Septer, D. (2007). Flooding and Landslide Events Southern British Columbia 1808-2006. Ministry of Environment, Province of British Columbia.
Statistics Canada. (2016). Census Profile, 2016 Census. Catalogue No. 98-316-X2016001.
Taylor, K.E., R.J. Stouffer, G.A. Meehl, An overview of CMIP5 and the experiment design, Bull. Amer. Meteor. Soc., 93, 485-498, DOI:10.1175/BAMS-D-11-00094.1, 2012.
Terra Remote Sensing. (2020). Thompson River Watershed lidar acquisition and processing. Data product prepared for Fraser Basin Council dated March 31, 2020.
Union of BC Municipalities. (2019). 2019 Resolutions. Vancouver, BC. Retrieved from: https://www.ubcm.ca/assets/Resolutions~and~Policy/Resolutions/2019%20UBCM%20Resolutions%20Book.pdf.
United Nations. (2016). Working Text on Indicators. Information from negotiations during the Second Session of the Open-ended Inter-governmental Expert Working Group on Indicators and Terminology relating to Disaster Risk Reduction, held in Geneva, Switzerland from 10-11 February 2016. Issued on March 3, 2016, and revised March 24, 2016.
United Nations Office for Disaster Risk Reduction (UNISDR). (2015). Sendai Framework for Disaster Risk Reduction – UNISRD. Website accessed November 2018: https://www.unisdr.org/we/coordinate/sendai-framework.
UNSD (1997). Glossary of Environment Statistics. Web link: https://unstats.un.org/unsd/environmentgl/
Wang, T., Hamann, A., Spittlehouse, D., & Carroll, C. (2016). Locally Downscaled and Spatially Customizable Climate Data for Historical and Future Periods for North America. PLoS ONE 11(6): e0156720. https:/doi.org/10.1371/journal.pone.0156720.
Columbia Shuswap Regional District April 16, 2020 Geohazard Risk Prioritization - FINAL Project No.: 1899001
BGC ENGINEERING INC. Page 77
Wilford D.J. Sakals M.E., Innes J.L., Sidle R.C. & Bergerud W.A. (2004). Recognition of debris flow, debris flood and flood hazard through watershed morphometrics. Landslides, 1, 61-66. https://doi.org/10.1007/s10346-003-0002-0.

Columbia Shuswap Regional District April 16, 2020 Geohazard Risk Prioritization - FINAL Project No.: 1899001
BGC ENGINEERING INC.
APPENDIX A DATA COMPILATION

Columbia Shuswap Regional DistrictGeohazard Risk Prioritization - FINAL APPENDIX A - DATA COMPILATION April 16, 2020
Project No. 1899001
Reference
Name River Basin District NTS ID Project Title Report (Y/N) Spatial information? Flooding? Landslide? Steep
Creek? Citation
Clanwilliam Landslide South Thompson CSRD 082L The 1999 Clanwilliam Landslide: A preliminary Analysis of Potential Failure Mechanisms
Y N Y Brideau, M-A., Stead, D., Couture, R. 2008, The 1999 Clanwilliam Landslide: A preliminary Analysis of Potential Failure Mechanisms In J. Locat, D., Perret, D., Turmel, D. Demers, et S. Leroueil, (2008). Comptes rendus de la 4e Conférence canadienne sur les géorisques: des causes à la gestion. Proceedings of the 4th Canadian Conference on Geohazards : From Causes to Management.Presse de l’Université Laval, Québec, 594 p
Sugar Lake South Thompson CSRD 082L Sugar Lake, Vernon Forest District, British Columbia. Y Y - See Terrain Mapping Y Y EBA Engineering Inc., 1998. Detailed Terrain Stability Mapping, Sugar Lake, Vernon Forest District, British Columbia. File 0806-97-87495
Sugar Lake/Gates Creek South Thompson CSRD 082L Sugar Lake and Gates Creek Areas, British Columbia. Y Y - See Terrain Mapping Y Y EBA Engineering Inc., 1999. Detailed and Reconnaissance Terrain Mapping with Interpretation of Terrain Stability, Erosion Potential and Potential Fine Sediment Transfer, Sugar Lake and Gates Creek Areas, British Columbia. Project No. 0801-98-87752.
Creighton Creek/Ferry Creek South Thompson CSRD 082L Upper Creighton Creek and Ferry Creek Y N Y EBA Engineering Inc., 1999. Interim Interior Watershed Assessment Procedure Upper Creighton Creek and Ferry Creek
Creighton Creek/Bonneau Creek/Ferry Creek
South Thompson CSRD 082L Upper Creighton Creek, Bonneau Creek, Ferry Creek Y N Y EBA Engineering Inc., 1999. Reconnaissance Channel Assessment Procedure (ReCAP) As Part of the Interior Watershed Assessment Procedure for Upper Creighton Creek, Bonneau Creek, Ferry Creek.
Squilax Creek/ Broderick Creek/ Reinecker Creek
South Thompson CSRD 082L Squilax, Broderick Creek, Reinecker Creek, TFL 33. Y Y - See Terrain Mapping Y Y EBA Engineering Inc., 2001. Salmon Arm Forest District Federated Co-operatives Limited Detailed Terrain Stability Mapping Squilax, Broderick Creek, Reinecker Creek, TFL 33. EBA Project No. 0801-00-81153
Reiter Creek/Holstein Creek South Thompson CSRD 082L Reiter and Holstein Creeks Bobbie Burns Mountain Y Y - See Terrain Mapping Y Y EBA Engineering Inc., 2002 Detailed Terrain Stability Mapping Reiter and Holstein Creeks Bobbie Burns Mountain
Shuswap Lake and Mara Lake South Thompson CSRD 082L Shuswap Watershed Mapping Project Y N Y Ecoscape Environmental Consultants Ltd., 2009. Shuswap Watershed Mapping Project - Foreshore Inventory and Mapping
Hummingbird Creek South Thompson CSRD 082L Forest Practices and the Hummingbird Creek Debris Flow Y N Y Forest Practices Board, 2001. Forest Practices and the Hummingbird Creek Debris FlowSalmon River South Thompson CSRD 082L The stability of stream channels within the Salmon River Watershed Y N Y Forsite Forest Management Consultants, 1998. The stability of stream channels within the Salmon
River Watershed Hunters Range/Eagle River South Thompson CSRD 082L N/A Y N Y Jakob, M., and Jordan, P. 2001. Design flood estimates in mountain streams — the need for a
geomorphic approach. Canadian Journal of Civil Engineering 28: 425-439.Salmon River South Thompson CSRD 082L Floodplain Mapping Program Salmon River Spa Creek to Falkland Y Y - See Floodplain
MappingY KPA Engineering Ltd., 1991. Floodplain Mapping Program Salmon River Spa Creek to Falkland.
Salmon River South Thompson CSRD 082L Salmon River Channel Stability Analysis Y N Y M. Miles and Associates, 1995. Salmon River Channel Stability AnalysisHummingbird Creek/Mara Creek South Thompson CSRD 082L Hummingbird Creek and Mara Creek Watersheds Y Y - See Terrain Mapping Y Y Terratech Consulting Ltd., 1999. Detailed Terrain Stability Mapping (TSIL C) Hummingbird Creek
and Mara Creek WatershedsHunters Range South Thompson CSRD 082L Hunters Range (Kingfisher) Y Y - See Terrain Mapping Y Y Terratech Consulting Ltd., 2001. Detailed Terrain Stability Mapping (TSIL C) Hunters Range
(Kingfisher). File 425-13Eagle River Valley South Thompson CSRD 082L Debris torrent hazards along Highway 1 Sicamous to Revelstoke Y N Y Thurber Consultants Ltd. 1987. Debris torrent hazards along Highway 1 Sicamous to Revelstoke.
File 15-3-51.Bastion Mountain Area South Thompson CSRD 082L Overview Landslide Assessment Y Y Y Y Westrek Geotechnical Services Ltd., 2019. Bastion Mountain Area, Overview Landslide
Assessment. Sunnybrae, BC. Prepared fro Kerr Wood Leidal Associates Ltd.Eagle River Sicamous CSRD 082L Eagle River from Sicamous to Malakwa N Y y N N BC Flood Mapping Program. 1979.
http://www.env.gov.bc.ca/wsd/data_searches/fpm/reports/keyplans-html/eagle-river.htmlSalmon River Salmon Arm CSRD 082L Salmon River Spa Creek to Falkland N Y Y N N BC Flood Mapping Program. 1992.
http://www.env.gov.bc.ca/wsd/data_searches/fpm/reports/keyplans-html/salmon-r-spa-cr-to-falkland7-10.html
Salmon River South Thompson CSRD 082L Salmon River Tributaries Terrain Stablity Report. Y Y - See Terrain Mapping Y Y Quaterra Environmental Consulting Ltd. 1999. Trinity Operating Area Terrain Stability ReportAnstey River/Eagle River South Thompson CSRD 082L/082M Anstey and Eagle River Watersheds Y N Y Forsite Forest Management Consultants, 1998. Anstey and Eagle River Watersheds Level 1
Interior Watershed Assessment and ReportNikwikwaia Creek South Thompson CSRD 082L04 Terrain Stability and Hydrology of the Nikwikwaia Creek Watershed Y Y - See Terrain Mapping Y Y Y Dobson Engineering Ltd. N.D. Terrain Stability and Hydrology of the Nikwikwaia Creek Watershed
Salmon Arm South Thompson CSRD 082L064 Geotechnical & Environmental Assessment Modified Area B Comprehensive Development Plan Salmon Arm, British Columbia.
Y N Y Golder Associates Ltd. (1998). Geotechnical & Environmental Assessment Modified Area B Comprehensive Development Plan Salmon Arm, British Columbia [Report]. Prepared for T.R. Underwood Engineering Ltd.
Sorrento South Thompson CSRD 082L083 Y N Y Onsite Engineering Ltd. (2018, August 14). Flood Hazard Assessment for the Development at 1374 Gillespie Rd, Sorrento, BC. Legal address: Lot 2, Section 15, Township 22, Range 11, W6M, KDYD, Plan 24433.
Salmon River South Thompson CSRD 082L11 Floodplain Mapping Program, Salmon River Shuswap Lake to Spa Creek Design Brief
Y Y - See Floodplain Mapping
Y Crippen Consultants. 1990. Floodplain Mapping Program, Salmon River Shuswap Lake to Spa Creek Design Brief
Silver Creek South Thompson CSRD 082L11 Silver Creek Detailed Terrain Mapping Y Y - See Terrain Mapping Y Y EBA Engineering Consultants Ltd., 1999. Detailed terrain mapping with interpretations for terrain stability, surface erosion potential, landslide induced stream sedimentation, and sediment delivery potential. Salmon Arm Forest District.
Cedar Hills South Thompson CSRD 082L11 Post-wildfire landslides in Southern British Columbia Y N Y Jordan, P., 2012. Post-wildfire landslides in Southern British Columbia. In 11th Internation & 2nd North American Symposium on Landslides, Banff, Alberta, Canada, June 3-8, 2012.
Cedar Hills South Thompson CSRD 082L11 Debris flows and floods following the 2003 wildfires in Southern British Columbia.
Y N Y Jordan, P., and Covert, S.A., 2009. Debris flows and floods following the 2003 wildfires in Southern British Columbia. Environmental & Engineering Geoscience 15 (4): 217-234.
Cedar Hills South Thompson CSRD 082L11 Developing a risk analysis procedure for post-wildfire mass movement and flooding in British Columbia.
Y N Y Jordan, P., Turner, K., Nicol, D., Boyer, D. 2006. Developing a risk analysis procedure for post-wildfire mass movement and flooding in British Columbia. 1st Specialty Conference on Disaster Mitigation. Calgary, Alberta, Canada. May 23-26, 2006.
Silver Creek South Thompson CSRD 082L11 The Silver Creek Fire Watershed Hazards Assessment Y N Y Winkler, R., Giles, T., Turner, K., Hope, G., Bird, S., Schwab, K., Hogan, D., and Anderson, D., 1998. The Silver Creek Fire Watershed Hazards Assessment.
Chase Creek South Thompson CSRD 082L12 Chase Creek Hydrologic Assessment Y N Y Dobson Engineering Inc. 2004. Chase Creek Hydrologic Assessment Impact of Mountain Pine Beetle Infestations on Peak Flows
Charcoal Creek South Thompson CSRD 082L12 Charcoal Creek Detailed Terrain Stability Mapping Y Y - See Terrain Mapping Y Y EBA Engineering Consultants Ltd., 2000. Charcoal Creek Detailed Terrain Stability Mapping (TSIL C). EBA Project No. 0801-99-81086
Chase Creek South Thompson CSRD 082L12 Investigations of 22 landslides in Upper Chase Creek, B.C. Y N Y Y Grainger, B., 2002. Investigations of 22 landslides in Upper Chase Creek, B.C.Corning Creek South Thompson CSRD 082L13 Interior Watershed Assessment for the Corning Creek Watershed Y N Y Y Silvatech Consulting Ltd. 2000. Interior Watershed Assessment for the Corning Creek Watershed.
Hummingbird Creek South Thompson CSRD 082L14 Stream restoration and restoration alternatives at Hummingbird Creek, Mara Lake, B.C.
Y N Y EBA Engineering Consultants Ltd. & Kerr Wood Leidal Associates Ltd. (1998). Stream restoration and restoration alternatives at Hummingbird Creek, Mara Lake, B.C. [Report]. Prepared for Ministry of Environment, Lands, and Parks.
Hummingbird Creek South Thompson CSRD 082L14 Sediment Coring at Swansea Point Fan Delta, Mara Lake, British Columbia
Y N Y Fuller, T., 2002. Sediment Coring at Swansea Point Fan Delta, Mara Lake, British Columbia—Application of a Coring Method to Determine Historical Debris Flow Events. In Terrain Stability and Forest Management in the Interior of British Columbia: Workshop Proceedings: May 23-25, 2001 Nelson, British Columbia, Canada.
Location Hazard TypeProject
BGC ENGINEERING INC. A-1

Columbia Shuswap Regional DistrictGeohazard Risk Prioritization - FINAL APPENDIX A - DATA COMPILATION April 16, 2020
Project No. 1899001
Reference
Name River Basin District NTS ID Project Title Report (Y/N) Spatial information? Flooding? Landslide? Steep
Creek? Citation
Location Hazard TypeProject
Onyx Creek South Thompson CSRD 082L14 Onyx Creek Watershed Salmon Arm, B.C. Y N Y Golder Associates Ltd. 1996. Level 1 - Interior Watershed Assessment Onyx Creek Watershed Salmon Arm, B.C.
Hummingbird Creek South Thompson CSRD 082L14 An unusually large debris flow at Hummingbird Creek, Mara Lake, British Columbia
Y N Y Jakob, M., Anderson, D., Fuller, T., Hungr, O., and Ayotte, D. 2000. An unusually large debris flow at Hummingbird Creek, Mara Lake, British Columbia. Canadian Geotechnical Journal 37: 1109-1125.
Ross Creek South Thompson CSRD 082L14 Channel and Debris Flow Risk Assesment of Ross Creek Y N Y Y M.J. Milne & Associates Ltd., and Grainger and Associates Consulting Ltd., 2002. Channel and debris flow risk assessment of Ross Creek.
Hummingbird Creek South Thompson CSRD 082L14 Hummingbird Creek Debris Event July 11, 1997. Y N Y Ministry of Environent, Lands and Parks, Ministry of Forests, Ministry of Transportation and Highways, Ministry of Attorney General (Interagency Report). (1997). Hummingbird Creek Debris Event July 11, 1997 [Report].
Hummingbird Creek South Thompson CSRD 082L14 Community of Swansea Point, Sicamous, British Columbia. Y N Y Singh, N., 2004. Quantitative Analysis of Partial Risk from Debris Flows and Debris Floods: Community of Swansea Point, Sicamous, British Columbia. In Landslide Management Handbook 56. Landslide Risk Case Studies in Forest Development Planning and Operations.
McIntyre Creek South Thompson CSRD 082L14 2014 McIntyre Creek Debris Flow Y N Y Westrek Geotechnical Services Ltd., 2015. 2014 McIntyre Creek Debris Flow Emergency Response and Investigation Findings. File 014-024.
Robinson Creek South Thompson CSRD 082L14 2017 Robinson Creek Debris Flow Y N Y Westrek Geotechnical Services Ltd., 2017. Summary of Emergency Response Activities and Intitial Geotechnical Assessment of the 2017 Robinson Creek Debris Flow. File 017-053.
Camp Creek South Thompson CSRD 082L15 Camp Creek Slide Y N Y Department of Highways, 1968. Camp Creek Slide. Report M2-486. 3 pages.Sicamous Creek South Thompson CSRD 082L15 Interior Watershed Assessment for the Sicamous Creek Watershed Y N Y Dobson Engineering Ltd., 1998. Interior Watershed Assesment for the Sicamous Creek
Watershed. Sicamous Creek South Thompson CSRD 082L15 Detailed terrain mapping of the Sicamous Creek Community Watershed Y Y - See Terrain Mapping Y Terratech Consulting Ltd. 1998, Detailed terrain mapping (TSIL C) of the Sicamous Creek
Community Watershed. File 425-8Celista Creek/Sim Creek/Pickett/Syphon/Palmer Creek
South Thompson CSRD 082M Celista Creek-Humamilt Lake, Sim Creek, and Pickett-Syphon-Palmer Creek Watersheds
Y Y - See Terrain Mapping Y Y EBA Engineering Inc. 1997, Reconnaissance Terrain Stability Mapping (TSIL D) for the Celista Creek-Humamilt Lake, Sim Creek, and Pickett-Syphon-Palmer Creek Watersheds
Seymour Arm South Thompson CSRD 082M Soil and Terrain of the Seymour Arm Area Y N Y Kowall, R.C., 1980. Soil and Terrain of the Seymour Arm Area (N.T.S. Map 82M)Eagle-Perry Area South Thompson CSRD 082M Detailed Terrain Stabiltiy Report Eagle-Perry Area Y N Y Y R.T. Banting Engineering Ltd., 2001. Detailed Terrain Stabiltiy Report TSIL "C" Eagle-Perry Area.
Surficial Geology, Columbia River Valley
Columbia CSRD 082M Surficial Geology, Columbia River Valley - Revelstoke to Mica Creek. N N Fulton, Robert J., & Brown, A. S. 1983. Surficial geology, Columbia River Valley - Revelstoke to Mica Creek. In Proceedings of the Joint Annual Meeting of the Geological Association of Canada and Mineralogical Association of Canada.
Blueberry Creek/Skimikin Lake South Thompson CSRD 082M/082L Blueberry Creek and Skimikin Lake Terrain Stability Mapping Y Y - See Terrain Mapping Y Y EBA Engineering Inc., 2000. Salmon Arm Forest District Federated Co-operatives Limited Operating Area (Blueberry Creek and Skimikin Lake) Terrain Stability Mapping
Scotch Creek South Thompson CSRD 082M03 Channel Assessment Procedure for Scotch Creek Y N Y Dobson Engineering Inc., 1997. Channel Assessment Procedure for Scotch Creek. Scotch Creek South Thompson CSRD 082M03 Results of the Interior Watershed Assessment Procedure for the
Scotch Creek WatershedY N Y Dobson Engineering Ltd., 1999. Results of the Interior Watershed Assessment Procedure for the
Scotch Creek WatershedScotch Creek/Kwikoit Creek/Corning Creek
South Thompson CSRD 082M03 Scotch Creek, Kwikoit Creek, Corning Creek Y Y - See Terrain Mapping Y Y EBA Engineering Inc., 1999. Detailed and Reconnaissance Terrain Mapping with Interpretation of Terrain Stability, Erosion Potential and Sediment Transfer Potential
Celista Creek South Thompson CSRD 082M06 Celista Creek (Humamilt Lake) Y N Y Forsite Forest Management Consultants, 1998. Celista Creek (Humamilt Lake) Watershed Channel Assessment Procedure (CAP)
Columbia River Revelstoke CSRD 082N Columbia River at Revelstoke N Y Y BC Flood Mapping Program. 1983. http://www.env.gov.bc.ca/wsd/data_searches/fpm/reports/keyplans-html/columbia-r-at-revelstoke.html
Steep Creek Hazards in Rogers Pass
Columbia CSRD 082N The Geomorphic Effects of the July 1983 Rainstorms in the Southern Corillera and their Impact on Transportation Factilities.
N N Y Y Evans, S.G. and Lister, D.R. The Geomorphic Effects of the July 1983 Rainstorms in the Southern Cordillera and their Impact on Transportation Facilities; in Current Research, Part B, Geological Survey of Canada, Paper 84-1B, p. 223-235, 1984.
Rogers Pass Columbia CSRD 082N04/05 Rogers Pass geotechnical evaluation of alternate routes. Y N Y Y EBA Engineering Consultants Ltd. 1976. CPR - Rogers Pass geotechnical evaluation of alternate routes. Report to CP Rail, File No. 1-1481.
East Gate Landslide Columbia CSRD 082N06 Structural and engineering geology of the East Gate Landslide, Purcell Mountains, British Columbia, Canada
N N Y Y Brideau, M-A., Stead, D., Couture, R. 2006. Structural and engineering geology of the East Gate Landslide, Purcell Mountains, British Columbia, Canada. Engineering Geology, 84 (2006), 183-206
East Gate Landslide Columbia CSRD 082N06 The East Gate Landslide, Beaver Valley, Glacier National Park, Columbia Mountains, British Columbia
Y N Y Y Couture, R. and Evans, S. 2000. The East Gate Landslide, Beaver Valley, Glacier National Park, Columbia Mountains, British Columbia. Geological Survey of Canada, Open File # 3877.
Rogers Pass Columbia CSRD 082N06 Deep-seated slope movements in the Beaver River Valley N Y Pritchard, M.A., Savigny, K.W., and Evans, S.G. 1988. Deep-seated slope movements in the Beaver River Valley, Glacier National Park, B.C. Geological Survey of Canada, Open File 2011.
Heather Hill Columbia CSRD 082N06 The Heather Hill landslide: an example of a large scale toplling failure in a natural slope
N Y Pritchard. M.A., and Savigny, K.W., 1991. The Heather Hill landslide: an example of a large scale toplling failure in a natural slope. Can. Geotech. J. 28, 410-422 (1991).
Cathedral Mountain Columbia CSRD 082N08 A catastrophic glacial outburst flood mechanism for debris flow generation at the Spiral Tunnels, Kicking Horse River basin, British Columbia.
N N Y Jackson, E. 1979. A catastrophic glacial outburst flood mechanism for debris flow generation at the Spiral Tunnels, Kicking Horse River basin, British Columbia. Can. Geotech. J. Vol. 16, 806-813 (1979).
Cathedral Mountain Columbia CSRD 082N08 Cathedral Mountain debris flows, Canada N N Y Jackson, L.E. Hungr, O., Garnder, J.S. and Mackay, C. 1989. Cathedral Mountain debris flows, Canada. Bulletin of the International Association of Engineering Geology, No. 40, 35-54.
Cathedral Mountain Columbia CSRD 082N08 Historical Review of Debris Flow Events & Related Research - Laggan 128.00 at Cathedral Gulch.
Y N Y Y SNC Lavalin Inc. 2014. Historical Review of Debris Flow Events & Related Research - Laggan 128.00 at Cathedral Gulch. Memorandum prepared for Canadian Pacific Railway, 29 p.
Cathedral Mountain Columbia CSRD 082N08 Analysis of the July 10, 2014 Cathedral Mountain Icefall-Debris Flow. N N Y Arenson, L. Bunce, C., and Gauthier et al. 2015. Analysis of the July 10, 2014 Cathedral Mountain Icefall-Debris Flow. GeoQuebec, 68th Canadaian Geotechnical Conference, Quebec, QC, Sept.
Stephen Creek Columbia CSRD 082N08 Summary of Stephen Creek Debris Flow Hazard and Risk Assessment Y N Y Y Tetra Tech EBA 2014. Summary of Stephen Creek Debris Flow Hazard and Risk Assessment. Report prepared for Parks Canada, June 2014.
Canadian Rocky Mountains Multiple CSRD 082N08 Debris Flow Hazard in the Canadian Rocky Mountains N N Y Y Jackson, L.E. 1987. Debris Flow Hazard in the Canadian Rocky Mountains. Geological Survey of Canada, Paper 86-11.
Little Chief Slide Columbia CSRD 083D Movement behavior of the Little Chief Slide Y N Y Mansour, M.F., Martin, C.D., and Morgenstern, N.R., 2011. Movement behavior of the Little Chief Slide, Can. Geotech J., Vol., 48, pp.655-670.
South Central BC Landslides Many CSRD 092P, 092I, 0Landslides in the Kamloops Group in South-Central British Columbia, A Progress Report, Scientific and Technical Notes in Current Research
Y N Y Evans, S. and Cruden, D.M.. 1981, Landslides in the Kamloops Group in South-Central British Columbia, A Progress Report, Scientific and Technical Notes in Current Research, Part B; Geol. Surv. Can. Paper 81-1b.
South Central BC Landslides Many CSRD 092P, 092I, 0Landslides in layers of volcanic successions with particular reference to the Tertiary rocks of south central British Columbia
Y N Y Evans, S.G., 1983. Landslides in layers of volcanic successions with particular reference to the Tertiary rocks of south central British Columbia, University of Alberta Thesis, Department of Geology, Fall 1983
Camp Creek Thompson CSRD 82L/15 Camp Creek Debris Flow and Debris Flood Assessment Y Y Y BGC Engineering Inc. 2019. Camp Creek Debris Flow and Debris Flood Assessment. Prepared for B.C. Ministry of Transportation and Infrastructure. Dated March 22, 2019.
Columbia River Golden CSRD 82N/02 Columbia River at Golden N Y Y N N BC Flood Mapping Program. 1979. http://www.env.gov.bc.ca/wsd/data_searches/fpm/reports/keyplans-html/columbia-r-at-golden.html
BGC ENGINEERING INC. A-2
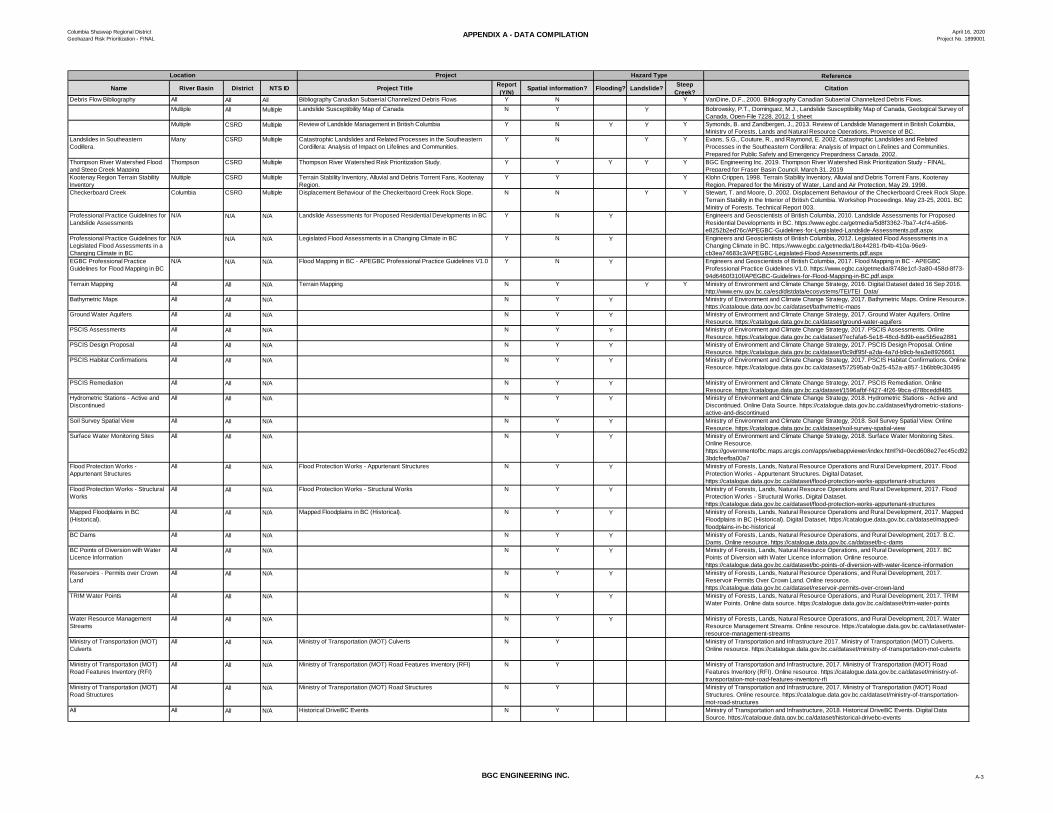
Columbia Shuswap Regional DistrictGeohazard Risk Prioritization - FINAL APPENDIX A - DATA COMPILATION April 16, 2020
Project No. 1899001
Reference
Name River Basin District NTS ID Project Title Report (Y/N) Spatial information? Flooding? Landslide? Steep
Creek? Citation
Location Hazard TypeProject
Debris Flow Bibliography All All All Bibliography Canadian Subaerial Channelized Debris Flows Y N Y VanDine, D.F., 2000. Bibliography Canadian Subaerial Channelized Debris Flows. Multiple All Multiple Landslide Susceptibility Map of Canada N Y Y Bobrowsky, P.T., Dominguez, M.J., Landslide Susceptibility Map of Canada, Geological Survey of
Canada, Open-File 7228, 2012, 1 sheetMultiple CSRD Multiple Review of Landslide Management in British Columbia Y N Y Y Y Symonds, B. and Zandbergen, J., 2013. Review of Landslide Management in British Columbia,
Ministry of Forests, Lands and Natural Resource Operations, Provence of BC.Landslides in Southeastern Codillera.
Many CSRD Multiple Catastrophic Landslides and Related Processes in the Southeastern Cordillera: Analysis of Impact on Lifelines and Communities.
Y N Y Y Evans, S.G., Couture, R., and Raymond, E. 2002. Catastrophic Landslides and Related Processes in the Southeastern Cordillera: Analysis of Impact on Lifelines and Communities. Prepared for Public Safety and Emergency Prepardness Canada. 2002.
Thompson River Watershed Flood and Steep Creek Mapping
Thompson CSRD Multiple Thompson River Watershed Risk Prioritization Study. Y Y Y Y Y BGC Engineering Inc. 2019. Thompson River Watershed Risk Prioritization Study - FINAL. Prepared for Fraser Basin Council. March 31, 2019
Kootenay Region Terrain Stability Inventory
Multiple CSRD Multiple Terrain Stability Inventory, Alluvial and Debris Torrent Fans, Kootenay Region.
Y Y Y Klohn Crippen, 1998. Terrain Stability Inventory, Alluvial and Debris Torrent Fans, Kootenay Region. Prepared for the Ministry of Water, Land and Air Protection, May 29. 1998.
Checkerboard Creek Columbia CSRD Multiple Displacement Behaviour of the Checkerbaord Creek Rock Slope. N N Y Y Stewart, T. and Moore, D. 2002. Displacement Behaviour of the Checkerboard Creek Rock Slope. Terrain Stability in the Interior of British Columbia. Workshop Proceedings. May 23-25, 2001. BC Minitry of Forests. Technical Report 003.
Professional Practice Guidelines for Landslide Assessments
N/A N/A N/A Landslide Assessments for Proposed Residential Developments in BC Y N Y Engineers and Geoscientists of British Columbia, 2010. Landslide Assessments for Proposed Residential Developments in BC. https://www.egbc.ca/getmedia/5d8f3362-7ba7-4cf4-a5b6-e8252b2ed76c/APEGBC-Guidelines-for-Legislated-Landslide-Assessments.pdf.aspx
Professional Practice Guidelines for Legislated Flood Assessments in a Changing Climate in BC
N/A N/A N/A Legislated Flood Assessments in a Changing Climate in BC Y N Y Engineers and Geoscientists of British Columbia, 2012. Legislated Flood Assessments in a Changing Climate in BC. https://www.egbc.ca/getmedia/18e44281-fb4b-410a-96e9-cb3ea74683c3/APEGBC-Legislated-Flood-Assessments.pdf.aspx
EGBC Professional Practice Guidelines for Flood Mapping in BC
N/A N/A N/A Flood Mapping in BC - APEGBC Professional Practice Guidelines V1.0 Y N Y Engineers and Geoscientists of British Columbia, 2017. Flood Mapping in BC - APEGBC Professional Practice Guidelines V1.0. https://www.egbc.ca/getmedia/8748e1cf-3a80-458d-8f73-94d6460f310f/APEGBC-Guidelines-for-Flood-Mapping-in-BC.pdf.aspx
Terrain Mapping All All N/A Terrain Mapping N Y Y Y Ministry of Environment and Climate Change Strategy, 2016. Digital Dataset dated 16 Sep 2016. http://www.env.gov.bc.ca/esd/distdata/ecosystems/TEI/TEI_Data/
Bathymetric Maps All All N/A N Y Y Ministry of Environment and Climate Change Strategy, 2017. Bathymetric Maps. Online Resource. https://catalogue.data.gov.bc.ca/dataset/bathymetric-maps
Ground Water Aquifers All All N/A N Y Y Ministry of Environment and Climate Change Strategy, 2017. Ground Water Aquifers. Online Resource. https://catalogue.data.gov.bc.ca/dataset/ground-water-aquifers
PSCIS Assessments All All N/A N Y Y Ministry of Environment and Climate Change Strategy, 2017. PSCIS Assessments. Online Resource. https://catalogue.data.gov.bc.ca/dataset/7ecfafa6-5e18-48cd-8d9b-eae5b5ea2881
PSCIS Design Proposal All All N/A N Y Y Ministry of Environment and Climate Change Strategy, 2017. PSCIS Design Proposal. Online Resource. https://catalogue.data.gov.bc.ca/dataset/0c9df95f-a2da-4a7d-b9cb-fea3e8926661
PSCIS Habitat Confirmations All All N/A N Y Y Ministry of Environment and Climate Change Strategy, 2017. PSCIS Habitat Confirmations. Online Resource. https://catalogue.data.gov.bc.ca/dataset/572595ab-0a25-452a-a857-1b6bb9c30495
PSCIS Remediation All All N/A N Y Y Ministry of Environment and Climate Change Strategy, 2017. PSCIS Remediation. Online Resource. https://catalogue.data.gov.bc.ca/dataset/1596afbf-f427-4f26-9bca-d78bceddf485
Hydrometric Stations - Active and Discontinued
All All N/A N Y Y Ministry of Environment and Climate Change Strategy, 2018. Hydrometric Stations - Active and Discontinued. Online Data Source. https://catalogue.data.gov.bc.ca/dataset/hydrometric-stations-active-and-discontinued
Soil Survey Spatial View All All N/A N Y Y Ministry of Environment and Climate Change Strategy, 2018. Soil Survey Spatial View. Online Resource. https://catalogue.data.gov.bc.ca/dataset/soil-survey-spatial-view
Surface Water Monitoring Sites All All N/A N Y Y Ministry of Environment and Climate Change Strategy, 2018. Surface Water Monitoring Sites. Online Resource. https://governmentofbc.maps.arcgis.com/apps/webappviewer/index.html?id=0ecd608e27ec45cd923bdcfeefba00a7
Flood Protection Works - Appurtenant Structures
All All N/A Flood Protection Works - Appurtenant Structures N Y Y Ministry of Forests, Lands, Natural Resource Operations and Rural Development, 2017. Flood Protection Works - Appurtenant Structures. Digital Dataset. https://catalogue.data.gov.bc.ca/dataset/flood-protection-works-appurtenant-structures
Flood Protection Works - Structural Works
All All N/A Flood Protection Works - Structural Works N Y Y Ministry of Forests, Lands, Natural Resource Operations and Rural Development, 2017. Flood Protection Works - Structural Works. Digital Dataset. https://catalogue.data.gov.bc.ca/dataset/flood-protection-works-appurtenant-structures
Mapped Floodplains in BC (Historical).
All All N/A Mapped Floodplains in BC (Historical). N Y Y Ministry of Forests, Lands, Natural Resource Operations and Rural Development, 2017. Mapped Floodplains in BC (Historical). Digital Dataset. https://catalogue.data.gov.bc.ca/dataset/mapped-floodplains-in-bc-historical
BC Dams All All N/A N Y Y Ministry of Forests, Lands, Natural Resource Operations, and Rural Development, 2017. B.C. Dams. Online resource. https://catalogue.data.gov.bc.ca/dataset/b-c-dams
BC Points of Diversion with Water Licence Information
All All N/A N Y Y Ministry of Forests, Lands, Natural Resource Operations, and Rural Development, 2017. BC Points of Diversion with Water Licence Information. Online resource. https://catalogue.data.gov.bc.ca/dataset/bc-points-of-diversion-with-water-licence-information
Reservoirs - Permits over Crown Land
All All N/A N Y Y Ministry of Forests, Lands, Natural Resource Operations, and Rural Development, 2017. Reservoir Permits Over Crown Land. Online resource. https://catalogue.data.gov.bc.ca/dataset/reservoir-permits-over-crown-land
TRIM Water Points All All N/A N Y Y Ministry of Forests, Lands, Natural Resource Operations, and Rural Development, 2017. TRIM Water Points. Online data source. https://catalogue.data.gov.bc.ca/dataset/trim-water-points
Water Resource Management Streams
All All N/A N Y Y Ministry of Forests, Lands, Natural Resource Operations, and Rural Development, 2017. Water Resource Management Streams. Online resource. https://catalogue.data.gov.bc.ca/dataset/water-resource-management-streams
Ministry of Transportation (MOT) Culverts
All All N/A Ministry of Transportation (MOT) Culverts N Y Ministry of Transportation and Infrastructure 2017. Ministry of Transportation (MOT) Culverts. Online resource. https://catalogue.data.gov.bc.ca/dataset/ministry-of-transportation-mot-culverts
Ministry of Transportation (MOT) Road Features Inventory (RFI)
All All N/A Ministry of Transportation (MOT) Road Features Inventory (RFI) N Y Ministry of Transportation and Infrastructure, 2017. Ministry of Transportation (MOT) Road Features Inventory (RFI). Online resource. https://catalogue.data.gov.bc.ca/dataset/ministry-of-transportation-mot-road-features-inventory-rfi
Ministry of Transportation (MOT) Road Structures
All All N/A Ministry of Transportation (MOT) Road Structures N Y Ministry of Transportation and Infrastructure, 2017. Ministry of Transportation (MOT) Road Structures. Online resource. https://catalogue.data.gov.bc.ca/dataset/ministry-of-transportation-mot-road-structures
All All All N/A Historical DriveBC Events N Y Ministry of Transportation and Infrastructure, 2018. Historical DriveBC Events. Digital Data Source. https://catalogue.data.gov.bc.ca/dataset/historical-drivebc-events
BGC ENGINEERING INC. A-3
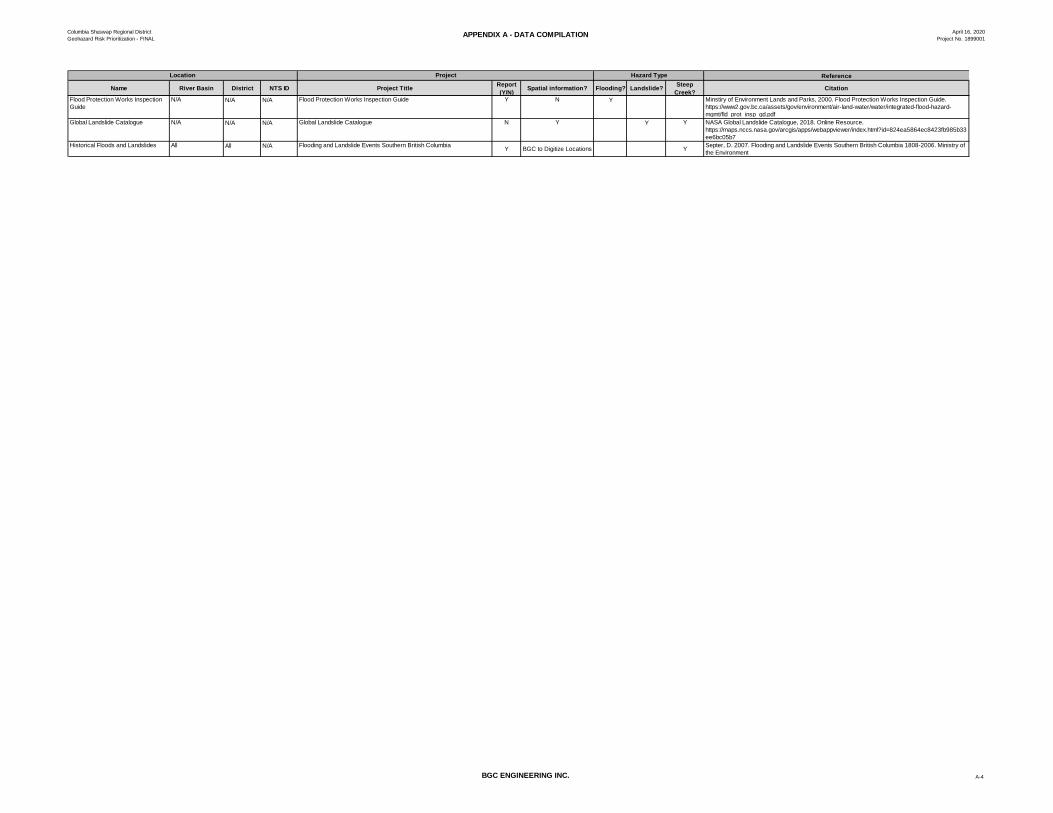
Columbia Shuswap Regional DistrictGeohazard Risk Prioritization - FINAL APPENDIX A - DATA COMPILATION April 16, 2020
Project No. 1899001
Reference
Name River Basin District NTS ID Project Title Report (Y/N) Spatial information? Flooding? Landslide? Steep
Creek? Citation
Location Hazard TypeProject
Flood Protection Works Inspection Guide
N/A N/A N/A Flood Protection Works Inspection Guide Y N Y Minstiry of Environment Lands and Parks, 2000. Flood Protection Works Inspection Guide. https://www2.gov.bc.ca/assets/gov/environment/air-land-water/water/integrated-flood-hazard-mgmt/fld_prot_insp_gd.pdf
Global Landslide Catalogue N/A N/A N/A Global Landslide Catalogue N Y Y Y NASA Global Landslide Catalogue, 2018. Online Resource. https://maps.nccs.nasa.gov/arcgis/apps/webappviewer/index.html?id=824ea5864ec8423fb985b33ee6bc05b7
Historical Floods and Landslides All All N/A Flooding and Landslide Events Southern British Columbia Y BGC to Digitize Locations Y Septer, D. 2007. Flooding and Landslide Events Southern British Columbia 1808-2006. Ministry of the Environment
BGC ENGINEERING INC. A-4
Columbia Shuswap Regional District April 16, 2020 Geohazard Risk Prioritization - FINAL Project No.: 1899001
BGC ENGINEERING INC.
APPENDIX B CAMBIO COMMUNITIES
Columbia-Shuswap Regional District April 16, 2020 Geohazard Risk Prioritization - FINAL Project No.: 1899001
Appendix B - Cambio Communities.docx B-1
BGC ENGINEERING INC.
B.1. INTRODUCTION
B.1.1. Purpose
Cambio is an ecosystem of web applications that support regional scale, geohazard risk-informed decision making by government and stakeholders. It is intended to support community planning, policy, and bylaw implementation, and provides a way to maintain an organized, accessible knowledge base of information about geohazards and elements at risk. Of the “four pillars” of emergency management – mitigation, preparedness, response, and recovery – Cambio primarily supports mitigation and provides input to preparedness.
EMBC (2019)1 defines “mitigation” as, “the phase of emergency management in which proactive steps are taken to prevent a hazardous event from occurring by eliminating the hazard, or to reduce the severity or potential impact of such an event before it occurs. Mitigation protects lives, property, and cultural sites, and reduces vulnerabilities to emergencies and economic and social disruption.” BGC notes that the full cycle of pro-active geohazard risk management, from hazard identification to risk analysis and the design and implementation of risk control measures, would fall under the EMBC definition of “mitigation”.
The results of this study are also provided separately from Cambio, in the form of this report and digital information (GIS data download and web service for prioritized geohazard areas). Cambio provides a platform to access the same results in a structure that supports decision making.
The application combines map-based information about geohazard areas and elements at risk with evaluation tools based on the principles of risk assessment. Cambio can be used to address questions such as:
• Where are geohazards located and what are their characteristics? • What community assets (elements at risk) are in these areas? • What geohazard areas are ranked highest priority, from a geohazard risk perspective?
These questions are addressed by bringing together three major components of the application:
Hazard information:
• Type, spatial extent, and characteristics of geohazard areas, presented on a web map. • Supporting information such as hydrologic information, geohazard mapping and imagery.
1 Emergency Management BC (EMBC). (2019). Discussion Paper: Modernizing BC’s Emergency Management
Legislation. Web link: https://www2.gov.bc.ca/assets/gov/public-safety-and-emergency-services/emergency-preparedness-response-recovery/modernizing_bcs_emergencymanagement_legislation.pdf
Columbia-Shuswap Regional District April 16, 2020 Geohazard Risk Prioritization - FINAL Project No.: 1899001
Appendix B - Cambio Communities.docx B-2
BGC ENGINEERING INC.
Exposure information:
• Type, location, and characteristics of community assets, including elements at risk and risk management infrastructure.
Analysis tools:
• Identification of assets in geohazard areas (elements at risk). • Prioritization of geohazard areas based on ratings for geohazards and consequences. • Access to data downloads and reports for geohazard areas2.
This user guide describes how users can navigate map controls, view site features, and obtain additional information about geohazard areas. It should be read with the main report, which describes methodologies, limitations, and gaps in the data presented on the application.
B.1.2. Site Access
Cambio can be viewed at www.cambiocommunities.ca. Username and password information is available on request. The application should be viewed using Chrome or Firefox web browsers and is not designed for Internet Explorer or Edge.
Two levels of access are provided:
• Local/Regional Government users: Access to a single study area of interest (e.g., administrative or watershed area of interest for the user).
• Provincial/Federal Government users: Access to multiple study areas3.
The remainder of this guide is best read after the user has logged into Cambio. Users should also read the main document to understand methods, limitations, uncertainties and gaps in the information presented.
This guide describes information displayed across multiple administrative areas within British Columbia. Footnotes indicate cases where information is specific to certain regions.
B.2. NAVIGATION
Figure B.2-1 provides a screen shot of Cambio following user login and acceptance of terms and conditions. Section B.3 describes map controls and tools, including how to turn layers on and off for viewing. Section B.4 describes interactive features used to access and download information about geohazard areas. On login, the map opens with all layers turned off. Click the layer list to choose which layers to view (See Section B.3).
2 The ability to download available reports at a given geohazard area is only available for study areas where
government has worked with BGC to define report location metadata. 3 User access may be limited by client permissions. BGC does not expect this to be a barrier for provincially/federally
funded studies currently being completed under the NDMP Program.
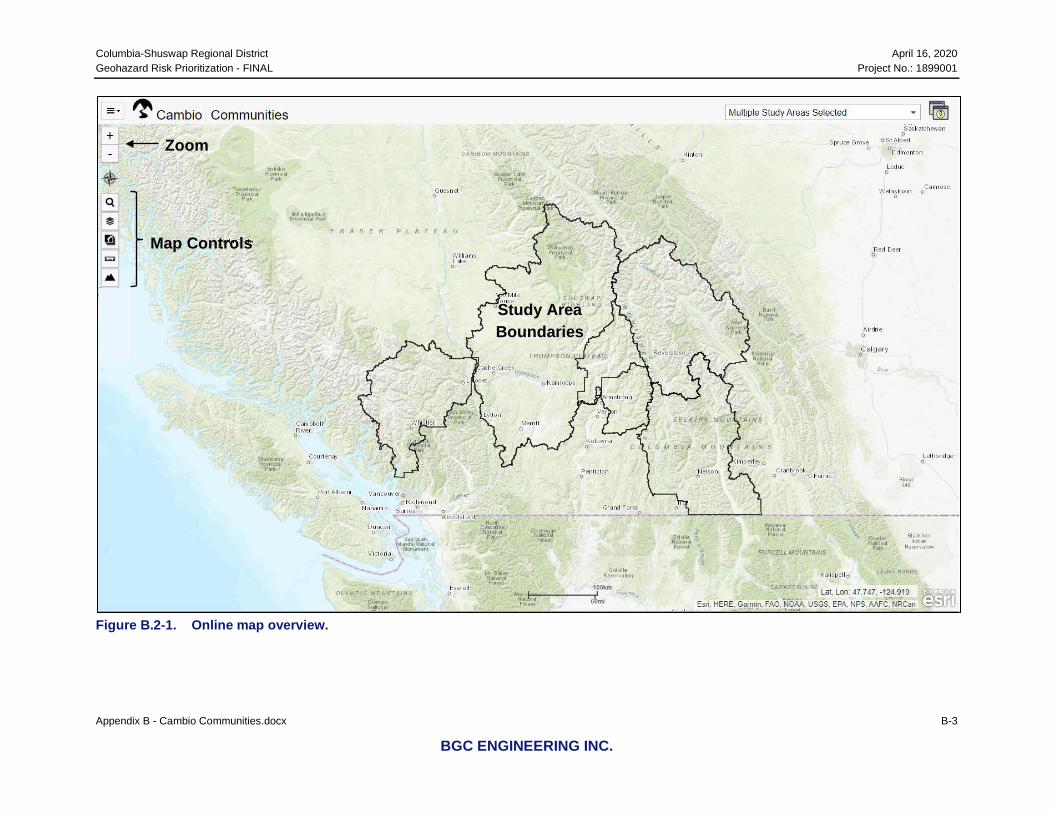
Columbia-Shuswap Regional District April 16, 2020 Geohazard Risk Prioritization - FINAL Project No.: 1899001
Appendix B - Cambio Communities.docx B-3
BGC ENGINEERING INC.
Figure B.2-1. Online map overview.
Zoom
Map Controls
Study Area Boundaries

Columbia-Shuswap Regional District April 16, 2020 Geohazard Risk Prioritization - FINAL Project No.: 1899001
Appendix B - Cambio Communities.docx B-4
BGC ENGINEERING INC.
B.3. MAP CONTROLS
Figure B.2-1 showed the map controls icons on the top left side of the page. Map controls can be listed by clicking on the Compass Rose, then opened by clicking on each icon (Figure B.3-1). Sections B.3.1 to B.3.5 describe the tools in more detail.
Clicking on an icon displays a new window with the tool. The tool can be dragged to a convenient location on the page or popped out in a new browser window.
Figure B.3-1. Map controls and tools.
B.3.1. Search
Search is currently available for geohazard area names and street addresses. To search for hazards:
a. Select the hazard type from the drop-down menu. b. Scroll through the dropdown list to select the feature of interest or begin typing the
feature’s name.
B.3.2. Layer List
This control (Figure B.3-2) allows the user to select which data types and layers to display on the map. It will typically be the first map control accessed on login.
Note that not all layers are visible at all zoom levels, to avoid clutter and permit faster display. Labels change from grey to black font color when viewable, and if the layer cannot be turned on, use map zoom to view at a larger (more detailed) scale. Additionally, the user can adjust the transparency of individual basemap and map layers using the slider located below each layer in the layer list. Complex layers and information will take longer to display the first time they are turned on and cached in the browser.
Elevation Profile
Measurement
BaseMap Gallery
Layer List
Search
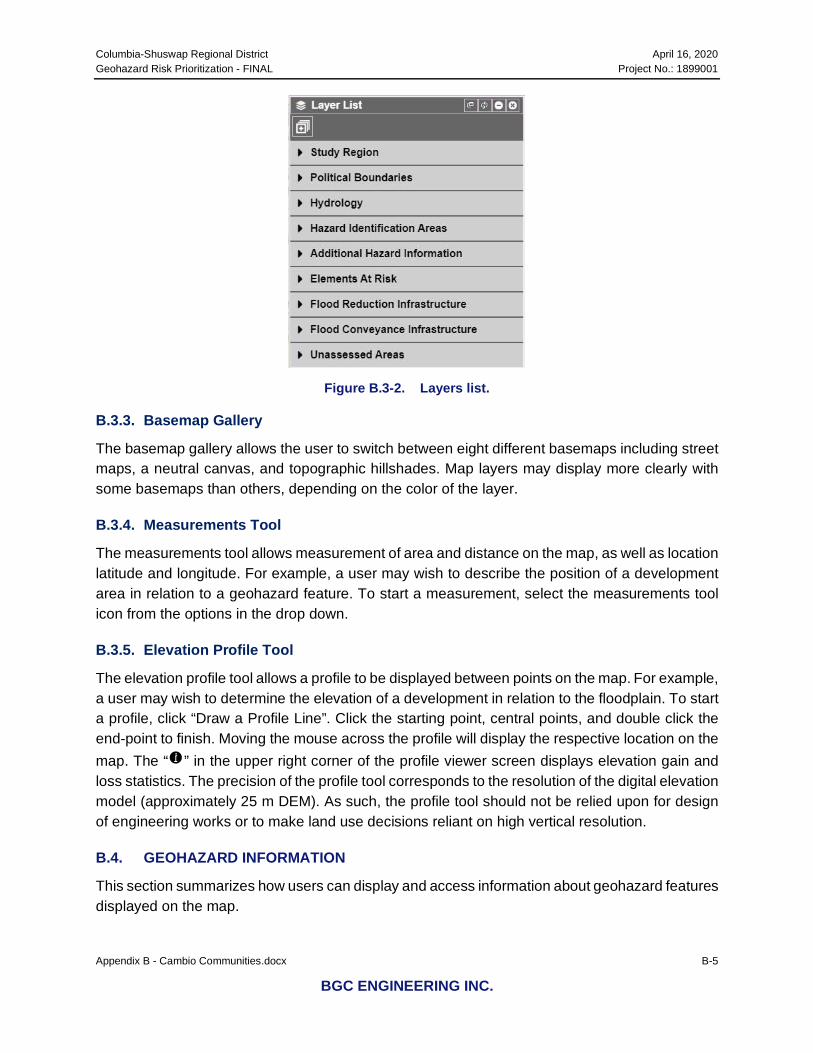
Columbia-Shuswap Regional District April 16, 2020 Geohazard Risk Prioritization - FINAL Project No.: 1899001
Appendix B - Cambio Communities.docx B-5
BGC ENGINEERING INC.
Figure B.3-2. Layers list.
B.3.3. Basemap Gallery
The basemap gallery allows the user to switch between eight different basemaps including street maps, a neutral canvas, and topographic hillshades. Map layers may display more clearly with some basemaps than others, depending on the color of the layer.
B.3.4. Measurements Tool
The measurements tool allows measurement of area and distance on the map, as well as location latitude and longitude. For example, a user may wish to describe the position of a development area in relation to a geohazard feature. To start a measurement, select the measurements tool icon from the options in the drop down.
B.3.5. Elevation Profile Tool
The elevation profile tool allows a profile to be displayed between points on the map. For example, a user may wish to determine the elevation of a development in relation to the floodplain. To start a profile, click “Draw a Profile Line”. Click the starting point, central points, and double click the end-point to finish. Moving the mouse across the profile will display the respective location on the map. The “ ” in the upper right corner of the profile viewer screen displays elevation gain and loss statistics. The precision of the profile tool corresponds to the resolution of the digital elevation model (approximately 25 m DEM). As such, the profile tool should not be relied upon for design of engineering works or to make land use decisions reliant on high vertical resolution.
B.4. GEOHAZARD INFORMATION
This section summarizes how users can display and access information about geohazard features displayed on the map.
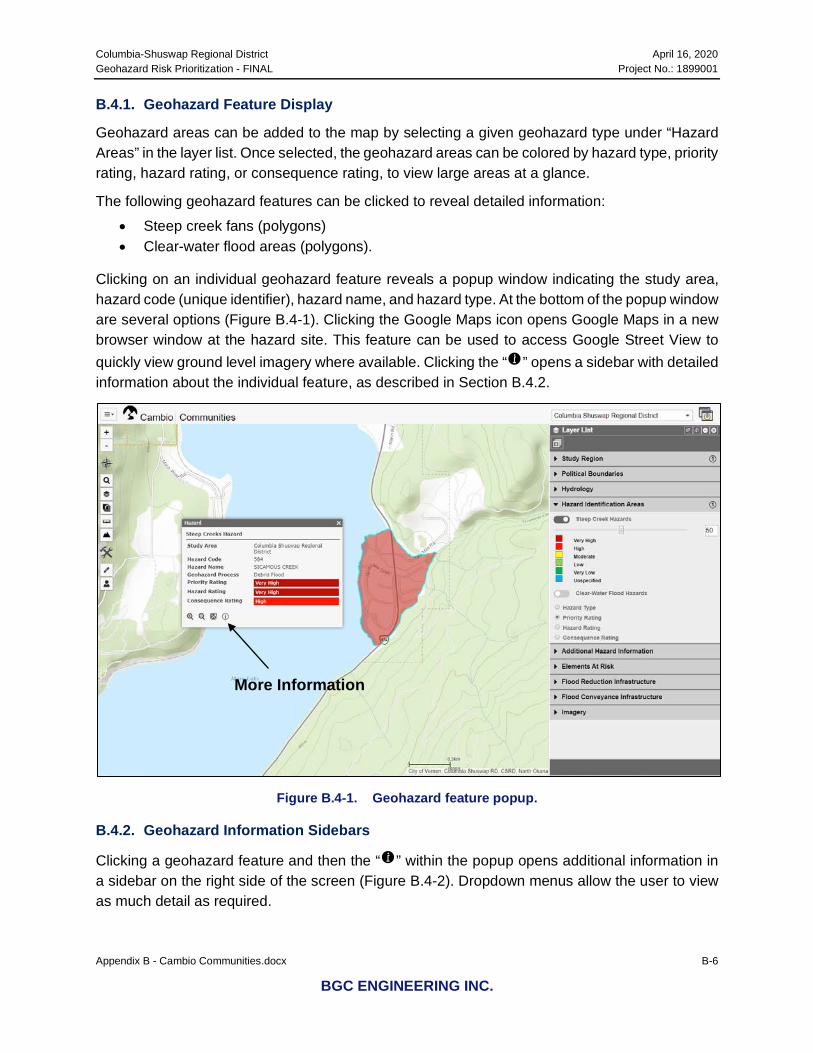
Columbia-Shuswap Regional District April 16, 2020 Geohazard Risk Prioritization - FINAL Project No.: 1899001
Appendix B - Cambio Communities.docx B-6
BGC ENGINEERING INC.
B.4.1. Geohazard Feature Display
Geohazard areas can be added to the map by selecting a given geohazard type under “Hazard Areas” in the layer list. Once selected, the geohazard areas can be colored by hazard type, priority rating, hazard rating, or consequence rating, to view large areas at a glance.
The following geohazard features can be clicked to reveal detailed information: • Steep creek fans (polygons) • Clear-water flood areas (polygons).
Clicking on an individual geohazard feature reveals a popup window indicating the study area, hazard code (unique identifier), hazard name, and hazard type. At the bottom of the popup window are several options (Figure B.4-1). Clicking the Google Maps icon opens Google Maps in a new browser window at the hazard site. This feature can be used to access Google Street View to quickly view ground level imagery where available. Clicking the “ ” opens a sidebar with detailed information about the individual feature, as described in Section B.4.2.
Figure B.4-1. Geohazard feature popup.
B.4.2. Geohazard Information Sidebars
Clicking a geohazard feature and then the “ ” within the popup opens additional information in a sidebar on the right side of the screen (Figure B.4-2). Dropdown menus allow the user to view as much detail as required.
More Information

Columbia-Shuswap Regional District April 16, 2020 Geohazard Risk Prioritization - FINAL Project No.: 1899001
Appendix B - Cambio Communities.docx B-7
BGC ENGINEERING INC.
Figure B.4-2. Additional information sidebar.
Table B-1 summarizes the information displayed within the sidebar. In summary, clicking Ratings reveals the site Priority, Consequence, and Hazard Ratings. See Chapter 5.0 of the main document for further description of these ratings. The geohazard, elements at risk, and hazard reports dropdowns display supporting information. Hover the mouse over the to the right of a row for further definition of the information displayed. Click the “ ” icon at the bottom right of the sidebar to download all sidebar information in either comma-separated values (CSV) or JavaScript Object Notation (JSON) format.
Table B-1. Geohazard information sidebar contents summary.
Dropdown Menu Contents Summary
Ratings Provides geohazard, consequence and priority ratings for an area, displayed graphically as matrices. The geohazard and consequence ratings combine to provide the priority rating. For more information on ratings methodology, see the main report.
Geohazards Info Watershed statistics, hydrology and geohazard characterization, event history, and comments. These inputs form the basis for the geohazard rating and intensity (destructive potential) component of the consequence rating for a given area.
Elements at Risk Info
Summary of elements at risk types and/or values within the geohazard area. These inputs form the basis for the consequence rating for a given area.
Reports Links to download previous reports associated with the area (if any) in pdf format.
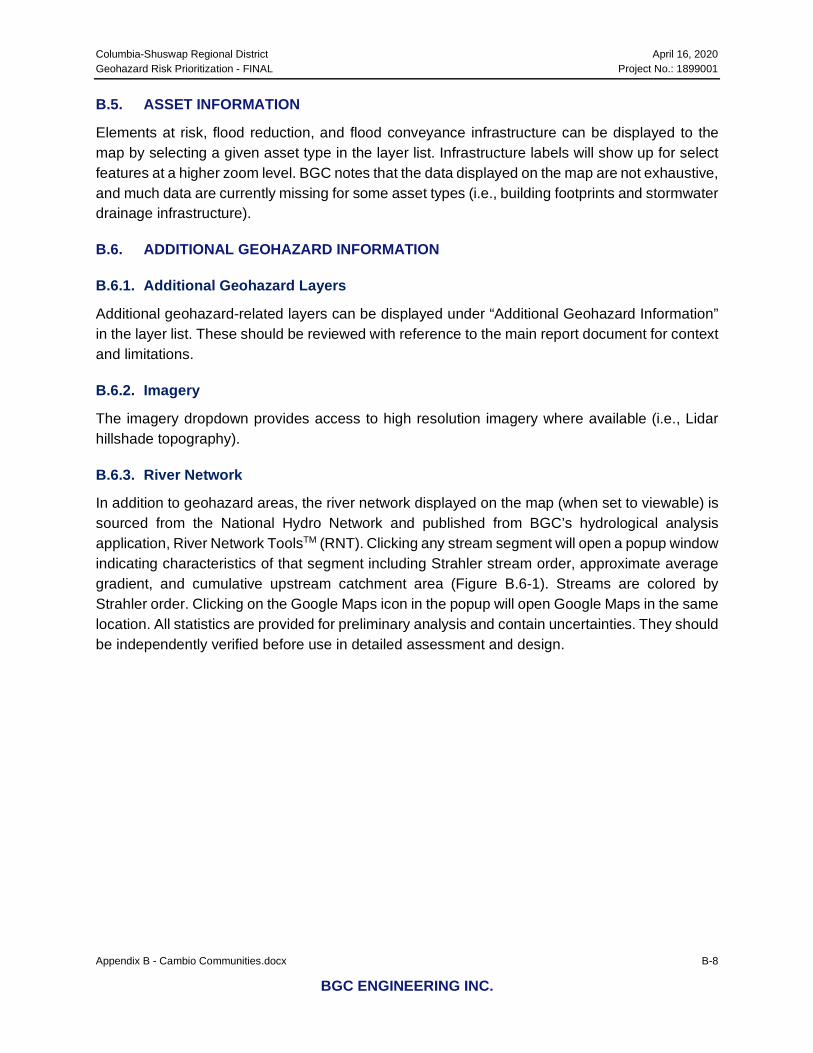
Columbia-Shuswap Regional District April 16, 2020 Geohazard Risk Prioritization - FINAL Project No.: 1899001
Appendix B - Cambio Communities.docx B-8
BGC ENGINEERING INC.
B.5. ASSET INFORMATION
Elements at risk, flood reduction, and flood conveyance infrastructure can be displayed to the map by selecting a given asset type in the layer list. Infrastructure labels will show up for select features at a higher zoom level. BGC notes that the data displayed on the map are not exhaustive, and much data are currently missing for some asset types (i.e., building footprints and stormwater drainage infrastructure).
B.6. ADDITIONAL GEOHAZARD INFORMATION
B.6.1. Additional Geohazard Layers
Additional geohazard-related layers can be displayed under “Additional Geohazard Information” in the layer list. These should be reviewed with reference to the main report document for context and limitations.
B.6.2. Imagery
The imagery dropdown provides access to high resolution imagery where available (i.e., Lidar hillshade topography).
B.6.3. River Network
In addition to geohazard areas, the river network displayed on the map (when set to viewable) is sourced from the National Hydro Network and published from BGC’s hydrological analysis application, River Network ToolsTM (RNT). Clicking any stream segment will open a popup window indicating characteristics of that segment including Strahler stream order, approximate average gradient, and cumulative upstream catchment area (Figure B.6-1). Streams are colored by Strahler order. Clicking on the Google Maps icon in the popup will open Google Maps in the same location. All statistics are provided for preliminary analysis and contain uncertainties. They should be independently verified before use in detailed assessment and design.
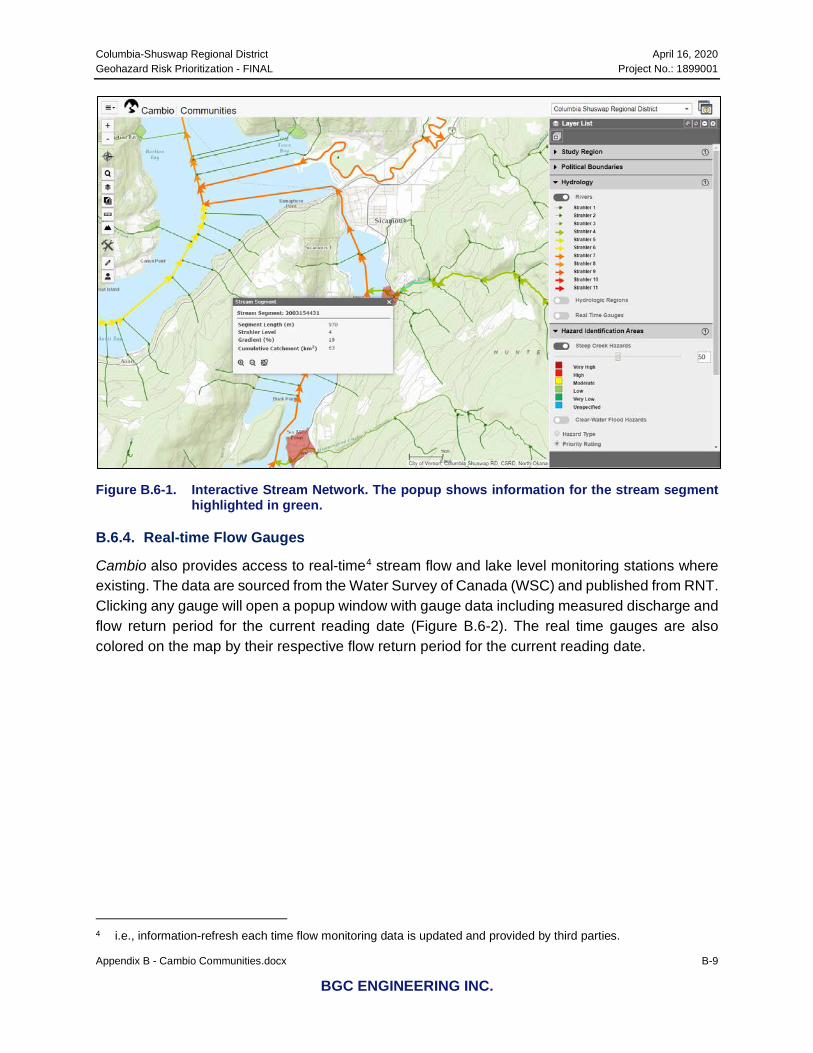
Columbia-Shuswap Regional District April 16, 2020 Geohazard Risk Prioritization - FINAL Project No.: 1899001
Appendix B - Cambio Communities.docx B-9
BGC ENGINEERING INC.
Figure B.6-1. Interactive Stream Network. The popup shows information for the stream segment
highlighted in green.
B.6.4. Real-time Flow Gauges
Cambio also provides access to real-time4 stream flow and lake level monitoring stations where existing. The data are sourced from the Water Survey of Canada (WSC) and published from RNT. Clicking any gauge will open a popup window with gauge data including measured discharge and flow return period for the current reading date (Figure B.6-2). The real time gauges are also colored on the map by their respective flow return period for the current reading date.
4 i.e., information-refresh each time flow monitoring data is updated and provided by third parties.
Columbia-Shuswap Regional District April 16, 2020 Geohazard Risk Prioritization - FINAL Project No.: 1899001
Appendix B - Cambio Communities.docx B-10
BGC ENGINEERING INC.
Figure B.6-2. Near real-time flow gauge. The popup shows gauge information including measured
discharge and return period for a given reading date and time.
B.7. FUTURE DEVELOPMENT
The current version is the first release of Cambio. BGC may develop future versions of the application, and the user interface and features may be updated from time to time. Site development may include:
• Further access to attributes of features displayed on the map • Ability to upload information via desktop and mobile applications • Real-time5 precipitation monitoring and forecasts, in addition to stream flow and lake level. • Automated alerts for monitored data (i.e., stream flow or precipitation) • Automated alerts for debris flow occurrence locations and characteristics. • Inclusion of other types of geohazards (i.e., landslides and snow avalanches).
BGC welcomes feedback on Cambio. Please do not hesitate to contact the undersigned of this report with comments or questions.
5 i.e., information-refresh each time monitoring data are updated and provided by third parties.

Columbia Shuswap Regional District April 16, 2020 Geohazard Risk Prioritization - FINAL Project No.: 1899001
BGC ENGINEERING INC.
APPENDIX C EXPOSURE ASSESSMENT
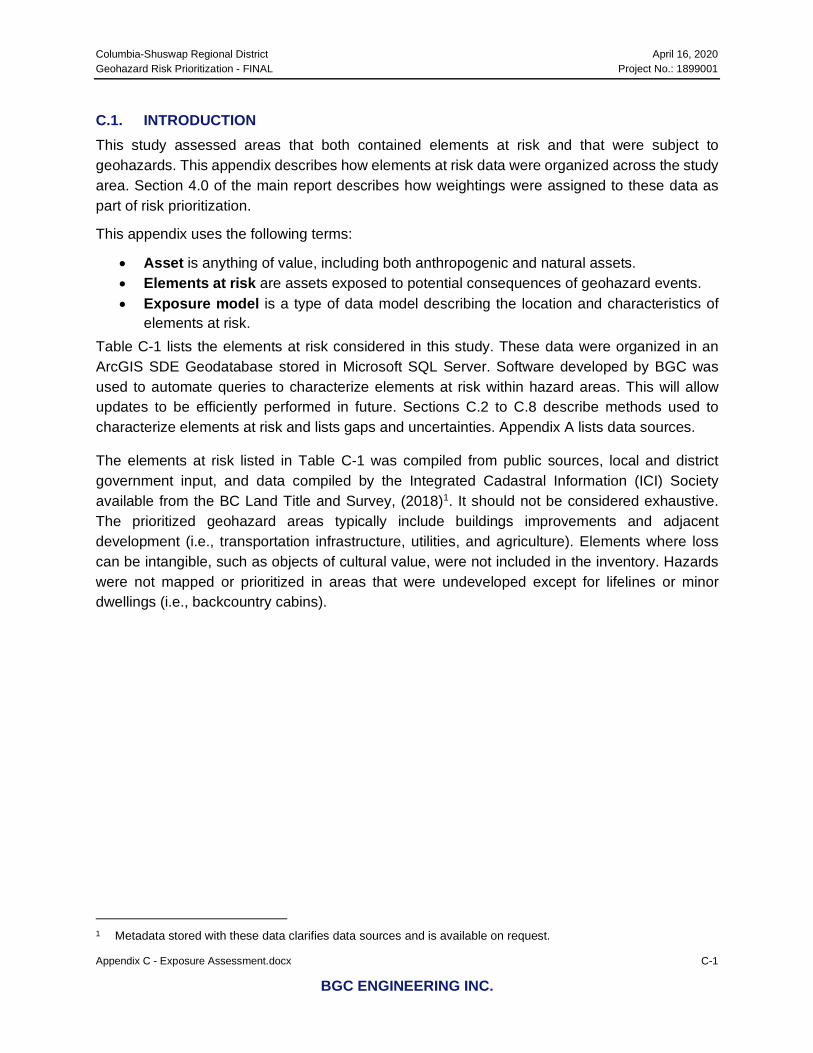
Columbia-Shuswap Regional District April 16, 2020 Geohazard Risk Prioritization - FINAL Project No.: 1899001
Appendix C - Exposure Assessment.docx C-1
BGC ENGINEERING INC.
C.1. INTRODUCTION This study assessed areas that both contained elements at risk and that were subject to geohazards. This appendix describes how elements at risk data were organized across the study area. Section 4.0 of the main report describes how weightings were assigned to these data as part of risk prioritization.
This appendix uses the following terms:
• Asset is anything of value, including both anthropogenic and natural assets. • Elements at risk are assets exposed to potential consequences of geohazard events. • Exposure model is a type of data model describing the location and characteristics of
elements at risk. Table C-1 lists the elements at risk considered in this study. These data were organized in an ArcGIS SDE Geodatabase stored in Microsoft SQL Server. Software developed by BGC was used to automate queries to characterize elements at risk within hazard areas. This will allow updates to be efficiently performed in future. Sections C.2 to C.8 describe methods used to characterize elements at risk and lists gaps and uncertainties. Appendix A lists data sources.
The elements at risk listed in Table C-1 was compiled from public sources, local and district government input, and data compiled by the Integrated Cadastral Information (ICI) Society available from the BC Land Title and Survey, (2018)1. It should not be considered exhaustive. The prioritized geohazard areas typically include buildings improvements and adjacent development (i.e., transportation infrastructure, utilities, and agriculture). Elements where loss can be intangible, such as objects of cultural value, were not included in the inventory. Hazards were not mapped or prioritized in areas that were undeveloped except for lifelines or minor dwellings (i.e., backcountry cabins).
1 Metadata stored with these data clarifies data sources and is available on request.
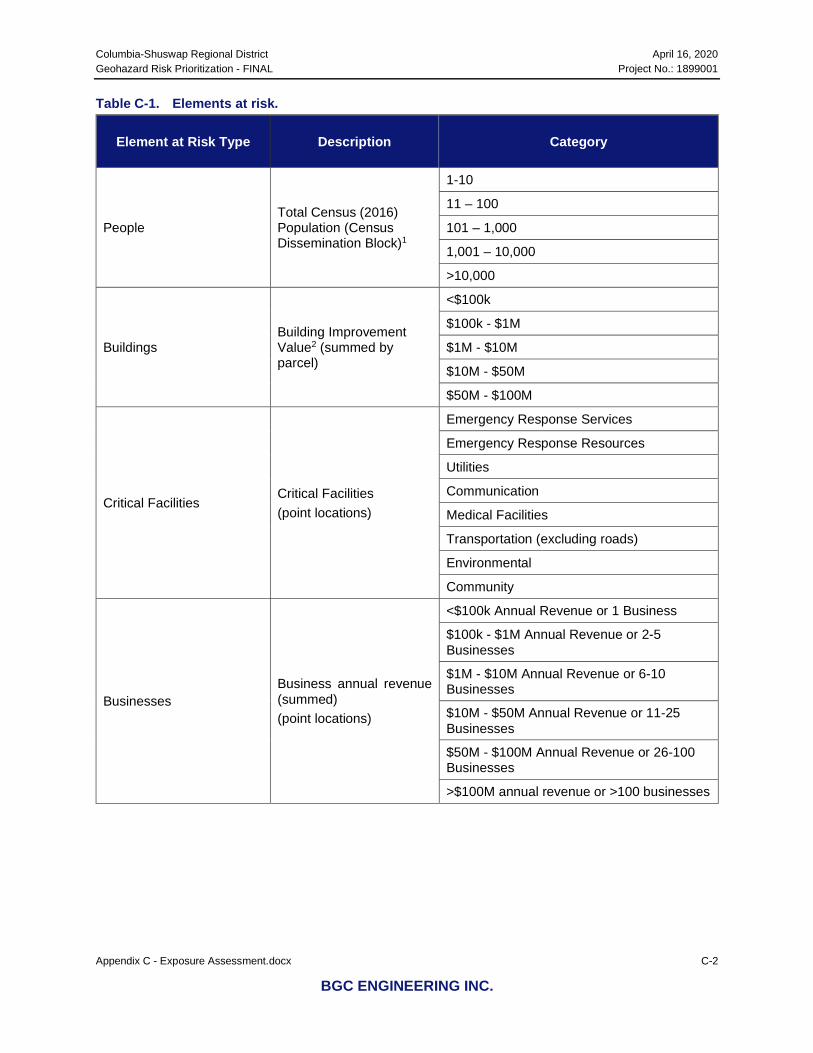
Columbia-Shuswap Regional District April 16, 2020 Geohazard Risk Prioritization - FINAL Project No.: 1899001
Appendix C - Exposure Assessment.docx C-2
BGC ENGINEERING INC.
Table C-1. Elements at risk.
Element at Risk Type Description Category
People Total Census (2016) Population (Census Dissemination Block)1
1-10
11 – 100
101 – 1,000
1,001 – 10,000
>10,000
Buildings Building Improvement Value2 (summed by parcel)
<$100k
$100k - $1M
$1M - $10M
$10M - $50M
$50M - $100M
Critical Facilities Critical Facilities
(point locations)
Emergency Response Services
Emergency Response Resources
Utilities
Communication
Medical Facilities
Transportation (excluding roads)
Environmental
Community
Businesses Business annual revenue (summed) (point locations)
<$100k Annual Revenue or 1 Business
$100k - $1M Annual Revenue or 2-5 Businesses
$1M - $10M Annual Revenue or 6-10 Businesses
$10M - $50M Annual Revenue or 11-25 Businesses
$50M - $100M Annual Revenue or 26-100 Businesses
>$100M annual revenue or >100 businesses

Columbia-Shuswap Regional District April 16, 2020 Geohazard Risk Prioritization - FINAL Project No.: 1899001
Appendix C - Exposure Assessment.docx C-3
BGC ENGINEERING INC.
Element at Risk Type Description Category
Lifelines
Roads (centerline)
Presence of any type
Highway present; no traffic data
0-10 vehicles/day (Class 7)
10-100 vehicles/day (Class 6)
100-500 vehicles/day (Class 5)
500-1000 vehicles/day (Class 4)
> 1000 vehicles/day (Class <4)
Highway
Presence of any type
Railway
Petroleum Infrastructure
Electrical Infrastructure
Communication Infrastructure
Water Infrastructure
Sanitary Infrastructure
Drainage Infrastructure
Environmental Values
Active Agricultural Area
Presence of any type Fisheries
Species and Ecosystems at Risk
Notes: 1. Census population was scaled according to the proportion of census block area intersecting a hazard area. For example, if
the hazard area intersected half the census block, then half the population was assigned. The estimate does not account for spatial variation of population density within the census block.
2. Large parcels with only minor outbuildings or cabins, typically in remote areas, were not included in the assessment.
C.2. BUILDINGS (IMPROVEMENTS)
BGC characterized buildings (improvements) at a parcel level of detail based on cadastral data, which define the location and extent of title and crown land parcels, and municipal assessment data, which describe the usage and value of parcels for taxation.
Titled and Crown land parcels in British Columbia were defined using Parcel Map BC (BC, 2018) and joined to 2018 and 2019 BC Assessment (BCA) data to obtain data on building improvements and land use. BGC applied the following steps to join these data and address one-to-many and many-to-one relationships within the data:
1. BGC obtained the “Parcel code” (PID) from the Parcel Map BC table. If no Parcel code was available on this table, BGC joined from it to the “SHARED_GEOMETRY” table using the “Plan ID”, and from this obtained the PID.
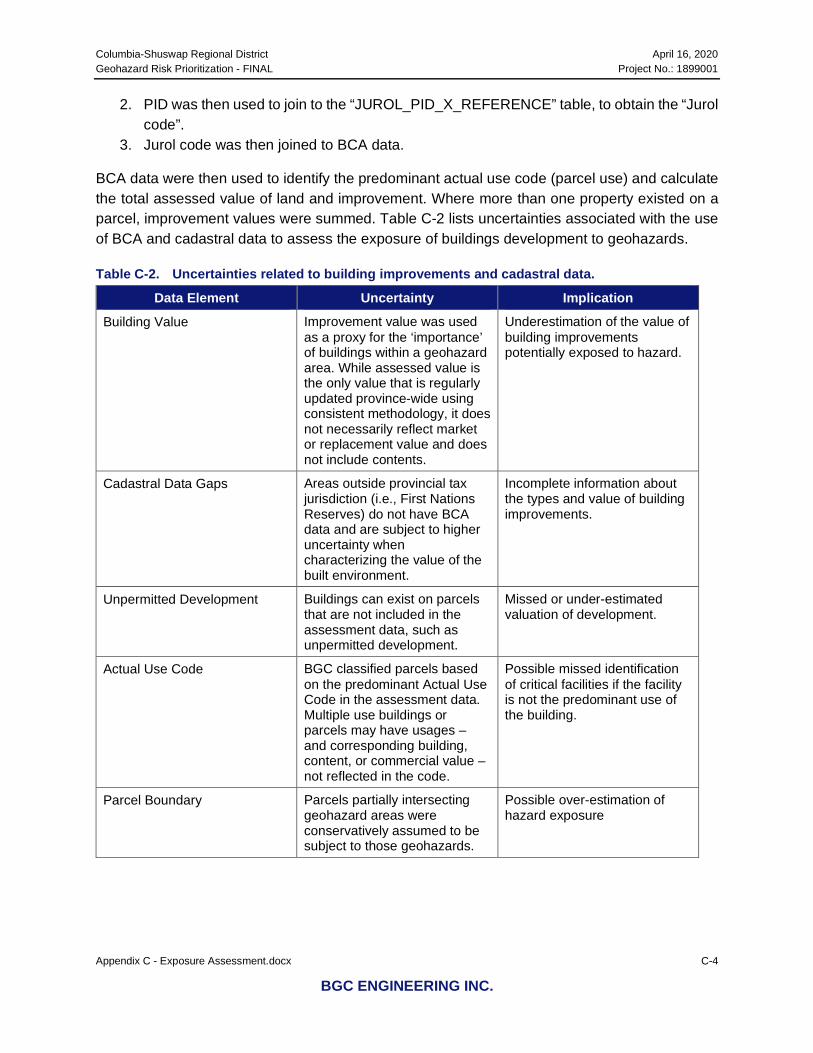
Columbia-Shuswap Regional District April 16, 2020 Geohazard Risk Prioritization - FINAL Project No.: 1899001
Appendix C - Exposure Assessment.docx C-4
BGC ENGINEERING INC.
2. PID was then used to join to the “JUROL_PID_X_REFERENCE” table, to obtain the “Jurol code”.
3. Jurol code was then joined to BCA data.
BCA data were then used to identify the predominant actual use code (parcel use) and calculate the total assessed value of land and improvement. Where more than one property existed on a parcel, improvement values were summed. Table C-2 lists uncertainties associated with the use of BCA and cadastral data to assess the exposure of buildings development to geohazards.
Table C-2. Uncertainties related to building improvements and cadastral data.
Data Element Uncertainty Implication
Building Value Improvement value was used as a proxy for the ‘importance’ of buildings within a geohazard area. While assessed value is the only value that is regularly updated province-wide using consistent methodology, it does not necessarily reflect market or replacement value and does not include contents.
Underestimation of the value of building improvements potentially exposed to hazard.
Cadastral Data Gaps Areas outside provincial tax jurisdiction (i.e., First Nations Reserves) do not have BCA data and are subject to higher uncertainty when characterizing the value of the built environment.
Incomplete information about the types and value of building improvements.
Unpermitted Development Buildings can exist on parcels that are not included in the assessment data, such as unpermitted development.
Missed or under-estimated valuation of development.
Actual Use Code BGC classified parcels based on the predominant Actual Use Code in the assessment data. Multiple use buildings or parcels may have usages – and corresponding building, content, or commercial value – not reflected in the code.
Possible missed identification of critical facilities if the facility is not the predominant use of the building.
Parcel Boundary Parcels partially intersecting geohazard areas were conservatively assumed to be subject to those geohazards.
Possible over-estimation of hazard exposure

Columbia-Shuswap Regional District April 16, 2020 Geohazard Risk Prioritization - FINAL Project No.: 1899001
Appendix C - Exposure Assessment.docx C-5
BGC ENGINEERING INC.
C.3. POPULATION
Population data was obtained from the 2016 Canada Census (2016) at a dissemination block2 level of detail. BGC estimated population exposure within hazard areas based on population counts for each census block. Where census blocks partially intersected a hazard area, population counts were estimated by proportion. For example, if half the census block intersected the hazard area, half the population count was assigned to the hazard area.
While Census data are a reasonable starting point for prioritizing hazard area, it contains uncertainties in both the original data and in population distribution within a census block. It also does not provide information about other populations potentially exposed to hazard, such as workers, and does not account for daily or seasonal variability. Because Census populations do not include the total possible number of people that could be in a geohazard area, they should be considered a minimum estimate.
C.4. CRITICAL FACILITIES
Critical facilities were defined as facilities that:
• Provide vital services in saving and avoiding loss of human life • Accommodate and support activities important to rescue and treatment operations • Are required for the maintenance of public order • House substantial populations • Confine activities or products that, if disturbed or damaged, could be hazardous to the
region • Contain irreplaceable artifacts and historical documents.
BGC distinguished between “critical facilities” and “lifelines”, where the latter includes linear transportation networks and utility systems. While both may be important in an emergency, linear infrastructure can extend through multiple geohazard areas and were inventoried separately.
BGC compiled critical facilities data provided as point shapefiles by CSRD (email from David Major, personal communication, September 12, 2019). Facility locations are shown on the web map, classified according to the categories shown in Table C-3.
2 A dissemination block (DB) is defined as a geographic area bounded on all sides by roads and/or boundaries of
standard geographic area. The dissemination block is the smallest geographic area for which population and dwelling counts are determined. (Statistics Canada, 2016).
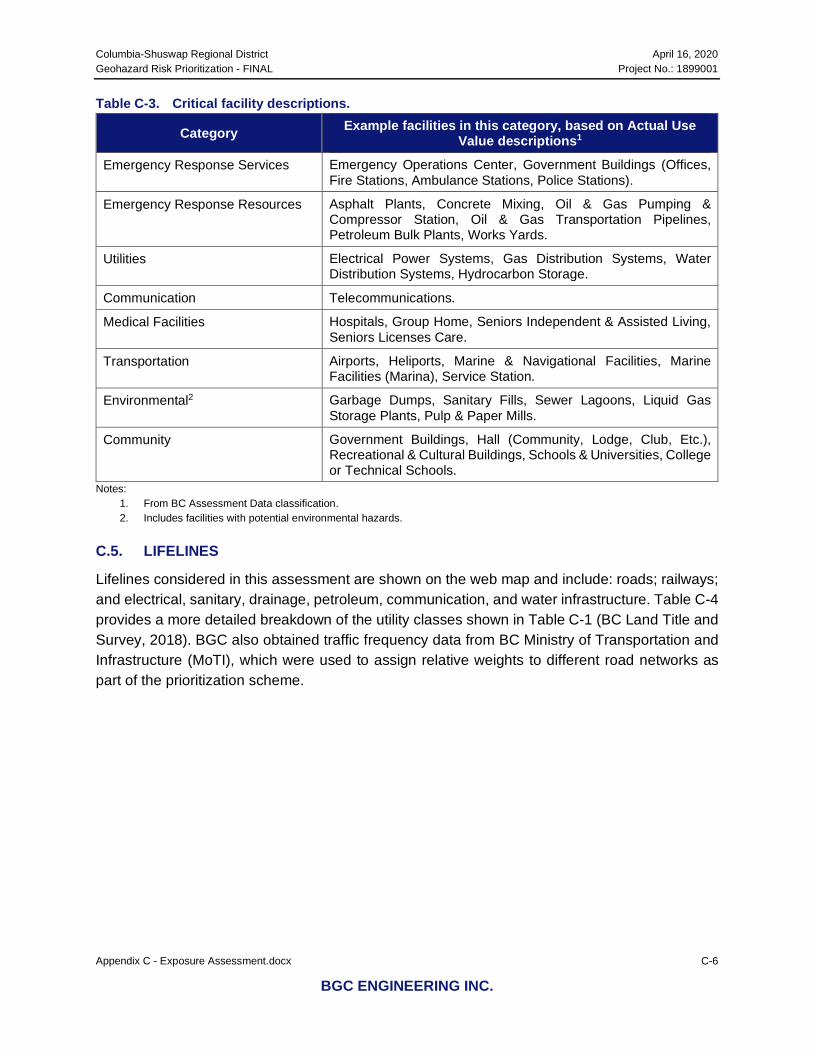
Columbia-Shuswap Regional District April 16, 2020 Geohazard Risk Prioritization - FINAL Project No.: 1899001
Appendix C - Exposure Assessment.docx C-6
BGC ENGINEERING INC.
Table C-3. Critical facility descriptions.
Notes: 1. From BC Assessment Data classification. 2. Includes facilities with potential environmental hazards.
C.5. LIFELINES
Lifelines considered in this assessment are shown on the web map and include: roads; railways; and electrical, sanitary, drainage, petroleum, communication, and water infrastructure. Table C-4 provides a more detailed breakdown of the utility classes shown in Table C-1 (BC Land Title and Survey, 2018). BGC also obtained traffic frequency data from BC Ministry of Transportation and Infrastructure (MoTI), which were used to assign relative weights to different road networks as part of the prioritization scheme.
Category Example facilities in this category, based on Actual Use Value descriptions1
Emergency Response Services Emergency Operations Center, Government Buildings (Offices, Fire Stations, Ambulance Stations, Police Stations).
Emergency Response Resources Asphalt Plants, Concrete Mixing, Oil & Gas Pumping & Compressor Station, Oil & Gas Transportation Pipelines, Petroleum Bulk Plants, Works Yards.
Utilities Electrical Power Systems, Gas Distribution Systems, Water Distribution Systems, Hydrocarbon Storage.
Communication Telecommunications.
Medical Facilities Hospitals, Group Home, Seniors Independent & Assisted Living, Seniors Licenses Care.
Transportation Airports, Heliports, Marine & Navigational Facilities, Marine Facilities (Marina), Service Station.
Environmental2 Garbage Dumps, Sanitary Fills, Sewer Lagoons, Liquid Gas Storage Plants, Pulp & Paper Mills.
Community Government Buildings, Hall (Community, Lodge, Club, Etc.), Recreational & Cultural Buildings, Schools & Universities, College or Technical Schools.
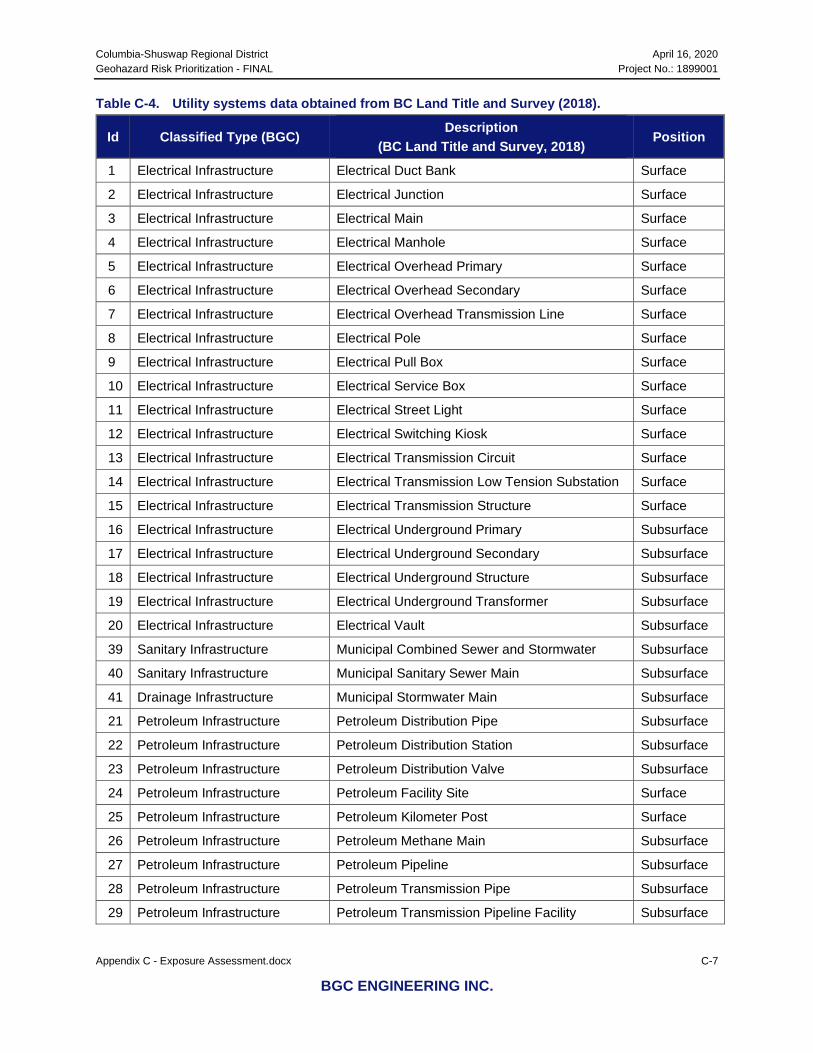
Columbia-Shuswap Regional District April 16, 2020 Geohazard Risk Prioritization - FINAL Project No.: 1899001
Appendix C - Exposure Assessment.docx C-7
BGC ENGINEERING INC.
Table C-4. Utility systems data obtained from BC Land Title and Survey (2018).
Id Classified Type (BGC) Description
(BC Land Title and Survey, 2018) Position
1 Electrical Infrastructure Electrical Duct Bank Surface
2 Electrical Infrastructure Electrical Junction Surface
3 Electrical Infrastructure Electrical Main Surface
4 Electrical Infrastructure Electrical Manhole Surface
5 Electrical Infrastructure Electrical Overhead Primary Surface
6 Electrical Infrastructure Electrical Overhead Secondary Surface
7 Electrical Infrastructure Electrical Overhead Transmission Line Surface
8 Electrical Infrastructure Electrical Pole Surface
9 Electrical Infrastructure Electrical Pull Box Surface
10 Electrical Infrastructure Electrical Service Box Surface
11 Electrical Infrastructure Electrical Street Light Surface
12 Electrical Infrastructure Electrical Switching Kiosk Surface
13 Electrical Infrastructure Electrical Transmission Circuit Surface
14 Electrical Infrastructure Electrical Transmission Low Tension Substation Surface
15 Electrical Infrastructure Electrical Transmission Structure Surface
16 Electrical Infrastructure Electrical Underground Primary Subsurface
17 Electrical Infrastructure Electrical Underground Secondary Subsurface
18 Electrical Infrastructure Electrical Underground Structure Subsurface
19 Electrical Infrastructure Electrical Underground Transformer Subsurface
20 Electrical Infrastructure Electrical Vault Subsurface
39 Sanitary Infrastructure Municipal Combined Sewer and Stormwater Subsurface
40 Sanitary Infrastructure Municipal Sanitary Sewer Main Subsurface
41 Drainage Infrastructure Municipal Stormwater Main Subsurface
21 Petroleum Infrastructure Petroleum Distribution Pipe Subsurface
22 Petroleum Infrastructure Petroleum Distribution Station Subsurface
23 Petroleum Infrastructure Petroleum Distribution Valve Subsurface
24 Petroleum Infrastructure Petroleum Facility Site Surface
25 Petroleum Infrastructure Petroleum Kilometer Post Surface
26 Petroleum Infrastructure Petroleum Methane Main Subsurface
27 Petroleum Infrastructure Petroleum Pipeline Subsurface
28 Petroleum Infrastructure Petroleum Transmission Pipe Subsurface
29 Petroleum Infrastructure Petroleum Transmission Pipeline Facility Subsurface
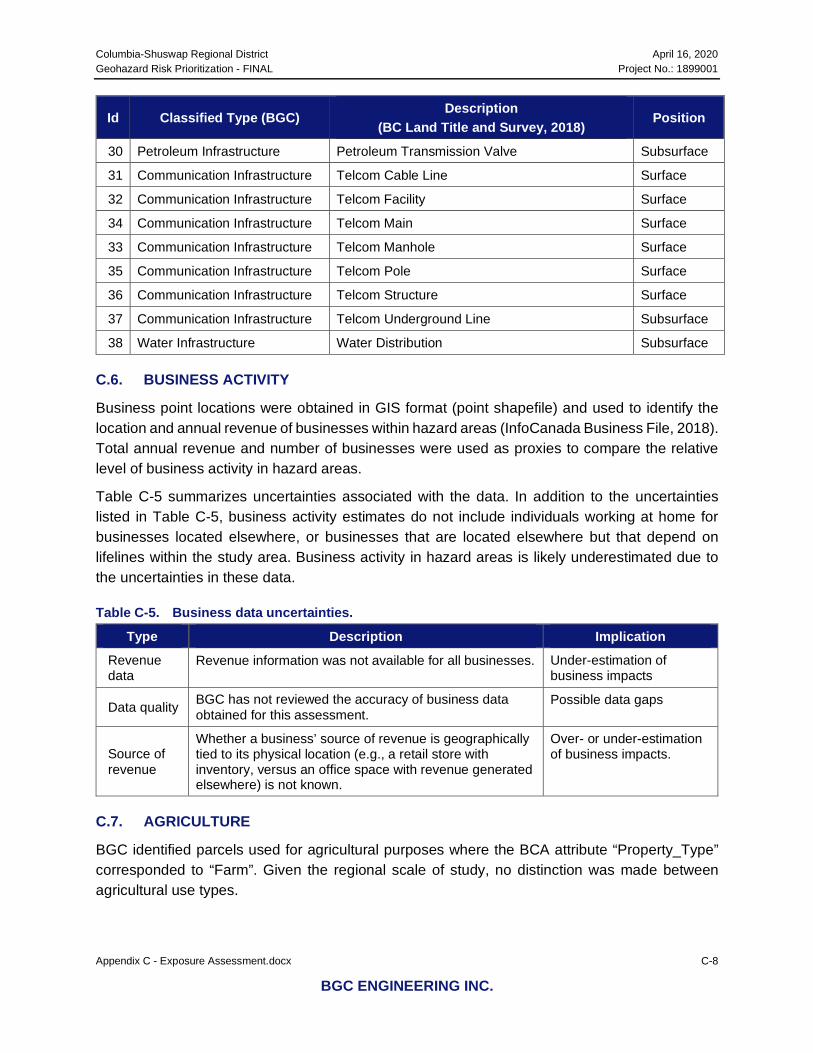
Columbia-Shuswap Regional District April 16, 2020 Geohazard Risk Prioritization - FINAL Project No.: 1899001
Appendix C - Exposure Assessment.docx C-8
BGC ENGINEERING INC.
Id Classified Type (BGC) Description
(BC Land Title and Survey, 2018) Position
30 Petroleum Infrastructure Petroleum Transmission Valve Subsurface
31 Communication Infrastructure Telcom Cable Line Surface
32 Communication Infrastructure Telcom Facility Surface
34 Communication Infrastructure Telcom Main Surface
33 Communication Infrastructure Telcom Manhole Surface
35 Communication Infrastructure Telcom Pole Surface
36 Communication Infrastructure Telcom Structure Surface
37 Communication Infrastructure Telcom Underground Line Subsurface
38 Water Infrastructure Water Distribution Subsurface
C.6. BUSINESS ACTIVITY
Business point locations were obtained in GIS format (point shapefile) and used to identify the location and annual revenue of businesses within hazard areas (InfoCanada Business File, 2018). Total annual revenue and number of businesses were used as proxies to compare the relative level of business activity in hazard areas.
Table C-5 summarizes uncertainties associated with the data. In addition to the uncertainties listed in Table C-5, business activity estimates do not include individuals working at home for businesses located elsewhere, or businesses that are located elsewhere but that depend on lifelines within the study area. Business activity in hazard areas is likely underestimated due to the uncertainties in these data.
Table C-5. Business data uncertainties.
Type Description Implication Revenue data
Revenue information was not available for all businesses. Under-estimation of business impacts
Data quality BGC has not reviewed the accuracy of business data obtained for this assessment.
Possible data gaps
Source of revenue
Whether a business’ source of revenue is geographically tied to its physical location (e.g., a retail store with inventory, versus an office space with revenue generated elsewhere) is not known.
Over- or under-estimation of business impacts.
C.7. AGRICULTURE
BGC identified parcels used for agricultural purposes where the BCA attribute “Property_Type” corresponded to “Farm”. Given the regional scale of study, no distinction was made between agricultural use types.

Columbia-Shuswap Regional District April 16, 2020 Geohazard Risk Prioritization - FINAL Project No.: 1899001
Appendix C - Exposure Assessment.docx C-9
BGC ENGINEERING INC.
C.8. ENVIRONMENTAL VALUES
BGC included stream networks classed as fish bearing and areas classed as sensitive habitat in the risk prioritization.
In the case of fish, the BC Ministry of Environment (MOE) maintains a spatial database of historical fish distribution in streams based on the Fisheries Information Summary System (FISS) (MOE, 2018a). The data includes point locations and zones (river segments) where fish species have been observed, the extent of their upstream migration, and where activities such as spawning, rearing and holding are known to occur. As a preliminary step and because fisheries values are of regulatory concern for structural flood mitigation works, FISS data were used to identify fan and flood hazard areas that intersect known fish habitat. Hazard areas were conservatively identified as intersecting fish habitat irrespective of the proportion intersected (e.g., entire hazard areas were flagged as potentially fish bearing where one or more fish habitat points or river segments were identified within the hazard zone), so these results should be interpreted as potential only.
For endangered species and ecosystems, the BC Conservation Data Centre (BC CDC) maintains a spatial data set of locations of endangered species and ecosystems, including a version available for public viewing and download (MOE, 2018b).
BGC emphasizes that the information used to identify areas containing environmental values is highly incomplete, and estimation of vulnerability is highly complex. More detailed identification of habitat values in areas subject to flood geohazards starts with an Environmental Scoping Study (ESS), typically based on a review of existing information, preliminary field investigations, and consultation with local stakeholders and environmental agencies.
BGC also notes that environmental values are distinct from the other elements at risk considered in this section in that flood mitigation, not necessarily flooding itself, has the potential to result in the greatest level of negative impact. For example, flood management activities, particularly structural protection measures (e.g., dikes), have the potential to cause profound changes to the ecology of floodplain areas. The construction of dikes and dams eliminates flooding as an agent of disturbance and driver of ecosystem health, potentially leading to substantial changes to species composition and overall floodplain ecosystem function.
Within rivers, fish access to diverse habitats necessary to sustain various life stages has the potential to be reduced due to floodplain reclamation for agricultural use and wildlife management, restricting fisheries values to the mainstem of the river. Riparian shoreline vegetation also provides important wildlife habitat, and itself may include plants of cultural significance to First Nations peoples. On the floodplains, reduction in wetland habitat may impact waterfowl, other waterbirds, migratory waterbirds, and associated wetland species such as amphibians.
The ecological impacts of dike repair and maintenance activities can also be severe. Dike repairs often result in the removal of riparian vegetation compromising critical fisheries and wildlife habitat values. The removal of undercut banks and overstream (bank) vegetation results in a lack of cover for fish and interrupts long term large woody debris (LWD) recruitment processes and riparian
Columbia-Shuswap Regional District April 16, 2020 Geohazard Risk Prioritization - FINAL Project No.: 1899001
Appendix C - Exposure Assessment.docx C-10
BGC ENGINEERING INC.
function. Alternative flood mitigation approaches could include setback dikes from the river, providing a narrow floodplain riparian area on the river side of the dike, and vegetating the dikes with non-woody plants so that inspections may be performed and the dike integrity is not compromised. Such approaches may prevent conflicting interests between the Fisheries Act and Dike Maintenance Act.
Lastly, BGC notes that increased impact to fish habitat may result where land use changes (e.g., logging, forest fires) have increased debris flow/debris avalanche activity and the delivery of fine sediments to fish bearing streams.

Columbia-Shuswap Regional District April 16, 2020 Geohazard Risk Prioritization - FINAL Project No.: 1899001
Appendix C - Exposure Assessment.docx C-11
BGC ENGINEERING INC.
REFERENCES
BC Assessment. (2018). BC Assessment Custom Report. Provided by CSRD via email attachment dated November 2018.
BC Assessment. (2019). BC Assessment Custom Report. Provided by CSRD via email attachment dated June 2019.
BC Land Title and Survey. (2018). Parcel Map BC. Cadastral data provided by the Integrated Cadastral Information (ICI) Society, dated September 2018.
InfoCanada Business File. (2018). Canada Business Points. Provided by Geografx Digital Mapping Services, dated September 29, 2018.
Ministry of Environment (MOE). (2018a). Fisheries Inventory. Web location: https://www2.gov.bc.ca/gov/content/environment/plants-animals-ecosystems/fish
Ministry of Environment (MOE). (2018b). Endangered Species and Ecosystems – Masked Occurrences Data. Web location: https://catalogue.data.gov.bc.ca/dataset?type=Application
Statistics Canada. (2016). Census Profile, 2016 Census. Catalogue No. 98-316-X2016001.
Columbia Shuswap Regional District April 16, 2020 Geohazard Risk Prioritization - FINAL Project No.: 1899001
BGC ENGINEERING INC.
APPENDIX D HAZARD ASSESSMENT METHODS – CLEAR-WATER FLOODS
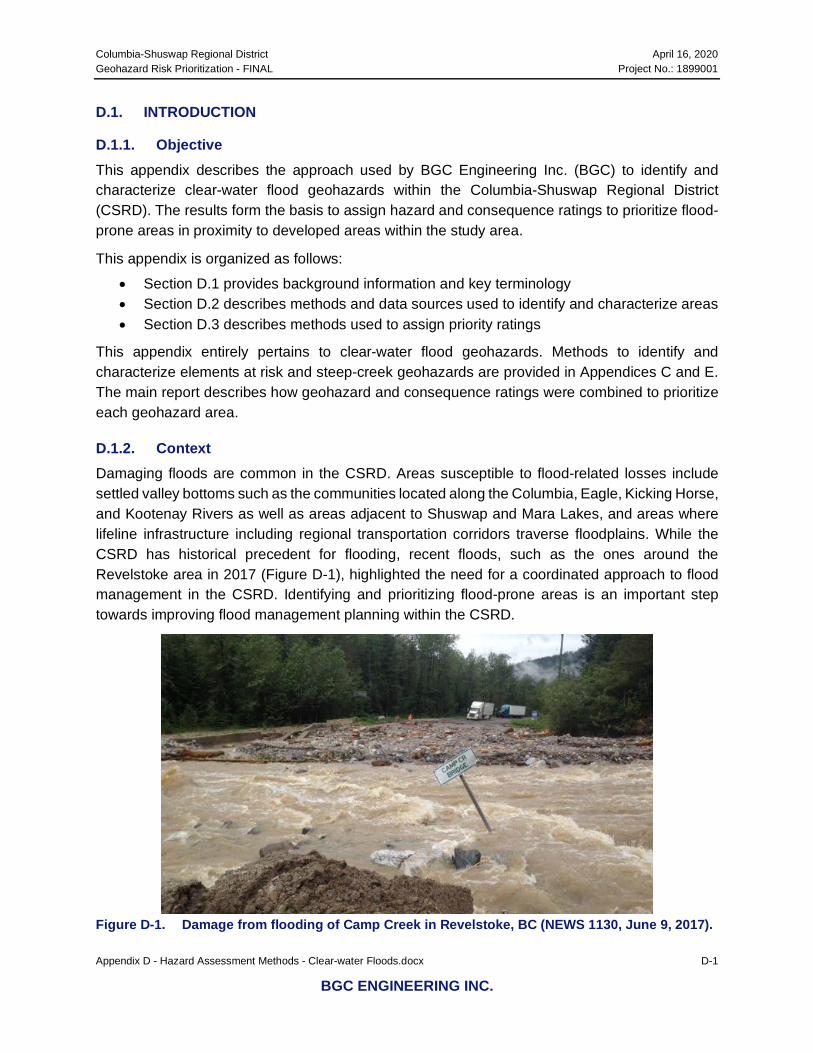
Columbia-Shuswap Regional District April 16, 2020 Geohazard Risk Prioritization - FINAL Project No.: 1899001
Appendix D - Hazard Assessment Methods - Clear-water Floods.docx D-1
BGC ENGINEERING INC.
D.1. INTRODUCTION
D.1.1. Objective This appendix describes the approach used by BGC Engineering Inc. (BGC) to identify and characterize clear-water flood geohazards within the Columbia-Shuswap Regional District (CSRD). The results form the basis to assign hazard and consequence ratings to prioritize flood-prone areas in proximity to developed areas within the study area.
This appendix is organized as follows:
• Section D.1 provides background information and key terminology • Section D.2 describes methods and data sources used to identify and characterize areas • Section D.3 describes methods used to assign priority ratings
This appendix entirely pertains to clear-water flood geohazards. Methods to identify and characterize elements at risk and steep-creek geohazards are provided in Appendices C and E. The main report describes how geohazard and consequence ratings were combined to prioritize each geohazard area.
D.1.2. Context Damaging floods are common in the CSRD. Areas susceptible to flood-related losses include settled valley bottoms such as the communities located along the Columbia, Eagle, Kicking Horse, and Kootenay Rivers as well as areas adjacent to Shuswap and Mara Lakes, and areas where lifeline infrastructure including regional transportation corridors traverse floodplains. While the CSRD has historical precedent for flooding, recent floods, such as the ones around the Revelstoke area in 2017 (Figure D-1), highlighted the need for a coordinated approach to flood management in the CSRD. Identifying and prioritizing flood-prone areas is an important step towards improving flood management planning within the CSRD.
Figure D-1. Damage from flooding of Camp Creek in Revelstoke, BC (NEWS 1130, June 9, 2017).
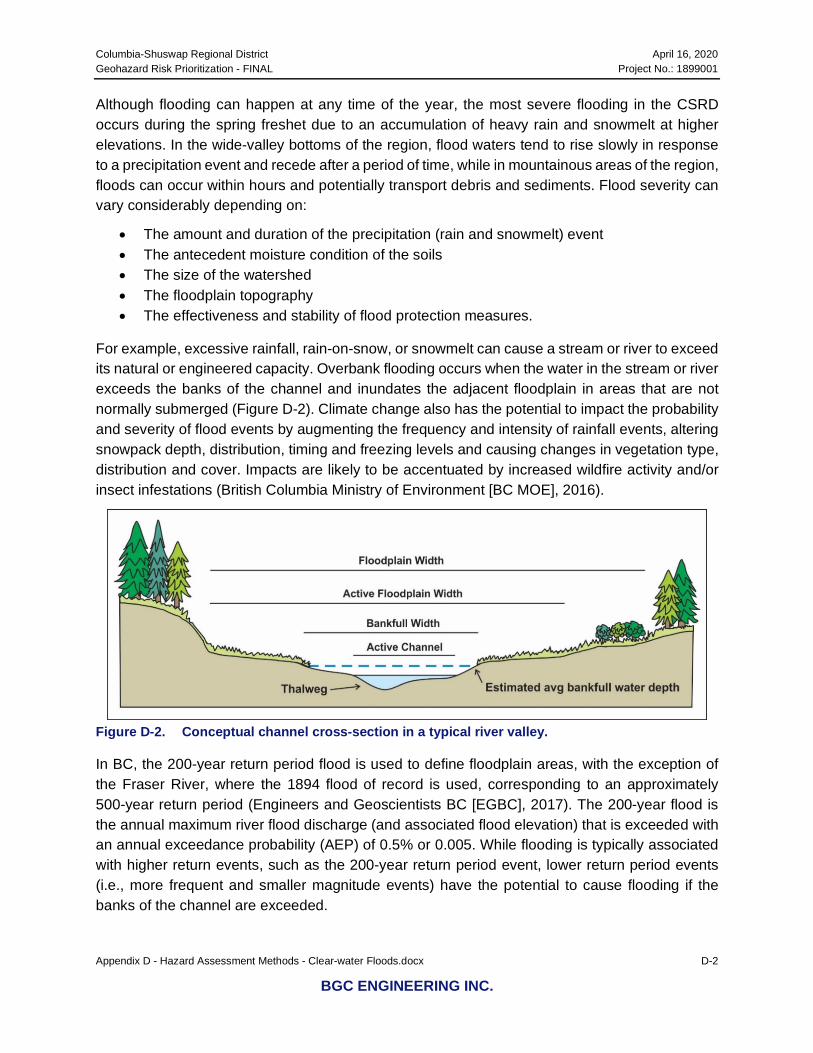
Columbia-Shuswap Regional District April 16, 2020 Geohazard Risk Prioritization - FINAL Project No.: 1899001
Appendix D - Hazard Assessment Methods - Clear-water Floods.docx D-2
BGC ENGINEERING INC.
Although flooding can happen at any time of the year, the most severe flooding in the CSRD occurs during the spring freshet due to an accumulation of heavy rain and snowmelt at higher elevations. In the wide-valley bottoms of the region, flood waters tend to rise slowly in response to a precipitation event and recede after a period of time, while in mountainous areas of the region, floods can occur within hours and potentially transport debris and sediments. Flood severity can vary considerably depending on:
• The amount and duration of the precipitation (rain and snowmelt) event • The antecedent moisture condition of the soils • The size of the watershed • The floodplain topography • The effectiveness and stability of flood protection measures.
For example, excessive rainfall, rain-on-snow, or snowmelt can cause a stream or river to exceed its natural or engineered capacity. Overbank flooding occurs when the water in the stream or river exceeds the banks of the channel and inundates the adjacent floodplain in areas that are not normally submerged (Figure D-2). Climate change also has the potential to impact the probability and severity of flood events by augmenting the frequency and intensity of rainfall events, altering snowpack depth, distribution, timing and freezing levels and causing changes in vegetation type, distribution and cover. Impacts are likely to be accentuated by increased wildfire activity and/or insect infestations (British Columbia Ministry of Environment [BC MOE], 2016).
Figure D-2. Conceptual channel cross-section in a typical river valley.
In BC, the 200-year return period flood is used to define floodplain areas, with the exception of the Fraser River, where the 1894 flood of record is used, corresponding to an approximately 500-year return period (Engineers and Geoscientists BC [EGBC], 2017). The 200-year flood is the annual maximum river flood discharge (and associated flood elevation) that is exceeded with an annual exceedance probability (AEP) of 0.5% or 0.005. While flooding is typically associated with higher return events, such as the 200-year return period event, lower return period events (i.e., more frequent and smaller magnitude events) have the potential to cause flooding if the banks of the channel are exceeded.
Columbia-Shuswap Regional District April 16, 2020 Geohazard Risk Prioritization - FINAL Project No.: 1899001
Appendix D - Hazard Assessment Methods - Clear-water Floods.docx D-3
BGC ENGINEERING INC.
D.1.3. Terminology This appendix refers to the following key definitions1:
• Annual Exceedance Probability (AEP): chance that a flood magnitude is exceeded in any year. For example, a flood with a 0.5% AEP has a 1 in 200 chance of being exceeded in any year. AEP is increasingly replacing the use of the term ‘return period’ to describe flood recurrence intervals.
• Clear-water floods: riverine and lake flooding resulting from inundation due to an excess of clear-water discharge in a watercourse or body of water such that land outside the natural or artificial banks which is not normally under water is submerged.
• Consequence: damage or losses to an element-at-risk in the event of a specific hazard. • Flood Construction Level (FCL): a designated flood level plus freeboard, or where a
designated flood level cannot be determined, a specified height above a natural boundary, natural ground elevation, or any obstruction that could cause flooding.
• Flood maps: provide information on the hazards associated with defined flood events, such as water depth, velocity, and duration of flooding, and the probability of occurrence. These maps are used as a decision-making tool for local and regional governments during floods or for planning purposes.
• Screening Level Flood Hazard Mapping: delineation of flood lines and elevations on a base map, typically taking the form of flood lines on a map that show the area that will be covered by water, or the elevation that water would reach during a flood event. In this study, BGC deployed a regional scale approach for the identification of horizontal flooding extents as well as a coarse measurement of flood depths—this was done using a terrain-based flood hazard identification exercise using the Height-Above-Nearest-Drainage (HAND) approach, discussed in Section D.2.4. The approach employs the use of publicly available topographic data and hydrometric data from the Water Survey of Canada.
• Flood mitigation: measures that have the potential to reduce the risk associated with flooding. These measures can be broadly defined as structural such as flood protection infrastructure (e.g., dikes or diversions) or non-structural such as emergency response, resiliency and land-use planning.
• Flood setback: the required minimum distance from the natural boundary of a watercourse or waterbody to maintain a floodway and allow for potential bank erosion.
• Risk: a measure of the probability of a specific flood event occurring and the consequence • Steep-creek floods: rapid flow of water and debris in a steep channel, often associated
with avulsions and bank erosion and referred to as debris floods and debris flows. • Waterbody: ponds, lakes and reservoirs. • Watercourse: creeks, streams and rivers.
D.1.4. Approach Overview Historical flood events that have occurred within the CSRD are generally due to riverine flooding from rainfall, snowmelt and glacial runoff processes. However, flooding can also be triggered from
1 Canadian Standards Association [CSA] (1997); EGBC (2017, 2018).
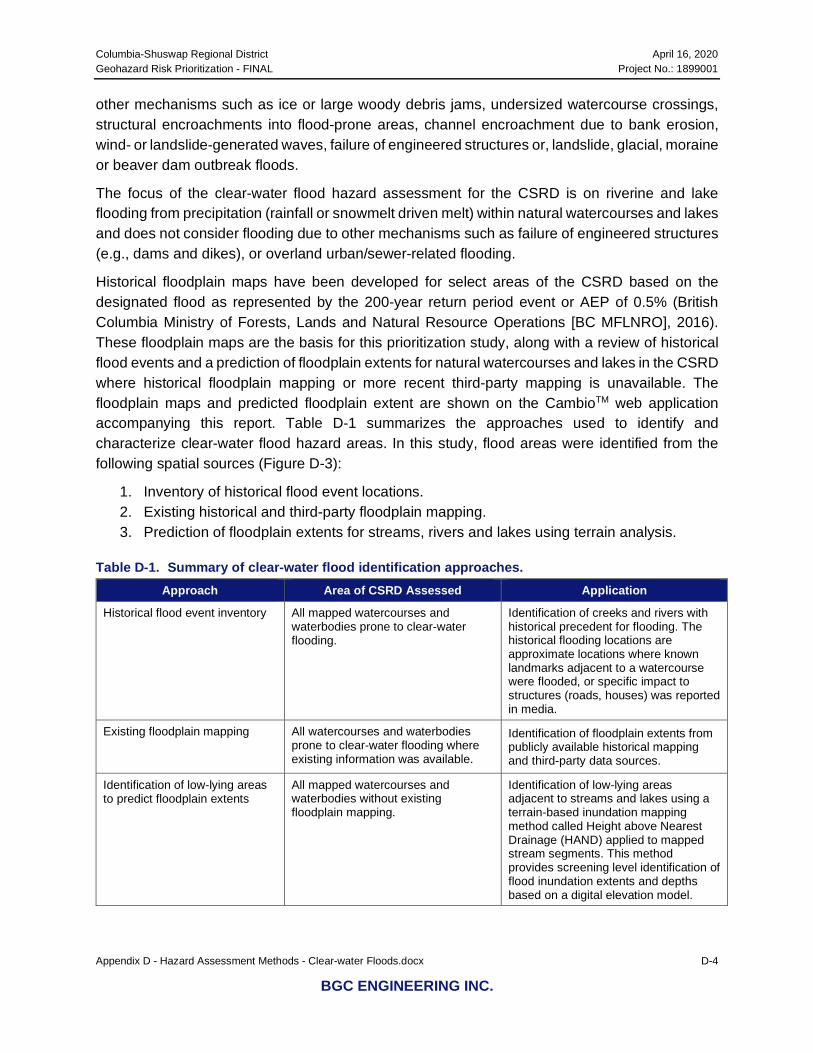
Columbia-Shuswap Regional District April 16, 2020 Geohazard Risk Prioritization - FINAL Project No.: 1899001
Appendix D - Hazard Assessment Methods - Clear-water Floods.docx D-4
BGC ENGINEERING INC.
other mechanisms such as ice or large woody debris jams, undersized watercourse crossings, structural encroachments into flood-prone areas, channel encroachment due to bank erosion, wind- or landslide-generated waves, failure of engineered structures or, landslide, glacial, moraine or beaver dam outbreak floods.
The focus of the clear-water flood hazard assessment for the CSRD is on riverine and lake flooding from precipitation (rainfall or snowmelt driven melt) within natural watercourses and lakes and does not consider flooding due to other mechanisms such as failure of engineered structures (e.g., dams and dikes), or overland urban/sewer-related flooding.
Historical floodplain maps have been developed for select areas of the CSRD based on the designated flood as represented by the 200-year return period event or AEP of 0.5% (British Columbia Ministry of Forests, Lands and Natural Resource Operations [BC MFLNRO], 2016). These floodplain maps are the basis for this prioritization study, along with a review of historical flood events and a prediction of floodplain extents for natural watercourses and lakes in the CSRD where historical floodplain mapping or more recent third-party mapping is unavailable. The floodplain maps and predicted floodplain extent are shown on the CambioTM web application accompanying this report. Table D-1 summarizes the approaches used to identify and characterize clear-water flood hazard areas. In this study, flood areas were identified from the following spatial sources (Figure D-3):
1. Inventory of historical flood event locations. 2. Existing historical and third-party floodplain mapping. 3. Prediction of floodplain extents for streams, rivers and lakes using terrain analysis.
Table D-1. Summary of clear-water flood identification approaches. Approach Area of CSRD Assessed Application
Historical flood event inventory All mapped watercourses and waterbodies prone to clear-water flooding.
Identification of creeks and rivers with historical precedent for flooding. The historical flooding locations are approximate locations where known landmarks adjacent to a watercourse were flooded, or specific impact to structures (roads, houses) was reported in media.
Existing floodplain mapping All watercourses and waterbodies prone to clear-water flooding where existing information was available.
Identification of floodplain extents from publicly available historical mapping and third-party data sources.
Identification of low-lying areas to predict floodplain extents
All mapped watercourses and waterbodies without existing floodplain mapping.
Identification of low-lying areas adjacent to streams and lakes using a terrain-based inundation mapping method called Height above Nearest Drainage (HAND) applied to mapped stream segments. This method provides screening level identification of flood inundation extents and depths based on a digital elevation model.

Columbia-Shuswap Regional District April 16, 2020 Geohazard Risk Prioritization - FINAL Project No.: 1899001
Appendix D - Hazard Assessment Methods - Clear-water Floods.docx D-5
BGC ENGINEERING INC.
Figure D-3. Example floodplain extents derived through terrain analysis for CSRD. Refer to Section D.2.3 for a description of the methods used for predicting floodplain extents.
N

Columbia-Shuswap Regional District April 16, 2020 Geohazard Risk Prioritization - FINAL Project No.: 1899001
Appendix D - Hazard Assessment Methods - Clear-water Floods.docx D-6
BGC ENGINEERING INC.
D.2. CLEAR-WATER FLOOD GEOHAZARD CHARACTERIZATION The following sections describe methods and data sources used to identify and characterize clear-water flood geohazard areas as summarized in Table D-1. In addition to the clear-water flood hazard areas described below, BGC notes that flood hazard exists on steep creek fans that are also prone to debris floods or debris flows. Assessment methods for steep creek fans are described in Appendix E.
D.2.1. Historical Flood Event Inventory BGC compiled a historical flood and steep creek inventory across the CSRD and digitized the locations of historical events from Septer (2007), DriveBC (British Columbia Ministry of Transportation and Infrastructure [BC MoTI], April 2018), and recent freshet-related floods (e.g., media reports). BGC also considered the hazard sites identified in the Community to Community Forum between Fraser Basin Council (FBC) and the CSRD stakeholders on February 14, 2018. Historical flood events such as the event shown in Figure D-4 were used to confirm flood-prone low-lying terrain outside of the historical floodplain maps. Clear-water flood hazard areas were intersected with the flood event inventory compiled by BGC to identify areas with greater potential susceptibility to flooding. However, geohazard ratings were not increased for clear-water hazard areas that intersected a past flood event location.
Figure D-4. Flood event from June 1948 when hard rain combined with snowmelt from a warm and late spring in the Salmon River sent flood water into Sicamous, BC. (Revelstoke Review, May 30, 2018).

Columbia-Shuswap Regional District April 16, 2020 Geohazard Risk Prioritization - FINAL Project No.: 1899001
Appendix D - Hazard Assessment Methods - Clear-water Floods.docx D-7
BGC ENGINEERING INC.
The Salmon River Bridge can serve as a visual reminder of past flood water heights, as the water level was at the base of the bridge during flooding in 1948 (Figure D-5).
Figure D-5. The Salmon River Bridge during the 1948 flood on the Salmon River (Revelstoke
Review, May 30, 2018).
The historical flooding locations presented on the web application are approximate locations where known landmarks adjacent to a watercourse were flooded, or specific impact to structures (roads, houses) was reported in media. Flooding events are indicated as a point location and therefore do not represent the full extent of flooding on a watercourse (e.g., Figure D-3). Additional details on the historical flood event inventory are provided in geospatial (GIS) layers delivered with this study.
D.2.2. Existing Floodplain Mapping
D.2.2.1. Historical Mapping Sources
The BC government provides publicly available information on the location of floodplains, floodplain maps and supporting data (BC MFLNRO, 2016). A provincial floodplain mapping program began in BC in 1974, aimed at identifying flood risk areas. This was in part due to the Fraser River flood of 1972, which resulted in damage in the BC Interior. From 1975 to 2003, the Province managed development in designated floodplain areas under the Floodplain Development Control Program. From 1987 to 1998, the rate of mapping increased through the

Columbia-Shuswap Regional District April 16, 2020 Geohazard Risk Prioritization - FINAL Project No.: 1899001
Appendix D - Hazard Assessment Methods - Clear-water Floods.docx D-8
BGC ENGINEERING INC.
Canada/British Columbia Agreement Respecting Floodplain Mapping. The agreement provided shared federal–provincial funding for the program and included provisions for termination of the agreement as of March 31, 2003. This mapping was generally focused on major rivers as summarized in Table D-2 and shown in Figure D-6. While the maps are now outdated, their use is promoted by the MFLNRO as often representing the best floodplain mapping information available (EGBC, 2017).
The historical floodplain maps typically show both the extent of inundation and flood construction levels (FCLs) based on the 0.5% AEP or 200-year return period event and include a freeboard allowance. At select locations, the 5% AEP or 20-year return period flood elevation (including a freeboard allowance) was also provided for septic tank requirements under the Health Act at the time. Flood levels associated with the 0.5% AEP (including a freeboard allowance) have been used to establish design elevations for flood mitigation works and to inform local floodplain management policy and emergency preparedness. The historical flood maps do not consider the occurrence and location of flood protection measures in the map extents.
Historical floodplain mapping in the CSRD is approximately 35 years old and as a result does not: • Reflect the full data record available for hydrometric stations within the watershed since
the mapping was conducted. Estimates of the 200-year return period flood have likely changed since there are now an additional 20+ years of hydrometric records.
• Reflect potential changes in channel planform and bathymetry (e.g., aggradation and bank erosion as well as channel changes and avulsion paths formation), or development within the floodplain that could alter the extent of inundation.
• Accuracy is limited to the resolution of the input data. Mapping predates high resolution Lidar surveys and hydraulic analysis was limited to 1-dimensional (1D) analysis.
• Consider climate change impacts on flooding (directly by predicted changes in rainfall and/or snowmelt and indirectly by changes in vegetation cover through wildfires and/or insect infestations).
• Consider the presence of flood protection measures such as dikes or embankments, if applicable, and does not consider flood scenarios associated with failure of these structures (e.g., dike breaches, which would result in different flood inundation patterns, depths and velocities than if water levels rose in the absence of dikes).
The quality and accuracy of the historical floodplain mapping was not evaluated as part of this prioritization study. Further, freeboard and flood protection measures such as dike protections have not been evaluated or considered in the geohazard or consequence ratings applied.

Columbia-Shuswap Regional District April 16, 2020 Geohazard Risk Prioritization - FINAL Project No.: 1899001
Appendix D - Hazard Assessment Methods - Clear-water Floods.docx D-9
BGC ENGINEERING INC.
Table D-2. Summary of historical floodplain mapping within the CSRD conducted by the BC Province.
Site No.1
Watercourse (Area)
Approximate Floodplain Area (km2)
Approximate Floodplain
Length (km) Floodplain Map Year
Flood Protection Measures?
Recorded Historical Flood
Events Comments
1 Columbia River at Golden 17.6 13 1979 Yes 1894, 1916, 1954, 1986
Floodplain mapping includes the confluence of the Kicking Horse River tributary with the Columbia River at Golden, BC. Ice jams on the Kicking Horse River are also a flooding concern during spring freshet.
2 Columbia River at Revelstoke 15.8 14 1983 Yes 1894, 1900, 1936,
1948, 1954, 2004
Floodplain mapping includes the confluence of the Illecillewaet River with the Columbia River at Revelstoke, BC. Prior to dam construction, Revelstoke used to experience frequent damaging flood events.
3 Seymour River at Seymour Arm2 12.7 8 1989 No Unknown – no
historical accounts
Provincial floodplain designation has been withdrawn and mapping information is not accessible on iMapBC (Government of BC, 2016). No additional information was available on the reason why the map was withdrawn.
4 Eagle River (Malakwa to Sicamous) 34.0 35 1979 Yes
1894, 1927, 1935, 1967, 1972, 1982, 2012
Flooding at the western extent of Eagle River is influenced by lake levels on Shuswap and Mara Lakes. The costs for flooding damage in Sicamous area (including steep creeks on Sicamous and Hummingbird Creeks) totaled approximately $3.8M (Public Safety Canada, n.d.). Sicamous completed a hydrological connectivity study and applied for flood mitigation funding for Sicamous Creek.
5 Salmon River (Falkland to Salmon Arm) 47.6 50 1991/1992,
2011 No 1894, 1972, 1999, 2018
Flooding at the northern extent of Salmon River is influenced by lake levels on Shuswap Lake. Adams Lake Indian Band is currently conducting climate modelling for Chase Creek, Salmon River, and others. Lower reaches around Salmon Arm have updated floodplain mapping (2011).
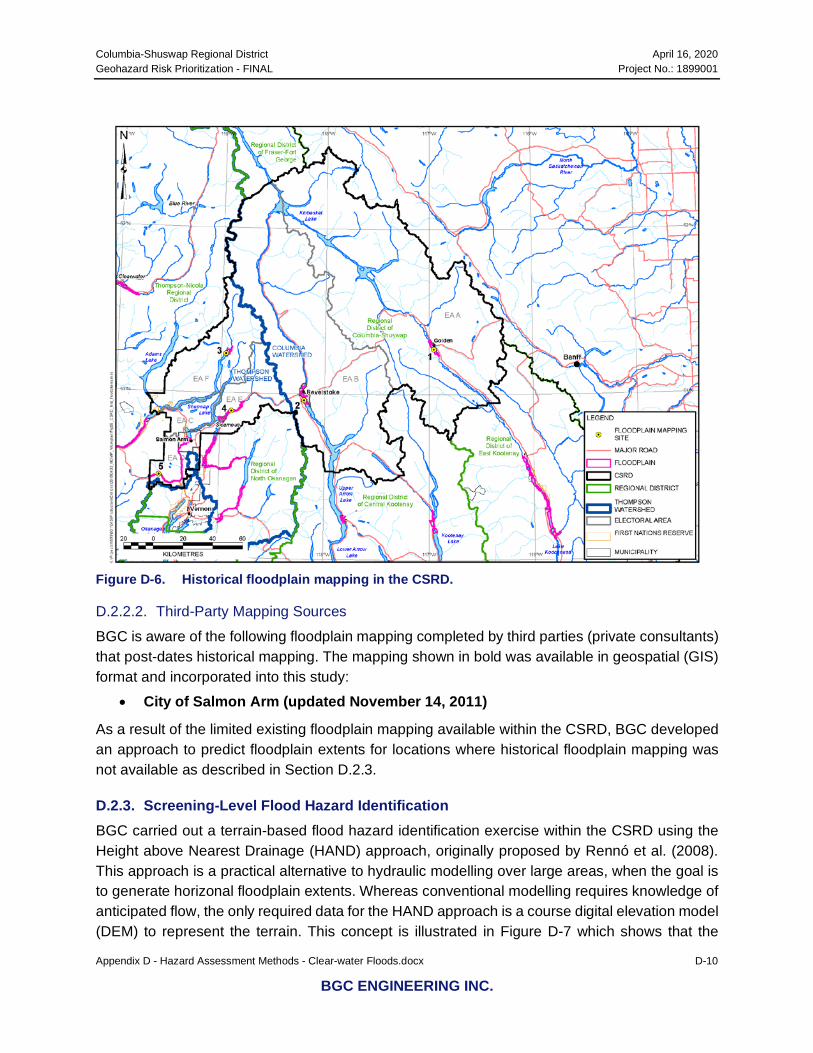
Columbia-Shuswap Regional District April 16, 2020 Geohazard Risk Prioritization - FINAL Project No.: 1899001
Appendix D - Hazard Assessment Methods - Clear-water Floods.docx D-10
BGC ENGINEERING INC.
Figure D-6. Historical floodplain mapping in the CSRD.
D.2.2.2. Third-Party Mapping Sources
BGC is aware of the following floodplain mapping completed by third parties (private consultants) that post-dates historical mapping. The mapping shown in bold was available in geospatial (GIS) format and incorporated into this study:
• City of Salmon Arm (updated November 14, 2011)
As a result of the limited existing floodplain mapping available within the CSRD, BGC developed an approach to predict floodplain extents for locations where historical floodplain mapping was not available as described in Section D.2.3.
D.2.3. Screening-Level Flood Hazard Identification BGC carried out a terrain-based flood hazard identification exercise within the CSRD using the Height above Nearest Drainage (HAND) approach, originally proposed by Rennó et al. (2008). This approach is a practical alternative to hydraulic modelling over large areas, when the goal is to generate horizonal floodplain extents. Whereas conventional modelling requires knowledge of anticipated flow, the only required data for the HAND approach is a course digital elevation model (DEM) to represent the terrain. This concept is illustrated in Figure D-7 which shows that the
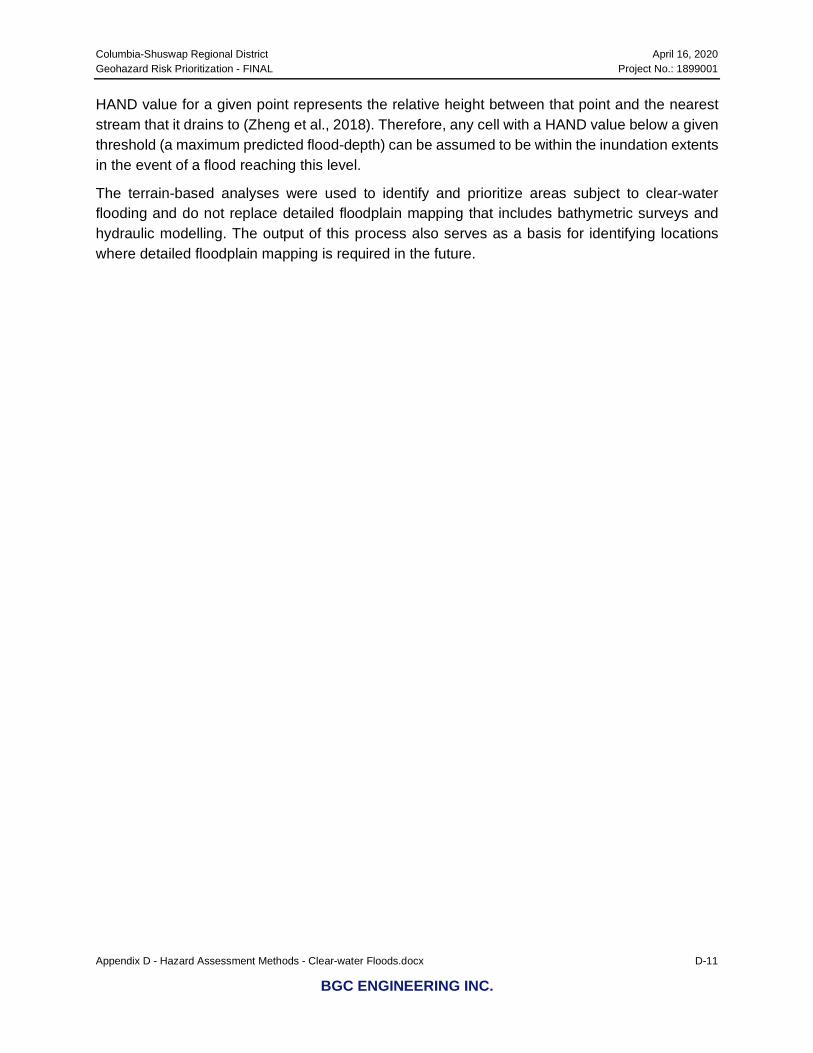
Columbia-Shuswap Regional District April 16, 2020 Geohazard Risk Prioritization - FINAL Project No.: 1899001
Appendix D - Hazard Assessment Methods - Clear-water Floods.docx D-11
BGC ENGINEERING INC.
HAND value for a given point represents the relative height between that point and the nearest stream that it drains to (Zheng et al., 2018). Therefore, any cell with a HAND value below a given threshold (a maximum predicted flood-depth) can be assumed to be within the inundation extents in the event of a flood reaching this level.
The terrain-based analyses were used to identify and prioritize areas subject to clear-water flooding and do not replace detailed floodplain mapping that includes bathymetric surveys and hydraulic modelling. The output of this process also serves as a basis for identifying locations where detailed floodplain mapping is required in the future.
Columbia-Shuswap Regional District April 16, 2020 Geohazard Risk Prioritization - FINAL Project No.: 1899001
Appendix D - Hazard Assessment Methods - Clear-water Floods.docx D-12
BGC ENGINEERING INC.
Figure D-7. Illustration of the HAND concept (modified from Zheng et al., 2018).
Columbia-Shuswap Regional District April 16, 2020 Geohazard Risk Prioritization - FINAL Project No.: 1899001
Appendix D - Hazard Assessment Methods - Clear-water Floods.docx D-13
BGC ENGINEERING INC.
The HAND processing was performed using the 25 m DEM for the study area acquired from the Shuttle RADAR Topography Mission (SRTM) (Farr et al., The HAND processing was performed using the 25 m DEM for the study area acquired from the Shuttle RADAR Topography Mission (SRTM) (Farr et al., 2007). The analysis was performed using the Terrain Analysis Using Digital Elevation Models (TauDEM) GIS tool suite (Tarboton, 2016). TauDEM is a set of GIS-based tools designed for large-scale hydrological analysis of topographic data. The “Vertical Drop” function within this suite allows for the calculation of HAND using a stream network and flow accumulation model as inputs.
For this study, the HAND model was used to estimate the approximate area that could be inundated in a 200-year return period flood event for all watercourses within the study area. In order to identify appropriate HAND values to associate with flood depths, the relationship between catchment area and flood depth during a 200-year return period flood was assessed. Hydrometric data from 205 Water Survey of Canada (WSC) (Environment and Climate Change Canada [ECCC], July 16, 2018) gauging stations with over 10 years of records located in southern BC were analyzed to provide a relationship between catchment area and flood depths (Figure D-8). For each gauge, a stage-discharge curve was built using readings collected between June and July. These two months were selected as the rating curves are seasonally adjusted by the WSC so a stable period to generate the rating curves was required.
The HAND mapping exercise was carried out for all waterbodies existing within the drainage network generated through TauDEM, these included rivers as well as lakes and reservoirs. The methodology for calculating the maximum 200-year flood depth did not differ based on type of waterbody (i.e., lakes, rivers and reservoirs were all treated the same way).
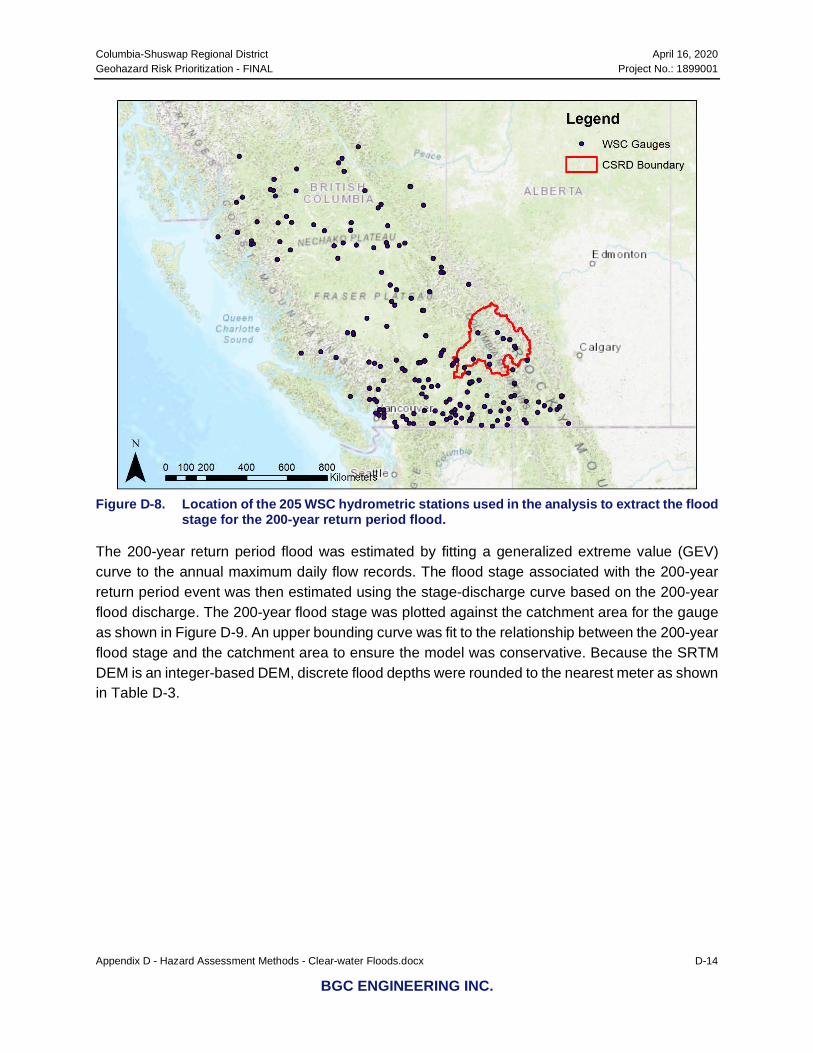
Columbia-Shuswap Regional District April 16, 2020 Geohazard Risk Prioritization - FINAL Project No.: 1899001
Appendix D - Hazard Assessment Methods - Clear-water Floods.docx D-14
BGC ENGINEERING INC.
Figure D-8. Location of the 205 WSC hydrometric stations used in the analysis to extract the flood
stage for the 200-year return period flood.
The 200-year return period flood was estimated by fitting a generalized extreme value (GEV) curve to the annual maximum daily flow records. The flood stage associated with the 200-year return period event was then estimated using the stage-discharge curve based on the 200-year flood discharge. The 200-year flood stage was plotted against the catchment area for the gauge as shown in Figure D-9. An upper bounding curve was fit to the relationship between the 200-year flood stage and the catchment area to ensure the model was conservative. Because the SRTM DEM is an integer-based DEM, discrete flood depths were rounded to the nearest meter as shown in Table D-3.

Columbia-Shuswap Regional District April 16, 2020 Geohazard Risk Prioritization - FINAL Project No.: 1899001
Appendix D - Hazard Assessment Methods - Clear-water Floods.docx D-15
BGC ENGINEERING INC.
Figure D-9. 200-year return period flood stage versus catchment area for 205 WSC hydrometric
gauging stations in southern BC. Red dots represent the curve fitted to observed values to relate catchment area to flood stage for estimating HAND flood depths.
Table D-3. Flood depths by catchment area used for estimating the 200-year flood elevations.
Catchment Area Categories Maximum Estimated Flood Depth (m) Lower Bound (km2) Upper Bound (km2)
0 40 2
40 85 3
85 180 4
180 375 5
375 785 6
785 1,650 7
1,650 3,455 8
3,455 7,250 9
>7,250 10
Columbia-Shuswap Regional District April 16, 2020 Geohazard Risk Prioritization - FINAL Project No.: 1899001
Appendix D - Hazard Assessment Methods - Clear-water Floods.docx D-16
BGC ENGINEERING INC.
Based on these results, a stream network for each catchment area group was generated and used as in input to the Vertical Drop function within TauDEM. For each HAND output (result of the Vertical Drop function), all raster cells exceeding the maximum flood depth were eliminated. All remaining cells were combined into a single raster which makes the final 200-year floodplain boundary. Figure D-7 illustrates this concept; here there are two watercourses; one with a total catchment area of 330 km2 the other 33,000 km2. The maximum HAND (based on the information in Table D-3) for the former is 5 m and 10 m for the latter.
The results from HAND mapping was compared to existing detailed floodplain mapping in the CSRD (Figure D-10). In general, HAND mapping is able to capture the extent of the flooding, and to a lesser extent the potential flood depths, suggesting that the HAND modelling results can be used as a proxy for the ‘0.5% AEP” flood extent in the absence of existing mapping. Studies comparing the HAND modelling approach to the results from hydraulic models found that it was able to produce similar inundation extents (e.g., Afshari et al., 2018; Johnson, Munasinghe, Eyelade, & Cohen, 2019).
However, the results should not be considered a specific representation of potential flood inundation and do not replace hydraulic modelling or detailed floodplain mapping. The HAND modelling is not a hydraulic model and therefore does not account for backwater effects created by obstructions in the watercourse from man-made structures (bridges, culverts) or natural constructions. The quality of the results also relies on the ability of the DEM data to capture topographic features that influence the extent of the floodplains and is typically better suited for wider floodplains.
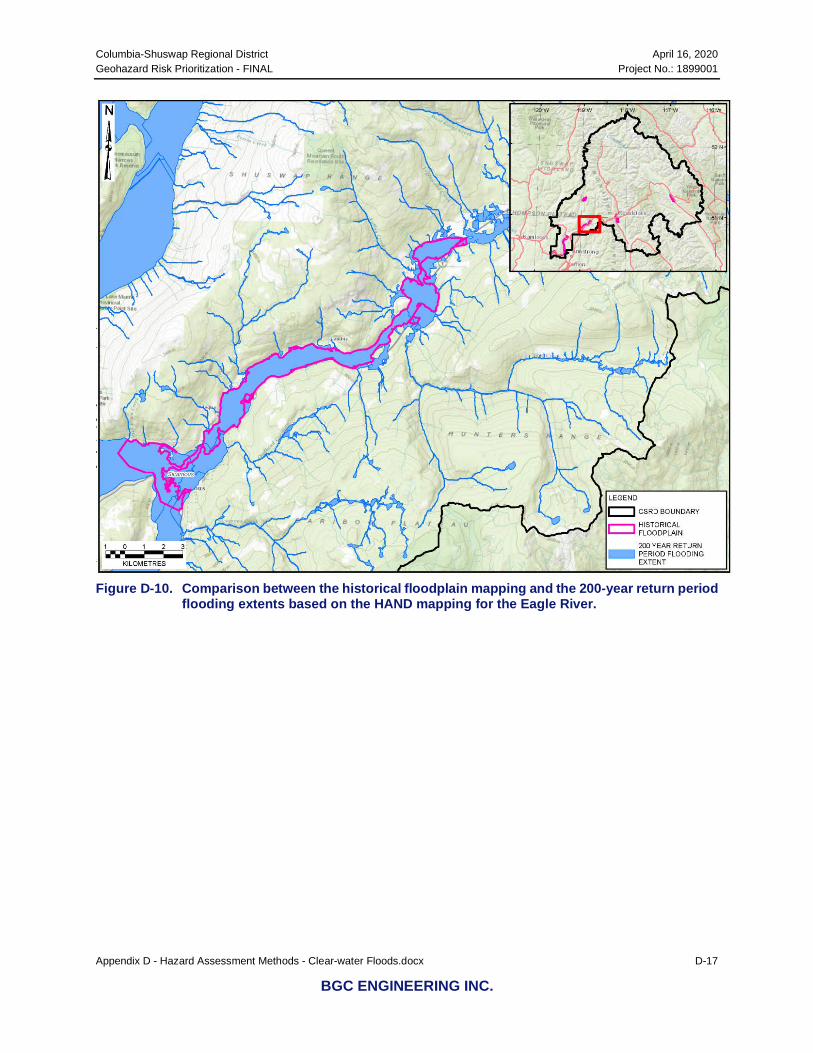
Columbia-Shuswap Regional District April 16, 2020 Geohazard Risk Prioritization - FINAL Project No.: 1899001
Appendix D - Hazard Assessment Methods - Clear-water Floods.docx D-17
BGC ENGINEERING INC.
Figure D-10. Comparison between the historical floodplain mapping and the 200-year return period
flooding extents based on the HAND mapping for the Eagle River.

Columbia-Shuswap Regional District April 16, 2020 Geohazard Risk Prioritization - FINAL Project No.: 1899001
Appendix D - Hazard Assessment Methods - Clear-water Floods.docx D-18
BGC ENGINEERING INC.
D.2.4. Additional Considerations The following sections describe additional data sources that were reviewed for the CSRD but were not incorporated into the characterization and prioritization of clear-water flood geohazard areas for the level of study.
D.2.4.1. Regulated Dams
Within the CSRD, there are currently 19 dams inventoried dams in BC that are regulated under the Water Sustainability Act, SBC 2014, c.15. Most of these dams occur on smaller watercourses within the CSRD and flows are generally unregulated. Although flow regulation due to the occurrence of dams has an impact on flood hydrology and could potentially reduce the magnitude of flood events, the impact of regulation on flows is outside the scope of this study.
Regulated dams require a water licence issued under the Act and must meet the requirements specified in the Dam Safety Regulation, BC Reg 40/2016. Six dams have a height greater than 7.5 m based on BC MFLNRO (2017a) as described in Figure D-11 and are fully regulated dams as listed in Table D-4.
Figure D-11. Dam height (m) versus dam live storage capacity (m3) as defined by the Dam Safety
Regulation, BC Reg 40/2016, which along with the dam failure consequence classification determines which portion of the Regulation applies to the dam.
BGC notes that two dams, constructed as part of BC Hydro’s Columbia River Operations (Figure D-12), influence the hydrology of the Columbia River within the CSRD and should be considered for subsequent flood studies on these waterbodies. These dams include:

Columbia-Shuswap Regional District April 16, 2020 Geohazard Risk Prioritization - FINAL Project No.: 1899001
Appendix D - Hazard Assessment Methods - Clear-water Floods.docx D-19
BGC ENGINEERING INC.
• Mica Dam, a 792 m long and 243 m high earthfill dam completed in 1973 under the 1964 Columbia River Treaty and impounds Kinbasket Reservoir
• Revelstoke Dam, a 472 m long and 175 m high concrete completed in 1984 dam located 130 km downstream of Mica Dam and impounds Revelstoke Lake (Figure D-13).
Figure D-12. Location of Mica and Revelstoke Dams in relation to other major dams in the
Columbia Region (Source: BC Hydro).
Figure D-13. Revelstoke Dam and Generating Station on the Columbia River near Revelstoke, BC (Source: BC Hydro).

Columbia-Shuswap Regional District April 16, 2020 Geohazard Risk Prioritization - FINAL Project No.: 1899001
Appendix D - Hazard Assessment Methods - Clear-water Floods.docx D-20
BGC ENGINEERING INC.
Table D-4. Summary of regulated dams with a height greater than 7.5 m in the CSRD (MFLNRO, 2017a).
Dam Name Dam Crest Information
Owner Status Waterbody Elevation (m)
Length (m)
Height (m)
Mica Dam 762 792 243 BC Hydro Active
Columbia River, Kinbasket Lake
Revelstoke Dam 582.2 472 175 BC Hydro Active
Columbia River, Revelstoke Lake
Walter Hardman Headpond Dam 704.1 385.6 12.2 BC Hydro Active Cranberry
Creek
Walter Hardman Cut-off Embankment Dam - 60 15 BC Hydro Active Cranberry
Creek
Deadman Creek Dam - 27.4 12.2 BC Hydro Active Deadman Creek
Metford (Canoe Creek East Fork) Dam - - 7.8 City of Salmon
Arm Active Canoe Creek (East Fork)
The web application displays all the inventoried dams in the CSRD (Figure D-14) to support subsequent detailed flood hazard studies within the CSRD (and should consider the potential flood hazards from high consequence dams such as the list provided in Table D-4 and Figure D-14.

Columbia-Shuswap Regional District April 16, 2020 Geohazard Risk Prioritization - FINAL Project No.: 1899001
Appendix D - Hazard Assessment Methods - Clear-water Floods.docx D-21
BGC ENGINEERING INC.
Figure D-14. Map showing the location of the dams located within the CSRD and their associated
failure consequence classification.
D.2.4.2. Dikes
Low-lying areas within river floodplains in the CSRD are often protected by dikes, though the condition of the dikes vary. A majority of the dikes are regulated by the Province of BC; however some private landowners and First Nations bands have dikes and flood protection works that are not provincially regulated. The provincial database for flood protection works includes structural works (MFLRNO, 2017b) and appurtenant structures (MFLRNO, 2017c). The database was developed through a provincial, GPS-based mapping project in 2004 and facilities shown in the database are regulated under the provincial Dike Maintenance Act, RSBC 1996, c. 95. As defined in the Act, a dike is “embankment, wall, fill, piling, pump, gate, floodbox, pipe, sluice, culvert, canal, ditch, drain, or any other thing that is constructed, assembled, or installed to prevent the flooding of land”. In addition, some dikes are considered “orphaned dikes.” These are flood protection works that are often constructed under emergency flooding conditions and are not maintained by a diking authority.
The web application displays the inventoried flood protection works in the CSRD. However, no condition assessment, ground-truthing, survey or detailed evaluation of the infrastructure was

Columbia-Shuswap Regional District April 16, 2020 Geohazard Risk Prioritization - FINAL Project No.: 1899001
Appendix D - Hazard Assessment Methods - Clear-water Floods.docx D-22
BGC ENGINEERING INC.
completed as part of the prioritization study, and the presence of such infrastructure was not accounted for in the prioritization. It is further noted that there may be additional structures not captured by the provincial database. The rationale for this approach reflects the study objective (prioritization) and level of detail of study.
D.2.4.3. Erosion Protection Structures
Riprap armouring or man-made erosion protection structures such as sheet piles are often used to protect against erosion in locations subject to riverine or coastal flooding. Although, these hard structures can provide protection from progressive channel migration and erosion, they do not eliminate the flood risk or prevent the channel from avulsing and forming a new active channel. The locations of erosion protection structures in the CSRD are not spatially inventoried for display on the web application.
D.2.4.4. Flood Conveyance Infrastructure
Although flood conveyance infrastructure such as culverts affect flood hydrology, assessment of this effect is outside the scope of this study. However, the location of culvert and road structures were included on the web application to support future detailed flood hazard studies within the CSRD. Because no single dataset exists for watercourse crossings in the CSRD, information was compiled from two MoTI databases to display on the web application including:
1. Culverts (BC MoTI, 2017a).
• Point dataset for culverts or half-round flumes less than 3 m in diameter that are used to transport or drain water under or away from a road and/or Right of Way (RoW).
• The majority of the data points are for culverts not on specific watercourses and many of the locations of culverts that are on specific watercourses do not align well with the stream network dataset described in Section B.2.1. Data on culvert parameters required for hydraulic analyses is typically not available.
2. Road Structures (BC MoTI, 2017b). • Polyline dataset for bridges, culverts (≥ 3 m), retaining walls (perpendicular height
greater than 2 m), sign bridges and tunnels/snowsheds that are located on a road and/or RoW that is owned and/or maintained by MoTI. The database includes structure names and reference numbers to the Bridge Management Information System (BMIS) but does not provide specifications for the structures.
The dataset is only for MoTI-owned infrastructure as included in the Road Features Inventory (RFI) (BC MoTI 2017c), and significant gaps exist for municipal, rail and industry-owned infrastructure.

Columbia-Shuswap Regional District April 16, 2020 Geohazard Risk Prioritization - FINAL Project No.: 1899001
Appendix D - Hazard Assessment Methods - Clear-water Floods.docx D-23
BGC ENGINEERING INC.
D.3. GEOHAZARD RATING Hazard sites were prioritized based on the relative likelihood that an event will occur, impact an element at risk and result in some level of undesirable consequence. The largest floodplain polygons in proximity to elements at risk were divided into sub-catchments and intersected with electoral boundaries where appropriate to provide a relatively consistent area for comparing ratings.
D.3.1. Hazard Likelihood Frequency analysis estimates how often geohazard events occur, on average. Frequency can be expressed either as a return period or an annual probability of occurrence. As described, floodplain maps are typically based on the designated flood as represented by the 0.5% AEP event. For consistency, the 200-year flood event likelihood was used as the basis to define approximate flood hazard extents and prioritize clear-water flood sites across the CSRD, which corresponds to a representative AEP of 0.5% or a “low” geohazard likelihood as summarized in Table D-5.
Table D-5. Annual Exceedance Probability (AEP) ranges and representative categories.
Geohazard Likelihood AEP Range (%)(1) Representative AEP Representative Return Period (years)
Very High >10% 20% 5
High >10% - <3.3% 5% 20
Moderate >3.3% - 1% 2% 50
Low >1% - <0.33% 0.5% 200
Very Low <0.33% - 0.1% 0.2% 500 Note:
1. AEP ranges are consistent with those identified in EGBC (2018).
D.3.2. Consequence Rating The main report presents a matrix used to assign consequence ratings to each hazard area based on the following two factors:
• Exposure of elements at risk to geohazards (exposure rating) • Destructive potential of uncontrolled flows that could impact elements at risk (hazard
intensity rating).
This section describes how these two factors were determined.
D.3.2.1. Hazard Exposure (Elements at Risk)
Elements at risk are things of value that could be exposed to damage or loss due to geohazard impact (geohazard exposure). This study assessed areas that both contained elements at risk and that were subject to geohazards. As such, identifying elements at risk was required to both define the areas to be assessed and to assign consequence ratings as part of risk prioritization.
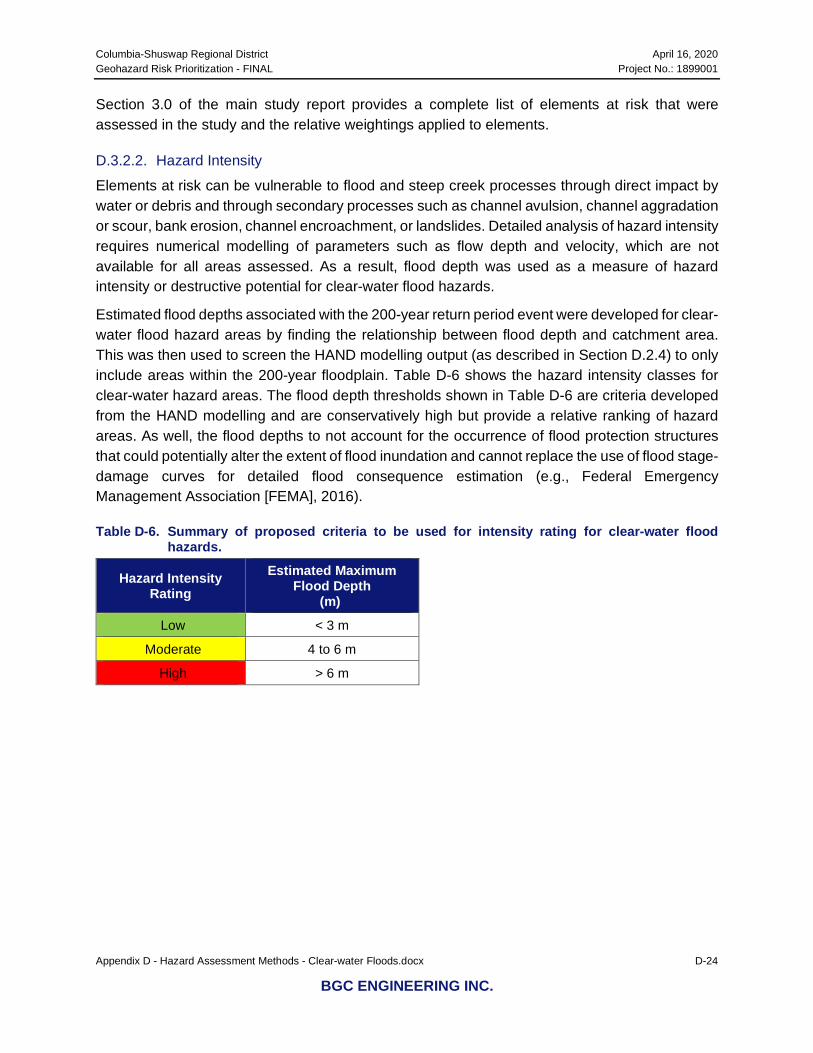
Columbia-Shuswap Regional District April 16, 2020 Geohazard Risk Prioritization - FINAL Project No.: 1899001
Appendix D - Hazard Assessment Methods - Clear-water Floods.docx D-24
BGC ENGINEERING INC.
Section 3.0 of the main study report provides a complete list of elements at risk that were assessed in the study and the relative weightings applied to elements.
D.3.2.2. Hazard Intensity
Elements at risk can be vulnerable to flood and steep creek processes through direct impact by water or debris and through secondary processes such as channel avulsion, channel aggradation or scour, bank erosion, channel encroachment, or landslides. Detailed analysis of hazard intensity requires numerical modelling of parameters such as flow depth and velocity, which are not available for all areas assessed. As a result, flood depth was used as a measure of hazard intensity or destructive potential for clear-water flood hazards.
Estimated flood depths associated with the 200-year return period event were developed for clear-water flood hazard areas by finding the relationship between flood depth and catchment area. This was then used to screen the HAND modelling output (as described in Section D.2.4) to only include areas within the 200-year floodplain. Table D-6 shows the hazard intensity classes for clear-water hazard areas. The flood depth thresholds shown in Table D-6 are criteria developed from the HAND modelling and are conservatively high but provide a relative ranking of hazard areas. As well, the flood depths to not account for the occurrence of flood protection structures that could potentially alter the extent of flood inundation and cannot replace the use of flood stage-damage curves for detailed flood consequence estimation (e.g., Federal Emergency Management Association [FEMA], 2016).
Table D-6. Summary of proposed criteria to be used for intensity rating for clear-water flood hazards.
Hazard Intensity Rating
Estimated Maximum Flood Depth
(m)
Low < 3 m
Moderate 4 to 6 m
High > 6 m
Columbia-Shuswap Regional District April 16, 2020 Geohazard Risk Prioritization - FINAL Project No.: 1899001
Appendix D - Hazard Assessment Methods - Clear-water Floods.docx D-25
BGC ENGINEERING INC.
REFERENCES
Afshari, S., Tavakoly, A.A., Rajib, M.A., Zheng, X., Follum, M.L., Omranian, E., & Fekete, B.M. (2018). Comparison of new generation low-complexity flood inundation mapping tools with a hydrodynamic model. Journal of Hydrology, 556, 539-556. https://doi.org/10.1016/j.jhydrol.2017.11.036
British Columbia Ministry of Environment. (2016). Indicators of climate change for British Columbia: 2016 update. Retrieved from https://www2.gov.bc.ca/assets/gov/environment/research-monitoring-and-reporting/reporting/envreportbc/archived-reports/climate-change/climatechangeindicators-13sept2016_final.pdf
British Columbia Ministry of Forests, Lands and Natural Resource Operations, Water Management Branch. (2016). Floodplain maps [Web page.] Retrieved from https://www2.gov.bc.ca/gov/content/environment/air-land-water/water/drought-flooding-dikes-dams/integrated-flood-hazard-management/flood-hazard-land-use-management/floodplain-mapping/floodplain-maps-by-region
British Columbia Ministry of Forests, Lands and Natural Resource Operations, Water Management Branch. (2017a). BC dams [Web page]. Retrieved from https://catalogue.data.gov.bc.ca/dataset/b-c-dams
British Columbia Ministry of Forests, Lands and Natural Resource Operations, Water Management Branch. (2017b). Flood protection works: Appurtenant structures [Dataset]. Retrieved from https://catalogue.data.gov.bc.ca/dataset/flood-protection-works-appurtenant-structures
British Columbia Ministry of Forests, Lands and Natural Resource Operations, Water Management Branch. (2017c). Flood protection works: Structural works [Dataset]. Retrieved from https://catalogue.data.gov.bc.ca/dataset/flood-protection-works-structural-works
British Columbia Ministry of Transportation and Infrastructure. (2017a). Culverts [Dataset]. Retrieved from https://catalogue.data.gov.bc.ca/dataset/ministry-of-transportation-mot-culverts
British Columbia Ministry of Transportation and Infrastructure. (2017b). Road structures [Dataset]. Retrieved from https://catalogue.data.gov.bc.ca/dataset/ministry-of-transportation-mot-road-structures
British Columbia Ministry of Transportation and Infrastructure. (2017c). Road features inventory (RFI) [Dataset]. Retrieved from https://catalogue.data.gov.bc.ca/dataset/ministry-of-transportation-mot-road-features-inventory-rfi
British Columbia Ministry of Transportation and Infrastructure. (2018, April). Historical DriveBC events [Dataset]. Retrieved from https://catalogue.data.gov.bc.ca/dataset/historical-drivebc-events

Columbia-Shuswap Regional District April 16, 2020 Geohazard Risk Prioritization - FINAL Project No.: 1899001
Appendix D - Hazard Assessment Methods - Clear-water Floods.docx D-26
BGC ENGINEERING INC.
Canadian Standards Association. (1997). Risk management: Guideline for decision-makers (CAN/CSA Q850-97 R2009). Etobicoke, ON: Author.{Updated 2009}
Dam Safety Regulation, BC Reg 40/2016.
Dike Maintenance Act, RSBC 1996, c. 95.
Engineers and Geoscientists BC. (2017). Professional practice guidelines: Flood mapping in BC. Retrieved from https://www.egbc.ca/getmedia/8748e1cf-3a80-458d-8f73-94d6460f310f/APEGBC-Guidelines-for-Flood-Mapping-in-BC.pdf.aspx
Engineers and Geoscientists BC. (2018). Professional practice guidelines: Legislated flood assessments in a changing climate in BC. Retrieved from https://www.egbc.ca/getmedia/f5c2d7e9-26ad-4cb3-b528-940b3aaa9069/Legislated-Flood-Assessments-in-BC.pdf.aspx
Environment and Climate Change Canada. (2018, July 16). HYDAT [Database]. Retrieved from https://www.canada.ca/en/environment-climate-change/services/water-overview/quantity/monitoring/survey/data-products-services/national-archive-hydat.html
Farr, T.G., Rosen, P.A., Caro, E., Crippen, R., Duren, R., Hensley, S., ... Alsdorf, D. (2007). The Shuttle Radar Topography Mission. Reviews of Geophysics, 45(2). https://doi.org/10.1029/2005RG000183
Federal Emergency Management Association (FEMA). (2016). Guidance for flood risk analysis and mapping: Automated engineering (Guidance Document 27). Retrieved from https://www.fema.gov/media-library-data/1469144112748-f3c4ecd90cb927cd200b6a3e9da80d8a/Automated_Engineering_Guidance_May_2016.pdf
Johnson, J.M., Munasinghe, D., Eyelade, D., & Cohen, S. (2019). An integrated evaluation of the National Water Model (NWM) - Height Above Nearest Drainage (HAND) flood mapping methodology. Natural Hazards and Earth Systems Sciences, 19, 2405-2420. https://doi.org/10.5194/nhess-19-2405-2019
Rennó, C.D., Nobre, A.D., Cuartas, L.A., Soares, J.V., Hodnett, M.G., Tomasella, J., & Waterloo, M.J. (2008). HAND, a new terrain descriptor using SRTM-DEM: Mapping terra-firme rainforest environments in Amazonia. Remote Sensing of Environment, 112(9), 3469-3481. https://doi.org/10.1016/j.rse.2008.03.018
Septer, D. (2007). Flooding and landslide events southern British Columbia 1808-2006. Retrieved from http://www.env.gov.bc.ca/wsd/public_safety/flood/pdfs_word/floods_landslides_south1.pdf
Tarboton, D.G. (2016). Terrain analysis using digital elevation models (TauDEM) [Web page]. Retrieved from http://hydrology.usu.edu/taudem/taudem5/index.html
Water Sustainability Act, SBC 2014, c. 15.
Columbia-Shuswap Regional District April 16, 2020 Geohazard Risk Prioritization - FINAL Project No.: 1899001
Appendix D - Hazard Assessment Methods - Clear-water Floods.docx D-27
BGC ENGINEERING INC.
Zheng, X., Tarboton, D.G., Maidment, D.R., Liu, Y.Y., & Passalacqua, P. (2018). River channel geometry and rating curve estimation using height above nearest drainage. Journal of the American Water Resources Association, 54(4), 785-806. https://doi.org/10.1111/1752-1688.12661

Columbia Shuswap Regional District April 16, 2020 Geohazard Risk Prioritization - FINAL Project No.: 1899001
BGC ENGINEERING INC.
APPENDIX E HAZARD ASSESSMENT METHODS – STEEP CREEKS

Columbia Shuswap Regional District April 16, 2020 Geohazard Risk Prioritization – FINAL Project No.: 1899001
Appendix E - Hazard Assessment Methods - Steep Creeks.docx E-1
BGC ENGINEERING INC.
E.1. INTRODUCTION
E.1.1. Objectives This appendix describes methods used by BGC to identify and characterize steep creek geohazards within the study area. This appendix is organized as follows:
• Section E.1 provides background information and key terminology on steep creek geohazards, high level introduction to climate change effects on steep creek geohazards, and the workflow used to prioritize steep creek geohazard areas.
• Section 0 describes methods and criteria used to identify steep creek geohazard areas. • Sections E.3 and E.4 describe methods and criteria used to assign geohazard and
consequence ratings, respectively.
Section 5.4 of the main report describes how geohazard and consequence ratings were used as inputs to prioritize geohazard areas. Section 6 of the main report describes how study results are delivered, including prioritized geohazard areas and supporting information.
E.1.2. What Are Steep Creek Geohazards? Steep creeks (here-in defined as having channel gradients steeper than 3°, or 5%) are typically subject to a spectrum of sediment transport processes ranging from clear-water floods to debris floods to hyper-concentrated flows to debris flows, in order of increasing sediment concentration. They can be referred to collectively as hydrogeomorphic1 processes because water and sediment (in suspension and bedload) are being transported. Depending on process and severity, hydrogeomorphic processes can cause local landscape changes.
These processes are continuous in space and time, with floods transitioning into debris floods upon exceedance of critical bed shear stress thresholds to mobilize most grains of the surface bedload layer. At high fines concentrations, hyperconcentrated flows develop. Debris flows are typically triggered by side slope landslides or progressive bulking with erodible sediment, a process observed specifically after wildfires at moderate to high burn severity. Dilution of a debris flow through partial sediment deposition on lower gradient (less than approximately <15°) channels, and tributary injection of water can lead to a transition towards hyper-concentrated flows and debris floods and eventually floods. Some steep creeks can be classified as hybrids, implying variable hydrogeomorphic processes at different return periods.
Figure E-1 summarizes the different hydrogeomorphic processes by their appearance in plan form, velocity and sediment concentration.
1 Hydrogeomorphology is an interdisciplinary science that focuses on the interaction and linkage of hydrologic
processes with landforms or earth materials and the interaction of geomorphic processes with surface and subsurface water in temporal and spatial dimensions (Sidle & Onda, 2004).
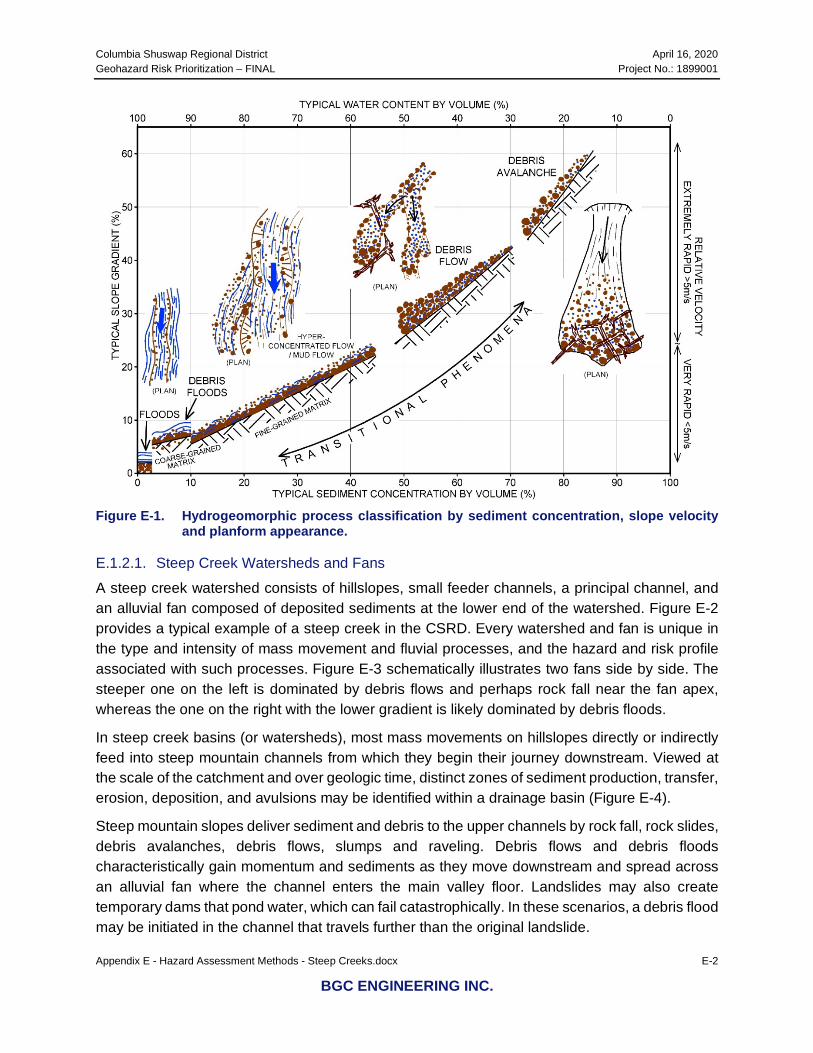
Columbia Shuswap Regional District April 16, 2020 Geohazard Risk Prioritization – FINAL Project No.: 1899001
Appendix E - Hazard Assessment Methods - Steep Creeks.docx E-2
BGC ENGINEERING INC.
Figure E-1. Hydrogeomorphic process classification by sediment concentration, slope velocity
and planform appearance.
E.1.2.1. Steep Creek Watersheds and Fans
A steep creek watershed consists of hillslopes, small feeder channels, a principal channel, and an alluvial fan composed of deposited sediments at the lower end of the watershed. Figure E-2 provides a typical example of a steep creek in the CSRD. Every watershed and fan is unique in the type and intensity of mass movement and fluvial processes, and the hazard and risk profile associated with such processes. Figure E-3 schematically illustrates two fans side by side. The steeper one on the left is dominated by debris flows and perhaps rock fall near the fan apex, whereas the one on the right with the lower gradient is likely dominated by debris floods.
In steep creek basins (or watersheds), most mass movements on hillslopes directly or indirectly feed into steep mountain channels from which they begin their journey downstream. Viewed at the scale of the catchment and over geologic time, distinct zones of sediment production, transfer, erosion, deposition, and avulsions may be identified within a drainage basin (Figure E-4).
Steep mountain slopes deliver sediment and debris to the upper channels by rock fall, rock slides, debris avalanches, debris flows, slumps and raveling. Debris flows and debris floods characteristically gain momentum and sediments as they move downstream and spread across an alluvial fan where the channel enters the main valley floor. Landslides may also create temporary dams that pond water, which can fail catastrophically. In these scenarios, a debris flood may be initiated in the channel that travels further than the original landslide.
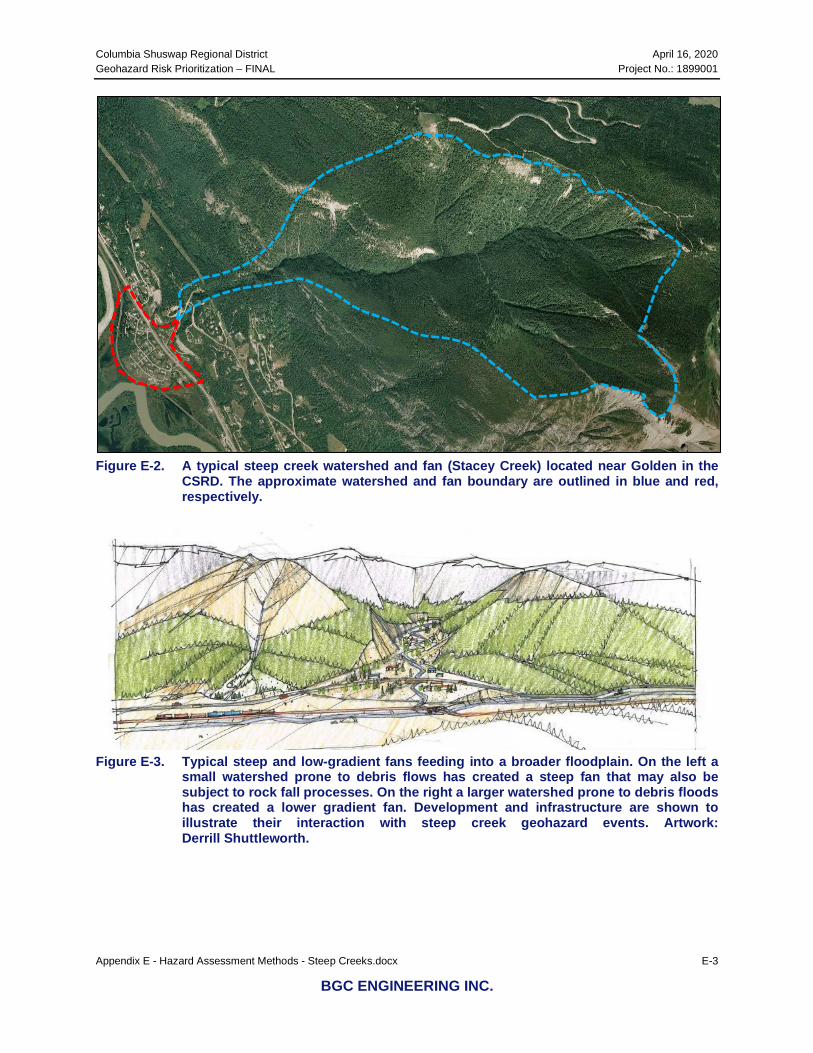
Columbia Shuswap Regional District April 16, 2020 Geohazard Risk Prioritization – FINAL Project No.: 1899001
Appendix E - Hazard Assessment Methods - Steep Creeks.docx E-3
BGC ENGINEERING INC.
Figure E-2. A typical steep creek watershed and fan (Stacey Creek) located near Golden in the
CSRD. The approximate watershed and fan boundary are outlined in blue and red, respectively.
Figure E-3. Typical steep and low-gradient fans feeding into a broader floodplain. On the left a
small watershed prone to debris flows has created a steep fan that may also be subject to rock fall processes. On the right a larger watershed prone to debris floods has created a lower gradient fan. Development and infrastructure are shown to illustrate their interaction with steep creek geohazard events. Artwork: Derrill Shuttleworth.

Columbia Shuswap Regional District April 16, 2020 Geohazard Risk Prioritization – FINAL Project No.: 1899001
Appendix E - Hazard Assessment Methods - Steep Creeks.docx E-4
BGC ENGINEERING INC.
Figure E-4. Schematic diagram of a steep creek watershed system that shows the principal zones
of distinctive processes and sediment behaviour. The alluvial fan is thought of as the long-term storage landform with a time scale of thousands to tens of thousands of years. Sketch developed by BGC from concepts produced by Schumm (1977), Montgomery & Buffington (1997), and Church (2013).
The alluvial fan represents a mostly depositional landform at the outlet of a steep creek watershed. Alluvial fans are dynamic and potentially very dangerous (hazardous) landforms that represent the approximate extent of past and future hydrogeomorphic processes. This landform is more correctly called a colluvial fan when formed by debris flows because debris flows are classified as a landslide process, and an alluvial fan when formed by clear-water floods (those which do not
Columbia Shuswap Regional District April 16, 2020 Geohazard Risk Prioritization – FINAL Project No.: 1899001
Appendix E - Hazard Assessment Methods - Steep Creeks.docx E-5
BGC ENGINEERING INC.
carry substantial bedload or suspended load) or debris floods. For simplicity the term alluvial fan is used herein irrespective of geohazard type. “Classic” alluvial fans are roughly triangular in planform, but most fans have irregular shapes influenced by the surrounding topography. Redistribution of sediments from the upper steeper fan to the lower flatter fan, primarily through bank erosion and channel scour, is common. Identification of the inflection point, that is where erosion switches to deposition, is important for assessments of proposed or existing buried linear infrastructure (Lau, 2017).
Stream channels on the fan are prone to avulsions, which are rapid changes in channel location, due to natural cycles in alluvial fan development and from the loss of channel confinement during hydrogeomorphic events (e.g., Kellerhals & Church, 1990; van Dijk et al., 2009; 2012; de Haas et al, 2017). If the alluvial fan is formed on the margin of a still water body (lake, reservoir, ocean), the alluvial fan is termed a fan-delta. These landforms differ from alluvial fans in that sediment deposition at the margin of the landform occurs in still water, which invites in-channel sediment aggradation due to a pronounced morphodynamic backwater effect. This can increase the frequency and possibly severity of avulsions (van Dijk et al., 2009; 2012).
The term “paleofan” is used to describe portions of fans interpreted as no longer active (under present climate and geomorphic/geological setting) and entirely removed from the channel processes described previously (i.e., with negligible potential for channel avulsion and flow propagation) due to deep channel incision (Kellerhals & Church, 1990). Paleofans were not included in the fan inventory.
E.1.2.2. Debris Flows
‘Debris flow’, as defined by Hungr et al. (2014), is a very rapid, channelized flow of saturated debris containing fine grained sediment (i.e., sand and finer fractions) with a plasticity index of less than 5%. Debris flows originate from a single or distributed source area(s) from sediment mobilized by the influx of ground or surface water. Liquefaction occurs shortly after the onset of landsliding due to turbulent mixing of water and sediment, and the slurry begins to flow downstream. Post-fire debris flows are a special case where the lack of vegetation and root strength can lead to abundant rilling and gullying that deliver sediment to the main channel where mixing leads to the formation of debris flows. In those cases, no single source or sudden liquefaction is required to initiate or maintain debris-flow mechanics.
Sediment bulking is the process by which rapidly flowing water entrains bed and bank materials either through erosion or preferential “plucking” until sediment saturation is reached (often at 60-70% sediment concentration by volume). At this time, further sediment entrainment may still occur through bank undercutting and transitional deposition of debris, with a zero-net change in sediment concentration. Bulking may be limited to partial channel substrate mobilization of the top gravel layer, or – in the case of debris flows – may entail entrainment of the entire loose channel debris. Scour to bedrock in the transport zone is expected in the latter case.
Unlike debris avalanches, which travel on unconfined slopes, debris flows travel in confined channels bordered by steep slopes. In confined channels, the flow volume, peak discharge, and
Columbia Shuswap Regional District April 16, 2020 Geohazard Risk Prioritization – FINAL Project No.: 1899001
Appendix E - Hazard Assessment Methods - Steep Creeks.docx E-6
BGC ENGINEERING INC.
flow depth increase, and the debris becomes sorted along the flow path. Debris-flow physics are highly complex and video recordings of events in progress have demonstrated that no unique rheology can describe the range of observed mechanical behaviour (Iverson, 1997). Flow velocities typically range from 1 to 10 m/s, although very large debris flows from volcanic edifices, often containing substantial fines, can travel at more than 20 m/s along much of their path (Major et al., 2005). The front of the rapidly advancing flow is steep and commonly followed by several secondary surges that form due to particle segregation and upwards or outwards migration of boulders. Hence, one of the distinguishing characteristics of coarse granular debris flows is vertical inverse grading, in which larger particles are concentrated at the top of the deposit. This characteristic behaviour leads to the formation of lateral levees along the channel that become part of the debris-flow depositional legacy. Similarly, depositional lobes are formed where frictional resistance from unsaturated coarse-grained or large organic debris-rich fronts is high enough to slow and eventually stop the motion of the trailing liquefied debris. Debris-flow deposits remain saturated for some time after deposition but become rigid once seepage and desiccation have removed pore water.
Coarse granular debris flows require a channel gradient of at least 27% (15o) for transport over significant distances (Takahashi, 1991) and have volumetric sediment concentrations in excess of 50%. Between the main surges a fluid slurry with a hyperconcentration (>10%) of suspended fines occurs. Transport is possible at gradients as low as 20% (11o)2, although some type of momentum transfer from side-slope landslides is needed to sustain flow on those slopes. Debris flows may continue to run out onto lower gradients even as they lose momentum and drain: the higher the fine grained (especially clay) sediment content, and hence the slower the sediment-water mixture will lose its pore water, the lower the ultimate stopping angle. The clay fraction is the most important textural control on debris-flow mobility. The surface gradient of a debris-flow fan approximates the stopping angle for flows issuing from the drainage basin.
Due to their high flow velocities, peak discharges during debris flows are at least an order of magnitude larger than those of comparable return period floods and can be 50 times larger or more (Jakob & Jordan, 2001; Jakob et al., 2016). Channel banks can be severely eroded during debris flows, although lateral erosion is often associated with the trailing hyperconcentrated flow phase that is characterized by lower volumetric sediment concentrations. The most severe damage results from direct impact of large clasts or coarse woody debris against structures that are not designed for the impact forces. Even where the supporting walls of buildings may be able to withstand the loads associated with debris flows, building windows and doors are crushed and debris may enter the building, leading to extensive damage to the interior of the structure (Jakob et al., 2012). Similarly, linear infrastructure such as roads and railways are subject to complete destruction. On medial and distal fan sections (the lower 1/3 to 2/3), debris flows tend to deposit their sediment rather than scour. Therefore, exposure or rupture of buried infrastructure such as telecommunication lines or pipelines is rare. However, if a linear infrastructure is buried in the proximal fan portions that undergoes cycles of incision and infill, or in a recent debris deposit, it
2 For volcanic debris-flows, transport can occur at even lower gradients.

Columbia Shuswap Regional District April 16, 2020 Geohazard Risk Prioritization – FINAL Project No.: 1899001
Appendix E - Hazard Assessment Methods - Steep Creeks.docx E-7
BGC ENGINEERING INC.
is likely that over time or during a significant runoff event, the tractive forces of water will erode through the debris until an equilibrium slope is achieved, and the infrastructure thereby becomes exposed or may rupture due to boulder impact or abrasion. This necessitates understanding the geomorphic state of the fans being traversed by a buried linear infrastructure.
Avulsions are likely in poorly confined channel sections and on the outside of channel bends where debris flows tend to superelevate. Sudden loss of confinement and decrease in channel slope cause debris flows to decelerate, drain their inter-granular water, and increase shearing resistance, which slow the advancing bouldery front and block the channel. The more fluid afterflow (hyperconcentrated flow) is then often deflected by the slowing front, leading to secondary avulsions and the creation of distributary channels on the fan. Because debris flows often display surging behaviour, in which bouldery fronts alternate with hyperconcentrated afterflows, the cycle of coarse bouldery lobe and levee formation and afterflow deflection can be repeated several times during a single event. These flow aberrations and varying rheological characteristics pose a challenge to numerical modelers seeking to create an equivalent fluid (Iverson, 2014).
E.1.2.3. Debris Floods
Within the past thirty years the term ‘debris flood’ has come into use to describe severe floods involving exceptionally high rates of transport of coarse sediments, usually occurring in steep channels. It is favoured by geotechnical engineers and engineering geomorphologists who share responsibility to protect civil society and its infrastructure from such events. A recent authoritative review of landslide-like phenomena defines debris flood as “very rapid flow of water, heavily charged with debris, in a steep channel. Peak discharge is comparable to that of a water flood.” (Hungr et al., 2014: p.185). The text continues: “the stream bed may be destabilized causing massive movement of sediment. Such sediment movement (sometimes referred to as “live bed” or “carpet flow” by hydraulicians) can reach transport rates far exceeding normal bed load movement through rolling and saltation. However, the movement still relies on the tractive forces of water.” (ibid.) Accordingly, debris floods represent flood flows with high transport of gravel to boulder size material.
Bedload transport in gravel-bed channels has been characterized in three stages (Carling, 1988; Ashworth & Ferguson, 1989). In stage 1, fine material – typically sand – overpasses a static bed or is mobilized by winnowing from an otherwise static bed. The force of the flowing water is insufficient to mobilize the local bed material. In stage 2, local bed material is entrained and redeposited at low rates. Individual clasts are mobilized from the bed surface independently of other entraining events (except when movement of a relatively large clast liberates much finer material that was lying in its shadow). Most of the bed remains stable. In stage 3, the entire bed becomes mobile and activity may extend to a depth of two or three median grain sizes below the surface as the result of momentum transfer by grain-grain collisions. A debris flood is specifically a case of stage 3 transport.
Columbia Shuswap Regional District April 16, 2020 Geohazard Risk Prioritization – FINAL Project No.: 1899001
Appendix E - Hazard Assessment Methods - Steep Creeks.docx E-8
BGC ENGINEERING INC.
Debris floods are rare because stage 3 transport is rare in gravel-bed channels. In such channels, where bed and banks are constituted of similar material, the banks are more readily eroded than the bed so that the channel widens, with consequent reduction in flow depths, until it is just able to transport the incoming bed material load at rates near the threshold for transport (Parker, 1978). Steep mountain channels in which the width remains limited because the banks consist of rock or other non-erodible material are prone to debris-flood occurrence. Similarly, large and relatively steep channels carrying extraordinary floods (100-year return period or greater) are prone to debris-flood occurrence. Such floods are distinctly two-phase flows, with ‘clear water’ or water with a substantial suspended sediment load, overlying a slurry-like flow containing a high concentration of bed material, the finest fractions of which may be episodically suspended.
Debris floods typically occur on creeks with channel gradients between 5 and 30% (3 and 17o) but can also occur on lower gradient gravel bed rivers. Due to their initially relatively low sediment concentration, debris floods can be more erosive along low-gradient alluvial channel banks than debris flows. Bank erosion and excessive amounts of bedload introduce large amounts of sediment to the fan where they accumulate (aggrade) in channel sections with decreased slope. Debris floods can also be initiated on the fan itself through rapid bed erosion and entrainment of bank materials, as long as the stream power is high enough to transport clasts larger than the D50. Because typical long-duration storm hydrographs fluctuate several times over the course of the storm, several cycles of aggradation and remobilization of deposited sediments on channel and fan reaches can be expected during the same event (Jakob et al., 2016). Similarly, debris floods triggered by outbreak floods may lead to single or multiple surges irrespective of hydrograph fluctuations that can lead to cycles of bank erosion, scour and infill. This is important for interpretations of field observations as only the final deposition or scour can be measured. This is of particular relevance where a pipeline or telecommunication line is to be buried. Maximum scour during a debris flood may be much deeper than what is viewed and measured during a field visit.
Church and Jakob (2020) developed a three-fold typology for debris floods. This is summarized in Table E-1 and is still being developed. Identifying the correct debris-flood type is key in preparing for numerical modeling and hazard assessments. Type 2 is the typical debris-flood type referred to in this prioritization study. Type 1 is considered in clear-water flood on fan process described in Section E.1.2.4, due to similar regional scale characteristics. Type 3 is considered in the landslide dam outbreak flood (LDOF) parameter presented in Section E.3.2.5.
Hyperconcentrated flows are a special case of debris floods that are typical for volcanic sources areas or fine-grained sedimentary rocks. They can occur as Type 1, 2 or 3 debris floods. The term “hyperconcentrated flow” was defined by Pierson (2005a) on the basis of sediment concentration as “a type of two-phase, non-Newtonian flow of sediment and water that operates between normal streamflow (water flow) and debris flow (or mudflow)”. The use of the term “hyperconcentrated flow” should be reserved for volcanic or weak sedimentary fine-grained slurries.

Columbia Shuswap Regional District April 16, 2020 Geohazard Risk Prioritization – FINAL Project No.: 1899001
Appendix E - Hazard Assessment Methods - Steep Creeks.docx E-9
BGC ENGINEERING INC.
Table E-1. Debris-flood classification based on Church and Jakob (2020).
Term Definition Typical
sediment concentration by volume (%)
Typical Qmax factor
compared to calc. clear-water
Physical Characteristics Typical impacts Typical
return period range
(years)
Type 1 Rainfall/snowmelt generated through exceedance of critical shear stress threshold when more than 1SD of the surface bed grains are being mobilized. While not a fixed threshold, the 1SD bed surface grains are a reasonable proxy for major channel shifts.
< 5 1.02 to 1.2 (depending on the proximity of major debris sources to the fan apex as well as organic debris loading)
Steep fans (1 to 10%), shallow but wide active floodplain widespread boulder carpets, clast to matrix-supported sediment facies, subrounded to rounded stones, some imbrication, disturbed riparian vegetation, frequent fan avulsions
Widespread bank instability, avulsions, alternating reaches of bed aggradation and degradation, blocked culverts, scoured bridge abutments, damaged buried infrastructure particularly in channel reaches u/s of fans
>10
Type 2 Transitional as a consequence of debris flows. Substantially higher sediment concentration compared to a Type 1 debris flood and accordingly greater facility to transport larger volumes of sediment. All grain calibers mobilized, except from lag deposits (big glacial or rock fall boulders)
< 50 2-5 (but possibly larger at the transition zone) but depending highly on the proximity to the fan apex.
As for Type 1 but rarely clast-supported and with higher matrix sediment concentration. Stones subangular to angular, boulder carpets on fans often display sharp edges
Widespread bank instability, avulsions, substantial bed aggradation particularly on fans, blocked culverts, scoured bridge abutments, damaged buried infrastructure on fans
>50
Type 3 Outbreak flood in channels with insufficient steepness for debris-flow generation. Critical shear stress for debris-flood initiation exceeded abruptly due to sharp hydrograph associated with the outbreak flood. All Ds mobilized in channel bed and non-cohesive banks
< 10 (except immediately downstream of the outbreak)
up to 100 depending on size of dam and distance to dam failure, Qmax should be calculated by combination of dam breach analyses and flood routing
Presence or deduction of landforms that could lead to eventual outbreak floods, Watershed channel reaches with distinct trimlines in case of past events. pronounced superelevation in channel bends, even aged vegetation on large segments of the fan, high fines content in matrix, sometimes inverse grading
Vast bank erosion, avulsions, substantial bed degradation along channels and aggradation on fans, destroyed culverts, outflanked or overwhelmed bridges, damaged buried infrastructure on channels and fans
>100 (can be singular
events in the case of a
moraine dam or glacial breach)
Columbia Shuswap Regional District April 16, 2020 Geohazard Risk Prioritization – FINAL Project No.: 1899001
Appendix E - Hazard Assessment Methods - Steep Creeks.docx E-10
BGC ENGINEERING INC.
E.1.2.4. Clear-water Floods on Alluvial Fans
Clear-water floods are defined in Appendix D as “riverine and lake flooding resulting from inundation due to an excess of clear-water discharge in a watercourse or body of water such that land outside the natural or artificial banks which is not normally under water is submerged”. In Appendix D, clear-water flood hazard is estimated based on: historical and 3rd-party floodplain maps, historical events, existing hydraulic studies, and HAND (Height Above Nearest Drainage) modeling. Further information on clear-water floods and the methodology used for prioritization are provided in Appendix D.
Clear-water floods on alluvial fans are treated separately in this study to account for avulsion potential, which is controlled by similar parameters as for steep creek geohazards. These parameters include evidence for previous avulsion, avulsion mechanism and LDOFs, and they are discussed in Section E.3.2.
E.1.3. Climate Change
E.1.3.1. Background
Climate change is expected to impact steep creek geohazards both directly and indirectly through complex feedback mechanisms. Given that hydrological and mass movement processes are higher order effects of air temperature increases, their prediction is highly complex and often site-specific.
Regional climate change projections indicate that there will be an increase in winter rainfall, decrease in winter snowfall (PCIC, 2012), an increase in the hourly intensity of extreme rainfall and increase in frequency of events (Prein et al., 2017). Changes to short duration (one hour and less) rainfall intensities are particularly relevant for post-fire situations in debris-flow generating watersheds. Within the year to a few years after a wildfire affecting large portions of a given watershed, short duration and high intensity rainfall events are much more likely to trigger debris flows or debris floods, than prior to a wildfire event.
Steep creek basins can be generally categorized as being either: • Supply-limited: meaning that debris available for transport is a limiting factor on the
magnitude and frequency of steep creek events. In other words, once debris in the source zone and transport zone has been depleted by a debris flow or debris flood, another event even with the same hydro-climatic trigger will be of lesser magnitude.
• Supply-unlimited: meaning that debris available for transport is not a limiting factor on the magnitude and frequency of steep creek events, and another factor (such as precipitation frequency/magnitude) is the limiting factor. In other words, there is always an abundance of debris along a channel and in source areas so that whenever a critical hydro-climatic threshold is exceeded, an event will occur. The more severe the hydro-climatic event, the higher the resulting magnitude of the debris flow or debris flood.
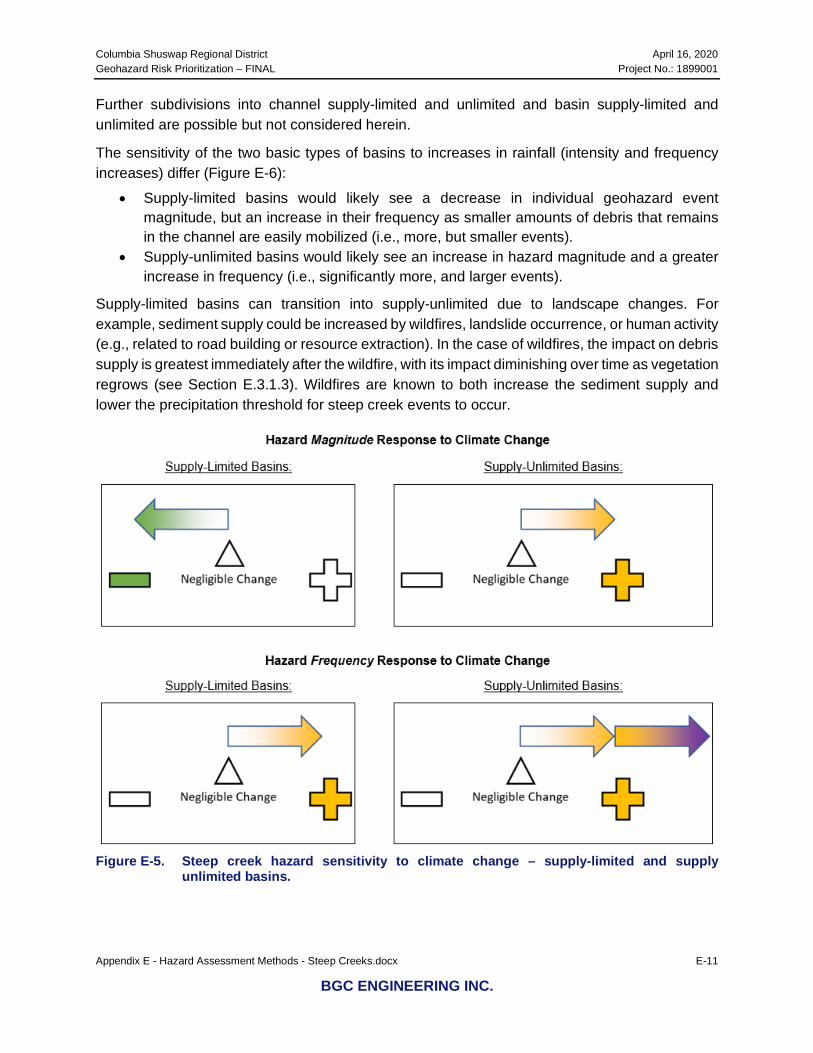
Columbia Shuswap Regional District April 16, 2020 Geohazard Risk Prioritization – FINAL Project No.: 1899001
Appendix E - Hazard Assessment Methods - Steep Creeks.docx E-11
BGC ENGINEERING INC.
Further subdivisions into channel supply-limited and unlimited and basin supply-limited and unlimited are possible but not considered herein.
The sensitivity of the two basic types of basins to increases in rainfall (intensity and frequency increases) differ (Figure E-6):
• Supply-limited basins would likely see a decrease in individual geohazard event magnitude, but an increase in their frequency as smaller amounts of debris that remains in the channel are easily mobilized (i.e., more, but smaller events).
• Supply-unlimited basins would likely see an increase in hazard magnitude and a greater increase in frequency (i.e., significantly more, and larger events).
Supply-limited basins can transition into supply-unlimited due to landscape changes. For example, sediment supply could be increased by wildfires, landslide occurrence, or human activity (e.g., related to road building or resource extraction). In the case of wildfires, the impact on debris supply is greatest immediately after the wildfire, with its impact diminishing over time as vegetation regrows (see Section E.3.1.3). Wildfires are known to both increase the sediment supply and lower the precipitation threshold for steep creek events to occur.
Figure E-5. Steep creek hazard sensitivity to climate change – supply-limited and supply
unlimited basins.

Columbia Shuswap Regional District April 16, 2020 Geohazard Risk Prioritization – FINAL Project No.: 1899001
Appendix E - Hazard Assessment Methods - Steep Creeks.docx E-12
BGC ENGINEERING INC.
E.1.3.2. Climate Change Adjustment in Steep Creek Geohazard Assessment
Planning decisions based on hazard maps can have implications for half a century or longer. As such, climate change is considered in steep creek hazard characterization by applying climate change adjusted estimates of peak discharge as inputs for hazard intensity ratings (Section E.4.1). Adjustment of the geohazard likelihood ratings that consider the ‘sensitivity’ of geomorphic activity in a watershed to climate change is not applied in the current prioritization study, because the adjustment would be applied to all geohazard areas, and therefore would not have any effect on the relative prioritization.
E.1.4. Workflow The workflow for the steep creek geohazard assessment and risk prioritization includes three main phases: hazard identification, geohazard rating, and consequence rating. Figure E-7 summarizes the parameters used in each phase. The methods and criteria used to estimate each parameters are detailed in Sections E.2, E.3 and E.4.

Columbia Shuswap Regional District April 16, 2020 Geohazard Risk Prioritization – FINAL Project No.: 1899001
Appendix E - Hazard Assessment Methods - Steep Creeks.docx E-13
BGC ENGINEERING INC.
Figure E-6. Workflow for steep creek geohazard assessment and risk prioritization.

Columbia Shuswap Regional District April 16, 2020 Geohazard Risk Prioritization – FINAL Project No.: 1899001
Appendix E - Hazard Assessment Methods - Steep Creeks.docx E-14
BGC ENGINEERING INC.
E.2. STEEP CREEK GEOHAZARD IDENTIFICATION Steep creek geohazard identification for the CSRD focused on the delineation of alluvial fans, as these are the landforms commonly occupied by elements at risk (see Main Report Section 1.4). The boundaries of alluvial fans define the steep creek geohazard areas prioritized in this study. Watersheds upstream of each mapped fan were assessed to identify geohazard processes and determine geohazard ratings but were not mapped. The streams of the entire CSRD were delineated, classified and used for both susceptibility modeling (impact likelihood rating, in Section E.3.2) and peak discharge estimation (intensity rating, in Section E.4).
E.2.1. Fan Inventory Fan extents were manually delineated in an ESRI ArcGIS Online web map based on a review of previous mapping (e.g., Klohn Crippen, 1998; EBA Engineering Inc., 1998; EBA Engineering Inc., 2001; Terratech Consulting Ltd. 1999; Tetra Tech EBA, 2014; BGC, March 31, 2019; Ministry of Environment and Climate Change Strategy, 2016), and from hillshade images built from the limited coverage of lidar Digital Elevation Models (DEM). At sites where lidar DEMs were not available (e.g., the majority of Electoral Areas A and B), low resolution (approximately 25 m)3 Canadian Digital Elevation Model (CDEM) terrain models, air photos, and satellite imagery available within ArcGIS and Google Earth were used for terrain interpretation. A total of 450 developed fans were mapped within the CSRD.
The accuracy of each fan’s boundary and hazard rating depends, in part, on the resolution of the available terrain data. Lidar DEMs, where available, provide 1 m or better resolution (e.g., Figure E-8). Mapped fan boundaries, even where lidar coverage is available, are approximate, but are less certain where lidar coverage was not available. For areas without lidar coverage, the minimum fan size and characteristics that can be mapped at regional scale with the available information is about 2 ha. Local variations in terrain conditions over areas of 1 to 3 ha, or over distances of less than about 200 m, may not be visible. Specific site investigations could alter the locations of the fan boundaries mapped by BGC.
While the presence of a fan indicates past geohazard occurrence, the lack of a fan on a steep creek does not necessarily rule out the potential for future geohazard occurrence. As such, the fan inventory completed in this study should not be considered exhaustive. In addition, in some cases, BGC does not rule out the potential for steep creek geohazards to extend beyond the limit of the mapped fan boundary. The fan boundary approximates the extent of sediment deposition since the beginning of fan formation4. Geohazards can potentially extend beyond the fan boundary due to localized flooding, where the fan is truncated by a lake or river, in young landscapes where fans are actively forming (e.g., recently deglaciated areas) or where large landslides (e.g., rock avalanches) trigger steep creek events larger than any previously occurring.
3 CDEM resolution varies according to geographic location. The base resolution is 0.75 arc second along a profile in
the south-north direction and varies from 0.75 to 3 arc seconds in the east-west direction, depending on location. In the CSRD, this corresponds to approximately 25 m grid cell resolution (Government of Canada, 2016).
4 Most of the alluvial fans mapped in this study represent the accumulation of sediment over the Holocene period (since about 11,000 years BP).

Columbia Shuswap Regional District April 16, 2020 Geohazard Risk Prioritization – FINAL Project No.: 1899001
Appendix E - Hazard Assessment Methods - Steep Creeks.docx E-15
BGC ENGINEERING INC.
Section E.3.2.2 describes steep creek hazard susceptibility modelling that was applied on every watercourse classed as potentially subject to debris floods or debris flows, including those without mapped fans. Areas modelled as potentially susceptible to steep creek geohazards, but that do not contain a mapped fan, are shown on Cambio for reference but are not otherwise characterized or prioritized.
Figure E-7. Example of lidar hillshade showing alluvial fans along East Canoe Creek just east of
Salmon Arm. lidar DEM provided by NDMP.
E.2.2. Stream Network The streams of the entire CSRD were extracted from BGC’s River Network Tools (RNTTM). RNT is a web-based application developed by BGC for analysis of hydrotechnical geohazards associated with rivers and streams. The basis for RNT is a digital stream network that is used to evaluate catchment hydrology, including delineating catchment areas and analyzing flood

Columbia Shuswap Regional District April 16, 2020 Geohazard Risk Prioritization – FINAL Project No.: 1899001
Appendix E - Hazard Assessment Methods - Steep Creeks.docx E-16
BGC ENGINEERING INC.
frequencies over large geographical areas. RNT incorporates hydrographic data with national coverage from Natural Resources Canada’s (NRCan’s) National Hydro Network (NHN) at a resolution of 1:50,000 (NRCan, January 25, 2016). The publicly available stream network is enhanced by algorithms within the RNT database to ensure the proper connectivity of the stream segments even through complex braided sections. Modifications to the stream network within the RNT are made as necessary based on review of satellite imagery (e.g., Google EarthTM) at approximately 1:10,000 scale.
In the RNT, the stream network is represented as a series of individual segments that includes hydraulic information such as:
• A water flow direction • The upstream and downstream stream segment connections • A local upstream catchment area for each stream segment (used to calculate total
catchment area) • A Strahler stream order classification (Strahler, 1952) • A local channel gradient, which is determined using a topographic dataset to assess the
elevation differential between the upstream and downstream limit of the segment.
Strahler stream order is used to classify stream segments by its branching complexity within a drainage system and is an indication of the significance in size and water conveying capacity at points along a river (Strahler, 1952). Strahler order 4 and higher streams are typically larger streams and rivers (e.g., Adams River), while Strahler order 3 and lower streams are typically smaller, headwater streams (e.g., Stephen Creek). An illustration of Strahler stream order classification is shown in Figure E-9 and described conceptually for the CSRD in Table E-2.
BGC supplements these data with 1:50,000-scale CanVec digital watercourse linework to represent lakes and reservoirs and 1:20,000 scale GeoBase digital elevation models (DEMs; NRCan, January 25, 2016) to generate catchment areas and a local stream gradient for each segment in RNT. Dam locations are represented using the inventory provided by the BC Ministry of Forests, Lands and Natural Resource Operations (MFLNRO, 2017a).

Columbia Shuswap Regional District April 16, 2020 Geohazard Risk Prioritization – FINAL Project No.: 1899001
Appendix E - Hazard Assessment Methods - Steep Creeks.docx E-17
BGC ENGINEERING INC.
Figure E-8. Illustration showing Strahler stream order (Montgomery, 1990).
Table E-2. Strahler order summary for the CSRD stream network.
Strahler Order Description
% of CSRD Stream
Segments CSRD Examples
1 – 3 Small, headwater streams generally on steeper slopes and typically subject to steep-creek processes (debris floods/ flows). Channel may be dry for a portion of the year. They are tributaries to larger streams and are typically unnamed.
85 Stephen Creek, Carbonate Creek, Sicamous Creek, Hummingbird Creek
4 – 6 Medium stream or river. Generally, less steep and lower flow velocity than headwater streams.
14 Horse Creek, Canyon Creek, Adams River, Scotch Creek
7+ Large river. Larger volumes of runoff and potentially debris conveyed then from smaller waterways.
1 Columbia River
E.2.3. Geohazard Process Type Identification BGC used terrain interpretations and morphometric statistics to assign each creek as “dominantly” subject to debris flows, debris floods or clear-water floods. The morphometric statistical approach was applied to every stream segment in the entire study area, including both developed and undeveloped areas. For the mapped geohazard areas, the morphometric statistical approach was considered alongside terrain interpretations. The term “dominant” refers to the process type that primarily controlled hazard assessment methodology and ratings. Recognizing that there is a continuum between clear-water floods and debris flows, BGC notes the following assumptions:

Columbia Shuswap Regional District April 16, 2020 Geohazard Risk Prioritization – FINAL Project No.: 1899001
Appendix E - Hazard Assessment Methods - Steep Creeks.docx E-18
BGC ENGINEERING INC.
• Fans classified as subject to debris flows may also be subject to floods and debris floods at lower return periods (debris flows may transition to watery afterflows in the lower runout zone and after the main debris surge).
• Fans classified as subject to debris floods may be subject to clear-water floods, but generally not to debris flows.
• Fans classified as subject to clear-water flood are dominated by clear-water floods.
E.2.3.1. Morphometric Statistics
BGC applied the following morphometric statistical approach to predict steep creek process type for all segments of every mapped creek within the study area:
1. Collect statistics on Melton Ratio5 and watershed length6 for each segment of each creek. These terrain factors are a good screening level indicator of the propensity of a creek to dominantly produce floods, debris floods or debris flow (Holm et al., 2016).
2. Apply class boundaries to predict process types for all stream segments in the study area, regardless of whether they intersect fans.
Figure E-10 plots the study area creeks with respect to Melton Ratio and watershed length7. Although there is overlap, creeks with the highest Melton ratio and shortest watershed stream length are mostly prone to debris flows, and those with the lowest Melton ratio and longest watershed stream lengths are mostly prone to clear-water floods. Debris floods fall between these types. Table E-3 lists class boundaries used to define process types on each segment of each creek within the CSRD, based on recommendations from previous studies in BC (Holm et al., 2016).
5 Melton ratio is watershed relief divided by the square root of watershed area (Melton, 1957). 6 Stream network length is the total channel length upstream of a given stream segment to the stream segment
farthest from the fan apex. 7 The process type shown in the figure represents the process at the location of the fan apex. Many creeks subject
to debris-floods are also subject to debris-flows on steeper creeks higher in the basin.
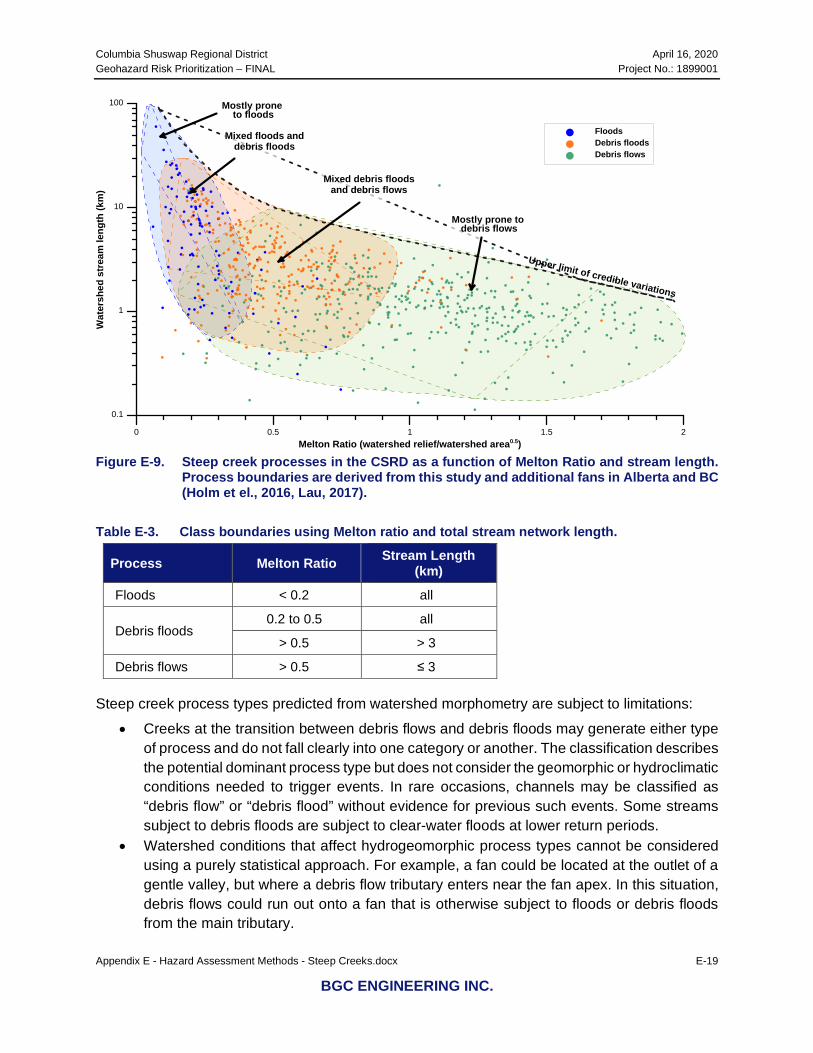
Columbia Shuswap Regional District April 16, 2020 Geohazard Risk Prioritization – FINAL Project No.: 1899001
Appendix E - Hazard Assessment Methods - Steep Creeks.docx E-19
BGC ENGINEERING INC.
Figure E-9. Steep creek processes in the CSRD as a function of Melton Ratio and stream length.
Process boundaries are derived from this study and additional fans in Alberta and BC (Holm et el., 2016, Lau, 2017).
Table E-3. Class boundaries using Melton ratio and total stream network length.
Process Melton Ratio Stream Length (km)
Floods < 0.2 all
Debris floods 0.2 to 0.5 all
> 0.5 > 3
Debris flows > 0.5 ≤ 3
Steep creek process types predicted from watershed morphometry are subject to limitations:
• Creeks at the transition between debris flows and debris floods may generate either type of process and do not fall clearly into one category or another. The classification describes the potential dominant process type but does not consider the geomorphic or hydroclimatic conditions needed to trigger events. In rare occasions, channels may be classified as “debris flow” or “debris flood” without evidence for previous such events. Some streams subject to debris floods are subject to clear-water floods at lower return periods.
• Watershed conditions that affect hydrogeomorphic process types cannot be considered using a purely statistical approach. For example, a fan could be located at the outlet of a gentle valley, but where a debris flow tributary enters near the fan apex. In this situation, debris flows could run out onto a fan that is otherwise subject to floods or debris floods from the main tributary.
0 0.5 1 1.5 2Melton Ratio (watershed relief/watershed area0.5)
0.1
1
10
100W
ater
shed
str
eam
leng
th (k
m)
FloodsDebris floodsDebris flows
Mostly prone to debris flows
Mostly prone to floods
Upper limit of credible variations
Mixed floods anddebris floods
Mixed debris floodsand debris flows

Columbia Shuswap Regional District April 16, 2020 Geohazard Risk Prioritization – FINAL Project No.: 1899001
Appendix E - Hazard Assessment Methods - Steep Creeks.docx E-20
BGC ENGINEERING INC.
• The morphometric statistical approach may not apply to hanging valleys, where the lower channel sharply steepens below a gentle upper basin.
• Finally, as explained in Section E.1.2, there is a continuum between each of the geohazard processes and consequently, a steep creek could have an event that has characteristics that fall between a debris flood and debris flow. Similarly, not every debris flood shows the same characteristics (see Section E.1.2.3).
The major advantage of statistically based methods is that they can be applied to much larger regions than would be feasible to manually assess. However, interpretation of steep creek process types from multiple lines of evidence (statistical, remote-sensed, field observation) would result in higher confidence. Therefore, BGC manually interpreted the dominant fan-forming process types for the prioritized geohazard areas (Section E.2.3.2).
E.2.3.2. Terrain Interpretations
BGC interpreted the dominant fan-forming process types from the following information sources: • The geomorphology of fans and their associated watersheds observed in the available
imagery • Field observations • Records of previous events • Review of statistically predicted process type for channel(s) intersecting the fan.
Table E-4 summarizes the characteristics used to differentiate hydrogeomorphic processes on fans from imagery and field evidence.

Columbia Shuswap Regional District April 16, 2020 Geohazard Risk Prioritization – FINAL Project No.: 1899001
Appendix E - Hazard Assessment Methods - Steep Creeks.docx E-21
BGC ENGINEERING INC.
Table E-4. Characteristics used to classify hydrogeomorphic process types on fans (after Lau, 2017). Grey shading indicates key characteristic used to classify the process.
Debris flow Debris flood Flood
Air photo • Steep (>15°) average watershed channel gradient and typically small (< 3 km2) watersheds with high relief
• Frequent sediment sources in upper watershed (rockfalls, debris avalanches, etc.)
• Inconsistent breaks in tree canopy on fan along stream channel.
• Moderately steep (3-15°) average watershed channel gradient, medium to large watersheds with moderate to high relief
• Sediment sources in upper watershed (rockfalls, debris avalanches, etc.)
• Consistent break in tree canopy on fan along stream channel.
• Low (<3°) average watershed channel gradient, medium to large watersheds with moderate to low relief.
• Wide channels • Large gap in tree
canopy along stream channel.
• Overbank deposits
Lidar • Fan gradient > 5° • Levees along channel
margin • U-shaped channels • (Boulder) lobes on fan
surface • Tongue-shaped boulder
carpets • Sharp deposit boundaries
• Fan gradient 2-10° • No levees along channel • Potential lobes on fan surface • Paired terraces
• Fan gradient < 5° • Wide channels • Lack of lobes and
levees along channel margin
Field • Matrix-supported deposits common, clast-supported rarely
• Inversely graded deposits • No imbrication in deposits • Levees along channel
margins • U-shaped channels • Boulder lobes on surface • Impact scars on trees • Adventitious roots • Buried tree trunks
• Clast-supported deposits • Normally graded deposits • Imbricated channel deposits
(moderate frequency) • Potential lobes on surface • Paired terraces • Impact scars on trees • Adventitious8 roots • Buried tree trunks • Boulder carpets • Deposition of bedload up to
water surface elevation
• Clast-supported deposits
• Normally graded deposits
• Imbricated channel deposits (common frequency)
• Wide, shallow deposits • Wide and shallow
channels • Evidence of multiple
tree stand ages along stream channel.
E.3. GEOHAZARD RATING BGC assigned geohazard ratings that considered the following two factors:
1. Geohazard likelihood: What is the likelihood of steep creek geohazard events large enough to potentially impact elements at risk9 (Section E.3.1)?
2. Geohazard impact likelihood: Given a geohazard event occurs, how susceptible is the hazard area to flows that could impact elements at risk (Section E.3.2)?
These two factors were combined in the qualitative geohazard rating matrix shown in Table E-5 to prioritize each geohazard area. Sections E.3.1 and E.3.2 describe methods and criteria used to estimate geohazard likelihood and impact likelihood, respectively. In these methods, terrain
8 Adventitious roots are roots arising in abnormal places 9 Elements at risk are defined as assets exposed to potential consequences of geohazard events (see Section 4 of
the main report, and Appendix C).
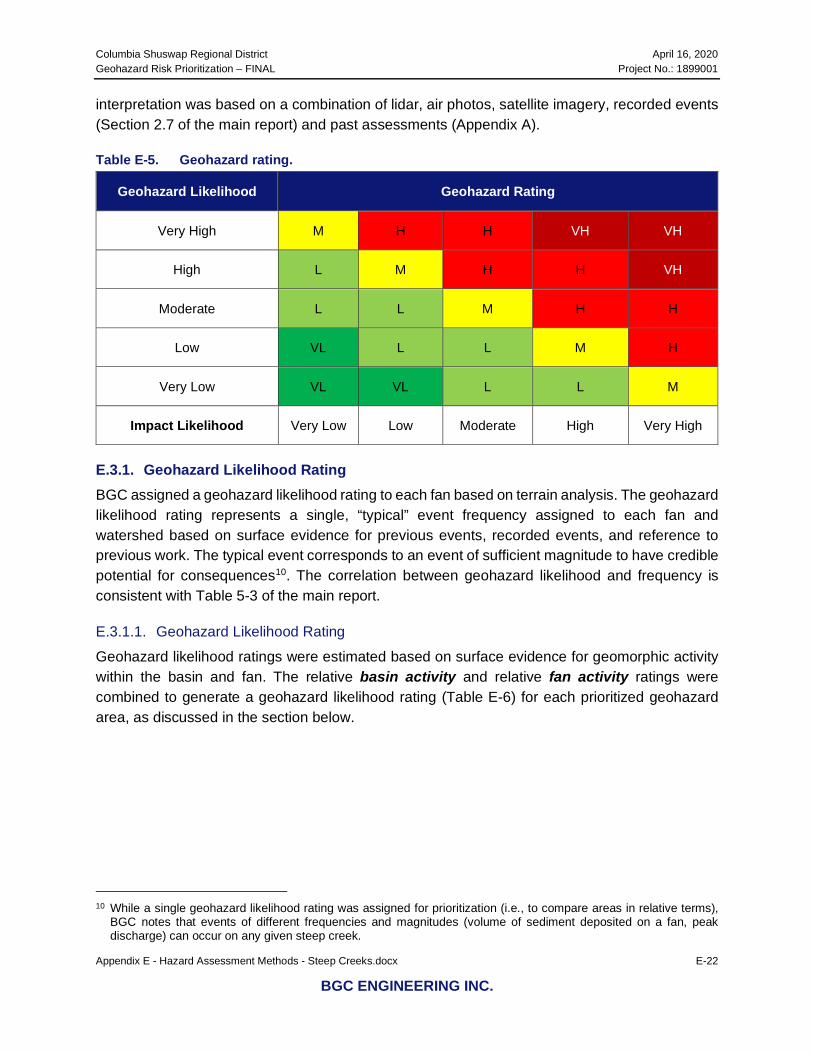
Columbia Shuswap Regional District April 16, 2020 Geohazard Risk Prioritization – FINAL Project No.: 1899001
Appendix E - Hazard Assessment Methods - Steep Creeks.docx E-22
BGC ENGINEERING INC.
interpretation was based on a combination of lidar, air photos, satellite imagery, recorded events (Section 2.7 of the main report) and past assessments (Appendix A).
Table E-5. Geohazard rating.
Geohazard Likelihood Geohazard Rating
Very High M H H VH VH
High L M H H VH
Moderate L L M H H
Low VL L L M H
Very Low VL VL L L M
Impact Likelihood Very Low Low Moderate High Very High
E.3.1. Geohazard Likelihood Rating BGC assigned a geohazard likelihood rating to each fan based on terrain analysis. The geohazard likelihood rating represents a single, “typical” event frequency assigned to each fan and watershed based on surface evidence for previous events, recorded events, and reference to previous work. The typical event corresponds to an event of sufficient magnitude to have credible potential for consequences10. The correlation between geohazard likelihood and frequency is consistent with Table 5-3 of the main report.
E.3.1.1. Geohazard Likelihood Rating
Geohazard likelihood ratings were estimated based on surface evidence for geomorphic activity within the basin and fan. The relative basin activity and relative fan activity ratings were combined to generate a geohazard likelihood rating (Table E-6) for each prioritized geohazard area, as discussed in the section below.
10 While a single geohazard likelihood rating was assigned for prioritization (i.e., to compare areas in relative terms),
BGC notes that events of different frequencies and magnitudes (volume of sediment deposited on a fan, peak discharge) can occur on any given steep creek.

Columbia Shuswap Regional District April 16, 2020 Geohazard Risk Prioritization – FINAL Project No.: 1899001
Appendix E - Hazard Assessment Methods - Steep Creeks.docx E-23
BGC ENGINEERING INC.
Table E-6. Geohazard likelihood hazard rating matrix. Typical Basin Activity Characteristics
Very Low Low Moderate High Very High
Fan
Act
ivity
Cha
ract
eris
tics
Very High Moderate Moderate High Very High Very High
High Low Moderate High High Very High
Moderate Low Low Moderate High High
Low Very Low Low Low Moderate Moderate
Very Low Very Low Very Low Low Low Moderate
E.3.1.2. Geohazard Likelihood Criteria
Table E-7 and Table E-8 summarize the criteria used to rate basin activity and fan activity, respectively. Figure E-11 and Figure E-12 show examples of events large enough to produce visible surface evidence of activity. It should be noted that dense tree cover could obscure small events that would not be detected at the scale of study. Accordingly, the ratings are relative measures and can be subject to the limitations of available records and datasets. Specifically, terrain interpretation on less vegetated fans can be biased in favour of relatively smaller, more frequent events that would not have been visible under tree cover. All ratings are potentially subject to revision following future more detailed study. No geohazard likelihood rating was assigned to fans whose dominant process is clear-water flood, because the criteria for terrain interpretation listed in Table E-7 and Table E-8 are not applicable for clear-water floods.

Columbia Shuswap Regional District April 16, 2020 Geohazard Risk Prioritization – FINAL Project No.: 1899001
Appendix E - Hazard Assessment Methods - Steep Creeks.docx E-24
BGC ENGINEERING INC.
Table E-7. Relative basin activity for steep creeks organized by dominant process type.
Basin Activity Description
Characteristic Observations
Debris-flood dominated steep creeks
Debris-flow dominated steep creeks
Very Low
• Minimal sediment sources.
• Supply limited watershed.
• Negligible sediment sources in or along channel or in tributaries.
• Absence of landslide scars or erodible terrain.
• Basin is treed. • Several rounded slopes.
Low
• Identifiable sediment sources, but most show limited evidence of activity or connectivity.
• Supply limited watershed
• Minimal sediment sources in or along channel and any existing channel material is not easily mobilized (e.g., dense till, partially bedrock controlled).
• Some exposed soil or rock occurs. • Absence of fresh landslide scars or
debris below exposed terrain. • Absence of channel deposits. • Basin and channel are mostly
treed
Moderate
• Active sediment sources, but the material is not easily mobilized AND is not connected to the main channel or fan.
• Supply limited or unlimited watershed.
• Sediment sources are present in or along channel.
• Channel material is not easily mobilized (e.g., dense till, partially bedrock controlled)
• Tributaries with identifiable sediment sources (e.g., debris-flow tributaries) typically stall before reaching main channel.
• Main channel often has variable width.
• Sediment sources are present on slopes (e.g., presence of landslide scars in soil or rock).
• Source material or in channel deposits are not easily mobilized (e.g., coarse, angular colluvium, dense till, or partially bedrock controlled).
• Landslide deposits typically stall before the main channel.
High
• Active sediment sources, but the material is either not easily mobilized, or not clearly connected to the main channel or fan.
• Supply unlimited watershed
• Numerous, actively producing source areas along main channel and tributaries (i.e., debris slides, debris avalanches, raveling in lacustrine, glaciofluvial, or morainal sediments);
• Evidence of temporary sediment storage along main channel.
• Numerous, actively producing source areas on slopes or in channel.
• Channel is choked with debris, but the material is not easily entrained (e.g., coarse angular colluvium)
• Source material could be easily entrained (e.g., talus, loose glacial deposits, volcanic), but there is no clear connection between the sources and main channel (e.g., hanging valley).
Very High
• Active sediment sources that could be easily mobilized and are well connected to the main channel or fan.
• Supply unlimited watershed
• Numerous, actively producing source areas along main channel and tributaries (i.e., debris slides, debris avalanches, raveling in lacustrine, glaciofluvial, or morainal sediments);
• Source material could be easily entrained.
• Tributaries with identifiable sediment sources (e.g., debris-flow tributaries) deposit straight into main channel.
• Numerous, actively producing source areas on slopes or in channel.
• Channel choked with debris. • Easily entrained source materials
along channels (e.g., talus, glacial deposits, volcanics)

Columbia Shuswap Regional District April 16, 2020 Geohazard Risk Prioritization – FINAL Project No.: 1899001
Appendix E - Hazard Assessment Methods - Steep Creeks.docx E-25
BGC ENGINEERING INC.
Table E-8. Relative fan activity for steep creeks organized by dominant process type. Fan activity refers to the frequency of steep creek events reaching the fan.
Fan Activity1,2
Return Period
Number of
Recorded Events4
Fan Observations
Debris-flood dominated creeks Debris-flow dominated creeks
Very Low
500 year
None • Vegetated mainstem. • No distinguishable debris-flood
related landforms. • Uniform tree canopy of mature
forest.
• No observable mainstem. • No distinguishable debris-flow
related landforms. • Uniform tree canopy of mature
forest.
Low3
200 year
None • Partially vegetated mainstem. • Muted channels or over bank
deposits (most likely only visible in lidar).
• Uniform tree canopy of mature forest.
• Vegetated mainstem. • Muted channels, lobes or levees
(most likely only visible in lidar). • Uniform tree canopy of mature
forest.
Moderate
50 year
0 to 1 • Unvegetated mainstem. • Channels and over bank deposits
are visible in lidar, but potentially not in imagery.
• Persistently includes swaths of mixed deciduous or conifer trees in riparian zone.
• Partially vegetated mainstem; • Channels, lobes or levees are
visible in lidar, but potentially not in imagery.
• Persistently includes swaths of mixed deciduous or coniferous trees associated with debris-flow landforms.
High
20 year
1 to 2 • Unvegetated mainstem; • Channels and over bank deposits
are visible in imagery and lidar. • Persistently includes variable tree
stand ages in riparian zone. • Regenerative vegetation and
exposed sediment along channel. • Undersized channel in comparison
with active floodplain width. • Partially vegetated bank erosion
scars.
• Partially vegetated mainstem. • Channels, lobes or levees are
visible in imagery and lidar. • Persistently includes swaths of
regenerative (<10 year) or immature (<50 year) forest, potential areas of bare sediment.
Very High
5 year 8 (or at least two
in the past 10 years where
records are not
available over a longer period)
• Unvegetated mainstem; • Channels and over bank deposits
are visible in imagery and lidar. • Persistently includes areas of
pioneer vegetation in riparian zone. • Fresh deposits are visible. • Undersized channel in comparison
with active floodplain width. • Fresh bank erosion scars along
mainstem.
• Fresh deposits are visible. • Channels, lobes or levees are
visible in imagery and lidar. • Persistently includes swaths of
bare sediment or low (<2 year) pioneer vegetation.
Cannot determine3
n/a n/a • Anthropogenic modifications across most of fan, and no evidence of past events in air photo record.
Notes: 1. In cases where fan activity cannot be determined from available data, the basin activity rating was applied as the likelihood rating. 2. Very low vs. low classification cannot reliably be determined without lidar. A classification of low is conservatively applied in
such cases. 3. For the purposes of this assessment, BGC defined the record event span to be 1980 to present, for which there are readily
and freely available air photo and recorded event records in the study area. The true number of recorded events at each geohazard area depends on the length and quality of air photo, imagery, and media records.

Columbia Shuswap Regional District April 16, 2020 Geohazard Risk Prioritization – FINAL Project No.: 1899001
Appendix E - Hazard Assessment Methods - Steep Creeks.docx E-26
BGC ENGINEERING INC.
Figure E-10. Example of evidence for recent landslide or in-channel debris-flow initiation (red
arrows) within the basin of an unnamed creeks on the north end of the Van Horne Range, Columbia Valley (Imagery: Google Earth, 2005).
Figure E-11. Example of evidence (red arrows) of a debris-flow deposit on Birchlands Creek,
located south of Golden. The approximate alluvial fan boundary is shown in orange (Imagery: Google Earth 2005).
N
Blaeberry River
N
Columbia River
1000 m
1000 m
Columbia Shuswap Regional District April 16, 2020 Geohazard Risk Prioritization – FINAL Project No.: 1899001
Appendix E - Hazard Assessment Methods - Steep Creeks.docx E-27
BGC ENGINEERING INC.
E.3.1.3. Wildfires
Wildfires in steep mountainous terrain are often followed by a temporary period of increased geohazard activity. This period is most pronounced within the first three to five years after the fire (Cannon & Gartner, 2005; DeGraff et al., 2015). After about three to five years, vegetation can reestablish on hillslopes and loose, unconsolidated sediment mantling hillslopes and channels may have been eroded and deposited downstream. A second period of post-fire debris-flow activity is possible about ten years following a fire, when long duration storms with high rainfall totals or rain-on-snow events cause landslides that more easily mobilize due to a loss of cohesion caused by tree root decay (Degraff et al., 2015; Klock & Helvey, 1976; Sidle, 1991, 2005). This second period of heightened debris-flow activity is rare.
Detailed post-wildfire geohazard assessment is outside the scope of work. Therefore, BGC assigned basin activity ratings based on current observations at the time of the assessment. Information on the occurrence of wildfires in the watershed (based on data from Ministry of Forests, Lands, Natural Resources Operations and Rural Development11) is shown for informational purposes in Cambio. Future wildfire activity could change the potential basin activity rating by one or more categories, and all ratings should be re-visited following the occurrence of a wildfire.
E.3.2. Geohazard Impact Likelihood BGC assigned an impact likelihood rating to each fan that considered the relative spatial likelihood that geohazard events result in flows that could impact elements at risk. Given the study objective of regional risk prioritization, the geohazard impact likelihood rating was assigned as an average for the fan. It is not an estimate of spatial probability of impact for specific elements at risk, which would vary depending on their location. This section describes the methods used to determine this geohazard impact likelihood rating.
Geohazard impact likelihood is predominantly concerned with avulsions. Avulsion refers to a sudden change in stream channel position on a fan due to partial or complete blockage of the existing channel by debris or due to exceedance of bankfull conditions. During an event, part of or all of a flow may avulse from the existing channel and travel across a different fan portion.
E.3.2.1. Impact Likelihood Rating
BGC estimated geohazard impact likelihood based on a combination of susceptibility modeling and terrain interpretations. The results of the susceptibility model provided an initial estimate of impact likelihood (Sections E.3.2.2 and E.3.2.3), which was then complemented by observations on avulsion activity (Section E.3.2.4) and the potential for a LDOF (Section E.3.2.5). Previous assessments and event records were referenced where available. The methods described in this section are applicable for regional-scale assessment.
11 https://catalogue.data.gov.bc.ca/dataset/fire-perimeters-historical; https://catalogue.data.gov.bc.ca/dataset/fire-
locations-current (accessed in December 9, 2019)

Columbia Shuswap Regional District April 16, 2020 Geohazard Risk Prioritization – FINAL Project No.: 1899001
Appendix E - Hazard Assessment Methods - Steep Creeks.docx E-28
BGC ENGINEERING INC.
An initial impact likelihood rating was first calculated as the proportion of “moderate” and/or “high” modelled susceptibility classes included within the area of each fan (Table E-9). For clear-water flood, the initial impact likelihood rating was calculated as the proportion of fan inundated by the HAND model (Table E-10; Appendix D). This initial estimate of impact likelihood was then adjusted based on the other factors (avulsion activity and LDOF potential) as follows:
• The initial impact likelihood rating was increased by a factor of 1 if the evidence for previous avulsion rating (see Section E.3.2.4) was “moderate”; and by a factor of 2 if it was “high’ or “very high”.
• The initial impact likelihood rating was further increased by a factor of 1 if the LDOF potential rating was “moderate”; and by a factor of 2 if it was “high’ or “very high” (Section E.3.2.5). This adjustment serves to flag fans where there is a possibility of major flooding events associated with potential LDOF events.
Table E-9. Summary of criteria used for impact likelihood rating for debris flows and debris floods, in the CSRD.
Impact Likelihood Rating1 Criteria
Very Low Fan area is rated Very Low or Low susceptibility; no evidence of previous avulsion
Low Less than 5% of fan area is rated Moderate or High susceptibility; none to poor evidence of previous avulsion.
Moderate
Poor evidence of previous avulsion where more than 5% of fan area is rated Moderate or High susceptibility but less than 40% of the fan area is rated High susceptibility; OR moderate evidence of previous avulsion where less than 5% of fan area is rated Moderate or High susceptibility
High
Poor evidence for previous avulsion where more than 40% of fan area is rated High susceptibility; OR moderate evidence of previous avulsion where more than 5% of fan area is rated Moderate or High susceptibility but less than 40% of the fan area is rated High susceptibility; OR strong or very strong evidence of previous avulsion where less than 5% of the fan is rated Moderate or High susceptibility
Very High
Moderate or stronger evidence of previous avulsion where more than 40% of fan area is rated High susceptibility; strong or very strong evidence of previous avulsion where more than 5% of fan area is rated moderate or high susceptibility but less than 40% of the fan area is rated High susceptibility
Note: 1 The impact likelihood rating was increased by a factor of 1 if the LDOF potential criteria are “moderate”; and by a factor of
2 if they are “high’ or “very high”.
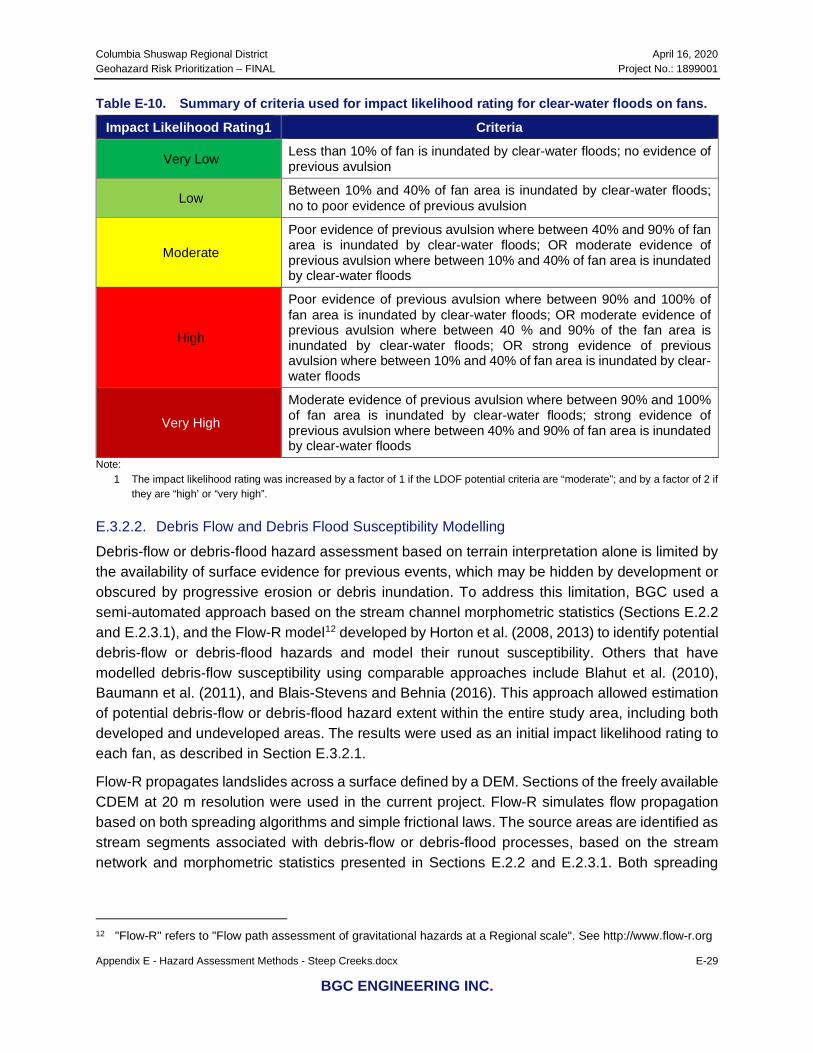
Columbia Shuswap Regional District April 16, 2020 Geohazard Risk Prioritization – FINAL Project No.: 1899001
Appendix E - Hazard Assessment Methods - Steep Creeks.docx E-29
BGC ENGINEERING INC.
Table E-10. Summary of criteria used for impact likelihood rating for clear-water floods on fans.
Impact Likelihood Rating1 Criteria
Very Low Less than 10% of fan is inundated by clear-water floods; no evidence of previous avulsion
Low Between 10% and 40% of fan area is inundated by clear-water floods; no to poor evidence of previous avulsion
Moderate
Poor evidence of previous avulsion where between 40% and 90% of fan area is inundated by clear-water floods; OR moderate evidence of previous avulsion where between 10% and 40% of fan area is inundated by clear-water floods
High
Poor evidence of previous avulsion where between 90% and 100% of fan area is inundated by clear-water floods; OR moderate evidence of previous avulsion where between 40 % and 90% of the fan area is inundated by clear-water floods; OR strong evidence of previous avulsion where between 10% and 40% of fan area is inundated by clear-water floods
Very High
Moderate evidence of previous avulsion where between 90% and 100% of fan area is inundated by clear-water floods; strong evidence of previous avulsion where between 40% and 90% of fan area is inundated by clear-water floods
Note: 1 The impact likelihood rating was increased by a factor of 1 if the LDOF potential criteria are “moderate”; and by a factor of 2 if
they are “high’ or “very high”.
E.3.2.2. Debris Flow and Debris Flood Susceptibility Modelling
Debris-flow or debris-flood hazard assessment based on terrain interpretation alone is limited by the availability of surface evidence for previous events, which may be hidden by development or obscured by progressive erosion or debris inundation. To address this limitation, BGC used a semi-automated approach based on the stream channel morphometric statistics (Sections E.2.2 and E.2.3.1), and the Flow-R model12 developed by Horton et al. (2008, 2013) to identify potential debris-flow or debris-flood hazards and model their runout susceptibility. Others that have modelled debris-flow susceptibility using comparable approaches include Blahut et al. (2010), Baumann et al. (2011), and Blais-Stevens and Behnia (2016). This approach allowed estimation of potential debris-flow or debris-flood hazard extent within the entire study area, including both developed and undeveloped areas. The results were used as an initial impact likelihood rating to each fan, as described in Section E.3.2.1.
Flow-R propagates landslides across a surface defined by a DEM. Sections of the freely available CDEM at 20 m resolution were used in the current project. Flow-R simulates flow propagation based on both spreading algorithms and simple frictional laws. The source areas are identified as stream segments associated with debris-flow or debris-flood processes, based on the stream network and morphometric statistics presented in Sections E.2.2 and E.2.3.1. Both spreading
12 "Flow-R" refers to "Flow path assessment of gravitational hazards at a Regional scale". See http://www.flow-r.org
Columbia Shuswap Regional District April 16, 2020 Geohazard Risk Prioritization – FINAL Project No.: 1899001
Appendix E - Hazard Assessment Methods - Steep Creeks.docx E-30
BGC ENGINEERING INC.
algorithms and friction parameters need to be calibrated by back-analysis of past events or using geomorphological observations.
Flow-R can calculate the maximum susceptibility that passes through each cell of the DEM, or the sum of all susceptibilities passing through each cell. The former is calculated in Flow-R using the “quick” calculation method and is used to identify the area susceptible to landslide processes. The “quick” method propagates the highest source areas, and iteratively checks the remaining source areas to determine if a higher energy or susceptibility value will be modelled. The latter is calculated in Flow-R using the “complete” method and can be used to identify areas of highest relative regional susceptibility. The complete method triggers propagation from every cell in the source segments.
For this study, the sum of susceptibilities using the “complete” method was calculated once the final model parameters were calibrated. Although the absolute value of susceptibility at a given location has no physical meaning, areas of higher relative regional susceptibility account for both larger source zones (increased the number of potential debris flows or debris floods that reach a susceptibility zone), as well as increased control of topographic features (i.e., incised channels or avulsion paths within alluvial fans).
BGC used the following steps to complete debris-flow/flood susceptibility modelling using Flow-R:
• BGC had already modeled susceptibility for steep creeks where detailed assessment had previously been completed. These steep creeks are in the Canmore, Alberta area (Holm et al., 2018), which have been previously assessed by BGC at a higher level of detail than any creeks within the CSRD. As such, the Canmore-area creeks provide a good starting point to calibrate the model.
• BGC then calibrated the Flow-R model parameters by attempting to reproduce the extent of fans at selected locations within the CSRD.
• Finally, BGC applied the model to map debris-flow and debris-flood susceptibility on all creeks in the stream network, within the CSRD. The results were further compared to terrain analyses.
Table E-11 and Table E-12 show Flow-R calibrated parameters for debris flows and debris floods, respectively. The debris-flow and debris-flood scenarios are modelled separately.

Columbia Shuswap Regional District April 16, 2020 Geohazard Risk Prioritization – FINAL Project No.: 1899001
Appendix E - Hazard Assessment Methods - Steep Creeks.docx E-31
BGC ENGINEERING INC.
Table E-11. Calibrated debris-flow parameters used in Flow-R.
Selection Flow-R Parameter Value
Columbia Shuswap-Seton Region
Directions algorithm Holmgren (1994) modified dh = 2 exponent = 2
Inertial algorithm Weights Gamma (2000)
Friction loss function travel angle 7°
Energy limitation Velocity < 15 m/s
Table E-12. Calibrated debris-flood parameters used in Flow-R.
Selection Flow-R Parameter Value
Columbia Shuswap-Seton Region
Directions algorithm Holmgren (1994) modified dh = 2 exponent = 1
Inertial algorithm weights Default
Friction loss function travel angle 3°
Energy limitation velocity < 15 m/s
Debris-flow/flood susceptibility results are displayed in Cambio and generally correspond well to the extent of known debris-flow or debris-flood events and fan boundaries within the study area (Figure E-14). The summed susceptibility values throughout the CSRD follow a negative exponential distribution. Zones of the DEM with summed susceptibility values lower than a threshold corresponding to the 70th percentile were attributed ‘very low’ regional susceptibility (i.e., ‘very low’ susceptibility include the majority of areas covered by Flow-R simulations). Zones of ‘low’ regional susceptibility were defined between the 70th and 85th percentile (the 85th percentile corresponding approximately to the mean susceptibility value); ‘moderate’ and ‘high’ susceptibility were defined between the 85th and 95th percentile, and greater than the 95th percentile, respectively. Portions of alluvial fans not encompassed by susceptibility modelling were interpreted as having ‘very low’ regional susceptibility, where modern fan morphometry encourages flow away from the unaffected area, or not affected by debris flows/floods where deep channel incision indicate paleofans.
BGC notes that regional scale susceptibility modelling contains uncertainties and should be interpreted with caution. BGC highlights the following specific limitations:
• Susceptibility modelling on creeks without mapped fans contains much higher uncertainty. • Susceptibility modelling does not imply any specific hazard likelihood. Some areas
mapped as susceptible to debris flows or debris floods may not have credible potential for events due to factors not considered in regional scale modelling, such as lack of sediment supply.
Columbia Shuswap Regional District April 16, 2020 Geohazard Risk Prioritization – FINAL Project No.: 1899001
Appendix E - Hazard Assessment Methods - Steep Creeks.docx E-32
BGC ENGINEERING INC.
• Susceptibility modelling is only completed for creeks within the mapped stream network. Because debris flows can also initiate in areas without mapped streams, additional debris-flow hazard areas exist that are not mapped.
• Debris-flow and debris-flood susceptibility model calibration was optimized for flow propagation on the fan. Susceptibility in the upper basin should be considered a proxy for debris sources, not necessarily an accurate representation of actual source areas.
• Flow-R propagation was simulated using parameters calibrated at regional scale. It is not applicable for detailed runout simulations, risk analyses and risk control design at specific sites. In addition, the model is not physics-based (it is an empirical model) and not attached to any specific return period. Thus, it cannot inform on return period-specific runout distance, nor does it provide flow depths and velocity estimates which are necessary to calculate debris-flow intensities.
• Susceptibility mapping does not replicate specific scenarios undertaken as part of detailed hazard and risk assessment.

Columbia Shuswap Regional District April 16, 2020 Geohazard Risk Prioritization – FINAL Project No.: 1899001
Appendix E - Hazard Assessment Methods - Steep Creeks.docx E-33
BGC ENGINEERING INC.
Figure E-12. Debris-flood susceptibility map for a section of the study area showing the spatial distribution of the four different
susceptibility classes and developed debris-flood fans.
Columbia Shuswap Regional District April 16, 2020 Geohazard Risk Prioritization – FINAL Project No.: 1899001
Appendix E - Hazard Assessment Methods - Steep Creeks.docx E-34
BGC ENGINEERING INC.
E.3.2.3. Clear-water Flood Susceptibility
Section D.2.4 of Appendix D (Clear-water Hazard Assessment Methodology) describes methods to identify the extent of clear-water flood hazards using the HAND approach. This approach is applied to alluvial fans classified as dominantly subject to clear-water floods. The modelled 200-year floodplain extent was used as a proxy for channel confinement: the deeper and more incised a channel, the narrower the floodplain is expected to be. Similarly, the shallower and less incised a channel, the wider the floodplain.
E.3.2.4. Avulsion Activity
BGC used terrain interpretations of evidence of previous avulsions and description of potential avulsion mechanisms to assess the potential for avulsion to impact elements at risk at each fan. Surface evidence for previous avulsions includes vegetation and the presence of relict channels, lobes and deposits on the fan surface (Table E-13; Figure E-15). These features are usually detectable on lidar hillshades; interpretations are less certain for areas without lidar coverage. The rating is subject to greater uncertainty where development has obscured previous evidence for flow avulsions (e.g., channel modification or highly developed fans).
Fan-deltas (fans that form in standing water bodies, such as lakes, oceans and reservoirs) typically have a higher potential for avulsion than terrestrial (land-based) alluvial fans due to channel back-filling effects from the stream-water body interface. As such, these fans typically exhibit characteristics of a “Very High” or “High” rating, as long as the channel is not entrenched (highly incised) into the fan and the water level at any time of the year is well below the fan surface. Fan deltas with steeper gradients are less influenced by lake level and their avulsion rating does not need to be upgraded.

Columbia Shuswap Regional District April 16, 2020 Geohazard Risk Prioritization – FINAL Project No.: 1899001
Appendix E - Hazard Assessment Methods - Steep Creeks.docx E-35
BGC ENGINEERING INC.
Figure E-13. Example of high evidence for previous avulsion on Emerald River, located at the north
end of Emerald Lake. The approximate fan boundary is shown in orange.
N
1000 m

Columbia Shuswap Regional District April 16, 2020 Geohazard Risk Prioritization – FINAL Project No.: 1899001
Appendix E - Hazard Assessment Methods - Steep Creeks.docx E-36
BGC ENGINEERING INC.
Table E-13. Evidence of previous avulsions criteria. These criteria refer to the frequency of events avulsing on the fan, as opposed to Table E-8, which refers to the frequency of events reaching the fan regardless of avulsing or not.
Surface Evidence of
Previous Avulsions1
Representative Return Period
(years)
Number of Recorded Events2
Description Characteristic Observations3
Very
Low
500 None Active or historical channels cannot be identified in lidar or imagery.
Vegetated fan with consistent, mature tree stand age. No avulsion channels visible in lidar if available.
Low
1
200 None Historical channels visible with lidar but they are muted and vegetated and not discernable on satellite imagery.
Vegetated fan with consistent, mature stand age. Muted historical channels visible in lidar if available. lidar
Mod
erat
e
50 0 to 1 Historical channels on fan surface are visible in lidar and satellite imagery.
Swaths of young (<50 year) deciduous or coniferous vegetation exist in previous avulsion paths. Relict channels clear in lidar. Channels have similar characteristic geomorphic observations (e.g., debris-flow levees) as described in the fan activity rating.
High
20 1 to 2 An avulsion path is visible. Swaths of bare sediment or low (<20 year) pioneer vegetation exist on previous avulsion path. Channels have similar characteristic geomorphic observations (e.g., debris-flow levees) as described in the fan activity rating.
Very
Hig
h
5 8 (or at least two in the past 10 years where records are not available over a longer period)
At least one fresh avulsion path exists.
Swaths of bare sediment or low (<2 year) pioneer vegetation exist on previous avulsion paths. Channels have similar characteristic geomorphic observations (e.g., debris-flow levees) as described in the fan activity rating.
Notes: 1. Very low vs. low classification cannot reliably be determined without lidar. A classification of low is conservatively applied in
such cases. 2. For the purposes of this assessment, BGC defined the record event span to be 1980 to present, for which there are readily
and freely available air photo and recorded event records in the study area. The true number of recorded events at each geohazard area depends on the length and quality of air photo, imagery, and media records.
3. Fans classified as being a flood geohazard type are assessed according to these characteristics, but smaller flood events can be difficult to discern in air photos or satellite imagery. lidar, historical records and judgement is used where applicable. A low classification is conservatively applied as the lowest option for flood type fans.

Columbia Shuswap Regional District April 16, 2020 Geohazard Risk Prioritization – FINAL Project No.: 1899001
Appendix E - Hazard Assessment Methods - Steep Creeks.docx E-37
BGC ENGINEERING INC.
The potential for avulsion can be variable along a channel due to relative confinement of the channel within the fan landform. For example, flows can more easily fill and overtop a channel that has low channel banks, rather than a deeply incised channel. In addition, structures such as bridges and culverts can become blocked during hydrogeomorphic events and generate an avulsion. BGC characterized the most likely avulsion mechanism that could occur at each prioritized geohazard area (Table E-14). At the regional scale of the study, these mechanisms were not used in the attribution of evidence for previous avulsion rating; however, natural landform obstruction and channel plugging are implicitly accounted for in the susceptibility model described in Section E.3.2.2 or evidence for previous avulsion detailed in Table E-13.
Table E-14. Avulsion mechanism description. Avulsion
Mechanism Description
Bridge crossing Forestry, highway, railway bridges on the main channel of fan
Culvert crossing Culvert used to contain the flow on the main channel
Natural landform obstruction
Places where flow could leave the main channel (e.g., sharp bend in main channel)
Channel plugging
This usually occurs when debris flows stall and create a lobe front, forcing the remaining flows to go around the stalled or slow-moving boulder lobe. The evidence of channel plugging is typically avulsion channels and lobes across the fan in several channels. This type of avulsion typically occurs at the inflection point of the fan. The presence of a channel inflection point can be observed as a change from entrenched channel to unconfined channel, drastic change in grain size as debris flows are deposited, or a sudden change in average channel gradient.
None no identifiable landform or anthropogenic feature that could enhance avulsions (i.e., very high or high channel confinement rating).
E.3.2.5. Landslide Dam Outbreak Flood Potential
Some steep creek watersheds are prone to LDOFs, which could trigger flooding, debris floods, or debris flows with larger magnitudes than “typical” hazards. An example of this hazard is landslides in the Mount Meager volcanic complex, Squamish-Lillooet Regional District, which have generated several landslide dams along Meager Creek and Lillooet River (Bovis & Jakob, 2000; Guthrie et al., 2012). In this assessment, LDOF potential is expected to be a factor potentially increasing the potential for avulsion; therefore, it is considered in the impact likelihood rating (see Section E.3.2.1). However, LDOFs are a distinct population of events from the “typical” debris flows and debris floods defined in Section E.3.1. Therefore, this rating serves as a flag for consideration of more specific analyses to address this type of geohazard.
Table E-15 lists terrain criteria used to estimate LDOF potential. Ratings are assigned based on evidence of past landslide dams, presence of large landslides with the potential to travel to the valley floor, and presence of channel sections potentially susceptible to blockage (e.g., channel constrictions).
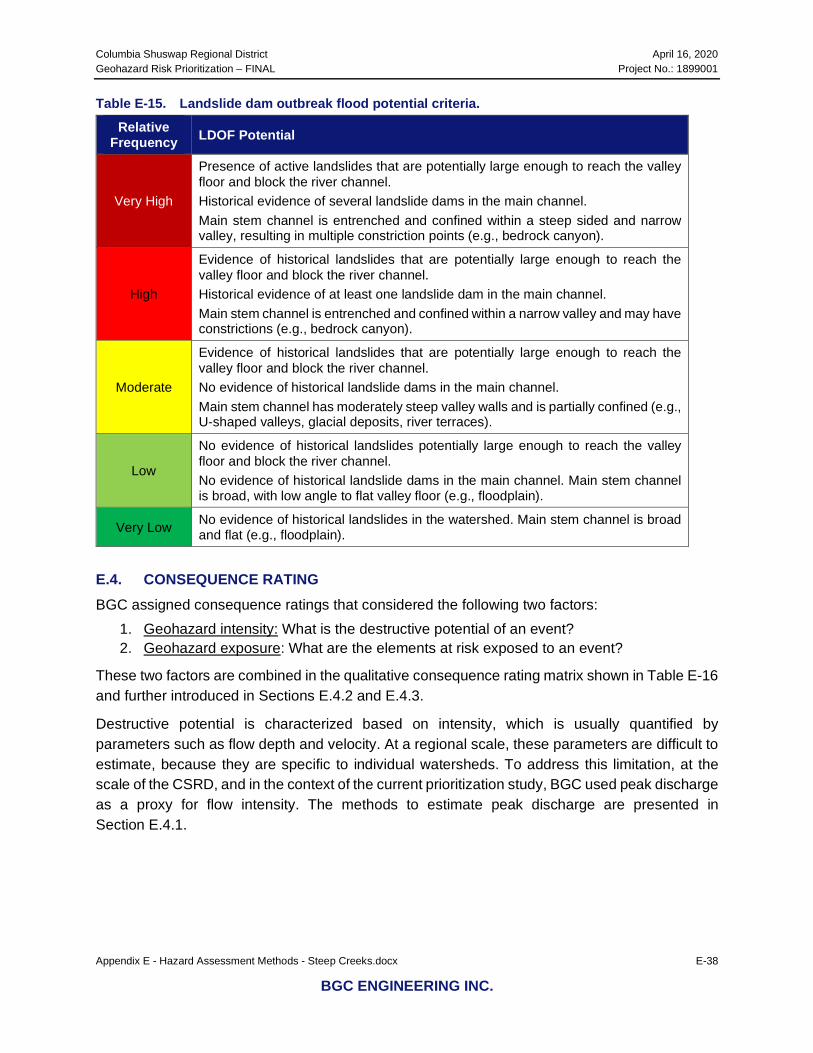
Columbia Shuswap Regional District April 16, 2020 Geohazard Risk Prioritization – FINAL Project No.: 1899001
Appendix E - Hazard Assessment Methods - Steep Creeks.docx E-38
BGC ENGINEERING INC.
Table E-15. Landslide dam outbreak flood potential criteria. Relative
Frequency LDOF Potential
Very High
Presence of active landslides that are potentially large enough to reach the valley floor and block the river channel. Historical evidence of several landslide dams in the main channel. Main stem channel is entrenched and confined within a steep sided and narrow valley, resulting in multiple constriction points (e.g., bedrock canyon).
High
Evidence of historical landslides that are potentially large enough to reach the valley floor and block the river channel. Historical evidence of at least one landslide dam in the main channel. Main stem channel is entrenched and confined within a narrow valley and may have constrictions (e.g., bedrock canyon).
Moderate
Evidence of historical landslides that are potentially large enough to reach the valley floor and block the river channel. No evidence of historical landslide dams in the main channel. Main stem channel has moderately steep valley walls and is partially confined (e.g., U-shaped valleys, glacial deposits, river terraces).
Low
No evidence of historical landslides potentially large enough to reach the valley floor and block the river channel. No evidence of historical landslide dams in the main channel. Main stem channel is broad, with low angle to flat valley floor (e.g., floodplain).
Very Low No evidence of historical landslides in the watershed. Main stem channel is broad and flat (e.g., floodplain).
E.4. CONSEQUENCE RATING BGC assigned consequence ratings that considered the following two factors:
1. Geohazard intensity: What is the destructive potential of an event? 2. Geohazard exposure: What are the elements at risk exposed to an event?
These two factors are combined in the qualitative consequence rating matrix shown in Table E-16 and further introduced in Sections E.4.2 and E.4.3.
Destructive potential is characterized based on intensity, which is usually quantified by parameters such as flow depth and velocity. At a regional scale, these parameters are difficult to estimate, because they are specific to individual watersheds. To address this limitation, at the scale of the CSRD, and in the context of the current prioritization study, BGC used peak discharge as a proxy for flow intensity. The methods to estimate peak discharge are presented in Section E.4.1.

Columbia Shuswap Regional District April 16, 2020 Geohazard Risk Prioritization – FINAL Project No.: 1899001
Appendix E - Hazard Assessment Methods - Steep Creeks.docx E-39
BGC ENGINEERING INC.
Table E-16. Consequence rating.
Hazard Exposure Relative Consequence Rating
Very High M H H VH VH
High L M H H VH
Moderate L L M H H
Low VL L L M H
Very Low VL VL L L M
Hazard Intensity Rating Very Low Low Moderate High Very High
E.4.1. Peak Discharge Estimation Clear-water flood, debris-flood, and debris-flow processes can differ widely in terms of peak discharge. The peak discharge of a debris flood is typically 1 to 1.2 times that of a clear-water flood in the same creek but could be much greater for debris-floods Types 2 and 3 (Table E-1). If the creek is subject to debris flows, the peak flow may be much higher (as much as 50 times) than the flood peak discharge (Jakob & Jordan, 2001). Figure E-17 shows a hypothetical cross-section of a steep creeks, including:
• Peak flow for the 2-year return period (Q2) • Peak flow for the 200-year return period flood (Q200) • Peak flow for debris flood (Qmax debris flood) • Peak flow for debris flow (Qmax debris flow).
Figure E-14. Steep creek flood profile showing schematically peak flow levels for different events.
Columbia Shuswap Regional District April 16, 2020 Geohazard Risk Prioritization – FINAL Project No.: 1899001
Appendix E - Hazard Assessment Methods - Steep Creeks.docx E-40
BGC ENGINEERING INC.
Due to the differences in peak discharges associated with each process type, the maximum peak discharge at the prioritized geohazard areas is calculated depending on the interpreted geohazard process type, using the methods described below. Results of this analysis are provided in Cambio.
To account for the projected climate change effect on steep creek geohazard magnitude (Section E.1.3), the peak discharge for fans associated with supply-limited basins was reduced by 10%13, and the peak discharge for fans associated with supply-unlimited basins was increased by 10%. These percentages are expected to reflect climate change effect by 2050 for “typical” steep creek geohazard events, i.e., where entrained sediments include in-channel material and a small amount of sediments from slope failures. A 10% increase in peak discharge is applied to all fans with clear-water flood process.
E.4.1.1. Clear-Water Floods
A screening-level 200-year flood event was calculated using a regional flood frequency analysis (Regional FFA) because the steep creek watersheds are not typically gauged by hydrometric stations. The regionalization of floods procedure was completed using the index-flood method. For this project, the mean annual flood was selected as the index-flood and dimensionless regional growth curves were developed from Water Survey of Canada (WSC) peak instantaneous discharge data to scale the mean annual flood to the 200-year flood event. Additional information to the methodology for the Regional FFA is summarized in the Methodology Report prepared for the Regional District of Central Kootenay (BGC, March 31, 2020).
To estimate the 200-year flood for each steep creek watershed, a polygon was defined upstream of the fan. A suite of 18 watershed characteristics were extracted and averaged over the area for each ungauged watershed. The watershed characteristics are summarised in Table E-17 across all steep creek watersheds
13 The 10% decrease/increase is based on judgment due to the lack of literature currently available on this topic.

Columbia Shuswap Regional District April 16, 2020 Geohazard Risk Prioritization – FINAL Project No.: 1899001
Appendix E - Hazard Assessment Methods - Steep Creeks.docx E-41
BGC ENGINEERING INC.
Table E-17. Summary of watershed characteristics, including the mean, maximum, and minimum values over all watersheds considered in the study.
Type No. Acronym Units Mean Min Max Standard Deviation
Watershed
1 Centroid_Lat Deg. 51.062822 50.423746 52.319799 0.323474
2 Centroid_Long Deg. -118.148339 -119.692038 -116.314592 1.012767
3 Centroid_Elev masl 1262 366 2401 430
4 Area km2 13 0.04 594 41
5 Relief m 1222 66 2545 486
6 Length km 0.46 0.03 3.8 0.48
7 Slope % 36 2 198 27
Climate
8 MAP mm 1112 462 2042 391
9 MAT ⁰C 2.8 -3.0 7.6 2.4
10 PAS mm 610 130 1489 331
11 PPT_wt mm 401 129 800 168
12 PPT_sp mm 198 93 363 66
13 PPT_sm mm 214 113 429 59
14 PPT_fl mm 299 112 641 114
Physiographic
15 Forest % 80 0 200 24
16 Water_Wetland % 1 0 40 5
17 Urban % 0 0 1 0
18 CN --- 69 55 81 4
The steep creek watersheds were subsequently assigned to one of the hydrologic regions identified across the Regional District based on the watershed characteristics. The hydrologic regions that cover the Regional District include 1 West, 4 East, 7, 8 North, 8 South for watersheds less than 500 km2.The hydrologic region assignment was completed using the Random Forest classification algorithm.
Once a hydrologic region was assigned to the steep creek watershed, the index-flood was estimated based on a regional and a provincially-based ensemble of five multiple regression models. The regional and provincial results were compared, and the highest value was used to calculate the 200-year flood event using the appropriate regional growth curve.
The magnitude of the 200-year flood event is influenced by the watershed characteristics. This is because the index-flood is calculated using a multiple linear regression that depends on the watershed characteristics that define the top five models (regional and provincially-based models). Two watersheds of similar area may have significantly different flood quantile estimates because of major differences in watershed characteristics.
Columbia Shuswap Regional District April 16, 2020 Geohazard Risk Prioritization – FINAL Project No.: 1899001
Appendix E - Hazard Assessment Methods - Steep Creeks.docx E-42
BGC ENGINEERING INC.
The regionalisation of floods tends to underestimate peak flows for small watersheds and overestimate peak flows for larger watersheds. This is in part due to differences in hydrological processes that control peak flows. For example, maximum annual peak instantaneous flows in small watersheds within the study area are more likely controlled by rainfall compared to larger watershed that tend to be more snowmelt-dominated in the spring. The rainfall control in small watersheds reflects the greater likelihood that a rainfall event, like a convective storm, covers the entire watershed area. In the case for larger watersheds, it is more likely for snowmelt to occur across the entire area in the spring.
E.4.1.2. Debris Floods
Type 1 and 2 debris floods vary in discharge between 1.02 times to several times (see Table E-1) the corresponding clear-water flood discharge (Church & Jakob, 2020). At the regional scale of this prioritization study, splitting debris floods into different types and their associated varying discharges is not possible. Therefore, BGC uses a proxy discharge multiplier, which is designed as a relative rating. BGC chose a multiplier of 1.5, which is applied to peak discharge of the clear-water flood at the 200-year return period in the same creek. This multiplier reflects heavy sediment and organic debris load and is conservative in most cases. Type 3 debris floods (LDOF) are addressed as a parameter in the geohazard impact likelihood rating (see Section E.3.2.5).
E.4.1.3. Debris Flows
Debris-flow peak discharge was estimated using the following procedure:
• A regional frequency-magnitude (F-M) relationship was developed for debris flows in the study area, based on data from previous studies.
• A hypothetical site-specific F-M was developed from the regional F-M, based on the fan area for each prioritized debris-flow fan.
• The hypothetical sediment volume of a 200-year return period debris-flow event was calculated from the site-specific F-M.
• The peak discharge of the hypothetical 200-year return period event was calculated from the event volume using empirical relationships.
Typically, F-M relationships for debris flows are difficult to compile because of the scarceness of direct observations, the discontinuous nature of event occurrence, and the obfuscation of field evidence due to progressive erosion or debris inundation. Detailed F-M analyses involve a high level of effort for each creek that is outside the current scope of work. However, when several reliable F-M curves have been assembled, regional relations can be developed. These relations can then be applied to watersheds for which detailed studies are unavailable, unaffordable or impractical due to lack of dateable field evidence. The number of watersheds with detailed F-M analyses is increasing, but at present is still limited.
BGC cautions against the indiscriminate use of regionally based F-M curves, especially in watersheds where multiple geomorphic upland processes are suspected, or where drastic changes (mining, major landslides) have occurred in the watershed that are not yet fully

Columbia Shuswap Regional District April 16, 2020 Geohazard Risk Prioritization – FINAL Project No.: 1899001
Appendix E - Hazard Assessment Methods - Steep Creeks.docx E-43
BGC ENGINEERING INC.
responded to by the fan area. These site-specific factors could result in data population distributions that violate underlying statistical assumptions in the regional F-M curves.
In this assessment, BGC used F-M curves outlined in Jakob et al. (2020) from detailed studies of sixteen creeks in southwestern British Columbia. Individual F-M curves were normalized by dividing sediment volume by fan area and then plotted collectively versus return period. A logarithmic best-fit curve was then fit to the data. Figure E-19 shows the resulting normalized F-M curve for debris flows in southwestern British Columbia.
Figure E-15. F-M curve for debris flows in southwestern British Columbia using data from sixteen
study creeks. Curves are truncated at the 40-year return period (Jakob et al., 2020).
The regional F-M relationship (Equation E-1), based on the best-fit line from Figure E-19 for the the detailed study14 of sixteen creeks in southwestern BC, is then derived:
𝑉𝑉𝑆𝑆 = 𝐴𝐴𝑓𝑓[79,14 ln(T) − 293,811] [Eq. E-1]
Using this equation, BGC predicted sediment volumes (Vs) for each prioritized geohazard area within CSRD using the fan area (Af) and an average return period (T) of 200 years. This equation was used for comparative analysis amongst prioritized geohazard area in this study.
Having determined sediment volume, three published empirical relations for granular debris flows were considered to estimate peak discharge on each debris-flow creek. These relations are as follows:
𝑀𝑀 = 13 ∗ 𝑄𝑄1.33 (Mizuyama et al., 1992) [Eq. E-2]
𝑀𝑀 = 28 ∗ 𝑄𝑄1.11 (Jakob and Bovis, 1996) [Eq. E-3]
𝑀𝑀 = (10 ∗ 𝑄𝑄)6/5 (Rickenmann, 1999) [Eq. E-4]
14 BGC, March 28, 2013; December 2, 2013a/b; December 18, 2013; July 30, 2014; January 22, 2015; October 23,
2015; November 23, 2015; January 31, 2017; May 31, 2017; June 2018; April 6, 2018; September 25, 2018; Cordilleran Geoscience 2008 and 2015; Clague et al., 2003; and Michael Cullen Geotechnical Ltd. and Cordilleran Geoscience 2015.
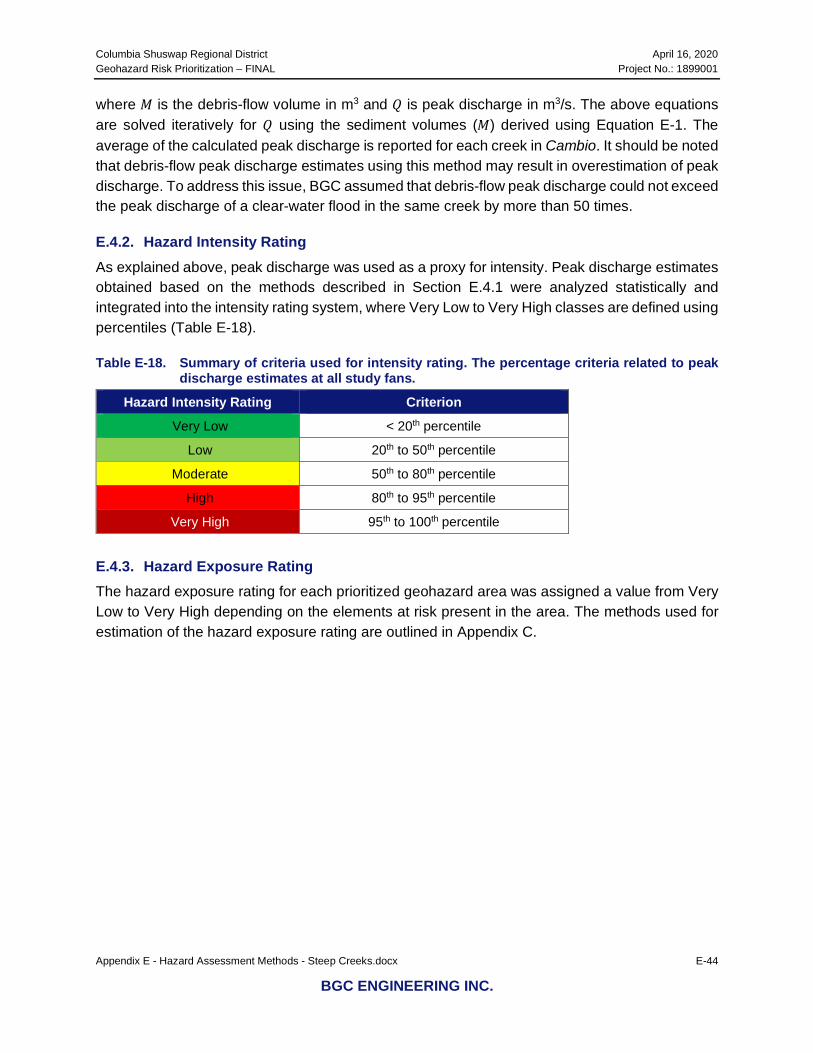
Columbia Shuswap Regional District April 16, 2020 Geohazard Risk Prioritization – FINAL Project No.: 1899001
Appendix E - Hazard Assessment Methods - Steep Creeks.docx E-44
BGC ENGINEERING INC.
where 𝑀𝑀 is the debris-flow volume in m3 and 𝑄𝑄 is peak discharge in m3/s. The above equations are solved iteratively for 𝑄𝑄 using the sediment volumes (𝑀𝑀) derived using Equation E-1. The average of the calculated peak discharge is reported for each creek in Cambio. It should be noted that debris-flow peak discharge estimates using this method may result in overestimation of peak discharge. To address this issue, BGC assumed that debris-flow peak discharge could not exceed the peak discharge of a clear-water flood in the same creek by more than 50 times.
E.4.2. Hazard Intensity Rating As explained above, peak discharge was used as a proxy for intensity. Peak discharge estimates obtained based on the methods described in Section E.4.1 were analyzed statistically and integrated into the intensity rating system, where Very Low to Very High classes are defined using percentiles (Table E-18).
Table E-18. Summary of criteria used for intensity rating. The percentage criteria related to peak discharge estimates at all study fans.
Hazard Intensity Rating Criterion
Very Low < 20th percentile
Low 20th to 50th percentile
Moderate 50th to 80th percentile
High 80th to 95th percentile
Very High 95th to 100th percentile
E.4.3. Hazard Exposure Rating The hazard exposure rating for each prioritized geohazard area was assigned a value from Very Low to Very High depending on the elements at risk present in the area. The methods used for estimation of the hazard exposure rating are outlined in Appendix C.
Columbia Shuswap Regional District April 16, 2020 Geohazard Risk Prioritization – FINAL Project No.: 1899001
Appendix E - Hazard Assessment Methods - Steep Creeks.docx E-45
BGC ENGINEERING INC.
REFERENCES
Ashworth, P.J. & Ferguson, R.I. (1989). Size-selective entrainment of bed load in gravel bed streams. Water Resources Research, 25(4), 627-634. https://doi.org/10.1029/WR025i004p00627.
Baumann V, Wick E, Horton P, & Jaboyedoff M. (2011). Debris-flow susceptibility mapping at a regional scale along the National Road N7, Argentina. In: Proceedings of the 14th Pan-American Conference on Soil Mechanics and Geotechnical Engineering, 2-6 October 2011, Toronto, Ontario, Canada.
BGC Engineering Inc. (2013, March 28). Upper Bayview Road Debris-flow Hazard and Risk Assessment Update [Report]. Prepared for BC Ministry of Forests, Lands, and Natural Resource Operations and Emergency Management BC.
BGC Engineering Inc. (2014, July 30). Mackay Creek and Grouse Creek Debris-flow Hazard and Risk Assessment [Report]. Prepared for Metro Vancouver.
BGC Engineering Inc. (2015, January 22). Catiline Creek Debris-Flow Hazard and Risk Assessment [Report]. Prepared for Columbia Shuswap Regional District.
BGC Engineering Ltd. (2017, January 31). Bear Creek Fan Preliminary Debris-flow Hazard Assessment, Whitecap development [Report]. Prepared for Columbia Shuswap Regional District.
BGC Engineering Inc. (2017, May 31). Debris Geohazard Risk and Risk Control Assessment [Report]. Prepared for District of North Vancouver.
BGC Engineering Inc. (2018, April 6). Seton Portage Area Integrated Hydrogeomorphic Risk Assessment [Report]. Prepared for Columbia Shuswap Regional District.
BGC Engineering Inc. (2018, June). Bridal Falls to Hope Debris-Flow and Debris-Flood Risk Prioritization Study [Report]. Prepared for Ministry of Transportation and Infrastructure.
BGC Engineering Inc. (2019, March 31). Thompson River Watershed Risk Prioritization Study – FINAL. Prepared for Fraser Basin Council.
BGC Engineering Inc. (2020, March 31). Steep Creek Assessment Methodology Report [Report]. Prepared for the Regional District of Central Kootenay.
Blahut, J., Horton, P., Sterlacchini, S., & Jaboyedoff, M. (2010). Debris-flow hazard modelling on medium scale: Valtellina di Tirano, Italy. Natural Hazards Earth System Science, 10, 2379–2390. https://doi.org/10.5194/nhess-10-2379-2010.
Blais-Stevens, A. (2008). Surficial geology and landslide inventory of the upper Sea to Sky corridor, British Columbia. Geological Survey of Canada, Open File 5324, scale 1:50,000.

Columbia Shuswap Regional District April 16, 2020 Geohazard Risk Prioritization – FINAL Project No.: 1899001
Appendix E - Hazard Assessment Methods - Steep Creeks.docx E-46
BGC ENGINEERING INC.
Blais-Stevens, A. & Behnia, P. (2016). Debris-flow susceptibility mapping using qualitative heuristic method and Flow-R along the Yukon Alaska Highway Corridor, Canada. Natural Hazards Earth System Science, 16, 449-462. https:/doi.org/10.5194/nhess-16-449-2016
Bovis, M., & Jakob, M. (2000). The July 29, 1998 debris-flow and landslide dam at Capricorn Creek, Mount Meager Volcanic Complex, southern Coast Mountains, British Columbia. Canadian Journal of Earth Sciences, 37, 1321-1334.
Cannon, S.H. & Gartner, J.E. (2005). Wildfire-related debris flow from a hazards perspective. In: M. Jakob, O. Hungr (Eds), Debris-flow hazards and related phenomena, Springer, Berlin, Heidelberg, 363-385.
Carling, P. (1988). The Concept of Dominant Discharge Applied to Two Gravel-Bed Streams in Relation to Channel Stability Thresholds. Earth Surface Processes and Landforms, 13(4), 355-367. https://doi.org/10.1002/esp.3290130407.
Church, M. (2013). Steep headwater channels. Chapter 9.28 in Shroder, J.F. (eds.) Treatise on Geomorphology, vol. 9, Wohl, E. (ed.), Fluvial Geomorphology. San Diego, Academic Press: 528-549.
Church, M. & Jakob, M. (2020). What is a debris flood? Submitted paper to Water Resources Research.
Church, M. & Ryder, J.M. (1972). Paraglacial sedimentation: a consideration of fluvial processes conditioned by glaciation. Geological Society of America Bulletin, 83, 3059-3072.
Clague, J.J., Friele, P.A. & Hutchinson, I. (2003). Chronology and hazards of large debris flows in the Cheekye River basin, British Columbia, Canada. Environmental and Engineering Geoscience, 8(4), 75-91.
Cordilleran Geoscience. (2008). Geologic Hazard Assessment for Subdivision Approval, Keir Property on Walker Creek, Gun Lake near Goldbridge, BC [Report]. Prepared for David Keir, 100 Mile House, BC.
Cordilleran Geoscience. (2015). Geologic Hazards and Risk Assessment, Lot 2, DL 1249, Plan 27929, Lillooet land District, Mars Crossing near Birken, BC [Report]. Prepared for Mike Milner, Birken, BC.
Degraff, J.V., Cannon, S.H., & Gartner, J.E. (2015). Timing and susceptibility to post-fire debris flows in the western USA. Environmental and Engineering Geoscience. https://doi.org/10.2113/EEG-1677
de Haas, T., Densmore, A.L., Stoffel, M., Suwa, H., Imaizumi, F., Ballesteros-Cánovas, J.A., & Wasklewicz, T. (2017). Avulsions and the spatio-temporal evolution of debris-flow fans. Earth-Science Reviews, 177, 53-75. https://doi.org/10.1016/j.earscirev.2017.11.007
EBA Engineering Inc. (1998). Detailed Terrain Stability Mapping, Sugar Lake, Vernon Forest District, British Columbia. File 0806-97-87495

Columbia Shuswap Regional District April 16, 2020 Geohazard Risk Prioritization – FINAL Project No.: 1899001
Appendix E - Hazard Assessment Methods - Steep Creeks.docx E-47
BGC ENGINEERING INC.
EBA Engineering Inc. (2001). Salmon Arm Forest District Federated Co-operatives Limited Detailed Terrain Stability Mapping Squilax, Broderick Creek, Reinecker Creek, TFL 33. EBA Project No. 0801-00-81153
Gamma, P. (2000). Dfwalk – Ein Murgang-Simulationsprogramm zur Gefahrenzonierung: Geographisches Institut der Universität Bern.
Government of Canada. (2016). Canadian Digital Elevation Model (CDEM) Product Specifications. Available online at http://ftp.geogratis.gc.ca, accessed December 2018.
Guthrie, R.H., Friele, P., Allstadt, K., Roberts, N., Evans, S.G., Delaney, K.B., Roche, D., Clague, J.J., & Jakob, M. (2012). The 6 August 2010 Mount Meager rock slide-debris flow, Coast Mountains, British Columbia: characteristics, dynamics, and implications for hazard and risk assessment. Natural Hazards and Earth System Sciences, 12, 1277-1294.
Holm, K., Jakob, M., Kimball, S., & Strouth, A. (2018). Steep creek geohazard risk and risk control assessment in the Town of Canmore, Alberta. Proceedings of Geohazards 07, June 2-7, Canmore, Alberta.
Holm K., Jakob, M., & Scordo, E. (2016). An inventory and risk-based prioritization of Steep Creek Fans in Alberta, Canada. FLOODrisk 2016, 3rd European Conference on Flood Risk Management, E3S Web of Conferences 7, 01009.
Holmgren, P. (1994). Multiple flow direction algorithms for runoff modelling in grid-based elevation models: an empirical evaluation. Hydrological Processes, 8, 327-334. https://doi.org/10.1002/hyp.3360080405
Horton, P., Jaboyedoff, M., & Bardou, E. (2008). Debris-flow susceptibility mapping at a regional scale. In: Proceedings of the 4th Canadian Conference on Geohazards, edited by: Locat, J., Perret, D., Turmel, D., Demers, D., and Leroueil, S., Qu´ebec, Canada, 20-24 May 2008, 339–406.
Horton, P., Jaboyedoff, M., Rudaz, B., & Zimmermann, M. (2013). Flow-R, a model for susceptibility mapping of debris flows and other gravitational hazards at regional scale. Natural Hazards and Earth System Sciences, 13, 869-885. https://doi.org/10.5194/nhess-13-869-2013
Hungr, O., Leroueil, S., & Picarelli, L. (2014). Varnes classification of landslide types, an update. Landslides, 11, 167-194. https://doi.org/10.1007/s10346-013-0436-y
Iverson, R.M. (1997). The physics of debris flows. Reviews of Geophysics, 35(3), 245-296. https://doi.org/10.1029/97RG00426
Iverson, R.M. (2014). Debris flows: behaviour and hazard assessment. Geology Today, 30(1), 15-20. https://doi.org/10.1111/gto.12037
Jakob, M. & Bovis, M.J. (1996). Morphometrical and geotechnical controls of debris-flow activity, southern Coast Mountains, British Columbia, Canada. Zeitschrift für Geomorphologie Supplementband, 104, 13-26.
Columbia Shuswap Regional District April 16, 2020 Geohazard Risk Prioritization – FINAL Project No.: 1899001
Appendix E - Hazard Assessment Methods - Steep Creeks.docx E-48
BGC ENGINEERING INC.
Jakob, M., Clague, J., & Church, M. (2016). Rare and dangerous: recognizing extra-ordinary events in stream channels. Canadian Water Resources Journal. https:/doi.org/10.1080/07011784.2015.1028451.
Jakob, M. & Jordan, P. (2001). Design flood estimates in mountain streams – the need for a geomorphic approach. Canadian Journal of Civil Engineering, 28, 425-239. https://doi.org/10.1139/l01-010.
Jakob, M., McDougall, S., Bale, S., & Friele, P. (2016). Regional Debris-flow Frequency-Magnitude Curves. GeoVancouver. Vancouver, BC.
Jakob, M., Moase, E., McDougall, S., Friele, P., Lau, C-A., & Bale, S. (2020). Regional debris-flow frequency-magnitude curves. Submitted to Earth Surface Processes and Landforms.
Jakob, M., Stein, D., & Ulmi, M. (2012). Vulnerability of buildings to debris-flow impact. Natural Hazards, 60(2), 241-261. https://doi.org/10.1007/s11069-011-0007-2
Kellerhals, R. & Church, M. (1990). Hazard management on fans, with examples from British Columbia. In: Rachocki, A.H. & Church, M. (Eds.), Alluvial fans: a field approach (pp. 335-354). John Wiley & Sons, Chichester, UK.
Klock, G.O. & Helvey, J.D. (1976). Debris flows following wildfire in North Central Washington. In Proceedings of the 3rd Federal Inter-Agency Sedimentation Conference, March 22-25, Denver, Colorado. Water Resources Council, Denver, CO. pp. 91-98.
Klohn Crippen. (1998, May 29). Terrain Stability Inventory, Alluvial and Debris Torrent Fans, Kootenay Region [Report]. Prepared for the Ministry of Water, Land and Air Protection.
Lau, C.A. (2017). Channel scour on temperate alluvial fans in British Columbia (Master’s thesis). Simon Fraser University, Burnaby, British Columbia. Retrieved from http://summit.sfu.ca/system/files/iritems1/17564/etd10198_CLau.pdf
Major, J., Pierson, T., & Scott, K. (2005). Debris flows at Mount St. Helens, Washington, USA. In M. Jakob, O. Hungr (Eds), Debris-flow Hazards and Related Phenomena (pp. 685-731). Springer, Berlin Heidelberg.
Melton, M.A. (1957). An analysis of the relation among elements of climate, surface properties and geomorphology. Office of Nav Res Dept Geol Columbia Univ, NY. Tech Rep 11
Michael Cullen Geotechnical Ltd & Cordilleran Geoscience. (2015). Assessment of debris floods, debris flows and glacial lake outburst floods on the proposed Wedge Creek run of river power project Phase 1 [Report]. Prepared for Lil’wat Construction Enterprises LP, Mount Currie, BC.
Ministry of Environment and Climate Change Strategy (2016). Terrestrial ecosystem inventory distribution package – Non Predictive Ecosystem Mapping (South Coast, Thompson/Okanagan) [GIS files]. Retrieved from http://www.env.gov.bc.ca/esd/distdata/ecosystems/TEI/TEI_Data/
Columbia Shuswap Regional District April 16, 2020 Geohazard Risk Prioritization – FINAL Project No.: 1899001
Appendix E - Hazard Assessment Methods - Steep Creeks.docx E-49
BGC ENGINEERING INC.
Ministry of Forests, Lands and Natural Resource Operations (MFLNRO), Water Management Branch. (2017a). BC Dams. Available online at: www.env.gov.bc.ca/wsd/public_safety/flood/fhm-2012/landuse_floodplain_maps.html [accessed: 07/10/2018]
Mizuyama, T., Kobashi, S., & Ou, G. (1992). Prediction of debris-flow peak discharge, Interpraevent, International Symposium, Bern, Switzerland, Tagespublikation, 4; 99-108.
Montgomery, C.W. (1990). Physical Geology, 2nd edition. WCB Publishers, Dubuque, IA, USA.
Montgomery, D.R. & Buffington, J.M. (1997). Channel-reach morphology in mountain drainage basins. Geological Society of America Bulletin, 109, 596-611.
Natural Resources Canada (NRCan). (2016, January 25). National hydro network [GIS data]. Retrieved from http://open.canada.ca/data/en/dataset/a4b190fe-e090-4e6d-881e-b87956c07977.
Pacific Climate Impacts Consortium (PCIC). (2012). Plan2Adapt. https://www.pacificclimate.org/analysis-tools/plan2adapt. [Accessed August 17, 2018]
Parker, G. (1978). Self-formed straight rivers with equilibrium banks and mobile bed. Part 2. The gravel river. Journal of Fluid Mechanics, 89, 127-146.
Pierson, T.C. (2005a). Distinguishing between debris flows and floods from field evidence in small watersheds. Fact Sheet 2004-3142. U.S. Geological Survey.
Pierson, T.C. (2005b). Hyperconcentrated flow – transitional process between water flow and debris flow. In: Jakob, M. & Hungr O. (Eds.), Debris-flow hazards and related phenomena, Springer-Praxis, Chichester, UK, 159-202.
Prein, A.F., Rasmussen, R.M., Ikeda, K., Liu, C., Clark, M.P, and Holland, G.J. (2017). The future intensification of hourly precipitation extremes. Nature Climate Change, 7, 48-52.
Rickenmann, D. (1999). Empirical relationships for debris flows. Natural Hazards, 19, 47-77. https://doi.org/10.1023/A:1008064220727
Ryder, J.M. (1971a). Some aspects of the morphometry of paraglacial alluvial fans in south-central British Columbia. Canadian Journal of Earth Sciences, 8, 1252-1264. https://doi.org/10.1139/e71-114
Ryder, J.M. (1971b). The stratigraphy and morphology of paraglacial alluvial fans in south-central British Columbia. Canadian Journal of Earth Sciences, 8, 279-298. https://doi.org/10.1139/e71-027
Schumm, S.A. (1977). The fluvial system. Wiley, New York, 338 p.
Sidle, R.C. (1991). A conceptual model of changes in root cohesion in response to vegetation management. Journal of Environmental Quality, 20, 43-52.

Columbia Shuswap Regional District April 16, 2020 Geohazard Risk Prioritization – FINAL Project No.: 1899001
Appendix E - Hazard Assessment Methods - Steep Creeks.docx E-50
BGC ENGINEERING INC.
Sidle, R.C. (2005). Influence of forest harvesting activities on debris avalanches and flows. In Jakob, M. & Hungr O. (Eds.), Debris-flow hazards and related phenomena (pp. 387-209). Springer-Praxis, Chichester, UK.
Sidle, R.C. & Onda, Y. (2004). Hydrogeomorphology: Overview of an emerging science. Hydrological Processes, 18(4), 597-602. https://doi.org/10.1002/hyp.1360
Strahler, A.N. (1952). Hypsometric (area-altitude) analysis of erosional topography. Bulletin Geological Society of America, 63, 1117-1142.
Takahashi T. (1991). Debris flows. Rotterdam, Balkema.
Terratech Consulting Ltd. (1999). Detailed Terrain Stability Mapping (TSIL C) Hummingbird Creek and Mara Creek Watersheds.
Tetra Tech EBA. (2014). Summary of Stephen Creek Debris Flow Hazard and Risk Assessment [Report]. Prepared for Parks Canada.
van Dijk, M., Kleihans, M.G., & Postma, G. (2009). Autocyclic behaviour of fan deltas: an analogue experimental study. Sedimentology, 56(5), 1569-1589. https://doi.org/10.1111/j.1365-3091.2008.01047.x
van Dijk, M., Kleihans, M.G., Postma, G., & Kraal, E. (2012). Contrasting morphodynamics in alluvial fans and fan deltas: effects of the downstream boundary. Sedimentology, 59(7), 2125-2145. https://doi.org/10.1111/j.1365-3091.2012.01337.x
Columbia Shuswap Regional District April 16, 2020 Geohazard Risk Prioritization - FINAL Project No.: 1899001
BGC ENGINEERING INC.
APPENDIX F RISK ASSESSMENT INFORMATION TEMPLATE (RAIT)

Page 1 of 19
National Disaster Mitigation Program (NDMP) Risk Assessment Information Template
UNCLASSIFIED
Risk Event Details
Start and End Date Provide the start and end dates of the selected event, based on historical data. Start Date: End Date:
Severity of the Risk Event
Provide details about the risk, including: • Speed of onset and duration of event; • Level and type of damaged caused; • Insurable and non-insurable losses; and • Other details, as appropriate.
This RAIT focuses on Sicamous Creek, a steep creek located 2.5 km south of the town of Sicamous, BC along Mara Lake. This RAIT is an example of the range of proposed studies included with this funding application. The Sicamous Creek fan contains 64 parcels and 1 business. The medial portion of the fan is crossed by Highway 97A. This creek has been subject to debris flood events in 1927, 1935, the 1950s, 1997, and 2012. The 2012 debris flood event damaged several homes and caused Highway 97A to be closed while repairs to the event-damaged bridge could be completed. The 2012 event led to the shutdown of a houseboat company, with severe loss of business revenue. This triggered a lawsuit against the district, province, and two individuals lasting 7 years, and eventual bankruptcy of the houseboat company.
Response During the Risk Event Provide details on how the defined geographic area continued its essential operations while responding to the event.
During the 1997 event, when the creek threatened to avulse at the McLaughlin bridge, an excavator was used to remove the bridge in order to avoid blockage. During the 2012 event. portions of the fan were evacuated, Highway 97A was closed for several days, the creek was once again excavated into its former bed, and the northern portion of the fan regraded.
Recovery Method for the Risk Event Provide details on how the defined geographic area recovered.
Following the 1997 flood, the McLaughlin Bridge was replaced in 1998 using Provincial Emergency Program funding. After the 2012 event extensive riprap was added to the channel, extending from the former location of the McLaughlin bridge to the fan apex. In an expert opinion by Dr. Matthias Jakob, the necessity of a comprehensive mitigation strategy was emphasized and it was stressed that riprapping portions of the channel does not constitute an appropriate risk reduction measure.
Recovery Costs Related to the Risk Event
Provide details on the costs, in dollars, associated with implementing recovery strategies following the event.
The McLaughlin bridge was removed following the 2012 event; as of this point, there are no plans to replace the bridge. Although exact recovery costs are not known at this time, they are estimated to be in excess of $1M.

Page 2 of 19
Recovery Time Related to the Risk Event
Provide details on the recovery time needed to return to normal operations following the event.
As the houseboat company located on the fan went bankrupt following the 2012 event, full recovery has not been possible. In 2012, Highway 97A was closed for several days.

Page 3 of 19
UNCLASSIFIEDNational Disaster Mitigation Program Risk Assessment Information Template
Risk Event Identification and Overview
Provide a qualitative description of the defined geographic area, including: • Watershed/community/region name(s); • Province/Territory; • Area type (i.e., city, township, watershed, organization, etc.); • Population size; • Population variances (e.g., significant change in population between summer and winter
months); • Main economic areas of interest; • Special consideration areas (e.g., historical, cultural and natural resource areas); and an • Estimate of the annual operating budget of the area.
- Watershed of Sicamous Creek - Province of British Columbia - District of Sicamous - Estimated population of 70 - Main economic areas of interest: tourism (houseboating), fishing, forestry - Key transportation corridor of Highway 97A, connecting Sicamous to communities to the south including Swansea Point and Grindrod
EBA Engineering (2006) conducted a debris flow and flood hazard assessment of proposed development along Sicamous Creek, owned by Waterway Houseboats Inc. This study is currently being completed (2020): BGC Engineering Inc. (BGC) is currently completing a flood and steep creek geohazard risk prioritization study for the Columbia Shuswap Regional District (CSRD) under the National Disaster Mitigation Program (NDMP) Stream 1 funding. This study includes the following methodologies: hazard identification, vulnerability analysis, likelihood assessment, impact assessment, and risk assessment.
Provide the year in which the following processes/analyses were last completed and state the methodology(ies) used:
• Hazard identification; • Vulnerability analysis; • Likelihood assessment; • Impact assessment; • Risk assessment; • Resiliency assessment; and/or • Climate change impact and/or adaptation assessment.
Note: It is recognized that many of the processes/analyses mentioned above may be included within one methodology.
Methodolgies, processes and analyses

Page 4 of 19
UNCLASSIFIEDNational Disaster Mitigation Program Risk Assessment Information Template
Hazard Mapping
To complete this section: • Obtain a map of the area that clearly indicates general land uses, neighbourhoods, landmarks, etc. For clarity throughout this exercise, it may be beneficial to omit any non-essential
information from the map intended for use. Controlled photographs (e.g. aerial photography) can be used in place of or in addition to existing maps to avoid the cost of producing new maps. • Place a grid over the maps/photographs of the area and assign row and column identifiers. This will help identify the specific area(s) that may be impacted, as well as additional information on
the characteristics within and affecting the area. • Identify where and how flood hazards may affect the defined geographic area. • Identify the mapped areas that are most likely to be impacted by the identified flood hazard.
Map(s)/photograph(s) can also be used, where appropriate, to visually represent the information/prioritization being provided as part of this template.
Hazard identification and prioritization
List known or likely flood hazards to the defined geographic area in order of proposed priority. For example: (1) dyke breach overland flooding; (2) urban storm surge flooding ; and so on.
(1) debris flood; (2) flooding
Provide a rationale for each prioritization and the key information sources supporting this rationale.
Sicamous Creek is rated "Very High" priority in relation to other creeks within the Columbia Shuswap Regional District, according to the results of the current study.
Risk Event Title
Identify the name/title of the risk. An example of a risk event name or title is: "A one-in-one hundred year flood following an extreme rain event."
A one-in-fifty year debris flood with the potential for avulsion affecting surrounding homes and Highway 97A.
Type of Flood Hazard
Identify the type of flood hazard being described (e.g., riverine flooding, coastal inundation, urban run-off, etc.)
A steep creek debris flood with severe bank erosion, sediment, and inundation causing highway blockage, bridge damage, and flooding of properties.
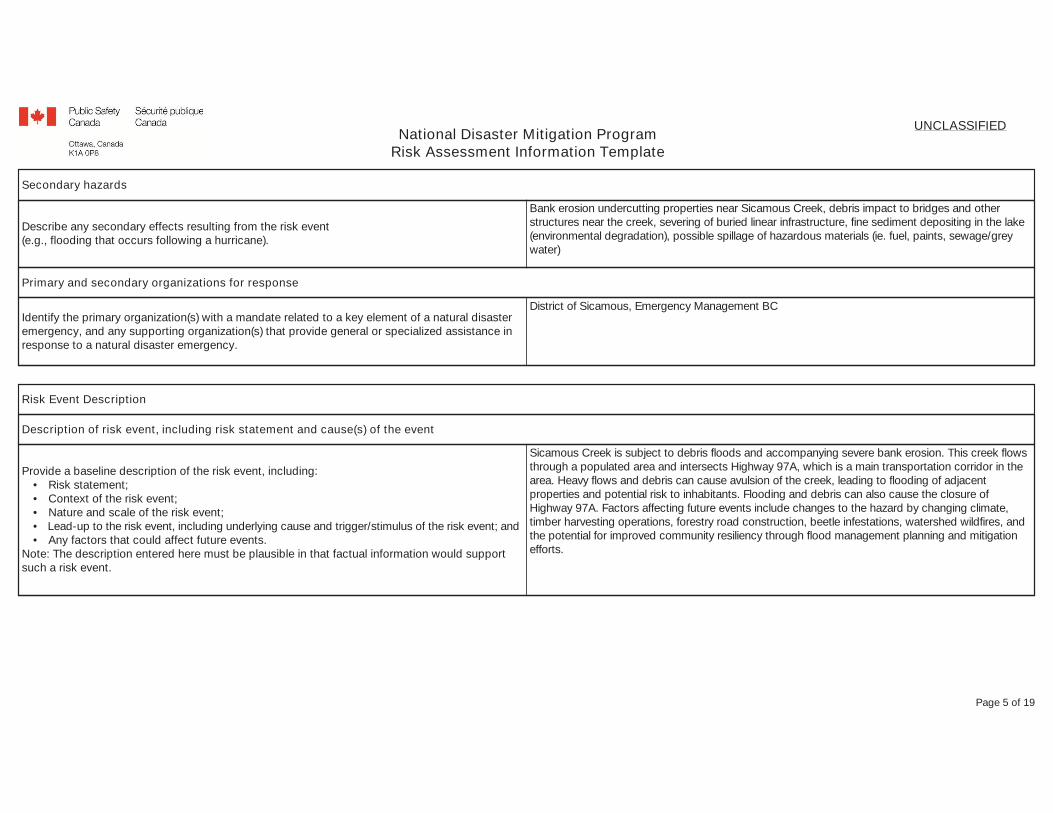
Page 5 of 19
UNCLASSIFIEDNational Disaster Mitigation Program Risk Assessment Information Template
Secondary hazards
Describe any secondary effects resulting from the risk event (e.g., flooding that occurs following a hurricane).
Bank erosion undercutting properties near Sicamous Creek, debris impact to bridges and other structures near the creek, severing of buried linear infrastructure, fine sediment depositing in the lake (environmental degradation), possible spillage of hazardous materials (ie. fuel, paints, sewage/grey water)
Primary and secondary organizations for response
Identify the primary organization(s) with a mandate related to a key element of a natural disaster emergency, and any supporting organization(s) that provide general or specialized assistance in response to a natural disaster emergency.
District of Sicamous, Emergency Management BC
Risk Event Description
Description of risk event, including risk statement and cause(s) of the event
Provide a baseline description of the risk event, including: • Risk statement; • Context of the risk event; • Nature and scale of the risk event; • Lead-up to the risk event, including underlying cause and trigger/stimulus of the risk event; and • Any factors that could affect future events.
Note: The description entered here must be plausible in that factual information would support such a risk event.
Sicamous Creek is subject to debris floods and accompanying severe bank erosion. This creek flows through a populated area and intersects Highway 97A, which is a main transportation corridor in the area. Heavy flows and debris can cause avulsion of the creek, leading to flooding of adjacent properties and potential risk to inhabitants. Flooding and debris can also cause the closure of Highway 97A. Factors affecting future events include changes to the hazard by changing climate, timber harvesting operations, forestry road construction, beetle infestations, watershed wildfires, and the potential for improved community resiliency through flood management planning and mitigation efforts.

Page 6 of 19
UNCLASSIFIEDNational Disaster Mitigation Program Risk Assessment Information Template
Location
Provide details regarding the area impacted by the risk event such as: • Province(s)/territory(ies); • Region(s) or watershed(s); • Municipality(ies); • Community(ies); and so on.
- Province: British Columbia - Region/Watershed: Columbia Shuswap Regional District, Sicamous Creek - Municipality: District of Sicamous
Natural environment considerations
Document relevant physical or environmental characteristics of the defined geographic area.
The area of the Sicamous Creek alluvial fan covers an area of 0.3 square km, and has been developed with residential properties and businesses. Sicamous Creek has a cumulative catchment area of approximately 65 square km, with a Melton ratio of 0.2 and watershed relief of 1903 masl.
Meteorological conditions
Identify the relevant meteorological conditions that may influence the outcome of the risk event.
A seasonal freshet flood occurring between late April and early July is snowmelt controlled. Extreme events are triggered by rain-on-snow events, occurring in late spring or early summer. Especially when coinciding with high lake levels, which decrease the surface water slope, thereby inducing hydraulic and morphodynamic backwatering. This implies potentially severe sediment build up immediately upstream of the fan delta front and thus increased avulsion potential.
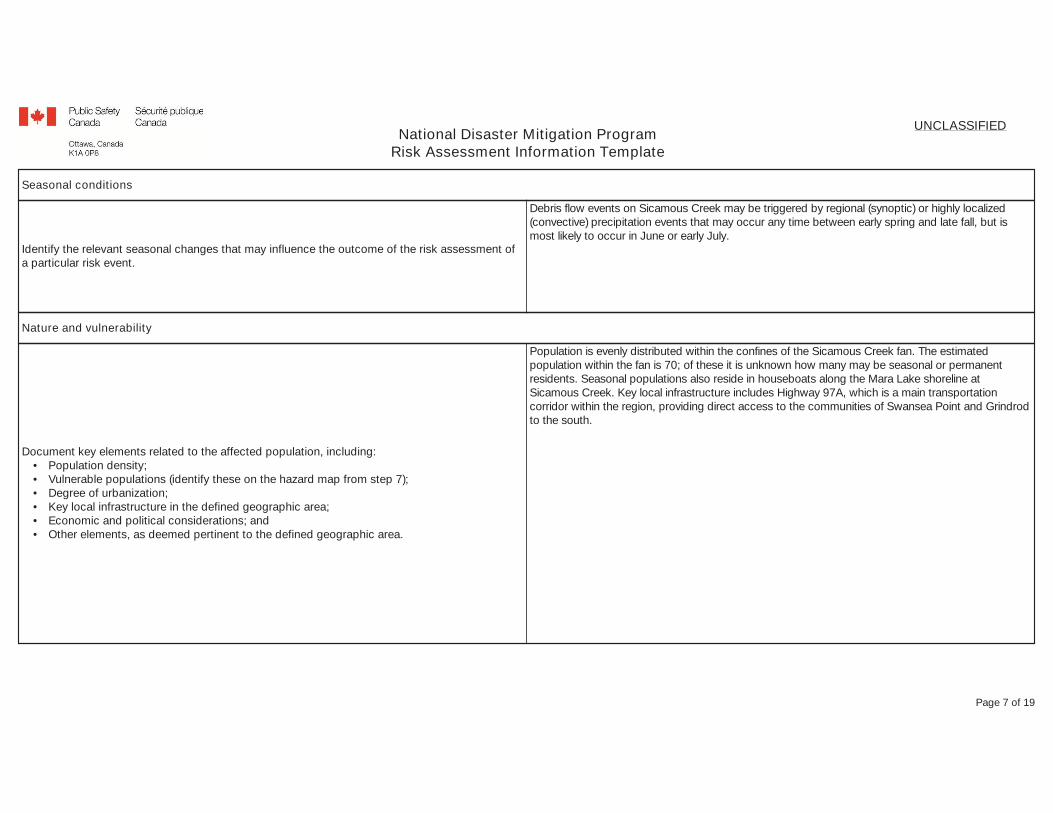
Page 7 of 19
UNCLASSIFIEDNational Disaster Mitigation Program Risk Assessment Information Template
Seasonal conditions
Identify the relevant seasonal changes that may influence the outcome of the risk assessment of a particular risk event.
Debris flow events on Sicamous Creek may be triggered by regional (synoptic) or highly localized (convective) precipitation events that may occur any time between early spring and late fall, but is most likely to occur in June or early July.
Nature and vulnerability
Document key elements related to the affected population, including: • Population density; • Vulnerable populations (identify these on the hazard map from step 7); • Degree of urbanization; • Key local infrastructure in the defined geographic area; • Economic and political considerations; and • Other elements, as deemed pertinent to the defined geographic area.
Population is evenly distributed within the confines of the Sicamous Creek fan. The estimated population within the fan is 70; of these it is unknown how many may be seasonal or permanent residents. Seasonal populations also reside in houseboats along the Mara Lake shoreline at Sicamous Creek. Key local infrastructure includes Highway 97A, which is a main transportation corridor within the region, providing direct access to the communities of Swansea Point and Grindrod to the south.

Page 8 of 19
UNCLASSIFIEDNational Disaster Mitigation Program Risk Assessment Information Template
Asset inventory
Identify the asset inventory of the defined geographic area, including: • Critical assets; • Cultural or historical assets; • Commercial assets; and • Other area assets, as applicable to the defined geographic area.
Key asset-related information should also be provided, including:
• Location on the hazard map (from step 7); • Size; • Structure replacement cost; • Content value; • Displacement costs; • Importance rating and rationale; • Vulnerability rating and reason; and • Average daily cost to operate.
A total estimated value of physical assets in the area should also be provided.
Assets include residential areas with estimated total improvement value of $14M, 1 business, and Highway 97A. Total population is estimated to be 70 people.
Other assumptions, variability and/or relevant information
Identify any assumptions made in describing the risk event; define details regarding any areas of uncertainty or unpredictability around the risk event; and supply any supplemental information, as applicable.
The most recent risk prioritization study conducted for the CSRD rated Sicamous Creek as a Very High hazard, as compared to other steep creek hazards within the study area. This assessment was conducted using available aerial imagery and previously conducted studies to assign qualitative hazard ratings. Risk was assessed using provided information regarding improvement values of parcels intersecting the fan, and is reliant on the accuracy of that information. A seven year long lawsuit between a houseboat rental company and the province/district/private landowner ensued during which the high hazard and high risk condition of Sicamous Creek fan delta was established by several expert witnesses.
Existing Risk Treatment Measures
Identify existing risk treatment measures that are currently in place within the defined geographic area to mitigate the risk event, and describe the sufficiency of these risk treatment measures.
Existing risk treatment measures include excavation of the main channel to increase capacity, removal of the McLaughlin bridge, and riprap armouring of the channel from the previous location of the McLaughlin bridge to the fan apex. These measures are not sufficient to adequately reduce the residual risk to infrastructure on the fan, as opined by Dr. Matthias Jakob, who acted as an expert witness in the above mentioned lawsuit.
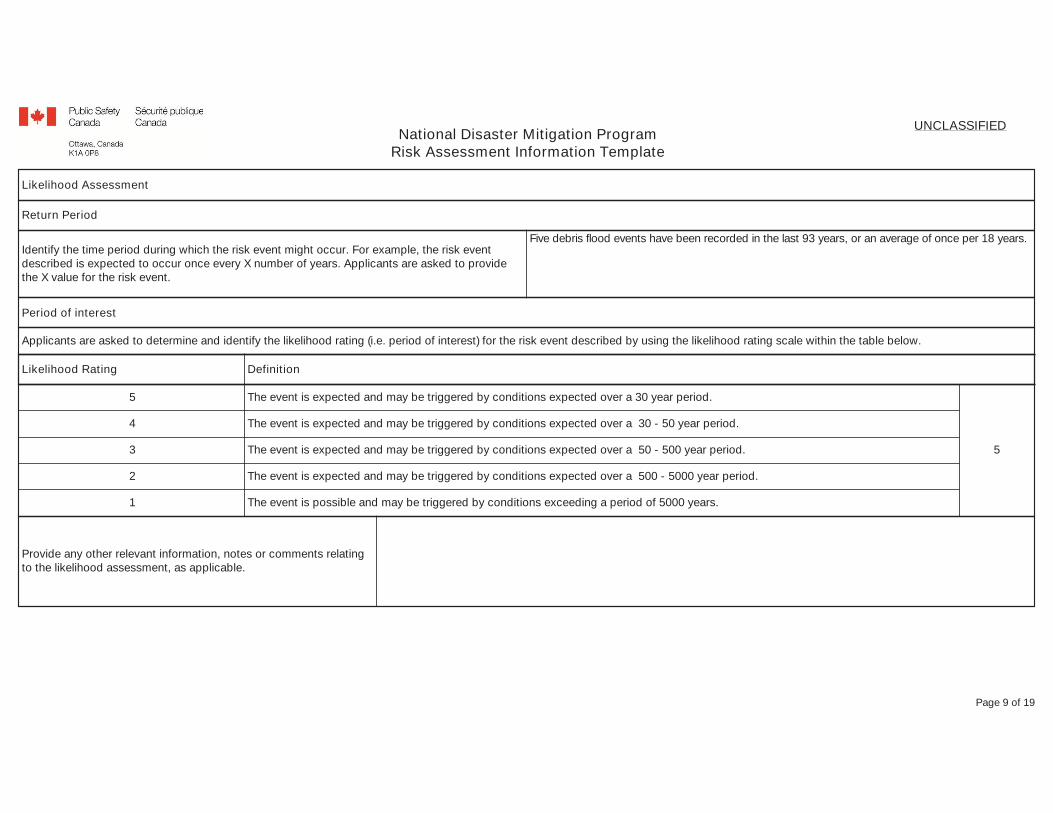
Page 9 of 19
UNCLASSIFIEDNational Disaster Mitigation Program Risk Assessment Information Template
Likelihood Assessment
Return Period
Identify the time period during which the risk event might occur. For example, the risk event described is expected to occur once every X number of years. Applicants are asked to provide the X value for the risk event.
Five debris flood events have been recorded in the last 93 years, or an average of once per 18 years.
Period of interest
Applicants are asked to determine and identify the likelihood rating (i.e. period of interest) for the risk event described by using the likelihood rating scale within the table below.
Likelihood Rating Definition
5 The event is expected and may be triggered by conditions expected over a 30 year period.
4 The event is expected and may be triggered by conditions expected over a 30 - 50 year period.
3 The event is expected and may be triggered by conditions expected over a 50 - 500 year period.
2 The event is expected and may be triggered by conditions expected over a 500 - 5000 year period.
1 The event is possible and may be triggered by conditions exceeding a period of 5000 years.
5
Provide any other relevant information, notes or comments relating to the likelihood assessment, as applicable.
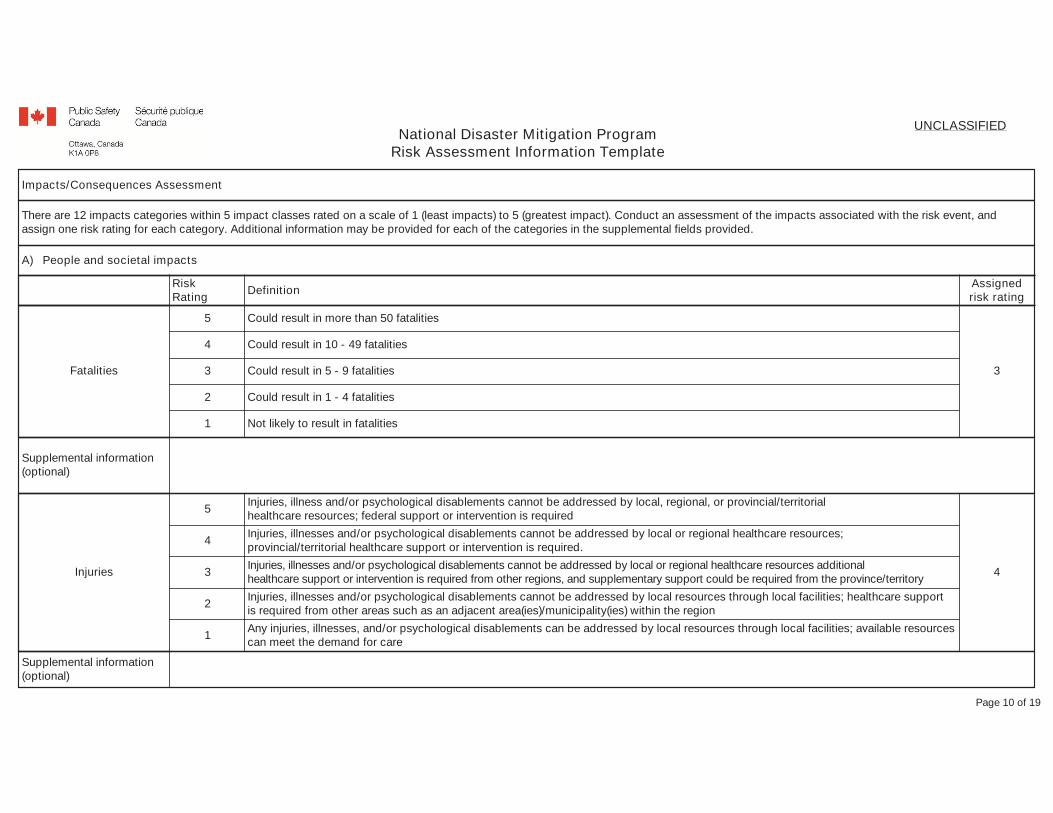
Page 10 of 19
UNCLASSIFIEDNational Disaster Mitigation Program Risk Assessment Information Template
Impacts/Consequences Assessment
There are 12 impacts categories within 5 impact classes rated on a scale of 1 (least impacts) to 5 (greatest impact). Conduct an assessment of the impacts associated with the risk event, and assign one risk rating for each category. Additional information may be provided for each of the categories in the supplemental fields provided.
A) People and societal impacts
Risk Rating Definition Assigned
risk rating
Fatalities
5 Could result in more than 50 fatalities
4 Could result in 10 - 49 fatalities
3 Could result in 5 - 9 fatalities
2 Could result in 1 - 4 fatalities
1 Not likely to result in fatalities
3
Supplemental information (optional)
Injuries
5 Injuries, illness and/or psychological disablements cannot be addressed by local, regional, or provincial/territorial healthcare resources; federal support or intervention is required
4 Injuries, illnesses and/or psychological disablements cannot be addressed by local or regional healthcare resources; provincial/territorial healthcare support or intervention is required.
3 Injuries, illnesses and/or psychological disablements cannot be addressed by local or regional healthcare resources additional healthcare support or intervention is required from other regions, and supplementary support could be required from the province/territory
2 Injuries, illnesses and/or psychological disablements cannot be addressed by local resources through local facilities; healthcare support is required from other areas such as an adjacent area(ies)/municipality(ies) within the region
1 Any injuries, illnesses, and/or psychological disablements can be addressed by local resources through local facilities; available resources can meet the demand for care
4
Supplemental information (optional)

Page 11 of 19
UNCLASSIFIEDNational Disaster Mitigation Program Risk Assessment Information Template
Risk Rating Definition Assigned
risk rating
Displacement
Percentage of
displaced individuals
5 > 15% of total local population
4 10 - 14.9% of total local population
3 5 - 9.9% of total local population
2 2 - 4.9% of total local population
1 0 - 1.9% of total local population
5
Duration of displacement
5 > 26 weeks (6 months)
4 4 weeks - 26 weeks (6 months)
3 1 week - 4 weeks
2 72 hours - 168 hours (1 week)
1 Less than 72 hours
3
Supplemental information (optional)
B) Environmental impacts
5> 75% of flora or fauna impacted or 1 or more ecosystems significantly impaired; Air quality has significantly deteriorated; Water quality is significantly lower than normal or water level is > 3 meters above highest natural level; Soil quality or quantity is significantly lower (i.e., significant soil loss, evidence of lethal soil contamination) than normal; > 15% of local area is affected
440 - 74.9% of flora or fauna impacted or 1 or more ecosystems considerably impaired; Air quality has considerably deteriorated; Water quality is considerably lower than normal or water level is 2 - 2.9 meters above highest natural level; Soil quality or quantity is moderately lower than normal; 10 - 14.9% of local area is affected
310 - 39.9% of flora or fauna impacted or 1 1 or more ecosystems moderately impaired; Air quality has moderately deteriorated; Water quality is moderately lower than normal or water level is 1 - 2 meters above highest natural level; Soil quality is moderately lower than normal; 6 - 9.9 % of area affected
3

Page 12 of 19
UNCLASSIFIEDNational Disaster Mitigation Program Risk Assessment Information Template
2< 10 % of flora or fauna impacted or little or no impact to any ecosystems; Little to no impact to air quality and/or soil quality or quantity; Water quality is slightly lower than normal, or water level is less than 0.9 meters above highest natural level and increased for less than 24 hours; 3 ‐ 5.9 % of local area is affected
1 Little to no impact to flora or fauna, any ecosystems, air quality, water quality or quantity, or to soil quality or quantity; 0 ‐ 2.9 % of local area is affected
Supplemental information (optional)
C) Local economic impacts
Risk Rating Definition Assigned
risk rating
5 > 15 % of local economy impacted
4 10 ‐ 14.9 % of local economy impacted
3 6 ‐ 9.9 % of local economy impacted
2 3 ‐ 5.9 % of local economy impacted
1 0 ‐ 2.9 % of local economy impacted
5
Supplemental information (optional)
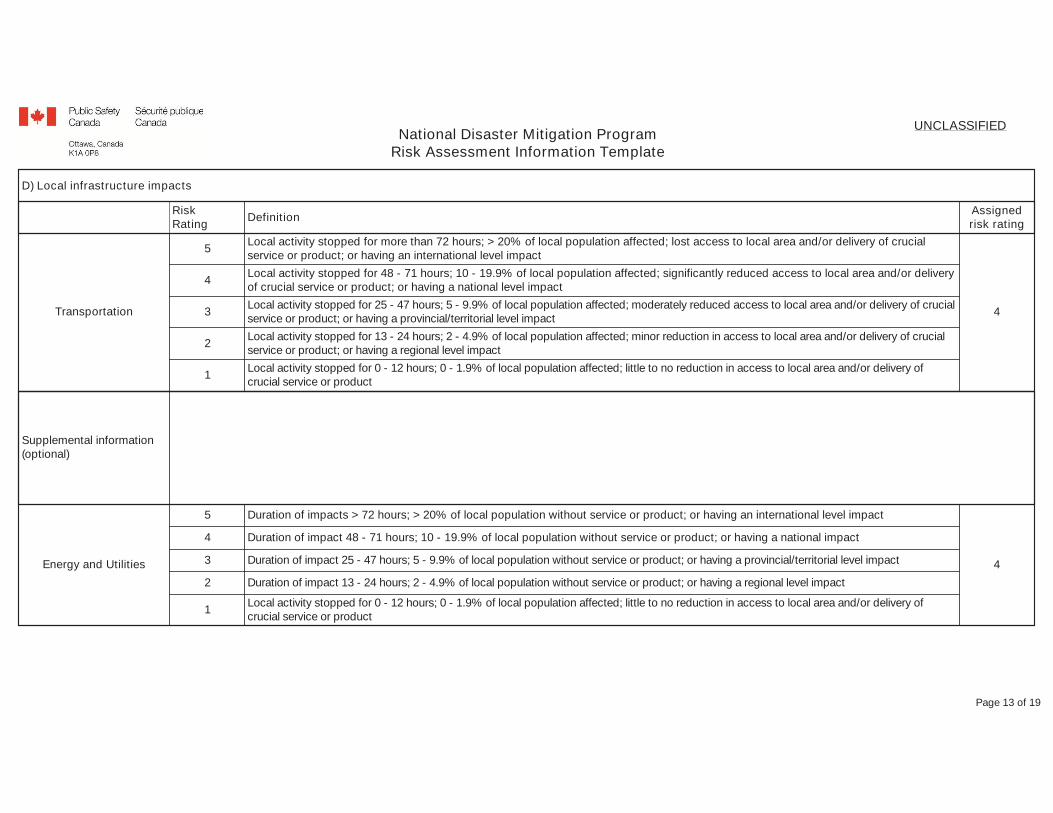
Page 13 of 19
UNCLASSIFIEDNational Disaster Mitigation Program Risk Assessment Information Template
D) Local infrastructure impacts
Risk Rating Definition Assigned
risk rating
Transportation
5 Local activity stopped for more than 72 hours; > 20% of local population affected; lost access to local area and/or delivery of crucial service or product; or having an international level impact
4 Local activity stopped for 48 - 71 hours; 10 - 19.9% of local population affected; significantly reduced access to local area and/or delivery of crucial service or product; or having a national level impact
3 Local activity stopped for 25 - 47 hours; 5 - 9.9% of local population affected; moderately reduced access to local area and/or delivery of crucial service or product; or having a provincial/territorial level impact
2 Local activity stopped for 13 - 24 hours; 2 - 4.9% of local population affected; minor reduction in access to local area and/or delivery of crucial service or product; or having a regional level impact
1 Local activity stopped for 0 - 12 hours; 0 - 1.9% of local population affected; little to no reduction in access to local area and/or delivery of crucial service or product
4
Supplemental information (optional)
Energy and Utilities
5 Duration of impacts > 72 hours; > 20% of local population without service or product; or having an international level impact
4 Duration of impact 48 - 71 hours; 10 - 19.9% of local population without service or product; or having a national impact
3 Duration of impact 25 - 47 hours; 5 - 9.9% of local population without service or product; or having a provincial/territorial level impact
2 Duration of impact 13 - 24 hours; 2 - 4.9% of local population without service or product; or having a regional level impact
1 Local activity stopped for 0 - 12 hours; 0 - 1.9% of local population affected; little to no reduction in access to local area and/or delivery of crucial service or product
4
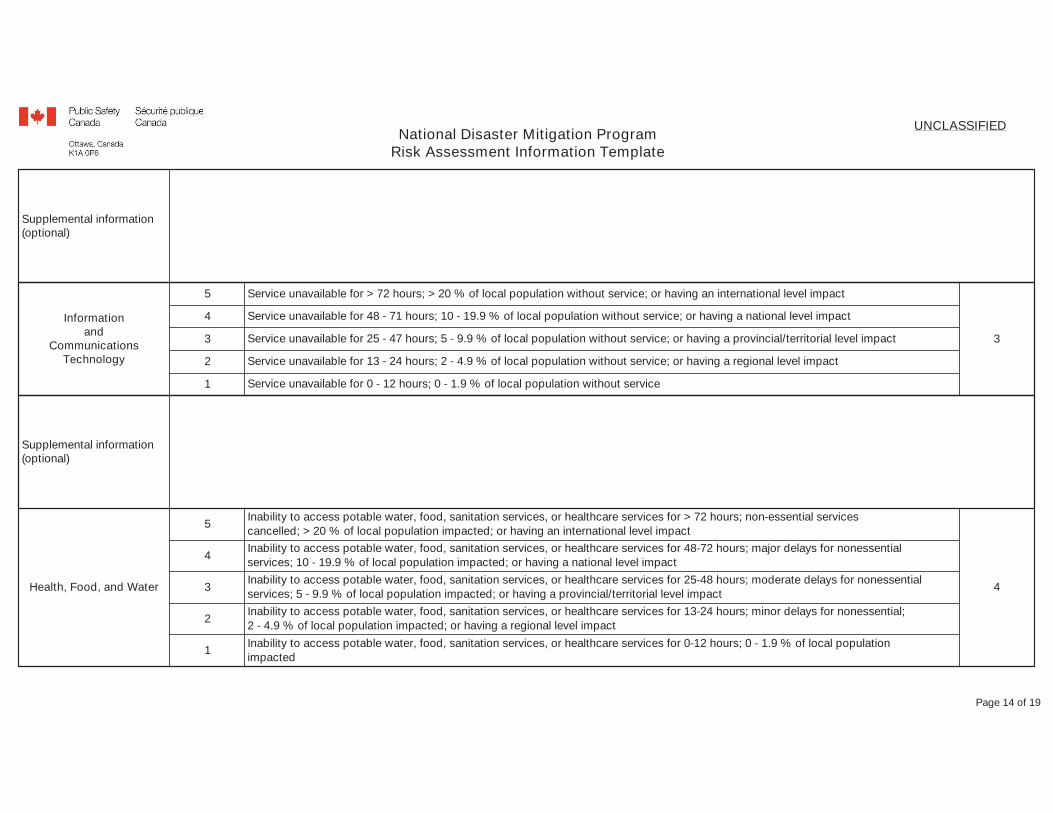
Page 14 of 19
UNCLASSIFIEDNational Disaster Mitigation Program Risk Assessment Information Template
Supplemental information (optional)
Information and
Communications Technology
5 Service unavailable for > 72 hours; > 20 % of local population without service; or having an international level impact
4 Service unavailable for 48 ‐ 71 hours; 10 ‐ 19.9 % of local population without service; or having a national level impact
3 Service unavailable for 25 ‐ 47 hours; 5 ‐ 9.9 % of local population without service; or having a provincial/territorial level impact
2 Service unavailable for 13 ‐ 24 hours; 2 ‐ 4.9 % of local population without service; or having a regional level impact
1 Service unavailable for 0 ‐ 12 hours; 0 ‐ 1.9 % of local population without service
3
Supplemental information (optional)
Health, Food, and Water
5 Inability to access potable water, food, sanitation services, or healthcare services for > 72 hours; non‐essential services cancelled; > 20 % of local population impacted; or having an international level impact
4 Inability to access potable water, food, sanitation services, or healthcare services for 48‐72 hours; major delays for nonessential services; 10 ‐ 19.9 % of local population impacted; or having a national level impact
3 Inability to access potable water, food, sanitation services, or healthcare services for 25‐48 hours; moderate delays for nonessential services; 5 ‐ 9.9 % of local population impacted; or having a provincial/territorial level impact
2 Inability to access potable water, food, sanitation services, or healthcare services for 13‐24 hours; minor delays for nonessential; 2 ‐ 4.9 % of local population impacted; or having a regional level impact
1 Inability to access potable water, food, sanitation services, or healthcare services for 0‐12 hours; 0 ‐ 1.9 % of local population impacted
4

Page 15 of 19
UNCLASSIFIEDNational Disaster Mitigation Program Risk Assessment Information Template
Supplemental information (optional)
Safety and Security
5 > 20 % of local population impacted; loss of intelligence or defence assets or systems for > 72 hours; or having an international level impact
4 10 ‐ 19.9 % of local population impacted; loss of intelligence or defence assets or systems for 48 – 71 hours; or having a national level impact
3 5 ‐ 9.9 % of local population impacted; loss of intelligence or defence assets or systems for 25 – 47 hours; or having a provincial/territorial level impact
2 2 ‐ 4.9 % of local population impacted; loss of intelligence or defence assets or systems for 13 – 24 hours; or having a regional level impact
1 0 ‐ 1.9 % of local population impacted; loss of intelligence or defence assets or systems for 0 – 12 hours
3
Supplemental information (optional)
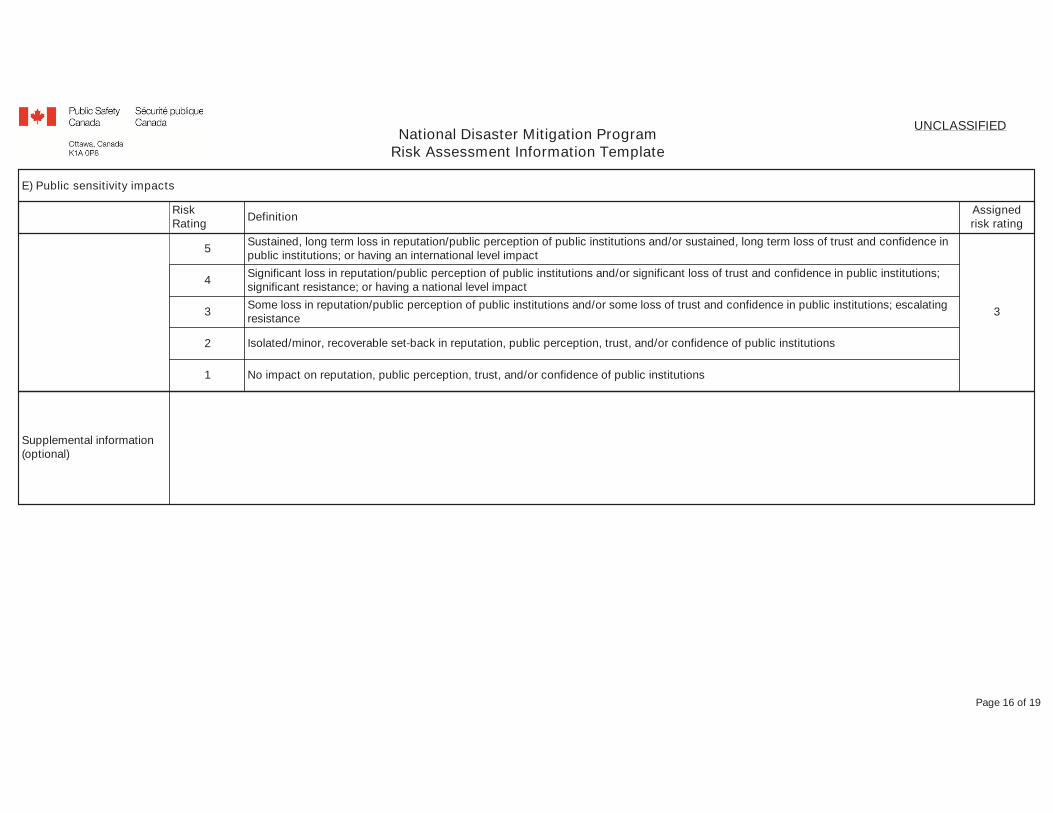
Page 16 of 19
UNCLASSIFIEDNational Disaster Mitigation Program Risk Assessment Information Template
E) Public sensitivity impacts
Risk Rating Definition Assigned
risk rating
5 Sustained, long term loss in reputation/public perception of public institutions and/or sustained, long term loss of trust and confidence in public institutions; or having an international level impact
4 Significant loss in reputation/public perception of public institutions and/or significant loss of trust and confidence in public institutions; significant resistance; or having a national level impact
3 Some loss in reputation/public perception of public institutions and/or some loss of trust and confidence in public institutions; escalating resistance
2 Isolated/minor, recoverable set‐back in reputation, public perception, trust, and/or confidence of public institutions
1 No impact on reputation, public perception, trust, and/or confidence of public institutions
3
Supplemental information (optional)
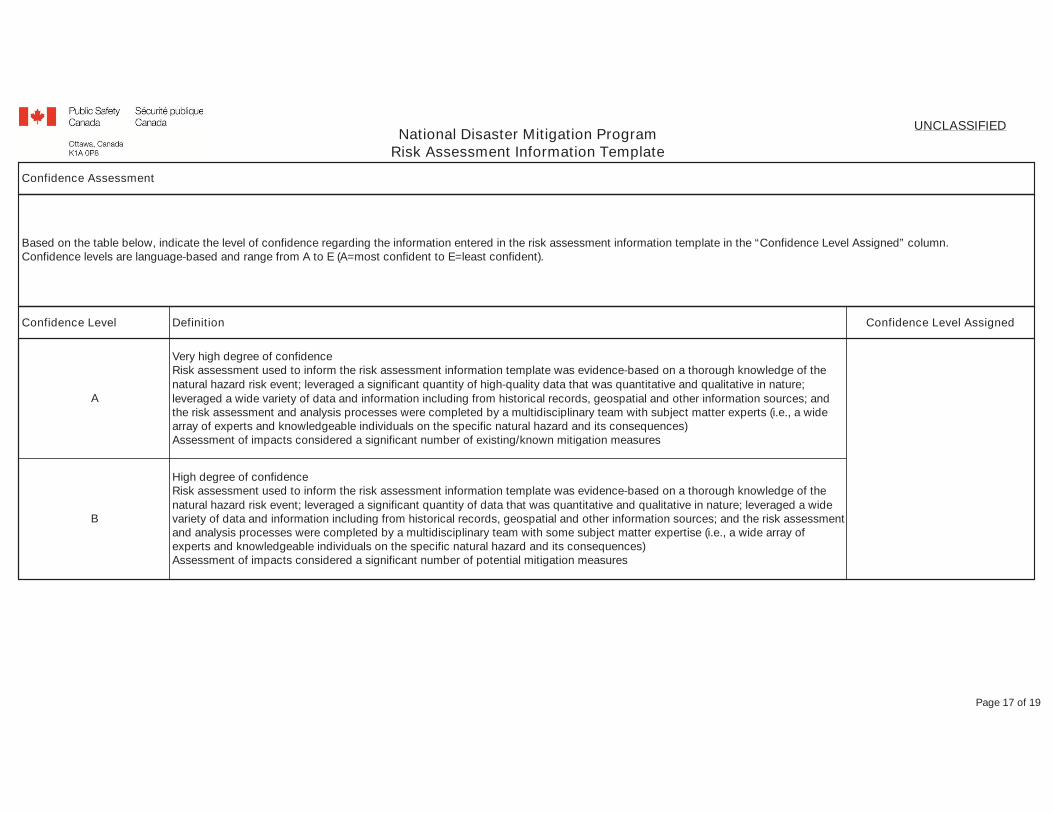
Page 17 of 19
UNCLASSIFIEDNational Disaster Mitigation Program Risk Assessment Information Template
Confidence Assessment
Based on the table below, indicate the level of confidence regarding the information entered in the risk assessment information template in the “Confidence Level Assigned” column. Confidence levels are language‐based and range from A to E (A=most confident to E=least confident).
Confidence Level Definition Confidence Level Assigned
A
Very high degree of confidence Risk assessment used to inform the risk assessment information template was evidence‐based on a thorough knowledge of the natural hazard risk event; leveraged a significant quantity of high‐quality data that was quantitative and qualitative in nature; leveraged a wide variety of data and information including from historical records, geospatial and other information sources; and the risk assessment and analysis processes were completed by a multidisciplinary team with subject matter experts (i.e., a wide array of experts and knowledgeable individuals on the specific natural hazard and its consequences) Assessment of impacts considered a significant number of existing/known mitigation measures
B
High degree of confidence Risk assessment used to inform the risk assessment information template was evidence‐based on a thorough knowledge of the natural hazard risk event; leveraged a significant quantity of data that was quantitative and qualitative in nature; leveraged a wide variety of data and information including from historical records, geospatial and other information sources; and the risk assessment and analysis processes were completed by a multidisciplinary team with some subject matter expertise (i.e., a wide array of experts and knowledgeable individuals on the specific natural hazard and its consequences) Assessment of impacts considered a significant number of potential mitigation measures

Page 18 of 19
UNCLASSIFIEDNational Disaster Mitigation Program Risk Assessment Information Template
C
Moderate confidence Risk assessment used to inform the risk assessment information template was moderately evidence‐based from a considerable amount of knowledge of the natural hazard risk event; leveraged a considerable quantity of data that was quantitative and/or qualitative in nature; leveraged a considerable amount of data and information including from historical records, geospatial and other information sources; and the risk assessment and analysis processes were completed by a moderately sized multidisciplinary team, incorporating some subject matter experts (i.e., a wide array of experts and knowledgeable individuals on the specific natural hazard and its consequences) Assessment of impacts considered a large number of potential mitigation measures
D
Low confidence Risk assessment used to inform the risk assessment information template was based on a relatively small amount of knowledge of the natural hazard risk event; leveraged a relatively small quantity of quantitative and/or qualitative data that was largely historical in nature; may have leveraged some geospatial information or information from other sources (i.e., databases, key risk and resilience methodologies); and the risk assessment and analysis processes were completed by a small team that may or may not have incorporated subject matter experts (i.e., did not include a wide array of experts and knowledgeable individuals on the specific natural hazard and its consequences). Assessment of impacts considered a relatively small number of potential mitigation measures
E
Very low confidence Risk assessment used to inform the risk assessment information template was not evidence‐based; leveraged a small quantity of information and/or data relating to the natural risk hazard and risk event; primary qualitative information used with little to no quantitative data or information; and the risk assessment and analysis processes were completed by an individual or small group of individuals little subject matter expertise (i.e., did not include a wide array of experts and knowledgeable individuals on the specific natural hazard and its consequences). Assessment of impacts did not consider existing or potential mitigation measures
B
Rationale for level of confidence
Provide the rationale for the selected confidence level, including any references or sources to support the level assigned.
This RAIT was prepared with reference to a detailed report prepared by a subject matter specialist in steep creek risk assessment, as cited below.

Page 19 of 19
UNCLASSIFIEDNational Disaster Mitigation Program Risk Assessment Information Template
Key Information Sources
Identify all supporting documentation and information sources for qualitative and quantitative data used to identify risk events, develop the risk event description, and assess impacts and likelihood. This ensures credibility and validity of risk information presented as well as enables referencing back to decision points at any point in time. Clearly identify unclassified and classified information.
EBA Engineering Consultants Ltd. (September 8, 2006). Debris flow and flood hazard assessment of the proposed development along Sicamous Creek [Report]. Prepared for Waterway Houseboats Inc. BGC Engineering Inc. (November 30, 2017). Expert Opinion - Waterway Houseboats et al. v. HMQ, Sicamous et al. [Letter]. Prepared for the Ministry of Justice. BGC Engineering Inc. (In Progress). Geohazard Risk Prioritization [Report]. Prepared for Columbia Shuswap Regional District.
Description of the risk analysis team
List and describe the type and level of experience of each individual who was involved with the completion of the risk assessment and risk analysis used to inform the information contained within this risk assessment information template.
Matthias Jakob, Ph.D., P.Geo. Dr. Jakob’s expertise revolves primarily around steep creek processes and risk management but extends to landslide and flood risk management for a broad range of private and government clients. He has authored some 40 peer reviewed journal papers and a total of over one hundred technical papers in journals, conference proceedings and books. He is adjunct professor at the Geography and Earth and Ocean Science departments at the University of British Columbia where he teaches courses in applied geomorphology.
Columbia Shuswap Regional District April 16, 2020 Geohazard Risk Prioritization - FINAL Project No.: 1899001
BGC ENGINEERING INC.
APPENDIX G EVENT HISTORY

Columbia-Shuswap Regional DistrictGeohazard Risk Prioritization - FINAL
April 16, 2020Project No.: 1899001
Year Month Type of Hazard Location Source Description of Event
1894 May 24 - June 14
Flood Golden, Illecillewaet River
Septer (2007) Flooding and mudslides cut the Canadian Pacific Railroad (CPR) line and “caused a longer lay out in train service in British Columbia than ever before.” Floods on the Columbia River were interrupting rail traffic at Golden. On May 24, the passenger train was delayed for several days at the Illecillewaet River. Other slides and washouts interrupted train traffic until June 14. High water and debris on the Illecillewaet River swept away the bridge at the 13th crossing of the CPR railway. Around May 25, a small mudslide was reported at Albert Canyon near Revelstoke.
1894 May 29 Flood Salmon Arm Septer (2007) Around May 29, after two weeks of warm weather, flooding was reported in Salmon Arm. Extensive flooding filled the valley and several locals evacuated their homes. The roads were flooded, and some culverts and bridges were washed out.
1894 May 31 Flood Salmon Arm, Salmon River
Septer (2007) The gravel road at Salmon River was flooded with approximately 1.2 m of water for about 2 km and nearly impassable. The Salmon River bridge was also impacted.
1894 June 1-3 Flood Salmon Arm, North Thompson River
Septer (2007) Between June 1-3, the North Thompson River dropped about 0.75 m but the heavy rains on the afternoon of June 3 sent it up again. After a rapid rise it appeared to peak on June 6. The North Thompson River surpassed the high-water level of 1876. At the mouth of the North Thompson River, the water rose higher than ever known before.
1894 June 30 Flood Eagle River Septer (2007) Water levels in Eagle River were almost level with the adjacent railroad track. Some of the smaller bridges washed away and pilings were displaced. In some places the track was under 0.2-0.25 m of water.
1894 June 30 Debris flow Clanwilliam Septer (2007) A mudslide buried about 180 m of railroad track to a depth of 2 m or more. Immediately on completion of a temporary track laid over this slide, a second slide came down. It buried this false track 2 m deep to a length of 90 m.
1900 June 25 - 27 Flood Revelstoke Septer (2007) The railroad was flooded from Revelstoke to Arrowhead and floodwaters destroyed much of the track.1909 November 27 -
30Mudslide Revelstoke Septer (2007) Some small slides occurred east and west of Revelstoke.
1916 June 15 - 24 Flood Golden, Kicking Horse River River
Septer (2007) The Kicking Horse River carried out the southern span of the railway and road bridge. The Golden bridge was damaged and a number of residents were flooded out. Late on June 19, floodwaters tore out the fill of the north approach to the steel Kootenay Central bridge at Golden.
1927 Unknown Date Debris flood Sicamous Creek
Dobson Engineering Ltd. (December 1998)
A landslide in the mid 1920’s (1925 to 1927) caused high bedload transport rates onto the fan.
1928 January 8 - 12 Mudslide Revelstoke Septer (2007) The CPR line was impacted by a slide near Revelstoke.1936 May 29 - June
3Flood Columbia
River, Illecillewaet River, Revelstoke
Septer (2007) At the end of May, a sudden rise in temperatures caused snowmelt and flooding conditions province-wide, as well as in the Yukon and Alaska. In the southern interior, the Fraser, Thompson and Columbia rivers flooded their banks. The Revelstoke district experienced the “worst flood conditions since 1894”. At west Revelstoke, numerous families moved to higher ground when early on June 3 floodwaters exceeded the record high of 1894 by 1.5 ft. (45 cm).
1935 Unknown Date Debris flood Sicamous Creek
Dobson Engineering Ltd. (December 1998)
Sicamous Creek avulsed during a flood and abandoned its northern channel, reactivating an older channel and flowing into the south bay.
1948 June 9 - 11 Flood Columbia River, Revelstoke
Septer (2007) The Columbia and Kootenay rivers reached record levels. On June 9, the Columbia River at Revelstoke reached an all-time high maximum daily discharge of 5,040 m3/s (Environment Canada, 1991). On June 11, torrential rains caused the Columbia River to rise 12 in. (30 cm) in 24 hours.
1954 May 13 - 20 Flood, Mudslide
Columbia River, Revelstoke
Septer (2007) On May 13, a jump of 16 in. (40 cm) in 24 hours to 15.9 ft was registered in the Columbia River at Trail. Floodwaters inundated the Trans-Canada Highway near Chase and Revelstoke. On May 20, a mudslide east of Revelstoke delayed the eastbound CPR trains for 10 hours.
1948 May 25 Flood Sorrento Septer (2007) At Sorrento, Shuswap Lake rose 0.2 m daily until May 31, when the rate dropped to 0.1 m. Some of the beach homes at Sorrento were flooded.
1948 June 12 Flood Blind Bay Septer (2007) The high level of Shuswap Lake divided the community of Blind Bay in two. In places the water was 0.9 m deep on the road. Several cabins were flooded and the Scotch Creek to Sorrento ferry was using the dock at Catherwoods, instead of the Sorrento wharf.
Appendix - Event History BGC ENGINEERING INC. G-1
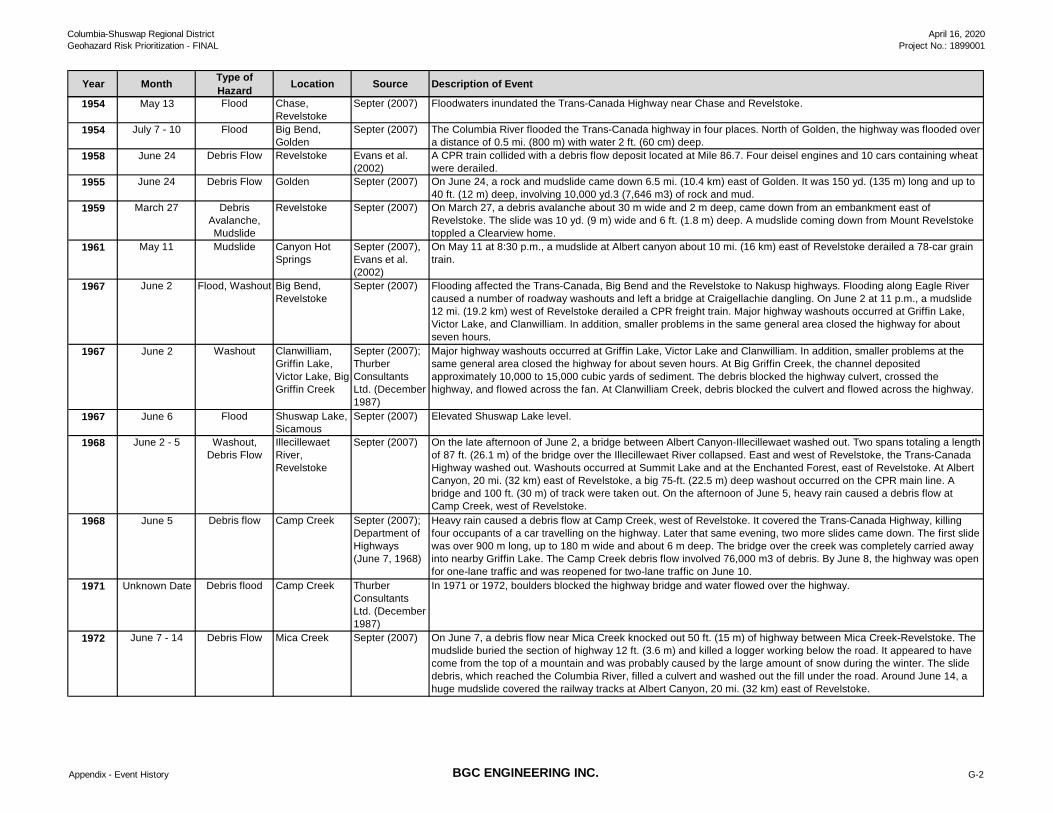
Columbia-Shuswap Regional DistrictGeohazard Risk Prioritization - FINAL
April 16, 2020Project No.: 1899001
Year Month Type of Hazard Location Source Description of Event
1954 May 13 Flood Chase, Revelstoke
Septer (2007) Floodwaters inundated the Trans-Canada Highway near Chase and Revelstoke.
1954 July 7 - 10 Flood Big Bend, Golden
Septer (2007) The Columbia River flooded the Trans-Canada highway in four places. North of Golden, the highway was flooded over a distance of 0.5 mi. (800 m) with water 2 ft. (60 cm) deep.
1958 June 24 Debris Flow Revelstoke Evans et al. (2002)
A CPR train collided with a debris flow deposit located at Mile 86.7. Four deisel engines and 10 cars containing wheat were derailed.
1955 June 24 Debris Flow Golden Septer (2007) On June 24, a rock and mudslide came down 6.5 mi. (10.4 km) east of Golden. It was 150 yd. (135 m) long and up to 40 ft. (12 m) deep, involving 10,000 yd.3 (7,646 m3) of rock and mud.
1959 March 27 Debris Avalanche, Mudslide
Revelstoke Septer (2007) On March 27, a debris avalanche about 30 m wide and 2 m deep, came down from an embankment east of Revelstoke. The slide was 10 yd. (9 m) wide and 6 ft. (1.8 m) deep. A mudslide coming down from Mount Revelstoke toppled a Clearview home.
1961 May 11 Mudslide Canyon Hot Springs
Septer (2007), Evans et al. (2002)
On May 11 at 8:30 p.m., a mudslide at Albert canyon about 10 mi. (16 km) east of Revelstoke derailed a 78-car grain train.
1967 June 2 Flood, Washout Big Bend, Revelstoke
Septer (2007) Flooding affected the Trans-Canada, Big Bend and the Revelstoke to Nakusp highways. Flooding along Eagle River caused a number of roadway washouts and left a bridge at Craigellachie dangling. On June 2 at 11 p.m., a mudslide 12 mi. (19.2 km) west of Revelstoke derailed a CPR freight train. Major highway washouts occurred at Griffin Lake, Victor Lake, and Clanwilliam. In addition, smaller problems in the same general area closed the highway for about seven hours.
1967 June 2 Washout Clanwilliam, Griffin Lake, Victor Lake, Big Griffin Creek
Septer (2007); Thurber Consultants Ltd. (December 1987)
Major highway washouts occurred at Griffin Lake, Victor Lake and Clanwilliam. In addition, smaller problems at the same general area closed the highway for about seven hours. At Big Griffin Creek, the channel deposited approximately 10,000 to 15,000 cubic yards of sediment. The debris blocked the highway culvert, crossed the highway, and flowed across the fan. At Clanwilliam Creek, debris blocked the culvert and flowed across the highway.
1967 June 6 Flood Shuswap Lake, Sicamous
Septer (2007) Elevated Shuswap Lake level.
1968 June 2 - 5 Washout, Debris Flow
Illecillewaet River, Revelstoke
Septer (2007) On the late afternoon of June 2, a bridge between Albert Canyon-Illecillewaet washed out. Two spans totaling a length of 87 ft. (26.1 m) of the bridge over the Illecillewaet River collapsed. East and west of Revelstoke, the Trans-Canada Highway washed out. Washouts occurred at Summit Lake and at the Enchanted Forest, east of Revelstoke. At Albert Canyon, 20 mi. (32 km) east of Revelstoke, a big 75-ft. (22.5 m) deep washout occurred on the CPR main line. A bridge and 100 ft. (30 m) of track were taken out. On the afternoon of June 5, heavy rain caused a debris flow at Camp Creek, west of Revelstoke.
1968 June 5 Debris flow Camp Creek Septer (2007); Department of Highways (June 7, 1968)
Heavy rain caused a debris flow at Camp Creek, west of Revelstoke. It covered the Trans-Canada Highway, killing four occupants of a car travelling on the highway. Later that same evening, two more slides came down. The first slide was over 900 m long, up to 180 m wide and about 6 m deep. The bridge over the creek was completely carried away into nearby Griffin Lake. The Camp Creek debris flow involved 76,000 m3 of debris. By June 8, the highway was open for one-lane traffic and was reopened for two-lane traffic on June 10.
1971 Unknown Date Debris flood Camp Creek Thurber Consultants Ltd. (December 1987)
In 1971 or 1972, boulders blocked the highway bridge and water flowed over the highway.
1972 June 7 - 14 Debris Flow Mica Creek Septer (2007) On June 7, a debris flow near Mica Creek knocked out 50 ft. (15 m) of highway between Mica Creek-Revelstoke. The mudslide buried the section of highway 12 ft. (3.6 m) and killed a logger working below the road. It appeared to have come from the top of a mountain and was probably caused by the large amount of snow during the winter. The slide debris, which reached the Columbia River, filled a culvert and washed out the fill under the road. Around June 14, a huge mudslide covered the railway tracks at Albert Canyon, 20 mi. (32 km) east of Revelstoke.
Appendix - Event History BGC ENGINEERING INC. G-2
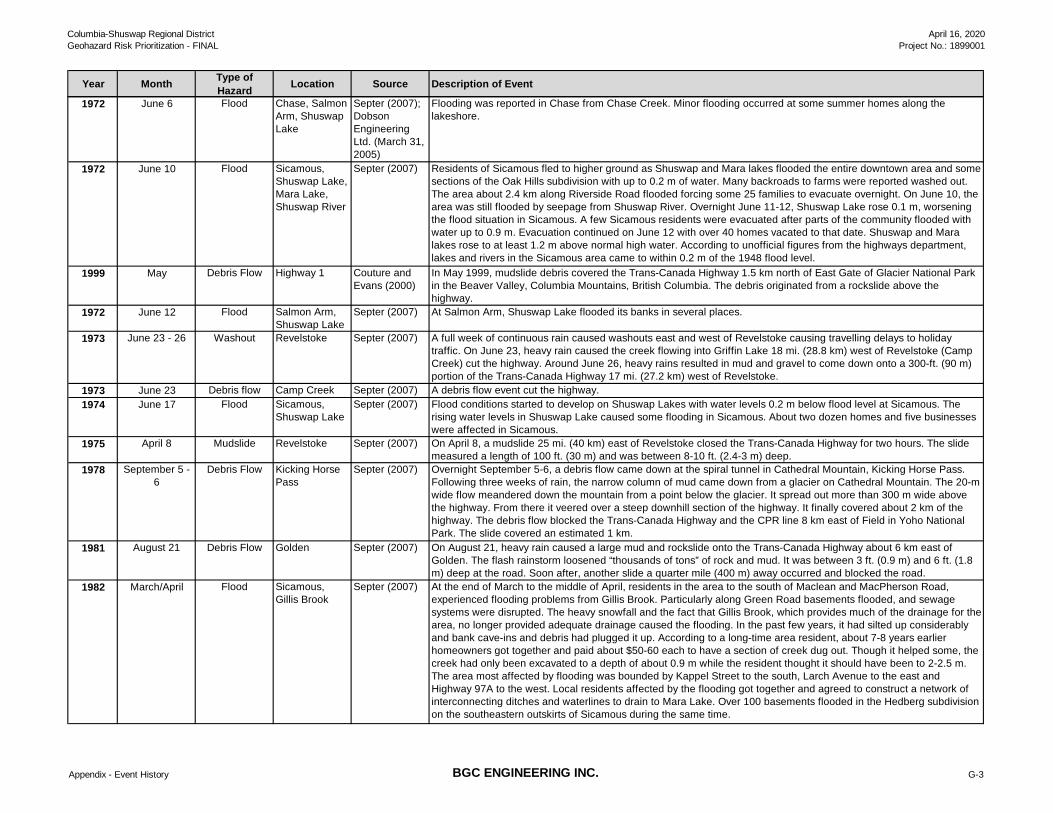
Columbia-Shuswap Regional DistrictGeohazard Risk Prioritization - FINAL
April 16, 2020Project No.: 1899001
Year Month Type of Hazard Location Source Description of Event
1972 June 6 Flood Chase, Salmon Arm, Shuswap Lake
Septer (2007); Dobson Engineering Ltd. (March 31, 2005)
Flooding was reported in Chase from Chase Creek. Minor flooding occurred at some summer homes along the lakeshore.
1972 June 10 Flood Sicamous, Shuswap Lake, Mara Lake, Shuswap River
Septer (2007) Residents of Sicamous fled to higher ground as Shuswap and Mara lakes flooded the entire downtown area and some sections of the Oak Hills subdivision with up to 0.2 m of water. Many backroads to farms were reported washed out. The area about 2.4 km along Riverside Road flooded forcing some 25 families to evacuate overnight. On June 10, the area was still flooded by seepage from Shuswap River. Overnight June 11-12, Shuswap Lake rose 0.1 m, worsening the flood situation in Sicamous. A few Sicamous residents were evacuated after parts of the community flooded with water up to 0.9 m. Evacuation continued on June 12 with over 40 homes vacated to that date. Shuswap and Mara lakes rose to at least 1.2 m above normal high water. According to unofficial figures from the highways department, lakes and rivers in the Sicamous area came to within 0.2 m of the 1948 flood level.
1999 May Debris Flow Highway 1 Couture and Evans (2000)
In May 1999, mudslide debris covered the Trans-Canada Highway 1.5 km north of East Gate of Glacier National Park in the Beaver Valley, Columbia Mountains, British Columbia. The debris originated from a rockslide above the highway.
1972 June 12 Flood Salmon Arm, Shuswap Lake
Septer (2007) At Salmon Arm, Shuswap Lake flooded its banks in several places.
1973 June 23 - 26 Washout Revelstoke Septer (2007) A full week of continuous rain caused washouts east and west of Revelstoke causing travelling delays to holiday traffic. On June 23, heavy rain caused the creek flowing into Griffin Lake 18 mi. (28.8 km) west of Revelstoke (Camp Creek) cut the highway. Around June 26, heavy rains resulted in mud and gravel to come down onto a 300-ft. (90 m) portion of the Trans-Canada Highway 17 mi. (27.2 km) west of Revelstoke.
1973 June 23 Debris flow Camp Creek Septer (2007) A debris flow event cut the highway.1974 June 17 Flood Sicamous,
Shuswap LakeSepter (2007) Flood conditions started to develop on Shuswap Lakes with water levels 0.2 m below flood level at Sicamous. The
rising water levels in Shuswap Lake caused some flooding in Sicamous. About two dozen homes and five businesses were affected in Sicamous.
1975 April 8 Mudslide Revelstoke Septer (2007) On April 8, a mudslide 25 mi. (40 km) east of Revelstoke closed the Trans-Canada Highway for two hours. The slide measured a length of 100 ft. (30 m) and was between 8-10 ft. (2.4-3 m) deep.
1978 September 5 - 6
Debris Flow Kicking Horse Pass
Septer (2007) Overnight September 5-6, a debris flow came down at the spiral tunnel in Cathedral Mountain, Kicking Horse Pass. Following three weeks of rain, the narrow column of mud came down from a glacier on Cathedral Mountain. The 20-m wide flow meandered down the mountain from a point below the glacier. It spread out more than 300 m wide above the highway. From there it veered over a steep downhill section of the highway. It finally covered about 2 km of the highway. The debris flow blocked the Trans-Canada Highway and the CPR line 8 km east of Field in Yoho National Park. The slide covered an estimated 1 km.
1981 August 21 Debris Flow Golden Septer (2007) On August 21, heavy rain caused a large mud and rockslide onto the Trans-Canada Highway about 6 km east of Golden. The flash rainstorm loosened “thousands of tons” of rock and mud. It was between 3 ft. (0.9 m) and 6 ft. (1.8 m) deep at the road. Soon after, another slide a quarter mile (400 m) away occurred and blocked the road.
1982 March/April Flood Sicamous, Gillis Brook
Septer (2007) At the end of March to the middle of April, residents in the area to the south of Maclean and MacPherson Road, experienced flooding problems from Gillis Brook. Particularly along Green Road basements flooded, and sewage systems were disrupted. The heavy snowfall and the fact that Gillis Brook, which provides much of the drainage for the area, no longer provided adequate drainage caused the flooding. In the past few years, it had silted up considerably and bank cave-ins and debris had plugged it up. According to a long-time area resident, about 7-8 years earlier homeowners got together and paid about $50-60 each to have a section of creek dug out. Though it helped some, the creek had only been excavated to a depth of about 0.9 m while the resident thought it should have been to 2-2.5 m. The area most affected by flooding was bounded by Kappel Street to the south, Larch Avenue to the east and Highway 97A to the west. Local residents affected by the flooding got together and agreed to construct a network of interconnecting ditches and waterlines to drain to Mara Lake. Over 100 basements flooded in the Hedberg subdivision on the southeastern outskirts of Sicamous during the same time.
Appendix - Event History BGC ENGINEERING INC. G-3
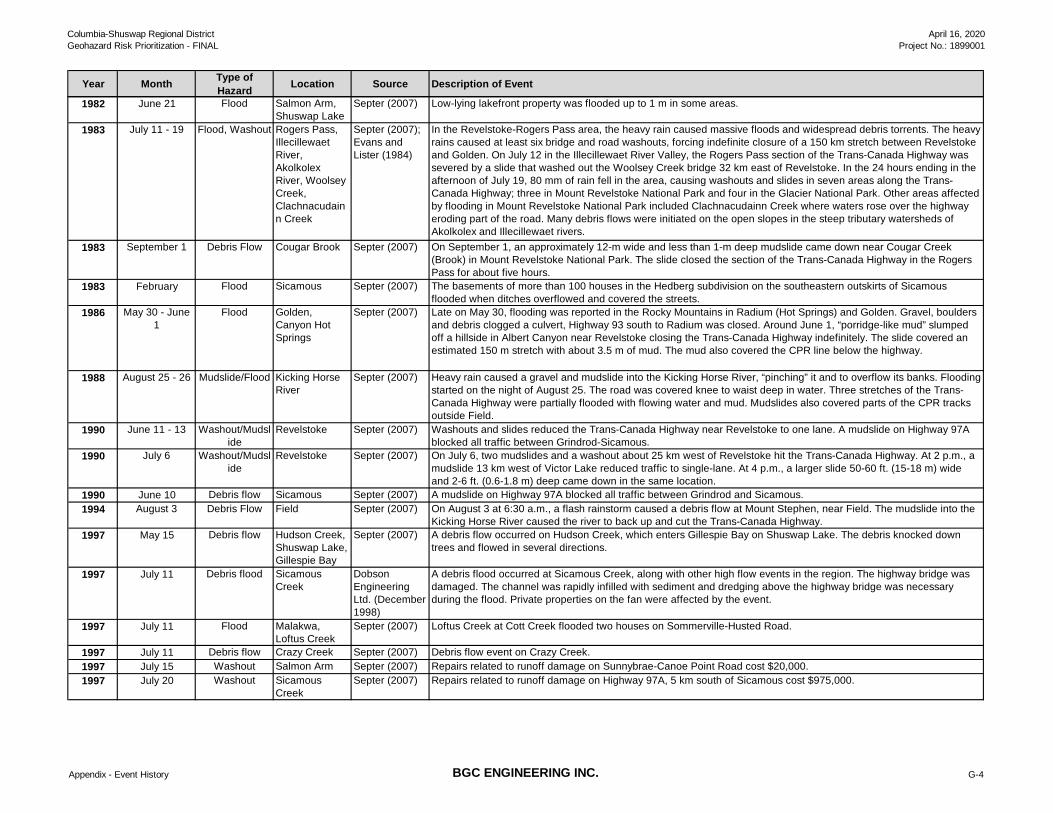
Columbia-Shuswap Regional DistrictGeohazard Risk Prioritization - FINAL
April 16, 2020Project No.: 1899001
Year Month Type of Hazard Location Source Description of Event
1982 June 21 Flood Salmon Arm, Shuswap Lake
Septer (2007) Low-lying lakefront property was flooded up to 1 m in some areas.
1983 July 11 - 19 Flood, Washout Rogers Pass, Illecillewaet River, Akolkolex River, Woolsey Creek, Clachnacudainn Creek
Septer (2007); Evans and Lister (1984)
In the Revelstoke-Rogers Pass area, the heavy rain caused massive floods and widespread debris torrents. The heavy rains caused at least six bridge and road washouts, forcing indefinite closure of a 150 km stretch between Revelstoke and Golden. On July 12 in the Illecillewaet River Valley, the Rogers Pass section of the Trans-Canada Highway was severed by a slide that washed out the Woolsey Creek bridge 32 km east of Revelstoke. In the 24 hours ending in the afternoon of July 19, 80 mm of rain fell in the area, causing washouts and slides in seven areas along the Trans-Canada Highway; three in Mount Revelstoke National Park and four in the Glacier National Park. Other areas affected by flooding in Mount Revelstoke National Park included Clachnacudainn Creek where waters rose over the highway eroding part of the road. Many debris flows were initiated on the open slopes in the steep tributary watersheds of Akolkolex and Illecillewaet rivers.
1983 September 1 Debris Flow Cougar Brook Septer (2007) On September 1, an approximately 12-m wide and less than 1-m deep mudslide came down near Cougar Creek (Brook) in Mount Revelstoke National Park. The slide closed the section of the Trans-Canada Highway in the Rogers Pass for about five hours.
1983 February Flood Sicamous Septer (2007) The basements of more than 100 houses in the Hedberg subdivision on the southeastern outskirts of Sicamous flooded when ditches overflowed and covered the streets.
1986 May 30 - June 1
Flood Golden, Canyon Hot Springs
Septer (2007) Late on May 30, flooding was reported in the Rocky Mountains in Radium (Hot Springs) and Golden. Gravel, boulders and debris clogged a culvert, Highway 93 south to Radium was closed. Around June 1, “porridge-like mud” slumped off a hillside in Albert Canyon near Revelstoke closing the Trans-Canada Highway indefinitely. The slide covered an estimated 150 m stretch with about 3.5 m of mud. The mud also covered the CPR line below the highway.
1988 August 25 - 26 Mudslide/Flood Kicking Horse River
Septer (2007) Heavy rain caused a gravel and mudslide into the Kicking Horse River, “pinching” it and to overflow its banks. Flooding started on the night of August 25. The road was covered knee to waist deep in water. Three stretches of the Trans-Canada Highway were partially flooded with flowing water and mud. Mudslides also covered parts of the CPR tracks outside Field.
1990 June 11 - 13 Washout/Mudslide
Revelstoke Septer (2007) Washouts and slides reduced the Trans-Canada Highway near Revelstoke to one lane. A mudslide on Highway 97A blocked all traffic between Grindrod-Sicamous.
1990 July 6 Washout/Mudslide
Revelstoke Septer (2007) On July 6, two mudslides and a washout about 25 km west of Revelstoke hit the Trans-Canada Highway. At 2 p.m., a mudslide 13 km west of Victor Lake reduced traffic to single-lane. At 4 p.m., a larger slide 50-60 ft. (15-18 m) wide and 2-6 ft. (0.6-1.8 m) deep came down in the same location.
1990 June 10 Debris flow Sicamous Septer (2007) A mudslide on Highway 97A blocked all traffic between Grindrod and Sicamous.1994 August 3 Debris Flow Field Septer (2007) On August 3 at 6:30 a.m., a flash rainstorm caused a debris flow at Mount Stephen, near Field. The mudslide into the
Kicking Horse River caused the river to back up and cut the Trans-Canada Highway.1997 May 15 Debris flow Hudson Creek,
Shuswap Lake, Gillespie Bay
Septer (2007) A debris flow occurred on Hudson Creek, which enters Gillespie Bay on Shuswap Lake. The debris knocked down trees and flowed in several directions.
1997 July 11 Debris flood Sicamous Creek
Dobson Engineering Ltd. (December 1998)
A debris flood occurred at Sicamous Creek, along with other high flow events in the region. The highway bridge was damaged. The channel was rapidly infilled with sediment and dredging above the highway bridge was necessary during the flood. Private properties on the fan were affected by the event.
1997 July 11 Flood Malakwa, Loftus Creek
Septer (2007) Loftus Creek at Cott Creek flooded two houses on Sommerville-Husted Road.
1997 July 11 Debris flow Crazy Creek Septer (2007) Debris flow event on Crazy Creek.1997 July 15 Washout Salmon Arm Septer (2007) Repairs related to runoff damage on Sunnybrae-Canoe Point Road cost $20,000.1997 July 20 Washout Sicamous
CreekSepter (2007) Repairs related to runoff damage on Highway 97A, 5 km south of Sicamous cost $975,000.
Appendix - Event History BGC ENGINEERING INC. G-4
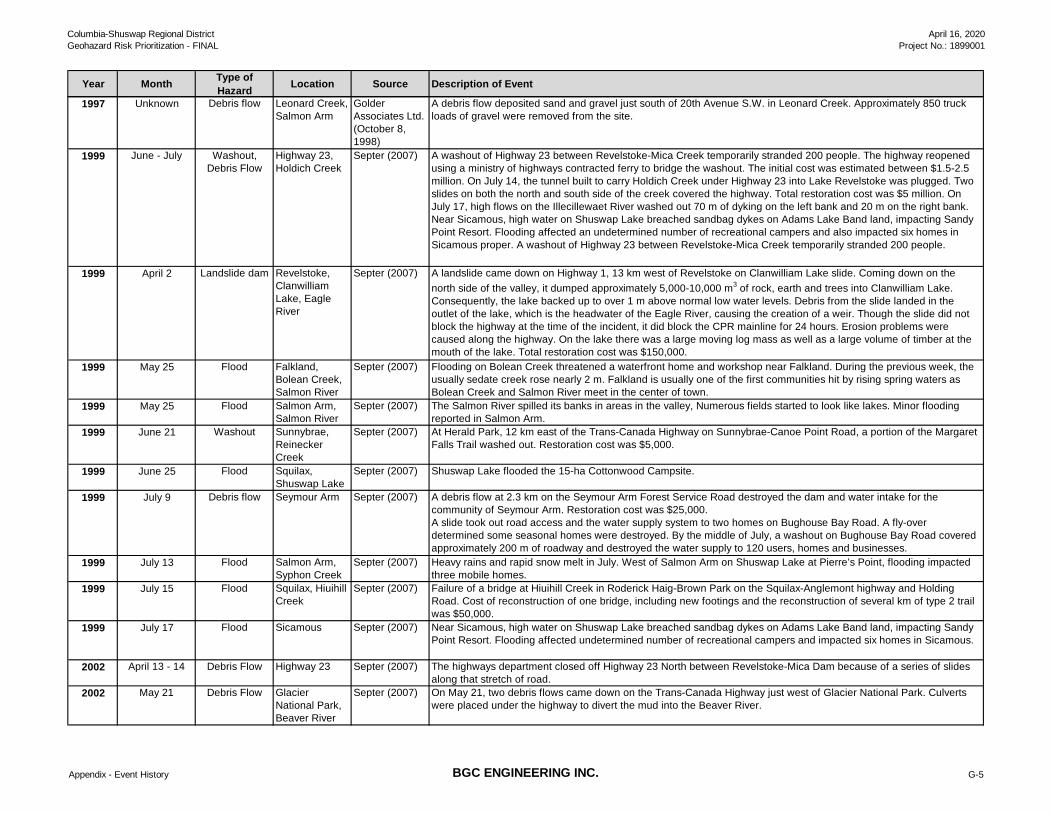
Columbia-Shuswap Regional DistrictGeohazard Risk Prioritization - FINAL
April 16, 2020Project No.: 1899001
Year Month Type of Hazard Location Source Description of Event
1997 Unknown Debris flow Leonard Creek, Salmon Arm
Golder Associates Ltd. (October 8, 1998)
A debris flow deposited sand and gravel just south of 20th Avenue S.W. in Leonard Creek. Approximately 850 truck loads of gravel were removed from the site.
1999 June - July Washout, Debris Flow
Highway 23, Holdich Creek
Septer (2007) A washout of Highway 23 between Revelstoke-Mica Creek temporarily stranded 200 people. The highway reopened using a ministry of highways contracted ferry to bridge the washout. The initial cost was estimated between $1.5-2.5 million. On July 14, the tunnel built to carry Holdich Creek under Highway 23 into Lake Revelstoke was plugged. Two slides on both the north and south side of the creek covered the highway. Total restoration cost was $5 million. On July 17, high flows on the Illecillewaet River washed out 70 m of dyking on the left bank and 20 m on the right bank. Near Sicamous, high water on Shuswap Lake breached sandbag dykes on Adams Lake Band land, impacting Sandy Point Resort. Flooding affected an undetermined number of recreational campers and also impacted six homes in Sicamous proper. A washout of Highway 23 between Revelstoke-Mica Creek temporarily stranded 200 people.
1999 April 2 Landslide dam Revelstoke, Clanwilliam Lake, Eagle River
Septer (2007) A landslide came down on Highway 1, 13 km west of Revelstoke on Clanwilliam Lake slide. Coming down on the north side of the valley, it dumped approximately 5,000-10,000 m3 of rock, earth and trees into Clanwilliam Lake. Consequently, the lake backed up to over 1 m above normal low water levels. Debris from the slide landed in the outlet of the lake, which is the headwater of the Eagle River, causing the creation of a weir. Though the slide did not block the highway at the time of the incident, it did block the CPR mainline for 24 hours. Erosion problems were caused along the highway. On the lake there was a large moving log mass as well as a large volume of timber at the mouth of the lake. Total restoration cost was $150,000.
1999 May 25 Flood Falkland, Bolean Creek, Salmon River
Septer (2007) Flooding on Bolean Creek threatened a waterfront home and workshop near Falkland. During the previous week, the usually sedate creek rose nearly 2 m. Falkland is usually one of the first communities hit by rising spring waters as Bolean Creek and Salmon River meet in the center of town.
1999 May 25 Flood Salmon Arm, Salmon River
Septer (2007) The Salmon River spilled its banks in areas in the valley, Numerous fields started to look like lakes. Minor flooding reported in Salmon Arm.
1999 June 21 Washout Sunnybrae, Reinecker Creek
Septer (2007) At Herald Park, 12 km east of the Trans-Canada Highway on Sunnybrae-Canoe Point Road, a portion of the Margaret Falls Trail washed out. Restoration cost was $5,000.
1999 June 25 Flood Squilax, Shuswap Lake
Septer (2007) Shuswap Lake flooded the 15-ha Cottonwood Campsite.
1999 July 9 Debris flow Seymour Arm Septer (2007) A debris flow at 2.3 km on the Seymour Arm Forest Service Road destroyed the dam and water intake for the community of Seymour Arm. Restoration cost was $25,000.A slide took out road access and the water supply system to two homes on Bughouse Bay Road. A fly-over determined some seasonal homes were destroyed. By the middle of July, a washout on Bughouse Bay Road covered approximately 200 m of roadway and destroyed the water supply to 120 users, homes and businesses.
1999 July 13 Flood Salmon Arm, Syphon Creek
Septer (2007) Heavy rains and rapid snow melt in July. West of Salmon Arm on Shuswap Lake at Pierre’s Point, flooding impacted three mobile homes.
1999 July 15 Flood Squilax, Hiuihill Creek
Septer (2007) Failure of a bridge at Hiuihill Creek in Roderick Haig-Brown Park on the Squilax-Anglemont highway and Holding Road. Cost of reconstruction of one bridge, including new footings and the reconstruction of several km of type 2 trail was $50,000.
1999 July 17 Flood Sicamous Septer (2007) Near Sicamous, high water on Shuswap Lake breached sandbag dykes on Adams Lake Band land, impacting Sandy Point Resort. Flooding affected undetermined number of recreational campers and impacted six homes in Sicamous.
2002 April 13 - 14 Debris Flow Highway 23 Septer (2007) The highways department closed off Highway 23 North between Revelstoke-Mica Dam because of a series of slides along that stretch of road.
2002 May 21 Debris Flow Glacier National Park, Beaver River
Septer (2007) On May 21, two debris flows came down on the Trans-Canada Highway just west of Glacier National Park. Culverts were placed under the highway to divert the mud into the Beaver River.
Appendix - Event History BGC ENGINEERING INC. G-5
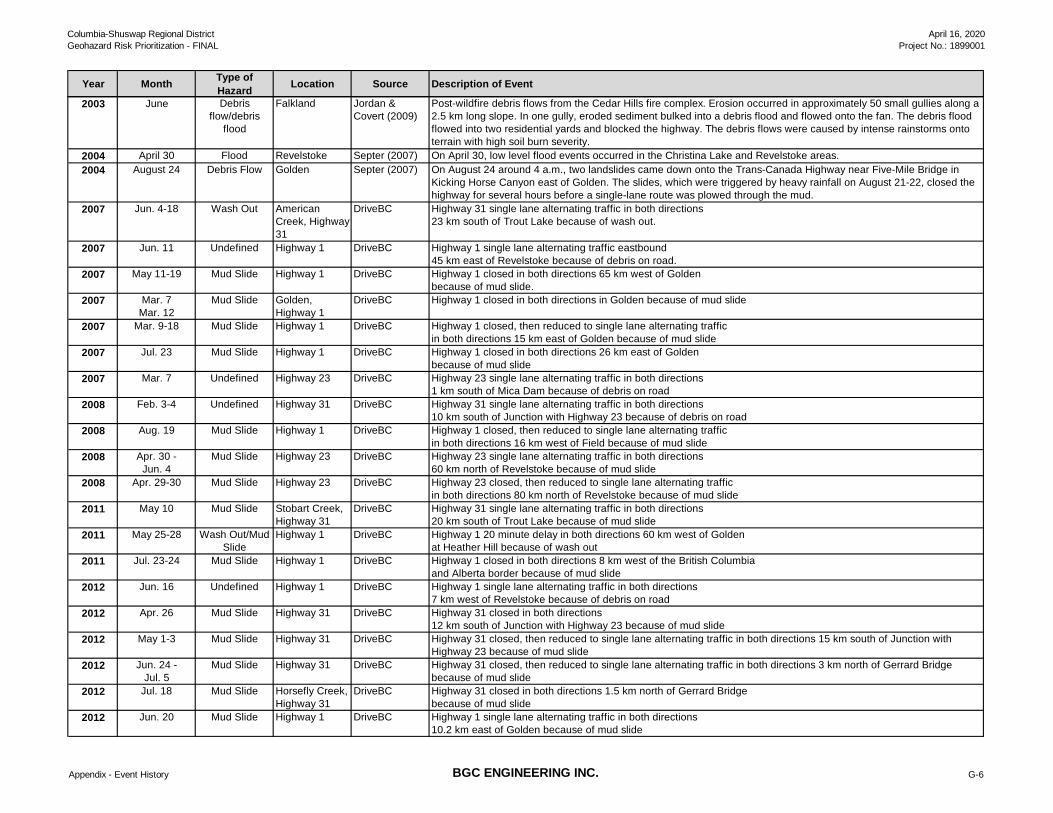
Columbia-Shuswap Regional DistrictGeohazard Risk Prioritization - FINAL
April 16, 2020Project No.: 1899001
Year Month Type of Hazard Location Source Description of Event
2003 June Debris flow/debris
flood
Falkland Jordan & Covert (2009)
Post-wildfire debris flows from the Cedar Hills fire complex. Erosion occurred in approximately 50 small gullies along a 2.5 km long slope. In one gully, eroded sediment bulked into a debris flood and flowed onto the fan. The debris flood flowed into two residential yards and blocked the highway. The debris flows were caused by intense rainstorms onto terrain with high soil burn severity.
2004 April 30 Flood Revelstoke Septer (2007) On April 30, low level flood events occurred in the Christina Lake and Revelstoke areas.2004 August 24 Debris Flow Golden Septer (2007) On August 24 around 4 a.m., two landslides came down onto the Trans-Canada Highway near Five-Mile Bridge in
Kicking Horse Canyon east of Golden. The slides, which were triggered by heavy rainfall on August 21-22, closed the highway for several hours before a single-lane route was plowed through the mud.
2007 Jun. 4-18 Wash Out American Creek, Highway 31
DriveBC Highway 31 single lane alternating traffic in both directions23 km south of Trout Lake because of wash out.
2007 Jun. 11 Undefined Highway 1 DriveBC Highway 1 single lane alternating traffic eastbound 45 km east of Revelstoke because of debris on road.
2007 May 11-19 Mud Slide Highway 1 DriveBC Highway 1 closed in both directions 65 km west of Goldenbecause of mud slide.
2007 Mar. 7Mar. 12
Mud Slide Golden, Highway 1
DriveBC Highway 1 closed in both directions in Golden because of mud slide
2007 Mar. 9-18 Mud Slide Highway 1 DriveBC Highway 1 closed, then reduced to single lane alternating trafficin both directions 15 km east of Golden because of mud slide
2007 Jul. 23 Mud Slide Highway 1 DriveBC Highway 1 closed in both directions 26 km east of Goldenbecause of mud slide
2007 Mar. 7 Undefined Highway 23 DriveBC Highway 23 single lane alternating traffic in both directions1 km south of Mica Dam because of debris on road
2008 Feb. 3-4 Undefined Highway 31 DriveBC Highway 31 single lane alternating traffic in both directions10 km south of Junction with Highway 23 because of debris on road
2008 Aug. 19 Mud Slide Highway 1 DriveBC Highway 1 closed, then reduced to single lane alternating traffic in both directions 16 km west of Field because of mud slide
2008 Apr. 30 -Jun. 4
Mud Slide Highway 23 DriveBC Highway 23 single lane alternating traffic in both directions 60 km north of Revelstoke because of mud slide
2008 Apr. 29-30 Mud Slide Highway 23 DriveBC Highway 23 closed, then reduced to single lane alternating traffic in both directions 80 km north of Revelstoke because of mud slide
2011 May 10 Mud Slide Stobart Creek, Highway 31
DriveBC Highway 31 single lane alternating traffic in both directions20 km south of Trout Lake because of mud slide
2011 May 25-28 Wash Out/Mud Slide
Highway 1 DriveBC Highway 1 20 minute delay in both directions 60 km west of Goldenat Heather Hill because of wash out
2011 Jul. 23-24 Mud Slide Highway 1 DriveBC Highway 1 closed in both directions 8 km west of the British Columbia and Alberta border because of mud slide
2012 Jun. 16 Undefined Highway 1 DriveBC Highway 1 single lane alternating traffic in both directions7 km west of Revelstoke because of debris on road
2012 Apr. 26 Mud Slide Highway 31 DriveBC Highway 31 closed in both directions 12 km south of Junction with Highway 23 because of mud slide
2012 May 1-3 Mud Slide Highway 31 DriveBC Highway 31 closed, then reduced to single lane alternating traffic in both directions 15 km south of Junction with Highway 23 because of mud slide
2012 Jun. 24 - Jul. 5
Mud Slide Highway 31 DriveBC Highway 31 closed, then reduced to single lane alternating traffic in both directions 3 km north of Gerrard Bridge because of mud slide
2012 Jul. 18 Mud Slide Horsefly Creek, Highway 31
DriveBC Highway 31 closed in both directions 1.5 km north of Gerrard Bridgebecause of mud slide
2012 Jun. 20 Mud Slide Highway 1 DriveBC Highway 1 single lane alternating traffic in both directions 10.2 km east of Golden because of mud slide
Appendix - Event History BGC ENGINEERING INC. G-6
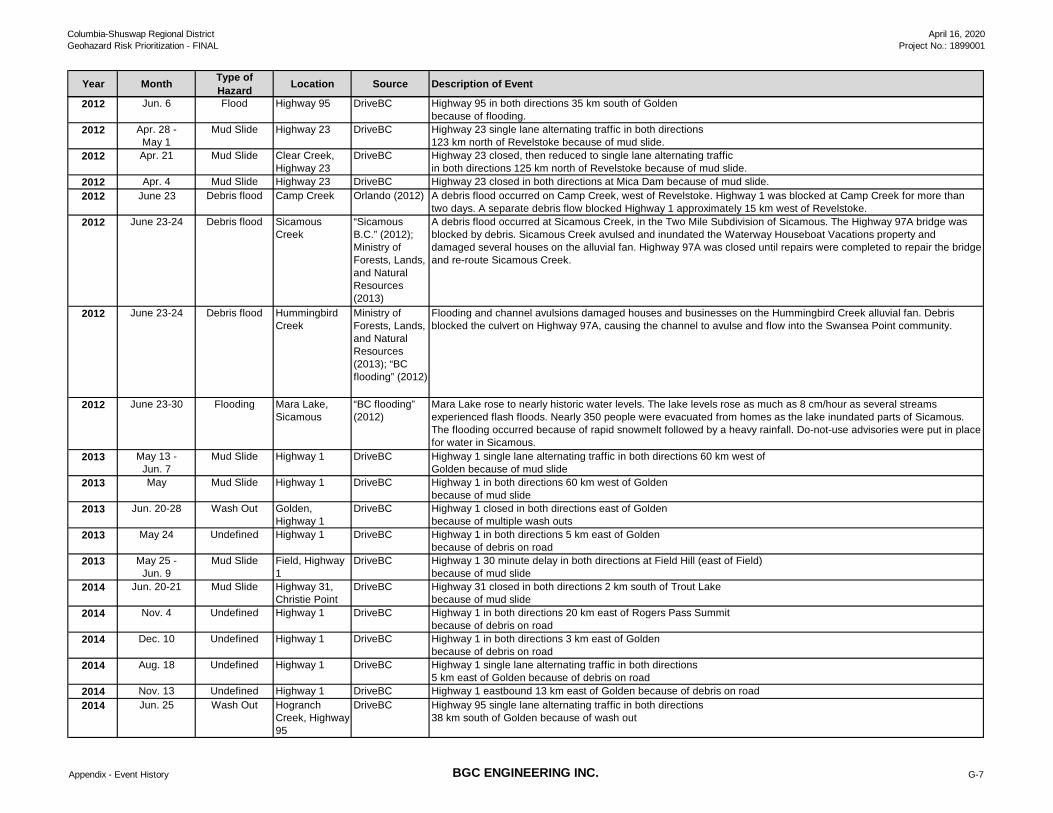
Columbia-Shuswap Regional DistrictGeohazard Risk Prioritization - FINAL
April 16, 2020Project No.: 1899001
Year Month Type of Hazard Location Source Description of Event
2012 Jun. 6 Flood Highway 95 DriveBC Highway 95 in both directions 35 km south of Goldenbecause of flooding.
2012 Apr. 28 -May 1
Mud Slide Highway 23 DriveBC Highway 23 single lane alternating traffic in both directions123 km north of Revelstoke because of mud slide.
2012 Apr. 21 Mud Slide Clear Creek, Highway 23
DriveBC Highway 23 closed, then reduced to single lane alternating traffic in both directions 125 km north of Revelstoke because of mud slide.
2012 Apr. 4 Mud Slide Highway 23 DriveBC Highway 23 closed in both directions at Mica Dam because of mud slide.2012 June 23 Debris flood Camp Creek Orlando (2012) A debris flood occurred on Camp Creek, west of Revelstoke. Highway 1 was blocked at Camp Creek for more than
two days. A separate debris flow blocked Highway 1 approximately 15 km west of Revelstoke. 2012 June 23-24 Debris flood Sicamous
Creek“Sicamous B.C.” (2012); Ministry of Forests, Lands, and Natural Resources (2013)
A debris flood occurred at Sicamous Creek, in the Two Mile Subdivision of Sicamous. The Highway 97A bridge was blocked by debris. Sicamous Creek avulsed and inundated the Waterway Houseboat Vacations property and damaged several houses on the alluvial fan. Highway 97A was closed until repairs were completed to repair the bridge and re-route Sicamous Creek.
2012 June 23-24 Debris flood Hummingbird Creek
Ministry of Forests, Lands, and Natural Resources (2013); “BC flooding” (2012)
Flooding and channel avulsions damaged houses and businesses on the Hummingbird Creek alluvial fan. Debris blocked the culvert on Highway 97A, causing the channel to avulse and flow into the Swansea Point community.
2012 June 23-30 Flooding Mara Lake, Sicamous
“BC flooding” (2012)
Mara Lake rose to nearly historic water levels. The lake levels rose as much as 8 cm/hour as several streams experienced flash floods. Nearly 350 people were evacuated from homes as the lake inundated parts of Sicamous. The flooding occurred because of rapid snowmelt followed by a heavy rainfall. Do-not-use advisories were put in place for water in Sicamous.
2013 May 13 -Jun. 7
Mud Slide Highway 1 DriveBC Highway 1 single lane alternating traffic in both directions 60 km west ofGolden because of mud slide
2013 May Mud Slide Highway 1 DriveBC Highway 1 in both directions 60 km west of Goldenbecause of mud slide
2013 Jun. 20-28 Wash Out Golden, Highway 1
DriveBC Highway 1 closed in both directions east of Goldenbecause of multiple wash outs
2013 May 24 Undefined Highway 1 DriveBC Highway 1 in both directions 5 km east of Golden because of debris on road
2013 May 25 -Jun. 9
Mud Slide Field, Highway 1
DriveBC Highway 1 30 minute delay in both directions at Field Hill (east of Field)because of mud slide
2014 Jun. 20-21 Mud Slide Highway 31, Christie Point
DriveBC Highway 31 closed in both directions 2 km south of Trout Lakebecause of mud slide
2014 Nov. 4 Undefined Highway 1 DriveBC Highway 1 in both directions 20 km east of Rogers Pass Summit because of debris on road
2014 Dec. 10 Undefined Highway 1 DriveBC Highway 1 in both directions 3 km east of Golden because of debris on road
2014 Aug. 18 Undefined Highway 1 DriveBC Highway 1 single lane alternating traffic in both directions 5 km east of Golden because of debris on road
2014 Nov. 13 Undefined Highway 1 DriveBC Highway 1 eastbound 13 km east of Golden because of debris on road2014 Jun. 25 Wash Out Hogranch
Creek, Highway 95
DriveBC Highway 95 single lane alternating traffic in both directions38 km south of Golden because of wash out
Appendix - Event History BGC ENGINEERING INC. G-7

Columbia-Shuswap Regional DistrictGeohazard Risk Prioritization - FINAL
April 16, 2020Project No.: 1899001
Year Month Type of Hazard Location Source Description of Event
2014 May 2 Mud Slide Highway 23 DriveBC Highway 23 closed in both directions 136 km north of Revelstokebecause of mud slide
2014 May 2 Mud Slide Highway 23 DriveBC Highway 23 closed in both directions at Mica Dam because of mud slide2015 Apr. 2-3 Undefined Albert Canyon,
Highway 1DriveBC Highway 1 in both directions at Albert Canyon because of debris on road
2015 Mar. 9 Undefined Highway 1 DriveBC Highway 1 in both directions 50 km west of Goldenbecause of debris on road
2015 Feb. 14-20 Undefined Highway 1 DriveBC Highway 1 in both directions 5 km east of Golden because of debris on road
2015 Mar. 26 -Apr. 2
Undefined Revelstoke Dam, Highway 23
DriveBC Highway 23 in both directions at Revelstoke Dambecause of debris on road
2016 Aug. 11 Mud Slide Highway 95 DriveBC Highway 95 single lane alternating traffic in both directions 12 km south of Golden because of mud slide
2016 Aug. 10-11 Mud Slide Highway 95 DriveBC Highway 95 (Maddem Road to Radium) closed in both directions26 km south of Golden because of mud slide (debris flow)
2016 Mar. 11 Undefined Highway 23 DriveBC Highway 23 single lane alternating traffic in both directions6 km north of Revelstoke because of debris on road
2016 Mar. 13 Undefined Highway 23 DriveBC Highway 23 in both directions at Martha Creekbecause of debris on road (fallen rocks)
2016 Feb. 11-14 Undefined Highway 23 DriveBC Highway 23 northbound 67 km north of Revelstokebecause of debris on road (fallen rocks)
2016 Feb. 15-16 Undefined Old Goldstream Creek, Highway 23
DriveBC Highway 23 in both directions 91 km north of Revelstokebecause of debris on road
2017 Feb. 17 Undefined Highway 1 DriveBC Highway 1 20 minute delay westbound 29 km east of Revelstokebecause of debris on road
2017 Apr. 20 Flood Highway 1 DriveBC Highway 1 reduce speed to 70 km/h in both directions47 km east of Revelstoke because of flood
Appendix - Event History BGC ENGINEERING INC. G-8

Columbia Shuswap Regional District April 16, 2020 Geohazard Risk Prioritization - FINAL Project No.: 1899001
BGC ENGINEERING INC.
APPENDIX H RESULTS SPREADSHEET
(PROVIDED SEPARATELY IN EXCEL FORMAT)

Columbia Shuswap Regional District April 16, 2020 Geohazard Risk Prioritization - FINAL Project No.: 1899001
BGC ENGINEERING INC.
APPENDIX I POLICY AND BYLAW REVIEW

Columbia-Shushwap Regional District April 16, 2020 Geohazard Risk Prioritization – FINAL Project No.: 1899001
Appendix I - Policy and ByLaw Review.docx I-1
BGC ENGINEERING INC.
I.1. INTRODUCTION This Appendix provides a review of flood and steep creek related information in the following three CSRD bylaws:
• Electoral Area F Official Community Plan (OCP) Bylaw No. 830 • Scotch Creek/Lee Creek Zoning Bylaw No. 825 • Rural Sicamous Land Use Bylaw No. 2000.
The purpose of the policy and bylaw review is to support CSRD with modernization of flood-related policies and bylaws within the Regional District. The three bylaws listed above were selected by CSRD as representative examples of flood related information within bylaw documents administered by jurisdictions within the CSRD.
The following sections summarizes flood and steep creek related information, lists BGCs observations and provides recommendations for bylaw and policy modernization.
I.2. ELECTORAL AREA F OFFICIAL COMMUNITY PLAN, BYLAW NO. 830 The Electoral Area F OCP bylaw provides the longer-term vision for the community by stating the objectives and policies to guide decisions on planning and land use management (Government of British Columbia, 2020). Section 2.4 states the following main objective for managing hazardous areas, which includes those prone to flooding:
To identify natural and human-made hazardous conditions, and closely regulate any new development in these areas.
The OCP outlines four key policies to meet the above objective (Table I-1). Policies 1 and 2 focus on land use, where development is discouraged in hazardous areas, or if that’s not feasible high-intensity uses (e.g., commercial areas) are discouraged. Policies 3 and 4 focus on land development by providing Approving Officers authority to place restrictions on development through the application and use of Development Permit Areas (DPAs)1.
1 DPAs are a common tool applied by local government to identify hazardous areas and regulate development within
them. Any subdivision or building improvement (adding to or altering a building) within a DPA requires the issuance of a development permit to ensure that development or land alteration is consistent with objectives outlined within applicable Official Community Plans.
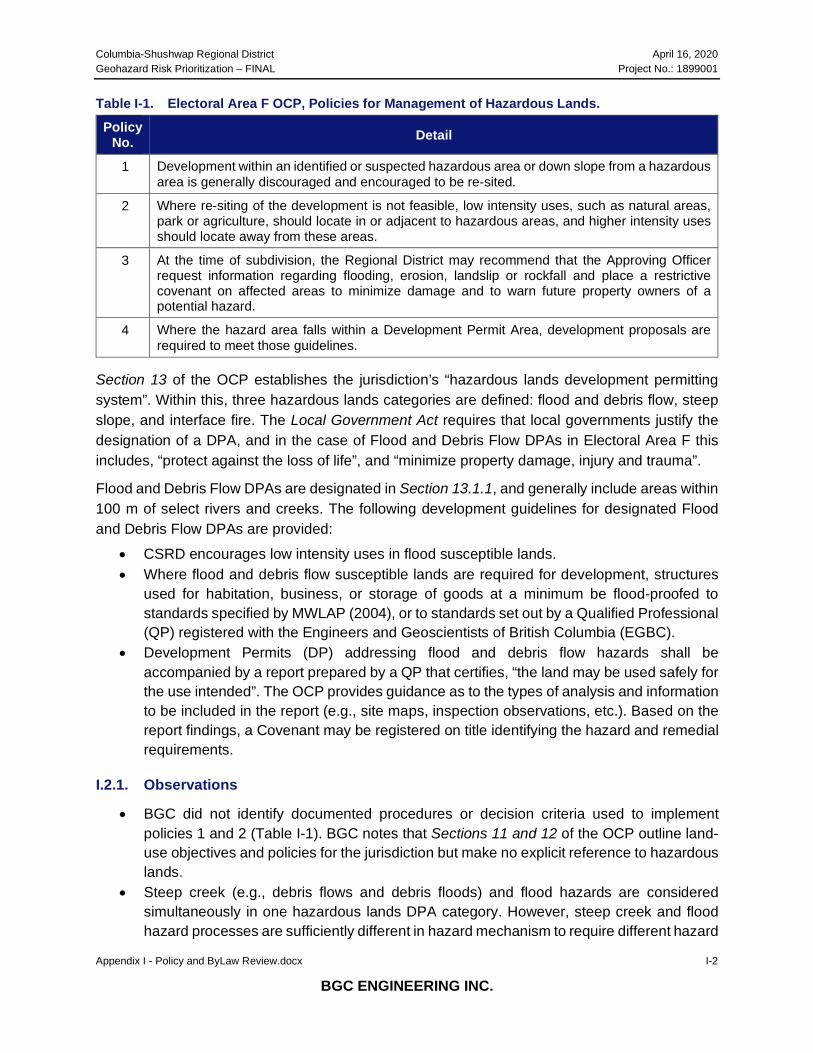
Columbia-Shushwap Regional District April 16, 2020 Geohazard Risk Prioritization – FINAL Project No.: 1899001
Appendix I - Policy and ByLaw Review.docx I-2
BGC ENGINEERING INC.
Table I-1. Electoral Area F OCP, Policies for Management of Hazardous Lands. Policy
No. Detail
1 Development within an identified or suspected hazardous area or down slope from a hazardous area is generally discouraged and encouraged to be re-sited.
2 Where re-siting of the development is not feasible, low intensity uses, such as natural areas, park or agriculture, should locate in or adjacent to hazardous areas, and higher intensity uses should locate away from these areas.
3 At the time of subdivision, the Regional District may recommend that the Approving Officer request information regarding flooding, erosion, landslip or rockfall and place a restrictive covenant on affected areas to minimize damage and to warn future property owners of a potential hazard.
4 Where the hazard area falls within a Development Permit Area, development proposals are required to meet those guidelines.
Section 13 of the OCP establishes the jurisdiction’s “hazardous lands development permitting system”. Within this, three hazardous lands categories are defined: flood and debris flow, steep slope, and interface fire. The Local Government Act requires that local governments justify the designation of a DPA, and in the case of Flood and Debris Flow DPAs in Electoral Area F this includes, “protect against the loss of life”, and “minimize property damage, injury and trauma”.
Flood and Debris Flow DPAs are designated in Section 13.1.1, and generally include areas within 100 m of select rivers and creeks. The following development guidelines for designated Flood and Debris Flow DPAs are provided:
• CSRD encourages low intensity uses in flood susceptible lands. • Where flood and debris flow susceptible lands are required for development, structures
used for habitation, business, or storage of goods at a minimum be flood-proofed to standards specified by MWLAP (2004), or to standards set out by a Qualified Professional (QP) registered with the Engineers and Geoscientists of British Columbia (EGBC).
• Development Permits (DP) addressing flood and debris flow hazards shall be accompanied by a report prepared by a QP that certifies, “the land may be used safely for the use intended”. The OCP provides guidance as to the types of analysis and information to be included in the report (e.g., site maps, inspection observations, etc.). Based on the report findings, a Covenant may be registered on title identifying the hazard and remedial requirements.
I.2.1. Observations
• BGC did not identify documented procedures or decision criteria used to implement policies 1 and 2 (Table I-1). BGC notes that Sections 11 and 12 of the OCP outline land-use objectives and policies for the jurisdiction but make no explicit reference to hazardous lands.
• Steep creek (e.g., debris flows and debris floods) and flood hazards are considered simultaneously in one hazardous lands DPA category. However, steep creek and flood hazard processes are sufficiently different in hazard mechanism to require different hazard

Columbia-Shushwap Regional District April 16, 2020 Geohazard Risk Prioritization – FINAL Project No.: 1899001
Appendix I - Policy and ByLaw Review.docx I-3
BGC ENGINEERING INC.
and risk management approaches, and bylaw requirements in flood hazard areas (i.e., Flood Construction Levels) may not be applicable to steep creeks. While approaches are not consistent across the province, other jurisdictions in British Columbia have placed steep creek and flood hazard areas in different hazardous lands DPA categories (e.g., District of North Vancouver).
• Section 13.1.1.(a) stipulates that the area within 100 m of certain listed creeks is designated as the Flood and Debris Flow Hazardous Lands DPA; however, this list does not include all areas subject to steep creek hazards (e.g., Hilna Creek). Several of the creeks are also debris flood creeks that are prone to avulsion, and the hazard area is better represented by the boundary of the associated alluvial fan.
• Section 13.1.1.(b).2 lists types of analysis and information that should be included in engineering reports prepared by QPs for the development permitting process. Depending on the site and type of development, items included in this list may not sufficiently cover the analysis required to certify, “the land may be used safely for the use intended” or may be more than should be required.
I.3. SCOTCH CREEK/LEE CREEK ZONING BYLAW NO. 825 Zoning bylaws implement land-use planning visions expressed in OCPs and regional growth strategies, and regulate how land, buildings, and other structures may be used (Government of British Columbia, 2020).
Scotch Creek and Lee Creek are designated as primary and secondary settlement areas within CSRD Electoral Area F. These areas are subject to bylaws in the Scotch Creek/Lee Creek Zoning Bylaw No. 830, as well as bylaws and policies included in the Electoral Area F Official Community Plan.
Zoning bylaws in the document pertain to floodplains, and don’t explicitly mention steep creek hazards. Bylaws pertaining to floodplains include:
• Information pertaining to the establishment and measurement of floodplains. • Guidelines for development within floodplains.
Establishment and Measurement of Floodplains Establishment of floodplains is summarized in Section 3.4 of the bylaw. The bylaw designates a ‘floodplain’ as:
• land lower than the flood construction level (FCL), which is determined by measuring from the natural boundary2 to a specified elevation above the natural boundary.
• land within the floodplain setback, which is determined by measuring a specified distance behind the natural boundary.
2 Natural boundary is defined in the Bylaw as: the visible high water mark of any lake, river, stream or other body of
water where the presence and action of the water are so common and usual, and so long continued in all ordinary years, as to mark on the soil of the bed of the body of water a character distinct from that of its banks, in vegetation, as well as in the nature of the soil itself.
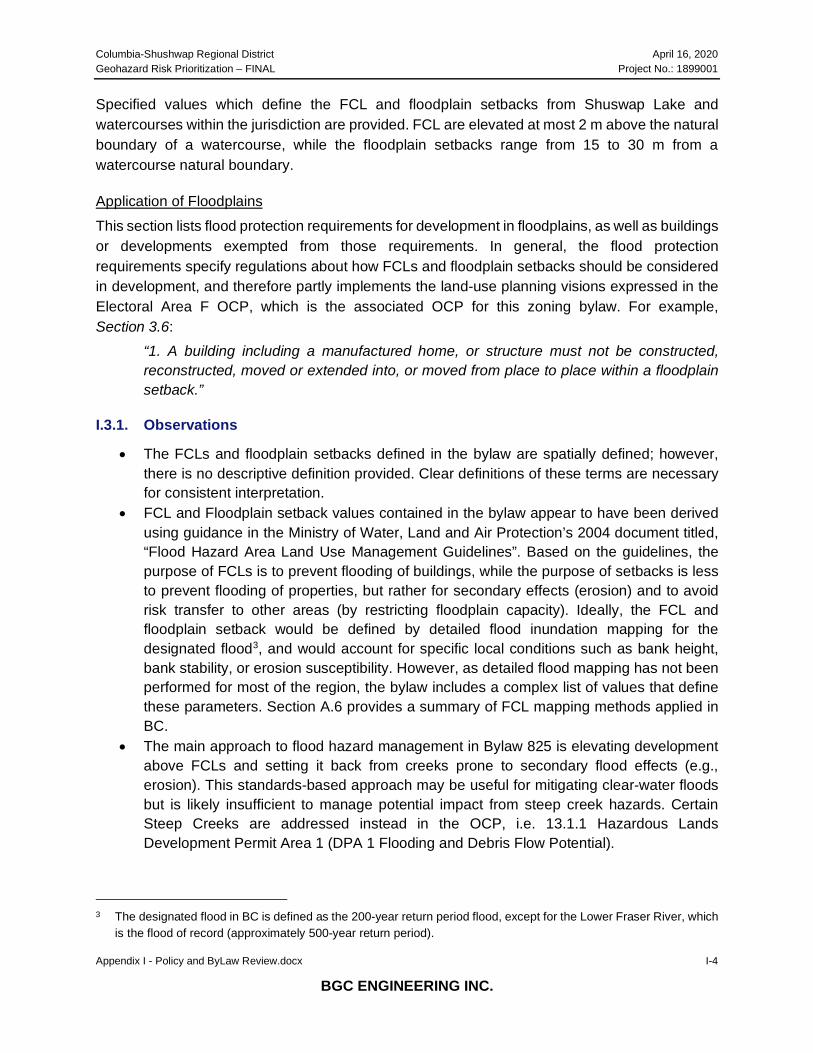
Columbia-Shushwap Regional District April 16, 2020 Geohazard Risk Prioritization – FINAL Project No.: 1899001
Appendix I - Policy and ByLaw Review.docx I-4
BGC ENGINEERING INC.
Specified values which define the FCL and floodplain setbacks from Shuswap Lake and watercourses within the jurisdiction are provided. FCL are elevated at most 2 m above the natural boundary of a watercourse, while the floodplain setbacks range from 15 to 30 m from a watercourse natural boundary.
Application of Floodplains This section lists flood protection requirements for development in floodplains, as well as buildings or developments exempted from those requirements. In general, the flood protection requirements specify regulations about how FCLs and floodplain setbacks should be considered in development, and therefore partly implements the land-use planning visions expressed in the Electoral Area F OCP, which is the associated OCP for this zoning bylaw. For example, Section 3.6:
“1. A building including a manufactured home, or structure must not be constructed, reconstructed, moved or extended into, or moved from place to place within a floodplain setback.”
I.3.1. Observations
• The FCLs and floodplain setbacks defined in the bylaw are spatially defined; however, there is no descriptive definition provided. Clear definitions of these terms are necessary for consistent interpretation.
• FCL and Floodplain setback values contained in the bylaw appear to have been derived using guidance in the Ministry of Water, Land and Air Protection’s 2004 document titled, “Flood Hazard Area Land Use Management Guidelines”. Based on the guidelines, the purpose of FCLs is to prevent flooding of buildings, while the purpose of setbacks is less to prevent flooding of properties, but rather for secondary effects (erosion) and to avoid risk transfer to other areas (by restricting floodplain capacity). Ideally, the FCL and floodplain setback would be defined by detailed flood inundation mapping for the designated flood3, and would account for specific local conditions such as bank height, bank stability, or erosion susceptibility. However, as detailed flood mapping has not been performed for most of the region, the bylaw includes a complex list of values that define these parameters. Section A.6 provides a summary of FCL mapping methods applied in BC.
• The main approach to flood hazard management in Bylaw 825 is elevating development above FCLs and setting it back from creeks prone to secondary flood effects (e.g., erosion). This standards-based approach may be useful for mitigating clear-water floods but is likely insufficient to manage potential impact from steep creek hazards. Certain Steep Creeks are addressed instead in the OCP, i.e. 13.1.1 Hazardous Lands Development Permit Area 1 (DPA 1 Flooding and Debris Flow Potential).
3 The designated flood in BC is defined as the 200-year return period flood, except for the Lower Fraser River, which
is the flood of record (approximately 500-year return period).
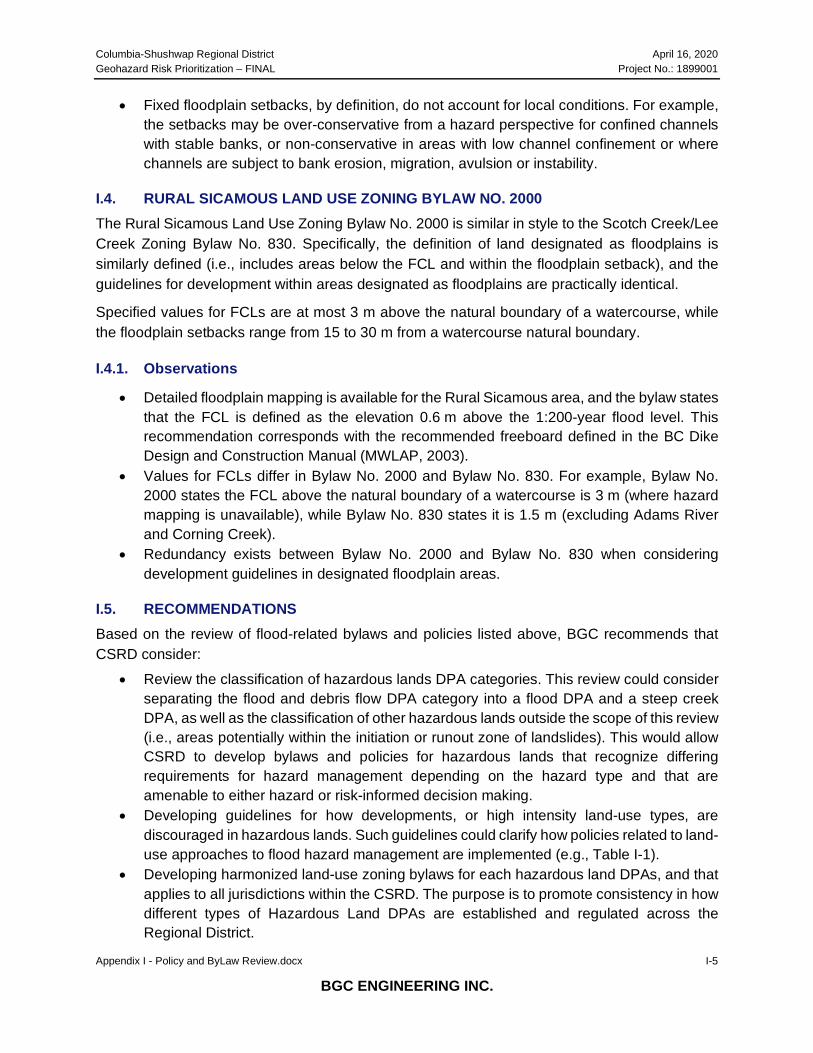
Columbia-Shushwap Regional District April 16, 2020 Geohazard Risk Prioritization – FINAL Project No.: 1899001
Appendix I - Policy and ByLaw Review.docx I-5
BGC ENGINEERING INC.
• Fixed floodplain setbacks, by definition, do not account for local conditions. For example, the setbacks may be over-conservative from a hazard perspective for confined channels with stable banks, or non-conservative in areas with low channel confinement or where channels are subject to bank erosion, migration, avulsion or instability.
I.4. RURAL SICAMOUS LAND USE ZONING BYLAW NO. 2000 The Rural Sicamous Land Use Zoning Bylaw No. 2000 is similar in style to the Scotch Creek/Lee Creek Zoning Bylaw No. 830. Specifically, the definition of land designated as floodplains is similarly defined (i.e., includes areas below the FCL and within the floodplain setback), and the guidelines for development within areas designated as floodplains are practically identical.
Specified values for FCLs are at most 3 m above the natural boundary of a watercourse, while the floodplain setbacks range from 15 to 30 m from a watercourse natural boundary.
I.4.1. Observations
• Detailed floodplain mapping is available for the Rural Sicamous area, and the bylaw states that the FCL is defined as the elevation 0.6 m above the 1:200-year flood level. This recommendation corresponds with the recommended freeboard defined in the BC Dike Design and Construction Manual (MWLAP, 2003).
• Values for FCLs differ in Bylaw No. 2000 and Bylaw No. 830. For example, Bylaw No. 2000 states the FCL above the natural boundary of a watercourse is 3 m (where hazard mapping is unavailable), while Bylaw No. 830 states it is 1.5 m (excluding Adams River and Corning Creek).
• Redundancy exists between Bylaw No. 2000 and Bylaw No. 830 when considering development guidelines in designated floodplain areas.
I.5. RECOMMENDATIONS Based on the review of flood-related bylaws and policies listed above, BGC recommends that CSRD consider:
• Review the classification of hazardous lands DPA categories. This review could consider separating the flood and debris flow DPA category into a flood DPA and a steep creek DPA, as well as the classification of other hazardous lands outside the scope of this review (i.e., areas potentially within the initiation or runout zone of landslides). This would allow CSRD to develop bylaws and policies for hazardous lands that recognize differing requirements for hazard management depending on the hazard type and that are amenable to either hazard or risk-informed decision making.
• Developing guidelines for how developments, or high intensity land-use types, are discouraged in hazardous lands. Such guidelines could clarify how policies related to land-use approaches to flood hazard management are implemented (e.g., Table I-1).
• Developing harmonized land-use zoning bylaws for each hazardous land DPAs, and that applies to all jurisdictions within the CSRD. The purpose is to promote consistency in how different types of Hazardous Land DPAs are established and regulated across the Regional District.

Columbia-Shushwap Regional District April 16, 2020 Geohazard Risk Prioritization – FINAL Project No.: 1899001
Appendix I - Policy and ByLaw Review.docx I-6
BGC ENGINEERING INC.
• Writing bylaws in OCPs that establish Hazardous Lands DPAs in a way that allows on-going updates to DPA boundaries.
• Updating sections of OCPs that list the types of analysis and information required by QPs to certify “the land may be used safely for the use intended” (e.g., Electoral Area F OCP, Section 13.1.1.(b).2) to simply reference appropriate professional guidelines established by EGBC. For example, the types of flood hazard analysis which should be carried out by QPs registered with EGBC are outlined in “Legislated Flood Assessments in a Changing Climate in BC (2018)”.
• Consider alternatives to fixed setback distances depending on the level of detail of information available. For example, automated approaches can consider topography (i.e., height over nearest drainage), and detailed assessment can estimate the probability that a bank erosion setback distance will be exceeded.
• Consider defining risk evaluation criteria (Ale, 2005; CSA, 2009; Van Dine, 2012) that provide the foundation for consistent risk reduction decision making (i.e., to define the term “safe for the use intended” in geohazards assessments for development approval applications). While such policy isn’t consistently adopted across the province, other jurisdictions have used such policy to support land-use and development approval decisions (e.g., District of Squamish). BGC notes that risk evaluation is currently an active area of discussion at both the provincial and local government level. On request, BGC can provide further information on our experiences working with other jurisdictions on the topic of risk evaluation.
I.6. FLOOD CONSTRUCTION LEVEL MAPPING In establishing FCLs where historical floodplain mapping is available, it can be used to determine the design floodwater elevation, and a freeboard added to the predicted water level based on the intended purpose of the freeboard. Establishing FCLs has economic implications for development, for example in requirements for raised foundations.
In BC, FCLs are typically calculated as the higher of the following scenarios:
• Water surface profile for the design peak instantaneous flow plus 0.3 m of freeboard • Water surface profile for the design daily flow plus 0.6 m of freeboard.
A freeboard is applied to the estimated water surface profile to account for uncertainties in the calculation of the water surface. This approach is used even for communities that are protected from flooding due to the presence of a diking system due to the potential for a dike to fail during a major flood due to factors such as channel scour, material deposition or toe erosion (Water Management Consultants, March 19, 2004).
Depending on the situation, the presence of a dike may lead to a local rise in the flood levels as the dike constrains the flow within the channel. Should a dike fail through overtopping or geotechnical failure, the resulting flooding depth and extent of flooding may be greater than if the dike was not present due to the elevated flood level (e.g., Figure I-1).

Columbia-Shushwap Regional District April 16, 2020 Geohazard Risk Prioritization – FINAL Project No.: 1899001
Appendix I - Policy and ByLaw Review.docx I-7
BGC ENGINEERING INC.
Figure I-1. Definition of design flood levels (DFL) in the presence of a dike. DFL refers to the
estimated water levels from a design flood event such as the 200-year return period flood (Modified from Water Management Consultants March 19, 2004).
Numerical modelling and mapping to establish FCLs should consider existing structural flood protection and clarify approaches used to define water surface elevations and freeboard. For example, this means considering:
1. Including dike elevations where existing, in the terrain included in a hydraulic model. 2. Making decisions about whether a dike will function as intended up to the return period at
which it is being overtopped, or if dike breach scenarios should be considered.
FCLs have traditionally been represented on historical floodplain maps as isolines. Alternative cartographic approaches, such as to define FCLs as polygons, can facilitate spatial analysis (i.e., to more easily identify cadastral parcels intersecting areas with a particular FCL).

Columbia-Shushwap Regional District April 16, 2020 Geohazard Risk Prioritization – FINAL Project No.: 1899001
Appendix I - Policy and ByLaw Review.docx I-8
BGC ENGINEERING INC.
REFERENCES Ale, B.J. (2005). Tolerable or acceptable: a comparison of risk regulations in the United Kingdom
and the Netherlands. Risk Analysis, 25, 231-241. https://doi.org/10.1111/j.1539-6924.2005.00585.x
Canadian Standards Association (CSA). (2009). CAN/CSA – IEC/ISO 31010-10 Risk Management: Risk Assessment Techniques. CSA Group, Toronto, ON.
Columbia Shuswap Regional District. (2016). Electoral Area ‘F’ (North Shuswap) Official Community Plan, Bylaw No. 830. Dated June 30, 2016.
Columbia Shuswap Regional District. (2017). Rural Sicamous Land Use Bylaw No. 2000. Dated October 20, 2017.
Columbia Shuswap Regional District. (2017). Scotch Creek/Lee Creek Zoning Bylaw No. 825. Dated July 22, 2019.
Engineers and Geoscientists British Columbia. (2018). Legislated Flood Assessments in a Changing Climate in BC. Version 2.0. July 16, 2018.
Government of British Columbia. (2020). What is an Official Community Plan? Online: https://www2.gov.bc.ca/gov/content/employment-business/economic-development/plan-and-measure/economic-development-basics/what-is-an-official-community-plan. Accessed on: February 15, 2020.
Government of British Columbia. (2020). Zoning Bylaws. Online: https://www2.gov.bc.ca/gov/content/governments/local-governments/planning-land-use/land-use-regulation/zoning-bylaws. Accessed on: February 18, 2020.
Ministry of Water, Land and Air Protection (MWLAP). (2004). Flood Hazard Area Land Use Management Guidelines.
Ministry of Water, Land and Air Protection (MWLAP). (2004). Dike Design and Construction Guide, Best Management Practices for British Columbia.
VanDine, D.F. (2012). Risk Management – Canadian Technical Guidelines and Best Practices Related to Landslides (GSC Open File 6996). Ottawa, ON: Geological Survey of Canada.
Water Management Consultants Inc. (2004, March 19). Floodplain Mapping: Guidelines and Specifications [Report]. Prepared for Fraser Basin Council.

Columbia Shuswap Regional District April 16, 2020 Geohazard Risk Prioritization - FINAL Project No.: 1899001
BGC ENGINEERING INC.
APPENDIX J ESTABLISHING DEVELOPMENT PERMIT AREAS

Columbia-Shuswap Regional District April 16, 2020 Geohazard Risk Prioritization – FINAL Project No.: 1899001
Appendix J - Establishing Development Permit Areas.docx J-1
BGC ENGINEERING INC.
J.1. INTRODUCTION This appendix provides a proposed framework for establishing geohazard-related Development Permit Areas (DPA) within the Regional District. This appendix begins with a brief summary of the regulatory framework for DPAs and a summary of hazard types within the CSRD. Review of the regulatory framework for DPAs suggests there are several regulatory nuances associated with the establishing DPAs that vary by jurisdiction irrespective of the hazard (i.e., DPAs only exist where there are Official Community Plans [OCPs]).
Assessment of the regulatory framework is beyond the scope of this work. As such, this Appendix focuses on the DPA best practices from a purely geohazard perspective. It provides guidance on how different levels of study and types of geohazard mapping could be applied in DPAs and associated guidelines for development approval. Description of policy development required in advance of establishing DPAs is outside the scope of this appendix.
J.2. BACKGROUND
J.2.1. Regulatory The Local Government Act, Section Sec 488-4911 provides local governments with the authority to designate a DPA. These areas identify locations that need special treatment for certain purposes including the protection of development from hazardous conditions (Government of British Columbia, 2019). Examples of existing hazardous land DPA categories in CSRD include flood and debris flow, slope, and interface-fire.
DPAs are designated through an OCP. To support the designation, the OCP must describe:
• The special conditions or objectives that justify the designation; and • The guidelines for how proposed development in that area can address the special
conditions or objectives. These guidelines can be specified in the OCP or in an accompanying zoning bylaw.
Within a DPA, any proposed subdivision, building improvement (i.e., adding to or altering a building) or new building requires a development permit be issued from the local government. The Board may grant or refuse a permit on a case by case basis depending on whether the guidelines listed for that DPA in an OCP have been satisfied.
J.2.2. Hazard Several types of hazardous conditions exist that may warrant the designation of a DPA. The current study focuses on flood (e.g., pluvial, fluvial, outbreak, groundwater) and steep creek hazards (e.g., debris flow, debris flood).
1 http://www.bclaws.ca/civix/document/id/complete/statreg/r15001_14#division_d0e44295
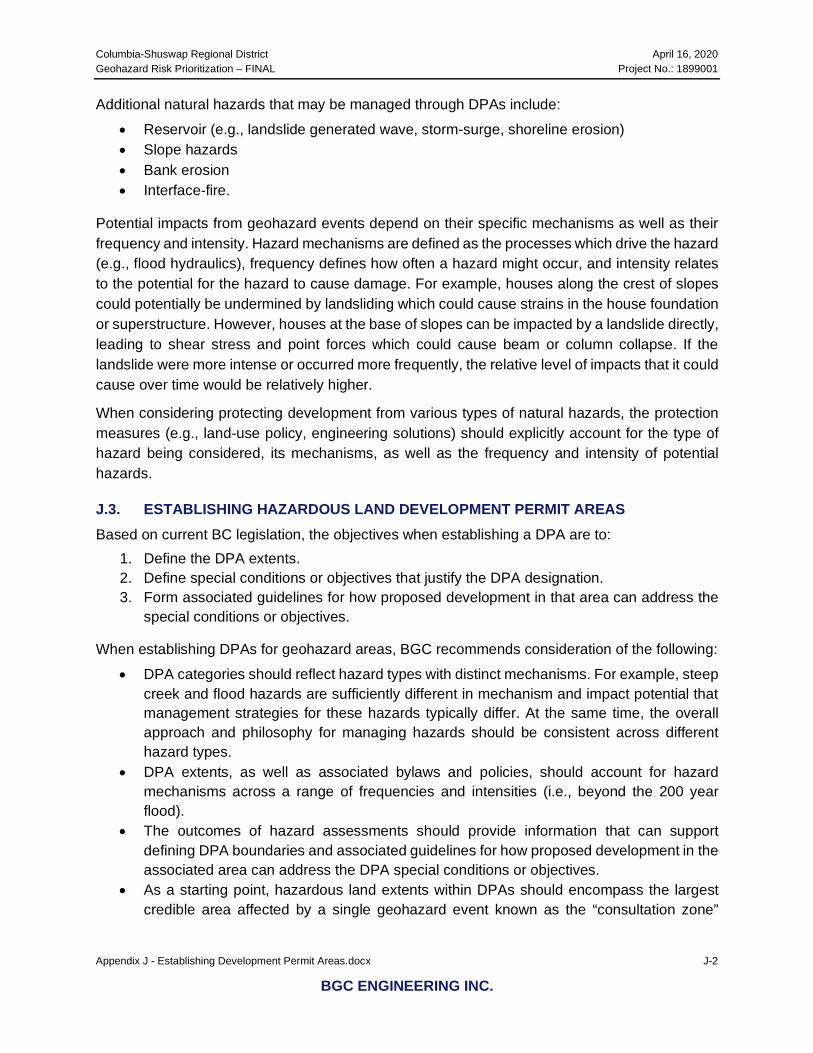
Columbia-Shuswap Regional District April 16, 2020 Geohazard Risk Prioritization – FINAL Project No.: 1899001
Appendix J - Establishing Development Permit Areas.docx J-2
BGC ENGINEERING INC.
Additional natural hazards that may be managed through DPAs include:
• Reservoir (e.g., landslide generated wave, storm-surge, shoreline erosion) • Slope hazards • Bank erosion • Interface-fire.
Potential impacts from geohazard events depend on their specific mechanisms as well as their frequency and intensity. Hazard mechanisms are defined as the processes which drive the hazard (e.g., flood hydraulics), frequency defines how often a hazard might occur, and intensity relates to the potential for the hazard to cause damage. For example, houses along the crest of slopes could potentially be undermined by landsliding which could cause strains in the house foundation or superstructure. However, houses at the base of slopes can be impacted by a landslide directly, leading to shear stress and point forces which could cause beam or column collapse. If the landslide were more intense or occurred more frequently, the relative level of impacts that it could cause over time would be relatively higher.
When considering protecting development from various types of natural hazards, the protection measures (e.g., land-use policy, engineering solutions) should explicitly account for the type of hazard being considered, its mechanisms, as well as the frequency and intensity of potential hazards.
J.3. ESTABLISHING HAZARDOUS LAND DEVELOPMENT PERMIT AREAS Based on current BC legislation, the objectives when establishing a DPA are to:
1. Define the DPA extents. 2. Define special conditions or objectives that justify the DPA designation. 3. Form associated guidelines for how proposed development in that area can address the
special conditions or objectives.
When establishing DPAs for geohazard areas, BGC recommends consideration of the following:
• DPA categories should reflect hazard types with distinct mechanisms. For example, steep creek and flood hazards are sufficiently different in mechanism and impact potential that management strategies for these hazards typically differ. At the same time, the overall approach and philosophy for managing hazards should be consistent across different hazard types.
• DPA extents, as well as associated bylaws and policies, should account for hazard mechanisms across a range of frequencies and intensities (i.e., beyond the 200 year flood).
• The outcomes of hazard assessments should provide information that can support defining DPA boundaries and associated guidelines for how proposed development in the associated area can address the DPA special conditions or objectives.
• As a starting point, hazardous land extents within DPAs should encompass the largest credible area affected by a single geohazard event known as the “consultation zone”
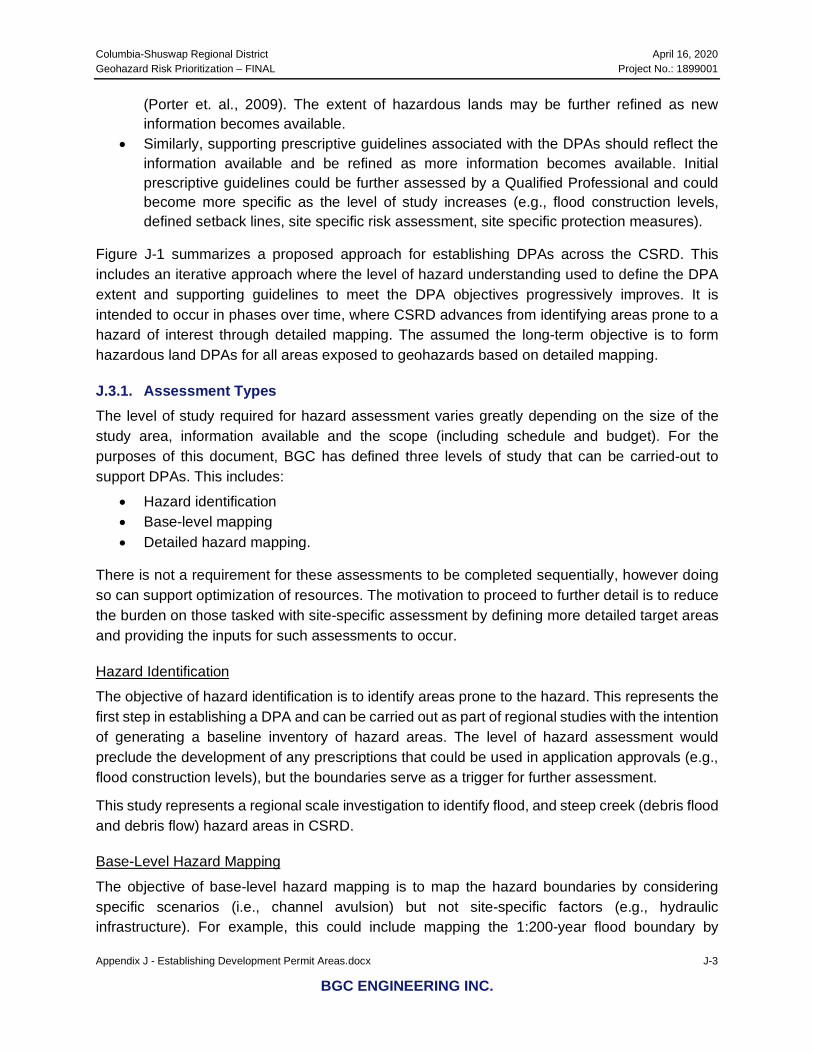
Columbia-Shuswap Regional District April 16, 2020 Geohazard Risk Prioritization – FINAL Project No.: 1899001
Appendix J - Establishing Development Permit Areas.docx J-3
BGC ENGINEERING INC.
(Porter et. al., 2009). The extent of hazardous lands may be further refined as new information becomes available.
• Similarly, supporting prescriptive guidelines associated with the DPAs should reflect the information available and be refined as more information becomes available. Initial prescriptive guidelines could be further assessed by a Qualified Professional and could become more specific as the level of study increases (e.g., flood construction levels, defined setback lines, site specific risk assessment, site specific protection measures).
Figure J-1 summarizes a proposed approach for establishing DPAs across the CSRD. This includes an iterative approach where the level of hazard understanding used to define the DPA extent and supporting guidelines to meet the DPA objectives progressively improves. It is intended to occur in phases over time, where CSRD advances from identifying areas prone to a hazard of interest through detailed mapping. The assumed the long-term objective is to form hazardous land DPAs for all areas exposed to geohazards based on detailed mapping.
J.3.1. Assessment Types The level of study required for hazard assessment varies greatly depending on the size of the study area, information available and the scope (including schedule and budget). For the purposes of this document, BGC has defined three levels of study that can be carried-out to support DPAs. This includes:
• Hazard identification • Base-level mapping • Detailed hazard mapping.
There is not a requirement for these assessments to be completed sequentially, however doing so can support optimization of resources. The motivation to proceed to further detail is to reduce the burden on those tasked with site-specific assessment by defining more detailed target areas and providing the inputs for such assessments to occur.
Hazard Identification
The objective of hazard identification is to identify areas prone to the hazard. This represents the first step in establishing a DPA and can be carried out as part of regional studies with the intention of generating a baseline inventory of hazard areas. The level of hazard assessment would preclude the development of any prescriptions that could be used in application approvals (e.g., flood construction levels), but the boundaries serve as a trigger for further assessment.
This study represents a regional scale investigation to identify flood, and steep creek (debris flood and debris flow) hazard areas in CSRD.
Base-Level Hazard Mapping
The objective of base-level hazard mapping is to map the hazard boundaries by considering specific scenarios (i.e., channel avulsion) but not site-specific factors (e.g., hydraulic infrastructure). For example, this could include mapping the 1:200-year flood boundary by
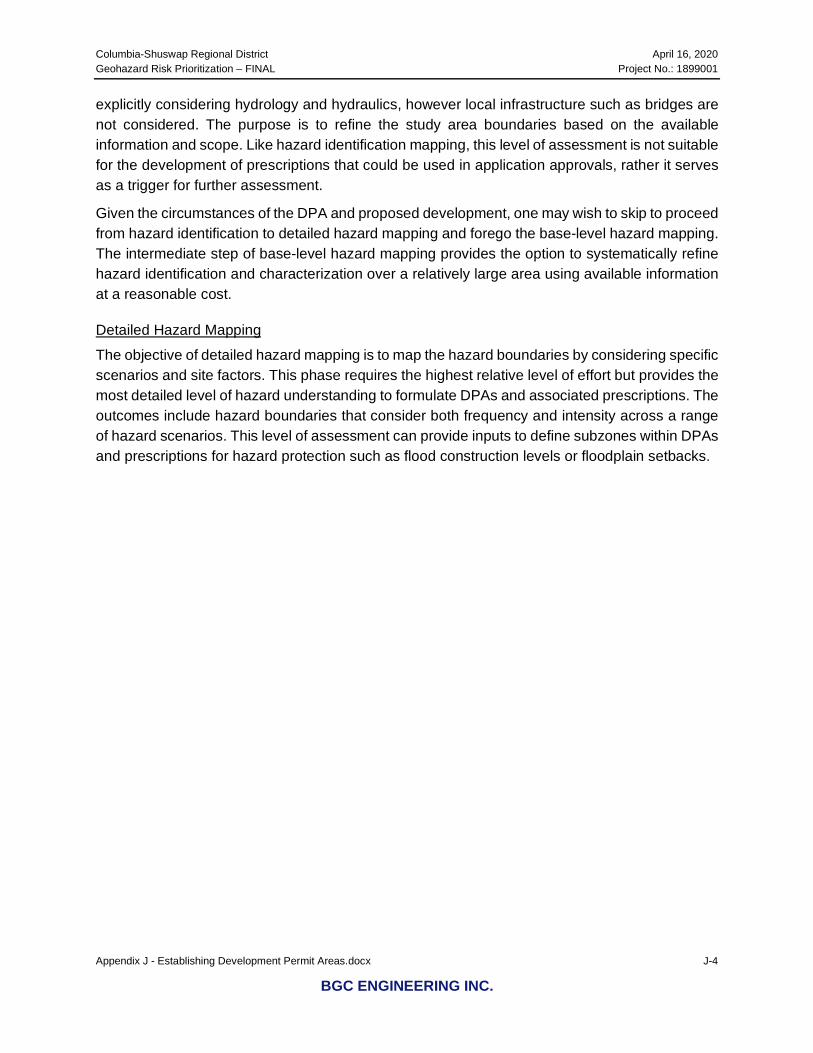
Columbia-Shuswap Regional District April 16, 2020 Geohazard Risk Prioritization – FINAL Project No.: 1899001
Appendix J - Establishing Development Permit Areas.docx J-4
BGC ENGINEERING INC.
explicitly considering hydrology and hydraulics, however local infrastructure such as bridges are not considered. The purpose is to refine the study area boundaries based on the available information and scope. Like hazard identification mapping, this level of assessment is not suitable for the development of prescriptions that could be used in application approvals, rather it serves as a trigger for further assessment.
Given the circumstances of the DPA and proposed development, one may wish to skip to proceed from hazard identification to detailed hazard mapping and forego the base-level hazard mapping. The intermediate step of base-level hazard mapping provides the option to systematically refine hazard identification and characterization over a relatively large area using available information at a reasonable cost.
Detailed Hazard Mapping
The objective of detailed hazard mapping is to map the hazard boundaries by considering specific scenarios and site factors. This phase requires the highest relative level of effort but provides the most detailed level of hazard understanding to formulate DPAs and associated prescriptions. The outcomes include hazard boundaries that consider both frequency and intensity across a range of hazard scenarios. This level of assessment can provide inputs to define subzones within DPAs and prescriptions for hazard protection such as flood construction levels or floodplain setbacks.
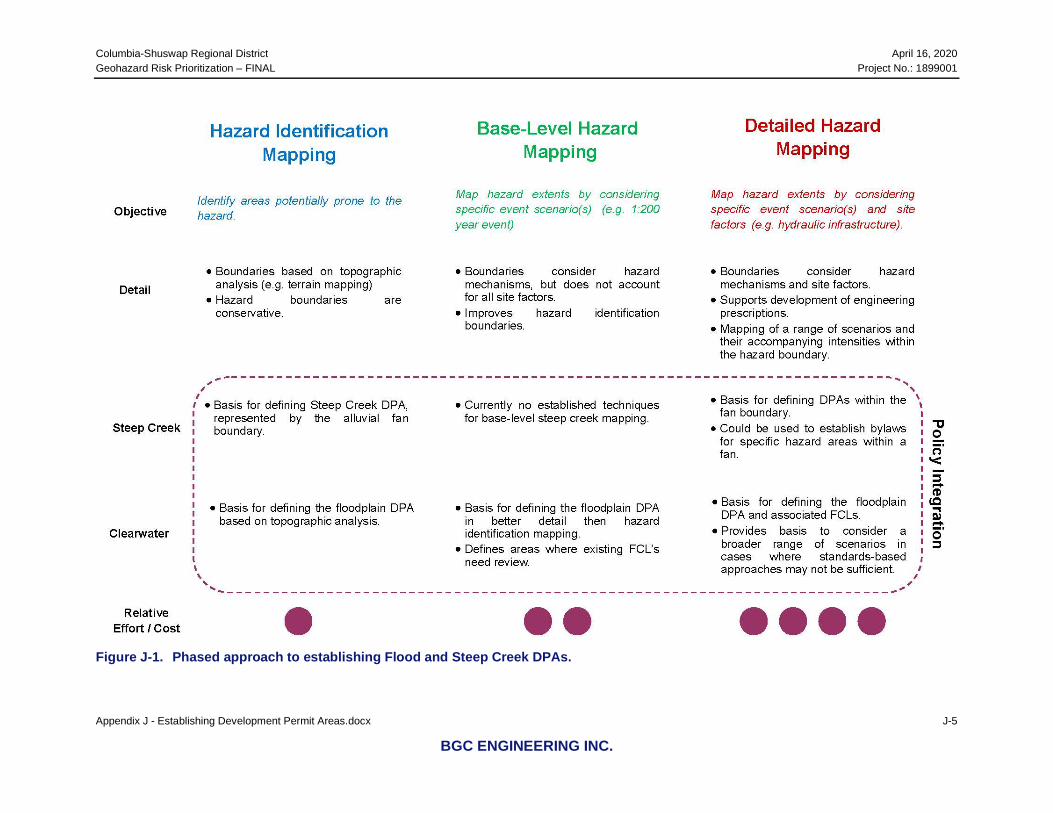
Columbia-Shuswap Regional District April 16, 2020 Geohazard Risk Prioritization – FINAL Project No.: 1899001
Appendix J - Establishing Development Permit Areas.docx J-5
BGC ENGINEERING INC.
Figure J-1. Phased approach to establishing Flood and Steep Creek DPAs.

Columbia-Shuswap Regional District April 16, 2020 Geohazard Risk Prioritization – FINAL Project No.: 1899001
Appendix J - Establishing Development Permit Areas.docx J-6
BGC ENGINEERING INC.
J.3.2. Managing Changing Conditions As discussed in Section 7.3 of the main report, geohazard risk management is an iterative process that needs to consider changes such as:
• Changes in earth systems (i.e., landscape an/or climate change) • Changes in human systems (i.e., new development) • Changes in the level of information and knowledge (i.e., new data, methods, or tools).
The main report summarizes points for consideration for how to continuously prioritize mapping effort between CSRD geohazard areas. In the case of DPAs, there is a tension between the need to establish boundaries with implications for development on a scale of decades or longer, and the need to update and refine as conditions change. To support updates to DPAs that may be triggered by changing conditions, BGC suggests the CSRD consider:
• Operational processes to remove the ‘friction’ caused by static datasets such as hazard mapping, information on the built environment, assessment data). Storing these data in a digital environment reduces the effort required for compilation and analysis.
• Criteria to decide when changes are warranted • Policy written to allow such change to occur regularly over time (i.e., DPAs defined outside
of the OCP).
Columbia-Shuswap Regional District April 16, 2020 Geohazard Risk Prioritization – FINAL Project No.: 1899001
Appendix J - Establishing Development Permit Areas.docx J-7
BGC ENGINEERING INC.
REFERENCES Porter, M., M. Jakob, and K. Holm. 2009. Proposed landslide risk tolerance criteria. 62nd
Canadian Geotechnical Conference and 10th Joint CGS/IAH-CNC Groundwater Conference, Halifax, Nova Scotia, Canada, 533–541.

Columbia Shuswap Regional District April 16, 2020 Geohazard Risk Prioritization - FINAL Project No.: 1899001
BGC ENGINEERING INC.
APPENDIX K RECOMMENDATIONS – DETAILED STUDIES

Columbia-Shuswap Regional District April 16, 2020 Geohazard Risk Prioritization – FINAL Project No.: 1899001
Appendix K - Recommendations - Detailed Studies.docx K-1
BGC ENGINEERING INC.
K.1. INTRODUCTION Section 7 of the Main Document recommends that CSRD complete more detailed assessments for geohazard areas chosen by CSRD as top priority following review of the results of this assessment. This appendix provides additional detail on recommended assessment approaches. BGC recommends that any new geohazards assessments and mapping be integrated into the current regional study and used to update the geohazard ratings.
K.2. CLEAR-WATER FLOODPLAINS
K.2.1. Approach and Overview Modernized floodplain maps should be consistent with the EGBC Guidelines for Floodplain Mapping and Flood Assessments in BC (2017). Flood Hazard Assessments at “Class 2 to 3” level of effort (EGBC, 2018) are recommended for clear-water flood sites. The suggested approach described herein should be adapted for individual sites. In summary, this level of effort includes the following components:
• Review Lidar and historical imagery to identify features such as historical channels • Review of stakeholder input • Site visit and qualitative assessment of flood hazards, including documentation of existing
flood and erosion protection • Bank erosion quantitative assessment using historical air photographs • Watershed-scale land use change consideration • Climate change predictions for precipitation and runoff as inputs to hydraulic modelling • Hydraulic modelling with possible dike breach scenarios, where applicable • Flood hazard inundation maps for 200-year and possibly 500 to 1,000-year flood event.
K.2.2. Suggested Work Plan Table K-1 lists recommended tasks for each area to be mapped. Each task is described in the sections which follow. BGC notes that tasks will differ in detail for individual areas.

Columbia-Shuswap Regional District April 16, 2020 Geohazard Risk Prioritization – FINAL Project No.: 1899001
Appendix K - Recommendations - Detailed Studies.docx K-2
BGC ENGINEERING INC.
Table K-1. Recommended clear-water floodplain mapping work plan.
Activities Tasks Deliverables/Products Resources
Data Compilation
Survey and Base Data Collection
Base inputs for hazard analyses and study integration such as historical air photographs, regional geology maps and land use coverage maps
• Bathymetric surveyors • Qualified Professionals • District staff • Project stakeholders
Asset and Elements at Risk Inventory Update
Base inputs for hazard analyses and study integration • BGC team • Qualified Professionals • Project stakeholders
Analysis Hydrology and Climate Change Assessment
Hydrologic inputs for hydraulic modelling including climate-change adjusted precipitation and runoff inputs
• Qualified Professionals
Hydraulic Modelling Model outputs showing flood extent, flow depth and velocity. • Qualified Professionals Channel Stability Investigation
Geomorphological inputs for flood hazard maps to show areas prone to erosion. Bank erosion assessment results and rates.
• Qualified Professionals
Study Integration Integration of new hazard mapping with this current study, including updates to risk prioritization results and web application display.
• Qualified Professionals • District staff • Project stakeholders
Final Deliverables
Hazard Map Production Clear-water flood hazard maps showing the areas of inundation at different return periods
• Qualified Professionals
Reporting and Data Services
Description of methods, results, and limitations, and data and web services for dissemination of study results
• District staff • Project stakeholders

Columbia-Shuswap Regional District April 16, 2020 Geohazard Risk Prioritization – FINAL Project No.: 1899001
Appendix K - Recommendations - Detailed Studies.docx K-3
BGC ENGINEERING INC.
Base Data Collection
Lidar is used in flood mapping to provide detailed topographic information that is not evident on topographic maps generated from photogrammetry. However, Lidar surveys are unable to penetrate water surfaces. To account for channel capacity below the previously surveyed water elevation, bathymetric surveys would be required. These surveys develop cross-sections at set intervals for the length of the study watercourse.
Post-processing of the bathymetric data is required to integrate the bathymetry with the Lidar to generate a digital elevation model (DEM) for use in hydraulic modelling. The survey would also include items such as: thalweg delineation, top of bank, bridge details, culvert details, geometry details for all flood control structures, cross sections of structures such as dikes and berms, elevations of buildings located in the floodplain, geo-referenced photos of surveyed features, and interviews with stakeholders as feasible.
Additional items that require compilation from available sources beyond the information collected in this current regional study include:
• Lidar DEMs • Channel bathymetry data • Historical air photos • High resolution ortho imagery • Gauge rating curves and historical cross-section surveys • Lake levels • Historical highwater marks • Detailed survey, condition assessment and geotechnical stability data for dikes, where
applicable • More detailed review of previous reports (e.g., flood hazard, risk assessments, terrain
maps, watershed assessments, resource inventory maps, geological/geotechnical reports and/or maps).
A site visit will be required to evaluate bank and channel bed conditions, such as existing bank protection, grain size, vegetation type and rooting depths. This information will inform channel stability evaluations.
The asset and elements at risk inventory compiled as part of this assessment may also need to be updated if needed. This will include details not captured in the current work but required for hydraulic model setup.
Hydrology Assessment
Relevant historical flow data from the systematic record will need to be gathered for each site, reviewed and compiled. Additional values will need to be incorporated based on historical accounts, where available. A flood frequency analysis (FFA) will need to be completed to develop return period design discharge values.

Columbia-Shuswap Regional District April 16, 2020 Geohazard Risk Prioritization – FINAL Project No.: 1899001
Appendix K - Recommendations - Detailed Studies.docx K-4
BGC ENGINEERING INC.
As part of the hydrology assessment, climate change predictions for the study area will also need to be reviewed and considered in the time-series analysis for climate (e.g., precipitation, temperature) and runoff used to develop peak flows for hydraulic models.
Hydraulic Modelling
A hydraulic model – preferably two-dimensional – should be generated from the DEM and FFA for each site in order to develop inundation extents, flood depths and peak flow velocities for clear-water floods. Site-specific historical flood discharge and elevation, where available, would be used to validate the modelling. Discharge and survey water levels should also be collected as part of the bathymetric survey to help with model calibration. A sensitivity analysis would also be conducted for key parameters (e.g., roughness). Flood model scenarios may need to include dike breach modelling, where appropriate.
Channel Stability Investigation
The main objectives of this task item are to provide qualitative and quantitative information about the lateral channel stability along a given study reach. Depending on site specific conditions, the main tasks could include:
• Georeference or orthorectify historical air photos • Delineate channel banks and thalweg from historical air photos • Compare channel cross-sections, where historical surveys exist • Evaluate Lidar for relict channels • Quantitative analysis of bank erosion threshold flows and erosion extents • Evaluate and map areas with avulsion potential and bank erosion potential for design flood
discharges.
K.3. RESERVOIRS High and/or fluctuating lake levels on regulated lakes can result in geohazards such as the following:
• Flood inundation • Shoreline erosion • Impact by landslides and associated landslide-generated impulse waves • Groundwater mounding • Wind- and boat-generated waves • Storm surge.
Impacts from such events are manifested through a chain of events where the hazard occurs, impacts an element at risk, and causes something of value to suffer a loss. Losses can be measured, for example, as the number of causalities (e.g., displaced persons, injured persons, fatalities), economic value (e.g., capital cost, or life cycle cost), time (e.g., days, weeks, months or years of schedule delay, or of loss of use of some asset or functionality), or ecological value.
Where additional reservoir geohazard and risk assessment is considered in these areas, BGC suggests using an ‘impact line’ approach, which is based on guidelines provided by the
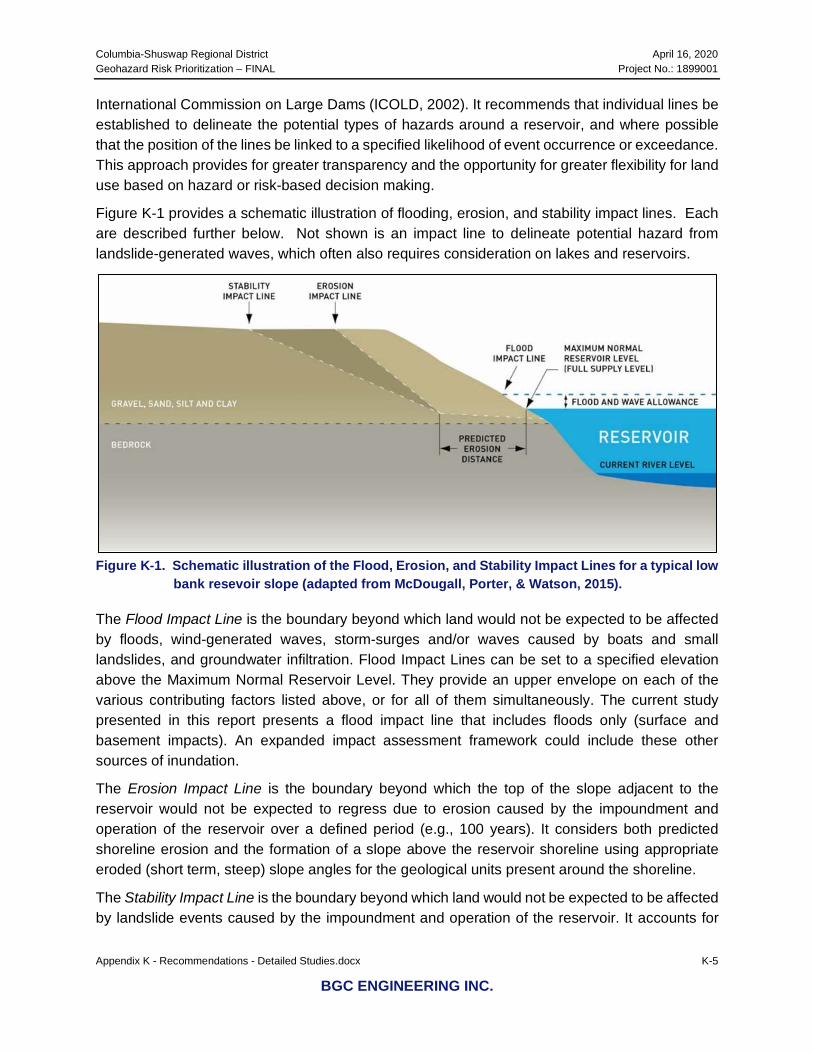
Columbia-Shuswap Regional District April 16, 2020 Geohazard Risk Prioritization – FINAL Project No.: 1899001
Appendix K - Recommendations - Detailed Studies.docx K-5
BGC ENGINEERING INC.
International Commission on Large Dams (ICOLD, 2002). It recommends that individual lines be established to delineate the potential types of hazards around a reservoir, and where possible that the position of the lines be linked to a specified likelihood of event occurrence or exceedance. This approach provides for greater transparency and the opportunity for greater flexibility for land use based on hazard or risk-based decision making.
Figure K-1 provides a schematic illustration of flooding, erosion, and stability impact lines. Each are described further below. Not shown is an impact line to delineate potential hazard from landslide-generated waves, which often also requires consideration on lakes and reservoirs.
Figure K-1. Schematic illustration of the Flood, Erosion, and Stability Impact Lines for a typical low
bank resevoir slope (adapted from McDougall, Porter, & Watson, 2015).
The Flood Impact Line is the boundary beyond which land would not be expected to be affected by floods, wind-generated waves, storm-surges and/or waves caused by boats and small landslides, and groundwater infiltration. Flood Impact Lines can be set to a specified elevation above the Maximum Normal Reservoir Level. They provide an upper envelope on each of the various contributing factors listed above, or for all of them simultaneously. The current study presented in this report presents a flood impact line that includes floods only (surface and basement impacts). An expanded impact assessment framework could include these other sources of inundation.
The Erosion Impact Line is the boundary beyond which the top of the slope adjacent to the reservoir would not be expected to regress due to erosion caused by the impoundment and operation of the reservoir over a defined period (e.g., 100 years). It considers both predicted shoreline erosion and the formation of a slope above the reservoir shoreline using appropriate eroded (short term, steep) slope angles for the geological units present around the shoreline.
The Stability Impact Line is the boundary beyond which land would not be expected to be affected by landslide events caused by the impoundment and operation of the reservoir. It accounts for
Columbia-Shuswap Regional District April 16, 2020 Geohazard Risk Prioritization – FINAL Project No.: 1899001
Appendix K - Recommendations - Detailed Studies.docx K-6
BGC ENGINEERING INC.
the predicted amount of shoreline erosion over a 100-year period of reservoir operation, potential changes in groundwater levels and gradual flattening of slopes above the reservoir shoreline using appropriate ultimate (long term, shallow) slope angles for the geological units present around the shoreline.
The Landslide-Generated Wave Impact Line is not shown on Figure K-1. It shows a boundary line where it can be determined that waves triggered by landslides entering a reservoir (landslide-generated waves) could temporarily inundate elevations higher than the Flood Impact Line. The inundation of these areas can be modelled numerically to estimate the Impact Line.
Raised reservoir levels can also increase the potential for fan-delta avulsions and bank erosion during steep creek geohazard events, i.e., where the coincidence of high lake levels and high creek flows can promote upstream avulsions. The Flood Impact Line approach cannot account for these types of reservoir hazards, and they are best considered as part of detailed steep creek assessments where this hazard is credible.
K.4. STEEP CREEKS
K.4.1. Approach and Overview As per EGBC Guidelines for Legislated Flood Assessments in BC (2018), BGC suggests that “Class 3” flood hazard assessments for debris floods or debris flows be completed for the prioritized steep creek flood hazard sites. A Class 3 assessment is semi-quantitative, in that steep creek flood hazards are described using both empirically derived values, as well as limited computation of site-specific parameters (e.g., magnitude or velocity).
The objective of the assessment is to generate hazard maps for each fan. The assessment would include a detailed characterization of in-scope steep creek flood hazards, in particular:
• Development of a preliminary frequency-magnitude (F-M) curve for steep creek flood hazards.
• Identification of active and inactive1 portions of the alluvial fan and areas potentially susceptible to avulsion or bank erosion during the specified steep creek flood hazard return periods.
• Numerical modelling of geohazard scenarios to estimate impact areas, flow velocity, and flow depth for a spectrum of return periods where appropriate from the F-M analysis.
• Consideration of climate change impacts on the frequency and magnitude of steep creek flood hazard processes.
• Consideration of long-term aggradation scenarios on the fan. • Consideration of processes specific to fan-deltas (rapid channel backfilling during times of
high lake levels).
1 Active alluvial fan – The portion of the fan surface which may be exposed to contemporary hydrogeomorphic or avulsion hazards. Inactive alluvial fan – Portions of the fan that are removed from active hydrogeomorphic or avulsion processes by severe fan erosion, also termed fan entrenchment.

Columbia-Shuswap Regional District April 16, 2020 Geohazard Risk Prioritization – FINAL Project No.: 1899001
Appendix K - Recommendations - Detailed Studies.docx K-7
BGC ENGINEERING INC.
F-M relations are defined as sediment volumes or peak discharges related to specific return periods (or annual frequencies). This relation forms the backbone of any hazard assessment because it combines the findings from F-M analyses and is the basic input to any future numerical modeling and hence informs components of hazard mapping.
K.4.2. Recommended Work Plan Table K-2 lists tasks suggested for each steep-creek hazard study area. Each task is further described in the sections which follow. BGC notes that tasks included in the table are generalized and will differ for individual project areas.
Data Compilation
The base data collection would include compiling all relevant site data relating to steep creek flood hazards. These data would be used as base inputs for the steep creek flood hazard mapping. Items to collate would include:
• Lidar DEMs • Historical air photos • High resolution ortho imagery • Gauge rating curves and historical cross-section surveys (if applicable/available) • Historical highwater marks (if readily available) • Bathymetric maps for fan-deltas (if available) • Accounts of historical steep creek floods and records of sediment deposition (if available) • Previous reports (e.g., flood hazard, risk assessments, terrain maps, watershed
assessments, resource inventory maps, geological/geotechnical reports and/or maps).
Derivative high-resolution DEMs from Lidar would be used to identify the locations of previous avulsions, aggradation, and historical steep creek flood deposits.

Columbia-Shuswap Regional District April 16, 2020 Geohazard Risk Prioritization – FINAL Project No.: 1899001
Appendix K - Recommendations - Detailed Studies.docx K-8
BGC ENGINEERING INC.
Table K-2. Suggested steep-creek hazard mapping work plan for each steep-creek hazard area.
Activities Tasks Deliverables/Products Resources Data Compilation
Base Data Collection • Base inputs for hazard analyses and study integration.
• Qualified Professional
• District staff • Provincial staff
Asset and Elements at Risk Inventory Update
• Base inputs for hazard analyses and study integration.
• Qualified Professional
• District staff Analysis Steep Creek hazard
characterization and analysis (desktop and field)
• Field observations to inform hazard analyses and modelling (surface observations and test pits)
• Field review of any existing structural protection structures (engineered or non-engineered)
• Regional F-M relationships • Hydrologic inputs for hazard
modelling.
• Qualified Professional
Climate Change Assessment
• Qualitative description of anticipated changes to F-M under climate change scenarios
• Qualified Professional
Hazard Modelling • Model outputs showing flow intensity (flow extent, flow depth and velocity), that form the basis for hazard mapping
• Qualified Professional
Channel Stability Investigation
• Geomorphological inputs for flood hazard maps.
• Bank erosion and set-back analysis
• Qualified Professional
Study Integration • Integration of new hazard mapping results with previous study.
• Qualified Professional
• District staff Final Deliverables
Hazard Map Production • Steep creek hazard maps. • Qualified Professional
• District staff Reporting and Data Services
• Description of methods, results, and limitations, and data and web services for dissemination of study results.
• Qualified Professional
• District staff

Columbia-Shuswap Regional District April 16, 2020 Geohazard Risk Prioritization – FINAL Project No.: 1899001
Appendix K - Recommendations - Detailed Studies.docx K-9
BGC ENGINEERING INC.
Analysis
Steep creek flood hazard characterization and mapping involves: developing an understanding of the underlying geophysical conditions (geological, hydrological, atmospheric, etc.); identifying and characterizing steep creek flood processes in terms of mechanism, causal factors, trigger conditions, intensity (destructive potential), extent, and change; developing steep creek F-M relationships; and identifying and characterizing geohazard scenarios to be considered in the steep creek flood hazard maps.
Desktop Study: Prior to field work, a desktop study would be completed to assess the frequency of past steep creek flood hazards from air photos, previous reports, and historical records. Qualitative observations would be made of any changes in watershed condition over the historical record (e.g., clear cuts, road construction, wildfires, insect infestations), as well as changes in the steep creek geomorphology (e.g., aggradation, erosion, avulsion, sediment input, landslide frequency) and artificial fan surface alterations (e.g., excavations, fill placements, developments). The desktop study would inform the key locations to be observed during field work. BGC suggests that prior to field work being conducted, the CSRD or stakeholders (i.e., those commissioning the work) should inform residents of the purpose and proposed timing for this field work.
Fieldwork: Fieldwork would provide key information for the steep creek flood hazard analysis. The steep creek channels would be traversed from the fan margins to as high as what can be accessed safely. Upper watersheds should also be accessed (on foot if possible) when important sediment sources have been identified that require field confirmation (e.g., landslides or artificial instabilities such as active or deactivated logging roads, waste rock placement, sumps). Helicopter overview flights would be used for channel sections that are not safely accessible from ground traverses. Stakeholder input would also be gathered during fieldwork, as feasible.
Surface field observations would include: • Location and extent of past steep creek floods from surface geomorphic evidence (e.g.,
channel levees, boulder lobes, paleochannels, etc.) • Channel measurements to identify high water/scour marks to estimate the peak flow of
previous steep creek floods • Channel cross-sections • Grain size distributions where appropriate • Sediment supply sources • Stratigraphy of natural exposures • Areas of channel aggradation and/or erosion • Visual assessment of existing steep creek flood mitigation structures (e.g., bridges, dikes,
rip rap, fills, groins, deflection berms, debris basins).
Where possible, dendrogeomorphological methods could be used to determine the timing and magnitude of past steep creek flood hazards. This sampling involves coring trees using a 4 mm-diameter incremental tree borer. Under ideal conditions, this method allows dating of past steep creek flood events several hundred years into the past. The dendrogeomorphological record can

Columbia-Shuswap Regional District April 16, 2020 Geohazard Risk Prioritization – FINAL Project No.: 1899001
Appendix K - Recommendations - Detailed Studies.docx K-10
BGC ENGINEERING INC.
complement the historical air photo record for developing a preliminary F-M assessment. The feasibility of applying dendrogeomorphological methods is usually determined during the site inspection.
Following field work, the preliminary F-M relationship would be developed for steep creek flood hazards and used to develop scenarios for numerical hazard modelling.
Numerical Modelling
Hazard modelling is necessary to estimate flow inundation area, flow velocities, flow depth, erosion, and sediment aggradation. The most appropriate two and three-dimensional modelling software would typically be selected after an initial assessment of site conditions. As new software packages constantly emerge, a decision as to the most appropriate model would be made at the time of the study. The modelling process may include:
• Model calibration of rheological and sediment entrainment parameters using the extents, thicknesses, and velocities (where available/applicable) of previous steep creek flood events, and measured sediment volumes in the channel. This calibration would be compared to empirical relationships.
• Predictive modelling of flows for the range of peak discharges associated with the return periods determined from the hazard analysis with rheological parameter combinations determined via the calibration process.
Additional Considerations
Very low hazard areas on fans, which are sometimes defined as “inactive” portions of the fan, and which are often paleofans, formed during a particularly active period in the early Holocene, can also be identified, if they exist. These areas are often hydraulically removed from the steep creek channel due to deep channel erosion or other factors and identifying these areas can be helpful for land use and development planning.
Most fans are active landforms that change over time. Areas subject to aggradation, channel erosion, or channel avulsions will need to be identified through desktop studies, site visits, and from the hazard modelling. In particular, fan-deltas (fans entering into water bodies) can have higher frequencies of aggradation and avulsions than land-based alluvial fans due to the interactions between the channel and still-water processes (van Dijk et al., 2012). All areas subject to these noted processes will be identified in the final hazard map.
Columbia-Shuswap Regional District April 16, 2020 Geohazard Risk Prioritization – FINAL Project No.: 1899001
Appendix K - Recommendations - Detailed Studies.docx K-11
BGC ENGINEERING INC.
REFERENCES Engineers and Geoscientists of BC (EGBC). (2017). Guidelines for Flood Mapping in BC. Web
link: https://www.egbc.ca/getmedia/8748e1cf-3a80-458d-8f73-94d6460f310f/APEGBC-Guidelines-for-Flood-Mapping-in-BC.pdf.aspx.
Engineers & Geoscientists British Columbia (EGBC) (2018, August 28). Legislated Flood Assessment in a Changing Climate in BC, Version 2.1. Professional Practice Guidelines.
International Commission on Large Dams (ICOLD). (2002). Reservoir Landslides: Investigation and Management, Guidelines and Case Histories. Bulletin 124.
McDougall, S., Porter, M., & Watson, A. (2015). Preliminary reservoir impact lines for the Site C Clean Energy Project. Proceedings, GeoQuebec,
van Dijk, M., Kleihans, M.G., Postma, G., & Kraal, E. (2012). Contrasting morphodynamics in alluvial fans and fan deltas: effects of the downstream boundary. Sedimentology, 59(7), 2125-2145.
Related Documents