CSRD in South Asia, Annual Report 2019 Annual Report: January to December 2019 CLIMATE SERVICES FOR RESILIENT DEVELOPMENT IN SOUTH ASIA ––– Strategic alignment –– ––

Welcome message from author
This document is posted to help you gain knowledge. Please leave a comment to let me know what you think about it! Share it to your friends and learn new things together.
Transcript
CSRD in South Asia, Annual Report 2019
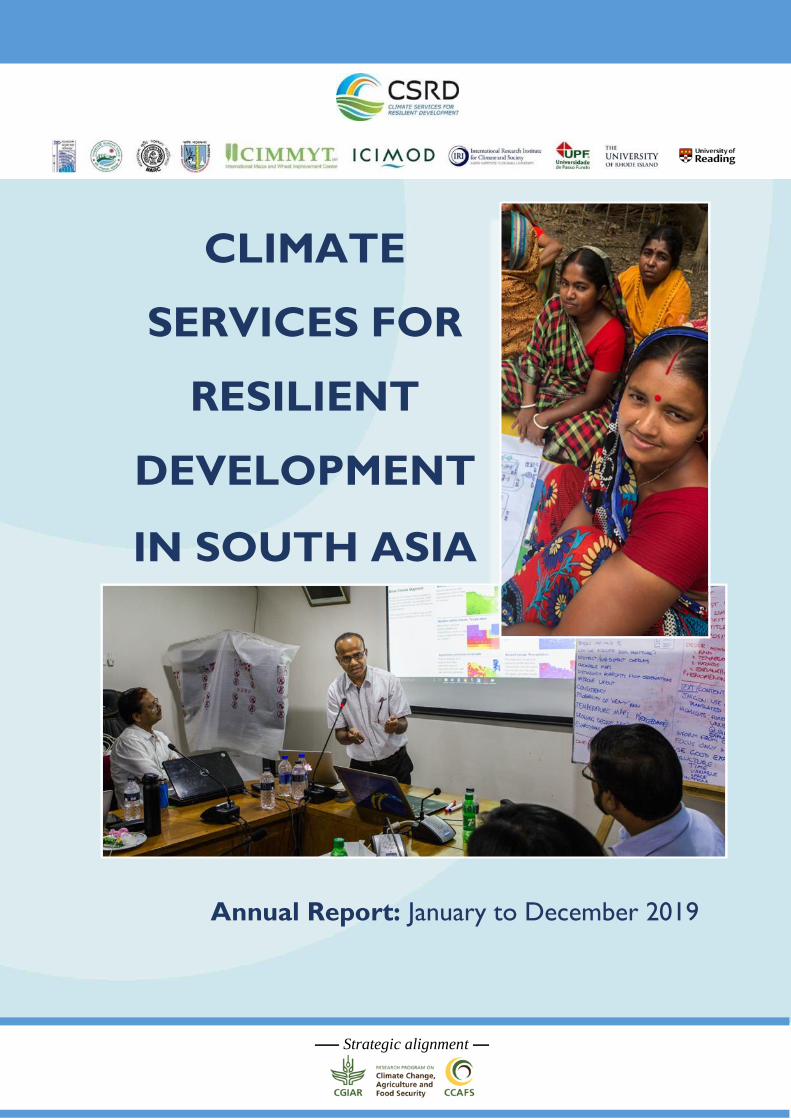
Annual Report: January to December 2019
CLIMATE
SERVICES FOR
RESILIENT
DEVELOPMENT
IN SOUTH ASIA
––– Strategic alignment ––––

CSRD in South Asia, Annual Report 2019
i
CSRD in South Asia, Annual Report 2019
ii
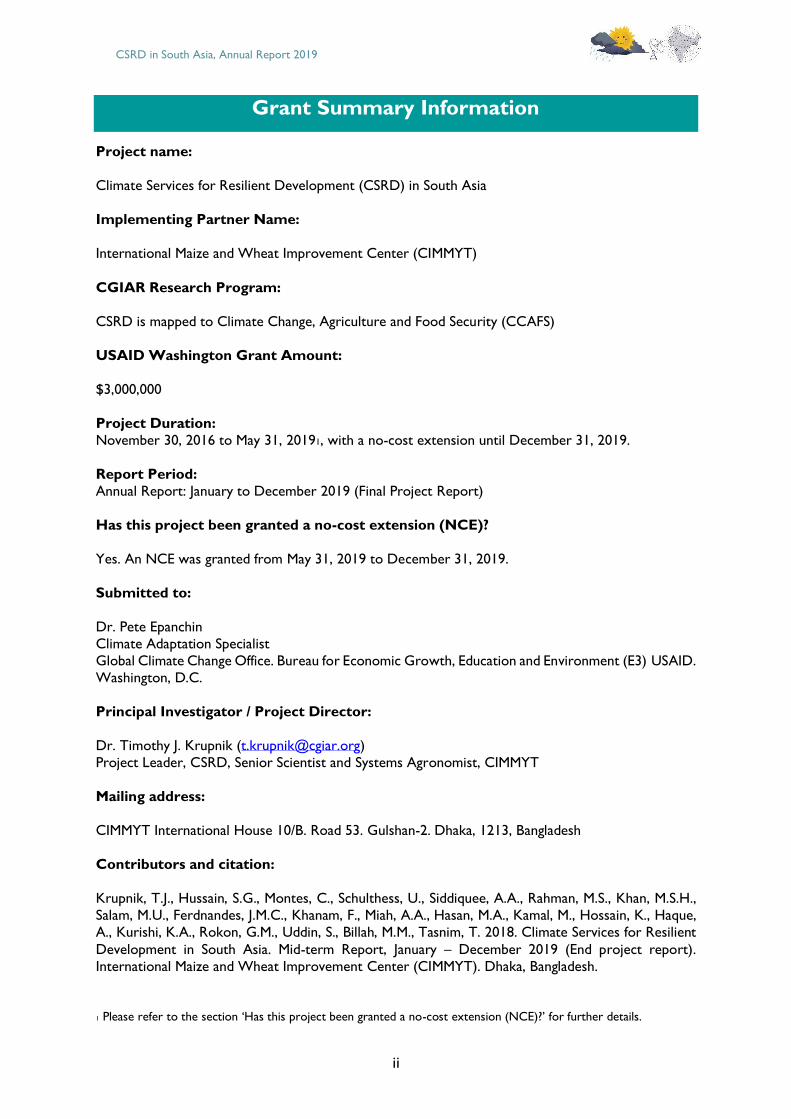
Grant Summary Information
Project name:
Climate Services for Resilient Development (CSRD) in South Asia
Implementing Partner Name:
International Maize and Wheat Improvement Center (CIMMYT)
CGIAR Research Program:
CSRD is mapped to Climate Change, Agriculture and Food Security (CCAFS)
USAID Washington Grant Amount:
$3,000,000
Project Duration:
November 30, 2016 to May 31, 20191, with a no-cost extension until December 31, 2019.
Report Period:
Annual Report: January to December 2019 (Final Project Report)
Has this project been granted a no-cost extension (NCE)?
Yes. An NCE was granted from May 31, 2019 to December 31, 2019.
Submitted to:
Dr. Pete Epanchin
Climate Adaptation Specialist
Global Climate Change Office. Bureau for Economic Growth, Education and Environment (E3) USAID.
Washington, D.C.
Principal Investigator / Project Director:
Dr. Timothy J. Krupnik ([email protected])
Project Leader, CSRD, Senior Scientist and Systems Agronomist, CIMMYT
Mailing address:
CIMMYT International House 10/B. Road 53. Gulshan-2. Dhaka, 1213, Bangladesh
Contributors and citation:
Krupnik, T.J., Hussain, S.G., Montes, C., Schulthess, U., Siddiquee, A.A., Rahman, M.S., Khan, M.S.H.,
Salam, M.U., Ferdnandes, J.M.C., Khanam, F., Miah, A.A., Hasan, M.A., Kamal, M., Hossain, K., Haque,
A., Kurishi, K.A., Rokon, G.M., Uddin, S., Billah, M.M., Tasnim, T. 2018. Climate Services for Resilient
Development in South Asia. Mid-term Report, January – December 2019 (End project report).
International Maize and Wheat Improvement Center (CIMMYT). Dhaka, Bangladesh.
1 Please refer to the section ‘Has this project been granted a no-cost extension (NCE)?’ for further details.

CSRD in South Asia, Annual Report 2019
iii
Cover photos: Timothy J. Krupnik (Top), Elizabeth Gawthrop (bottom). In the top photos, farmers
in Khulna discuss their interest in weather services. In the bottom, Dr. Nachiketa Acharya from IRI
leads discussions at BMD on the components of probabilistic forecasting.
Project website: Click here.
CSRD in South Asia, Annual Report 2019
iv
Contents
Grant Summary Information ............................................................................................................... ii
Contents ................................................................................................................................................ iv
Tables ..................................................................................................................................................... vi
Figures ................................................................................................................................................... vii
Photos .................................................................................................................................................... x
Abbreviations .......................................................................................................................................xii
Executive summary ............................................................................................................................xiv
Introduction .......................................................................................................................................... 1 Background ....................................................................................................................................... 1
Overview of the CSRD consortium in South Asia ..................................................................... 1
CSRD’s theory of change and strategic pillars in South Asia .................................................... 4
Objective 1: Impact-based national-scale decision tool platforms to support the Bangladesh
Meteorological Department’s Sector 3 agro-meteorology track ................................................. 5
Sub-Objective 1.1. Agricultural climactic information framework improved......................... 5 Sub-Objective 1.2. Climate services capacity development .................................................... 23
Sub-Objective 1.3: Development of forecast products, impact assessments and decision
support tools for agriculture, fisheries and/or livestock ......................................................... 24
Objective 2: Collaborative development and refinement of South Asian regional-scale agro-
climate decision support tools, services, and products ............................................................... 47
Sub–Objective 2.1: Support to facilitate the development and refinement of regional decision support decision support tools, services and products ........................................... 47
Objective 3: Coordination with CSRD partners in-country to ensure progress on the work
streams under the CSRD South Asia and Bangladesh working group ...................................... 61 Sub-Objective 3.1. Coordination of Bangladesh CSRD partners ........................................... 61
Sub-Objective 3.2. Policy maker, agro-metrological services, extension, and farmer
awareness of agro-meteorological forecasts and decision support tool platforms for agriculture increased ..................................................................................................................... 63
Implementation challenges ................................................................................................................ 69
Annexes ............................................................................................................................................... 70
Annex 1: Key Staff and Core Partner Designations ..................................................................... 70
Annex 2: Project subcontractors and key partners’ designations .............................................. 77
Annex 3: Monitoring, Evaluation and Learning Plan ..................................................................... 82
Annex 4: In-kind letters of support from partners ....................................................................... 75
Annex 5: Success stories and communication pieces produced during CSRD ........................ 81
Annex 6: Links to other communications and news and pieces about CSRD ......................... 97
Annex 7: Agvisely: Methodology and approach used to generate automated and location-
specific agricultural climate information services for farmers in Bangladesh .......................... 101
Annex 8: Draft Paper on Regional Climatological Analysis of Wheat Blast Disease Risks .. 121

CSRD in South Asia, Annual Report 2019
v
CSRD in South Asia, Annual Report 2019
vi
Tables
Table 2.1: Results of the switching regression model using the hindcast experiment data for
wheat farmers in Bangladesh and Bihar, 2017/18 .......................................................................... 19
Table 2.2: Details of the completed Agvisely trainings ................................................................. 38
Table A7.1: Phenological windows of field crops in Bangladesh with estimates of the number
of days required for each stage1 and temperature thresholds. n2 indicates the number of study observations included to calculate thresholds. ................................................................. 105
Table A7.2: Criteria for rainfall intensity used approved by the Bangladesh Meteorological
Department ....................................................................................................................................... 107
Table A8.1: List of parameters in the wheat phenology model. ............................................... 128
CSRD in South Asia, Annual Report 2019
vii
Figures
Figure 1.1: CSRD in South Asia’s strategic pillars upon which its research, development and
partnership activities were based ...................................................................................................... 4
Figure 2.1: The draft PICSA field manual in English (the Bangla version was completed in
early 2020) ............................................................................................................................................ 8
Figure 2.2: Individual level impacts of PICSA training as communicated in FGDs with PICSA female farmer trainees....................................................................................................................... 11
Figure 2.3: Household level impacts of PICSA training as communicated in FGDs with PICSA
male farmer trainees .......................................................................................................................... 11
Figure 2.4: Community level impacts of PICSA training as communicated at FGDs with male
and female trainees ............................................................................................................................ 12
Figure 2.5: A model hindcast sheet used during hindcast experiments to show farmers previous weather information in graphical form. Farmers then mapped their previous
season’s crop management practices to the dates in the graph and discussed how they may
have changed management practices if they had had access to the weather information. The data from such exercises helps identify the most relevant types of climate information and
crop management practices and the focus of climate services and agricultural extension
programs. ............................................................................................................................................. 17
Figure 2.6: Sampled farmers’ willingness to use climate services for altering agricultural
operations captured by hindcast experiment ................................................................................ 18
Figure 2.7: Depiction of the ‘decision frame’ on planting dates of farmers in Bihar, India. Note: the relative size of circles indicates number of farmers who responded affirmatively or
negatively to questions. Numbers shown on the diagram are the sample sizes. ..................... 20
Figure 2.8: Depiction of ‘decision frame’ on planting dates of wheat farmers in Bihar, India. Note: the relative size of circles indicates number of farmers who responded affirmatively or
negatively to questions. Numbers shown on the diagram are sample sizes. ............................ 21
Figure 2.9: Monsoon onset (a) and withdrawal (b) in Bangladesh (1981-2017). (c) Time series of country-averaged monsoon onset and withdrawal. Notes: shaded area is the spatial
standard deviation and all values are expressed in pentads. Data source: Climate Hazards
Group InfraRed Precipitation with Station product (CHIRPS v2) .............................................. 25
Figure 2.10: a and b: Maps of maximum Pearson correlation index between ENSO and
monsoon onset and withdrawal for clusters. c and d: the month (1-6 previous months) of
highest correlation displayed in a and b.......................................................................................... 26
Figure 2.11: Maps of (a) accumulated precipitation until the second week of June 2017 and
(b) corresponding anomalies. ........................................................................................................... 27
Figure 2.12: Maps of local monthly anomalies in precipitation during the 2018 monsoon in Bangladesh in relation to the long-term (1981–2018) mean. Data from CHIRPS v2.............. 28
Figure 2.13: Inter-annual average number of dry spells during 1951-2005 monsoon seasons –
(a) APHRODITE and (b) multi-model CMIP5 averages and (c) difference between (b) and (a). ......................................................................................................................................................... 30
Figure 2.14: Difference between number of dry spells in future projections and historical
CMIP5 multi-model average simulations for three future periods and two RCP scenarios. . 31
CSRD in South Asia, Annual Report 2019
viii
Figure 2.15: (a) The number of annual heavy rainfall events (1981–2017) and (b) linear trends. Note: p and n denote number of stations with positive and negative trends
respectively ......................................................................................................................................... 32
Figure 2.16: Rainfall amount (1999-2018) corresponding to the 95% during June-September, and accumulated precipitation for events above the percentile 95%. ....................................... 33
Figure 2.17: An infographic describing how Agvisely works. A short video on Agvisely can
also be found here. ............................................................................................................................ 36
Figure 2.18: Screenshot of a of the interactive agricultural climate services app Agvisely that
includes BMD sub-district forecasts and provides location-specific agronomic management
advisories for smallholder rice, wheat, maize, lentils and potato farmers on avoiding damaging heat, cold, dry spells, and heavy rainfall events. ........................................................... 37
Figure 2.19: The locations of three PANI experimental sites and percentage of water used
for irrigation derived from ground water. ..................................................................................... 41
Figure 2.20: A 20 March 2019 aerial view of the PANI maize experiment planted in Dinajpur
in winter 2018/19. Upper map shows the effect of the three irrigation treatments on the
canopy temperatures of maize. The lower map is a red-green-blue (RGB) image of these plots ...................................................................................................................................................... 42
Figure 2.21: Main components of PANI irrigation scheduling advisory system: Server with
database that runs a soil water balance model using weather data, crop management info and vegetation status measured by farmers by taking RGB photos with a smartphone app . 43
Figure 3.1: Regional seasonal outlook based on the condition in April 2019 produced on 7
May 2019 and its comparison with observed data in Nepal ....................................................... 48
Figure 3.2: Conditions interface of the National Agriculture Drought Watch ........................ 49
Figure 3.3: Seasonal assessment interface of the National Drought Watch, Bangladesh ....... 50
Figure 3.4: Elements and processes of the SALDAS system for producing drought data products ............................................................................................................................................... 52
Figure 3.5: Comparison of predicted and observed severity of Stemphylium blight disease of
lentils at 5 calibration locations (3 in Bangladesh, 2 in Nepal) and across all locations. Predictions used the best set of the Stempedia model’s parameters worked out from
calibration. Vertical bars denote 95% confidence intervals ......................................................... 55
Figure 3.6: Comparison of predicted (circles) and observed (line) severity of Stemphylium blight disease of lentils. Predictions based on calibrated Stempedia model .............................. 56
Figure 3.7: Comparison of predicted and observed severity of Stemphylium blight on lentils
at 5 tested locations (3 in Bangladesh, 2 in Nepal). Predictions based on calibrated Stempedia model. Vertical bars denote 95% confidence intervals ............................................. 56
Figure 3.8: Predicted severity of Stemphylium blight disease of lentils at 5 tested locations (3
in Bangladesh, 2 in Nepal) at farmers’ sowing time in 2017/18 and 2018/19 seasons. Predictions were based on the calibrated Stempedia model. ..................................................... 57
Figure 3.9: Modelling the incidence of Stemphylium blight on lentils in Bangladesh under
current thermal regimes (C: 1981-2005), and three future periods (F1: 2006-2039, F2: 2040-2059 and F3: 2070-95). ...................................................................................................................... 57
Figure A7.1: Methodological process used during systematic literature review to identify
peer-reviewed papers from which data were extracted to determining rice, wheat and maize
CSRD in South Asia, Annual Report 2019
ix
stress thresholds. Numbers in parentheses indicate the number of papers identified or retained. ............................................................................................................................................. 104
Figure A7.2: The architecture of Agvisely showing how forecast model outputs are
integrated with climate stress thresholds for different crops depending on likely phenological stages during forecast periods to generate climate-smart crop management advisories. .... 109
Figure A8.1: The shape of temperature response curve obtained by Equation (1) using
parameters for wheat blast (explained the text)......................................................................... 123
Figure A8.2: Map of what sowing dates (day of the year DOY) for winter wheat in Asia
MapSPAM wheat mask. ................................................................................................................... 125
Figure A8.3: Spatial pattern of the inter-annual average number of potential infections in Asia. Black dot symbols represent grid cells with presence of wheat. P99th is the 99%
percentile. .......................................................................................................................................... 129
Figure A8.4: As in Figure A8.3 but for inter-annual standard deviation .................................. 129
Figure A8.5: (a) Boxplots of spatial distribution of the inter-annual average number of
potential wheat blast infections. (b) Boxplots of temporal distribution of country averaged
number of potential infections. For each boxplot, the central mark shows the median and the edges are the 25th and 75th percentiles; dashed lines extend to the most extreme
values not considered outliers, and outliers are plotted individually (x sign) ........................ 130
Figure A8.6. Maps of inter-annual average (a) air temperature (ºC) and (b) relative humidity (%) during the cold season. Black dot symbols represent the points of Figure A8.3 where
wheat blast is present. ..................................................................................................................... 131
Figure A8.7. (a) Local correlation between the number of potential infections and ONI. (b) As in (a) but for number of potential infections and DMI. ........................................................ 132
Figure A8.8. (a) Composites of the difference between number potential infections for the
positive and negative face of ONI (a) and DMI (b). .................................................................... 133
CSRD in South Asia, Annual Report 2019
x
Photos
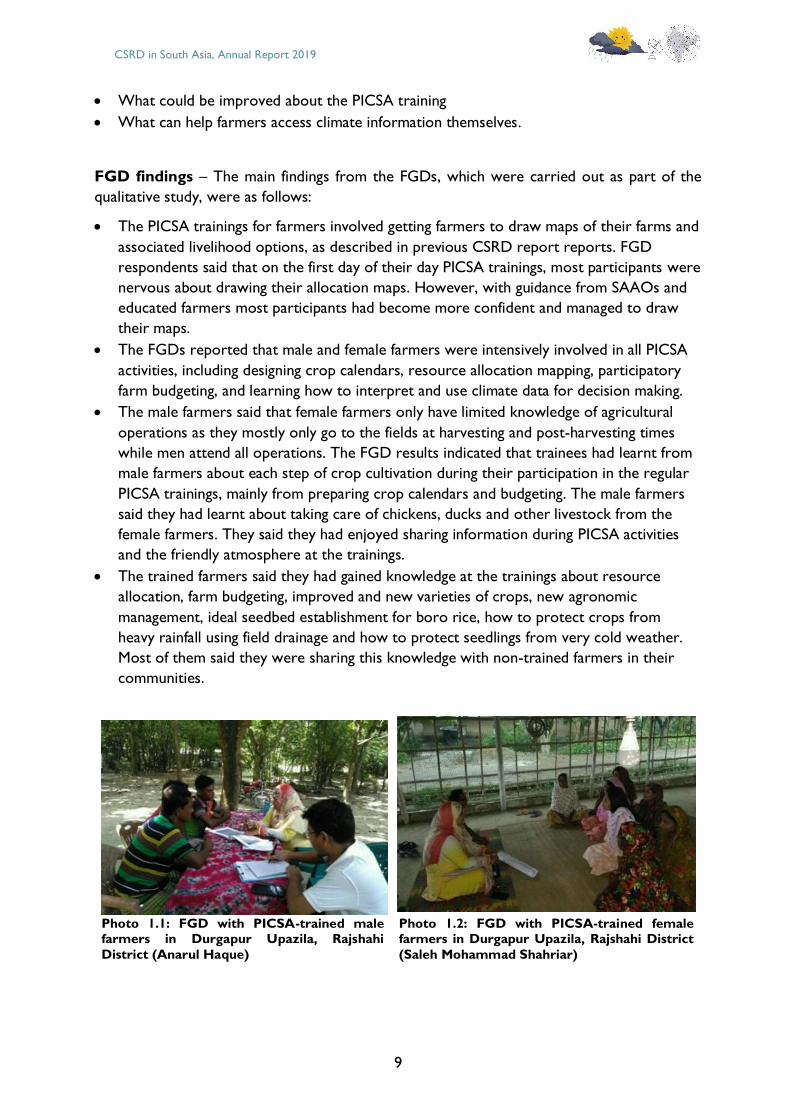
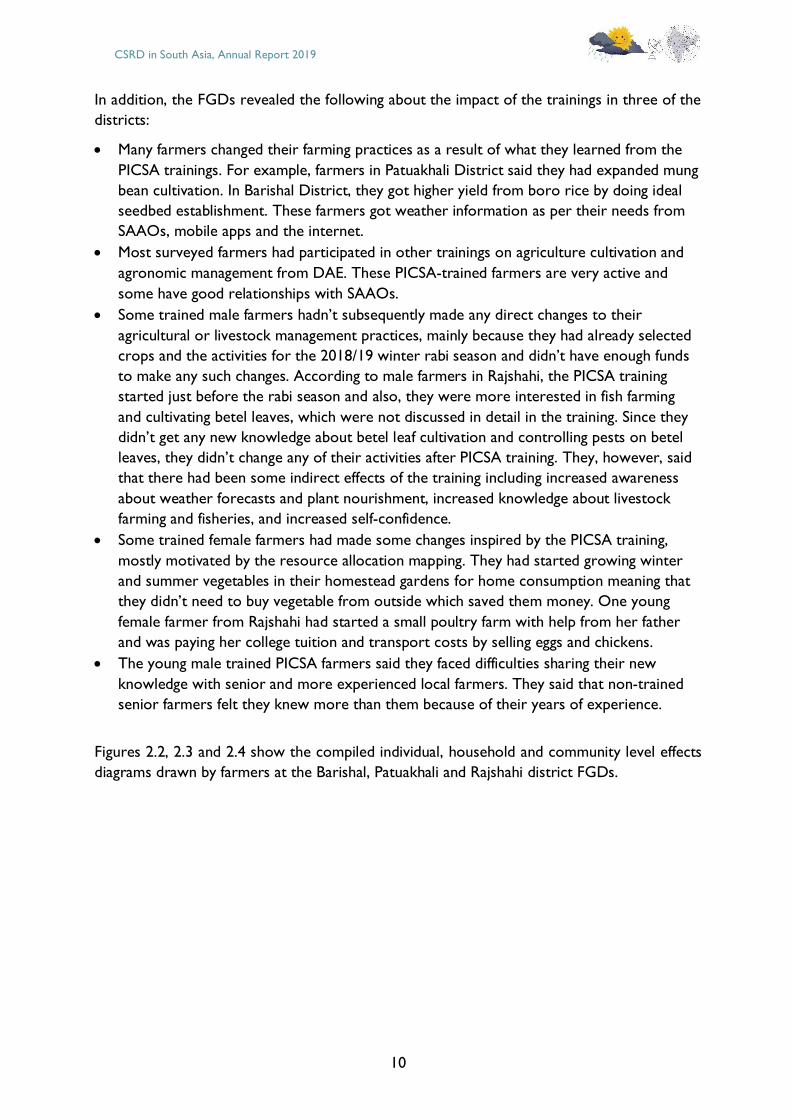
Photo 1.1: FGD with PICSA-trained male farmers in Durgapur Upazila, Rajshahi District
(Anarul Haque) ..................................................................................................................................... 9
Photo 1.2: FGD with PICSA-trained female farmers in Durgapur Upazila, Rajshahi District
(Saleh Mohammad Shahriar) ............................................................................................................... 9
Photo 1.3: Farmer Mijanur Rahman showing a weather forecast received through Facebook through his engagement with DAE and PICSA (SM Shahriar) .................................................... 13
Photo 1.4: Closer view of the 5-day BMD weather forecast sent by DAE with assistance
from CSRD (SM Shahriar) ................................................................................................................ 14
Photo 1.5: SM Shahriar (Agricultural Development Officer, CIMMYT) interviewing PICSA
trained farmer Anwar Hossain Babu in Durgapur Upazila, Rajshahi District (Anarul Haque)
.............................................................................................................................................................. 15
Photo 1.6: PICSA trained female farmer Safia Begum drawing her participatory storyline
explaining how, why and when she changed her vegetable cultivation practices influenced by
her PICSA training (Fahmida Khanam)............................................................................................ 15
Photo 1.7: The Agvisely launch workshop at Farmgate, Dhaka, 24 November 2019 ............. 37
Photo 2.1: Farmers consider mung beans as an economically important crop in southern
Bangladesh that also contributes to food and nutrition security, although extreme rainfall events threaten the crop and cause large losses in most years (CIMMYT) ............................. 39
Photo 2.2: Left to right: Prof. Mauricio Fernandes (UPF and EMBRAPA), Mr. Shamsuddin
Ahmed, Director of BMD, Dr. Wais Kabir, Director of Krishi Gobeshona Foundation, and Dr. Israil Hossain, Director of BWMRI officially recognize and endorse use of the CSRD
supported and meteorological forecast-driven early warning system for wheat blast in Dhaka
on 5 December 2019......................................................................................................................... 44
Photo 2.3: IRI and BMD scientists working in April 2019 in Dhaka to improve the code
generating 1 and 3 month forecasts using IRI’s Climate Predictability Tool............................. 46
Photo 2.4: An orientation workshop on Regional Drought Monitoring and Outlook System held in 2019 in Islamabad, Pakistan demonstrated the functions of the system and gathered
feedback on its usability (ICIMOD) ................................................................................................. 48
Photo 2.5: Stemphylium disease survey enumerators for 2018/19 in Nepal after returning from hands-on field training, 20 November 2018 (Sagar Kafle) ................................................. 54
Photo 2.6: Wheat blast is a potentially devastating fungal disease that causes bleaching of the
crop and unfilled grain. It was found for the first time in Asia in 2016. Since then, project scientists worked to assess the interaction between the region’s climate and potential for
disease outbreaks in key wheat growing countries. (CIMMYT) ................................................. 59
Photo 3.1: CIMMYT ODK lead Ashok Rai (far left) conducted an intensive training alongside Khaled Hossain (CIMMYT Research Associate) on ODK to accelerate observed data
weather availability. Through the use of digital data collection tools, weather data become
instantaneously available on a cloud server, reducing the time from data collection to when data can be used and analyzed by one to three months. ............................................................. 62
CSRD in South Asia, Annual Report 2019
xi
Photo 3.2: Mr. Shamsuddin Ahmed, Director of the Bangladesh Meteorological Department, addressing participants and facilitating a panel discussion with BACS Alumni at the 2019 5th
Annual Gobeshona conference on Climate Knowledge in Dhaka, Bangladesh. ....................... 63
Photo 3.3: Enhancing National Climate Services (ENACTS) launch workshop, 27 June 2019 at BMD (BACS) .................................................................................................................................. 65
Photo 3.4: Staff from CIMMYT and WorldFish trained as enumerators on 12 November
2019 to survey farmers and fishermen using methods developed under CSRD as part of CaFFSA project .................................................................................................................................. 66
Photo 3.5: Trainees in a multi-day workshop organized by ICIMOD and CIMMYT through
CSRD on the Principles and Application of GIS in Agriculture Planning and Decision Making, emphasizing climate information, at BARC Dhaka in May 2019. ................................................ 67
Photo 3.6: Josh Klein, U.S. Senate Foreign Relations Committee (left) visited CSRD field
activities in Bangladesh on 18 March 2019. Dr. Timothy J. Krupnik, Senior Scientist and Systems Agronomist, and CSRD in South Asia Project Leader (Right) explained how CSRD
partners with extension services in Bangladesh to deliver climate services to smallholder
farmers. ................................................................................................................................................ 67
CSRD in South Asia, Annual Report 2019
xii
Abbreviations
ACI Advanced Chemical Industries Ltd
AEO agricultural extension officer
APHRODITE Asian Precipitation - Highly-Resolved Observational Data Integration Towards
Evaluation
BACS Bangladesh Academy for Climate Services
BARC Bangladesh Agricultural Research Council
BARI Bangladesh Agriculture Research Institute
BAU Bihar Agricultural University
BIID Bangladesh Institute of ICT in Development
BMD Bangladesh Meteorological Department
BMR Bangladesh Map Room
BRAC formerly Bangladesh Rehabilitation Assistance Committee
BWCSRP Bangladesh Weather and Climate Services Regional Project
BWMRI Bangladesh Wheat and Maize Research Institute
CaFFSA Capacitating Farmers and Fishers to Manage Climate Risks in South Asia
CCAFS Climate Change Agriculture and Food Security
CEGIS Center for Environmental and Geographic Information Systems
CGIAR formerly the Consultative Group for International Agricultural Research
CHIRP Climate Hazard Group InfraRed Precipitation
CHIRPS Climate Hazard Group InfraRed Precipitation by Satellite
CIMMYT International Maize and Wheat Improvement Center
CMIP Coupled Model Intercomparison Project
CNRS French National Centre for Scientific Research
CPT Climate Predictability Tool
CSISA Cereal Systems Initiative for South Asia
CSRD Climate Services for Resilient Development
DAE Department of Agricultural Extension
DAP diammonium phosphate
DAS days after sowing
DEW disease establishment window
DSSAT Decision Support System for Technology Transfer
DST decision support tool
ENACTS Enhancing National Climate Services
ENSO El Niño-Southern Oscillation
ESRI formerly the Environmental Systems Research Institute
EWS early warning system
FGD focus group discussion
FOREWARN Forecast-based Warning, Analysis and Response Network
FTE full time equivalency
GDAS Global Data Assimilation System
GIS Geographic Information Systems
HKH Hindu Kush Himalaya
ICCCAD International Center for Climate Change and Development
ICIMOD International Center for Integrated Mountain Development
ICT information and communication technology
INAFI Asia International Network of Alternative Financial Institutions Asia
CSRD in South Asia, Annual Report 2019
xiii
IRI International Research Institute for Climate and Society
IUB Independent University of Bangladesh
IVR interactive voice response
IWM Institute of Water Modeling
LDAS Land Data Assimilation System
MERRA Modern-Era Retrospective analysis for Research and Applications
MoT Magnaporthe Oryzae Triticum
Mt metric tonnes
NARC Nepal Agricultural Research Council
NASA LIS NASA land Information System
NASA National Aeronautics and Space Administration
NGLRP National Grain Legume Research Program
NMME North American Multi Model Ensemble
PANI Program for Advanced Numerical Irrigation
PERSIANN Precipitation Estimation from Remotely Sensed Information using Artificial Neural
Networks
PICSA Participatory Integrated Climate Services for Agriculture
RCP Representative Concentration Pathway
RGB red-green-blue
RH relative humidity
S2S Seasonal to Sub-Seasonal
SAAO Sub-Assistant Agricultural Officer
SAARC South Asian Association for Regional Cooperation
SALDAS South Asia Land Data Assimilation System
SERVIR-HKH SERVIR-Hindu Kush Himalaya
NMME National Multi-Model Ensemble
SST sea-surface temperature
TK taka
TRMM Tropical Rainfall Measuring Mission
UAO Upazila agricultural offices
UPF University of Passo Fundo
URI University of Rhode Island
USAID United States Agency for International Development
WaterApps Water Information Services for Peri-urban Agriculture
WRF Weather Research and Forecasting Model
WUR Wageningen University and Research
CSRD in South Asia, Annual Report 2019
xiv
Executive summary
Climate Services for Resilient Development (CSRD) is a global partnership that is aligned with
the Global Framework for Climate Services. It works to link climate science, data streams,
decision support tools, and training with decision-makers in developing countries. CSRD is
led by the United States Government and is supported by the UK Government’s Department
for International Development (DFID), the UK Meteorological Office, ESRI, Google, the Inter-
American Development Bank, the Asian Development Bank, and the American Red Cross.
Led by the International Maize and Wheat Improvement Center (CIMMYT), the CSRD
initiative in South Asia ran from November 2016 to December 2020 with partners to conduct
applied research and facilitate the use of climate information to reduce risk for smallholder
farmers.
This report details activities of the CSRD project in South Asia during whole of 2019,
throughout to the end of the year, which marks the end of the project2. Notable highlights
include the following:
• In partnership with the Bangladesh Meteorological Department (BMD) and Department
of Agricultural Extension (DAE), CSRD established Agvisely, interactive, map-based agro-
meteorological bulletin and an accompanying mobile phone app that provides numerical
weather forecasting model predictions with easy-to-understand crop-specific
management advisories. Agvisely is an automatic climate service advisory system for
Bangladesh’s major field crops in Bangladesh. A database of climate information service
advisories covers the different phenological stages of eight crops. Each stage has specific
threshold temperature and rainfall threshold above or below which crop stresses occur.
Agvisely contains advisories for these stages that are to be triggered for different values
of temperature and rainfall that may arise within the following five day periods. In addition
to providing real-time crop advisories depending on the next five day weather forecast,
Agvisely provides temperature and rainfall forecasts for each of Bangladesh’s 491 sub-
districts. This makes it the highest resolution forecast now available in Bangladesh.
• On December 5, 2019, BMD, DAE, and the Bangladesh Wheat and Maize Research
Institute all endorsed use of the numerical weather forecast driven Wheat Blast disease
early warning system. This system,– which can be found at www.beattheblastews.net –
also provides automated, customized and location-specific disease management advisories
as a function of the forecast model outputs supplied by BMD. Over 800 extension officers
in Bangladesh are now receiving alerts by email 5 days in advance if their designated
working areas were predicted to be at risk of a wheat blast outbreak. Each extension
officer in Bangladesh is responsible for between 2,000–5,000 farmers. This underscores
the potential to reach farmers with relevant climate information services in the form of
wheat blast disease outbreak warnings and advisories now that the government has
endorsed use of the early warning system.
• As a result of BMD’s engagement with CSRD and the International Research Institute for
Climate and Society (IRI), BMD is now regularly running the scripts generating monthly
and three-monthly precipitation forecasts are now shown on BMD’s website. Links for
2 All previous five CSRD reports and additional publications can be found on the project website.
CSRD in South Asia, Annual Report 2019
xv
the monthly and seasonal precipitation forecasts can be found here and here. Completion
and integration of these forecasts in BMD’s website signals that CSRD was successful in
achieving one of its primary goals to begin the use of sub-seasonal and seasonal forecasts
in Bangladesh.
• Bangladesh’s Department of Agricultural Extension (DAE) continued to expand their use
of Participatory Integrated Climate Services for Agriculture (PICSA) training approaches
to increase farmers’ knowledge of climate and meteorology, and their relation to crop
and farm management practices. A customized PICSA manual for Bangladesh was
completed during the reporting period, as well as an effectiveness study that was used to
advise DAE on methods they can used to improve the impact of PICSA after CSRD ended
in December of 2019. In addition, DAE took strong steps towards integration of PICSA
in their regular institutional programs, with pro-active steps taken to generate additional
funding for PICSA after CSRD closes.
• CSRD scientists completed a set of novel ‘hindcast experiments’ in Bangladesh, Nepal,
and India to examine the ways in which farmers may or may not act on climate
information to improve crop management. 600 farmers took part in the participatory
study, which indicated that farmers were able to make a series of strategic choices on
crop management – with emphasis on nutrient management and irrigation timing
improvements – with the supply of forecast information. However, climate information
alone is not enough to condition behavioural change among farmers. Such information
needs to be complemented with adequate quality inputs of seed supply, access to finance,
and the availability of labor, farm machinery, irrigation water and post-harvest storage
facilities as part of integrated development programming. Based on learnings from CSRD,
two other research programs operational in Bangladesh – one led by Wageningen
University and the other led by WorldFish – are now using this method in their climate
services projects.
• The CSRD project completed a series of detailed analyses to develop . Agriculturally
relevant climatological analysis and improved extended-range forecasts and outlooks for
Bangladesh, with the resulting code turned over to the BMD for further use. Key areas
of analysis included studies to improve the prediction of monsoon onset and withdrawal,
prediction using ENSO data, mapping the seasonal progression of the monsoon and
deviations from historical normal, monthly anomalies in precipitation, and mapping of dry
spells within the monsoon (both historically and with future climate predictions to 2095).
• At a regional level, CSRD’s engagement with the International Centre for Mountain
Research and Development (ICIMO has resulted in additional improvements in sub-
seasonal to seasonal meteorological forecasts to more accurately monitor of hydrological
states, most notably drought. A non-validated and preliminary drought monitoring portal
was completed during the course of the CSRD project, with resulting seasonal outputs
from this work found at http://tethys.icimod.org/apps/sldasdataforecast/. In addition, a
comprehensive resource book was published by the South Asian Association for Regional
Cooperation Agriculture Centre, CIMMYT and ICIMOD, with support from CSRD.
• The productivity of lentils (Lens culinaris) in South Asia is severely affected by diseases,
many of which are related to prevailing weather conditions. Developed through CSRD,
CSRD in South Asia, Annual Report 2019
xvi
the Stempedia forecasting model has great potential as a weather-driven tool for
forecasting the occurrence of Stemphylium blight. Work during the reporting period
resulted in successful calibration and validation of the model. Confidence in the model is
now sufficiently acceptable that it can be utilized for Nepal and Bangladesh. Based on the
work of CSRD, the model will be trialed for pilot use in the 2020-2021 lentil production
season in both countries.
• CSRD’s work in capacity building continued during the reporting period. Notable
outcomes included the provision of tools such as Agvisely and the wheat blast early
warning system to governmental partners. The World Bank funded Bangladesh Weather
and Climate Services Regional Project (BWCSRP) for example now features CSRD’s
decision support tools on governmental partners linked to the project. CSRD continued
also to support the Bangladesh Academy for Climate Services, while also deepening
capacity development within BMD by establishing an electronic, internet tablet based
reporting system for weather station data collection. The latter two interventions
continue to sustain after the CSRD project, again indicative of the activity’s success.
CSRD in South Asia, Annual Report 2019
1
Introduction
Background
Climate Services for Resilient Development (CSRD) is a global partnership that connects
climate science, data streams, decision support tools, and training to decision-makers in
developing countries. CSRD addresses the climate challenges faced by smallholder farmers in
South Asia. The partnership is led by the United States Government and supported by the UK
Government Department for International Development (DFID), the UK Meteorological
Office, ESRI, Google, the Inter-American Development Bank, the Asian Development Bank,
and the American Red Cross.
The CSRD in South Asia initiative3 ran from November 2016 to December 2019 and was led
by the International Maize and Wheat Improvement Center (CIMMYT) and funded by USAID.
The consortium worked to increase resilience to climate change in South Asia by creating and
making available timely and useful climate data, information, tools and services. These activities
aligned with the Global Framework for Climate Services and the CGIAR Research Program on
Climate Change, Agriculture and Food Security (CCAFS).
CSRD activities in South Asia had three core objectives:
1. Impact-based national-scale decision tool platforms to support the Bangladesh
Meteorological Department’s (BMD) Sector 3 agro-meteorology track.
2. The collaborative development and refinement of South Asian regional scale agro-climate
decision support tools, services and products.
3. Coordination with CSRD partners in-country to ensure progress on the work streams
under the CSRD South Asia and Bangladesh working group.
Overview of the CSRD consortium in South Asia
In South Asia, the CSRD consortium focused primarily on Bangladesh (in alignment with
Objective 1 as described above), with a secondary emphasis on Nepal and India (supporting
Objective 2), and overall capacity development and awareness raising efforts across countries
(Objective 3). To improve the usefulness and agricultural relevance of climate information and
weather forecasts, the consortium developed strong science partnerships, and moved research
into action and impact. The overarching goal was to develop and sustain the capacity
development of agricultural climate services in the region. Throughout its duration, the
consortium benefited from valuable inputs and guidance from USAID and its
multi-partner CSRD Steering Committee.
CSRD in Bangladesh
Bangladesh is a core focal country for CSRD (see Objective 1). The two
strategic partners in Bangladesh were the Bangladesh Meteorological
Department (BMD) and the Department of Agricultural Extension (DAE) of
3 Also referred to as ‘CSRD in South Asia’ and ‘the consortium’ in this report.
CSRD in South Asia, Annual Report 2019
2
the government of Bangladesh (under the ministries of defence and agriculture). BMD was the
principal national organization mandated to sustain the country’s network of surface and air
observatories, radar and satellite stations and geomagnetic and seismological observatories. It
is also the main provider of climate information and forecasts to the general public. The DAE
has more than 14,000 grassroots level extension agents, known as sub-assistant agricultural
officers (SAAOs). These SAAOs are the first and primary point of contact and technical
assistance for most Bangladeshi farmers, and are an important conduit of information from
Bangladesh’s technical and research departments to farmers and other stakeholders.
Both DAE and BMD enabled CSRD to develop partnerships to embed climate services in
relevant regional institutes that will continue beyond CSRD. In this light, both organizations
are also involved in the World Bank-funded Weather and Climate Services Regional Project
for Bangladesh and make use of CSRD’s technical and capacity development products in this
and associated initiatives. By engaging with these agencies, CSRD developed country-driven
decision support tools (DSTs) and climate-related agricultural management advisories for
farmers to minimize climate and weather impacts on crop production, which in turn have
increased farmers’ resilience to climate risks. To promote the reach of relevant information to
farmers, CSRD’s dissemination strategy combined the use of DAE’s extension network and
information technology tools.
The Bangladesh Agricultural Research Institute (BARI) was another important CSRD partner.
BARI is Bangladesh’s most prolific and multi-crop research institute. It conducts breeding and
research on pulses, oilseeds, vegetables, fruits, and other crops and research on soil and crop
management, irrigation, disease and pest management, farm machinery and socioeconomic
issues. In collaboration with CSRD, BARI works on evaluating the PANI (Program for Advanced
Numerical Irrigation) app and decision support system (as developed by CIMMYT), which helps
farmers schedule irrigation based on assessing crop groundcover, evapotranspiration demand,
and BMD’s weather-forecasts. CSRD also supported the Bangladesh Maize and Wheat
Research Institute (BMWRI) to implement a wheat blast (Magnaporthe oryzae pathotype
Triticum) disease risk early warning system (EWS) for farmers at the national (Objective 1) and
regional (Objective 2) levels.
South Asia regional collaboration:
The International Center for Integrated Mountain Development (ICIMOD), which manages the
USAID funded SERVIR-Hindu Kush Himalaya (HKH) initiative, was another core CSRD
partner. Aligned with the SERVIR-HKH activities, CSRD brought knowledge and support to
boost ICIMOD’s efforts to develop a remote-sensing drought monitoring and forecasting
system for South Asia (under CSRD Objective 2). This work complemented additional efforts
CSRD in South Asia, Annual Report 2019
3
led by SERVIR-HKH on monitoring drought in Afghanistan, Pakistan, Nepal and Bangladesh.
Through linkages with ICIMOD and the SERVIR-HKH initiative, CSRD collaborated with the
Bangladesh Agricultural Research Council (BARC), which is the apex body of the National
Agricultural Research System (NARS) in Bangladesh. Leveraging learning from Afghanistan,
Pakistan, and Nepal, CSRD worked with BARC to improve the capacity of national scientists
to anticipate and respond to drought episodes. To achieve this goal, and in support of Objective
2, BARC was sub-contracted by ICIMOD and made responsible for implementing a new
national center for drought monitoring and forecasting at ICIMOD’s headquarters in
Kathmandu. Additionally, CSRD provided computer facilities and technical back-stopping for
BARC to promote use of the results of CSRD’s work on drought and to provide access to
equipment and online modern drought monitoring tools.
CSRD in South Asia developed several informal yet crucial partnerships. The partnership with
the Nepal Agricultural Research Council (NARC) developed weather-forecast based models
and warning systems for Stemphylium lentil disease. Another important partnership was
developed with the International Center for Climate Change and Development (ICCCAD) at
the Independent University in Bangladesh (IUB) from early 2018. ICCCAD contributed to the
founding of the Bangladesh Academy for Climate Services (BACS) alongside the International
Research Institute for Climate and Society (IRI) and CIMMYT through CSRD (see Objective 3
write-up). The academy is increases the awareness of and coordination between organizations
involved in providing climate information through educational programs, training and exchange
meetings.
International collaboration
CSRD also maintained international collaborations with
several advanced research institutes and universities. CSRD
and the University of Reading collaborated to provide training
and technical back-stopping to DAE’s implementation of
PICSA (Participatory Integrated Climate Services for
Agriculture) in five Bangladeshi districts under Objective I. To
scale-up PICSA implementation efforts, CSRD forged a
partnership with Wageningen University’s (WUR) Water
Information Services for Peri-urban Agriculture (WaterApps)
project. In addition, the University of Passo Fundo (UPF),
Brazil collaborated with CSRD scientists to implement a weather forecast-based early warning
system for wheat blast disease in Bangladesh (Objective 1). Both WaterApps and UPF
collaborated with CSRD on an entirely in-kind basis. The University of Rhode Island (URI) was
another CSRD in South Asia partner that collaborated on analyzing climate data and developing
the PANI algorithm in the early stages of the consortium.
This report
This report summarizes and updates readers on CSRD activities from January to December
2019. Previous project reports are on the project website.
Annex 1 presents information on CSRD team members across the associated organizations in
South Asia while CSRD’s formal sub-contractors are described in Annex 2. Annex 3 provides
a detailed account of project monitoring and evaluation procedures from 2016–2019. Annex
CSRD in South Asia, Annual Report 2019
4
4 details the in-kind funding support leveraged from partners from June 2019 to December
2019 with details of previous in-kind funding allotments available in previous CSRD semi-annual
and annual reports. Annex 5 presents communication and success stories generated by the
project over its three years while Annex 6 presents media reports on CSRD activities across
the same period. Annexes 7 and 8 present the methods used to develop Agvisely and regional
wheat blast analyses.
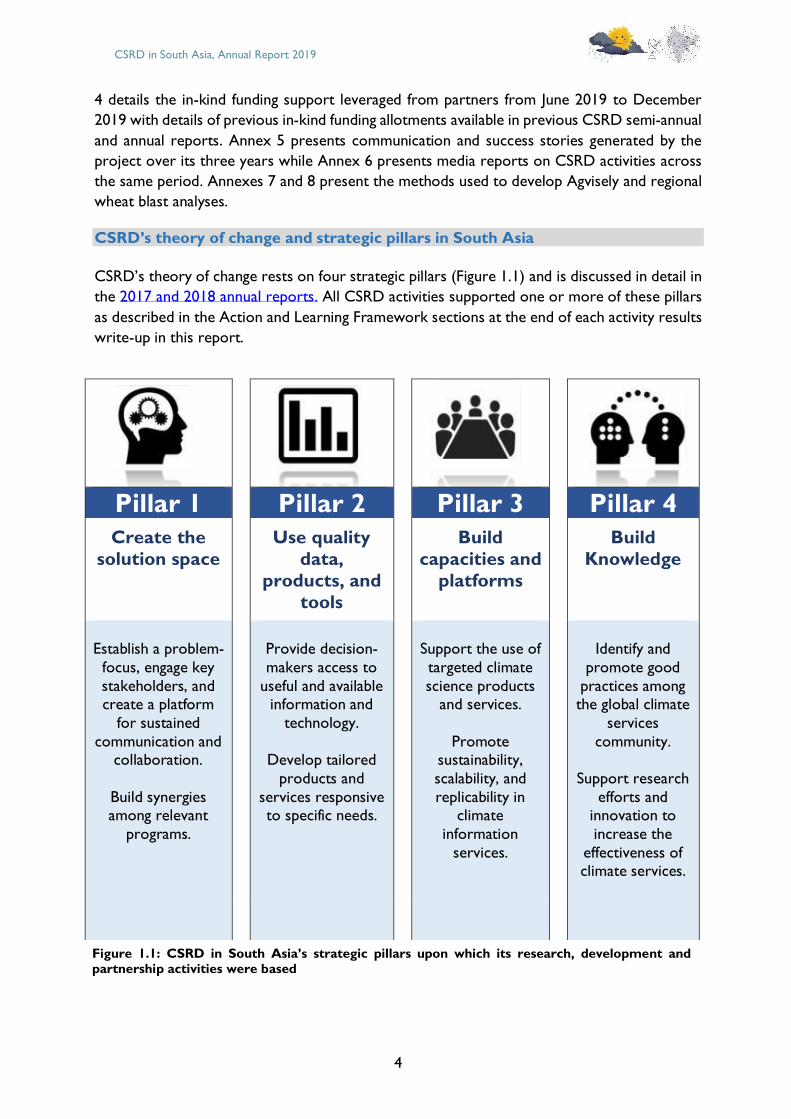
CSRD’s theory of change and strategic pillars in South Asia
CSRD’s theory of change rests on four strategic pillars (Figure 1.1) and is discussed in detail in
the 2017 and 2018 annual reports. All CSRD activities supported one or more of these pillars
as described in the Action and Learning Framework sections at the end of each activity results
write-up in this report.
Pillar 1 Pillar 2 Pillar 3 Pillar 4
Create the
solution space
Use quality
data,
products, and
tools
Build
capacities and
platforms
Build
Knowledge
Establish a problem-
focus, engage key
stakeholders, and create a platform
for sustained
communication and collaboration.
Build synergies among relevant
programs.
Provide decision-
makers access to
useful and available information and
technology.
Develop tailored
products and
services responsive to specific needs.
Support the use of
targeted climate
science products and services.
Promote sustainability,
scalability, and
replicability in climate
information
services.
Identify and
promote good
practices among the global climate
services
community.
Support research
efforts and innovation to
increase the
effectiveness of climate services.
Figure 1.1: CSRD in South Asia’s strategic pillars upon which its research, development and partnership activities were based
CSRD in South Asia, Annual Report 2019
5
Objective 1: Impact-based national-scale decision tool
platforms to support the Bangladesh Meteorological
Department’s Sector 3 agro-meteorology track4
Sub-Objective 1.1. Agricultural climactic information framework improved
Background – No matter how precise and useful forecasts are, most South Asian farmers
are unfamiliar with using meteorological and climate information to inform the management of
their farms. CSRD worked to increase the use of climate information as a service to farmers
in the shape of forecasts, early warning systems and management advisories. This required
building farmers’ capacity to better understand the implications, usefulness and use of climate
information.
Activities under CSRD in South Asia Sub-Objective 1.1 focused on improving South Asian
farmers’ ability to use climate and weather information to plan and conduct their livelihood
activities. Much of this work involved coordination and partnership with the Department of
Agricultural Extension (DAE) and the Bangladesh Meteorological Department (BMD) in
Bangladesh, and enabling front-line agricultural extension agents to understand and explain
climate information services so that farmers can reduce risk in their farming systems.
Despite the availability of weather forecasts, most farmers rely on indigenous knowledge and
intuition to make agricultural decisions. This is mainly due to their lack of understanding of
meteorological and climate information, a situation that in turn reduces their potential to make
use of practices that can contribute to resilience. Climate services can enable farmers to
comprehend the importance of meteorological and climate information in crop and farm
management decision-making.
Activity 1.1.1 Updating agro-meteorological information for major food and income staples in Bangladesh using farmer decision making frameworks
Under Activity 1.1.1, CSRD in South Asia carried out research to understand how farmers use
climate and weather information to conceptualize and plan their livelihoods. This also involved
using this information to improve the ways in which climate and agricultural science-based
advisories can be translated into easily understandable language, tailored to needs, and
extended to farmers in a timely way. Further work emphasized participatory processes and
capacity development efforts working with Bangladesh’s Department of Agricultural Extension
and partners on how to better partner with farmers to improve their strategic decision making
on their livelihoods and farm management.
4 Each of the products described in this report refers to the key research and science product outcomes developed
through CSRD.
CSRD in South Asia, Annual Report 2019
6
Product 1. Crop-specific farmer decision-making frameworks and extension
training to improve the quality and usefulness of agro-meteorological forecasts
Expanding the use of PICSA
2017 conference – A South and Southeast Asia Regional Technical and Learning Exchange
conference was held by CSRD from 17–19 September 2017. At this forum, Dr. Peter Dorward
of the University of Reading gave an overview of the large recent growth of climate services
and said it was time to take stock of how climate services research and practices should be
developed in the future. He introduced the concept of Participatory Integrated Climate
Services for Agriculture (PICSA), which is a successful systems approach that is farmer-focused
and practical, based on partnerships between farmers, government and non-government
agencies to encourage farmers to understand climate and plan their livelihood/farming activities
(see Box 2.1). Lessons from the application of PICSA in Africa were presented and discussed
in terms of their relevance to South and Southeast Asia. Building on this work, CSRD entered
into partnership with the University of Reading, DAE and BMD to pilot and expand the use of
PICSA in Bangladesh.
Box 2.1: The PICSA approach
PICSA is a new approach to extension and climate information services developed by Dr. Peter
Dorward and colleagues at the University of Reading, UK. The PICSA approach enables farmers to
make informed decisions based on accurate, location-specific climate and weather information, and
locally relevant crop, livestock and livelihood options. Considering farming and livelihood options in
the context of climate is crucial for good farm decision making. The PICSA approach is designed with
field staff in mind and provides smallholder farmers with improved resources and information.
PICSA uses historical climate records, participatory decision-making tools and forecasts to help
farmers identify and better plan livelihood options that are suited to local climates and their
circumstances. It was first implemented in 2016 in West African with farmers in Senegal and Mali. At
the end of the growing season, 97% of the Senegalese and 76% of Malian farmer respondents had
found the approach 'very useful'.
The key components of PICSA are as follows:
• Providing and considering climate and weather information with farmers, including historical
records and forecasts.
• The joint analysis by field staff and farmers of information on crop, livelihood and livestock
options and associated risks.
• A set of participatory tools that enable farmers to use climate and weather information in
planning and decision making.
This approach enables farmers to make strategic plans before cropping seasons based on their
improved knowledge of local climate features. Moreover, PICSA stimulates farmers to consider and
then implement the innovations of (i) changing the timing of activities such as sowing dates, (ii)
implementing soil and water management practices, (iii) selecting different crop varieties, (iv) fertilizer
management and (v) adapting farm management plans to their available resources. There is good
potential for farmer-to-farmer extension to scale-up the use of the approach, which is of great interest
given the current context of limited extension services.
CSRD in South Asia, Annual Report 2019
7
Training trainers – Partnering with the University of Reading, in 2018 CSRD translated the
PICSA training manual into the Bangla language and engaged the Bangladesh Meteorological
Department (BMD) and the Department of Agricultural Extension (DAE) to pilot PICSA in five
districts across Bangladesh. In 2018, ten DAE cadre officers were trained by CSRD and
University of Reading as master trainers on the PICSA approach. Subsequently, in late 2018
and before the winter crop season, these master trainers, guided by CSRD and the University
of Reading, trained 40 DAE field extension agents (SAAOs).
Training of farmers – During the reporting period in 2019, the trained SAAOs trained 500
farmers (20% women) at 20 PICSA farmer field schools. The farmer participants subsequently
took part in weekly discussion meetings and learning sessions on how to interpret and make
use of historical and forecasted climate information to improve farm and livelihood decision-
making. Following the completion of the pre-winter rabi season PICSA trainings (October–
November 2018) in the five districts, the DAE began regularly receiving customized 5-day,
location-specific forecasts derived from BMD’s Weather Research and Forecasting Model
(WRF) which passed on to the PICSA piloting villages. This information continued to be
supplied to May 2019, and then again during the summer monsoon rice season from July to
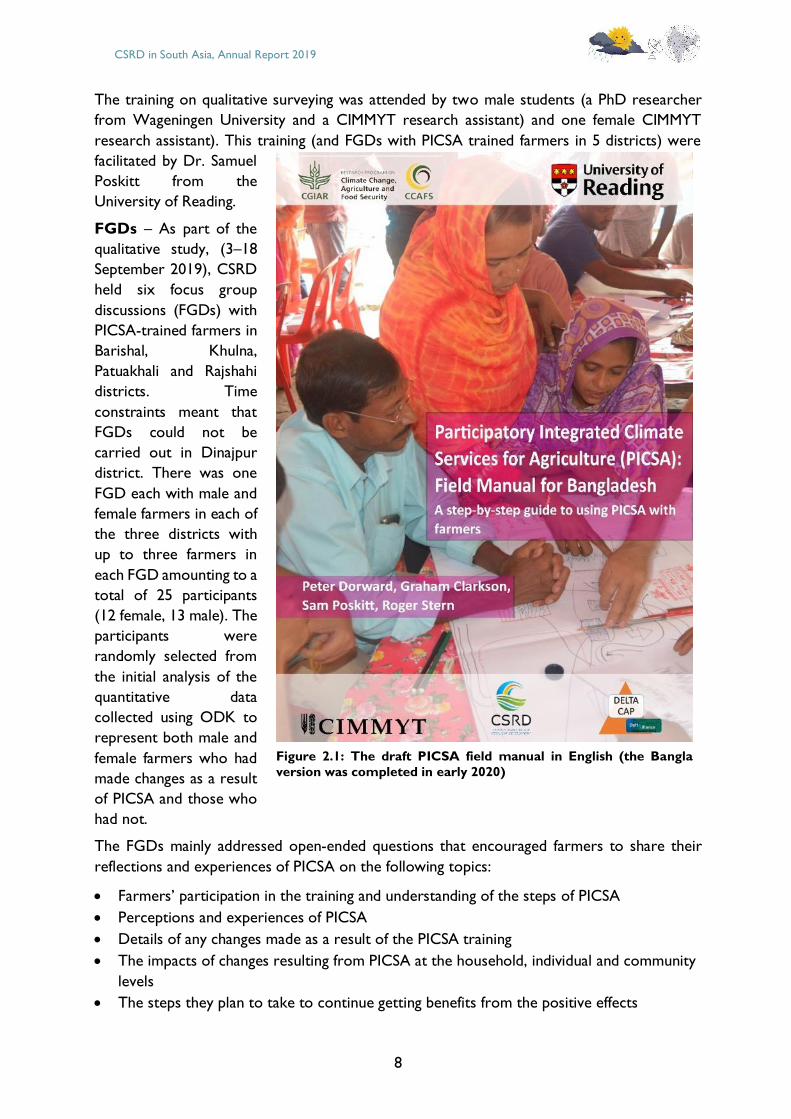
November 2019.
PICSA manual – In 2018/19, CSRD supported the translation of the general PICSA manual
into the Bangla language. In this reporting period the University of Reading finalized the
contextualized PICSA Manual for Bangladesh, which reflects PICSA as piloted in Bangladesh
(Figure 2.1). The new manual is designed for trained extension staff to use as a reference on
applying the PICSA approach.
Effectiveness study – In collaboration with Wageningen University’s WaterApps project and
the University of Reading, in summer 2019 a post-season monitoring and evaluation study was
conducted to assess the effectiveness of PICSA and identify if and how it had caused farmers
in the five districts to modify their crop management decision making and income-generating
activities in response to the pre-season trainings and receipt of the 5-day forecasts and
management advisories. A qualitative and quantitative evaluation was carried out led by the
University of Reading with financial support from the WaterApps project and coordination by
CSRD.
The steps of the study included (i) training survey and focus group enumerators, (ii) the holding
of focus group discussions and (c) a quantitative survey, as reported below:
Survey training – Two 2-day trainings at the BRAC Learning Center, Dinajpur in the 7–11
July 2019 period prepared six enumerators and four supervisors for carrying out the surveys.
The trainings comprised classroom and field-based instruction including on using the Open
Data Kit (ODK) to conduct quantitative surveys. The six trained enumerators were students
from Khulna University, Patuakhali Agricultural University and Hajee Mohammad Danesh
Science and Technology University, who were experienced in conducting household level
surveys using tablets.
CSRD in South Asia, Annual Report 2019
8
The training on qualitative surveying was attended by two male students (a PhD researcher
from Wageningen University and a CIMMYT research assistant) and one female CIMMYT
research assistant). This training (and FGDs with PICSA trained farmers in 5 districts) were
facilitated by Dr. Samuel
Poskitt from the
University of Reading.
FGDs – As part of the
qualitative study, (3–18
September 2019), CSRD
held six focus group
discussions (FGDs) with
PICSA-trained farmers in
Barishal, Khulna,
Patuakhali and Rajshahi
districts. Time
constraints meant that
FGDs could not be
carried out in Dinajpur
district. There was one
FGD each with male and
female farmers in each of
the three districts with
up to three farmers in
each FGD amounting to a
total of 25 participants
(12 female, 13 male). The
participants were
randomly selected from
the initial analysis of the
quantitative data
collected using ODK to
represent both male and
female farmers who had
made changes as a result
of PICSA and those who
had not.
The FGDs mainly addressed open-ended questions that encouraged farmers to share their
reflections and experiences of PICSA on the following topics:
• Farmers’ participation in the training and understanding of the steps of PICSA
• Perceptions and experiences of PICSA
• Details of any changes made as a result of the PICSA training
• The impacts of changes resulting from PICSA at the household, individual and community
levels
• The steps they plan to take to continue getting benefits from the positive effects
Figure 2.1: The draft PICSA field manual in English (the Bangla
version was completed in early 2020)
CSRD in South Asia, Annual Report 2019
9
• What could be improved about the PICSA training
• What can help farmers access climate information themselves.
FGD findings – The main findings from the FGDs, which were carried out as part of the
qualitative study, were as follows:
• The PICSA trainings for farmers involved getting farmers to draw maps of their farms and
associated livelihood options, as described in previous CSRD report reports. FGD
respondents said that on the first day of their day PICSA trainings, most participants were
nervous about drawing their allocation maps. However, with guidance from SAAOs and
educated farmers most participants had become more confident and managed to draw
their maps.
• The FGDs reported that male and female farmers were intensively involved in all PICSA
activities, including designing crop calendars, resource allocation mapping, participatory
farm budgeting, and learning how to interpret and use climate data for decision making.
• The male farmers said that female farmers only have limited knowledge of agricultural
operations as they mostly only go to the fields at harvesting and post-harvesting times
while men attend all operations. The FGD results indicated that trainees had learnt from
male farmers about each step of crop cultivation during their participation in the regular
PICSA trainings, mainly from preparing crop calendars and budgeting. The male farmers
said they had learnt about taking care of chickens, ducks and other livestock from the
female farmers. They said they had enjoyed sharing information during PICSA activities
and the friendly atmosphere at the trainings.
• The trained farmers said they had gained knowledge at the trainings about resource
allocation, farm budgeting, improved and new varieties of crops, new agronomic
management, ideal seedbed establishment for boro rice, how to protect crops from
heavy rainfall using field drainage and how to protect seedlings from very cold weather.
Most of them said they were sharing this knowledge with non-trained farmers in their
communities.
Photo 1.1: FGD with PICSA-trained male farmers in Durgapur Upazila, Rajshahi
District (Anarul Haque)
Photo 1.2: FGD with PICSA-trained female farmers in Durgapur Upazila, Rajshahi District
(Saleh Mohammad Shahriar)
CSRD in South Asia, Annual Report 2019
10
In addition, the FGDs revealed the following about the impact of the trainings in three of the
districts:
• Many farmers changed their farming practices as a result of what they learned from the
PICSA trainings. For example, farmers in Patuakhali District said they had expanded mung
bean cultivation. In Barishal District, they got higher yield from boro rice by doing ideal
seedbed establishment. These farmers got weather information as per their needs from
SAAOs, mobile apps and the internet.
• Most surveyed farmers had participated in other trainings on agriculture cultivation and
agronomic management from DAE. These PICSA-trained farmers are very active and
some have good relationships with SAAOs.
• Some trained male farmers hadn’t subsequently made any direct changes to their
agricultural or livestock management practices, mainly because they had already selected
crops and the activities for the 2018/19 winter rabi season and didn’t have enough funds
to make any such changes. According to male farmers in Rajshahi, the PICSA training
started just before the rabi season and also, they were more interested in fish farming
and cultivating betel leaves, which were not discussed in detail in the training. Since they
didn’t get any new knowledge about betel leaf cultivation and controlling pests on betel
leaves, they didn’t change any of their activities after PICSA training. They, however, said
that there had been some indirect effects of the training including increased awareness
about weather forecasts and plant nourishment, increased knowledge about livestock
farming and fisheries, and increased self-confidence.
• Some trained female farmers had made some changes inspired by the PICSA training,
mostly motivated by the resource allocation mapping. They had started growing winter
and summer vegetables in their homestead gardens for home consumption meaning that
they didn’t need to buy vegetable from outside which saved them money. One young
female farmer from Rajshahi had started a small poultry farm with help from her father
and was paying her college tuition and transport costs by selling eggs and chickens.
• The young male trained PICSA farmers said they faced difficulties sharing their new
knowledge with senior and more experienced local farmers. They said that non-trained
senior farmers felt they knew more than them because of their years of experience.
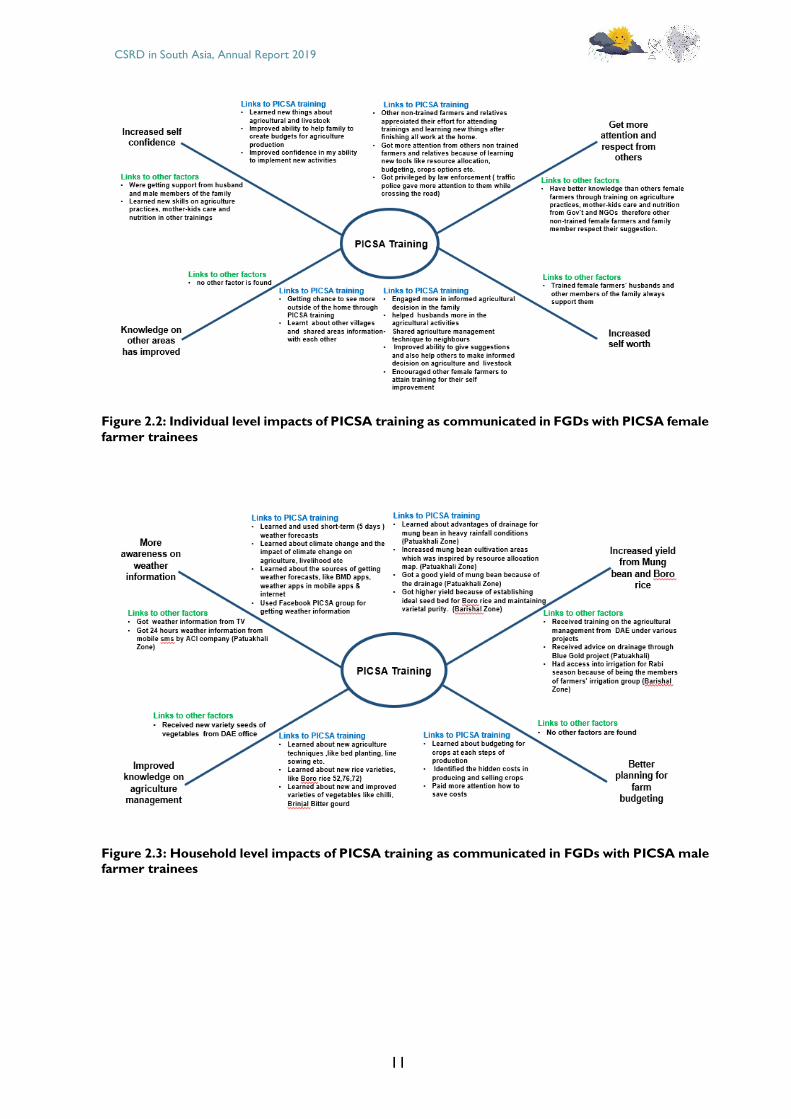
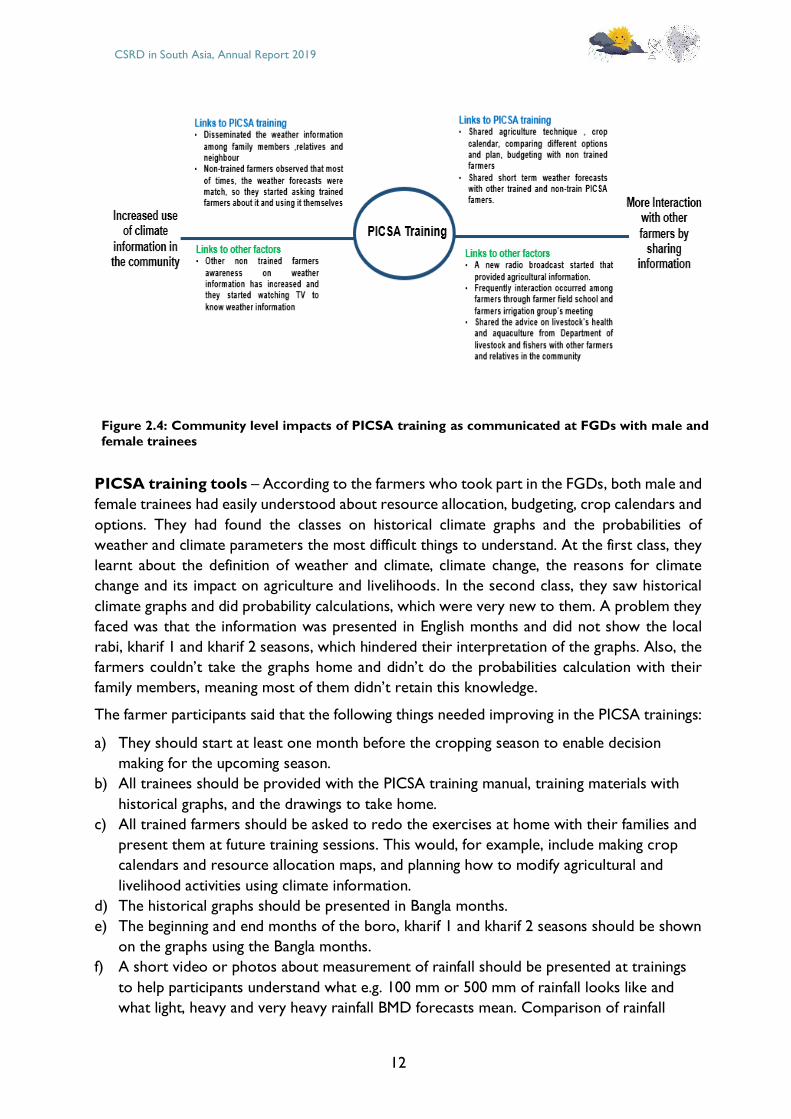
Figures 2.2, 2.3 and 2.4 show the compiled individual, household and community level effects
diagrams drawn by farmers at the Barishal, Patuakhali and Rajshahi district FGDs.
CSRD in South Asia, Annual Report 2019
11
Figure 2.2: Individual level impacts of PICSA training as communicated in FGDs with PICSA female
farmer trainees
Figure 2.3: Household level impacts of PICSA training as communicated in FGDs with PICSA male farmer trainees
CSRD in South Asia, Annual Report 2019
12
Figure 2.4: Community level impacts of PICSA training as communicated at FGDs with male and
female trainees
PICSA training tools – According to the farmers who took part in the FGDs, both male and
female trainees had easily understood about resource allocation, budgeting, crop calendars and
options. They had found the classes on historical climate graphs and the probabilities of
weather and climate parameters the most difficult things to understand. At the first class, they
learnt about the definition of weather and climate, climate change, the reasons for climate
change and its impact on agriculture and livelihoods. In the second class, they saw historical
climate graphs and did probability calculations, which were very new to them. A problem they
faced was that the information was presented in English months and did not show the local
rabi, kharif 1 and kharif 2 seasons, which hindered their interpretation of the graphs. Also, the
farmers couldn’t take the graphs home and didn’t do the probabilities calculation with their
family members, meaning most of them didn’t retain this knowledge.
The farmer participants said that the following things needed improving in the PICSA trainings:
a) They should start at least one month before the cropping season to enable decision
making for the upcoming season.
b) All trainees should be provided with the PICSA training manual, training materials with
historical graphs, and the drawings to take home.
c) All trained farmers should be asked to redo the exercises at home with their families and
present them at future training sessions. This would, for example, include making crop
calendars and resource allocation maps, and planning how to modify agricultural and
livelihood activities using climate information.
d) The historical graphs should be presented in Bangla months.
e) The beginning and end months of the boro, kharif 1 and kharif 2 seasons should be shown
on the graphs using the Bangla months.
f) A short video or photos about measurement of rainfall should be presented at trainings
to help participants understand what e.g. 100 mm or 500 mm of rainfall looks like and
what light, heavy and very heavy rainfall BMD forecasts mean. Comparison of rainfall
CSRD in South Asia, Annual Report 2019
13
volumes to common household cooking vessels, etc. were suggested as solution for this.
g) DAE officers should do follow up meetings or visits after the training is finished and the
season ends to collect feedback from farmer trainees.
h) In the last winter boro rice season, each PICSA training was four hours long without any
break and without refreshments. A break with refreshments should be included.
Sources of weather forecasts – The PICSA farmer training explained about the Bangladesh
Meteorological Department (BMD), its 5 day forecasts, the toll free 1090 number for weather
information and why BMD cannot provide forecasts at the sub-sub district level. CSRD’s
studies found that most trainee farmers and their family members’ had subsequently increased
their awareness about weather forecasts. Before their engagement with PICSA and CSRD, they
mostly got information on the weather from television, with those who didn’t have TVs going
to their local market or tea stall watch to the news. The female trained farmers also watched
TV or listened to the radio for information on the weather more frequently than before.
Kulsum Begum, a PICSA trained farmer from Babuganj Upazila, Barishal district reported how
her elder son had said:
“Mom, since getting the training, you are frequently watching the weather
news!”
The farmers received 5 day weather forecasts at the PICSA trainings; but afterwards most of
them didn’t receive such forecasts regularly from their SAAOs. They only received forecasts
from SAAOs (by mobile phone or
personal visits) when a calamity
threatened. The farmers also said that
whenever they needed weather
information, they called SAAOs and
most times, the provided forecasts were
accurate.
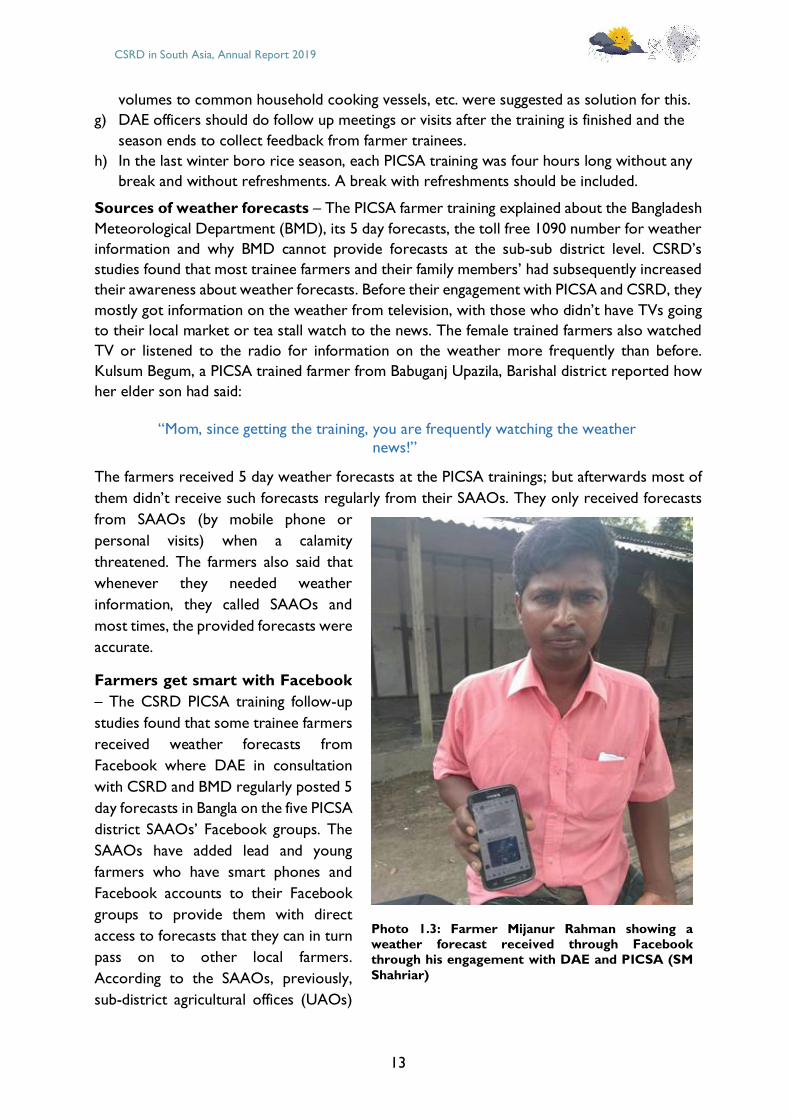
Farmers get smart with Facebook
– The CSRD PICSA training follow-up
studies found that some trainee farmers
received weather forecasts from
Facebook where DAE in consultation
with CSRD and BMD regularly posted 5
day forecasts in Bangla on the five PICSA
district SAAOs’ Facebook groups. The
SAAOs have added lead and young
farmers who have smart phones and
Facebook accounts to their Facebook
groups to provide them with direct
access to forecasts that they can in turn
pass on to other local farmers.
According to the SAAOs, previously,
sub-district agricultural offices (UAOs)
Photo 1.3: Farmer Mijanur Rahman showing a weather forecast received through Facebook
through his engagement with DAE and PICSA (SM
Shahriar)
CSRD in South Asia, Annual Report 2019
14
and agricultural extension officers (AEOs) received weather forecasts from DAE’s Dhaka office
by email to pass on to SAAOs, which meant that SAAOs received the information only 2–3
days after it was sent from Dhaka. SAAOs and farmers now get these forecasts instantly
directly from the PICSA Facebook groups.
Some lead and young farmers with smart phones were using mobile weather apps or the
internet to access forecasts for sharing with other farmers. Only a few male farmers in the
FGDs had called 1090 for a forecast:
“It was a general weather forecast for the country, but it matched what
happened” – male farmers of Bokhtiyarpur village, Durgapur Upazila, Rajshahi.
Surprisingly, some male farmers who took part in PICSA and the follow-up focus groups at
Bokhtiyarpur village in Durgapur Upazila, Rajshahi explained that they hadn’t checked the
weather information during and after the 2018/19 rabi season as there were no threatening
climate risks and they had just guessed the likely conditions from their experience. According
to the farmers in Rajshahi, the last boro season (2018/19) was a good weather year for farmers
but a bad year for selling rice as rice only fetched a very low price.
On the other hand, the female farmers at Par Chowpukuria village in Durgapur Upazila,
Rajshahi, said that their interest in weather forecasts had increased as most of the time the
weather matched the forecasts. Whenever they needed
weather information, they asked their neighbor who was
PICSA trained to check the forecast on the internet.
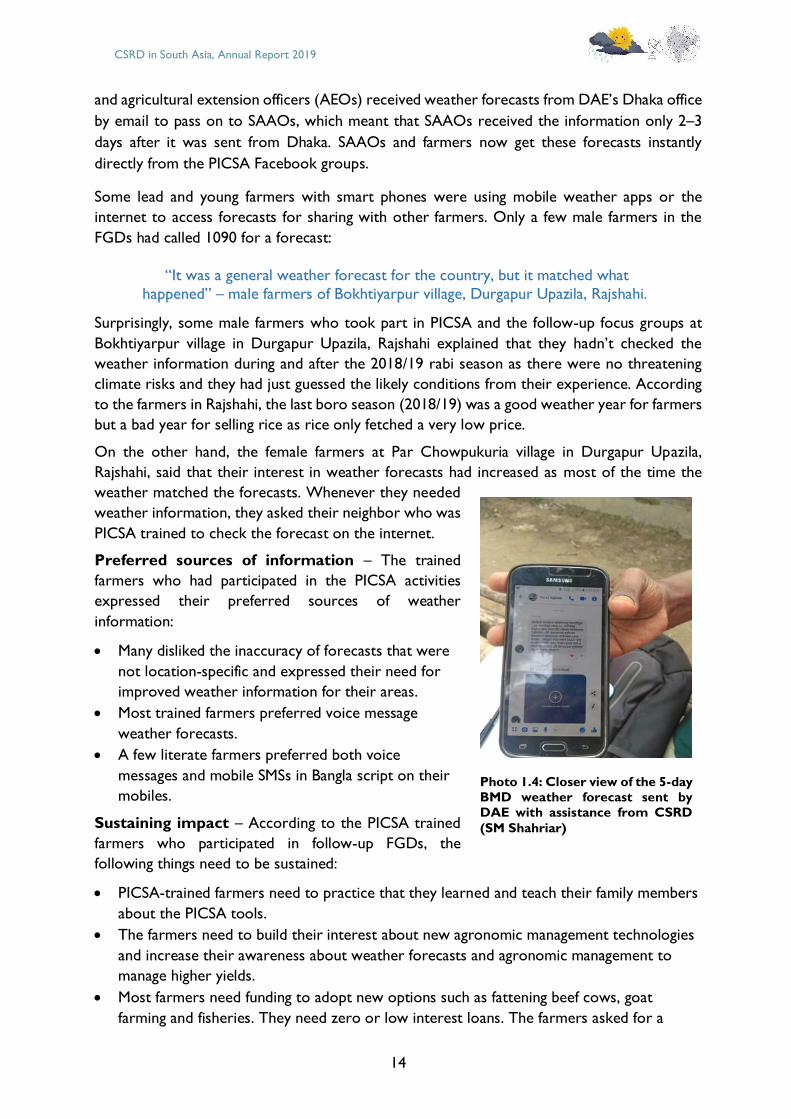
Preferred sources of information – The trained
farmers who had participated in the PICSA activities
expressed their preferred sources of weather
information:
• Many disliked the inaccuracy of forecasts that were
not location-specific and expressed their need for
improved weather information for their areas.
• Most trained farmers preferred voice message
weather forecasts.
• A few literate farmers preferred both voice
messages and mobile SMSs in Bangla script on their
mobiles.
Sustaining impact – According to the PICSA trained
farmers who participated in follow-up FGDs, the
following things need to be sustained:
• PICSA-trained farmers need to practice that they learned and teach their family members
about the PICSA tools.
• The farmers need to build their interest about new agronomic management technologies
and increase their awareness about weather forecasts and agronomic management to
manage higher yields.
• Most farmers need funding to adopt new options such as fattening beef cows, goat
farming and fisheries. They need zero or low interest loans. The farmers asked for a
Photo 1.4: Closer view of the 5-day BMD weather forecast sent by DAE with assistance from CSRD
(SM Shahriar)
CSRD in South Asia, Annual Report 2019
15
PICSA-related project where they could get financial support for expanding their farming.
• DAE should provide more PICSA or agriculture-related training for farmers for them to
learn continuously.
• DAE officers should do follow-up meetings or visits after training finishes and the season
ends to get feedback from trainees and keep the trainees on track.
• Farmers’ family members should be involved in the training so they can learn and help the
farmers on their farms as some trained farmers couldn’t convince or communicate the
PICSA methodologies to their family members.
• The farmers in Rajshahi needed more land for growing crops. Many farmers there had
switched to fish farming and were using the land for this and so did not have enough land
for growing crops.
• The Rajshahi farmers were interested in fish farming and cultivating betel leaves and to
learn more about these subjects including pest and disease control during the PICSA
training.
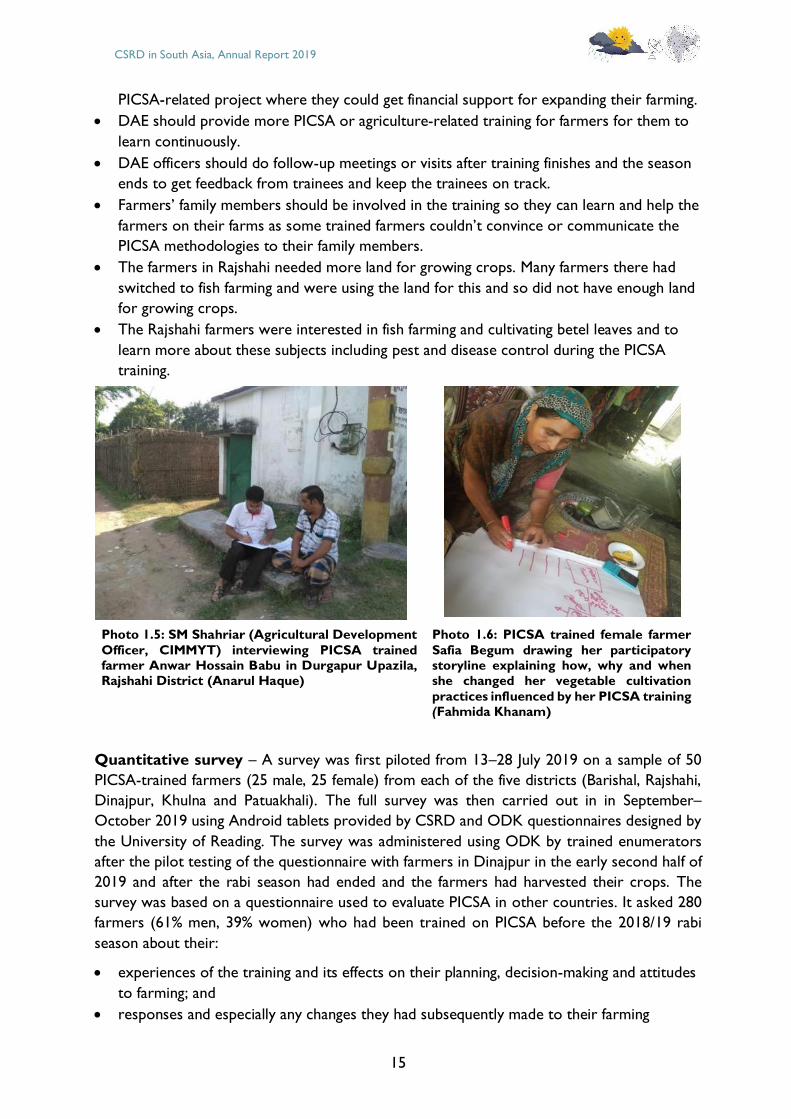
Photo 1.5: SM Shahriar (Agricultural Development
Officer, CIMMYT) interviewing PICSA trained farmer Anwar Hossain Babu in Durgapur Upazila, Rajshahi District (Anarul Haque)
Photo 1.6: PICSA trained female farmer
Safia Begum drawing her participatory storyline explaining how, why and when she changed her vegetable cultivation
practices influenced by her PICSA training (Fahmida Khanam)
Quantitative survey – A survey was first piloted from 13–28 July 2019 on a sample of 50
PICSA-trained farmers (25 male, 25 female) from each of the five districts (Barishal, Rajshahi,
Dinajpur, Khulna and Patuakhali). The full survey was then carried out in in September–
October 2019 using Android tablets provided by CSRD and ODK questionnaires designed by
the University of Reading. The survey was administered using ODK by trained enumerators
after the pilot testing of the questionnaire with farmers in Dinajpur in the early second half of
2019 and after the rabi season had ended and the farmers had harvested their crops. The
survey was based on a questionnaire used to evaluate PICSA in other countries. It asked 280
farmers (61% men, 39% women) who had been trained on PICSA before the 2018/19 rabi
season about their:
• experiences of the training and its effects on their planning, decision-making and attitudes
to farming; and
• responses and especially any changes they had subsequently made to their farming
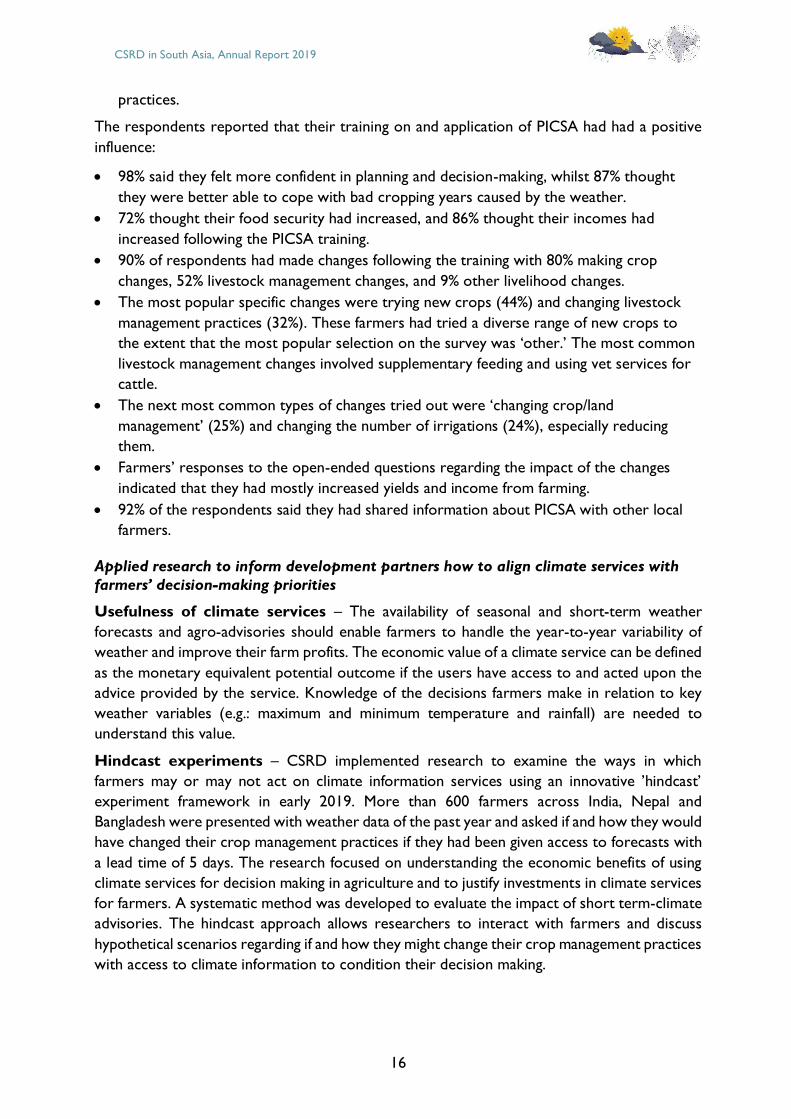
CSRD in South Asia, Annual Report 2019
16
practices.
The respondents reported that their training on and application of PICSA had had a positive
influence:
• 98% said they felt more confident in planning and decision-making, whilst 87% thought
they were better able to cope with bad cropping years caused by the weather.
• 72% thought their food security had increased, and 86% thought their incomes had
increased following the PICSA training.
• 90% of respondents had made changes following the training with 80% making crop
changes, 52% livestock management changes, and 9% other livelihood changes.
• The most popular specific changes were trying new crops (44%) and changing livestock
management practices (32%). These farmers had tried a diverse range of new crops to
the extent that the most popular selection on the survey was ‘other.’ The most common
livestock management changes involved supplementary feeding and using vet services for
cattle.
• The next most common types of changes tried out were ‘changing crop/land
management’ (25%) and changing the number of irrigations (24%), especially reducing
them.
• Farmers’ responses to the open-ended questions regarding the impact of the changes
indicated that they had mostly increased yields and income from farming.
• 92% of the respondents said they had shared information about PICSA with other local
farmers.
Applied research to inform development partners how to align climate services with
farmers’ decision-making priorities
Usefulness of climate services – The availability of seasonal and short-term weather
forecasts and agro-advisories should enable farmers to handle the year-to-year variability of
weather and improve their farm profits. The economic value of a climate service can be defined
as the monetary equivalent potential outcome if the users have access to and acted upon the
advice provided by the service. Knowledge of the decisions farmers make in relation to key
weather variables (e.g.: maximum and minimum temperature and rainfall) are needed to
understand this value.
Hindcast experiments – CSRD implemented research to examine the ways in which
farmers may or may not act on climate information services using an innovative ’hindcast’
experiment framework in early 2019. More than 600 farmers across India, Nepal and
Bangladesh were presented with weather data of the past year and asked if and how they would
have changed their crop management practices if they had been given access to forecasts with
a lead time of 5 days. The research focused on understanding the economic benefits of using
climate services for decision making in agriculture and to justify investments in climate services
for farmers. A systematic method was developed to evaluate the impact of short term-climate
advisories. The hindcast approach allows researchers to interact with farmers and discuss
hypothetical scenarios regarding if and how they might change their crop management practices
with access to climate information to condition their decision making.
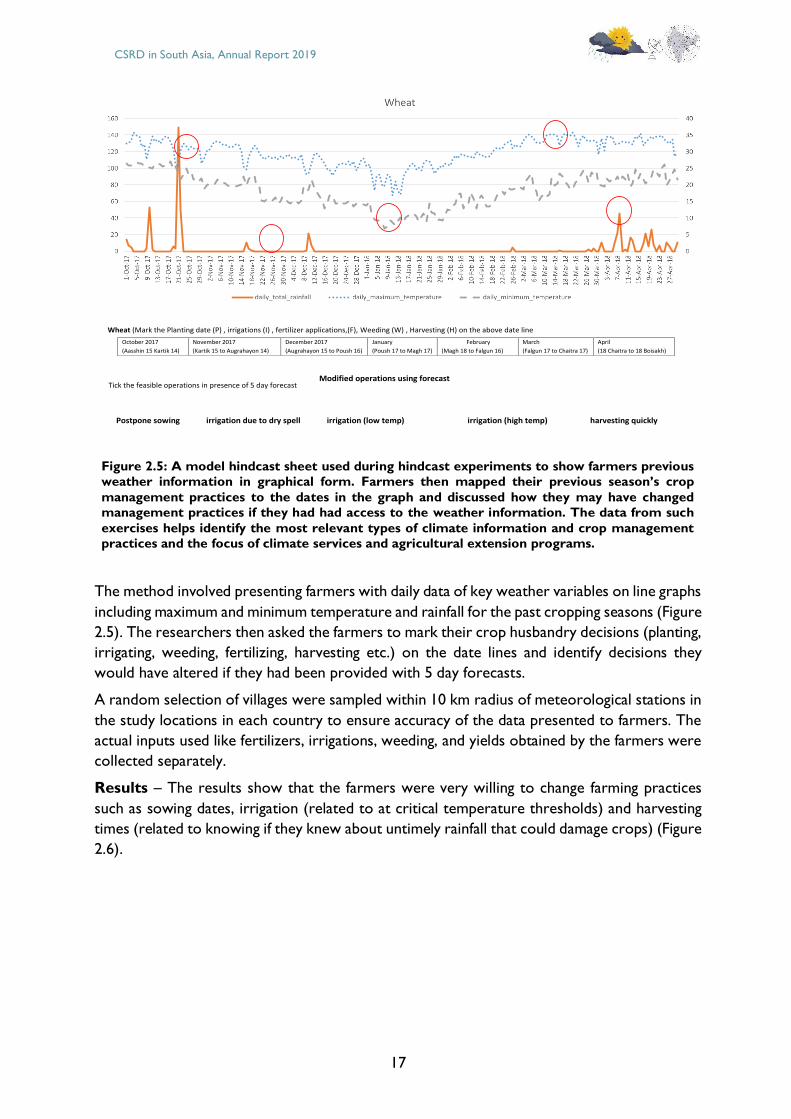
CSRD in South Asia, Annual Report 2019
17
Figure 2.5: A model hindcast sheet used during hindcast experiments to show farmers previous weather information in graphical form. Farmers then mapped their previous season’s crop
management practices to the dates in the graph and discussed how they may have changed
management practices if they had had access to the weather information. The data from such
exercises helps identify the most relevant types of climate information and crop management practices and the focus of climate services and agricultural extension programs.
The method involved presenting farmers with daily data of key weather variables on line graphs
including maximum and minimum temperature and rainfall for the past cropping seasons (Figure
2.5). The researchers then asked the farmers to mark their crop husbandry decisions (planting,
irrigating, weeding, fertilizing, harvesting etc.) on the date lines and identify decisions they
would have altered if they had been provided with 5 day forecasts.
A random selection of villages were sampled within 10 km radius of meteorological stations in
the study locations in each country to ensure accuracy of the data presented to farmers. The
actual inputs used like fertilizers, irrigations, weeding, and yields obtained by the farmers were
collected separately.
Results – The results show that the farmers were very willing to change farming practices
such as sowing dates, irrigation (related to at critical temperature thresholds) and harvesting
times (related to knowing if they knew about untimely rainfall that could damage crops) (Figure
2.6).
October 2017
(Aasshin 15 Kartik 14)
November 2017
(Kartik 15 to Augrahayon 14)
December 2017
(Augrahayon 15 to Poush 16)
January
(Poush 17 to Magh 17)
February
(Magh 18 to Falgun 16)
March
(Falgun 17 to Chaitra 17)
April
(18 Chaitra to 18 Boisakh)
Postpone sowing irrigation due to dry spell irrigation (low temp) irrigation (high temp) harvesting quickly
Modified operations using forecast
Wheat (Mark the Planting date (P) , irrigations (I) , fertilizer applications,(F), Weeding (W) , Harvesting (H) on the above date line
Tick the feasible operations in presence of 5 day forecast
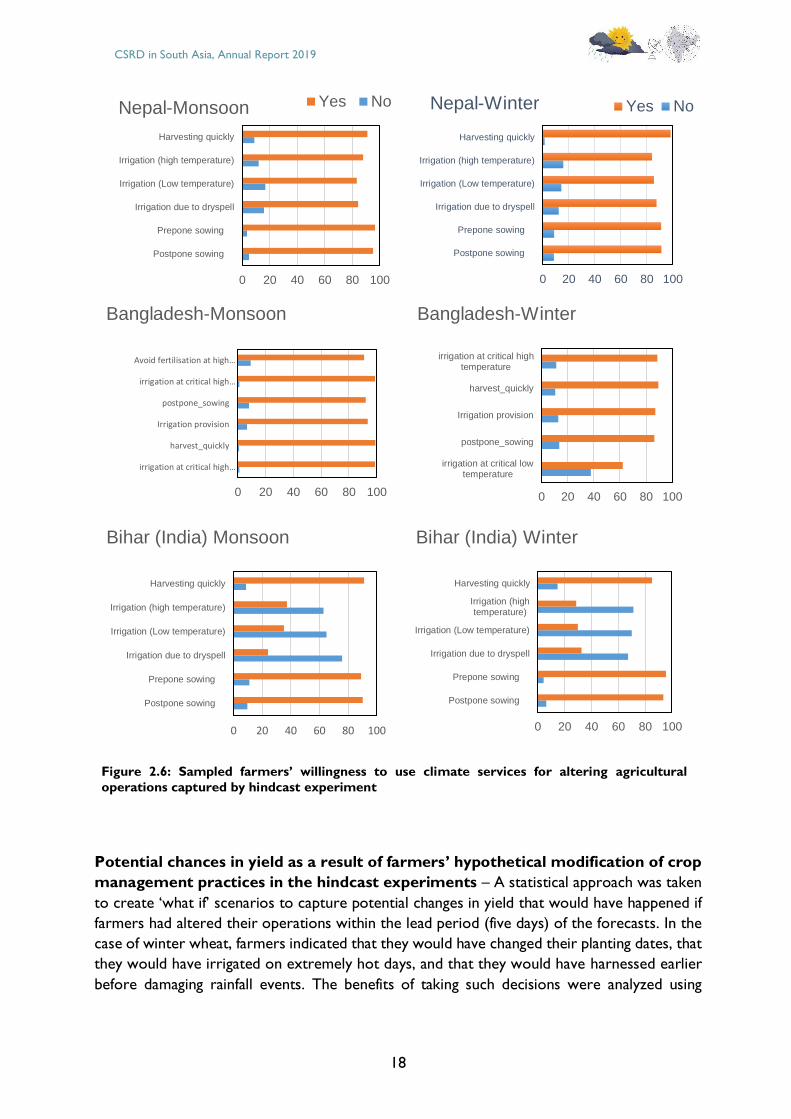
CSRD in South Asia, Annual Report 2019
18
Figure 2.6: Sampled farmers’ willingness to use climate services for altering agricultural
operations captured by hindcast experiment
Potential chances in yield as a result of farmers’ hypothetical modification of crop
management practices in the hindcast experiments – A statistical approach was taken
to create ‘what if’ scenarios to capture potential changes in yield that would have happened if
farmers had altered their operations within the lead period (five days) of the forecasts. In the
case of winter wheat, farmers indicated that they would have changed their planting dates, that
they would have irrigated on extremely hot days, and that they would have harnessed earlier
before damaging rainfall events. The benefits of taking such decisions were analyzed using
0 20 40 60 80 100
Postpone sowing
Prepone sowing
Irrigation due to dryspell
Irrigation (Low temperature)
Irrigation (high temperature)
Harvesting quickly
Nepal-Monsoon Yes No
0 20 40 60 80 100
Postpone sowing
Prepone sowing
Irrigation due to dryspell
Irrigation (Low temperature)
Irrigation (high temperature)
Harvesting quickly
Nepal-Winter Yes No
0 20 40 60 80 100
irrigation at critical high…
harvest_quickly
Irrigation provision
postpone_sowing
irrigation at critical high…
Avoid fertilisation at high…
Bangladesh-Monsoon
0 20 40 60 80 100
irrigation at critical lowtemperature
postpone_sowing
Irrigation provision
harvest_quickly
irrigation at critical hightemperature
Bangladesh-Winter
0 20 40 60 80 100
Postpone sowing
Prepone sowing
Irrigation due to dryspell
Irrigation (Low temperature)
Irrigation (high temperature)
Harvesting quickly
Bihar (India) Monsoon
0 20 40 60 80 100
Postpone sowing
Prepone sowing
Irrigation due to dryspell
Irrigation (Low temperature)
Irrigation (hightemperature)
Harvesting quickly
Bihar (India) Winter
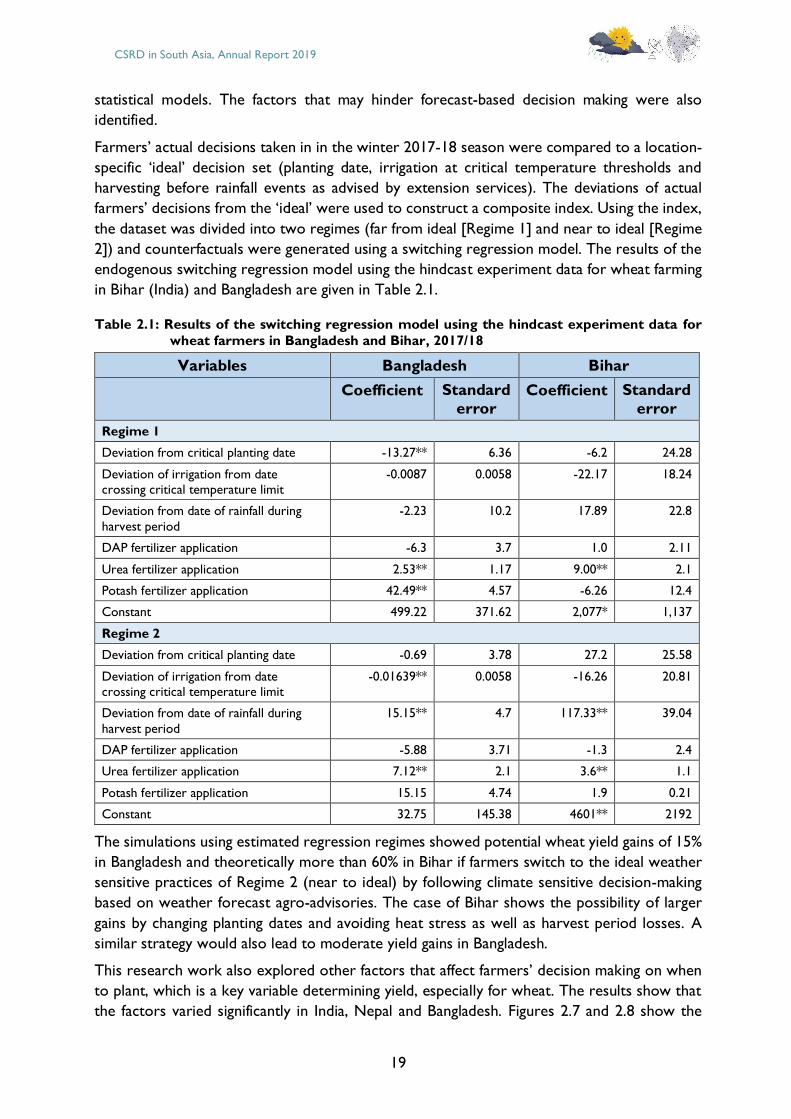
CSRD in South Asia, Annual Report 2019
19
statistical models. The factors that may hinder forecast-based decision making were also
identified.
Farmers’ actual decisions taken in in the winter 2017-18 season were compared to a location-
specific ‘ideal’ decision set (planting date, irrigation at critical temperature thresholds and
harvesting before rainfall events as advised by extension services). The deviations of actual
farmers’ decisions from the ‘ideal’ were used to construct a composite index. Using the index,
the dataset was divided into two regimes (far from ideal [Regime 1] and near to ideal [Regime
2]) and counterfactuals were generated using a switching regression model. The results of the
endogenous switching regression model using the hindcast experiment data for wheat farming
in Bihar (India) and Bangladesh are given in Table 2.1.
Table 2.1: Results of the switching regression model using the hindcast experiment data for
wheat farmers in Bangladesh and Bihar, 2017/18
Variables Bangladesh Bihar
Coefficient Standard
error Coefficient Standard
error
Regime 1
Deviation from critical planting date -13.27** 6.36 -6.2 24.28
Deviation of irrigation from date crossing critical temperature limit
-0.0087 0.0058 -22.17 18.24
Deviation from date of rainfall during
harvest period
-2.23 10.2 17.89 22.8
DAP fertilizer application -6.3 3.7 1.0 2.11
Urea fertilizer application 2.53** 1.17 9.00** 2.1
Potash fertilizer application 42.49** 4.57 -6.26 12.4
Constant 499.22 371.62 2,077* 1,137
Regime 2
Deviation from critical planting date -0.69 3.78 27.2 25.58
Deviation of irrigation from date crossing critical temperature limit
-0.01639** 0.0058 -16.26 20.81
Deviation from date of rainfall during
harvest period
15.15** 4.7 117.33** 39.04
DAP fertilizer application -5.88 3.71 -1.3 2.4
Urea fertilizer application 7.12** 2.1 3.6** 1.1
Potash fertilizer application 15.15 4.74 1.9 0.21
Constant 32.75 145.38 4601** 2192
The simulations using estimated regression regimes showed potential wheat yield gains of 15%
in Bangladesh and theoretically more than 60% in Bihar if farmers switch to the ideal weather
sensitive practices of Regime 2 (near to ideal) by following climate sensitive decision-making
based on weather forecast agro-advisories. The case of Bihar shows the possibility of larger
gains by changing planting dates and avoiding heat stress as well as harvest period losses. A
similar strategy would also lead to moderate yield gains in Bangladesh.
This research work also explored other factors that affect farmers’ decision making on when
to plant, which is a key variable determining yield, especially for wheat. The results show that
the factors varied significantly in India, Nepal and Bangladesh. Figures 2.7 and 2.8 show the
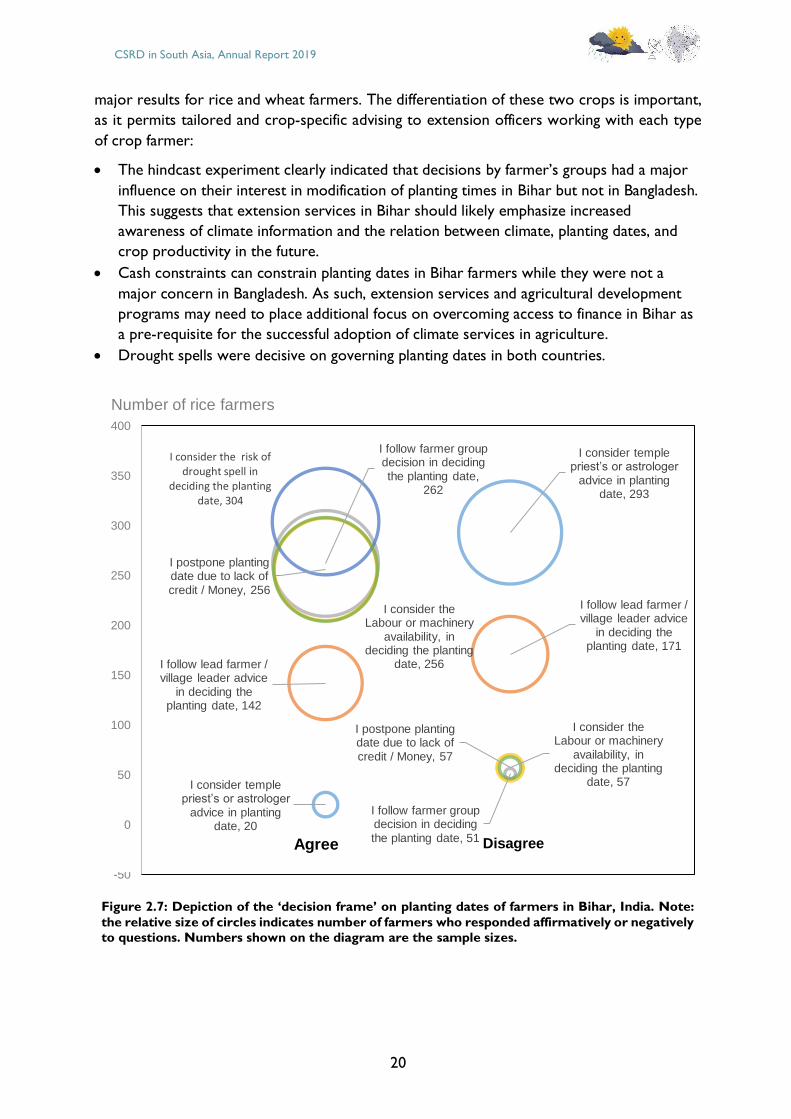
CSRD in South Asia, Annual Report 2019
20
major results for rice and wheat farmers. The differentiation of these two crops is important,
as it permits tailored and crop-specific advising to extension officers working with each type
of crop farmer:
• The hindcast experiment clearly indicated that decisions by farmer’s groups had a major
influence on their interest in modification of planting times in Bihar but not in Bangladesh.
This suggests that extension services in Bihar should likely emphasize increased
awareness of climate information and the relation between climate, planting dates, and
crop productivity in the future.
• Cash constraints can constrain planting dates in Bihar farmers while they were not a
major concern in Bangladesh. As such, extension services and agricultural development
programs may need to place additional focus on overcoming access to finance in Bihar as
a pre-requisite for the successful adoption of climate services in agriculture.
• Drought spells were decisive on governing planting dates in both countries.
Figure 2.7: Depiction of the ‘decision frame’ on planting dates of farmers in Bihar, India. Note:
the relative size of circles indicates number of farmers who responded affirmatively or negatively to questions. Numbers shown on the diagram are the sample sizes.
I consider temple priest’s or astrologer
advice in planting date, 20
I consider temple priest’s or astrologer
advice in planting date, 293
I follow lead farmer / village leader advice
in deciding the planting date, 142
I follow lead farmer / village leader advice
in deciding the planting date, 171
I follow farmer group decision in deciding the planting date,
262
I follow farmer group decision in deciding the planting date, 51
I consider the Labour or machinery
availability, in deciding the planting
date, 256
I consider the Labour or machinery
availability, in deciding the planting
date, 57
I consider the risk of drought spell in
deciding the planting date, 304
I postpone planting date due to lack of credit / Money, 256
I postpone planting date due to lack of credit / Money, 57
-50
0
50
100
150
200
250
300
350
400
Agree Disagree
Number of rice farmers
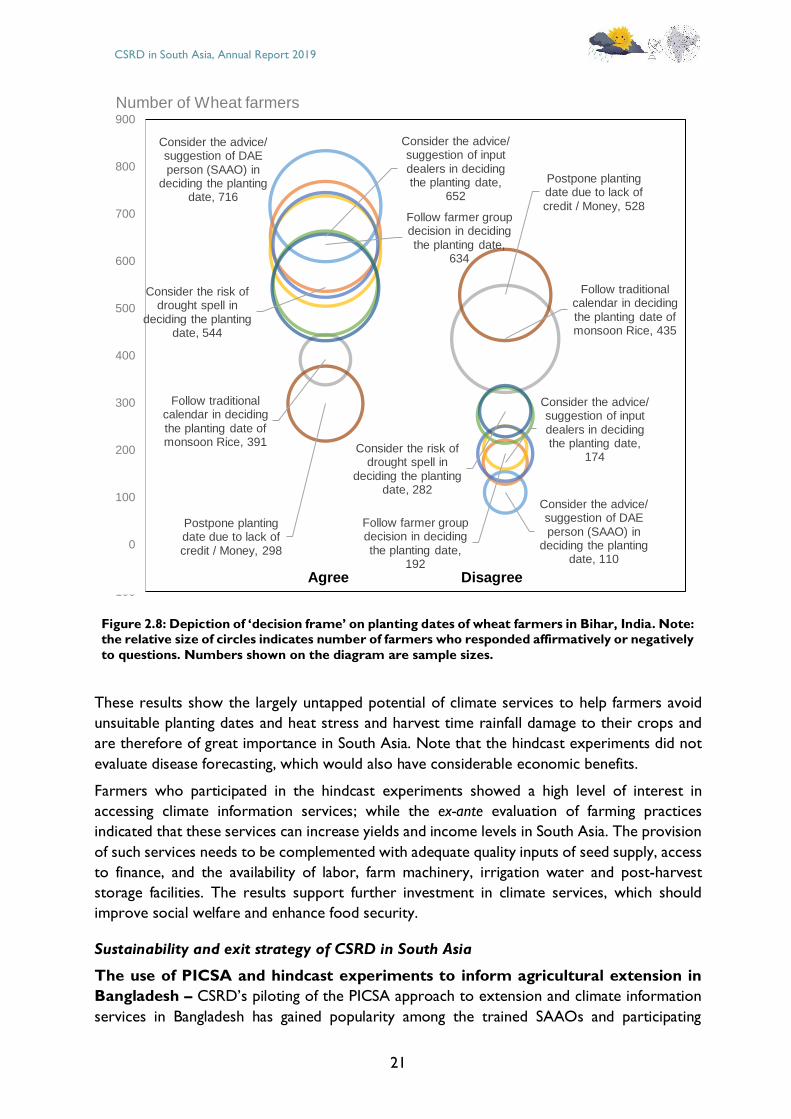
CSRD in South Asia, Annual Report 2019
21
Figure 2.8: Depiction of ‘decision frame’ on planting dates of wheat farmers in Bihar, India. Note: the relative size of circles indicates number of farmers who responded affirmatively or negatively
to questions. Numbers shown on the diagram are sample sizes.
These results show the largely untapped potential of climate services to help farmers avoid
unsuitable planting dates and heat stress and harvest time rainfall damage to their crops and
are therefore of great importance in South Asia. Note that the hindcast experiments did not
evaluate disease forecasting, which would also have considerable economic benefits.
Farmers who participated in the hindcast experiments showed a high level of interest in
accessing climate information services; while the ex-ante evaluation of farming practices
indicated that these services can increase yields and income levels in South Asia. The provision
of such services needs to be complemented with adequate quality inputs of seed supply, access
to finance, and the availability of labor, farm machinery, irrigation water and post-harvest
storage facilities. The results support further investment in climate services, which should
improve social welfare and enhance food security.
Sustainability and exit strategy of CSRD in South Asia
The use of PICSA and hindcast experiments to inform agricultural extension in
Bangladesh – CSRD’s piloting of the PICSA approach to extension and climate information
services in Bangladesh has gained popularity among the trained SAAOs and participating
Consider the advice/ suggestion of DAE person (SAAO) in
deciding the planting date, 716
Consider the advice/ suggestion of DAE person (SAAO) in
deciding the planting date, 110
Consider the advice/ suggestion of input dealers in deciding the planting date,
652
Consider the advice/ suggestion of input dealers in deciding the planting date,
174
Follow traditional calendar in deciding the planting date of monsoon Rice, 391
Follow traditional calendar in deciding the planting date of monsoon Rice, 435
Follow farmer group decision in deciding the planting date,
634
Follow farmer group decision in deciding the planting date,
192
Consider the risk of drought spell in
deciding the planting date, 544
Consider the risk of drought spell in
deciding the planting date, 282
Postpone planting date due to lack of credit / Money, 298
Postpone planting date due to lack of credit / Money, 528
-100
0
100
200
300
400
500
600
700
800
900
Agree Disagree
Number of Wheat farmers
CSRD in South Asia, Annual Report 2019
22
farmers. During the course of CSRD, 20 high-level DAE officers were trained as master trainers
on PICSA. They then trained 40 SAAOs who subsequently trained 1,000 farmers in 40
communities in 20 upazilas of 11 districts of Bangladesh.
Bangladesh’s DAE has expressed a strong interest in adopting PICSA and implementing PICSA
activities as part of the organizations’ core programming, and also in the World Bank funded
‘Weather and Climate Services Regional Project for Bangladesh’, which is led by DAE. In
addition, the following are two decision support tools developed by CSRD that are now applied
in DAE-led PICSA trainings (which are discussed later in this report):
• The Agvisely automated climate service advisory system for Bangladesh’s major field
crops helps extension agents and farmers increase the resilience of farming systems to
climate risks.
• The early warning system for wheat blast disease was developed by CIMMYT in
partnership with the Brazilian Agricultural Research Corporation (EMBRAPA), the
University of Passo Fundo (UPF) and a number of international and national research and
extension partners.
Officers and field level extension personnel have been trained as master trainers on the use of
these two applications to communicate weather information and crop management advisories
at least five days in advance. It is relevant to note here that these tools have been endorsed
for institutional use by DAE and have become a core part of DAE’s PICSA extension activities
by providing location-specific information that can be used in trainings. DAE is regularly using
PICSA in its farmer field school programming. And during 2019 CSRD supported DAE to seek
continuing funding support for scaling out the PICSA approach:
• On 10 April 2019, DAE submitted a project proposal on ‘Upscaling the PICSA approach
and assessing its impacts on managing climate risk in Bangladesh’ to the government’s
Krishi Gobeshona Foundation for funding support on. The proposal remains under
consideration (approvals often take 12-14 months). If awarded, this will result in
additional funding flexibility and additional support for DAE to continue developing the
PICSA approach for three more years beyond CSRD until longer duration funding is in
place.
• A concept paper for a PICSA project was resubmitted to Bangladesh’s Ministry of
Agriculture (MoA) in late 2019. The proposal was consistent with Articles 2.1 (Specific
Objectives), 5.2 (Extension Methods), 5.5 (Agricultural Productivity) and 9 (Agricultural
Mechanization) of the National Agricultural Policy, 2013.
If these efforts are fruitful then it is likely that the PICSA approach to providing climate services
will play a sustained and vital role in combating climate related stresses and to enhance farmers’
livelihoods.
Adoption of hindcast experimental approach by other climate services research
initiatives – An additional hindcast survey is underway with the Capacitating Farmers and
Fishers to Manage Climate Risks in South Asia project (CaFFSA) project supported by the
CGIAR Research Program on Climate Change, Agriculture, and Food Security (CCAFS) aligned
with CSRD that focuses on rice-fish and aquaculture systems. The adoption of this method and
its application in aquaculture by WorldFish, one of CIMMYT’s sister CGIAR centers, indicates
the value and promise of this approach. Data are currently being analyzed from this survey.
CSRD in South Asia, Annual Report 2019
23
In addition, the Water Apps project of Wageningen University is considering using the hindcast
method for evaluating climate services provided to farmers.
By proving stand-alone products, protocols and methods, CSRD generated longer-lasting
impacts as a pioneering project in agricultural climate services in South Asia.
Contribution of Activity 1.1.1 to CSRD’s Action and Learning Framework
Pillar 1, Indicators 1.1 and 1.2, Pillar 2, Indicators 2.1 and 2.2, Pillar 3, Indicators 3.1, and 3.2,
and Pillar 4, Indicator 4.1 (see Annex 3).
Sub-Objective 1.2. Climate services capacity development
Background – Sub-Objective 1.2 activities also concern technical improvements in
climatological services, data acquisition and analysis, weather and seasonal climate forecasting
skill improvements, and climatological research in Bangladesh.
Activity 1.2.1. Climate services capacity development in partnership with the
International Research Institute for Climate and Society
Product 1. BMD agricultural climate services assessment
The BMD agricultural climate services assessment was completed on schedule in the third
quarter of 2017. The assessment is provided as Annex 4 of the 2016/17 CSRD in South Asia
Annual Report. Further details of work resulting from the assessment’s recommendations are
described in CSRD’s 2018 semi-annual report.
Product 2. National scientist training and exchange, and CSRD planning with IRI
CSRD successfully facilitated a two-week science and training exchange hosted by IRI at
Columbia University, at the Lamont-Doherty Earth Observatory campus in New York, USA in
April 2017. Further details are in the 2016/17 CSRD in South Asia Annual Report.
Sustainability and exit strategy of CSRD in South Asia
Products 1 and 2 under Activity 1.2.1 were designed to provide essential training to BMD
meteorologists and climatologists so they could participate more effectively in other Objective
1, 2 and 3 activities. As such, no formal exit strategy was designed as these products were
parts of other activities.
Contribution of Activity 1.2.1 to CSRD’s Action and Learning Framework:
Pillar 1, Indicator 1.1 and Pillar 4, Indicator 4.1 (see Annex 3).
CSRD in South Asia, Annual Report 2019
24
Sub-Objective 1.3: Development of forecast products, impact assessments and
decision support tools for agriculture, fisheries and/or livestock
Activity 1.3.1: Iterative development and refinement of decision-support platforms
with improved agro-meteorological services visualization and communications
tools
Background – In pre-CSRD project consultations, BMD requested technical support and
collaboration on the three subjects detailed in this section of the report and that are a key
component of ‘Activity 1.3.1, the Sector 3 Agro-meteorology track’. The three subjects are
• The provision of GIS maps displaying climatic stresses
• Forecasts for irrigation management
• The development of impact based agro-forecast systems with an emphasis on developing
crop-specific pest and disease models.
The following write-ups report the progress in the reporting period on the Activity 1.3.1
research topics and products:
• Agriculturally short- and extended-range forecasts graphically depicted as climatic stress
risk maps for major cereals.
• An ITC platform for meteorologically integrated irrigation management services.
• Spatially explicit and meteorologically driven wheat blast (Magnaporthe oryzae Triticum)
disease risk assessments for Bangladesh.
Product 1. Agriculturally relevant climatological analysis and improved
extended-range forecasts and outlooks5
Using historical climate data to provide information on present and future climatic
conditions
Deriving actionable climate information for crop planning from historical data
The climatic data and products produced by the Bangladesh Meteorological Department
(BMD) are a valuable source of information for agriculture stakeholders. Effective institutional
communication is an essential part of the climate information services development cycle.
BMD–CSRD consultations prior to and at the beginning of the project identified many
opportunities and activities to enhance climate information services for agriculture to build the
resilience and adaptation capacities of Bangladeshi farming systems. This prioritized the analysis
of BMD and other historical climate data to identify and characterize the major climate factors
that influence agriculture in Bangladesh.
Background data – Between 2016 and 2019, BMD and IRI scientists generated databases of
climate information to document climate variability as the first step in developing improved
5 The initial USAID scope of work based on the 12 July 2016 consultation with BMD suggested focusing on developing
‘Seven-day rainfall forecasts with 15-day accumulative rainfall outlooks’ (Tasks i. ii.). At the start of the project, CSRD
staff found that BMD was already generating seven-day rainfall forecasts using outputs from its Weather Research and
Forecasting (WRF) model. Fifteen cumulative rainfall outlooks were relevant in the context of several other forecasting
parameters that were identified during the BMD skills assessment. Importantly, these topics were more agriculturally
relevant for farmers than generic 7 or 15-day accumulative rainfall outlooks. With the endorsement of BMD, CSRD
therefore focused on these forecasting needs under this activity product now renamed ‘Agriculturally relevant
climatological analysis and improved extended-range forecasts and outlooks’.
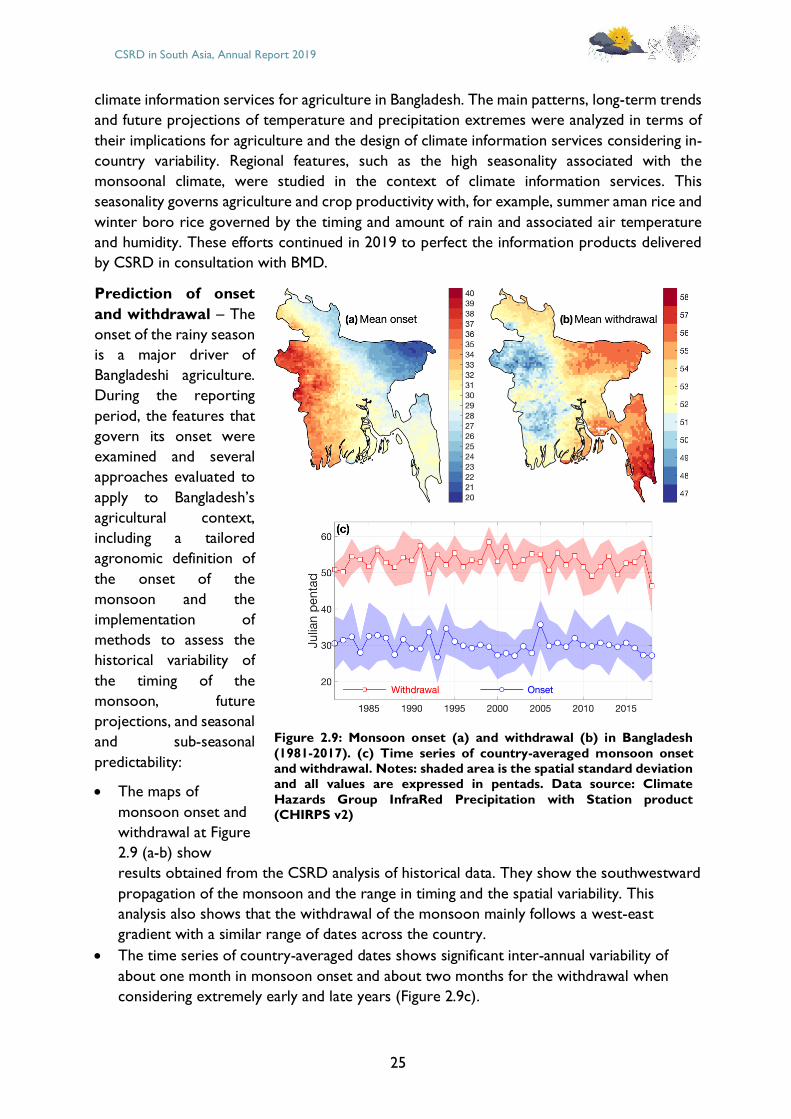
CSRD in South Asia, Annual Report 2019
25
climate information services for agriculture in Bangladesh. The main patterns, long-term trends
and future projections of temperature and precipitation extremes were analyzed in terms of
their implications for agriculture and the design of climate information services considering in-
country variability. Regional features, such as the high seasonality associated with the
monsoonal climate, were studied in the context of climate information services. This
seasonality governs agriculture and crop productivity with, for example, summer aman rice and
winter boro rice governed by the timing and amount of rain and associated air temperature
and humidity. These efforts continued in 2019 to perfect the information products delivered
by CSRD in consultation with BMD.
Prediction of onset
and withdrawal – The
onset of the rainy season
is a major driver of
Bangladeshi agriculture.
During the reporting
period, the features that
govern its onset were
examined and several
approaches evaluated to
apply to Bangladesh’s
agricultural context,
including a tailored
agronomic definition of
the onset of the
monsoon and the
implementation of
methods to assess the
historical variability of
the timing of the
monsoon, future
projections, and seasonal
and sub-seasonal
predictability:
• The maps of
monsoon onset and
withdrawal at Figure
2.9 (a-b) show
results obtained from the CSRD analysis of historical data. They show the southwestward
propagation of the monsoon and the range in timing and the spatial variability. This
analysis also shows that the withdrawal of the monsoon mainly follows a west-east
gradient with a similar range of dates across the country.
• The time series of country-averaged dates shows significant inter-annual variability of
about one month in monsoon onset and about two months for the withdrawal when
considering extremely early and late years (Figure 2.9c).
Figure 2.9: Monsoon onset (a) and withdrawal (b) in Bangladesh
(1981-2017). (c) Time series of country-averaged monsoon onset and withdrawal. Notes: shaded area is the spatial standard deviation and all values are expressed in pentads. Data source: Climate
Hazards Group InfraRed Precipitation with Station product (CHIRPS v2)
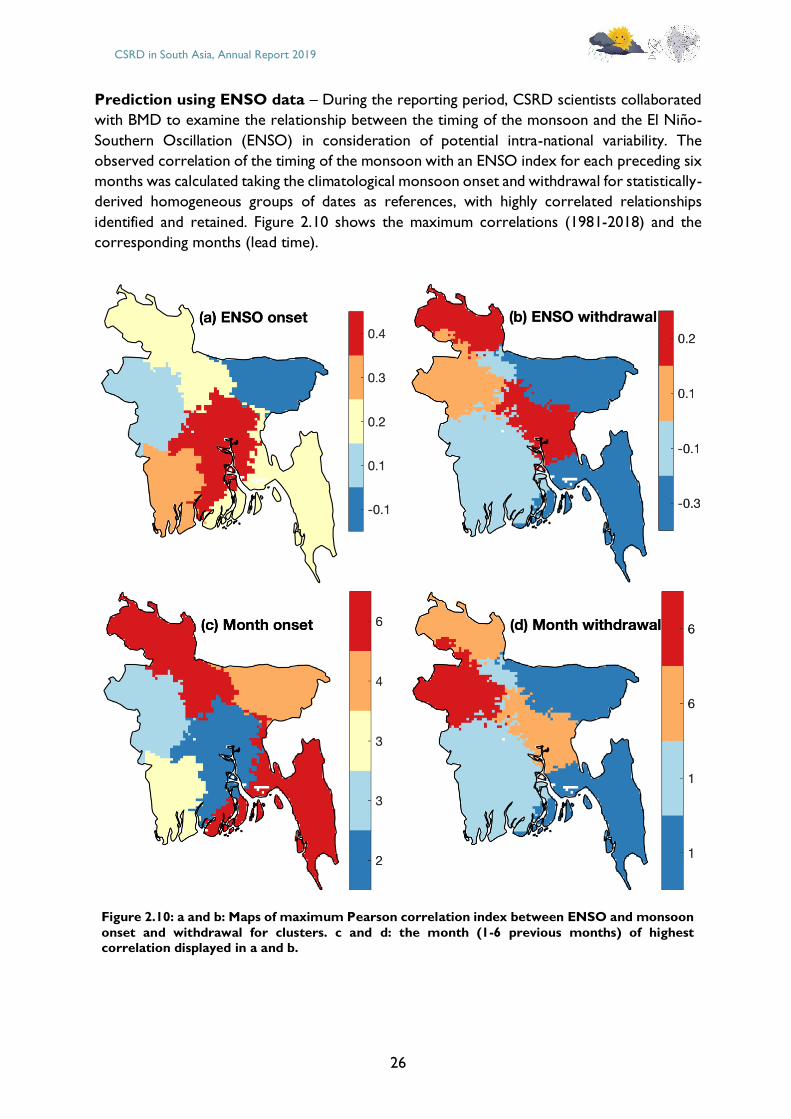
CSRD in South Asia, Annual Report 2019
26
Prediction using ENSO data – During the reporting period, CSRD scientists collaborated
with BMD to examine the relationship between the timing of the monsoon and the El Niño-
Southern Oscillation (ENSO) in consideration of potential intra-national variability. The
observed correlation of the timing of the monsoon with an ENSO index for each preceding six
months was calculated taking the climatological monsoon onset and withdrawal for statistically-
derived homogeneous groups of dates as references, with highly correlated relationships
identified and retained. Figure 2.10 shows the maximum correlations (1981-2018) and the
corresponding months (lead time).
Figure 2.10: a and b: Maps of maximum Pearson correlation index between ENSO and monsoon
onset and withdrawal for clusters. c and d: the month (1-6 previous months) of highest correlation displayed in a and b.
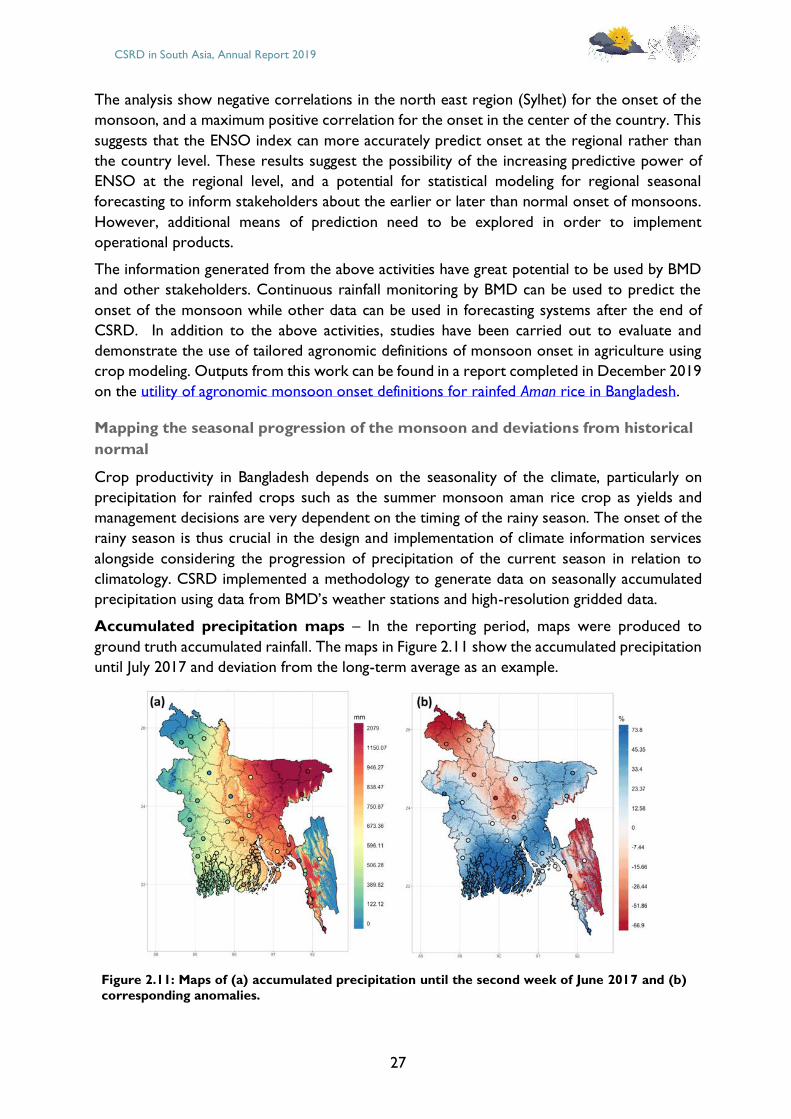
CSRD in South Asia, Annual Report 2019
27
The analysis show negative correlations in the north east region (Sylhet) for the onset of the
monsoon, and a maximum positive correlation for the onset in the center of the country. This
suggests that the ENSO index can more accurately predict onset at the regional rather than
the country level. These results suggest the possibility of the increasing predictive power of
ENSO at the regional level, and a potential for statistical modeling for regional seasonal
forecasting to inform stakeholders about the earlier or later than normal onset of monsoons.
However, additional means of prediction need to be explored in order to implement
operational products.
The information generated from the above activities have great potential to be used by BMD
and other stakeholders. Continuous rainfall monitoring by BMD can be used to predict the
onset of the monsoon while other data can be used in forecasting systems after the end of
CSRD. In addition to the above activities, studies have been carried out to evaluate and
demonstrate the use of tailored agronomic definitions of monsoon onset in agriculture using
crop modeling. Outputs from this work can be found in a report completed in December 2019
on the utility of agronomic monsoon onset definitions for rainfed Aman rice in Bangladesh.
Mapping the seasonal progression of the monsoon and deviations from historical
normal
Crop productivity in Bangladesh depends on the seasonality of the climate, particularly on
precipitation for rainfed crops such as the summer monsoon aman rice crop as yields and
management decisions are very dependent on the timing of the rainy season. The onset of the
rainy season is thus crucial in the design and implementation of climate information services
alongside considering the progression of precipitation of the current season in relation to
climatology. CSRD implemented a methodology to generate data on seasonally accumulated
precipitation using data from BMD’s weather stations and high-resolution gridded data.
Accumulated precipitation maps – In the reporting period, maps were produced to
ground truth accumulated rainfall. The maps in Figure 2.11 show the accumulated precipitation
until July 2017 and deviation from the long-term average as an example.
Figure 2.11: Maps of (a) accumulated precipitation until the second week of June 2017 and (b)
corresponding anomalies.
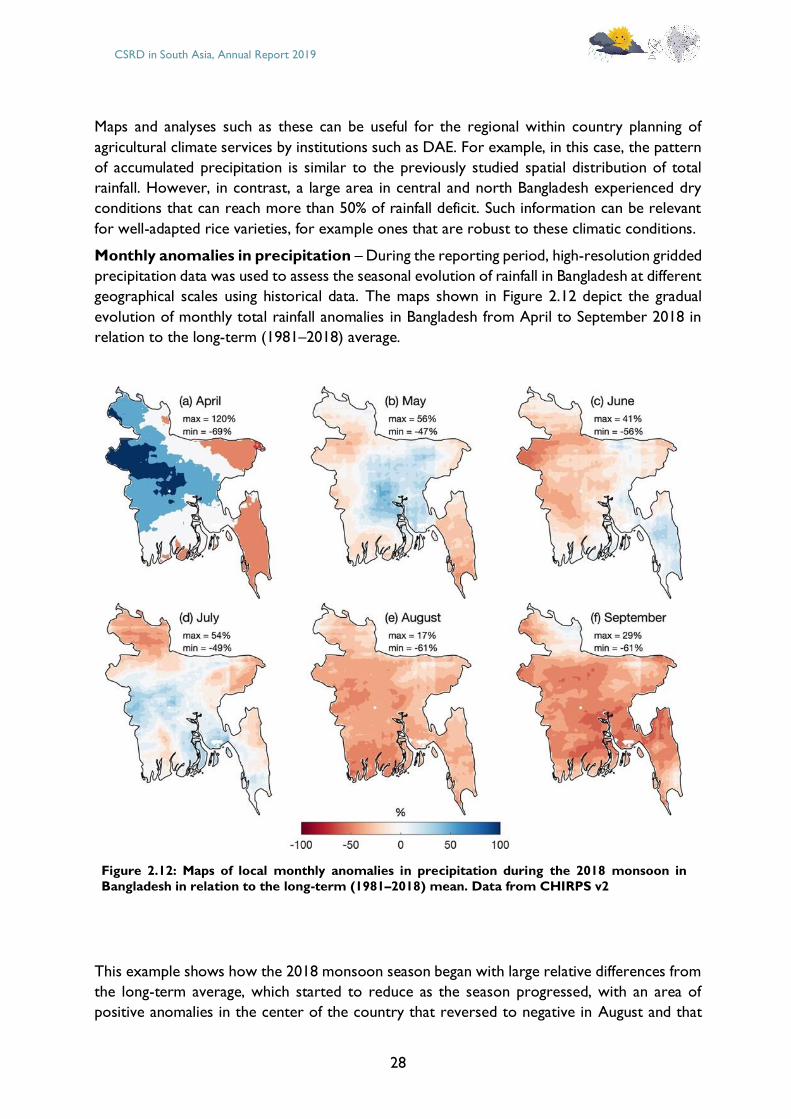
CSRD in South Asia, Annual Report 2019
28
Maps and analyses such as these can be useful for the regional within country planning of
agricultural climate services by institutions such as DAE. For example, in this case, the pattern
of accumulated precipitation is similar to the previously studied spatial distribution of total
rainfall. However, in contrast, a large area in central and north Bangladesh experienced dry
conditions that can reach more than 50% of rainfall deficit. Such information can be relevant
for well-adapted rice varieties, for example ones that are robust to these climatic conditions.
Monthly anomalies in precipitation – During the reporting period, high-resolution gridded
precipitation data was used to assess the seasonal evolution of rainfall in Bangladesh at different
geographical scales using historical data. The maps shown in Figure 2.12 depict the gradual
evolution of monthly total rainfall anomalies in Bangladesh from April to September 2018 in
relation to the long-term (1981–2018) average.
Figure 2.12: Maps of local monthly anomalies in precipitation during the 2018 monsoon in
Bangladesh in relation to the long-term (1981–2018) mean. Data from CHIRPS v2
This example shows how the 2018 monsoon season began with large relative differences from
the long-term average, which started to reduce as the season progressed, with an area of
positive anomalies in the center of the country that reversed to negative in August and that
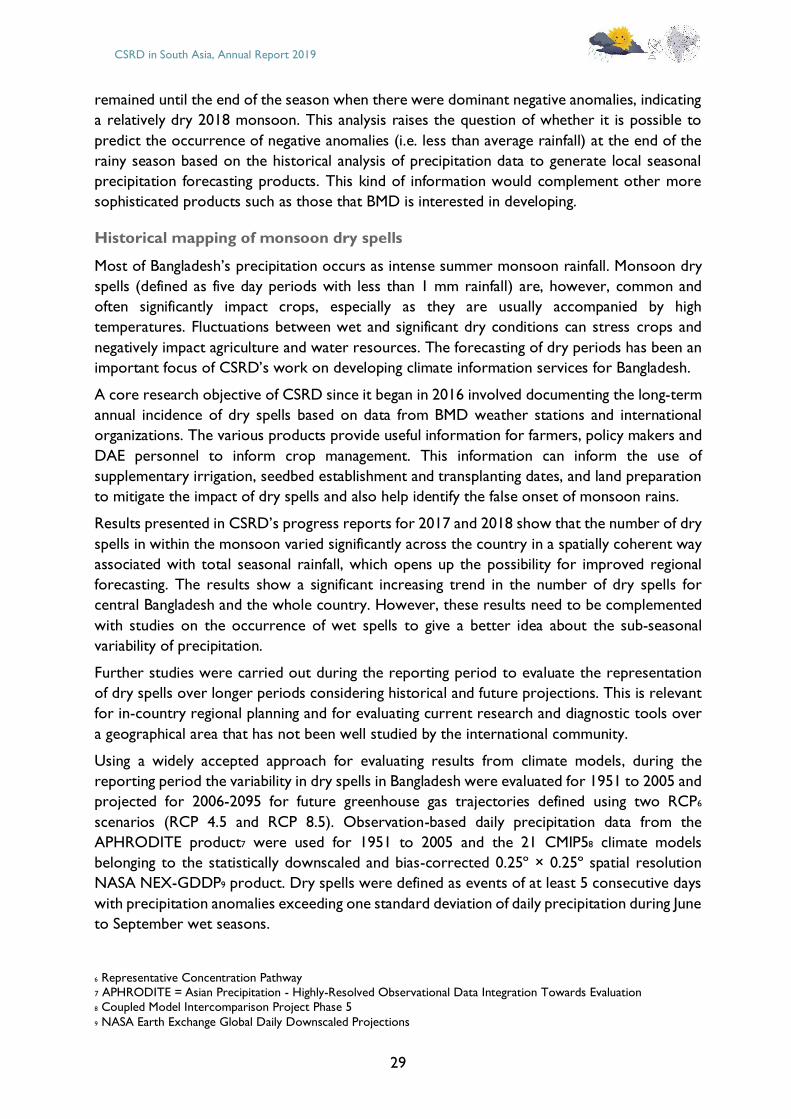
CSRD in South Asia, Annual Report 2019
29
remained until the end of the season when there were dominant negative anomalies, indicating
a relatively dry 2018 monsoon. This analysis raises the question of whether it is possible to
predict the occurrence of negative anomalies (i.e. less than average rainfall) at the end of the
rainy season based on the historical analysis of precipitation data to generate local seasonal
precipitation forecasting products. This kind of information would complement other more
sophisticated products such as those that BMD is interested in developing.
Historical mapping of monsoon dry spells
Most of Bangladesh’s precipitation occurs as intense summer monsoon rainfall. Monsoon dry
spells (defined as five day periods with less than 1 mm rainfall) are, however, common and
often significantly impact crops, especially as they are usually accompanied by high
temperatures. Fluctuations between wet and significant dry conditions can stress crops and
negatively impact agriculture and water resources. The forecasting of dry periods has been an
important focus of CSRD’s work on developing climate information services for Bangladesh.
A core research objective of CSRD since it began in 2016 involved documenting the long-term
annual incidence of dry spells based on data from BMD weather stations and international
organizations. The various products provide useful information for farmers, policy makers and
DAE personnel to inform crop management. This information can inform the use of
supplementary irrigation, seedbed establishment and transplanting dates, and land preparation
to mitigate the impact of dry spells and also help identify the false onset of monsoon rains.
Results presented in CSRD’s progress reports for 2017 and 2018 show that the number of dry
spells in within the monsoon varied significantly across the country in a spatially coherent way
associated with total seasonal rainfall, which opens up the possibility for improved regional
forecasting. The results show a significant increasing trend in the number of dry spells for
central Bangladesh and the whole country. However, these results need to be complemented
with studies on the occurrence of wet spells to give a better idea about the sub-seasonal
variability of precipitation.
Further studies were carried out during the reporting period to evaluate the representation
of dry spells over longer periods considering historical and future projections. This is relevant
for in-country regional planning and for evaluating current research and diagnostic tools over
a geographical area that has not been well studied by the international community.
Using a widely accepted approach for evaluating results from climate models, during the
reporting period the variability in dry spells in Bangladesh were evaluated for 1951 to 2005 and
projected for 2006-2095 for future greenhouse gas trajectories defined using two RCP6
scenarios (RCP 4.5 and RCP 8.5). Observation-based daily precipitation data from the
APHRODITE product7 were used for 1951 to 2005 and the 21 CMIP58 climate models
belonging to the statistically downscaled and bias-corrected 0.25º × 0.25º spatial resolution
NASA NEX-GDDP9 product. Dry spells were defined as events of at least 5 consecutive days
with precipitation anomalies exceeding one standard deviation of daily precipitation during June
to September wet seasons.
6 Representative Concentration Pathway
7 APHRODITE = Asian Precipitation - Highly-Resolved Observational Data Integration Towards Evaluation
8 Coupled Model Intercomparison Project Phase 5
9 NASA Earth Exchange Global Daily Downscaled Projections
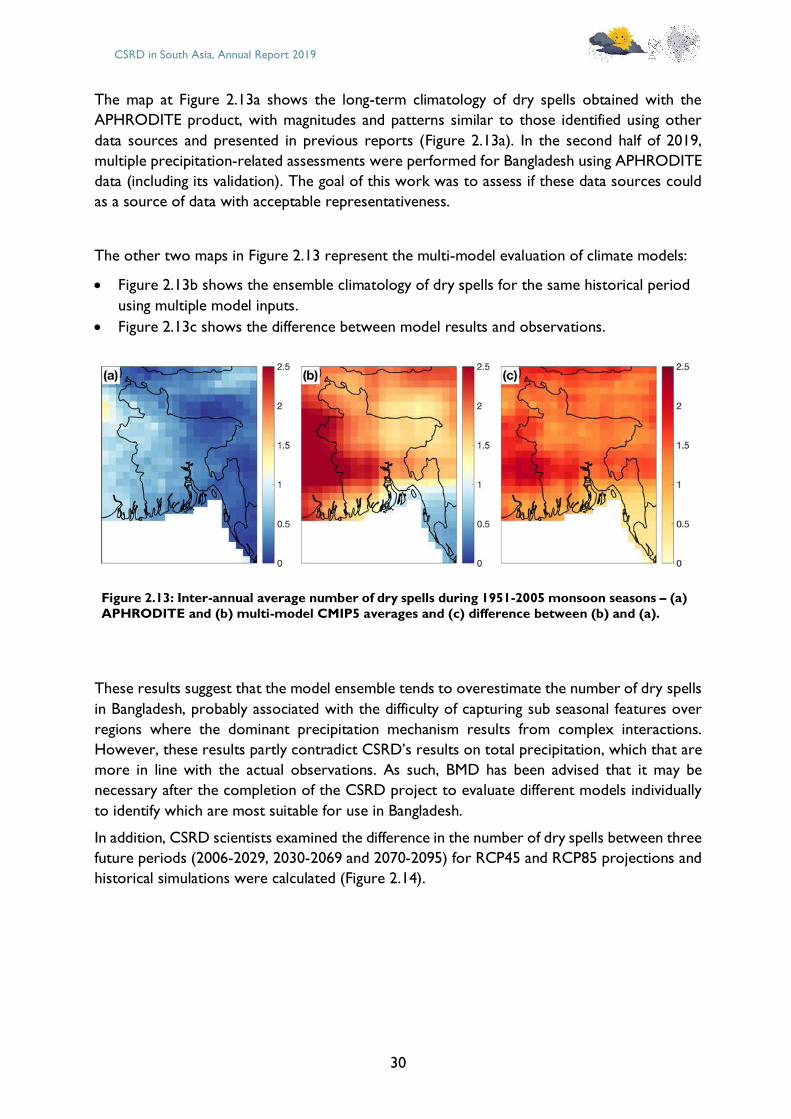
CSRD in South Asia, Annual Report 2019
30
The map at Figure 2.13a shows the long-term climatology of dry spells obtained with the
APHRODITE product, with magnitudes and patterns similar to those identified using other
data sources and presented in previous reports (Figure 2.13a). In the second half of 2019,
multiple precipitation-related assessments were performed for Bangladesh using APHRODITE
data (including its validation). The goal of this work was to assess if these data sources could
as a source of data with acceptable representativeness.
The other two maps in Figure 2.13 represent the multi-model evaluation of climate models:
• Figure 2.13b shows the ensemble climatology of dry spells for the same historical period
using multiple model inputs.
• Figure 2.13c shows the difference between model results and observations.
Figure 2.13: Inter-annual average number of dry spells during 1951-2005 monsoon seasons – (a)
APHRODITE and (b) multi-model CMIP5 averages and (c) difference between (b) and (a).
These results suggest that the model ensemble tends to overestimate the number of dry spells
in Bangladesh, probably associated with the difficulty of capturing sub seasonal features over
regions where the dominant precipitation mechanism results from complex interactions.
However, these results partly contradict CSRD’s results on total precipitation, which that are
more in line with the actual observations. As such, BMD has been advised that it may be
necessary after the completion of the CSRD project to evaluate different models individually
to identify which are most suitable for use in Bangladesh.
In addition, CSRD scientists examined the difference in the number of dry spells between three
future periods (2006-2029, 2030-2069 and 2070-2095) for RCP45 and RCP85 projections and
historical simulations were calculated (Figure 2.14).
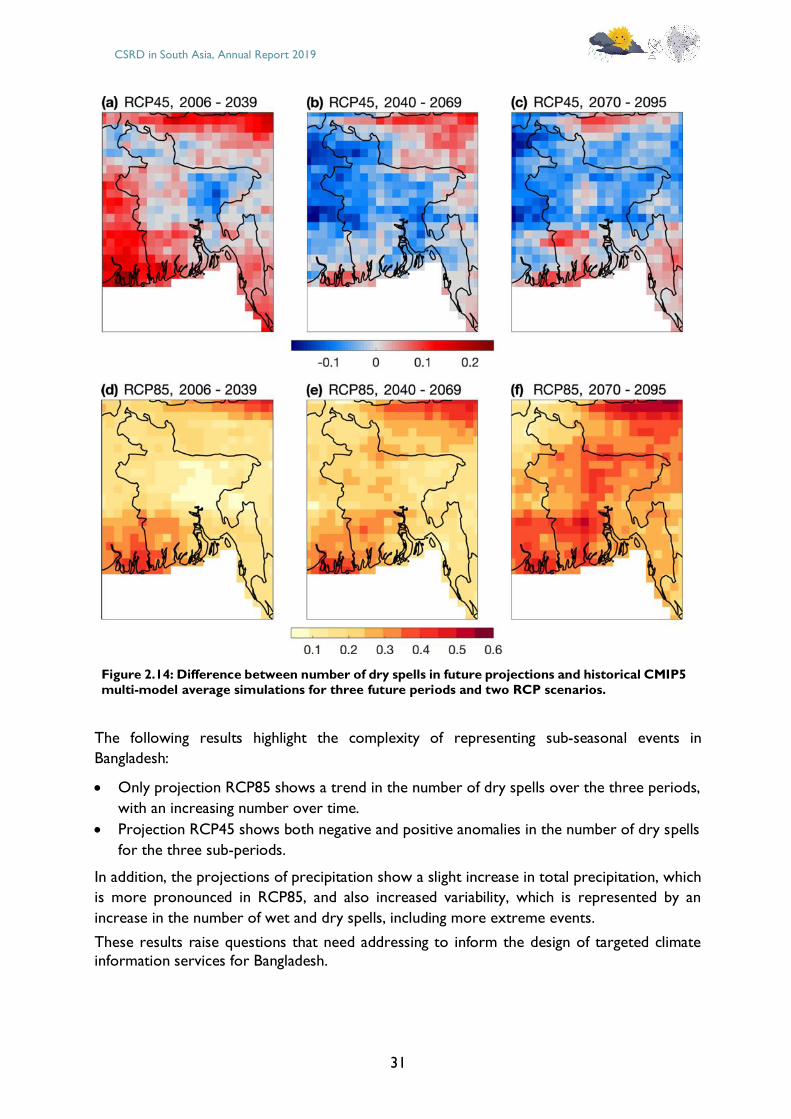
CSRD in South Asia, Annual Report 2019
31
Figure 2.14: Difference between number of dry spells in future projections and historical CMIP5 multi-model average simulations for three future periods and two RCP scenarios.
The following results highlight the complexity of representing sub-seasonal events in
Bangladesh:
• Only projection RCP85 shows a trend in the number of dry spells over the three periods,
with an increasing number over time.
• Projection RCP45 shows both negative and positive anomalies in the number of dry spells
for the three sub-periods.
In addition, the projections of precipitation show a slight increase in total precipitation, which
is more pronounced in RCP85, and also increased variability, which is represented by an
increase in the number of wet and dry spells, including more extreme events.
These results raise questions that need addressing to inform the design of targeted climate
information services for Bangladesh.
CSRD in South Asia, Annual Report 2019
32
Historical mapping of heavy rain events in the early pre-monsoon period
In Bangladesh, precipitation is the main climate variable that influences crop yields and
management practices, and that regulates extreme high temperatures in the transition to the
rainy season. Additionally, agriculture in Bangladesh is often affected by extreme precipitation
events that damage crops, reduce farmers’ incomes and impact food security.
CSRD early on identified the study of the long-term and spatial occurrence of heavy rainfall
events as a priority concern for Bangladeshi agriculture to inform the development of climate
information services for farmers. The analysis of the probability of heavy rainfall during the
transition from the dry to the wet season (early pre-monsoon rainfall), and during the
monsoon, were recognized as priorities in terms of their temporal and spatial variability,
trends, multi-scale forecasting, and the possible use of satellite products for extended studies
to generate useful information for planting, planning harvests, and fertilizer management, for
multiple crops and especially for sensitive ones such as mung beans.
As example of CSRD’s work in this field is the long-term statistical analysis of BMD historical
data that was carried out in the reporting period. Figure 2.15a shows the results from the
mapping of the annual number of heavy rainfall events between 1981 and 2017 using a 95%
percentile of daily precipitation as a criterion, and corresponding linear trends.
Figure 2.15: (a) The number of annual heavy rainfall events (1981–2017) and (b) linear trends.
Note: p and n denote number of stations with positive and negative trends respectively
The improved understanding of the occurrence of heavy rainfall events can inform the
development of climate information services for specific crops and regions, such as for mung
beans in south Bangladesh. This crop, which is increasingly grown by small farmers, is very
sensitive to heavy rainfall events at harvesting in the pre-monsoon period.
During the course of 2019, CSRD also collaborated with BMD developed a methodology to
assess the occurrence of heavy rainfall events in Patuakhali, south Bangladesh, considering long-
term statistical analysis, large-scale meteorological drivers and BMD weather forecasts. In
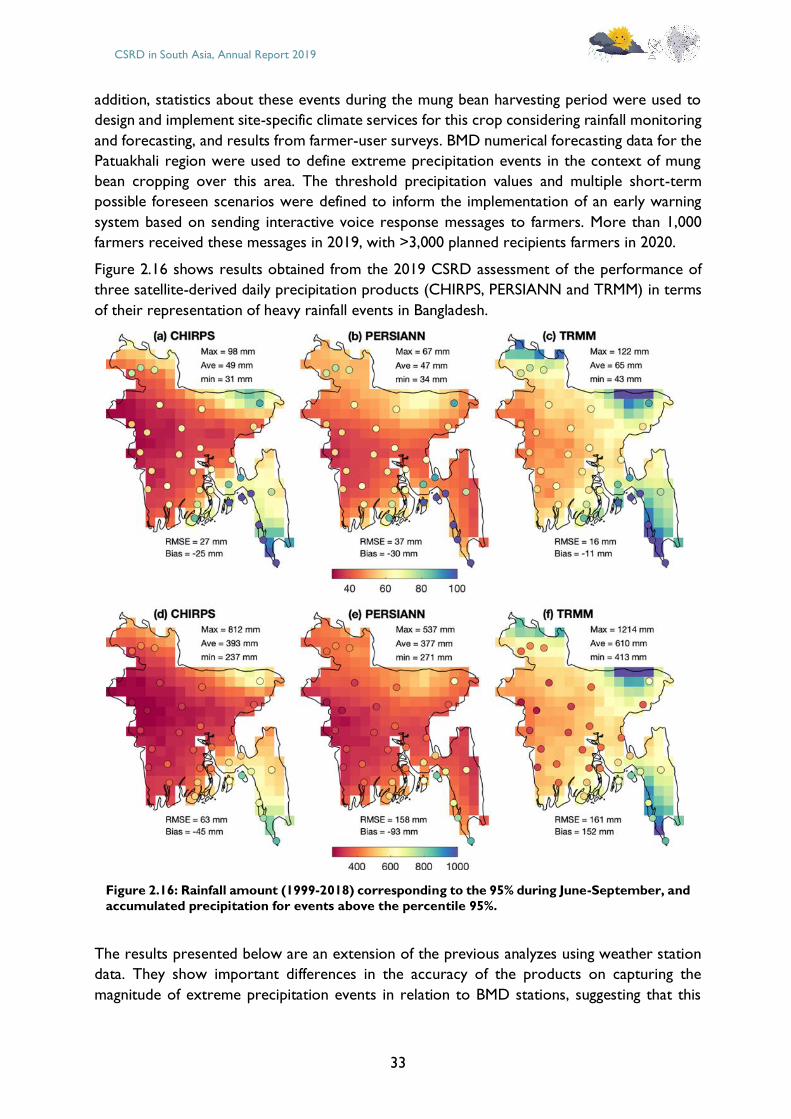
CSRD in South Asia, Annual Report 2019
33
addition, statistics about these events during the mung bean harvesting period were used to
design and implement site-specific climate services for this crop considering rainfall monitoring
and forecasting, and results from farmer-user surveys. BMD numerical forecasting data for the
Patuakhali region were used to define extreme precipitation events in the context of mung
bean cropping over this area. The threshold precipitation values and multiple short-term
possible foreseen scenarios were defined to inform the implementation of an early warning
system based on sending interactive voice response messages to farmers. More than 1,000
farmers received these messages in 2019, with >3,000 planned recipients farmers in 2020.
Figure 2.16 shows results obtained from the 2019 CSRD assessment of the performance of
three satellite-derived daily precipitation products (CHIRPS, PERSIANN and TRMM) in terms
of their representation of heavy rainfall events in Bangladesh.
Figure 2.16: Rainfall amount (1999-2018) corresponding to the 95% during June-September, and
accumulated precipitation for events above the percentile 95%.
The results presented below are an extension of the previous analyzes using weather station
data. They show important differences in the accuracy of the products on capturing the
magnitude of extreme precipitation events in relation to BMD stations, suggesting that this
CSRD in South Asia, Annual Report 2019
34
type of analysis is necessary when looking for the application of these products, even though
they are widely used by weather services.
The heavy rainfall event mapping activities described above have direct applications for BMD
and DAE. One is using satellite products to report the seasonal occurrence of extreme
precipitation events by agricultural region. Moreover, further analysis can be done by merging
gridded historical, high-resolution satellite data with rain gauge data. However, using these
results to inform climate information services must be subject to the implementation and
generation of new data and its correct translation and transfer to users. The results presented
here are, however, preliminary and additional research probably to be carried out by BMD
after the conclusion of the project.
In addition, the work conducted in 2019 indicates the potential of location-specific forecasting
to inform climate information service-based solutions to problems associated with extreme
precipitation events. However, its extension to and use in larger areas and periods of the year
(e.g. other crops) may be difficult given the lack of high-resolution observation networks in
Bangladesh. Previous CSRD work focused on analyzing these events using data from weather
stations where magnitudes, occurrence and coherent regional patterns were identified. This
information was useful to continue studies and applications in south Bangladesh for forecasting
heavy rainfall events. However, the use of weather stations has limitations associated with their
spatial coverage and data availability and quality. However, recently released high temporal and
daily resolution, almost real time data, generated by international organizations such as the
National Aeronautics and Space Administration (NASA) and the National Oceanic and
Atmospheric Administration (NOAA), have great potential for monitoring extreme
precipitation events and associated agricultural planning.
Sustainability and exit strategy of CSRD in South Asia
Code for the analytical products developed in Product 1 under Activity 1.2.1 of Sub-Objective
3.1 of CSRD have been provided to BMD to use in future climate analytical products and tools.
Product 2. The Agvisely climate services decision support and an advisory tool to
avoid crop stress10
Background – BMD wants to improve the quality of its agro-meteorological forecasts. In
2017, it was envisaged that improved short-term and seasonal forecasts and the integration of
the resulting information as crop-specific advisories would be deployed through CSRD
partners. Other suggestions were made to improve BMD’s weekly agro-meteorological
bulletins. In response, CSRD began work with BMD and other partners, such as DAE, to
develop improved, high spatial- and temporal-resolution forecasts and crop management
advisories. The Agvisely.com climate services decision support and advisory tool to avoid crop
stress responded to and achieves these objectives.
FGDs – In 2017, in the early months of the project, CSRD conducted focus group discussions
with 68 farmers and 59 DAE sub-assistant agricultural officers (SAAOs) in Barisal, Bhola,
Patuakhali, Rajshahi and Dinajpur Districts in Bangladesh. The coastal Barisal, Bhola, and
Patuakhali Districts are climate-risk prone and experience more cyclonic activity in the pre-
and post-monsoon seasons, while Rajshahi and Dinajpur are more drought-prone higher
10 Note that this is a new product that resulted from CSRD’s work that was not part of the original project work plan.
CSRD in South Asia, Annual Report 2019
35
elevation regions. The FGDs elicited farmers’ understanding of predominant climate and
weather patterns, and their impact on agricultural decision making and crop productivity.
Farmers’ use of weather forecasts and their degree of trust in extended and seasonal
forecasting were also explored, alongside preferences for how climate information can be
graphically communicated to farmers. SAAO focus groups also examined the perceived use of
extended range and seasonal forecasts for extension agents, while also exploring various media
and methods for rapidly communicating climate information and advisories to farmers.
FGD results – The FGD results indicated that neither farmers nor SAAOs regularly used or
had strong confidence in weather forecasts. Both groups pointed to lack of location-specific
information as a barrier. Participants who had received forecast information said it was too
geographically broad to be of use to their farm operations. The high degree of agronomic
complexity and microclimates in Bangladesh were a common subject of discussion in the focus
groups. However, the farmers and extension agents expressed an interest in high-intensity
weather event forecasts such as of storms, heavy rainfall and hail that can damage crops.
However, both groups had a generally poor understanding on the day-to-day effects on crop
productivity of weather and less dramatic climatic events, such as high temperatures and cold.
The farmer participants preferred 1–7 day forecasts and indicated that they had never heard
of, nor were likely to trust longer-range forecasts. The SAAOs also preferred 1–7 day
forecasts, but saw the value of seasonal forecasting so they could better assist farmers with
pre-seasonal planning and crop selection. That said, both farmers and SAAOs may have had
unrealistically high expectations of the accuracy of forecasts; both groups indicated that unless
forecasts were at least regularly 80% accurate that the information was difficult to use for
agricultural planning. Options for the graphical depiction of climate forecast information were
also explored with farmers.
Response – CSRD has responded to the needs identified in the FGDs by developing an
Agvisely, interactive, map-based agro-meteorological bulletin and an accompanying mobile
phone app that provides numerical weather forecasting model predictions with easy-to-
understand crop-specific management advisories. Crop productivity in Bangladesh is heavily
influenced by the large variability in temperature and precipitation. Access to timely weather
forecasts and crop management advisories would improve the resilience of Bangladesh’s
smallholder farmers to climate variability and extremes. But the data used to develop advisories
must be scientifically valid and understandable and useful to farmers.
There are a range of temperatures within which plant growth is optimum at the different
growth stages. When temperatures drop below or exceed the threshold then plant growth
stops. The lowest temperature at which crop growth can occur is the minimum cardinal
temperature while the maximum cardinal temperature is the temperature above which plant
growth stops. Rice, wheat, maize, potato, pulses and other crops have optimum temperature
ranges for their growth and development. This range varies by species and the phenology or
growth, the developmental stages of crops and by cultivar. Crops growth is adversely affected
when temperatures are too high or too low. Therefore, knowing the upper threshold and
lower thresholds can be useful for advising farmers of ways to increase the resilience of their
crops to climate extremes.
Scientists have developed complex crop growth models that relate precipitation and
atmospheric, soil, and water temperatures to the growth rates of crop species and cultivars.
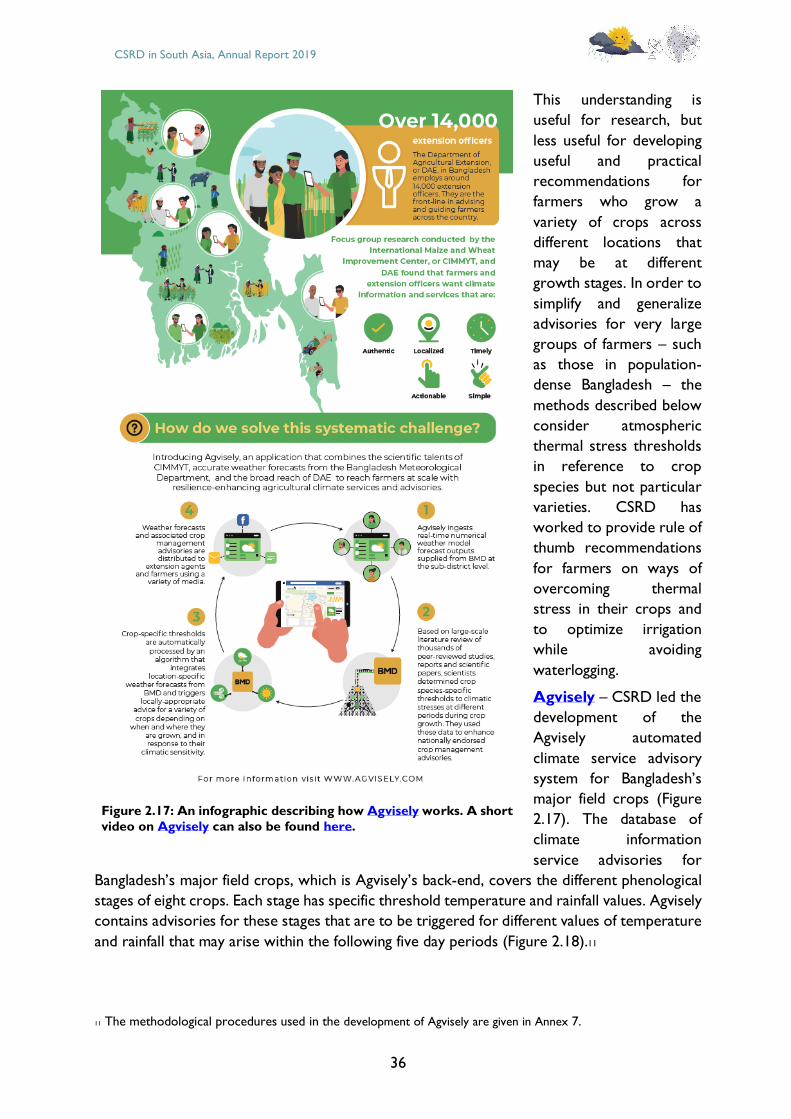
CSRD in South Asia, Annual Report 2019
36
This understanding is
useful for research, but
less useful for developing
useful and practical
recommendations for
farmers who grow a
variety of crops across
different locations that
may be at different
growth stages. In order to
simplify and generalize
advisories for very large
groups of farmers – such
as those in population-
dense Bangladesh – the
methods described below
consider atmospheric
thermal stress thresholds
in reference to crop
species but not particular
varieties. CSRD has
worked to provide rule of
thumb recommendations
for farmers on ways of
overcoming thermal
stress in their crops and
to optimize irrigation
while avoiding
waterlogging.
Agvisely – CSRD led the
development of the
Agvisely automated
climate service advisory
system for Bangladesh’s
major field crops (Figure
2.17). The database of
climate information
service advisories for
Bangladesh’s major field crops, which is Agvisely’s back-end, covers the different phenological
stages of eight crops. Each stage has specific threshold temperature and rainfall values. Agvisely
contains advisories for these stages that are to be triggered for different values of temperature
and rainfall that may arise within the following five day periods (Figure 2.18).11
11 The methodological procedures used in the development of Agvisely are given in Annex 7.
Figure 2.17: An infographic describing how Agvisely works. A short
video on Agvisely can also be found here.
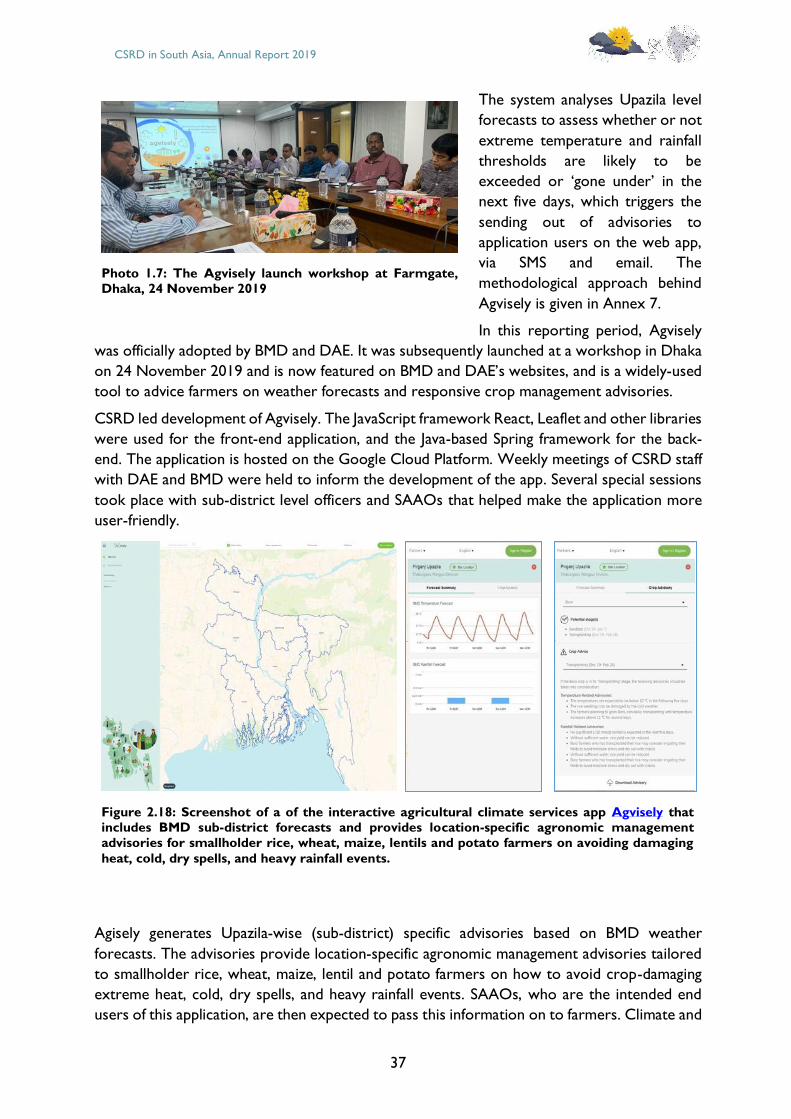
CSRD in South Asia, Annual Report 2019
37
The system analyses Upazila level
forecasts to assess whether or not
extreme temperature and rainfall
thresholds are likely to be
exceeded or ‘gone under’ in the
next five days, which triggers the
sending out of advisories to
application users on the web app,
via SMS and email. The
methodological approach behind
Agvisely is given in Annex 7.
In this reporting period, Agvisely
was officially adopted by BMD and DAE. It was subsequently launched at a workshop in Dhaka
on 24 November 2019 and is now featured on BMD and DAE’s websites, and is a widely-used
tool to advice farmers on weather forecasts and responsive crop management advisories.
CSRD led development of Agvisely. The JavaScript framework React, Leaflet and other libraries
were used for the front-end application, and the Java-based Spring framework for the back-
end. The application is hosted on the Google Cloud Platform. Weekly meetings of CSRD staff
with DAE and BMD were held to inform the development of the app. Several special sessions
took place with sub-district level officers and SAAOs that helped make the application more
user-friendly.
Figure 2.18: Screenshot of a of the interactive agricultural climate services app Agvisely that includes BMD sub-district forecasts and provides location-specific agronomic management
advisories for smallholder rice, wheat, maize, lentils and potato farmers on avoiding damaging
heat, cold, dry spells, and heavy rainfall events.
Agisely generates Upazila-wise (sub-district) specific advisories based on BMD weather
forecasts. The advisories provide location-specific agronomic management advisories tailored
to smallholder rice, wheat, maize, lentil and potato farmers on how to avoid crop-damaging
extreme heat, cold, dry spells, and heavy rainfall events. SAAOs, who are the intended end
users of this application, are then expected to pass this information on to farmers. Climate and
Photo 1.7: The Agvisely launch workshop at Farmgate,
Dhaka, 24 November 2019
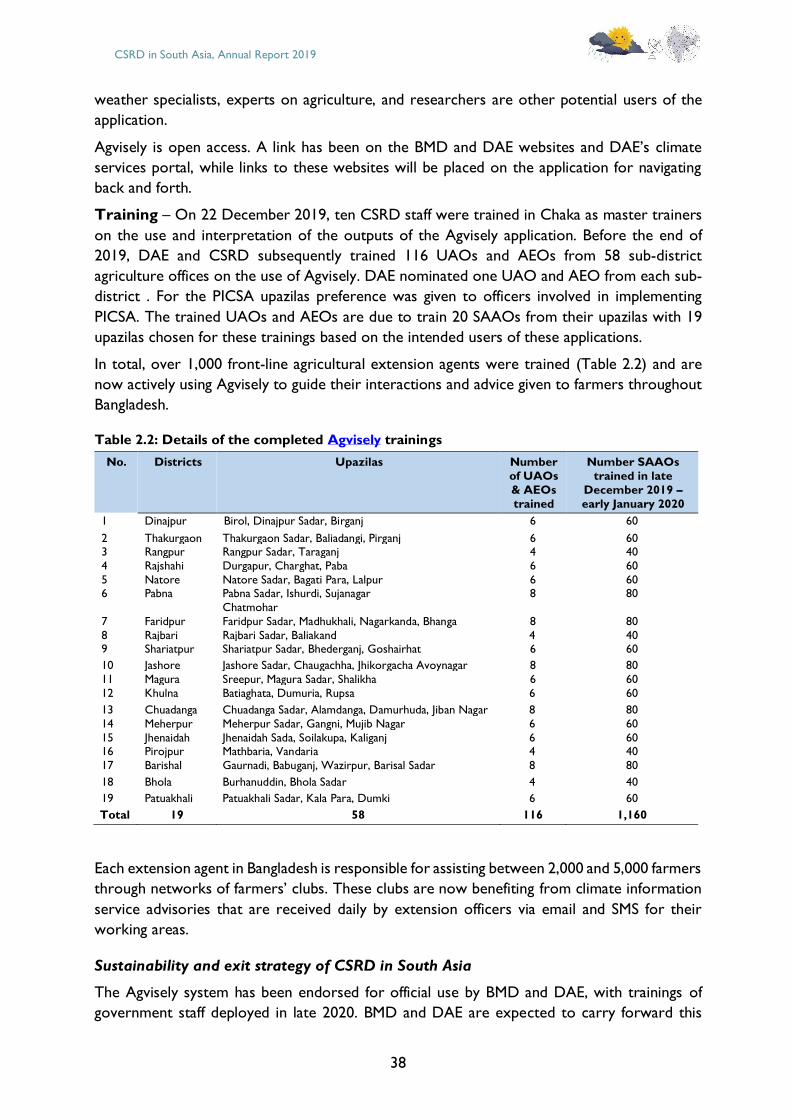
CSRD in South Asia, Annual Report 2019
38
weather specialists, experts on agriculture, and researchers are other potential users of the
application.
Agvisely is open access. A link has been on the BMD and DAE websites and DAE’s climate
services portal, while links to these websites will be placed on the application for navigating
back and forth.
Training – On 22 December 2019, ten CSRD staff were trained in Chaka as master trainers
on the use and interpretation of the outputs of the Agvisely application. Before the end of
2019, DAE and CSRD subsequently trained 116 UAOs and AEOs from 58 sub-district
agriculture offices on the use of Agvisely. DAE nominated one UAO and AEO from each sub-
district . For the PICSA upazilas preference was given to officers involved in implementing
PICSA. The trained UAOs and AEOs are due to train 20 SAAOs from their upazilas with 19
upazilas chosen for these trainings based on the intended users of these applications.
In total, over 1,000 front-line agricultural extension agents were trained (Table 2.2) and are
now actively using Agvisely to guide their interactions and advice given to farmers throughout
Bangladesh.
Table 2.2: Details of the completed Agvisely trainings
No. Districts Upazilas Number
of UAOs
& AEOs
trained
Number SAAOs
trained in late
December 2019 –
early January 2020
1 Dinajpur Birol, Dinajpur Sadar, Birganj 6 60
2 Thakurgaon Thakurgaon Sadar, Baliadangi, Pirganj 6 60 3 Rangpur Rangpur Sadar, Taraganj 4 40
4 Rajshahi Durgapur, Charghat, Paba 6 60
5 Natore Natore Sadar, Bagati Para, Lalpur 6 60 6 Pabna Pabna Sadar, Ishurdi, Sujanagar
Chatmohar
8 80
7 Faridpur Faridpur Sadar, Madhukhali, Nagarkanda, Bhanga 8 80
8 Rajbari Rajbari Sadar, Baliakand 4 40 9 Shariatpur Shariatpur Sadar, Bhederganj, Goshairhat 6 60
10 Jashore Jashore Sadar, Chaugachha, Jhikorgacha Avoynagar 8 80
11 Magura Sreepur, Magura Sadar, Shalikha 6 60
12 Khulna Batiaghata, Dumuria, Rupsa 6 60
13 Chuadanga Chuadanga Sadar, Alamdanga, Damurhuda, Jiban Nagar 8 80
14 Meherpur Meherpur Sadar, Gangni, Mujib Nagar 6 60
15 Jhenaidah Jhenaidah Sada, Soilakupa, Kaliganj 6 60 16 Pirojpur Mathbaria, Vandaria 4 40
17 Barishal Gaurnadi, Babuganj, Wazirpur, Barisal Sadar 8 80
18 Bhola Burhanuddin, Bhola Sadar 4 40
19 Patuakhali Patuakhali Sadar, Kala Para, Dumki 6 60
Total 19 58 116 1,160
Each extension agent in Bangladesh is responsible for assisting between 2,000 and 5,000 farmers
through networks of farmers’ clubs. These clubs are now benefiting from climate information
service advisories that are received daily by extension officers via email and SMS for their
working areas.
Sustainability and exit strategy of CSRD in South Asia
The Agvisely system has been endorsed for official use by BMD and DAE, with trainings of
government staff deployed in late 2020. BMD and DAE are expected to carry forward this
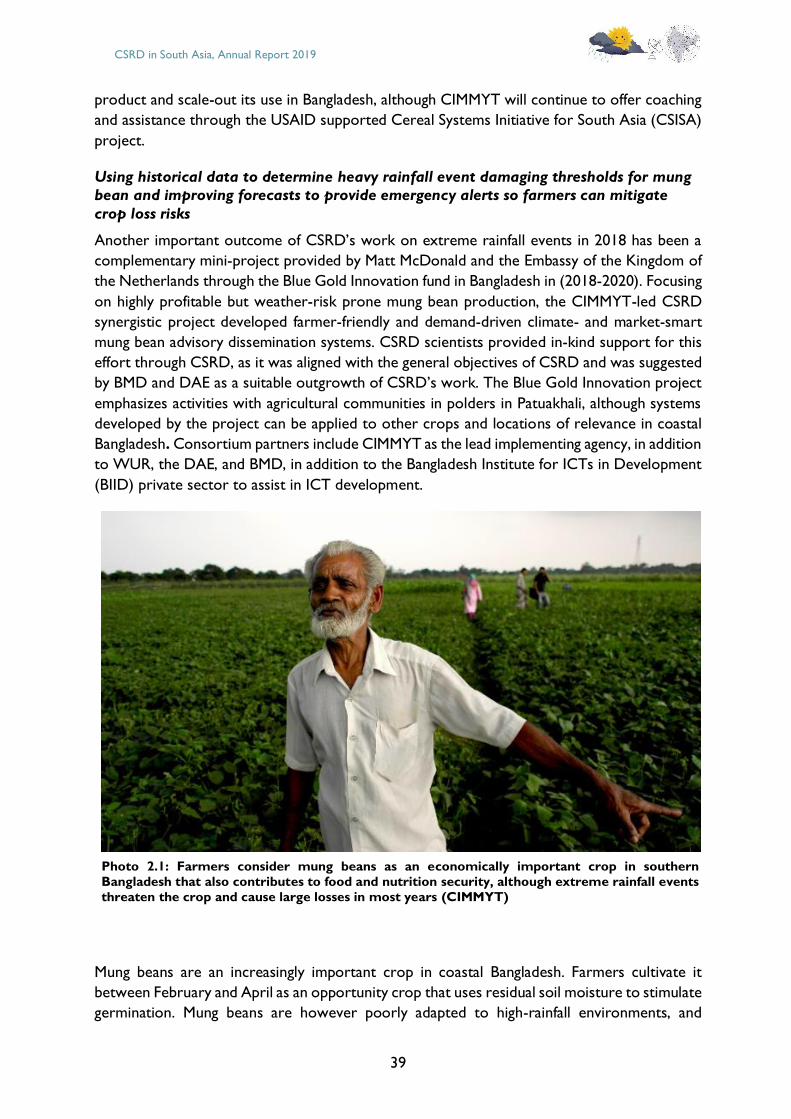
CSRD in South Asia, Annual Report 2019
39
product and scale-out its use in Bangladesh, although CIMMYT will continue to offer coaching
and assistance through the USAID supported Cereal Systems Initiative for South Asia (CSISA)
project.
Using historical data to determine heavy rainfall event damaging thresholds for mung bean and improving forecasts to provide emergency alerts so farmers can mitigate
crop loss risks
Another important outcome of CSRD’s work on extreme rainfall events in 2018 has been a
complementary mini-project provided by Matt McDonald and the Embassy of the Kingdom of
the Netherlands through the Blue Gold Innovation fund in Bangladesh in (2018-2020). Focusing
on highly profitable but weather-risk prone mung bean production, the CIMMYT-led CSRD
synergistic project developed farmer-friendly and demand-driven climate- and market-smart
mung bean advisory dissemination systems. CSRD scientists provided in-kind support for this
effort through CSRD, as it was aligned with the general objectives of CSRD and was suggested
by BMD and DAE as a suitable outgrowth of CSRD’s work. The Blue Gold Innovation project
emphasizes activities with agricultural communities in polders in Patuakhali, although systems
developed by the project can be applied to other crops and locations of relevance in coastal
Bangladesh. Consortium partners include CIMMYT as the lead implementing agency, in addition
to WUR, the DAE, and BMD, in addition to the Bangladesh Institute for ICTs in Development
(BIID) private sector to assist in ICT development.
Mung beans are an increasingly important crop in coastal Bangladesh. Farmers cultivate it
between February and April as an opportunity crop that uses residual soil moisture to stimulate
germination. Mung beans are however poorly adapted to high-rainfall environments, and
Photo 2.1: Farmers consider mung beans as an economically important crop in southern Bangladesh that also contributes to food and nutrition security, although extreme rainfall events threaten the crop and cause large losses in most years (CIMMYT)
CSRD in South Asia, Annual Report 2019
40
farmers frequently lose their crop due to heavy rainfall events at harvesting time. Most
importantly, harvesting is also prolonged for mung beans as the varieties grown in Bangladesh
are not determinate, meaning that they flower for an extended period and set seed and pods
over a period of several weeks. If heavy rainfall strikes in this period, pods can shatter and the
crop can become waterlogged, resulting in considerable crop losses.
In response, CIMMYT has built on the climate services information developed through CSRD
and worked with BMD and DAE to develop customized and location-specific heavy rainfall
event forecasts five days in advance of the risk of occurrence. To achieve this goal, daily rainfall
data provided by the BMD was used and the climatology of heavy rainfall events in Patuakhali
performed for the period 1 March to 1 May. The days with rainfall higher than 1 mm where
isolated and ranked to then apply a mathematical procedure to find the location where the
fitted exponential curve ‘turns’ (the ‘knee’ point), as described above.
A daily threshold rainfall amount of 23 mm/day was identified and used to characterize heavy
rainfall events (HREs), with a total of 181 events identified in 1981–2018. Using the new
threshold, further research exploring how to predict heavy rainfall events was conducted and
used to develop a system by which algorithms can be used to extract BMD’s Weather Research
and Forecasting Model (WRF) model outputs, examine them for heavy rainfall event risks, and
print them as a text file that can be used by BIID to provide interactive voice response messages
to farmers at risk of weather-induced mung bean losses.
Based on information generated from focus groups, farmers had indicated a strong preference
for delivery of weather advisories related to mung bean through voice call or voice message.
Accordingly, the project developed and implemented an interactive voice response (IVR)
system that delivers custom rainfall risk and harvesting advisories to farmers in Patuakhali.
The system was piloted in the 2019 mung bean season. The IVR system was created by
CIMMYT and BIID in consultation with DAE and BMD as an online platform that disseminates
pre-recorded message combinations (170+ combinations professionally recorded in Bangla
that are customized using an algorithm depending on location and forecasted rainfall severity).
Between April – May of 2019 IVR messages were delivered to 1,373 farmers in three pilot
locations in Patuakhali during the phenologically sensitive period at maturity and harvesting
when mung beans are at risk of major damage. In addition to pushing call messages directly to
farmers, they can also hear the IVR from their mobile phone from a free of cost call back
number.
Major findings of the project’s monitoring and evaluation of the 2019 mung bean season
deployment of the IVR weather advisory alert service are as follows:
• The farmer respondents to telephone surveys grew mung beans a total of 51.67, or 31.16
to 164.66 ha in Betagi Sankipur and Choto Bighai unions in Patuakhali, and Gulishakhali
union in Barguna districts.
• Farmers in project working areas who used IVR weather advisories to protect their mung
beans from rainfall damage perceived they had saved 48–52% of their crops from damage
and losses. This equates to 238–772 kg ha –1 equivalent of mung bean yield, or USD 175–
567 ha–1 after accounting for partial costs.
• Actions taken by farmers to avoid rainfall-induced damage appear to have saved a total of
88–204 Mt of mung beans equating to a conservative estimate of USD 64,513–151,337, or
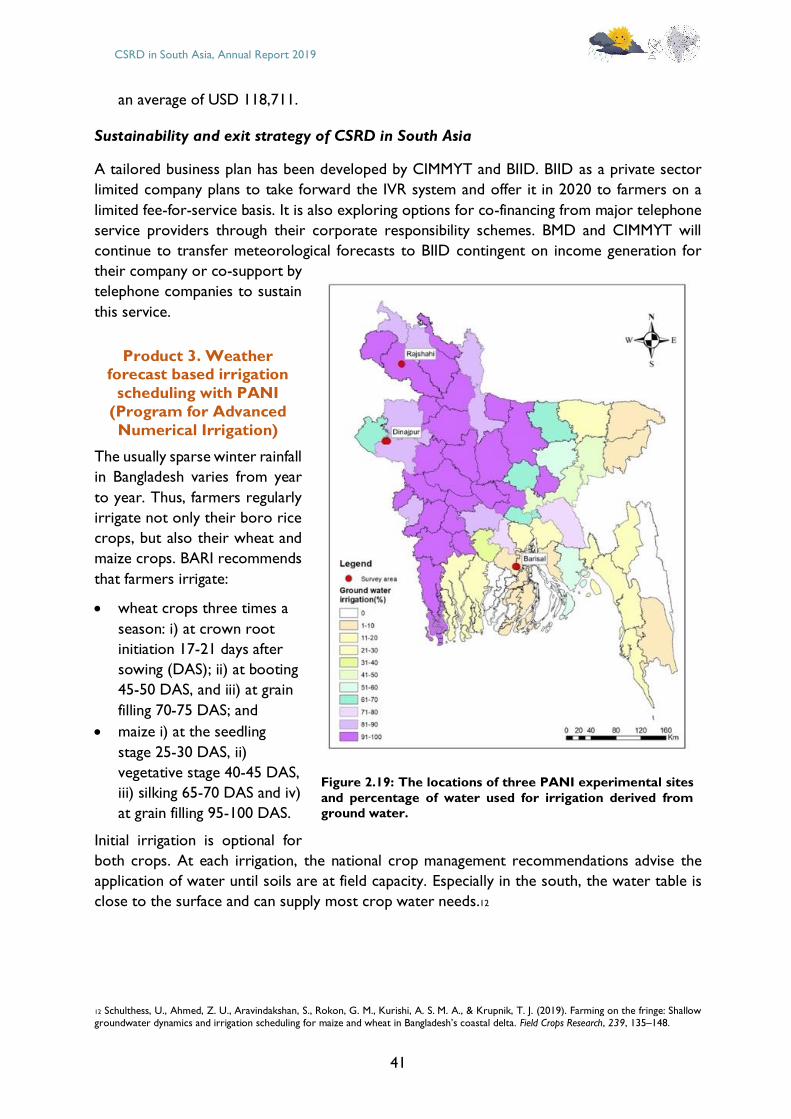
CSRD in South Asia, Annual Report 2019
41
an average of USD 118,711.
Sustainability and exit strategy of CSRD in South Asia
A tailored business plan has been developed by CIMMYT and BIID. BIID as a private sector
limited company plans to take forward the IVR system and offer it in 2020 to farmers on a
limited fee-for-service basis. It is also exploring options for co-financing from major telephone
service providers through their corporate responsibility schemes. BMD and CIMMYT will
continue to transfer meteorological forecasts to BIID contingent on income generation for
their company or co-support by
telephone companies to sustain
this service.
Product 3. Weather forecast based irrigation
scheduling with PANI
(Program for Advanced
Numerical Irrigation)
The usually sparse winter rainfall
in Bangladesh varies from year
to year. Thus, farmers regularly
irrigate not only their boro rice
crops, but also their wheat and
maize crops. BARI recommends
that farmers irrigate:
• wheat crops three times a
season: i) at crown root
initiation 17-21 days after
sowing (DAS); ii) at booting
45-50 DAS, and iii) at grain
filling 70-75 DAS; and
• maize i) at the seedling
stage 25-30 DAS, ii)
vegetative stage 40-45 DAS,
iii) silking 65-70 DAS and iv)
at grain filling 95-100 DAS.
Initial irrigation is optional for
both crops. At each irrigation, the national crop management recommendations advise the
application of water until soils are at field capacity. Especially in the south, the water table is
close to the surface and can supply most crop water needs.12
12 Schulthess, U., Ahmed, Z. U., Aravindakshan, S., Rokon, G. M., Kurishi, A. S. M. A., & Krupnik, T. J. (2019). Farming on the fringe: Shallow
groundwater dynamics and irrigation scheduling for maize and wheat in Bangladesh’s coastal delta. Field Crops Research, 239, 135–148.
Figure 2.19: The locations of three PANI experimental sites
and percentage of water used for irrigation derived from ground water.
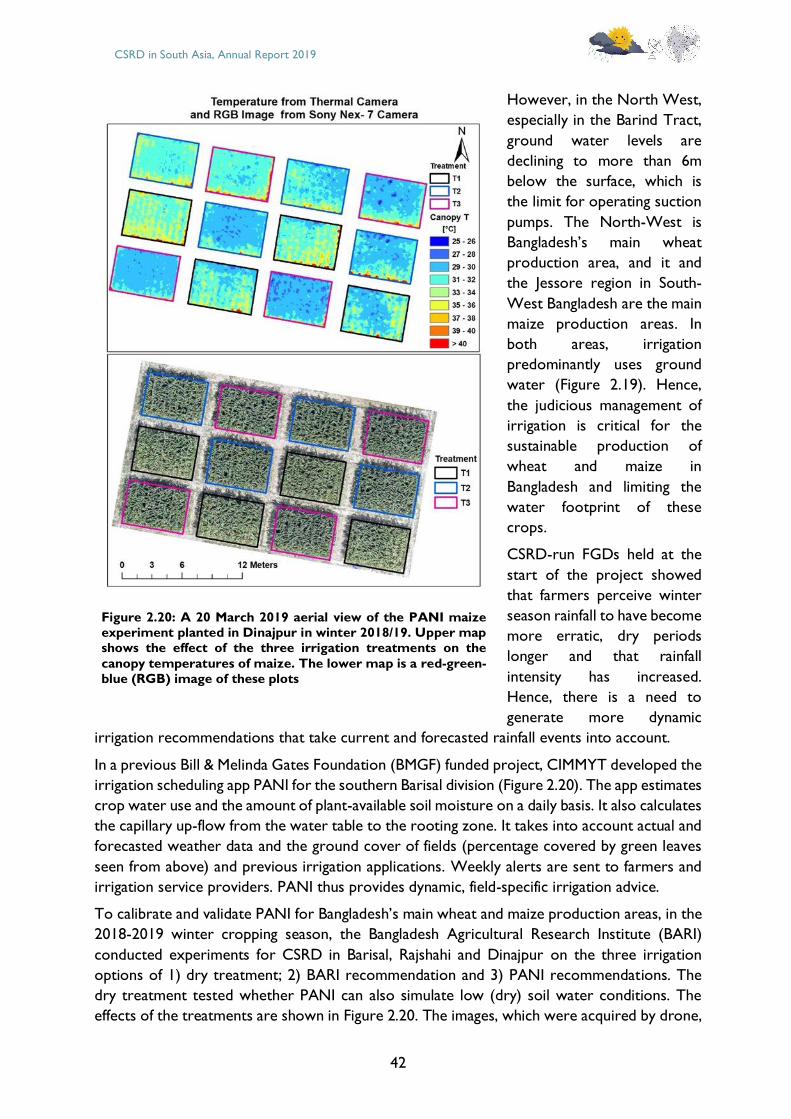
CSRD in South Asia, Annual Report 2019
42
However, in the North West,
especially in the Barind Tract,
ground water levels are
declining to more than 6m
below the surface, which is
the limit for operating suction
pumps. The North-West is
Bangladesh’s main wheat
production area, and it and
the Jessore region in South-
West Bangladesh are the main
maize production areas. In
both areas, irrigation
predominantly uses ground
water (Figure 2.19). Hence,
the judicious management of
irrigation is critical for the
sustainable production of
wheat and maize in
Bangladesh and limiting the
water footprint of these
crops.
CSRD-run FGDs held at the
start of the project showed
that farmers perceive winter
season rainfall to have become
more erratic, dry periods
longer and that rainfall
intensity has increased.
Hence, there is a need to
generate more dynamic
irrigation recommendations that take current and forecasted rainfall events into account.
In a previous Bill & Melinda Gates Foundation (BMGF) funded project, CIMMYT developed the
irrigation scheduling app PANI for the southern Barisal division (Figure 2.20). The app estimates
crop water use and the amount of plant-available soil moisture on a daily basis. It also calculates
the capillary up-flow from the water table to the rooting zone. It takes into account actual and
forecasted weather data and the ground cover of fields (percentage covered by green leaves
seen from above) and previous irrigation applications. Weekly alerts are sent to farmers and
irrigation service providers. PANI thus provides dynamic, field-specific irrigation advice.
To calibrate and validate PANI for Bangladesh’s main wheat and maize production areas, in the
2018-2019 winter cropping season, the Bangladesh Agricultural Research Institute (BARI)
conducted experiments for CSRD in Barisal, Rajshahi and Dinajpur on the three irrigation
options of 1) dry treatment; 2) BARI recommendation and 3) PANI recommendations. The
dry treatment tested whether PANI can also simulate low (dry) soil water conditions. The
effects of the treatments are shown in Figure 2.20. The images, which were acquired by drone,
Figure 2.20: A 20 March 2019 aerial view of the PANI maize experiment planted in Dinajpur in winter 2018/19. Upper map shows the effect of the three irrigation treatments on the
canopy temperatures of maize. The lower map is a red-green-blue (RGB) image of these plots
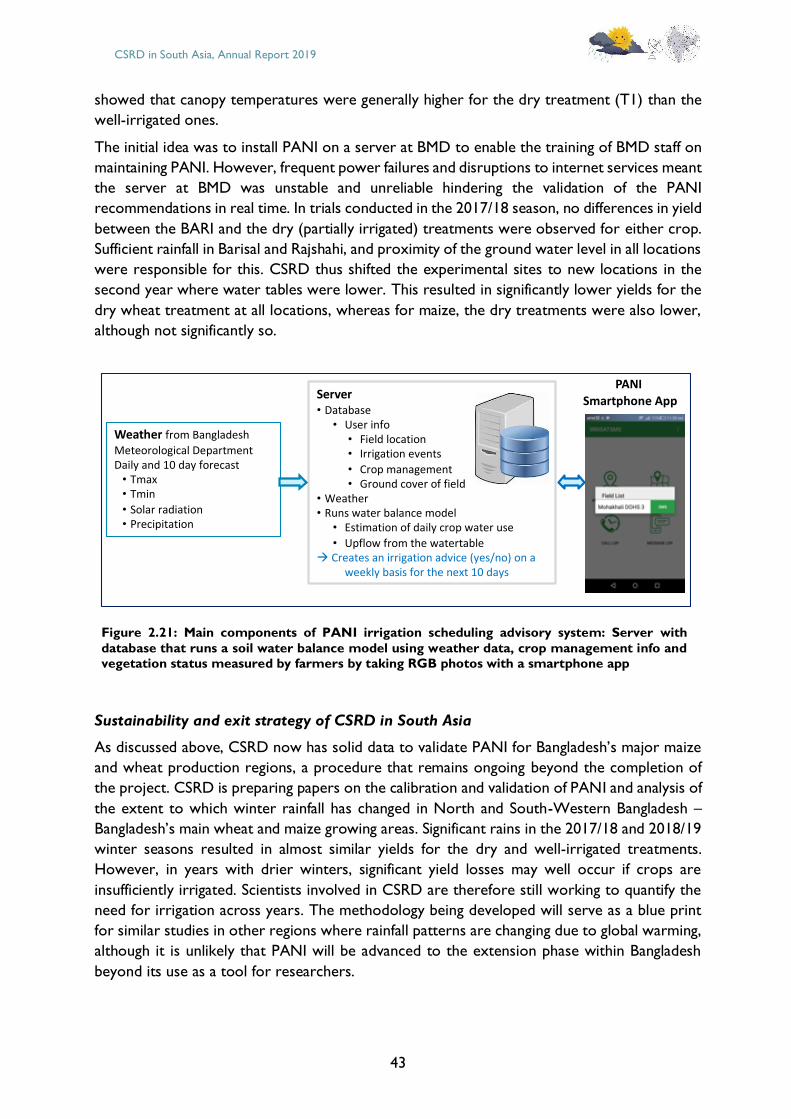
CSRD in South Asia, Annual Report 2019
43
showed that canopy temperatures were generally higher for the dry treatment (T1) than the
well-irrigated ones.
The initial idea was to install PANI on a server at BMD to enable the training of BMD staff on
maintaining PANI. However, frequent power failures and disruptions to internet services meant
the server at BMD was unstable and unreliable hindering the validation of the PANI
recommendations in real time. In trials conducted in the 2017/18 season, no differences in yield
between the BARI and the dry (partially irrigated) treatments were observed for either crop.
Sufficient rainfall in Barisal and Rajshahi, and proximity of the ground water level in all locations
were responsible for this. CSRD thus shifted the experimental sites to new locations in the
second year where water tables were lower. This resulted in significantly lower yields for the
dry wheat treatment at all locations, whereas for maize, the dry treatments were also lower,
although not significantly so.
Figure 2.21: Main components of PANI irrigation scheduling advisory system: Server with
database that runs a soil water balance model using weather data, crop management info and vegetation status measured by farmers by taking RGB photos with a smartphone app
Sustainability and exit strategy of CSRD in South Asia
As discussed above, CSRD now has solid data to validate PANI for Bangladesh’s major maize
and wheat production regions, a procedure that remains ongoing beyond the completion of
the project. CSRD is preparing papers on the calibration and validation of PANI and analysis of
the extent to which winter rainfall has changed in North and South-Western Bangladesh –
Bangladesh’s main wheat and maize growing areas. Significant rains in the 2017/18 and 2018/19
winter seasons resulted in almost similar yields for the dry and well-irrigated treatments.
However, in years with drier winters, significant yield losses may well occur if crops are
insufficiently irrigated. Scientists involved in CSRD are therefore still working to quantify the
need for irrigation across years. The methodology being developed will serve as a blue print
for similar studies in other regions where rainfall patterns are changing due to global warming,
although it is unlikely that PANI will be advanced to the extension phase within Bangladesh
beyond its use as a tool for researchers.
Server• Database
• User info• Field location• Irrigation events
• Crop management• Ground cover of field
• Weather• Runs water balance model
• Estimation of daily crop water use
• Upflow from the watertableà Creates an irrigation advice (yes/no) on a
weekly basis for the next 10 days
Weather from Bangladesh
Meteorological DepartmentDaily and 10 day forecast• Tmax• Tmin
• Solar radiation• Precipitation
PANI
Smartphone App
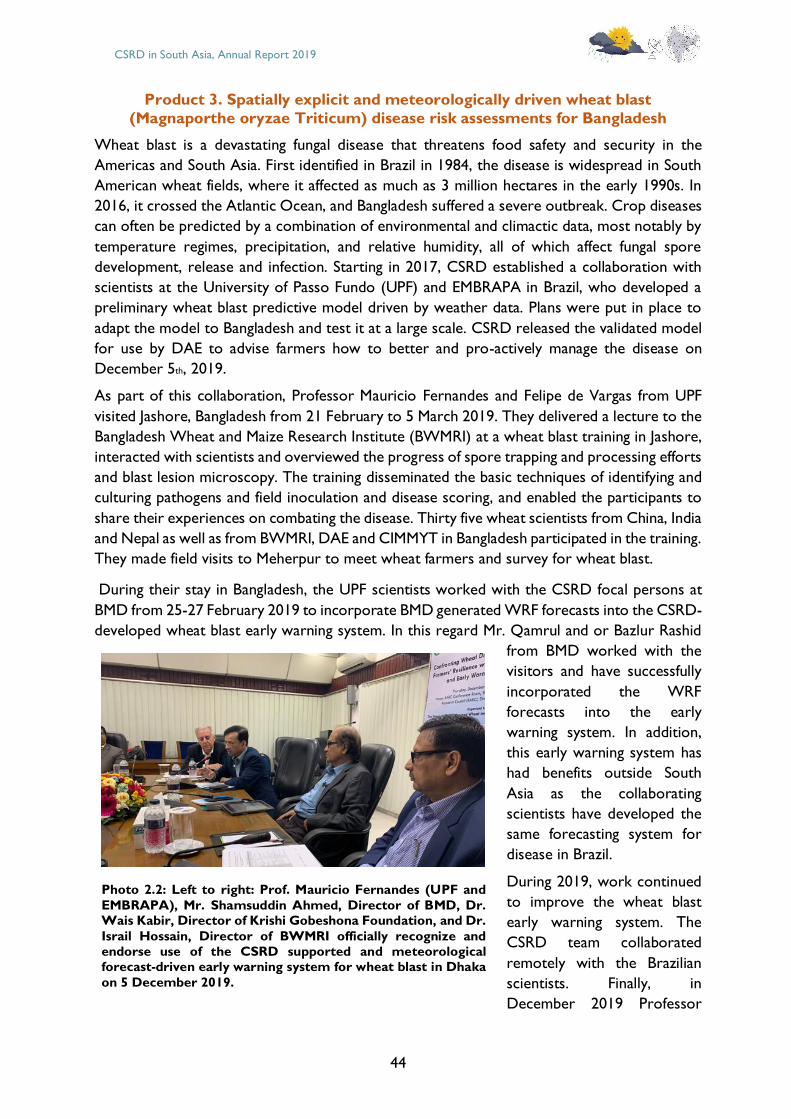
CSRD in South Asia, Annual Report 2019
44
Product 3. Spatially explicit and meteorologically driven wheat blast
(Magnaporthe oryzae Triticum) disease risk assessments for Bangladesh
Wheat blast is a devastating fungal disease that threatens food safety and security in the
Americas and South Asia. First identified in Brazil in 1984, the disease is widespread in South
American wheat fields, where it affected as much as 3 million hectares in the early 1990s. In
2016, it crossed the Atlantic Ocean, and Bangladesh suffered a severe outbreak. Crop diseases
can often be predicted by a combination of environmental and climactic data, most notably by
temperature regimes, precipitation, and relative humidity, all of which affect fungal spore
development, release and infection. Starting in 2017, CSRD established a collaboration with
scientists at the University of Passo Fundo (UPF) and EMBRAPA in Brazil, who developed a
preliminary wheat blast predictive model driven by weather data. Plans were put in place to
adapt the model to Bangladesh and test it at a large scale. CSRD released the validated model
for use by DAE to advise farmers how to better and pro-actively manage the disease on
December 5th, 2019.
As part of this collaboration, Professor Mauricio Fernandes and Felipe de Vargas from UPF
visited Jashore, Bangladesh from 21 February to 5 March 2019. They delivered a lecture to the
Bangladesh Wheat and Maize Research Institute (BWMRI) at a wheat blast training in Jashore,
interacted with scientists and overviewed the progress of spore trapping and processing efforts
and blast lesion microscopy. The training disseminated the basic techniques of identifying and
culturing pathogens and field inoculation and disease scoring, and enabled the participants to
share their experiences on combating the disease. Thirty five wheat scientists from China, India
and Nepal as well as from BWMRI, DAE and CIMMYT in Bangladesh participated in the training.
They made field visits to Meherpur to meet wheat farmers and survey for wheat blast.
During their stay in Bangladesh, the UPF scientists worked with the CSRD focal persons at
BMD from 25-27 February 2019 to incorporate BMD generated WRF forecasts into the CSRD-
developed wheat blast early warning system. In this regard Mr. Qamrul and or Bazlur Rashid
from BMD worked with the
visitors and have successfully
incorporated the WRF
forecasts into the early
warning system. In addition,
this early warning system has
had benefits outside South
Asia as the collaborating
scientists have developed the
same forecasting system for
disease in Brazil.
During 2019, work continued
to improve the wheat blast
early warning system. The
CSRD team collaborated
remotely with the Brazilian
scientists. Finally, in
December 2019 Professor
Photo 2.2: Left to right: Prof. Mauricio Fernandes (UPF and
EMBRAPA), Mr. Shamsuddin Ahmed, Director of BMD, Dr. Wais Kabir, Director of Krishi Gobeshona Foundation, and Dr.
Israil Hossain, Director of BWMRI officially recognize and
endorse use of the CSRD supported and meteorological forecast-driven early warning system for wheat blast in Dhaka
on 5 December 2019.
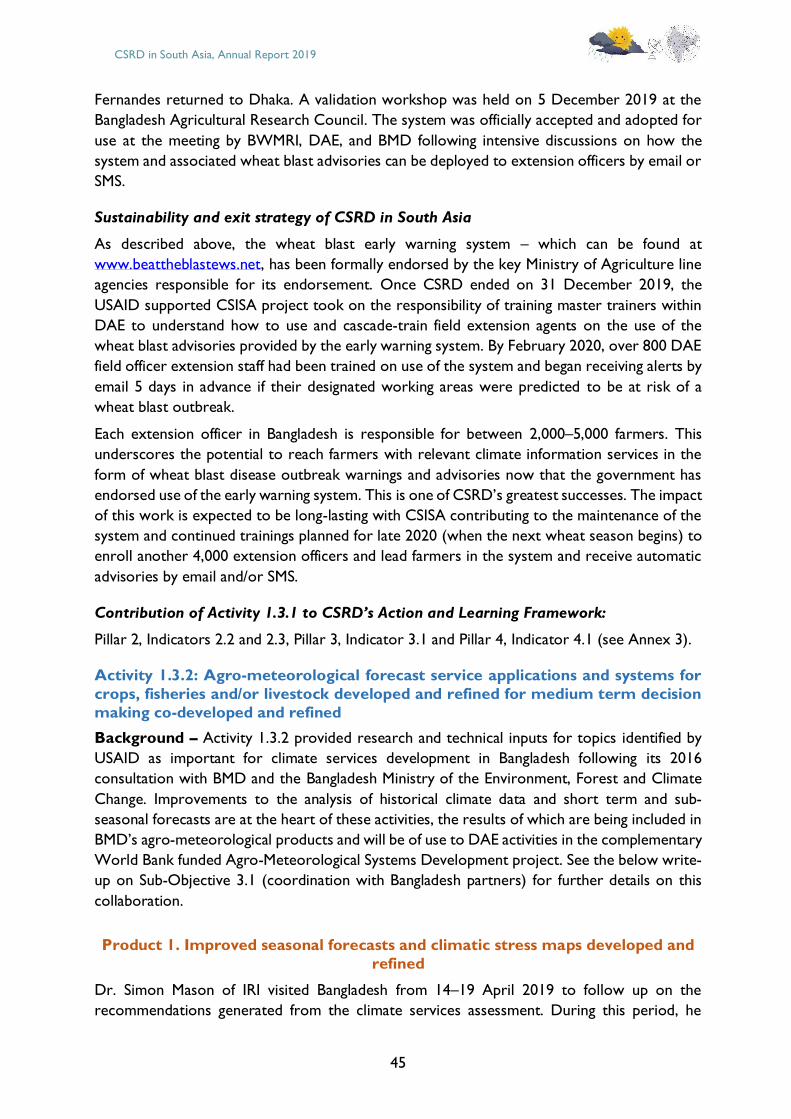
CSRD in South Asia, Annual Report 2019
45
Fernandes returned to Dhaka. A validation workshop was held on 5 December 2019 at the
Bangladesh Agricultural Research Council. The system was officially accepted and adopted for
use at the meeting by BWMRI, DAE, and BMD following intensive discussions on how the
system and associated wheat blast advisories can be deployed to extension officers by email or
SMS.
Sustainability and exit strategy of CSRD in South Asia
As described above, the wheat blast early warning system – which can be found at
www.beattheblastews.net, has been formally endorsed by the key Ministry of Agriculture line
agencies responsible for its endorsement. Once CSRD ended on 31 December 2019, the
USAID supported CSISA project took on the responsibility of training master trainers within
DAE to understand how to use and cascade-train field extension agents on the use of the
wheat blast advisories provided by the early warning system. By February 2020, over 800 DAE
field officer extension staff had been trained on use of the system and began receiving alerts by
email 5 days in advance if their designated working areas were predicted to be at risk of a
wheat blast outbreak.
Each extension officer in Bangladesh is responsible for between 2,000–5,000 farmers. This
underscores the potential to reach farmers with relevant climate information services in the
form of wheat blast disease outbreak warnings and advisories now that the government has
endorsed use of the early warning system. This is one of CSRD’s greatest successes. The impact
of this work is expected to be long-lasting with CSISA contributing to the maintenance of the
system and continued trainings planned for late 2020 (when the next wheat season begins) to
enroll another 4,000 extension officers and lead farmers in the system and receive automatic
advisories by email and/or SMS.
Contribution of Activity 1.3.1 to CSRD’s Action and Learning Framework:
Pillar 2, Indicators 2.2 and 2.3, Pillar 3, Indicator 3.1 and Pillar 4, Indicator 4.1 (see Annex 3).
Activity 1.3.2: Agro-meteorological forecast service applications and systems for
crops, fisheries and/or livestock developed and refined for medium term decision
making co-developed and refined
Background – Activity 1.3.2 provided research and technical inputs for topics identified by
USAID as important for climate services development in Bangladesh following its 2016
consultation with BMD and the Bangladesh Ministry of the Environment, Forest and Climate
Change. Improvements to the analysis of historical climate data and short term and sub-
seasonal forecasts are at the heart of these activities, the results of which are being included in
BMD’s agro-meteorological products and will be of use to DAE activities in the complementary
World Bank funded Agro-Meteorological Systems Development project. See the below write-
up on Sub-Objective 3.1 (coordination with Bangladesh partners) for further details on this
collaboration.
Product 1. Improved seasonal forecasts and climatic stress maps developed and
refined
Dr. Simon Mason of IRI visited Bangladesh from 14–19 April 2019 to follow up on the
recommendations generated from the climate services assessment. During this period, he
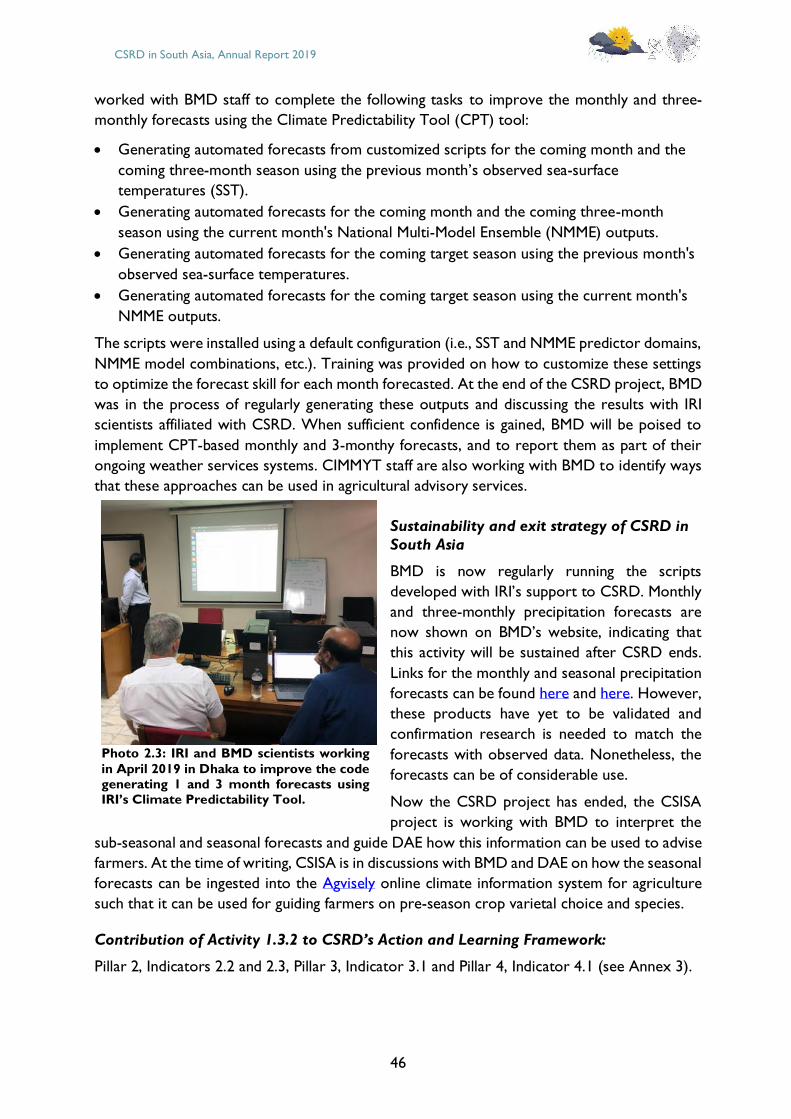
CSRD in South Asia, Annual Report 2019
46
worked with BMD staff to complete the following tasks to improve the monthly and three-
monthly forecasts using the Climate Predictability Tool (CPT) tool:
• Generating automated forecasts from customized scripts for the coming month and the
coming three-month season using the previous month’s observed sea-surface
temperatures (SST).
• Generating automated forecasts for the coming month and the coming three-month
season using the current month's National Multi-Model Ensemble (NMME) outputs.
• Generating automated forecasts for the coming target season using the previous month's
observed sea-surface temperatures.
• Generating automated forecasts for the coming target season using the current month's
NMME outputs.
The scripts were installed using a default configuration (i.e., SST and NMME predictor domains,
NMME model combinations, etc.). Training was provided on how to customize these settings
to optimize the forecast skill for each month forecasted. At the end of the CSRD project, BMD
was in the process of regularly generating these outputs and discussing the results with IRI
scientists affiliated with CSRD. When sufficient confidence is gained, BMD will be poised to
implement CPT-based monthly and 3-monthy forecasts, and to report them as part of their
ongoing weather services systems. CIMMYT staff are also working with BMD to identify ways
that these approaches can be used in agricultural advisory services.
Sustainability and exit strategy of CSRD in
South Asia
BMD is now regularly running the scripts
developed with IRI’s support to CSRD. Monthly
and three-monthly precipitation forecasts are
now shown on BMD’s website, indicating that
this activity will be sustained after CSRD ends.
Links for the monthly and seasonal precipitation
forecasts can be found here and here. However,
these products have yet to be validated and
confirmation research is needed to match the
forecasts with observed data. Nonetheless, the
forecasts can be of considerable use.
Now the CSRD project has ended, the CSISA
project is working with BMD to interpret the
sub-seasonal and seasonal forecasts and guide DAE how this information can be used to advise
farmers. At the time of writing, CSISA is in discussions with BMD and DAE on how the seasonal
forecasts can be ingested into the Agvisely online climate information system for agriculture
such that it can be used for guiding farmers on pre-season crop varietal choice and species.
Contribution of Activity 1.3.2 to CSRD’s Action and Learning Framework:
Pillar 2, Indicators 2.2 and 2.3, Pillar 3, Indicator 3.1 and Pillar 4, Indicator 4.1 (see Annex 3).
Photo 2.3: IRI and BMD scientists working
in April 2019 in Dhaka to improve the code generating 1 and 3 month forecasts using IRI’s Climate Predictability Tool.
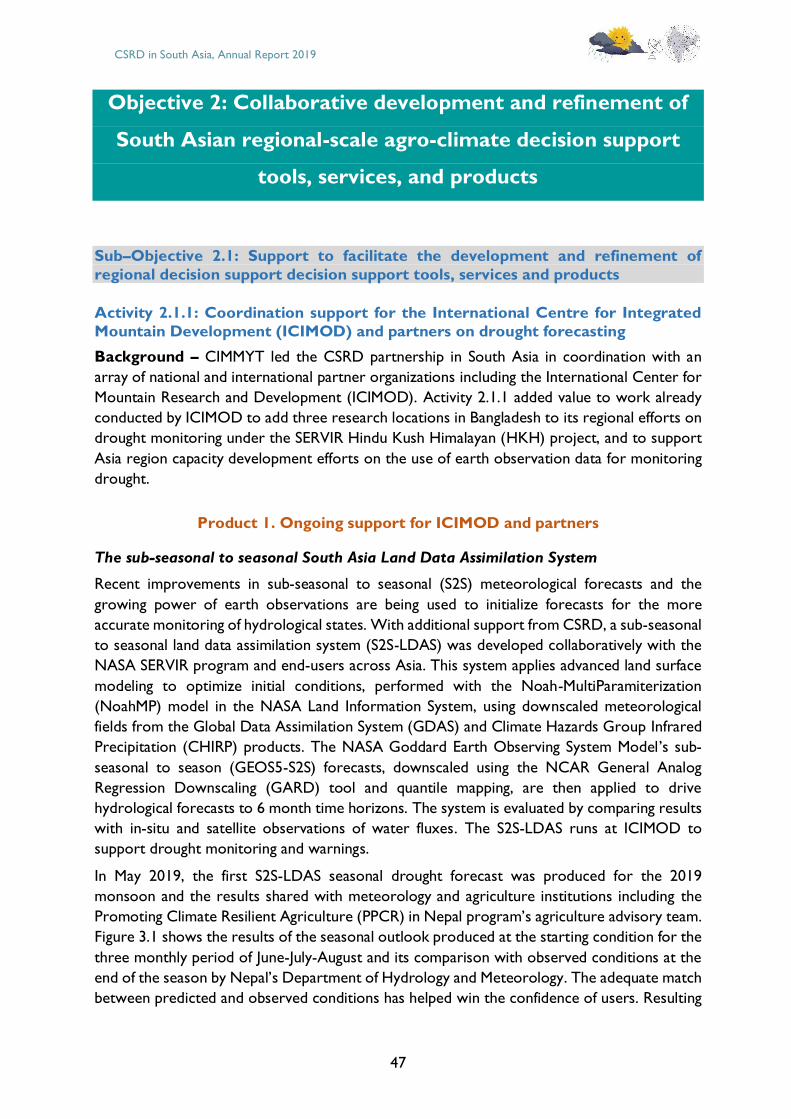
CSRD in South Asia, Annual Report 2019
47
Objective 2: Collaborative development and refinement of
South Asian regional-scale agro-climate decision support
tools, services, and products
Sub–Objective 2.1: Support to facilitate the development and refinement of
regional decision support decision support tools, services and products
Activity 2.1.1: Coordination support for the International Centre for Integrated
Mountain Development (ICIMOD) and partners on drought forecasting
Background – CIMMYT led the CSRD partnership in South Asia in coordination with an
array of national and international partner organizations including the International Center for
Mountain Research and Development (ICIMOD). Activity 2.1.1 added value to work already
conducted by ICIMOD to add three research locations in Bangladesh to its regional efforts on
drought monitoring under the SERVIR Hindu Kush Himalayan (HKH) project, and to support
Asia region capacity development efforts on the use of earth observation data for monitoring
drought.
Product 1. Ongoing support for ICIMOD and partners
The sub-seasonal to seasonal South Asia Land Data Assimilation System
Recent improvements in sub-seasonal to seasonal (S2S) meteorological forecasts and the
growing power of earth observations are being used to initialize forecasts for the more
accurate monitoring of hydrological states. With additional support from CSRD, a sub-seasonal
to seasonal land data assimilation system (S2S-LDAS) was developed collaboratively with the
NASA SERVIR program and end-users across Asia. This system applies advanced land surface
modeling to optimize initial conditions, performed with the Noah-MultiParamiterization
(NoahMP) model in the NASA Land Information System, using downscaled meteorological
fields from the Global Data Assimilation System (GDAS) and Climate Hazards Group Infrared
Precipitation (CHIRP) products. The NASA Goddard Earth Observing System Model’s sub-
seasonal to season (GEOS5-S2S) forecasts, downscaled using the NCAR General Analog
Regression Downscaling (GARD) tool and quantile mapping, are then applied to drive
hydrological forecasts to 6 month time horizons. The system is evaluated by comparing results
with in-situ and satellite observations of water fluxes. The S2S-LDAS runs at ICIMOD to
support drought monitoring and warnings.
In May 2019, the first S2S-LDAS seasonal drought forecast was produced for the 2019
monsoon and the results shared with meteorology and agriculture institutions including the
Promoting Climate Resilient Agriculture (PPCR) in Nepal program’s agriculture advisory team.
Figure 3.1 shows the results of the seasonal outlook produced at the starting condition for the
three monthly period of June-July-August and its comparison with observed conditions at the
end of the season by Nepal’s Department of Hydrology and Meteorology. The adequate match
between predicted and observed conditions has helped win the confidence of users. Resulting
CSRD in South Asia, Annual Report 2019
48
seasonal outputs from this work can be found at
http://tethys.icimod.org/apps/sldasdataforecast/.
Figure 3.1: Regional seasonal outlook based on the condition in April 2019 produced on 7 May
2019 and its comparison with observed data in Nepal
Agricultural drought watch for South Asia: Data exploration and information portal
launched
RDMOS – The Regional Drought Monitoring and Outlook System (RDMOS) application was
launched on 29 July 2019 at a four day workshop to train agriculture and meteorology
professionals on its use for monitoring and assessing drought in Islamabad, Pakistan.
Photo 2.4: An orientation workshop on Regional Drought Monitoring and Outlook System held in 2019 in Islamabad, Pakistan demonstrated the functions of the system and gathered feedback
on its usability (ICIMOD)
Officials from SAARC member states attended the inauguration workshop, which was
organized by the SAARC Agriculture Centre, ICIMOD, the Pakistan Agriculture Research
Council (PARC), and the Pakistan Meteorological Department (PMD). The training was based
on a comprehensive resource book produced by the SAARC Agriculture Centre, CIMMYT
and ICIMOD. It was attended by 10 participants from Afghanistan, Bangladesh, Maldives, Nepal,
Sri Lanka, and 25 participants from Pakistani agriculture and meteorology institutions.
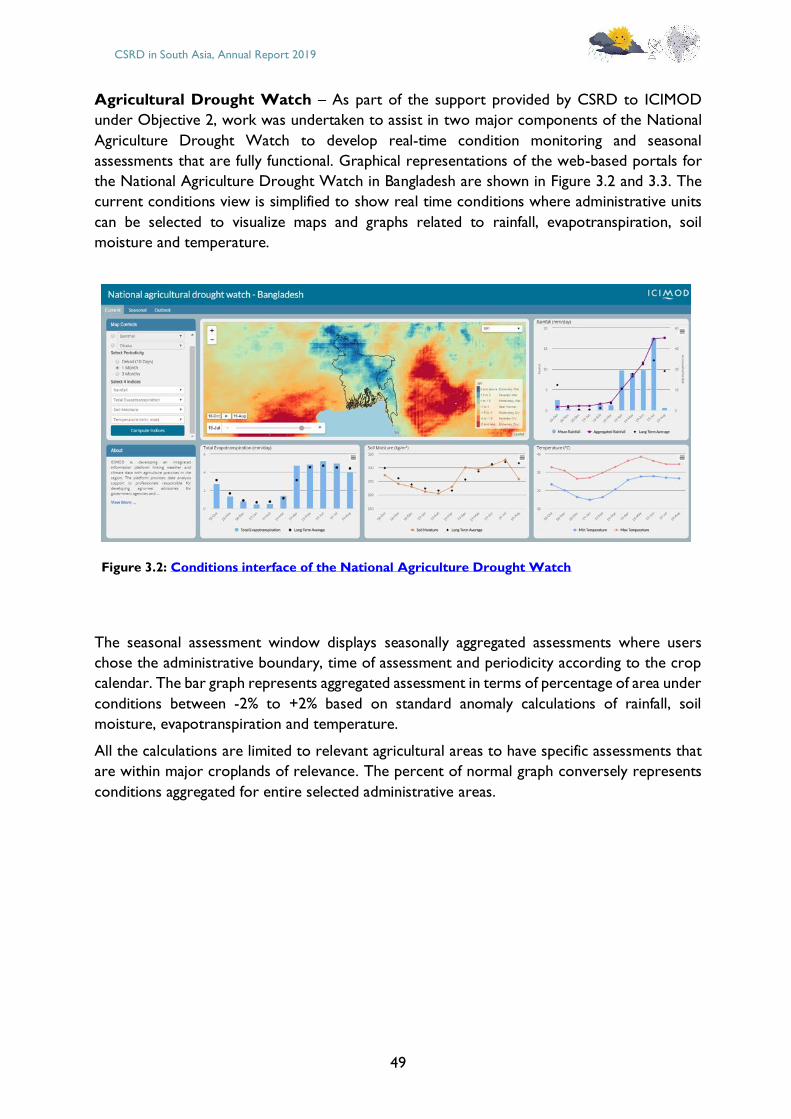
CSRD in South Asia, Annual Report 2019
49
Agricultural Drought Watch – As part of the support provided by CSRD to ICIMOD
under Objective 2, work was undertaken to assist in two major components of the National
Agriculture Drought Watch to develop real-time condition monitoring and seasonal
assessments that are fully functional. Graphical representations of the web-based portals for
the National Agriculture Drought Watch in Bangladesh are shown in Figure 3.2 and 3.3. The
current conditions view is simplified to show real time conditions where administrative units
can be selected to visualize maps and graphs related to rainfall, evapotranspiration, soil
moisture and temperature.
Figure 3.2: Conditions interface of the National Agriculture Drought Watch
The seasonal assessment window displays seasonally aggregated assessments where users
chose the administrative boundary, time of assessment and periodicity according to the crop
calendar. The bar graph represents aggregated assessment in terms of percentage of area under
conditions between -2% to +2% based on standard anomaly calculations of rainfall, soil
moisture, evapotranspiration and temperature.
All the calculations are limited to relevant agricultural areas to have specific assessments that
are within major croplands of relevance. The percent of normal graph conversely represents
conditions aggregated for entire selected administrative areas.
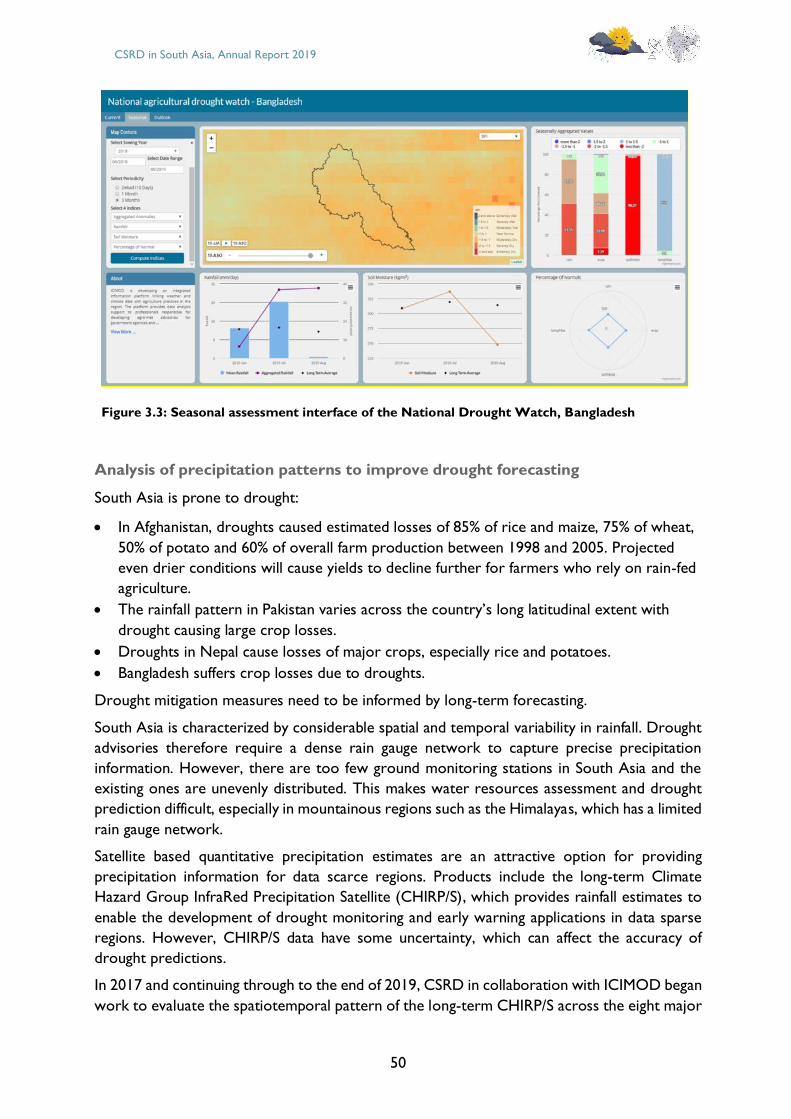
CSRD in South Asia, Annual Report 2019
50
Figure 3.3: Seasonal assessment interface of the National Drought Watch, Bangladesh
Analysis of precipitation patterns to improve drought forecasting
South Asia is prone to drought:
• In Afghanistan, droughts caused estimated losses of 85% of rice and maize, 75% of wheat,
50% of potato and 60% of overall farm production between 1998 and 2005. Projected
even drier conditions will cause yields to decline further for farmers who rely on rain-fed
agriculture.
• The rainfall pattern in Pakistan varies across the country’s long latitudinal extent with
drought causing large crop losses.
• Droughts in Nepal cause losses of major crops, especially rice and potatoes.
• Bangladesh suffers crop losses due to droughts.
Drought mitigation measures need to be informed by long-term forecasting.
South Asia is characterized by considerable spatial and temporal variability in rainfall. Drought
advisories therefore require a dense rain gauge network to capture precise precipitation
information. However, there are too few ground monitoring stations in South Asia and the
existing ones are unevenly distributed. This makes water resources assessment and drought
prediction difficult, especially in mountainous regions such as the Himalayas, which has a limited
rain gauge network.
Satellite based quantitative precipitation estimates are an attractive option for providing
precipitation information for data scarce regions. Products include the long-term Climate
Hazard Group InfraRed Precipitation Satellite (CHIRP/S), which provides rainfall estimates to
enable the development of drought monitoring and early warning applications in data sparse
regions. However, CHIRP/S data have some uncertainty, which can affect the accuracy of
drought predictions.
In 2017 and continuing through to the end of 2019, CSRD in collaboration with ICIMOD began
work to evaluate the spatiotemporal pattern of the long-term CHIRP/S across the eight major
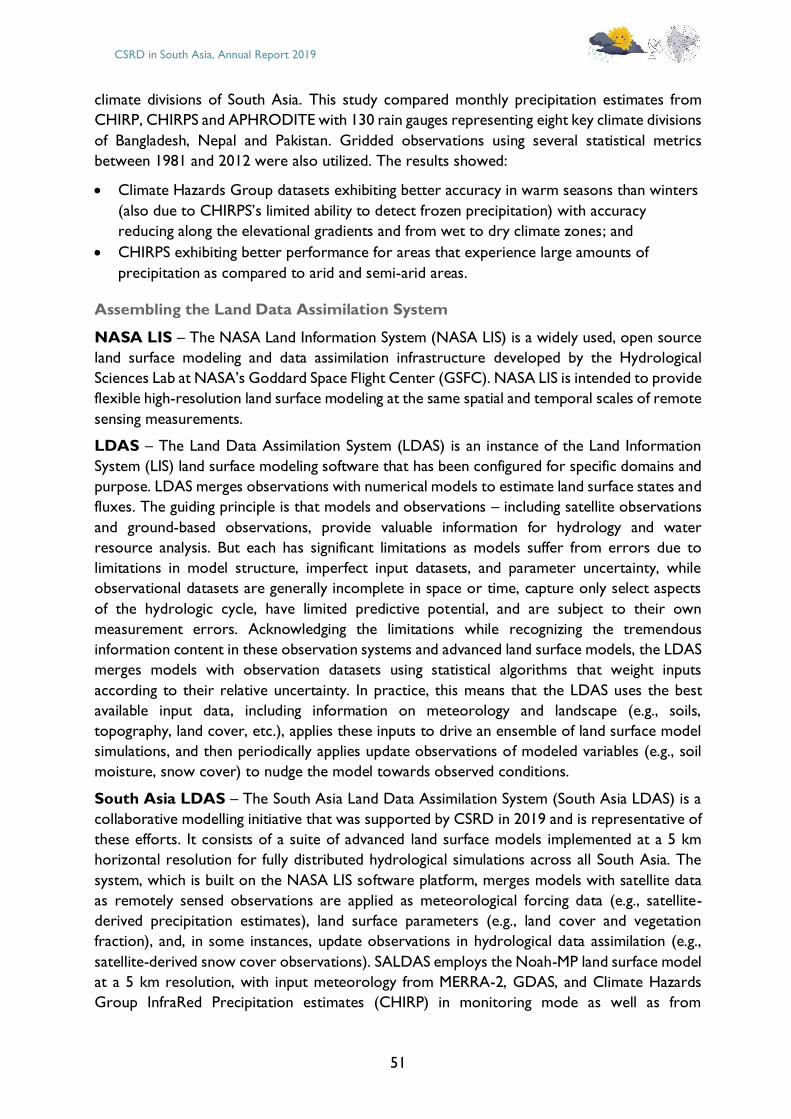
CSRD in South Asia, Annual Report 2019
51
climate divisions of South Asia. This study compared monthly precipitation estimates from
CHIRP, CHIRPS and APHRODITE with 130 rain gauges representing eight key climate divisions
of Bangladesh, Nepal and Pakistan. Gridded observations using several statistical metrics
between 1981 and 2012 were also utilized. The results showed:
• Climate Hazards Group datasets exhibiting better accuracy in warm seasons than winters
(also due to CHIRPS’s limited ability to detect frozen precipitation) with accuracy
reducing along the elevational gradients and from wet to dry climate zones; and
• CHIRPS exhibiting better performance for areas that experience large amounts of
precipitation as compared to arid and semi-arid areas.
Assembling the Land Data Assimilation System
NASA LIS – The NASA Land Information System (NASA LIS) is a widely used, open source
land surface modeling and data assimilation infrastructure developed by the Hydrological
Sciences Lab at NASA’s Goddard Space Flight Center (GSFC). NASA LIS is intended to provide
flexible high-resolution land surface modeling at the same spatial and temporal scales of remote
sensing measurements.
LDAS – The Land Data Assimilation System (LDAS) is an instance of the Land Information
System (LIS) land surface modeling software that has been configured for specific domains and
purpose. LDAS merges observations with numerical models to estimate land surface states and
fluxes. The guiding principle is that models and observations – including satellite observations
and ground-based observations, provide valuable information for hydrology and water
resource analysis. But each has significant limitations as models suffer from errors due to
limitations in model structure, imperfect input datasets, and parameter uncertainty, while
observational datasets are generally incomplete in space or time, capture only select aspects
of the hydrologic cycle, have limited predictive potential, and are subject to their own
measurement errors. Acknowledging the limitations while recognizing the tremendous
information content in these observation systems and advanced land surface models, the LDAS
merges models with observation datasets using statistical algorithms that weight inputs
according to their relative uncertainty. In practice, this means that the LDAS uses the best
available input data, including information on meteorology and landscape (e.g., soils,
topography, land cover, etc.), applies these inputs to drive an ensemble of land surface model
simulations, and then periodically applies update observations of modeled variables (e.g., soil
moisture, snow cover) to nudge the model towards observed conditions.
South Asia LDAS – The South Asia Land Data Assimilation System (South Asia LDAS) is a
collaborative modelling initiative that was supported by CSRD in 2019 and is representative of
these efforts. It consists of a suite of advanced land surface models implemented at a 5 km
horizontal resolution for fully distributed hydrological simulations across all South Asia. The
system, which is built on the NASA LIS software platform, merges models with satellite data
as remotely sensed observations are applied as meteorological forcing data (e.g., satellite-
derived precipitation estimates), land surface parameters (e.g., land cover and vegetation
fraction), and, in some instances, update observations in hydrological data assimilation (e.g.,
satellite-derived snow cover observations). SALDAS employs the Noah-MP land surface model
at a 5 km resolution, with input meteorology from MERRA-2, GDAS, and Climate Hazards
Group InfraRed Precipitation estimates (CHIRP) in monitoring mode as well as from
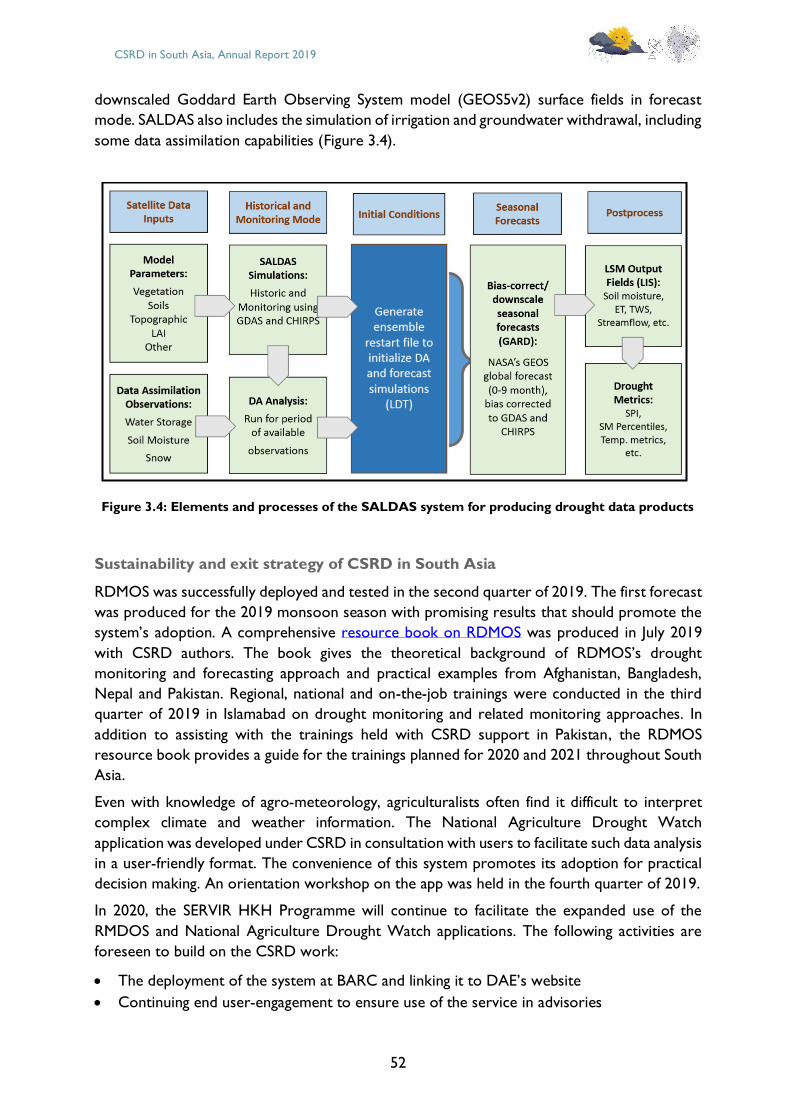
CSRD in South Asia, Annual Report 2019
52
downscaled Goddard Earth Observing System model (GEOS5v2) surface fields in forecast
mode. SALDAS also includes the simulation of irrigation and groundwater withdrawal, including
some data assimilation capabilities (Figure 3.4).
Figure 3.4: Elements and processes of the SALDAS system for producing drought data products
Sustainability and exit strategy of CSRD in South Asia
RDMOS was successfully deployed and tested in the second quarter of 2019. The first forecast
was produced for the 2019 monsoon season with promising results that should promote the
system’s adoption. A comprehensive resource book on RDMOS was produced in July 2019
with CSRD authors. The book gives the theoretical background of RDMOS’s drought
monitoring and forecasting approach and practical examples from Afghanistan, Bangladesh,
Nepal and Pakistan. Regional, national and on-the-job trainings were conducted in the third
quarter of 2019 in Islamabad on drought monitoring and related monitoring approaches. In
addition to assisting with the trainings held with CSRD support in Pakistan, the RDMOS
resource book provides a guide for the trainings planned for 2020 and 2021 throughout South
Asia.
Even with knowledge of agro-meteorology, agriculturalists often find it difficult to interpret
complex climate and weather information. The National Agriculture Drought Watch
application was developed under CSRD in consultation with users to facilitate such data analysis
in a user-friendly format. The convenience of this system promotes its adoption for practical
decision making. An orientation workshop on the app was held in the fourth quarter of 2019.
In 2020, the SERVIR HKH Programme will continue to facilitate the expanded use of the
RMDOS and National Agriculture Drought Watch applications. The following activities are
foreseen to build on the CSRD work:
• The deployment of the system at BARC and linking it to DAE’s website
• Continuing end user-engagement to ensure use of the service in advisories
CSRD in South Asia, Annual Report 2019
53
• The probabilistic visualization of ensemble forecasts in the RDMOS.
Contribution of Activity 2.1.1 to CSRD’s Action and Learning Framework:
Pillar 1, Indicator 1.1, Pillar 2, Indicator 2.2, and Pillar 4, Indicator 4.1 (see Annex 3).
Activity 2.1.2. Regional learning platform for climactically refined decision support
tools to support integrated disease management in lentils in smallholder farming systems
Background – The productivity of lentils (Lens culinaris) in South Asia is severely affected by
diseases, many of which are related to prevailing weather conditions. Stemphylium blight, which
is caused by Stemphylium botryosum, is a threat to lentil production and the livelihoods of many
smallholder farmers in Bangladesh, India and Nepal. Lentils are a popular legume that are
cooked as dhal that is typically eaten with rice and is an important part of nutrition-sensitive
farming systems in South Asia.
Cloudiness, temperature, precipitation and relative humidity directly influence the incidence
and severity of Stemphylium blight in lentils. However, the actual conditions that cause
Stemphylium blight vary considerably between locations within growing seasons and between
seasons within a location. This makes it challenging to develop climate services to support
integrated disease management for lentils. While applying foliar fungicides can control the
disease, uncertain weather forecasts challenge the rational application of fungicide. The
application of too much fungicide negatively affects farmers’ profits and has negative
environmental consequences.
Since late 2017, CSRD has supported the development of a Stempedia disease forecasting
model in response to the above issues. CSRD has supported the field testing and calibration of
the model to forecast the regional and seasonal incidence of the disease in South Asia.
Additional assistance was provided by the Cereal Systems Initiative for South Asia (CSISA)
project supported by USAID/Washington in the 2018/19 lentil growing season. The goal of this
work was to use weather forecasts to drive emergency warning systems to inform farmers
when to effectively and efficiently apply foliar fungicide against the disease.
Product 1. Stempedia: Lentil Stemphylium blight disease forecasting systems in
Bangladesh, Nepal, and India13
The Stempedia forecasting model has great potential as a weather-driven tool for forecasting
the occurrence of Stemphylium blight. Large-scale field surveys were conducted in Bangladesh,
India and Nepal during the 2017/18 and 2018/19 growing seasons of the incidence and severity
of the disease. The 2017/18 data were used to calibrate the model while the 2018/19 data were
used to validate it.
Field data collection – In both years, data on Stemphylium blight and other lentil diseases
were collected from 480 farmers’ lentil fields across:
• 32 fields in each of 5 sites (Jashore, Faridpur, Magura, Meherpur and Rajbari) in
13 Note that this work stream replaced the ‘Precision Nutrient Management’ work stream in CSRD in South Asia’s
original scope of work. The change was agreed with USAID in quarter 3 of 2017 because of the potential for rapid
model validation and impact in the context of integrated disease management across Nepal, India, and Bangladesh.
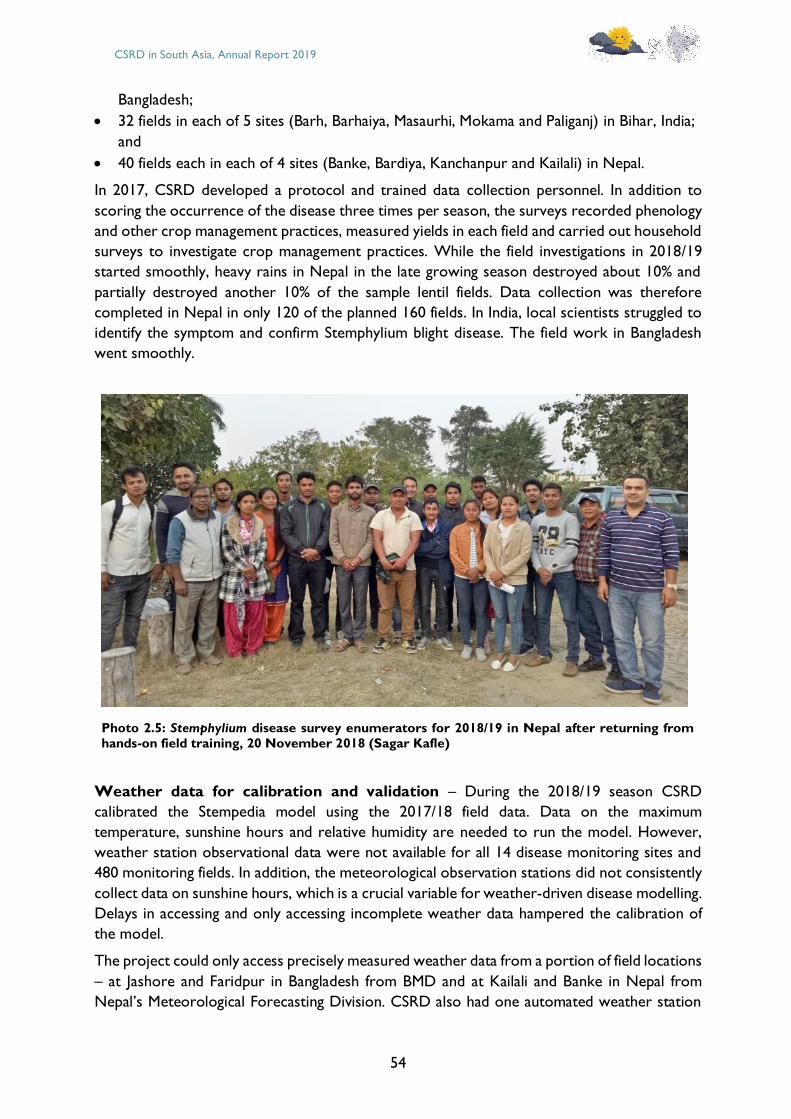
CSRD in South Asia, Annual Report 2019
54
Bangladesh;
• 32 fields in each of 5 sites (Barh, Barhaiya, Masaurhi, Mokama and Paliganj) in Bihar, India;
and
• 40 fields each in each of 4 sites (Banke, Bardiya, Kanchanpur and Kailali) in Nepal.
In 2017, CSRD developed a protocol and trained data collection personnel. In addition to
scoring the occurrence of the disease three times per season, the surveys recorded phenology
and other crop management practices, measured yields in each field and carried out household
surveys to investigate crop management practices. While the field investigations in 2018/19
started smoothly, heavy rains in Nepal in the late growing season destroyed about 10% and
partially destroyed another 10% of the sample lentil fields. Data collection was therefore
completed in Nepal in only 120 of the planned 160 fields. In India, local scientists struggled to
identify the symptom and confirm Stemphylium blight disease. The field work in Bangladesh
went smoothly.
Photo 2.5: Stemphylium disease survey enumerators for 2018/19 in Nepal after returning from hands-on field training, 20 November 2018 (Sagar Kafle)
Weather data for calibration and validation – During the 2018/19 season CSRD
calibrated the Stempedia model using the 2017/18 field data. Data on the maximum
temperature, sunshine hours and relative humidity are needed to run the model. However,
weather station observational data were not available for all 14 disease monitoring sites and
480 monitoring fields. In addition, the meteorological observation stations did not consistently
collect data on sunshine hours, which is a crucial variable for weather-driven disease modelling.
Delays in accessing and only accessing incomplete weather data hampered the calibration of
the model.
The project could only access precisely measured weather data from a portion of field locations
– at Jashore and Faridpur in Bangladesh from BMD and at Kailali and Banke in Nepal from
Nepal’s Meteorological Forecasting Division. CSRD also had one automated weather station
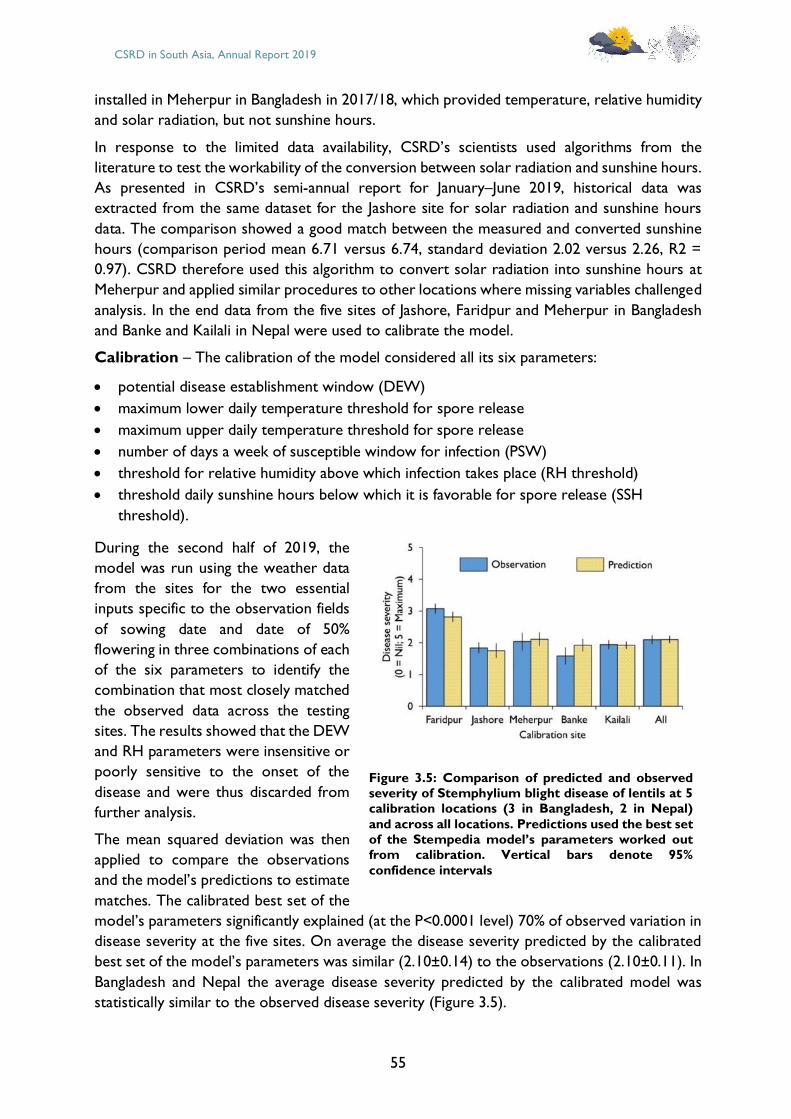
CSRD in South Asia, Annual Report 2019
55
installed in Meherpur in Bangladesh in 2017/18, which provided temperature, relative humidity
and solar radiation, but not sunshine hours.
In response to the limited data availability, CSRD’s scientists used algorithms from the
literature to test the workability of the conversion between solar radiation and sunshine hours.
As presented in CSRD’s semi-annual report for January–June 2019, historical data was
extracted from the same dataset for the Jashore site for solar radiation and sunshine hours
data. The comparison showed a good match between the measured and converted sunshine
hours (comparison period mean 6.71 versus 6.74, standard deviation 2.02 versus 2.26, R2 =
0.97). CSRD therefore used this algorithm to convert solar radiation into sunshine hours at
Meherpur and applied similar procedures to other locations where missing variables challenged
analysis. In the end data from the five sites of Jashore, Faridpur and Meherpur in Bangladesh
and Banke and Kailali in Nepal were used to calibrate the model.
Calibration – The calibration of the model considered all its six parameters:
• potential disease establishment window (DEW)
• maximum lower daily temperature threshold for spore release
• maximum upper daily temperature threshold for spore release
• number of days a week of susceptible window for infection (PSW)
• threshold for relative humidity above which infection takes place (RH threshold)
• threshold daily sunshine hours below which it is favorable for spore release (SSH
threshold).
During the second half of 2019, the
model was run using the weather data
from the sites for the two essential
inputs specific to the observation fields
of sowing date and date of 50%
flowering in three combinations of each
of the six parameters to identify the
combination that most closely matched
the observed data across the testing
sites. The results showed that the DEW
and RH parameters were insensitive or
poorly sensitive to the onset of the
disease and were thus discarded from
further analysis.
The mean squared deviation was then
applied to compare the observations
and the model’s predictions to estimate
matches. The calibrated best set of the
model’s parameters significantly explained (at the P<0.0001 level) 70% of observed variation in
disease severity at the five sites. On average the disease severity predicted by the calibrated
best set of the model’s parameters was similar (2.10±0.14) to the observations (2.10±0.11). In
Bangladesh and Nepal the average disease severity predicted by the calibrated model was
statistically similar to the observed disease severity (Figure 3.5).
Figure 3.5: Comparison of predicted and observed severity of Stemphylium blight disease of lentils at 5 calibration locations (3 in Bangladesh, 2 in Nepal)
and across all locations. Predictions used the best set
of the Stempedia model’s parameters worked out from calibration. Vertical bars denote 95%
confidence intervals
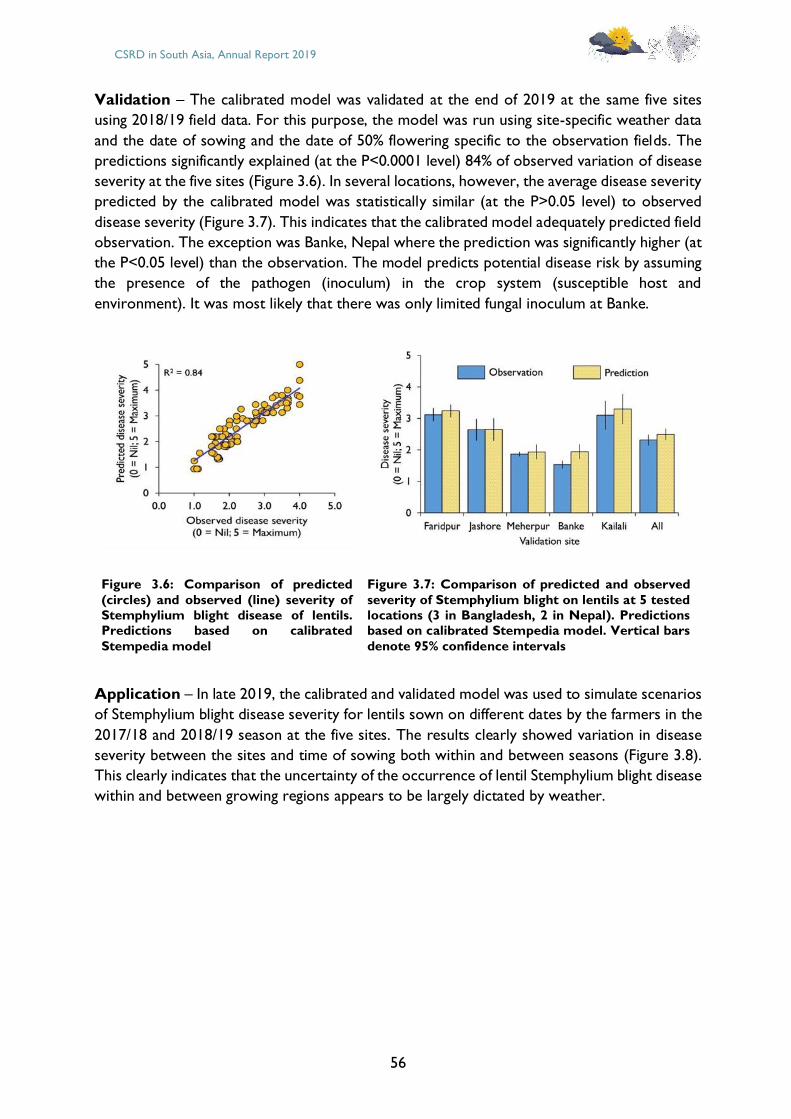
CSRD in South Asia, Annual Report 2019
56
Validation – The calibrated model was validated at the end of 2019 at the same five sites
using 2018/19 field data. For this purpose, the model was run using site-specific weather data
and the date of sowing and the date of 50% flowering specific to the observation fields. The
predictions significantly explained (at the P<0.0001 level) 84% of observed variation of disease
severity at the five sites (Figure 3.6). In several locations, however, the average disease severity
predicted by the calibrated model was statistically similar (at the P>0.05 level) to observed
disease severity (Figure 3.7). This indicates that the calibrated model adequately predicted field
observation. The exception was Banke, Nepal where the prediction was significantly higher (at
the P<0.05 level) than the observation. The model predicts potential disease risk by assuming
the presence of the pathogen (inoculum) in the crop system (susceptible host and
environment). It was most likely that there was only limited fungal inoculum at Banke.
Application – In late 2019, the calibrated and validated model was used to simulate scenarios
of Stemphylium blight disease severity for lentils sown on different dates by the farmers in the
2017/18 and 2018/19 season at the five sites. The results clearly showed variation in disease
severity between the sites and time of sowing both within and between seasons (Figure 3.8).
This clearly indicates that the uncertainty of the occurrence of lentil Stemphylium blight disease
within and between growing regions appears to be largely dictated by weather.
Figure 3.6: Comparison of predicted
(circles) and observed (line) severity of
Stemphylium blight disease of lentils. Predictions based on calibrated
Stempedia model
Figure 3.7: Comparison of predicted and observed
severity of Stemphylium blight on lentils at 5 tested
locations (3 in Bangladesh, 2 in Nepal). Predictions based on calibrated Stempedia model. Vertical bars
denote 95% confidence intervals
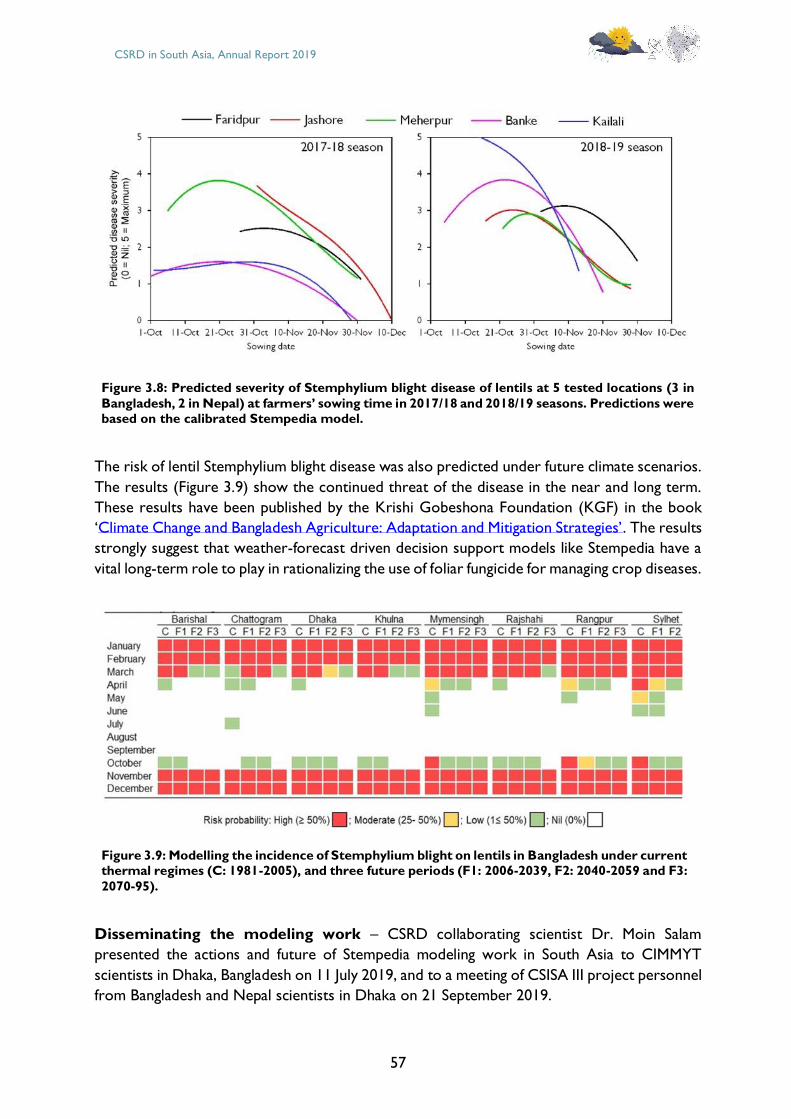
CSRD in South Asia, Annual Report 2019
57
Figure 3.8: Predicted severity of Stemphylium blight disease of lentils at 5 tested locations (3 in
Bangladesh, 2 in Nepal) at farmers’ sowing time in 2017/18 and 2018/19 seasons. Predictions were based on the calibrated Stempedia model.
The risk of lentil Stemphylium blight disease was also predicted under future climate scenarios.
The results (Figure 3.9) show the continued threat of the disease in the near and long term.
These results have been published by the Krishi Gobeshona Foundation (KGF) in the book
‘Climate Change and Bangladesh Agriculture: Adaptation and Mitigation Strategies’. The results
strongly suggest that weather-forecast driven decision support models like Stempedia have a
vital long-term role to play in rationalizing the use of foliar fungicide for managing crop diseases.
Figure 3.9: Modelling the incidence of Stemphylium blight on lentils in Bangladesh under current thermal regimes (C: 1981-2005), and three future periods (F1: 2006-2039, F2: 2040-2059 and F3:
2070-95).
Disseminating the modeling work – CSRD collaborating scientist Dr. Moin Salam
presented the actions and future of Stempedia modeling work in South Asia to CIMMYT
scientists in Dhaka, Bangladesh on 11 July 2019, and to a meeting of CSISA III project personnel
from Bangladesh and Nepal scientists in Dhaka on 21 September 2019.
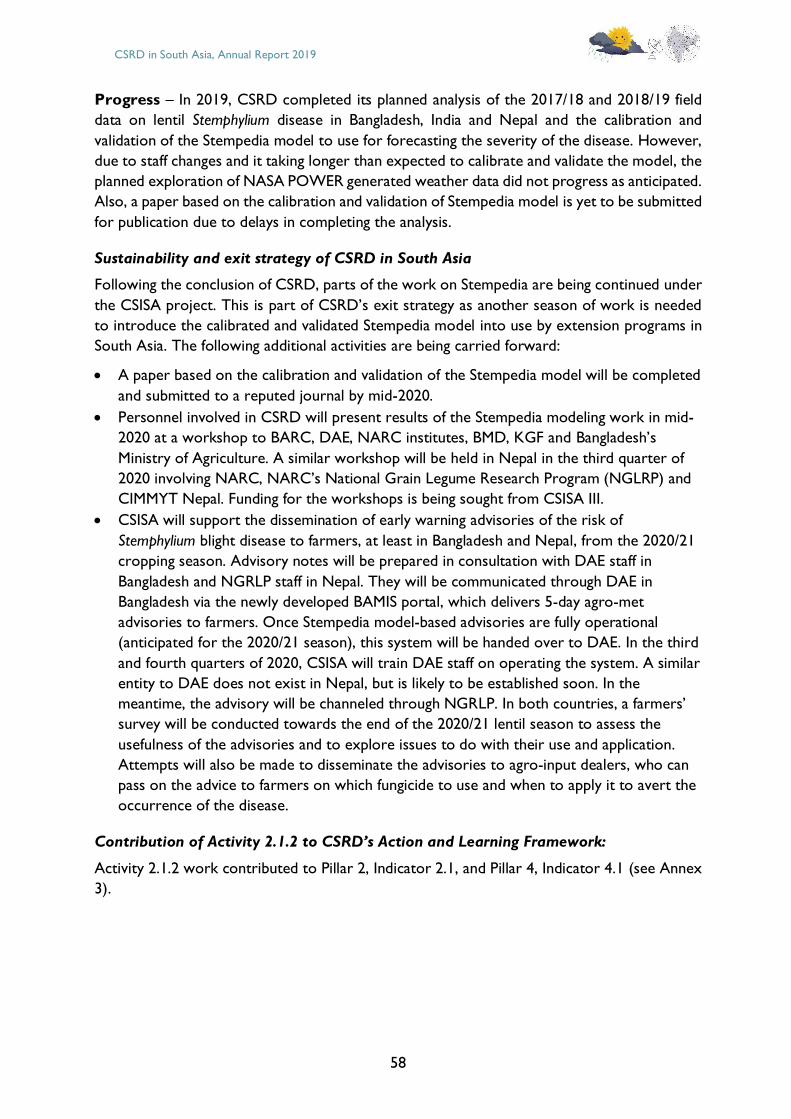
CSRD in South Asia, Annual Report 2019
58
Progress – In 2019, CSRD completed its planned analysis of the 2017/18 and 2018/19 field
data on lentil Stemphylium disease in Bangladesh, India and Nepal and the calibration and
validation of the Stempedia model to use for forecasting the severity of the disease. However,
due to staff changes and it taking longer than expected to calibrate and validate the model, the
planned exploration of NASA POWER generated weather data did not progress as anticipated.
Also, a paper based on the calibration and validation of Stempedia model is yet to be submitted
for publication due to delays in completing the analysis.
Sustainability and exit strategy of CSRD in South Asia
Following the conclusion of CSRD, parts of the work on Stempedia are being continued under
the CSISA project. This is part of CSRD’s exit strategy as another season of work is needed
to introduce the calibrated and validated Stempedia model into use by extension programs in
South Asia. The following additional activities are being carried forward:
• A paper based on the calibration and validation of the Stempedia model will be completed
and submitted to a reputed journal by mid-2020.
• Personnel involved in CSRD will present results of the Stempedia modeling work in mid-
2020 at a workshop to BARC, DAE, NARC institutes, BMD, KGF and Bangladesh’s
Ministry of Agriculture. A similar workshop will be held in Nepal in the third quarter of
2020 involving NARC, NARC’s National Grain Legume Research Program (NGLRP) and
CIMMYT Nepal. Funding for the workshops is being sought from CSISA III.
• CSISA will support the dissemination of early warning advisories of the risk of
Stemphylium blight disease to farmers, at least in Bangladesh and Nepal, from the 2020/21
cropping season. Advisory notes will be prepared in consultation with DAE staff in
Bangladesh and NGRLP staff in Nepal. They will be communicated through DAE in
Bangladesh via the newly developed BAMIS portal, which delivers 5-day agro-met
advisories to farmers. Once Stempedia model-based advisories are fully operational
(anticipated for the 2020/21 season), this system will be handed over to DAE. In the third
and fourth quarters of 2020, CSISA will train DAE staff on operating the system. A similar
entity to DAE does not exist in Nepal, but is likely to be established soon. In the
meantime, the advisory will be channeled through NGRLP. In both countries, a farmers’
survey will be conducted towards the end of the 2020/21 lentil season to assess the
usefulness of the advisories and to explore issues to do with their use and application.
Attempts will also be made to disseminate the advisories to agro-input dealers, who can
pass on the advice to farmers on which fungicide to use and when to apply it to avert the
occurrence of the disease.
Contribution of Activity 2.1.2 to CSRD’s Action and Learning Framework:
Activity 2.1.2 work contributed to Pillar 2, Indicator 2.1, and Pillar 4, Indicator 4.1 (see Annex
3).
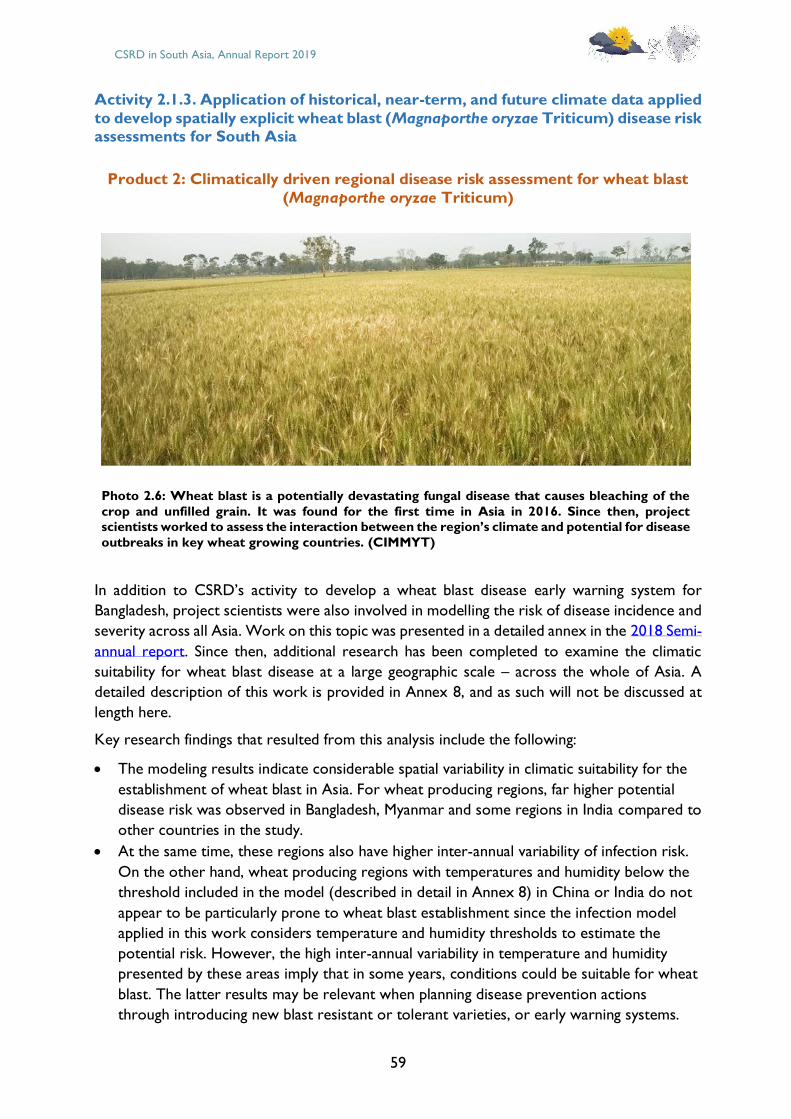
CSRD in South Asia, Annual Report 2019
59
Activity 2.1.3. Application of historical, near-term, and future climate data applied
to develop spatially explicit wheat blast (Magnaporthe oryzae Triticum) disease risk assessments for South Asia
Product 2: Climatically driven regional disease risk assessment for wheat blast
(Magnaporthe oryzae Triticum)
In addition to CSRD’s activity to develop a wheat blast disease early warning system for
Bangladesh, project scientists were also involved in modelling the risk of disease incidence and
severity across all Asia. Work on this topic was presented in a detailed annex in the 2018 Semi-
annual report. Since then, additional research has been completed to examine the climatic
suitability for wheat blast disease at a large geographic scale – across the whole of Asia. A
detailed description of this work is provided in Annex 8, and as such will not be discussed at
length here.
Key research findings that resulted from this analysis include the following:
• The modeling results indicate considerable spatial variability in climatic suitability for the
establishment of wheat blast in Asia. For wheat producing regions, far higher potential
disease risk was observed in Bangladesh, Myanmar and some regions in India compared to
other countries in the study.
• At the same time, these regions also have higher inter-annual variability of infection risk.
On the other hand, wheat producing regions with temperatures and humidity below the
threshold included in the model (described in detail in Annex 8) in China or India do not
appear to be particularly prone to wheat blast establishment since the infection model
applied in this work considers temperature and humidity thresholds to estimate the
potential risk. However, the high inter-annual variability in temperature and humidity
presented by these areas imply that in some years, conditions could be suitable for wheat
blast. The latter results may be relevant when planning disease prevention actions
through introducing new blast resistant or tolerant varieties, or early warning systems.
Photo 2.6: Wheat blast is a potentially devastating fungal disease that causes bleaching of the
crop and unfilled grain. It was found for the first time in Asia in 2016. Since then, project scientists worked to assess the interaction between the region’s climate and potential for disease
outbreaks in key wheat growing countries. (CIMMYT)

CSRD in South Asia, Annual Report 2019
60
Sustainability and exit strategy of CSRD in South Asia
As of December 2019, project scientists are working to publish the climate suitability analysis
for wheat blast in Asia. Following acceptance to a quality scientific journal, the data and codes
developed for this work are expected to be made open access for use by other researchers.
A webinar presenting the results of this work is also under consideration.
Contribution of Activity 2.1.3 to CSRD’s Action and Learning Framework:
Pillar 2, Indicator 2.2, Pillar 4, Indicator 4.1 (see Annex 3).
CSRD in South Asia, Annual Report 2019
61
Objective 3: Coordination with CSRD partners in-country to
ensure progress on the work streams under the CSRD South
Asia and Bangladesh working group
Sub-Objective 3.1. Coordination of Bangladesh CSRD partners
Background – CSRD supported a range of partners in Nepal, Bangladesh, and India through
coordination, training opportunities, and networking across countries. This write-up highlights
CSRD’s work with its partners in 2019, emphasizing the second half of the year.
CSRD and synergies with the World Bank funded Bangladesh Weather and Climate
Services Regional Project
Alongside CSRD, the World Bank has made an additional investment in Bangladesh through
the Bangladesh Weather and Climate Services Regional Project (BWCSRP) that supports BMD,
DAE and the Bangladesh Water Development Board (BWDB) with infrastructural support and
technical capacity development. As described in the Objective 1 write-up, the DAE has taken
on the PICSA activities that were piloted as part of CSRD. This indicates the sustainability of
this intervention as DAE will continue to roll out PICSA trainings partly supported by
BWSCRP. As the lead organization, DAE plans to continue to foster this work in the next two
years with technical collaboration from CIMMYT-Bangladesh and the School of Agriculture,
Policy and Development, University of Reading, UK.
In addition, DAE launched its Bangladesh Agro-Meteorological Information Portal in June 2019
through the World Bank funded Component C of the World Bank's larger investment in
climate services for Bangladesh. Although CSRD cannot claim credit for the portal, it did play
a strategic role in advising and coaching DAE and BMD staff on developing the portal, which
was the subject of considerable discussion in many of CSRD regular project partner meetings
in 2018 and 2019, and during DAE and BMD’s visit to IRI in 2018. The CSRD decision support
tool that provides sub-district level customized advisories for thermal and precipitation
stresses in Bangladesh has been linked to DAE’s portal.
Also:
• BMD now hosts the products developed by CSRD on its Agromet website, and as a co-
founder will continue to provide support to BACS.
• To assure continuation of this work, CIMMYT signed an official memorandum of
understanding with BMD for ongoing activity support in August 2019.
Bringing meteorological data collection into the digital age in Bangladesh
Prior to the CSRD project, most of the meteorological observation stations maintained by
BMD relied on manual measurements. The personnel who maintain BMD’s manual
meteorological observation stations take manual observations of a range of variables including
but not limited to air temperature, relative humidity, sunshine hours, soil temperature every
three-hours. All of these observations were written down by hand by pencil on forms. These
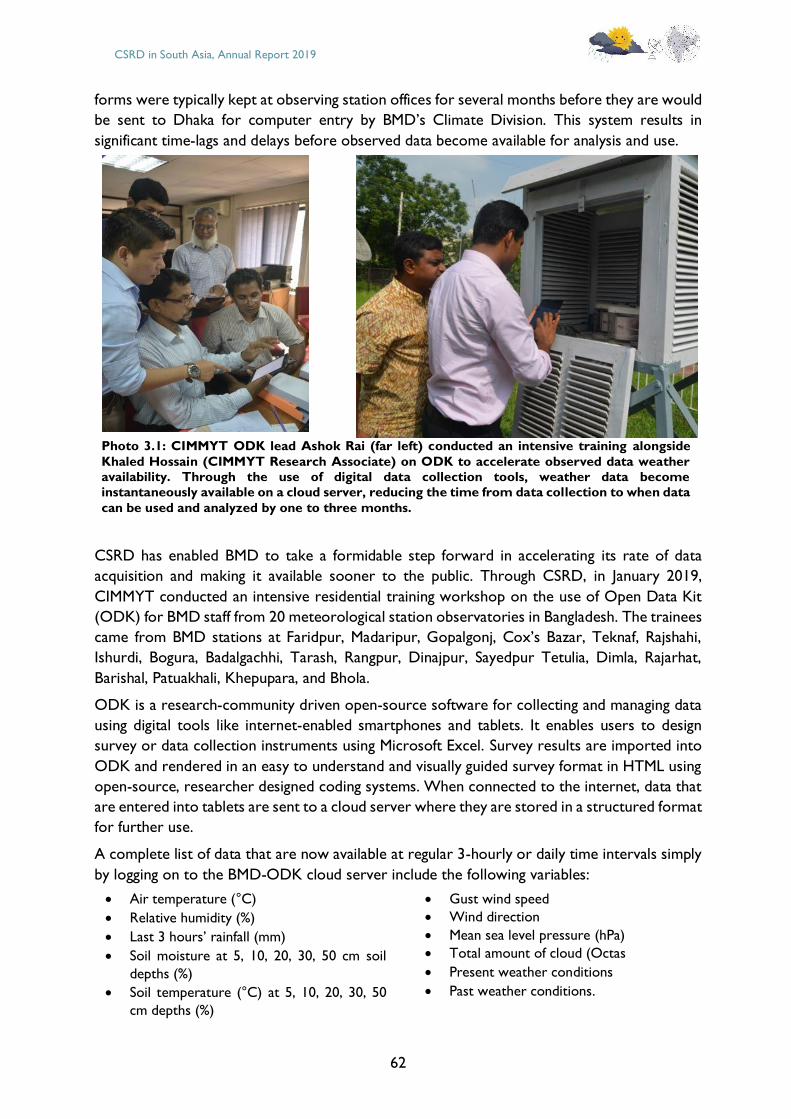
CSRD in South Asia, Annual Report 2019
62
forms were typically kept at observing station offices for several months before they are would
be sent to Dhaka for computer entry by BMD’s Climate Division. This system results in
significant time-lags and delays before observed data become available for analysis and use.
CSRD has enabled BMD to take a formidable step forward in accelerating its rate of data
acquisition and making it available sooner to the public. Through CSRD, in January 2019,
CIMMYT conducted an intensive residential training workshop on the use of Open Data Kit
(ODK) for BMD staff from 20 meteorological station observatories in Bangladesh. The trainees
came from BMD stations at Faridpur, Madaripur, Gopalgonj, Cox’s Bazar, Teknaf, Rajshahi,
Ishurdi, Bogura, Badalgachhi, Tarash, Rangpur, Dinajpur, Sayedpur Tetulia, Dimla, Rajarhat,
Barishal, Patuakhali, Khepupara, and Bhola.
ODK is a research-community driven open-source software for collecting and managing data
using digital tools like internet-enabled smartphones and tablets. It enables users to design
survey or data collection instruments using Microsoft Excel. Survey results are imported into
ODK and rendered in an easy to understand and visually guided survey format in HTML using
open-source, researcher designed coding systems. When connected to the internet, data that
are entered into tablets are sent to a cloud server where they are stored in a structured format
for further use.
A complete list of data that are now available at regular 3-hourly or daily time intervals simply
by logging on to the BMD-ODK cloud server include the following variables:
• Air temperature (°C)
• Relative humidity (%)
• Last 3 hours’ rainfall (mm)
• Soil moisture at 5, 10, 20, 30, 50 cm soil
depths (%)
• Soil temperature (°C) at 5, 10, 20, 30, 50
cm depths (%)
• Gust wind speed
• Wind direction
• Mean sea level pressure (hPa)
• Total amount of cloud (Octas
• Present weather conditions
• Past weather conditions.
Photo 3.1: CIMMYT ODK lead Ashok Rai (far left) conducted an intensive training alongside
Khaled Hossain (CIMMYT Research Associate) on ODK to accelerate observed data weather availability. Through the use of digital data collection tools, weather data become instantaneously available on a cloud server, reducing the time from data collection to when data
can be used and analyzed by one to three months.
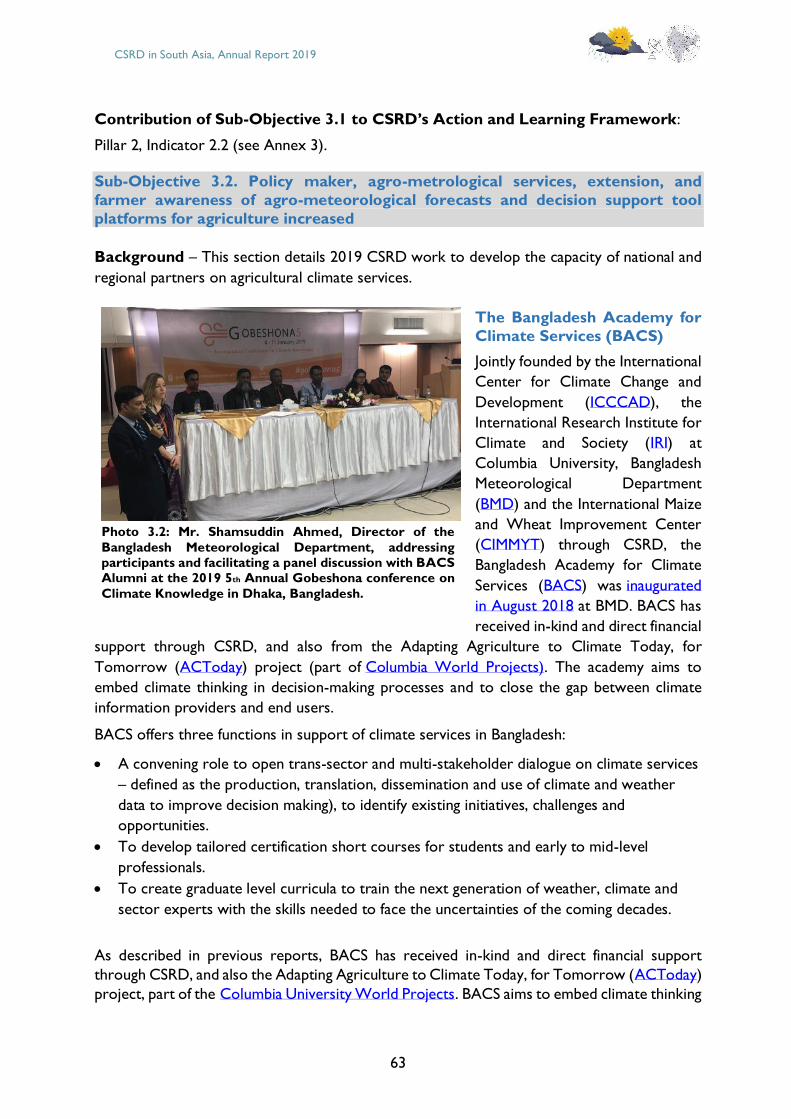
CSRD in South Asia, Annual Report 2019
63
Contribution of Sub-Objective 3.1 to CSRD’s Action and Learning Framework:
Pillar 2, Indicator 2.2 (see Annex 3).
Sub-Objective 3.2. Policy maker, agro-metrological services, extension, and
farmer awareness of agro-meteorological forecasts and decision support tool
platforms for agriculture increased
Background – This section details 2019 CSRD work to develop the capacity of national and
regional partners on agricultural climate services.
The Bangladesh Academy for
Climate Services (BACS)
Jointly founded by the International
Center for Climate Change and
Development (ICCCAD), the
International Research Institute for
Climate and Society (IRI) at
Columbia University, Bangladesh
Meteorological Department
(BMD) and the International Maize
and Wheat Improvement Center
(CIMMYT) through CSRD, the
Bangladesh Academy for Climate
Services (BACS) was inaugurated
in August 2018 at BMD. BACS has
received in-kind and direct financial
support through CSRD, and also from the Adapting Agriculture to Climate Today, for
Tomorrow (ACToday) project (part of Columbia World Projects). The academy aims to
embed climate thinking in decision-making processes and to close the gap between climate
information providers and end users.
BACS offers three functions in support of climate services in Bangladesh:
• A convening role to open trans-sector and multi-stakeholder dialogue on climate services
– defined as the production, translation, dissemination and use of climate and weather
data to improve decision making), to identify existing initiatives, challenges and
opportunities.
• To develop tailored certification short courses for students and early to mid-level
professionals.
• To create graduate level curricula to train the next generation of weather, climate and
sector experts with the skills needed to face the uncertainties of the coming decades.
As described in previous reports, BACS has received in-kind and direct financial support
through CSRD, and also the Adapting Agriculture to Climate Today, for Tomorrow (ACToday)
project, part of the Columbia University World Projects. BACS aims to embed climate thinking
Photo 3.2: Mr. Shamsuddin Ahmed, Director of the
Bangladesh Meteorological Department, addressing participants and facilitating a panel discussion with BACS Alumni at the 2019 5th Annual Gobeshona conference on
Climate Knowledge in Dhaka, Bangladesh.
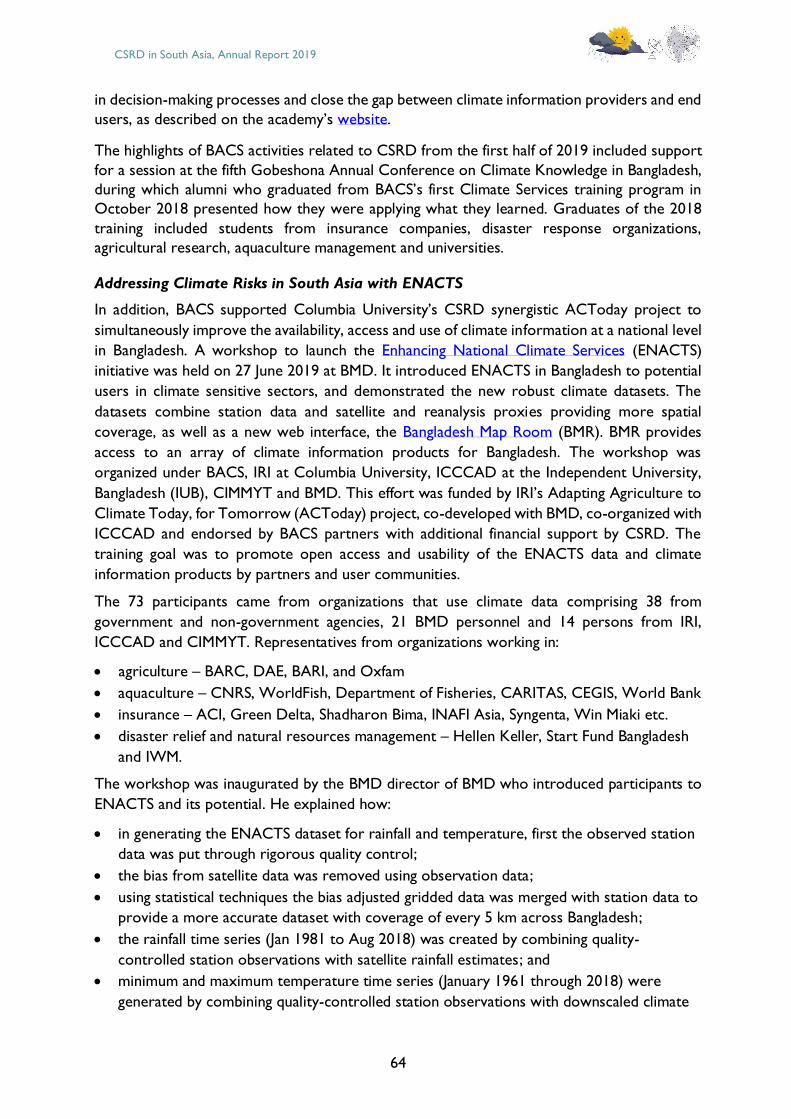
CSRD in South Asia, Annual Report 2019
64
in decision-making processes and close the gap between climate information providers and end
users, as described on the academy’s website.
The highlights of BACS activities related to CSRD from the first half of 2019 included support
for a session at the fifth Gobeshona Annual Conference on Climate Knowledge in Bangladesh,
during which alumni who graduated from BACS’s first Climate Services training program in
October 2018 presented how they were applying what they learned. Graduates of the 2018
training included students from insurance companies, disaster response organizations,
agricultural research, aquaculture management and universities.
Addressing Climate Risks in South Asia with ENACTS
In addition, BACS supported Columbia University’s CSRD synergistic ACToday project to
simultaneously improve the availability, access and use of climate information at a national level
in Bangladesh. A workshop to launch the Enhancing National Climate Services (ENACTS)
initiative was held on 27 June 2019 at BMD. It introduced ENACTS in Bangladesh to potential
users in climate sensitive sectors, and demonstrated the new robust climate datasets. The
datasets combine station data and satellite and reanalysis proxies providing more spatial
coverage, as well as a new web interface, the Bangladesh Map Room (BMR). BMR provides
access to an array of climate information products for Bangladesh. The workshop was
organized under BACS, IRI at Columbia University, ICCCAD at the Independent University,
Bangladesh (IUB), CIMMYT and BMD. This effort was funded by IRI’s Adapting Agriculture to
Climate Today, for Tomorrow (ACToday) project, co-developed with BMD, co-organized with
ICCCAD and endorsed by BACS partners with additional financial support by CSRD. The
training goal was to promote open access and usability of the ENACTS data and climate
information products by partners and user communities.
The 73 participants came from organizations that use climate data comprising 38 from
government and non-government agencies, 21 BMD personnel and 14 persons from IRI,
ICCCAD and CIMMYT. Representatives from organizations working in:
• agriculture – BARC, DAE, BARI, and Oxfam
• aquaculture – CNRS, WorldFish, Department of Fisheries, CARITAS, CEGIS, World Bank
• insurance – ACI, Green Delta, Shadharon Bima, INAFI Asia, Syngenta, Win Miaki etc.
• disaster relief and natural resources management – Hellen Keller, Start Fund Bangladesh
and IWM.
The workshop was inaugurated by the BMD director of BMD who introduced participants to
ENACTS and its potential. He explained how:
• in generating the ENACTS dataset for rainfall and temperature, first the observed station
data was put through rigorous quality control;
• the bias from satellite data was removed using observation data;
• using statistical techniques the bias adjusted gridded data was merged with station data to
provide a more accurate dataset with coverage of every 5 km across Bangladesh;
• the rainfall time series (Jan 1981 to Aug 2018) was created by combining quality-
controlled station observations with satellite rainfall estimates; and
• minimum and maximum temperature time series (January 1961 through 2018) were
generated by combining quality-controlled station observations with downscaled climate
CSRD in South Asia, Annual Report 2019
65
model reanalysis products.
Demonstration of this methodology was followed by discussions on the ENACTS dataset and
products and their use. Participants also discussed how to make potential users aware of the
initiative and how BMD deals with intermittent missing values. Group activities related to
agriculture, aquaculture, insurance and disaster relief discussed the positive and negative
aspects of ENACTS and their implications and discussed how to improve the Map Room.
Photo 3.3: Enhancing National Climate Services (ENACTS) launch workshop, 27 June 2019 at BMD (BACS)
Implementation of CSRD support to ICCCAD in BACS coordinator roles
The Bangladesh Academy for Climate Services is hosted at ICCCAD at the Independent
University of Bangladesh, Dhaka. A sub-component of the Gobeshona network, BACS reports
to the Gobeshona Steering Committee. In August 2019, CSRD provided a sub-grant to
ICCCAD to develop tailored short certification courses for early to mid-level professionals in
climate-sensitive sectors, with an initial focus on food security and nutrition, to address the
needs of stakeholder organization. To streamline the activities of BACS, ICCCAD immediately
appointed Prof. Mizan R. Khan as Coordinator and Tasfia Tasnim as deputy coordinator under
a CIMMYT–ICCCAD contract funded by CSRD. CSRD continued to review and contribute to
BACS activity progress and reports. A Google group was formed in mid-2019 to facilitate
regular communication among BACS Executive Committee members with monthly Skype calls
to discuss related activities.
Training dialogue – The second BACS Training Dialogue on Introduction to Climate
Information Service for Aquaculture and Agriculture was held 27–31 October 2019 at BMD,
Dhaka. CSRD supported reporting and session delivery. The ICCCAD team worked closely
with IRI and other BACS partners to develop the training modules. At the same time a BACS
alumni dinner discussion was held on 29 October 2019 as part of October 2018 training follow-
up activities. The course was mainly designed for persons working in aquaculture value chains
to improve their understanding of the use of climate services for aquaculture.
Capacitating Farmers and Fishers to Manage Climate Risks in South Asia (CaFFSA)
The CaFFSA project is developing, testing and delivering innovative climate services to 330,000
farm households in India and 150,000 fish-farming households in Bangladesh. The lead
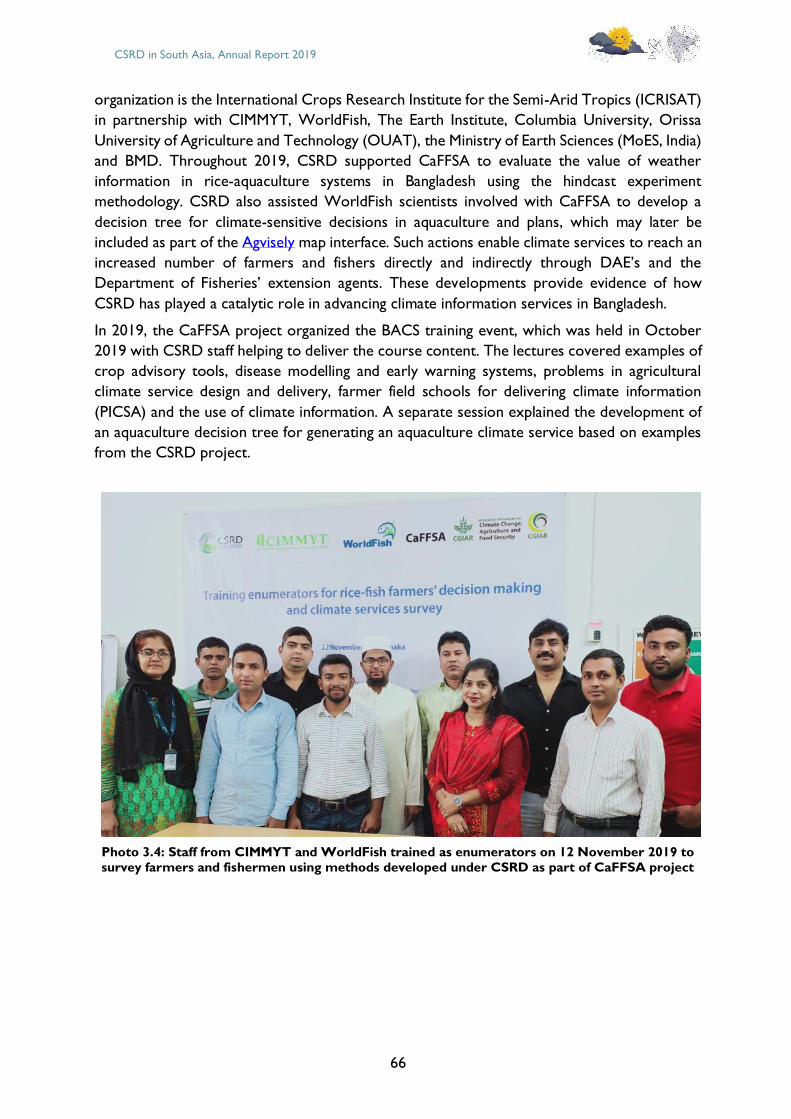
CSRD in South Asia, Annual Report 2019
66
organization is the International Crops Research Institute for the Semi-Arid Tropics (ICRISAT)
in partnership with CIMMYT, WorldFish, The Earth Institute, Columbia University, Orissa
University of Agriculture and Technology (OUAT), the Ministry of Earth Sciences (MoES, India)
and BMD. Throughout 2019, CSRD supported CaFFSA to evaluate the value of weather
information in rice-aquaculture systems in Bangladesh using the hindcast experiment
methodology. CSRD also assisted WorldFish scientists involved with CaFFSA to develop a
decision tree for climate-sensitive decisions in aquaculture and plans, which may later be
included as part of the Agvisely map interface. Such actions enable climate services to reach an
increased number of farmers and fishers directly and indirectly through DAE’s and the
Department of Fisheries’ extension agents. These developments provide evidence of how
CSRD has played a catalytic role in advancing climate information services in Bangladesh.
In 2019, the CaFFSA project organized the BACS training event, which was held in October
2019 with CSRD staff helping to deliver the course content. The lectures covered examples of
crop advisory tools, disease modelling and early warning systems, problems in agricultural
climate service design and delivery, farmer field schools for delivering climate information
(PICSA) and the use of climate information. A separate session explained the development of
an aquaculture decision tree for generating an aquaculture climate service based on examples
from the CSRD project.
Photo 3.4: Staff from CIMMYT and WorldFish trained as enumerators on 12 November 2019 to survey farmers and fishermen using methods developed under CSRD as part of CaFFSA project
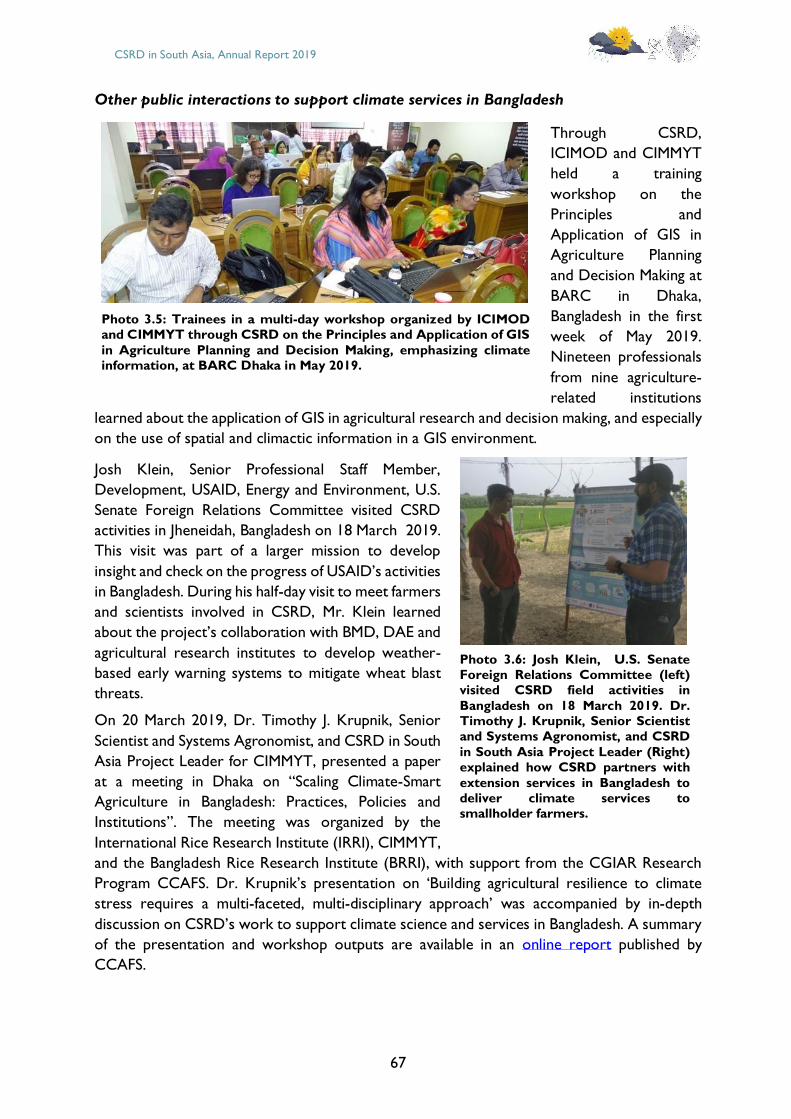
CSRD in South Asia, Annual Report 2019
67
Other public interactions to support climate services in Bangladesh
Through CSRD,
ICIMOD and CIMMYT
held a training
workshop on the
Principles and
Application of GIS in
Agriculture Planning
and Decision Making at
BARC in Dhaka,
Bangladesh in the first
week of May 2019.
Nineteen professionals
from nine agriculture-
related institutions
learned about the application of GIS in agricultural research and decision making, and especially
on the use of spatial and climactic information in a GIS environment.
Josh Klein, Senior Professional Staff Member,
Development, USAID, Energy and Environment, U.S.
Senate Foreign Relations Committee visited CSRD
activities in Jheneidah, Bangladesh on 18 March 2019.
This visit was part of a larger mission to develop
insight and check on the progress of USAID’s activities
in Bangladesh. During his half-day visit to meet farmers
and scientists involved in CSRD, Mr. Klein learned
about the project’s collaboration with BMD, DAE and
agricultural research institutes to develop weather-
based early warning systems to mitigate wheat blast
threats.
On 20 March 2019, Dr. Timothy J. Krupnik, Senior
Scientist and Systems Agronomist, and CSRD in South
Asia Project Leader for CIMMYT, presented a paper
at a meeting in Dhaka on “Scaling Climate-Smart
Agriculture in Bangladesh: Practices, Policies and
Institutions”. The meeting was organized by the
International Rice Research Institute (IRRI), CIMMYT,
and the Bangladesh Rice Research Institute (BRRI), with support from the CGIAR Research
Program CCAFS. Dr. Krupnik’s presentation on ‘Building agricultural resilience to climate
stress requires a multi-faceted, multi-disciplinary approach’ was accompanied by in-depth
discussion on CSRD’s work to support climate science and services in Bangladesh. A summary
of the presentation and workshop outputs are available in an online report published by
CCAFS.
Photo 3.5: Trainees in a multi-day workshop organized by ICIMOD and CIMMYT through CSRD on the Principles and Application of GIS
in Agriculture Planning and Decision Making, emphasizing climate information, at BARC Dhaka in May 2019.
Photo 3.6: Josh Klein, U.S. Senate Foreign Relations Committee (left) visited CSRD field activities in
Bangladesh on 18 March 2019. Dr. Timothy J. Krupnik, Senior Scientist
and Systems Agronomist, and CSRD
in South Asia Project Leader (Right) explained how CSRD partners with
extension services in Bangladesh to deliver climate services to smallholder farmers.

CSRD in South Asia, Annual Report 2019
68
Contribution of Sub-Objective 3.2 to CSRD’s Action and Learning Framework:
Pillar 3, Indicator 3.1 (see Annex 3).
CSRD in South Asia, Annual Report 2019
69
Implementation challenges
Aside from partial flooding in Nepal that hampered field work for lentil disease predictive
modelling data collection efforts in early 2019, no significant implementation challenges were
experienced during 2019.
During the reporting year, CSRD worked to hand over key CSRD products to government
partners like BMD and DAE, and to implement and scale-out activities through association and
synergies with the World Bank supported Agricultural Meteorology project in Bangladesh. This
is especially the case for PICSA, which has been on-boarded as a core part of DAE’s
programming. Similarly, Agvisely and the Wheat Blast Early Warning System have been adopted
by national partners and can continue to function without CSRD’s direct influence. However,
some additional source correction on these tools may be needed, which is now being
supported by the USAID funded Cereal Systems Initiative for South Asia (CSISA) Phase III
project (slated to continue to the end of 2021). This will permit relevant work streams to be
grown to fuller completion, with the goal of implementing the use of science products by
extension services and farmers in South Asia.
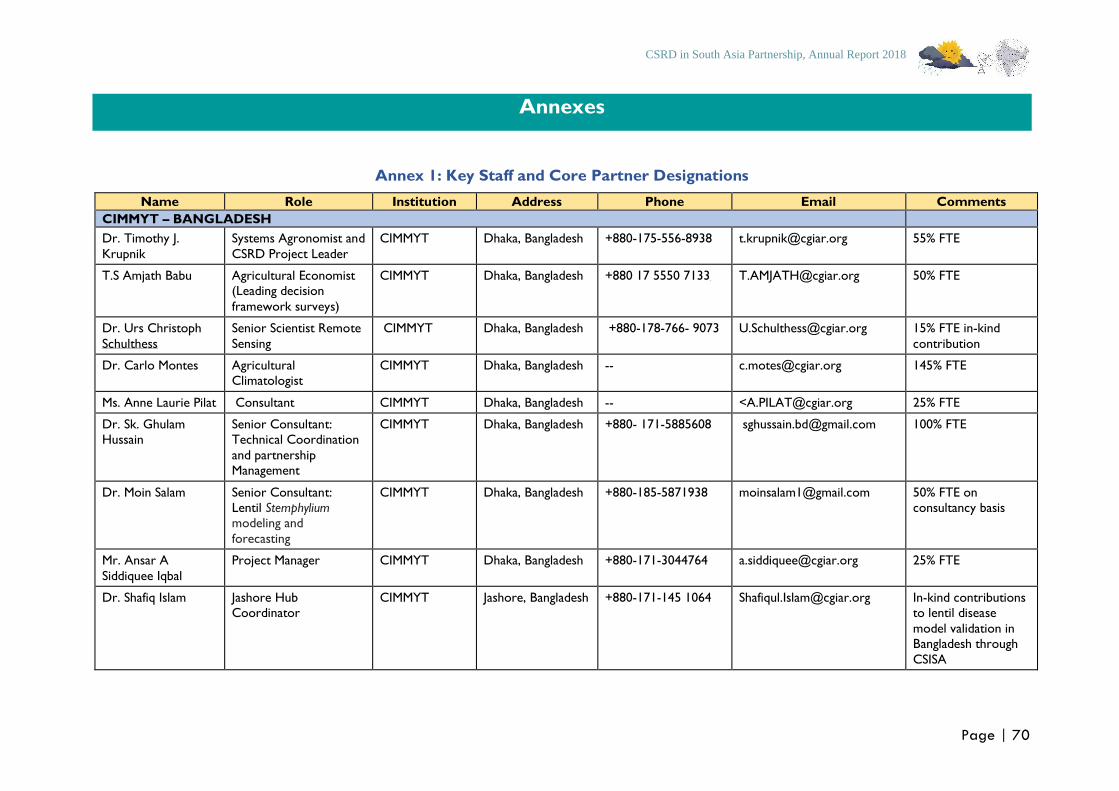
CSRD in South Asia Partnership, Annual Report 2018
Page | 70
Annexes
Annex 1: Key Staff and Core Partner Designations
Name Role Institution Address Phone Email Comments
CIMMYT – BANGLADESH
Dr. Timothy J.
Krupnik
Systems Agronomist and
CSRD Project Leader
CIMMYT Dhaka, Bangladesh +880-175-556-8938 [email protected] 55% FTE
T.S Amjath Babu Agricultural Economist (Leading decision
framework surveys)
CIMMYT Dhaka, Bangladesh +880 17 5550 7133 [email protected] 50% FTE
Dr. Urs Christoph
Schulthess
Senior Scientist Remote
Sensing
CIMMYT Dhaka, Bangladesh +880-178-766- 9073 [email protected] 15% FTE in-kind
contribution
Dr. Carlo Montes Agricultural Climatologist
CIMMYT Dhaka, Bangladesh -- [email protected] 145% FTE
Ms. Anne Laurie Pilat Consultant CIMMYT Dhaka, Bangladesh -- <[email protected] 25% FTE
Dr. Sk. Ghulam
Hussain
Senior Consultant:
Technical Coordination
and partnership Management
CIMMYT Dhaka, Bangladesh +880- 171-5885608 [email protected] 100% FTE
Dr. Moin Salam Senior Consultant:
Lentil Stemphylium modeling and
forecasting
CIMMYT Dhaka, Bangladesh +880-185-5871938 [email protected] 50% FTE on
consultancy basis
Mr. Ansar A
Siddiquee Iqbal
Project Manager CIMMYT Dhaka, Bangladesh +880-171-3044764 [email protected] 25% FTE
Dr. Shafiq Islam Jashore Hub Coordinator
CIMMYT Jashore, Bangladesh +880-171-145 1064 [email protected] In-kind contributions to lentil disease
model validation in Bangladesh through
CSISA
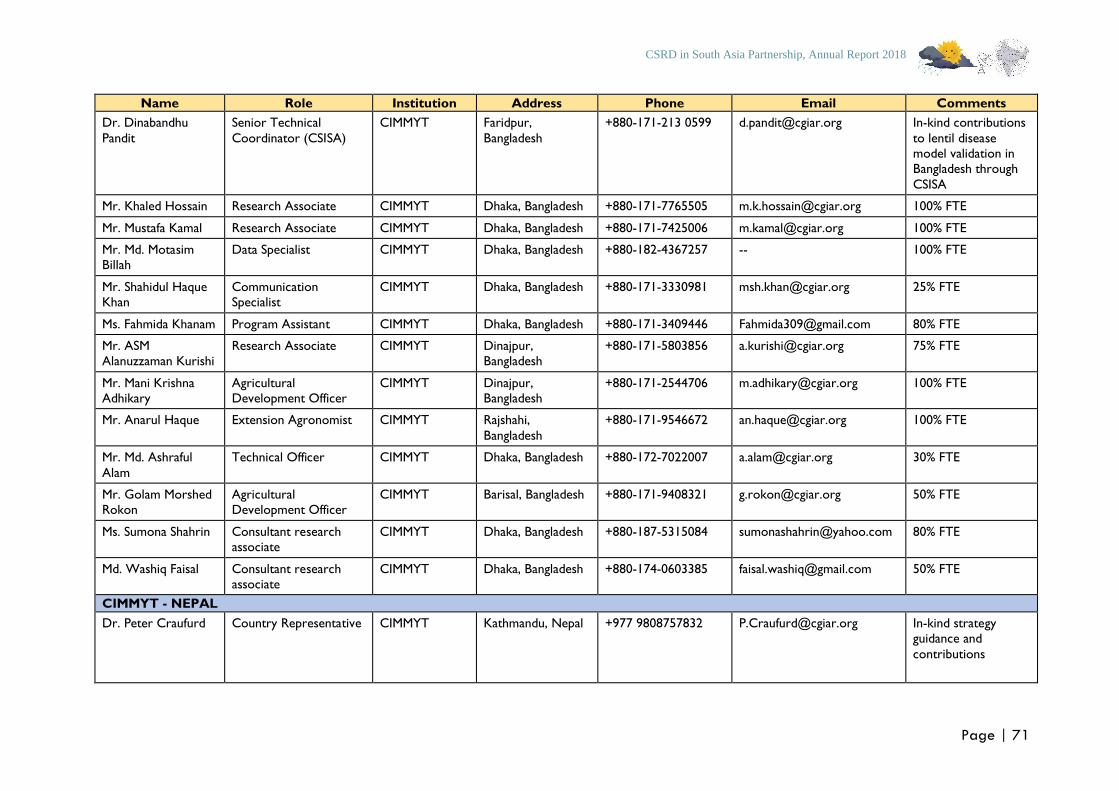
CSRD in South Asia Partnership, Annual Report 2018
Page | 71
Name Role Institution Address Phone Email Comments
Dr. Dinabandhu
Pandit
Senior Technical
Coordinator (CSISA)
CIMMYT Faridpur,
Bangladesh
+880-171-213 0599 [email protected] In-kind contributions
to lentil disease model validation in Bangladesh through
CSISA
Mr. Khaled Hossain Research Associate CIMMYT Dhaka, Bangladesh +880-171-7765505 [email protected] 100% FTE
Mr. Mustafa Kamal Research Associate CIMMYT Dhaka, Bangladesh +880-171-7425006 [email protected] 100% FTE
Mr. Md. Motasim Billah
Data Specialist CIMMYT Dhaka, Bangladesh +880-182-4367257 -- 100% FTE
Mr. Shahidul Haque Khan
Communication Specialist
CIMMYT Dhaka, Bangladesh +880-171-3330981 [email protected] 25% FTE
Ms. Fahmida Khanam Program Assistant CIMMYT Dhaka, Bangladesh +880-171-3409446 [email protected] 80% FTE
Mr. ASM
Alanuzzaman Kurishi
Research Associate CIMMYT Dinajpur,
Bangladesh
+880-171-5803856 [email protected] 75% FTE
Mr. Mani Krishna Adhikary
Agricultural Development Officer
CIMMYT Dinajpur, Bangladesh
+880-171-2544706 [email protected] 100% FTE
Mr. Anarul Haque Extension Agronomist CIMMYT Rajshahi,
Bangladesh
+880-171-9546672 [email protected] 100% FTE
Mr. Md. Ashraful
Alam
Technical Officer CIMMYT Dhaka, Bangladesh +880-172-7022007 [email protected] 30% FTE
Mr. Golam Morshed
Rokon
Agricultural
Development Officer
CIMMYT Barisal, Bangladesh +880-171-9408321 [email protected] 50% FTE
Ms. Sumona Shahrin Consultant research associate
CIMMYT Dhaka, Bangladesh +880-187-5315084 [email protected] 80% FTE
Md. Washiq Faisal Consultant research associate
CIMMYT Dhaka, Bangladesh +880-174-0603385 [email protected] 50% FTE
CIMMYT - NEPAL
Dr. Peter Craufurd Country Representative CIMMYT Kathmandu, Nepal +977 9808757832 [email protected] In-kind strategy guidance and
contributions
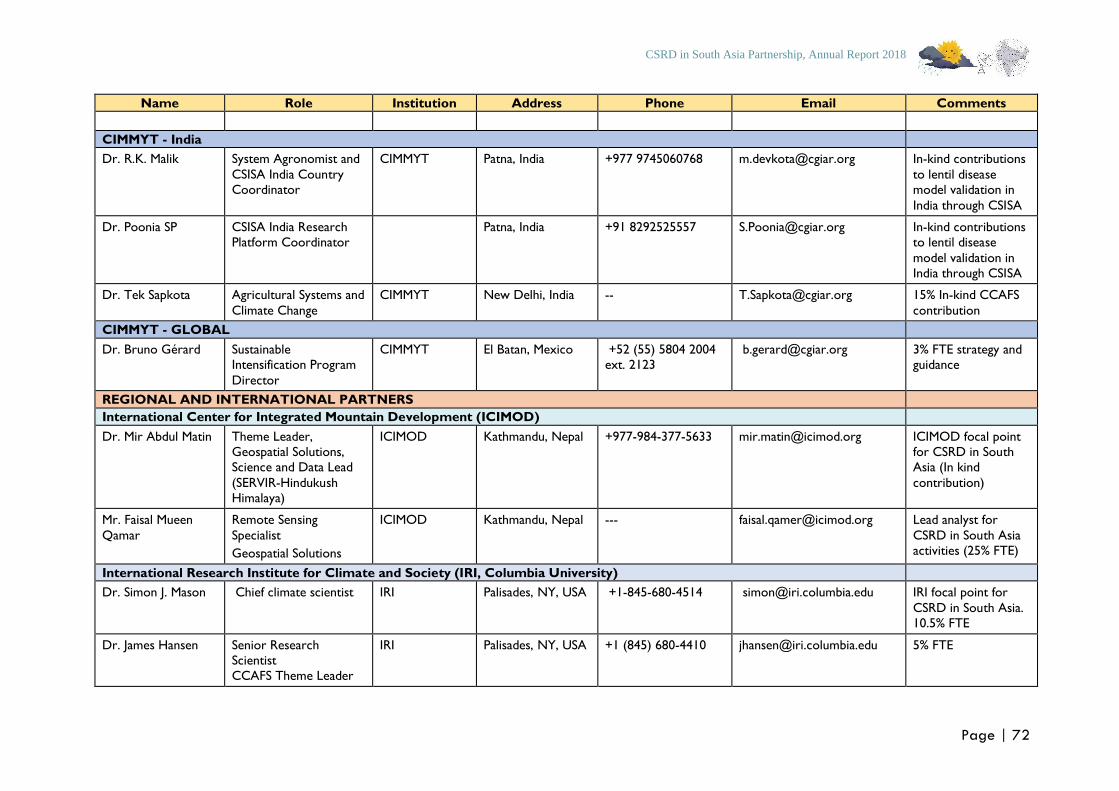
CSRD in South Asia Partnership, Annual Report 2018
Page | 72
Name Role Institution Address Phone Email Comments
CIMMYT - India
Dr. R.K. Malik System Agronomist and
CSISA India Country Coordinator
CIMMYT Patna, India +977 9745060768 [email protected] In-kind contributions
to lentil disease model validation in
India through CSISA
Dr. Poonia SP CSISA India Research Platform Coordinator
Patna, India +91 8292525557
[email protected] In-kind contributions to lentil disease
model validation in
India through CSISA
Dr. Tek Sapkota Agricultural Systems and
Climate Change
CIMMYT New Delhi, India -- [email protected] 15% In-kind CCAFS
contribution
CIMMYT - GLOBAL
Dr. Bruno Gérard Sustainable Intensification Program
Director
CIMMYT El Batan, Mexico +52 (55) 5804 2004 ext. 2123
[email protected] 3% FTE strategy and guidance
REGIONAL AND INTERNATIONAL PARTNERS
International Center for Integrated Mountain Development (ICIMOD)
Dr. Mir Abdul Matin Theme Leader, Geospatial Solutions, Science and Data Lead
(SERVIR-Hindukush Himalaya)
ICIMOD Kathmandu, Nepal +977-984-377-5633 [email protected] ICIMOD focal point for CSRD in South Asia (In kind
contribution)
Mr. Faisal Mueen
Qamar
Remote Sensing
Specialist
Geospatial Solutions
ICIMOD Kathmandu, Nepal --- [email protected] Lead analyst for
CSRD in South Asia activities (25% FTE)
International Research Institute for Climate and Society (IRI, Columbia University)
Dr. Simon J. Mason Chief climate scientist IRI Palisades, NY, USA +1-845-680-4514 [email protected] IRI focal point for
CSRD in South Asia. 10.5% FTE
Dr. James Hansen Senior Research Scientist
CCAFS Theme Leader
IRI Palisades, NY, USA +1 (845) 680-4410 [email protected] 5% FTE
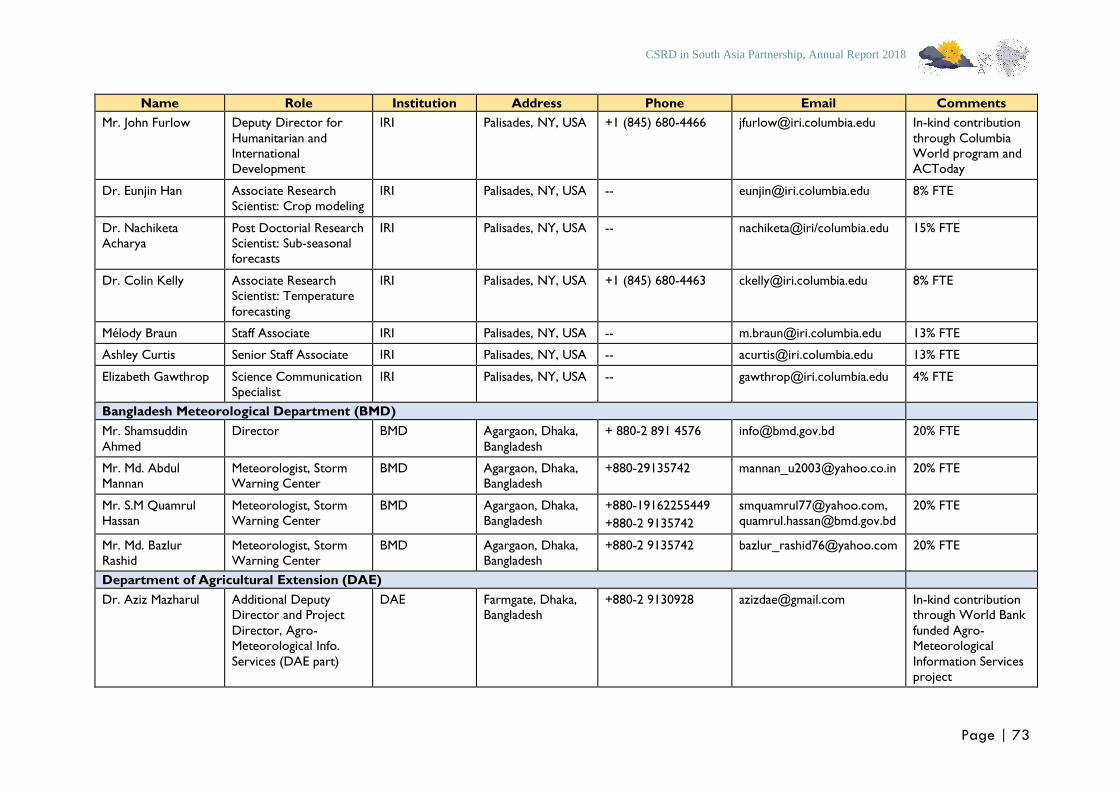
CSRD in South Asia Partnership, Annual Report 2018
Page | 73
Name Role Institution Address Phone Email Comments
Mr. John Furlow Deputy Director for
Humanitarian and International Development
IRI Palisades, NY, USA +1 (845) 680-4466
[email protected] In-kind contribution
through Columbia World program and ACToday
Dr. Eunjin Han Associate Research Scientist: Crop modeling
IRI Palisades, NY, USA -- [email protected] 8% FTE
Dr. Nachiketa Acharya
Post Doctorial Research Scientist: Sub-seasonal forecasts
IRI Palisades, NY, USA -- nachiketa@iri/columbia.edu 15% FTE
Dr. Colin Kelly Associate Research Scientist: Temperature
forecasting
IRI Palisades, NY, USA +1 (845) 680-4463 [email protected] 8% FTE
Mélody Braun Staff Associate IRI Palisades, NY, USA -- [email protected] 13% FTE
Ashley Curtis Senior Staff Associate IRI Palisades, NY, USA -- [email protected] 13% FTE
Elizabeth Gawthrop Science Communication Specialist
IRI Palisades, NY, USA -- [email protected] 4% FTE
Bangladesh Meteorological Department (BMD)
Mr. Shamsuddin
Ahmed
Director BMD Agargaon, Dhaka,
Bangladesh
+ 880-2 891 4576 [email protected] 20% FTE
Mr. Md. Abdul Mannan
Meteorologist, Storm Warning Center
BMD Agargaon, Dhaka, Bangladesh
+880-29135742 [email protected] 20% FTE
Mr. S.M Quamrul
Hassan
Meteorologist, Storm
Warning Center
BMD Agargaon, Dhaka,
Bangladesh
+880-19162255449
+880-2 9135742
20% FTE
Mr. Md. Bazlur Rashid
Meteorologist, Storm Warning Center
BMD Agargaon, Dhaka, Bangladesh
+880-2 9135742 [email protected] 20% FTE
Department of Agricultural Extension (DAE)
Dr. Aziz Mazharul Additional Deputy Director and Project
Director, Agro- Meteorological Info.
Services (DAE part)
DAE Farmgate, Dhaka, Bangladesh
+880-2 9130928 [email protected] In-kind contribution through World Bank
funded Agro-Meteorological
Information Services
project
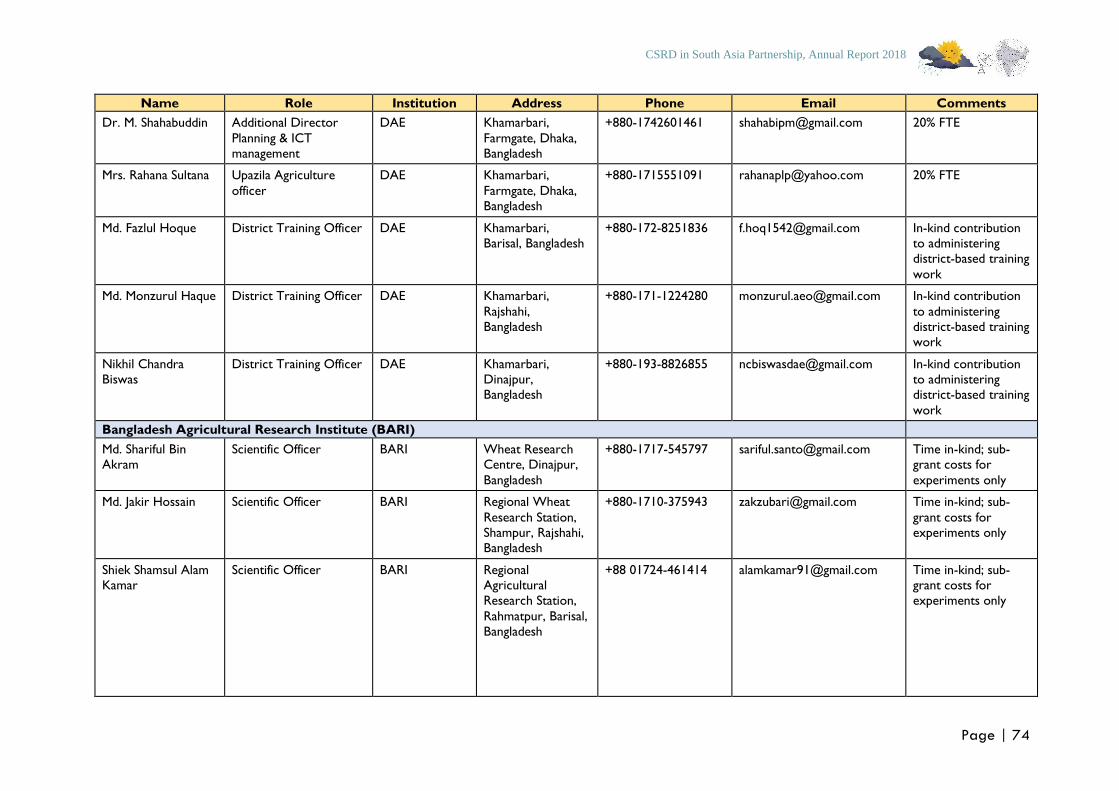
CSRD in South Asia Partnership, Annual Report 2018
Page | 74
Name Role Institution Address Phone Email Comments
Dr. M. Shahabuddin Additional Director
Planning & ICT management
DAE Khamarbari,
Farmgate, Dhaka, Bangladesh
+880-1742601461 [email protected] 20% FTE
Mrs. Rahana Sultana Upazila Agriculture
officer
DAE Khamarbari,
Farmgate, Dhaka, Bangladesh
+880-1715551091 [email protected] 20% FTE
Md. Fazlul Hoque District Training Officer DAE Khamarbari, Barisal, Bangladesh
+880-172-8251836 [email protected] In-kind contribution to administering district-based training
work
Md. Monzurul Haque District Training Officer DAE Khamarbari,
Rajshahi, Bangladesh
+880-171-1224280 [email protected] In-kind contribution
to administering district-based training work
Nikhil Chandra Biswas
District Training Officer DAE Khamarbari, Dinajpur, Bangladesh
+880-193-8826855 [email protected] In-kind contribution to administering district-based training
work
Bangladesh Agricultural Research Institute (BARI)
Md. Shariful Bin Akram
Scientific Officer BARI Wheat Research Centre, Dinajpur,
Bangladesh
+880-1717-545797
[email protected] Time in-kind; sub-grant costs for
experiments only
Md. Jakir Hossain Scientific Officer BARI Regional Wheat
Research Station, Shampur, Rajshahi, Bangladesh
+880-1710-375943 [email protected] Time in-kind; sub-
grant costs for experiments only
Shiek Shamsul Alam Kamar
Scientific Officer BARI Regional Agricultural
Research Station,
Rahmatpur, Barisal, Bangladesh
+88 01724-461414 [email protected] Time in-kind; sub-grant costs for
experiments only
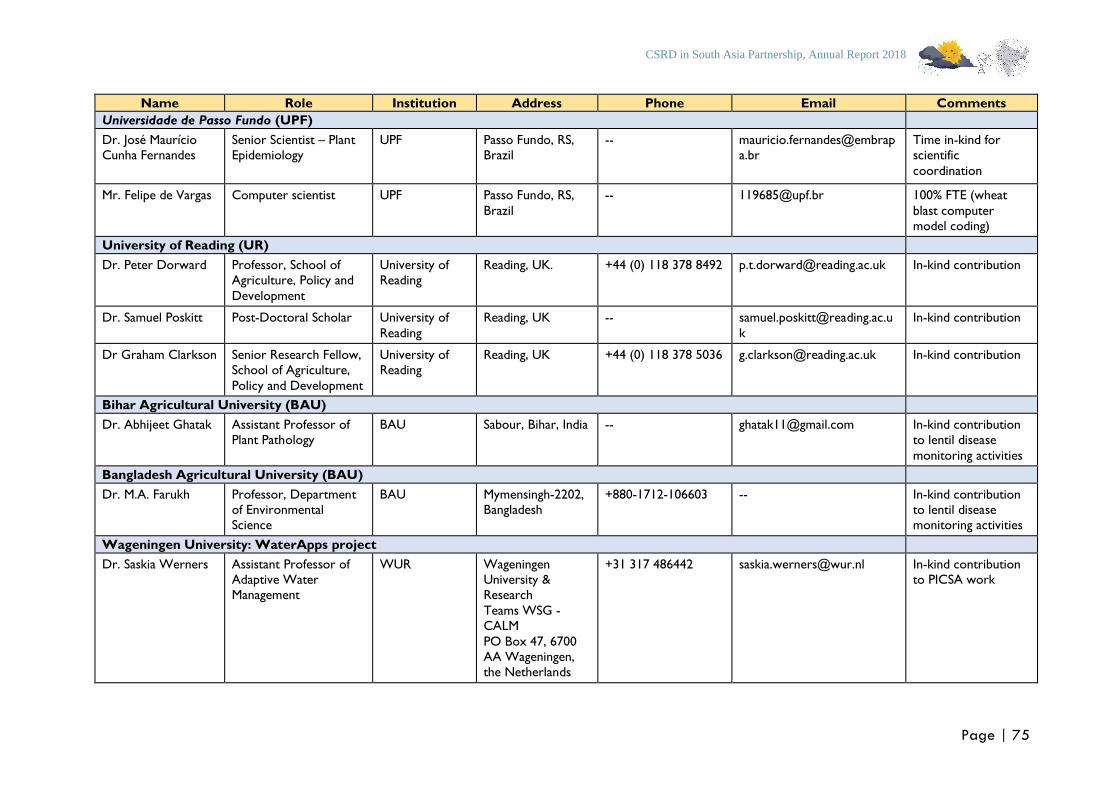
CSRD in South Asia Partnership, Annual Report 2018
Page | 75
Name Role Institution Address Phone Email Comments
Universidade de Passo Fundo (UPF)
Dr. José Maurício Cunha Fernandes
Senior Scientist – Plant Epidemiology
UPF Passo Fundo, RS, Brazil
Time in-kind for scientific
coordination
Mr. Felipe de Vargas Computer scientist UPF Passo Fundo, RS,
Brazil
100% FTE (wheat
blast computer model coding)
University of Reading (UR)
Dr. Peter Dorward Professor, School of
Agriculture, Policy and
Development
University of
Reading
Reading, UK. +44 (0) 118 378 8492
[email protected] In-kind contribution
Dr. Samuel Poskitt Post-Doctoral Scholar University of
Reading
Reading, UK -- [email protected]
k
In-kind contribution
Dr Graham Clarkson Senior Research Fellow, School of Agriculture,
Policy and Development
University of Reading
Reading, UK +44 (0) 118 378 5036 [email protected] In-kind contribution
Bihar Agricultural University (BAU)
Dr. Abhijeet Ghatak Assistant Professor of
Plant Pathology
BAU Sabour, Bihar, India -- [email protected] In-kind contribution
to lentil disease
monitoring activities
Bangladesh Agricultural University (BAU)
Dr. M.A. Farukh Professor, Department
of Environmental Science
BAU Mymensingh-2202,
Bangladesh
+880-1712-106603 -- In-kind contribution
to lentil disease monitoring activities
Wageningen University: WaterApps project
Dr. Saskia Werners Assistant Professor of Adaptive Water
Management
WUR Wageningen University &
Research
Teams WSG - CALM
PO Box 47, 6700 AA Wageningen,
the Netherlands
+31 317 486442 [email protected] In-kind contribution to PICSA work
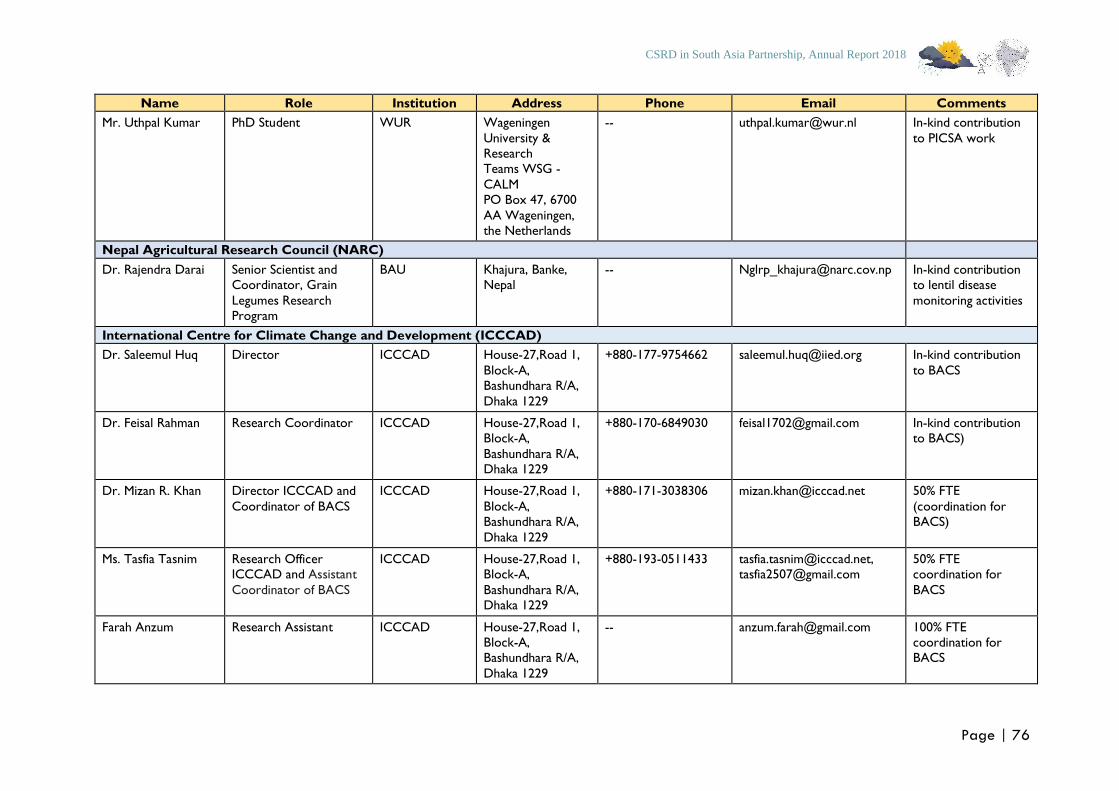
CSRD in South Asia Partnership, Annual Report 2018
Page | 76
Name Role Institution Address Phone Email Comments
Mr. Uthpal Kumar PhD Student WUR Wageningen
University & Research Teams WSG -
CALM
PO Box 47, 6700
AA Wageningen, the Netherlands
-- [email protected] In-kind contribution
to PICSA work
Nepal Agricultural Research Council (NARC)
Dr. Rajendra Darai Senior Scientist and
Coordinator, Grain
Legumes Research Program
BAU Khajura, Banke,
Nepal
-- [email protected] In-kind contribution
to lentil disease
monitoring activities
International Centre for Climate Change and Development (ICCCAD)
Dr. Saleemul Huq Director ICCCAD House-27,Road 1,
Block-A, Bashundhara R/A,
Dhaka 1229
+880-177-9754662 [email protected] In-kind contribution
to BACS
Dr. Feisal Rahman Research Coordinator ICCCAD House-27,Road 1,
Block-A,
Bashundhara R/A, Dhaka 1229
+880-170-6849030 [email protected] In-kind contribution
to BACS)
Dr. Mizan R. Khan Director ICCCAD and
Coordinator of BACS
ICCCAD House-27,Road 1,
Block-A,
Bashundhara R/A,
Dhaka 1229
+880-171-3038306 [email protected] 50% FTE
(coordination for
BACS)
Ms. Tasfia Tasnim Research Officer ICCCAD and Assistant
Coordinator of BACS
ICCCAD House-27,Road 1, Block-A,
Bashundhara R/A, Dhaka 1229
+880-193-0511433 [email protected], [email protected]
50% FTE coordination for
BACS
Farah Anzum Research Assistant ICCCAD House-27,Road 1, Block-A, Bashundhara R/A,
Dhaka 1229
-- [email protected] 100% FTE coordination for BACS
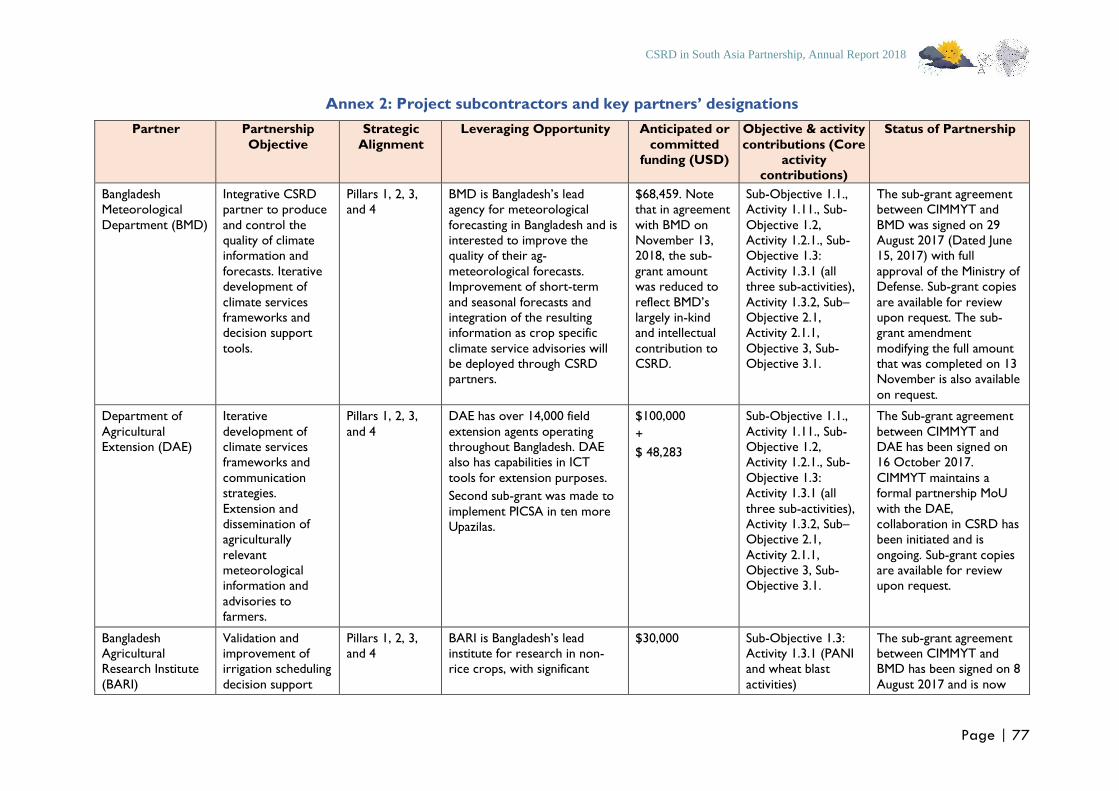
CSRD in South Asia Partnership, Annual Report 2018
Page | 77
Annex 2: Project subcontractors and key partners’ designations
Partner Partnership
Objective
Strategic
Alignment
Leveraging Opportunity Anticipated or
committed funding (USD)
Objective & activity
contributions (Core activity
contributions)
Status of Partnership
Bangladesh Meteorological
Department (BMD)
Integrative CSRD partner to produce
and control the quality of climate information and
forecasts. Iterative development of
climate services frameworks and decision support
tools.
Pillars 1, 2, 3, and 4
BMD is Bangladesh’s lead agency for meteorological
forecasting in Bangladesh and is interested to improve the quality of their ag-
meteorological forecasts. Improvement of short-term
and seasonal forecasts and integration of the resulting information as crop specific
climate service advisories will
be deployed through CSRD partners.
$68,459. Note that in agreement
with BMD on November 13, 2018, the sub-
grant amount was reduced to
reflect BMD’s largely in-kind and intellectual
contribution to
CSRD.
Sub-Objective 1.1., Activity 1.11., Sub-
Objective 1.2, Activity 1.2.1., Sub-Objective 1.3:
Activity 1.3.1 (all three sub-activities),
Activity 1.3.2, Sub–Objective 2.1, Activity 2.1.1,
Objective 3, Sub-
Objective 3.1.
The sub-grant agreement between CIMMYT and
BMD was signed on 29 August 2017 (Dated June 15, 2017) with full
approval of the Ministry of Defense. Sub-grant copies
are available for review upon request. The sub-grant amendment
modifying the full amount
that was completed on 13 November is also available
on request.
Department of
Agricultural Extension (DAE)
Iterative
development of climate services frameworks and
communication strategies.
Extension and dissemination of agriculturally
relevant meteorological information and
advisories to farmers.
Pillars 1, 2, 3,
and 4
DAE has over 14,000 field
extension agents operating throughout Bangladesh. DAE also has capabilities in ICT
tools for extension purposes.
Second sub-grant was made to
implement PICSA in ten more Upazilas.
$100,000
+
$ 48,283
Sub-Objective 1.1.,
Activity 1.11., Sub-Objective 1.2, Activity 1.2.1., Sub-
Objective 1.3: Activity 1.3.1 (all
three sub-activities), Activity 1.3.2, Sub–Objective 2.1,
Activity 2.1.1, Objective 3, Sub-Objective 3.1.
The Sub-grant agreement
between CIMMYT and DAE has been signed on 16 October 2017.
CIMMYT maintains a formal partnership MoU
with the DAE, collaboration in CSRD has been initiated and is
ongoing. Sub-grant copies are available for review upon request.
Bangladesh Agricultural
Research Institute
(BARI)
Validation and improvement of
irrigation scheduling
decision support
Pillars 1, 2, 3, and 4
BARI is Bangladesh’s lead institute for research in non-
rice crops, with significant
$30,000 Sub-Objective 1.3: Activity 1.3.1 (PANI
and wheat blast
activities)
The sub-grant agreement between CIMMYT and
BMD has been signed on 8
August 2017 and is now
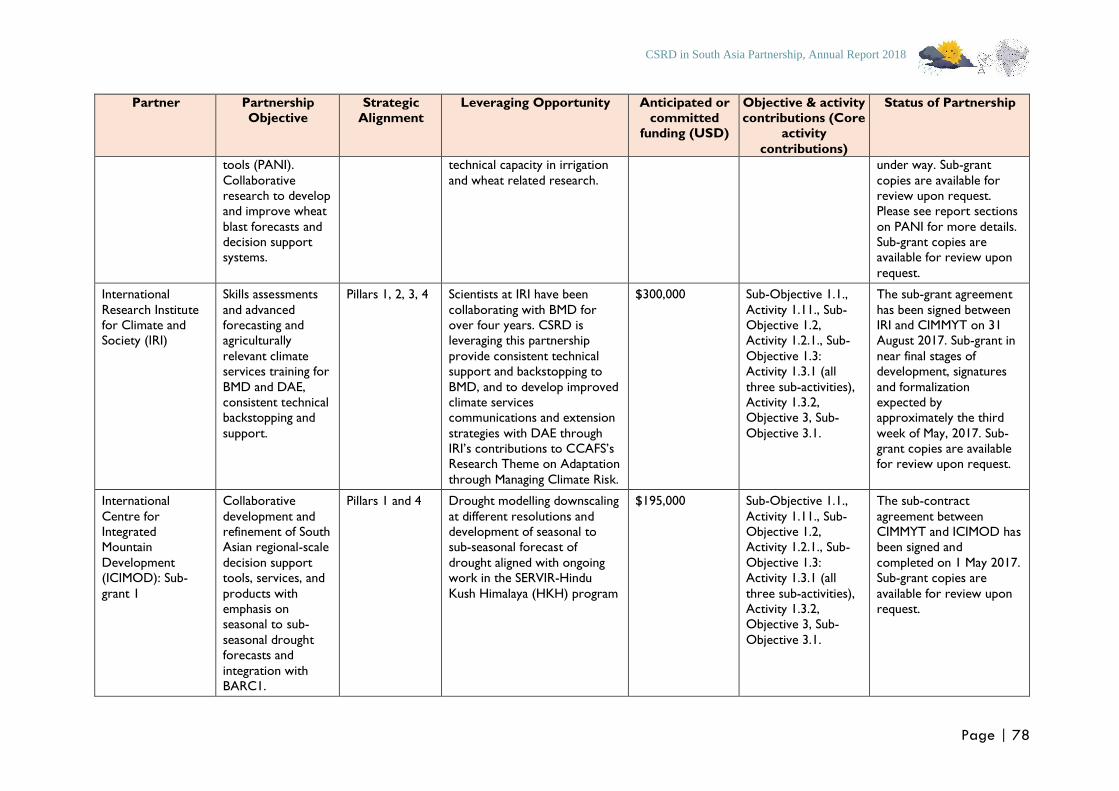
CSRD in South Asia Partnership, Annual Report 2018
Page | 78
Partner Partnership
Objective
Strategic
Alignment
Leveraging Opportunity Anticipated or
committed funding (USD)
Objective & activity
contributions (Core activity
contributions)
Status of Partnership
tools (PANI).
Collaborative
research to develop and improve wheat
blast forecasts and decision support systems.
technical capacity in irrigation
and wheat related research.
under way. Sub-grant
copies are available for
review upon request. Please see report sections
on PANI for more details. Sub-grant copies are available for review upon
request.
International
Research Institute for Climate and Society (IRI)
Skills assessments
and advanced forecasting and agriculturally
relevant climate services training for
BMD and DAE, consistent technical backstopping and
support.
Pillars 1, 2, 3, 4 Scientists at IRI have been
collaborating with BMD for over four years. CSRD is leveraging this partnership
provide consistent technical support and backstopping to
BMD, and to develop improved climate services communications and extension
strategies with DAE through IRI’s contributions to CCAFS’s Research Theme on Adaptation
through Managing Climate Risk.
$300,000 Sub-Objective 1.1.,
Activity 1.11., Sub-Objective 1.2, Activity 1.2.1., Sub-
Objective 1.3: Activity 1.3.1 (all
three sub-activities), Activity 1.3.2, Objective 3, Sub-
Objective 3.1.
The sub-grant agreement
has been signed between IRI and CIMMYT on 31 August 2017. Sub-grant in
near final stages of development, signatures
and formalization expected by approximately the third
week of May, 2017. Sub-grant copies are available for review upon request.
International
Centre for Integrated Mountain
Development (ICIMOD): Sub-
grant 1
Collaborative
development and refinement of South Asian regional-scale
decision support tools, services, and
products with emphasis on seasonal to sub-
seasonal drought forecasts and
integration with BARC1.
Pillars 1 and 4 Drought modelling downscaling
at different resolutions and development of seasonal to sub-seasonal forecast of
drought aligned with ongoing work in the SERVIR-Hindu
Kush Himalaya (HKH) program
$195,000 Sub-Objective 1.1.,
Activity 1.11., Sub-Objective 1.2, Activity 1.2.1., Sub-
Objective 1.3: Activity 1.3.1 (all
three sub-activities), Activity 1.3.2, Objective 3, Sub-
Objective 3.1.
The sub-contract
agreement between CIMMYT and ICIMOD has been signed and
completed on 1 May 2017. Sub-grant copies are
available for review upon request.
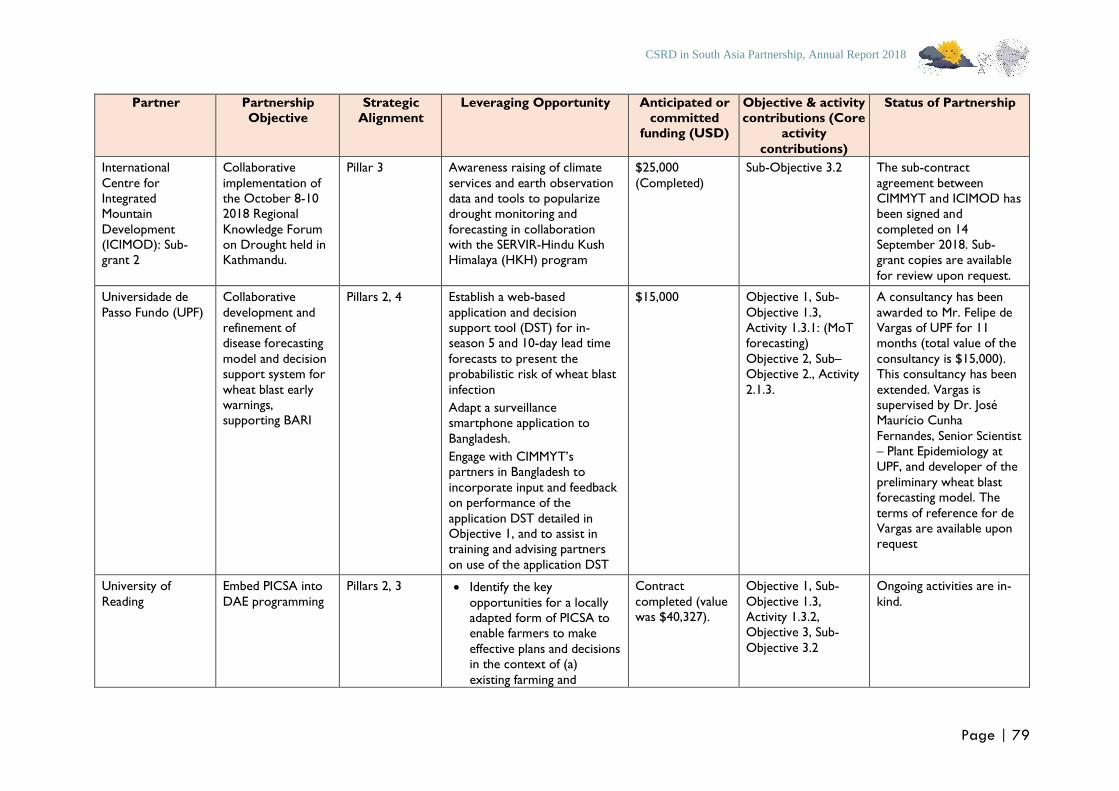
CSRD in South Asia Partnership, Annual Report 2018
Page | 79
Partner Partnership
Objective
Strategic
Alignment
Leveraging Opportunity Anticipated or
committed funding (USD)
Objective & activity
contributions (Core activity
contributions)
Status of Partnership
International
Centre for
Integrated Mountain
Development (ICIMOD): Sub-grant 2
Collaborative
implementation of
the October 8-10 2018 Regional
Knowledge Forum on Drought held in Kathmandu.
Pillar 3 Awareness raising of climate
services and earth observation
data and tools to popularize drought monitoring and
forecasting in collaboration with the SERVIR-Hindu Kush Himalaya (HKH) program
$25,000
(Completed)
Sub-Objective 3.2 The sub-contract
agreement between
CIMMYT and ICIMOD has been signed and
completed on 14 September 2018. Sub-grant copies are available
for review upon request.
Universidade de
Passo Fundo (UPF)
Collaborative
development and refinement of disease forecasting
model and decision support system for
wheat blast early warnings, supporting BARI
Pillars 2, 4 Establish a web-based
application and decision support tool (DST) for in-season 5 and 10-day lead time
forecasts to present the probabilistic risk of wheat blast
infection
Adapt a surveillance smartphone application to
Bangladesh.
Engage with CIMMYT’s partners in Bangladesh to
incorporate input and feedback on performance of the
application DST detailed in Objective 1, and to assist in training and advising partners
on use of the application DST
$15,000 Objective 1, Sub-
Objective 1.3, Activity 1.3.1: (MoT forecasting)
Objective 2, Sub–Objective 2., Activity
2.1.3.
A consultancy has been
awarded to Mr. Felipe de Vargas of UPF for 11 months (total value of the
consultancy is $15,000). This consultancy has been
extended. Vargas is supervised by Dr. José Maurício Cunha
Fernandes, Senior Scientist – Plant Epidemiology at UPF, and developer of the
preliminary wheat blast forecasting model. The
terms of reference for de Vargas are available upon request
University of
Reading
Embed PICSA into
DAE programming
Pillars 2, 3 • Identify the key
opportunities for a locally adapted form of PICSA to enable farmers to make
effective plans and decisions in the context of (a)
existing farming and
Contract
completed (value was $40,327).
Objective 1, Sub-
Objective 1.3, Activity 1.3.2, Objective 3, Sub-
Objective 3.2
Ongoing activities are in-
kind.
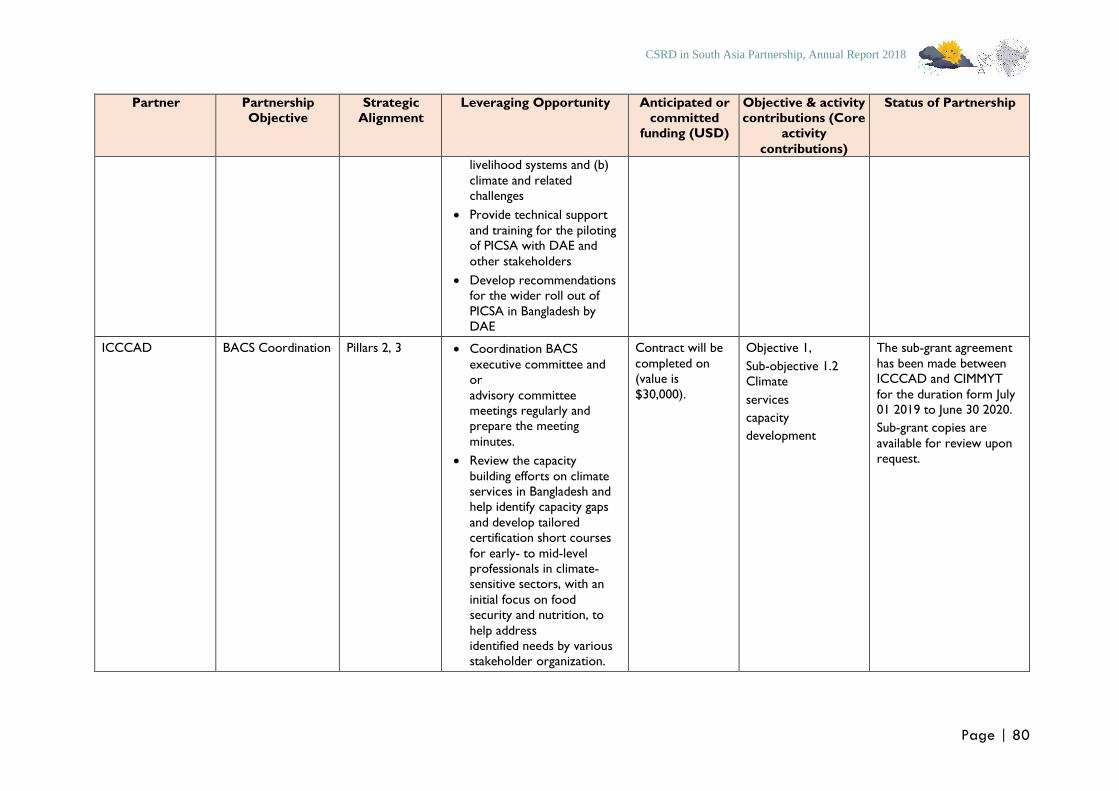
CSRD in South Asia Partnership, Annual Report 2018
Page | 80
Partner Partnership
Objective
Strategic
Alignment
Leveraging Opportunity Anticipated or
committed funding (USD)
Objective & activity
contributions (Core activity
contributions)
Status of Partnership
livelihood systems and (b)
climate and related
challenges
• Provide technical support
and training for the piloting of PICSA with DAE and
other stakeholders
• Develop recommendations for the wider roll out of
PICSA in Bangladesh by DAE
ICCCAD BACS Coordination Pillars 2, 3 • Coordination BACS
executive committee and or
advisory committee meetings regularly and prepare the meeting
minutes.
• Review the capacity
building efforts on climate services in Bangladesh and help identify capacity gaps
and develop tailored certification short courses
for early- to mid-level professionals in climate- sensitive sectors, with an
initial focus on food security and nutrition, to
help address identified needs by various stakeholder organization.
Contract will be
completed on (value is
$30,000).
Objective 1,
Sub-objective 1.2 Climate
services
capacity
development
The sub-grant agreement
has been made between ICCCAD and CIMMYT
for the duration form July 01 2019 to June 30 2020.
Sub-grant copies are
available for review upon request.
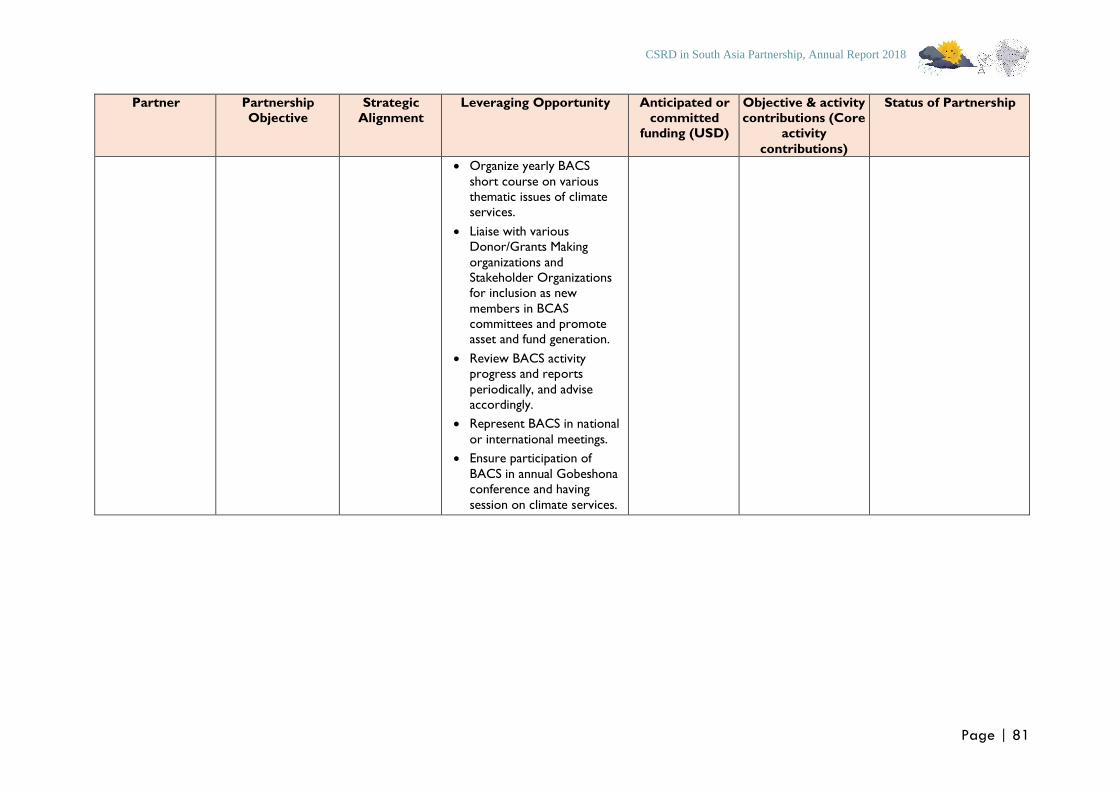
CSRD in South Asia Partnership, Annual Report 2018
Page | 81
Partner Partnership
Objective
Strategic
Alignment
Leveraging Opportunity Anticipated or
committed funding (USD)
Objective & activity
contributions (Core activity
contributions)
Status of Partnership
• Organize yearly BACS
short course on various
thematic issues of climate services.
• Liaise with various Donor/Grants Making
organizations and
Stakeholder Organizations for inclusion as new
members in BCAS committees and promote asset and fund generation.
• Review BACS activity progress and reports
periodically, and advise accordingly.
• Represent BACS in national
or international meetings.
• Ensure participation of
BACS in annual Gobeshona conference and having
session on climate services.
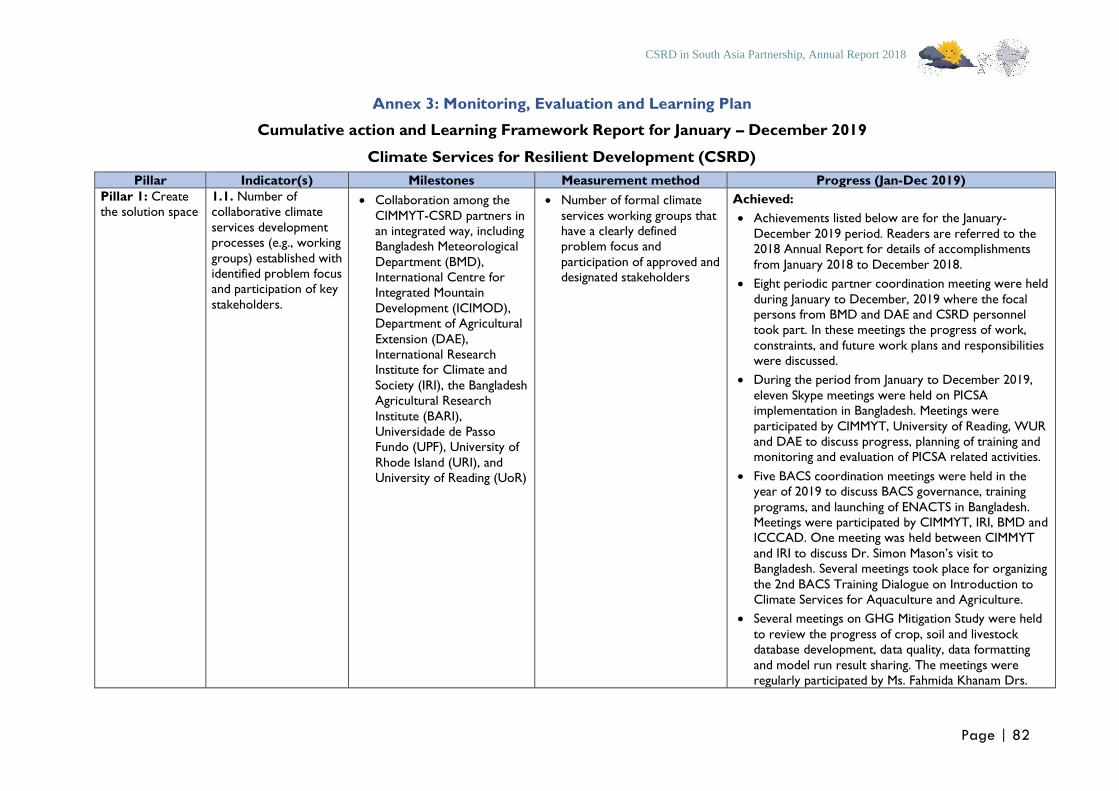
CSRD in South Asia Partnership, Annual Report 2018
Page | 82
Annex 3: Monitoring, Evaluation and Learning Plan
Cumulative action and Learning Framework Report for January – December 2019
Climate Services for Resilient Development (CSRD)
Pillar Indicator(s) Milestones Measurement method Progress (Jan-Dec 2019)
Pillar 1: Create the solution space
1.1. Number of collaborative climate
services development processes (e.g., working
groups) established with
identified problem focus and participation of key
stakeholders.
• Collaboration among the
CIMMYT-CSRD partners in an integrated way, including Bangladesh Meteorological
Department (BMD),
International Centre for Integrated Mountain
Development (ICIMOD), Department of Agricultural
Extension (DAE),
International Research Institute for Climate and
Society (IRI), the Bangladesh Agricultural Research
Institute (BARI),
Universidade de Passo Fundo (UPF), University of
Rhode Island (URI), and University of Reading (UoR)
• Number of formal climate
services working groups that have a clearly defined problem focus and
participation of approved and
designated stakeholders
Achieved:
• Achievements listed below are for the January-
December 2019 period. Readers are referred to the 2018 Annual Report for details of accomplishments
from January 2018 to December 2018.
• Eight periodic partner coordination meeting were held
during January to December, 2019 where the focal persons from BMD and DAE and CSRD personnel took part. In these meetings the progress of work,
constraints, and future work plans and responsibilities
were discussed.
• During the period from January to December 2019,
eleven Skype meetings were held on PICSA implementation in Bangladesh. Meetings were
participated by CIMMYT, University of Reading, WUR
and DAE to discuss progress, planning of training and monitoring and evaluation of PICSA related activities.
• Five BACS coordination meetings were held in the year of 2019 to discuss BACS governance, training
programs, and launching of ENACTS in Bangladesh.
Meetings were participated by CIMMYT, IRI, BMD and ICCCAD. One meeting was held between CIMMYT
and IRI to discuss Dr. Simon Mason’s visit to Bangladesh. Several meetings took place for organizing
the 2nd BACS Training Dialogue on Introduction to
Climate Services for Aquaculture and Agriculture.
• Several meetings on GHG Mitigation Study were held
to review the progress of crop, soil and livestock database development, data quality, data formatting
and model run result sharing. The meetings were
regularly participated by Ms. Fahmida Khanam Drs.
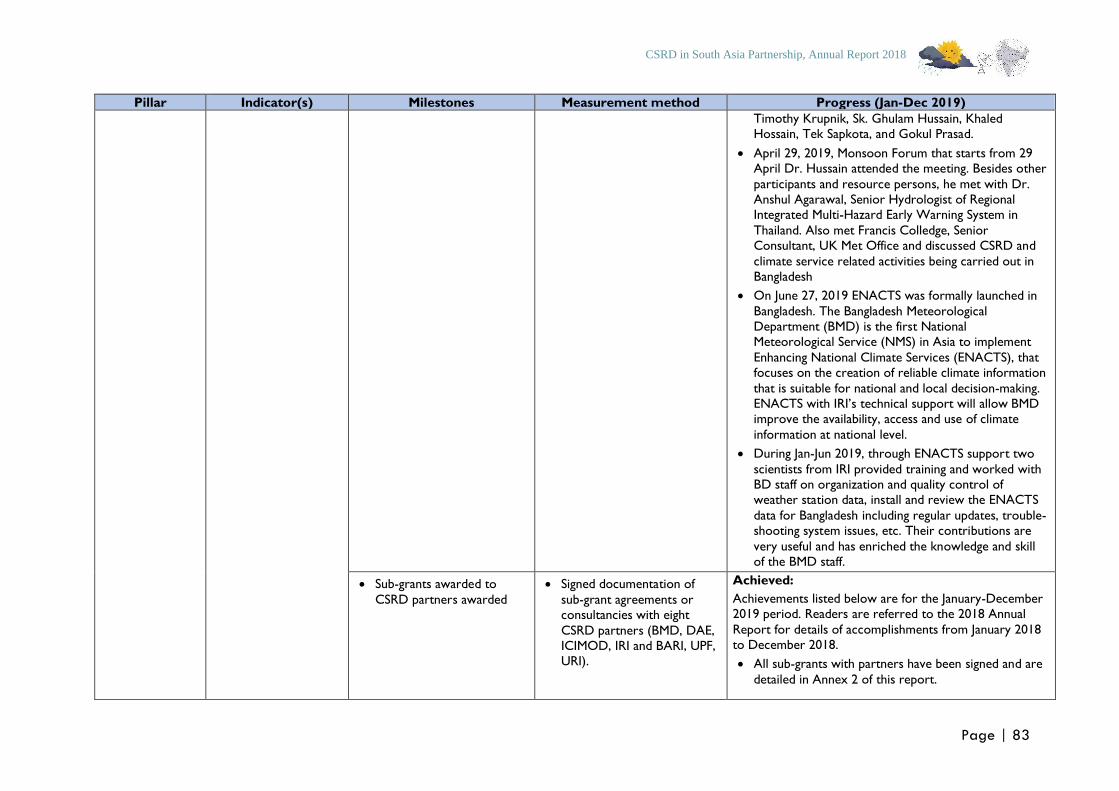
CSRD in South Asia Partnership, Annual Report 2018
Page | 83
Pillar Indicator(s) Milestones Measurement method Progress (Jan-Dec 2019)
Timothy Krupnik, Sk. Ghulam Hussain, Khaled Hossain, Tek Sapkota, and Gokul Prasad.
• April 29, 2019, Monsoon Forum that starts from 29 April Dr. Hussain attended the meeting. Besides other
participants and resource persons, he met with Dr.
Anshul Agarawal, Senior Hydrologist of Regional Integrated Multi-Hazard Early Warning System in
Thailand. Also met Francis Colledge, Senior Consultant, UK Met Office and discussed CSRD and
climate service related activities being carried out in
Bangladesh
• On June 27, 2019 ENACTS was formally launched in
Bangladesh. The Bangladesh Meteorological Department (BMD) is the first National Meteorological Service (NMS) in Asia to implement
Enhancing National Climate Services (ENACTS), that focuses on the creation of reliable climate information
that is suitable for national and local decision-making. ENACTS with IRI’s technical support will allow BMD improve the availability, access and use of climate
information at national level.
• During Jan-Jun 2019, through ENACTS support two
scientists from IRI provided training and worked with BD staff on organization and quality control of weather station data, install and review the ENACTS
data for Bangladesh including regular updates, trouble-shooting system issues, etc. Their contributions are
very useful and has enriched the knowledge and skill of the BMD staff.
• Sub-grants awarded to
CSRD partners awarded
• Signed documentation of
sub-grant agreements or consultancies with eight
CSRD partners (BMD, DAE, ICIMOD, IRI and BARI, UPF, URI).
Achieved:
Achievements listed below are for the January-December 2019 period. Readers are referred to the 2018 Annual
Report for details of accomplishments from January 2018 to December 2018.
• All sub-grants with partners have been signed and are
detailed in Annex 2 of this report.
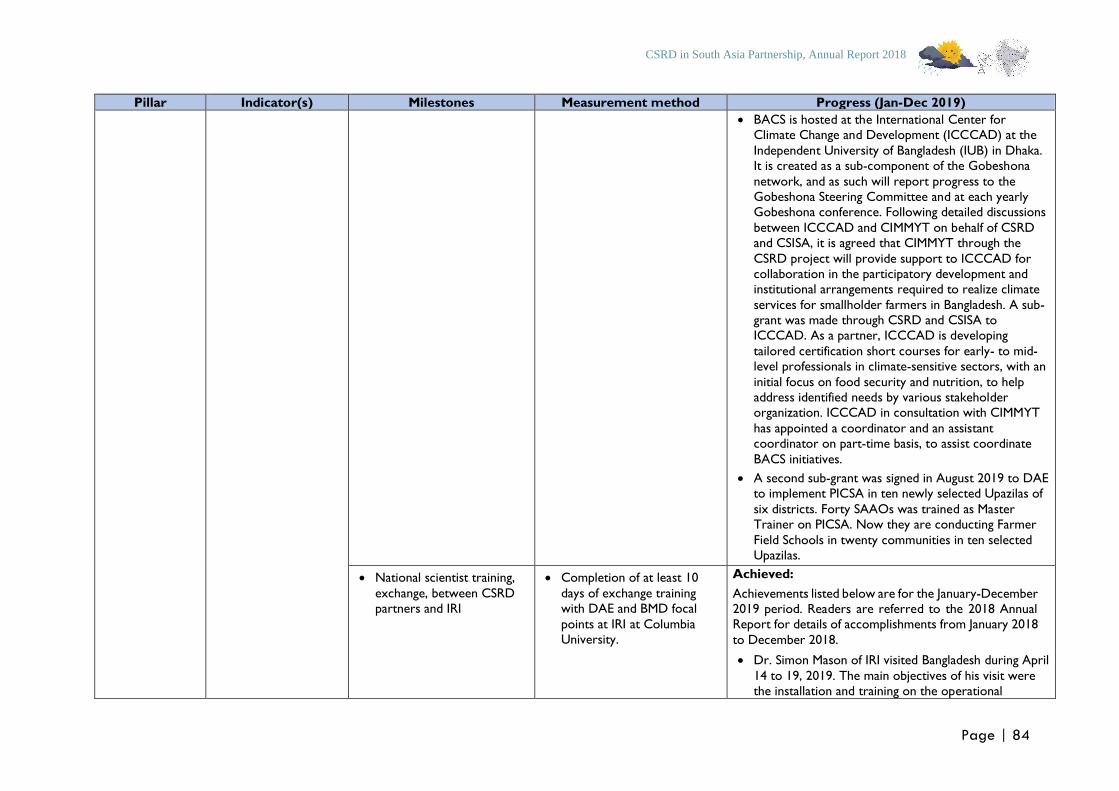
CSRD in South Asia Partnership, Annual Report 2018
Page | 84
Pillar Indicator(s) Milestones Measurement method Progress (Jan-Dec 2019)
• BACS is hosted at the International Center for Climate Change and Development (ICCCAD) at the
Independent University of Bangladesh (IUB) in Dhaka. It is created as a sub-component of the Gobeshona
network, and as such will report progress to the
Gobeshona Steering Committee and at each yearly Gobeshona conference. Following detailed discussions
between ICCCAD and CIMMYT on behalf of CSRD and CSISA, it is agreed that CIMMYT through the
CSRD project will provide support to ICCCAD for
collaboration in the participatory development and institutional arrangements required to realize climate
services for smallholder farmers in Bangladesh. A sub-grant was made through CSRD and CSISA to ICCCAD. As a partner, ICCCAD is developing
tailored certification short courses for early- to mid-level professionals in climate-sensitive sectors, with an
initial focus on food security and nutrition, to help address identified needs by various stakeholder organization. ICCCAD in consultation with CIMMYT
has appointed a coordinator and an assistant coordinator on part-time basis, to assist coordinate
BACS initiatives.
• A second sub-grant was signed in August 2019 to DAE to implement PICSA in ten newly selected Upazilas of
six districts. Forty SAAOs was trained as Master Trainer on PICSA. Now they are conducting Farmer
Field Schools in twenty communities in ten selected Upazilas.
• National scientist training,
exchange, between CSRD partners and IRI
• Completion of at least 10
days of exchange training with DAE and BMD focal
points at IRI at Columbia University.
Achieved:
Achievements listed below are for the January-December 2019 period. Readers are referred to the 2018 Annual Report for details of accomplishments from January 2018
to December 2018.
• Dr. Simon Mason of IRI visited Bangladesh during April
14 to 19, 2019. The main objectives of his visit were the installation and training on the operational
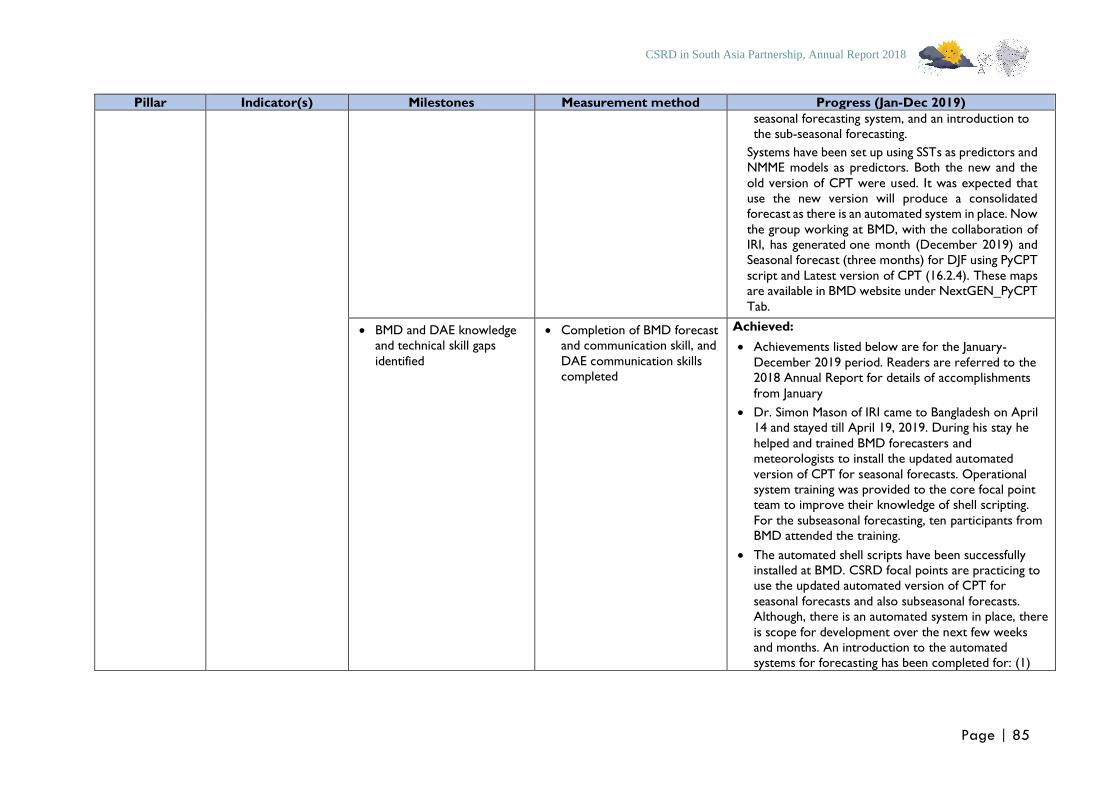
CSRD in South Asia Partnership, Annual Report 2018
Page | 85
Pillar Indicator(s) Milestones Measurement method Progress (Jan-Dec 2019)
seasonal forecasting system, and an introduction to the sub-seasonal forecasting.
Systems have been set up using SSTs as predictors and NMME models as predictors. Both the new and the
old version of CPT were used. It was expected that
use the new version will produce a consolidated forecast as there is an automated system in place. Now
the group working at BMD, with the collaboration of IRI, has generated one month (December 2019) and Seasonal forecast (three months) for DJF using PyCPT
script and Latest version of CPT (16.2.4). These maps are available in BMD website under NextGEN_PyCPT
Tab.
• BMD and DAE knowledge and technical skill gaps
identified
• Completion of BMD forecast and communication skill, and
DAE communication skills completed
Achieved:
• Achievements listed below are for the January-
December 2019 period. Readers are referred to the 2018 Annual Report for details of accomplishments
from January
• Dr. Simon Mason of IRI came to Bangladesh on April 14 and stayed till April 19, 2019. During his stay he
helped and trained BMD forecasters and meteorologists to install the updated automated
version of CPT for seasonal forecasts. Operational system training was provided to the core focal point team to improve their knowledge of shell scripting.
For the subseasonal forecasting, ten participants from BMD attended the training.
• The automated shell scripts have been successfully installed at BMD. CSRD focal points are practicing to use the updated automated version of CPT for
seasonal forecasts and also subseasonal forecasts. Although, there is an automated system in place, there
is scope for development over the next few weeks and months. An introduction to the automated systems for forecasting has been completed for: (1)
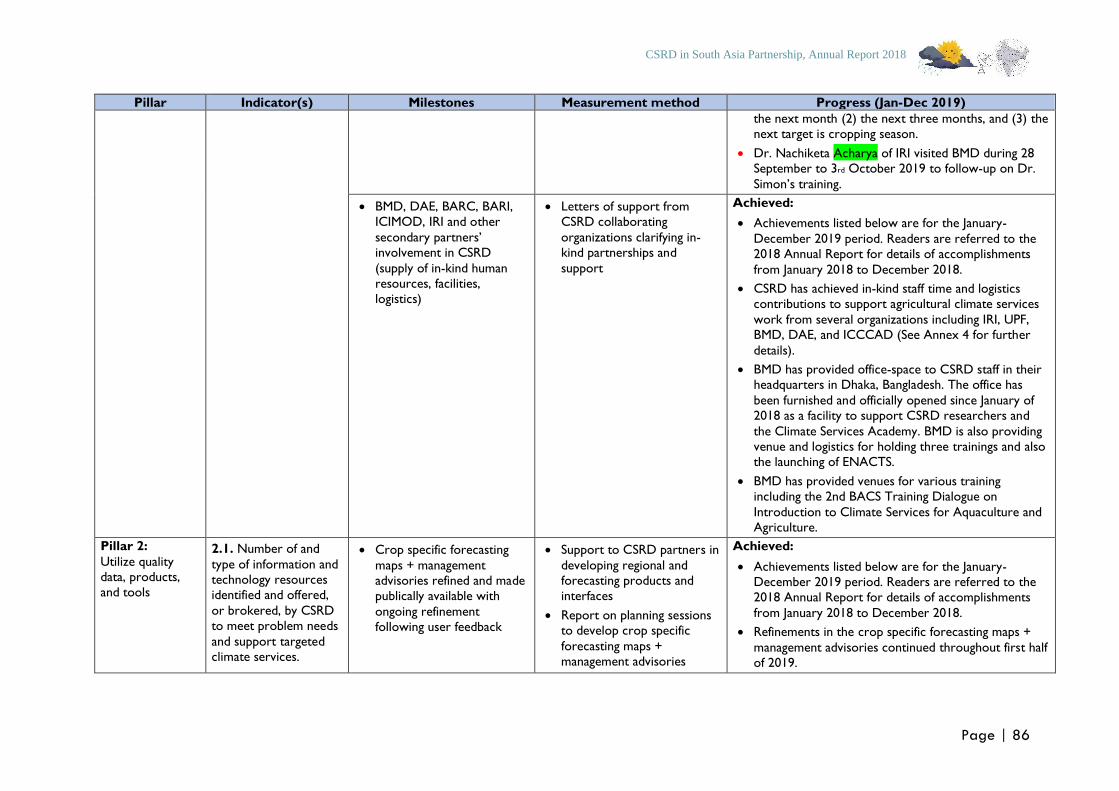
CSRD in South Asia Partnership, Annual Report 2018
Page | 86
Pillar Indicator(s) Milestones Measurement method Progress (Jan-Dec 2019)
the next month (2) the next three months, and (3) the next target is cropping season.
• Dr. Nachiketa Acharya of IRI visited BMD during 28 September to 3rd October 2019 to follow-up on Dr.
Simon’s training.
• BMD, DAE, BARC, BARI, ICIMOD, IRI and other
secondary partners’ involvement in CSRD
(supply of in-kind human
resources, facilities, logistics)
• Letters of support from CSRD collaborating
organizations clarifying in-kind partnerships and
support
Achieved:
• Achievements listed below are for the January-
December 2019 period. Readers are referred to the 2018 Annual Report for details of accomplishments
from January 2018 to December 2018.
• CSRD has achieved in-kind staff time and logistics contributions to support agricultural climate services
work from several organizations including IRI, UPF, BMD, DAE, and ICCCAD (See Annex 4 for further
details).
• BMD has provided office-space to CSRD staff in their headquarters in Dhaka, Bangladesh. The office has
been furnished and officially opened since January of 2018 as a facility to support CSRD researchers and
the Climate Services Academy. BMD is also providing venue and logistics for holding three trainings and also the launching of ENACTS.
• BMD has provided venues for various training including the 2nd BACS Training Dialogue on
Introduction to Climate Services for Aquaculture and Agriculture.
Pillar 2:
Utilize quality data, products,
and tools
2.1. Number of and
type of information and technology resources
identified and offered,
or brokered, by CSRD to meet problem needs
and support targeted climate services.
• Crop specific forecasting
maps + management advisories refined and made
publically available with
ongoing refinement following user feedback
• Support to CSRD partners in
developing regional and forecasting products and
interfaces
• Report on planning sessions to develop crop specific
forecasting maps + management advisories
Achieved:
• Achievements listed below are for the January-December 2019 period. Readers are referred to the
2018 Annual Report for details of accomplishments
from January 2018 to December 2018.
• Refinements in the crop specific forecasting maps +
management advisories continued throughout first half of 2019.
CSRD in South Asia Partnership, Annual Report 2018
Page | 87
Pillar Indicator(s) Milestones Measurement method Progress (Jan-Dec 2019)
• Prototype crop specific forecasting maps +
management advisories
• Public launch of crop specific
forecasting maps +
management advisories
• Refinements made in crop
specific forecasting maps + management advisories
• An application has been developed for providing BMD’s Meteorological Forecast based Agricultural
Advisories by CIMMYT was presented to the relevant BMD and DAE representatives for their suggestions
and comments.
• On November 19, 2018, a meeting was held at the CSRD office at BMD with the Agro-meteorology
Division, CSRD focal persons and the Director of BMD to share the prototype of agromet advisory
related app developed by CIMMYT.
• As per suggestion of BMD Director the Communication Engineer, Mr. M.A. Matin of BMD was
met and it has been agreed that for housing the application a tab will be created in the BMD website
which will be linked to server hosting the application.
So that when a user clicks on the tab, he/she will be able to use the agromet advisory related app.
• Currently, the entire client-side of the application (design and development) is also being developed by
the 3CK. The initial deployment of the application
took place in end of September 2019. For other climate variables and respective thresholds and any
other new features to be added with the application will be decided later and additional design and script for those components will be required.
2.2. Number of tailored products developed to
support specific decisions
• Establishment of Program for Advanced Numerical
Irrigation (PANI) prototype, subsequent field calibration experiments incorporating
precipitation forecasts implemented with BARI
• Availability of PANI prototype application
• Protocols for field experiments, and upload of
resulting datasets to publicly
available databases
• Revised PANI prototype
following CSRD partner and farmer evaluation.
Achieved:
• All achievements detailed in this and previous reports
CSRD in South Asia Partnership, Annual Report 2018
Page | 88
Pillar Indicator(s) Milestones Measurement method Progress (Jan-Dec 2019)
• Agriculturally relevant climatology, extended-range
and outlooks articulated as climactic stress risk maps
generated
• Prototype availability of agriculturally relevant
climatology, extended-range forecasts and outlooks
articulated as climactic stress
risk maps
• Refinement of agriculturally
relevant climatology, extended-range forecasts and
outlooks articulated as
climactic stress risk maps based on CSRD partner and
farmer feedback
• Formal establishment of
agriculturally relevant
climatology, extended-range forecasts and outlooks
articulated as climactic stress risk maps on BMD website, with links from other CSRD
partner websites
Modifications: Achievements listed below are for the January-December
2019 period. Readers are referred to the 2018 Annual Report for details of accomplishments from January 2018
to December 2018.
• Initial USAID consultation with BMD in 2016 revealed an interest in developing seven-day precipitation
forecasts with 15-day accumulative rainfall outlooks. Subsequent consultations with CSRD during the skills
assessment and IRI trainings however resulted in new
priorities being set that better reflect and respond to management decisions made by farmers and
agricultural decision makers in the DAE and other relevant organizations. As such, the product from these activities has been renamed ‘agriculturally
relevant climatology, extended-range forecasts and outlooks’. These changes are detailed below and are
under research and therefore in progress, with completion anticipated before Q2 of 2018.
Key sub-products resulting from this work will include the following, which have been agreed on by CSRD partners:
Historical Monitoring
• Crop-specific thermal stress risk mapping
• Monsoon progression: Seasonal accumulation
• Monsoon progression: Deviation from the norm
• Pseudo-monsoon onset
• Monsoon dry spells (consecutive 5 d < 1 mm,
monsoon seasonal scale)
• Heavy rain events (moderately heavy and above, February-March)
• Improved language, text, format for agricultural
meteorological bulletin produced by BMD (note that
this work is being used synergistically in the
CSRD in South Asia Partnership, Annual Report 2018
Page | 89
Pillar Indicator(s) Milestones Measurement method Progress (Jan-Dec 2019)
complementary CSMSM project in Patuakhali, Bangladesh.
Forecasts
• Crop-specific thermal stress risk mapping (extended
range, < 14 day periods)
• Heavy rain events (moderately heavy and above, 0-15
day forecasts in Feb-March)
• Further details on progress are provided in Objective
1, Sub-Objective 1.3, Activity 1.3, Product 1.
• Spatially explicit and meteorologically driven
Stemphylium disease risk assessments model for
South Asia (Replacement for previous Precision Nutrient Management work
stream as agreed on with USAID)
• Preliminary model availability
• Field protocols for model
calibration in India, Bangladesh, and Nepal
• Model converted to R code for integration into a formal DST
• Refinement and improvement
of model to improve
suitability in India, Bangladesh, and Nepal
Achieved:
Achievements listed below are for the January-December
2019 period. Readers are referred to the 2018 Annual Report for details of accomplishments from January 2018
to December 2018.
• During January-June period, data collection, following the protocol described in previous reports, on the
Stemphylium blight and other diseases for the growing season of 2018-19 was performed from 480 fields in
Bangladesh, India and Nepal. Collected data are being processed for second-year’s disease status analysis. These data will ultimately be used for validation of the
calibrated model. Given that accessing weather data on time and space from national weather stations has
been a great constraint to run model in order to
provide climate-based disease forecasting. Therefore, utilization of NASA POWER generated weather data
was explored whether that can be used in the forecasting system. Since the model uses sunshine
hours data effort was made to convert solar radiation
into sunshine hours using algorithms from literature.
• Calibration of the ‘Stempedia’ model is being
undertaken in several steps. Firstly, by running the model with single weather data-set at each of the five
sties (from where weather data was available) for all
the fields (176 in total) on such scenarios, the model,
CSRD in South Asia Partnership, Annual Report 2018
Page | 90
Pillar Indicator(s) Milestones Measurement method Progress (Jan-Dec 2019)
on average, underestimated the prediction (disease severity by model = 1.55 versus observation 2.21, r =
0.30). Secondly, by running the model with the same single weather data-set at each of the five sties (from
where weather data was available) for the fields with
more scrutinized flowering dates (73 in total); on such scenarios, the model’s predictability greatly improved
(disease severity by model = 2.19 versus observation 2.12, r = 0.62). Thirdly, running the model with changing parameter values; this work is ongoing and
will be reported in the next phase. When completed, a better calibrated ‘Stempedia’ model for the region is
expect.
• Spatially explicit and meteorologically driven
wheat blast (MoT) disease risk assessments model for
Bangladesh and South Asia
• Coding for preliminary back-casting and forecasting
models for MoT disease risk competed
• Prototype of MoT forecasting DST completed
• Refinement and public
availability of MoT forecasting DST
Achieved:
• Achievements listed below are for the January-
December 2019 period. Readers are referred to the 2018 Annual Report for details of accomplishments
from January 2018 to December 2018.
• Professor Dr. Jose Mauricio Cunha Fernandes and Dr. Felipe Devargas from EMBRAPA, Passo Fundo, Brazil
visited Bangladesh from the February 21st to March 05, 2019. During their stay in Bangladesh, Professor
Mauricio and Dr. Felipe visited Jeshore to deliver lecture in wheat blast training in Jashore, interacted with scientists and overviewed the progress of spore
trapping and processing efforts, blast lesion microscopy. The training was jointly organized by the
International Maize and Wheat Improvement Center (CIMMYT), Bangladesh Wheat and Maize Research Institute (BWMRI), and the Department of
Agricultural Extension (DAE) Bangladesh during 19-28 February, 2019 at Regional Agricultural Research Station, Jashore with financial support from the
Australian Centre for International Agricultural Research (ACIAR), the CGIAR Research Program on
Wheat (WHEAT), the Indian Council of Agricultural Research (ICAR), the Krishi Gobeshona Foundation
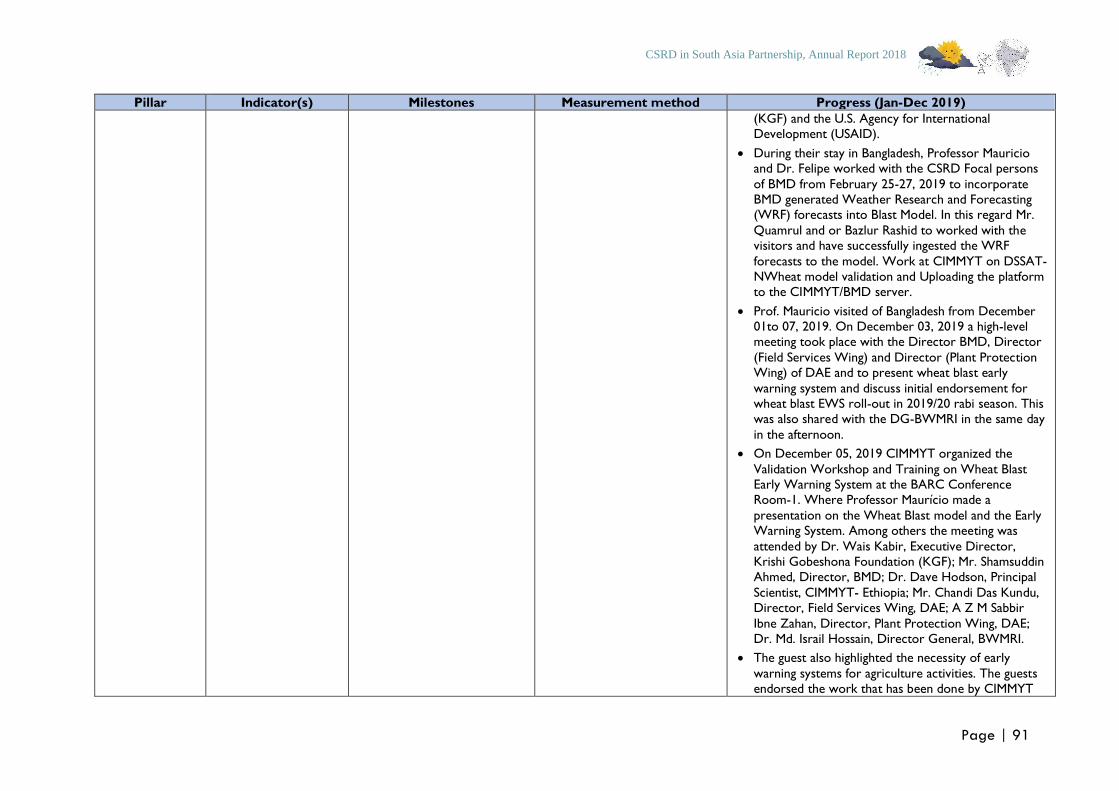
CSRD in South Asia Partnership, Annual Report 2018
Page | 91
Pillar Indicator(s) Milestones Measurement method Progress (Jan-Dec 2019)
(KGF) and the U.S. Agency for International Development (USAID).
• During their stay in Bangladesh, Professor Mauricio and Dr. Felipe worked with the CSRD Focal persons
of BMD from February 25-27, 2019 to incorporate
BMD generated Weather Research and Forecasting (WRF) forecasts into Blast Model. In this regard Mr.
Quamrul and or Bazlur Rashid to worked with the visitors and have successfully ingested the WRF
forecasts to the model. Work at CIMMYT on DSSAT-
NWheat model validation and Uploading the platform to the CIMMYT/BMD server.
• Prof. Mauricio visited of Bangladesh from December 01to 07, 2019. On December 03, 2019 a high-level meeting took place with the Director BMD, Director
(Field Services Wing) and Director (Plant Protection Wing) of DAE and to present wheat blast early
warning system and discuss initial endorsement for wheat blast EWS roll-out in 2019/20 rabi season. This was also shared with the DG-BWMRI in the same day
in the afternoon.
• On December 05, 2019 CIMMYT organized the
Validation Workshop and Training on Wheat Blast Early Warning System at the BARC Conference Room-1. Where Professor Maurício made a
presentation on the Wheat Blast model and the Early Warning System. Among others the meeting was
attended by Dr. Wais Kabir, Executive Director, Krishi Gobeshona Foundation (KGF); Mr. Shamsuddin Ahmed, Director, BMD; Dr. Dave Hodson, Principal
Scientist, CIMMYT- Ethiopia; Mr. Chandi Das Kundu, Director, Field Services Wing, DAE; A Z M Sabbir
Ibne Zahan, Director, Plant Protection Wing, DAE; Dr. Md. Israil Hossain, Director General, BWMRI.
• The guest also highlighted the necessity of early
warning systems for agriculture activities. The guests endorsed the work that has been done by CIMMYT
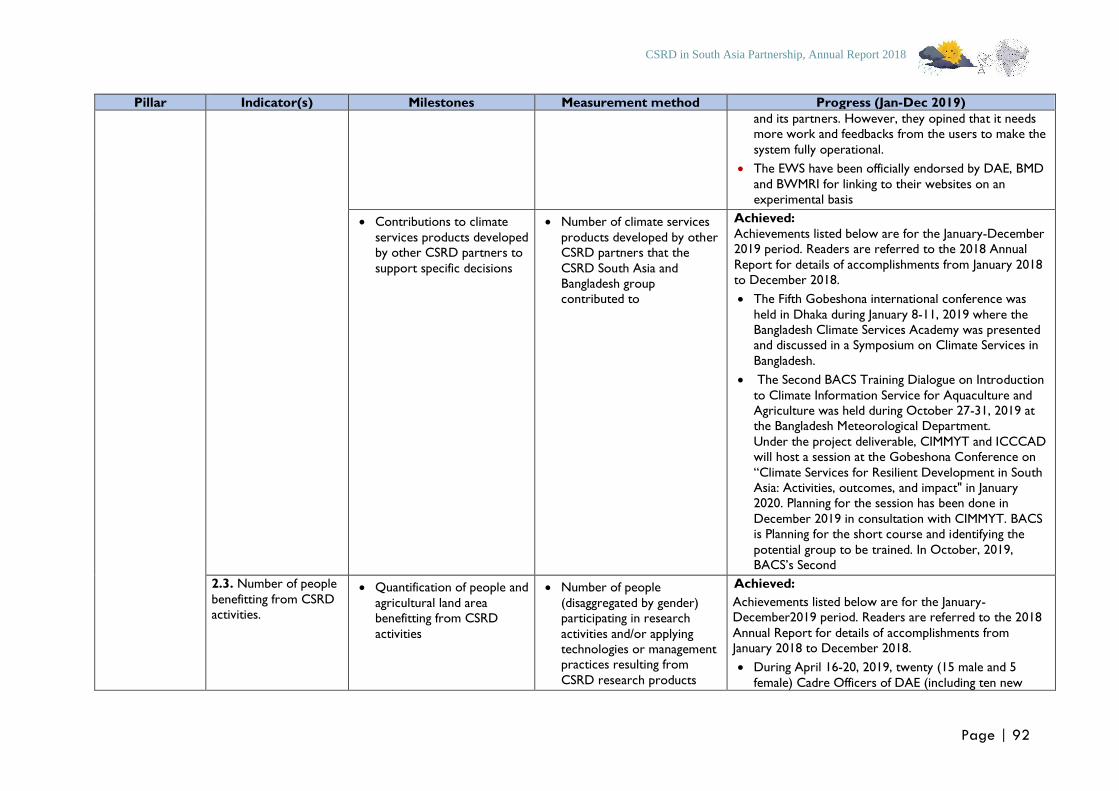
CSRD in South Asia Partnership, Annual Report 2018
Page | 92
Pillar Indicator(s) Milestones Measurement method Progress (Jan-Dec 2019)
and its partners. However, they opined that it needs more work and feedbacks from the users to make the
system fully operational.
• The EWS have been officially endorsed by DAE, BMD
and BWMRI for linking to their websites on an
experimental basis
• Contributions to climate
services products developed by other CSRD partners to
support specific decisions
• Number of climate services
products developed by other CSRD partners that the
CSRD South Asia and
Bangladesh group contributed to
Achieved:
Achievements listed below are for the January-December 2019 period. Readers are referred to the 2018 Annual
Report for details of accomplishments from January 2018
to December 2018.
• The Fifth Gobeshona international conference was
held in Dhaka during January 8-11, 2019 where the Bangladesh Climate Services Academy was presented and discussed in a Symposium on Climate Services in
Bangladesh.
• The Second BACS Training Dialogue on Introduction
to Climate Information Service for Aquaculture and Agriculture was held during October 27-31, 2019 at the Bangladesh Meteorological Department.
Under the project deliverable, CIMMYT and ICCCAD will host a session at the Gobeshona Conference on
“Climate Services for Resilient Development in South Asia: Activities, outcomes, and impact" in January 2020. Planning for the session has been done in
December 2019 in consultation with CIMMYT. BACS is Planning for the short course and identifying the
potential group to be trained. In October, 2019, BACS’s Second
2.3. Number of people
benefitting from CSRD activities.
• Quantification of people and
agricultural land area benefitting from CSRD
activities
• Number of people
(disaggregated by gender) participating in research
activities and/or applying technologies or management practices resulting from
CSRD research products
Achieved:
Achievements listed below are for the January-December2019 period. Readers are referred to the 2018
Annual Report for details of accomplishments from January 2018 to December 2018.
• During April 16-20, 2019, twenty (15 male and 5
female) Cadre Officers of DAE (including ten new
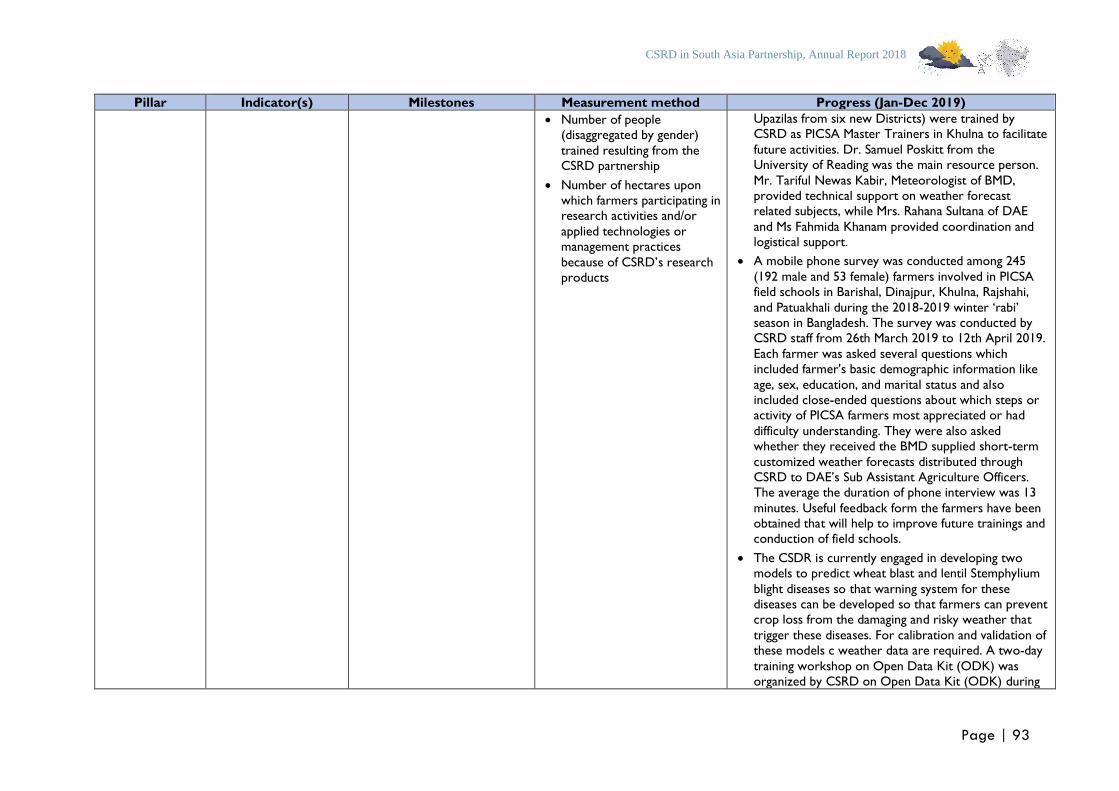
CSRD in South Asia Partnership, Annual Report 2018
Page | 93
Pillar Indicator(s) Milestones Measurement method Progress (Jan-Dec 2019)
• Number of people (disaggregated by gender)
trained resulting from the CSRD partnership
• Number of hectares upon
which farmers participating in research activities and/or
applied technologies or management practices
because of CSRD’s research
products
Upazilas from six new Districts) were trained by CSRD as PICSA Master Trainers in Khulna to facilitate
future activities. Dr. Samuel Poskitt from the University of Reading was the main resource person.
Mr. Tariful Newas Kabir, Meteorologist of BMD,
provided technical support on weather forecast related subjects, while Mrs. Rahana Sultana of DAE
and Ms Fahmida Khanam provided coordination and logistical support.
• A mobile phone survey was conducted among 245
(192 male and 53 female) farmers involved in PICSA field schools in Barishal, Dinajpur, Khulna, Rajshahi,
and Patuakhali during the 2018-2019 winter ‘rabi’ season in Bangladesh. The survey was conducted by CSRD staff from 26th March 2019 to 12th April 2019.
Each farmer was asked several questions which included farmer's basic demographic information like
age, sex, education, and marital status and also included close-ended questions about which steps or activity of PICSA farmers most appreciated or had
difficulty understanding. They were also asked whether they received the BMD supplied short-term
customized weather forecasts distributed through CSRD to DAE’s Sub Assistant Agriculture Officers. The average the duration of phone interview was 13
minutes. Useful feedback form the farmers have been obtained that will help to improve future trainings and conduction of field schools.
• The CSDR is currently engaged in developing two models to predict wheat blast and lentil Stemphylium
blight diseases so that warning system for these diseases can be developed so that farmers can prevent crop loss from the damaging and risky weather that
trigger these diseases. For calibration and validation of these models c weather data are required. A two-day
training workshop on Open Data Kit (ODK) was organized by CSRD on Open Data Kit (ODK) during
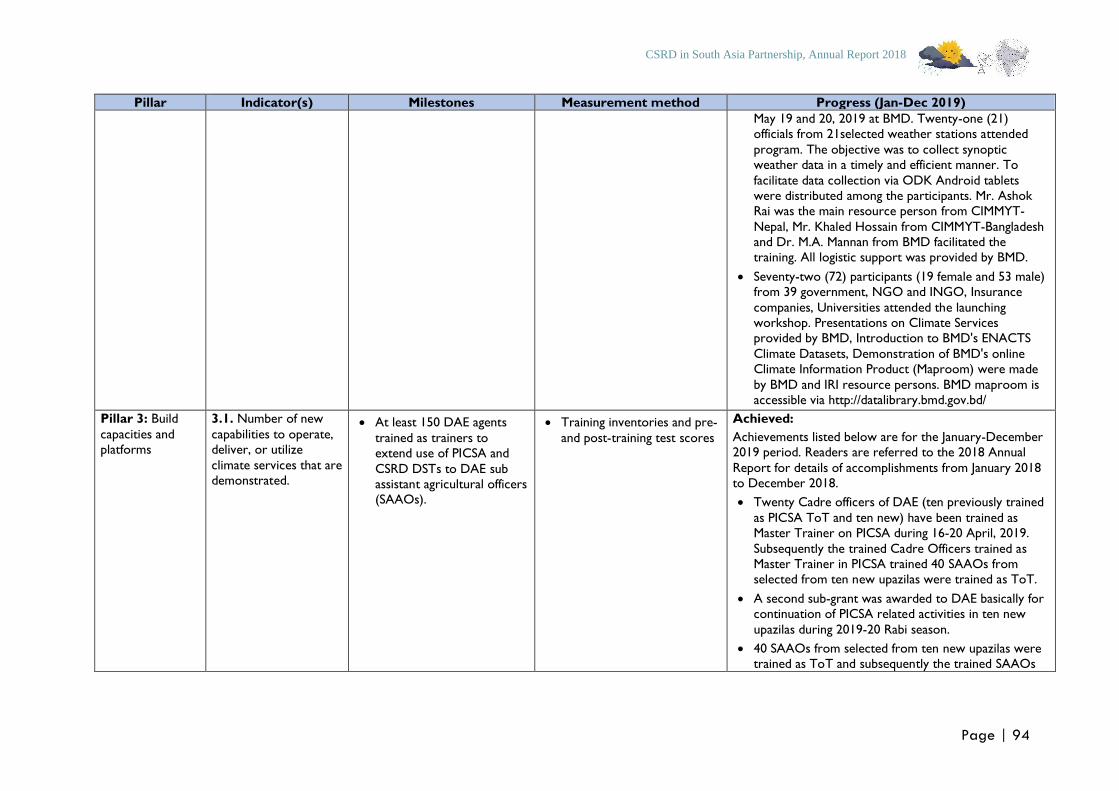
CSRD in South Asia Partnership, Annual Report 2018
Page | 94
Pillar Indicator(s) Milestones Measurement method Progress (Jan-Dec 2019)
May 19 and 20, 2019 at BMD. Twenty-one (21) officials from 21selected weather stations attended
program. The objective was to collect synoptic weather data in a timely and efficient manner. To
facilitate data collection via ODK Android tablets
were distributed among the participants. Mr. Ashok Rai was the main resource person from CIMMYT-
Nepal, Mr. Khaled Hossain from CIMMYT-Bangladesh and Dr. M.A. Mannan from BMD facilitated the training. All logistic support was provided by BMD.
• Seventy-two (72) participants (19 female and 53 male) from 39 government, NGO and INGO, Insurance
companies, Universities attended the launching workshop. Presentations on Climate Services provided by BMD, Introduction to BMD's ENACTS
Climate Datasets, Demonstration of BMD's online Climate Information Product (Maproom) were made
by BMD and IRI resource persons. BMD maproom is accessible via http://datalibrary.bmd.gov.bd/
Pillar 3: Build
capacities and platforms
3.1. Number of new
capabilities to operate, deliver, or utilize
climate services that are demonstrated.
• At least 150 DAE agents
trained as trainers to extend use of PICSA and
CSRD DSTs to DAE sub assistant agricultural officers (SAAOs).
• Training inventories and pre-
and post-training test scores
Achieved:
Achievements listed below are for the January-December 2019 period. Readers are referred to the 2018 Annual
Report for details of accomplishments from January 2018 to December 2018.
• Twenty Cadre officers of DAE (ten previously trained
as PICSA ToT and ten new) have been trained as Master Trainer on PICSA during 16-20 April, 2019.
Subsequently the trained Cadre Officers trained as Master Trainer in PICSA trained 40 SAAOs from selected from ten new upazilas were trained as ToT.
• A second sub-grant was awarded to DAE basically for continuation of PICSA related activities in ten new
upazilas during 2019-20 Rabi season.
• 40 SAAOs from selected from ten new upazilas were trained as ToT and subsequently the trained SAAOs
CSRD in South Asia Partnership, Annual Report 2018
Page | 95
Pillar Indicator(s) Milestones Measurement method Progress (Jan-Dec 2019)
are conducting 20 PICSA farmer field schools in 20 communities in the selected new Upazilas.
• In all 80 SAAOs from twenty Upazilas have been trained as ToT who are capable of training conducting
PICSA farmer field schools.
• At least 350 SAAOs subsequently trained in
interpreting and communicating
meteorological information
effectively to farmers.
• Training inventories and pre- and post-training test scores
Achieved:
• Achievements listed below are for the January-
December 2019 period. Readers are referred to the 2018 Annual Report for details of accomplishments
from January 2018 to December 2018.
• In 2018-2019 eighty (80) SAAOs were trained.
• The 80 trained SAAOs subsequently conducted 40
PICSA farmer field schools (FFS). In each farmer field school 25 farmers at 1:4 female: male ratio. In all 1000
farmers were inducted to PICSA.
3.2. Number of efforts aimed at better
understanding existing activities, new
opportunities, and any limitations of climate services to achieve
scale, replication or sustainability.
• Farmer decision making surveys
• Decision tree and/or choice experiment surveys deployed
with farmers in CSRD field sites
• Decision tree and/or choice experiment surveys data made publicly available on
DATAVERSE following paper completion
Achieved:
• The PICSA activities under CSRD project with
selected 500 farmers in 5 districts in Bangladesh was completed in June 2019. To learn from the farmers
experience and evaluate those farmers who were involved in the PICSA study CIMMYT will conduct the evaluation process.
• Quantitative survey was conducted among randomly selected 280 farmers who participated in the PICSA
field schools during 2018-19 Rabi season in four districts (Barishal, Patuakhali, Dinajpur and Patuakhali).. The survey was administered, using ODK,
by enumerators who were trained by PICSA experts and tested the survey in a pilot with farmers in
Dinajpur. The sample included 171 of men and 109
women. The results showed that the respondents considered PICSA to have a positive on their
livelihoods.
• CIMMYT conducted a more in-depth qualitative study
with a subset of households purposively sampled from
the quantitative survey respondents. A total of 12
CSRD in South Asia Partnership, Annual Report 2018
Page | 96
Pillar Indicator(s) Milestones Measurement method Progress (Jan-Dec 2019)
male and 13 female PICSA trained farmers in Barishal, Patuakhali and Rajshahi districts were interviewed.
The qualitative survey in the Dinajpur district couldn’t be done due to time constraints. For conducting the
qualitative surveys, two CIMMYT research assistants
(one male and one female) were trained by Dr. Samuel Poskitt, Postdoctoral Researcher on
Agricultural Development and Climate Services from the University of Reading. CIMMYT research team is now summarizing the interview notes and the
diagrams. By the end of December 2019, all the raw data including the notes and diagrams will be sent to
the University of Reading for final analysis.
• PANI business model study • Geographically explicit business model study
(quantitative and qualitative) articulating the conditions
under which irrigation scheduling services are most feasible deployed in CSRD
field sites
Achieved: Achievements listed below are for the January-December
2019 period. Readers are referred to the 2018 Annual Report for details of accomplishments from January 2018
to December 2018.
• An literature review was completed to determine components for business model studies that were
deployed and reported on in the 2018 semi-annual report.
• Number of people (disaggregated by gender) in CSRD partner organizations
contributing towards, operating, or using climate
services to improve agricultural decision making
• Participant observation, listing, and validation of collaborators at BMD, DAE,
ICIMOD, IRI and UPF, and BARI contributing towards,
operating, or using climate services to improve agricultural decision making
Achieved:
Achievements listed below are for the January-December 2019 period. Readers are referred to the 2018 Annual
Report for details of accomplishments from January 2018 to December 2018.
• Seven DAE Cadre Officer (male) were trained as ToT
on wheat blast protocol during February 2-4, 2019 in RARS Jashore. One SAAO briefing on wheat blast
protocol was conducted in the respective 7 Upazilas. The trained SAAOs have collected data from their respective fields. Crop cut from 176 selected fields
were also done.
• A training workshop on “Principles and application of
GIS in agriculture planning and decision making” was
CSRD in South Asia Partnership, Annual Report 2018
Page | 97
Pillar Indicator(s) Milestones Measurement method Progress (Jan-Dec 2019)
held during March 11-14, 2019 at the Bangladesh Agriculture Research Council (BARC). 19 (10 male
and 9 female) participants from DAE, BARC, SRDI, BSMRAU, BJRI, SAU, BMD, BARI and BRRI attended
the training. Eight Resource persons from ICIMOD,
one each from CIMMYT and BARC conducted the training.
• During April 16-20, 2019 Officers' Training of Trainers on PICSA for Aman season was held at CSS Ava
Center, Khulna. Dr. Samuel Proskitt from University
of Reading, UK and Mr. Tariful Newaz Kabir from BMD conducted the training for 20 (5 female and 15
male) DAE officers at UAO and AEO.
• During April 29 to May 02, 2019 a training on IRI Climate Data Tools (CDT) and developing a method
for integrating climate data was held under the auspices of ENACTS initiatives. The training was
conducted by Dr. Asher Benjamin Siebert, Postdoctoral Research Scientist at IRI. Four (two male and two female) Meteorologist of BMD Ms. Nayma
Baten, Ms. Shahnaz Sultana, Mr. A K M Nazmul Haque and Mr. Md. Aftab Uddin participated.
• Under the same initiatives, a follow up training was held during June 9-27, 2019. The training was facilitated by Mr. Igor Yurievich Khomyakov of IRI.
The training was attended by ten (two three female and seven male) officers of BMD. Both the trainings
are very useful in data management. These training have enriched the knowledge of the BMD scientists.
Pillar 4: Build
knowledge
4.1. Number of
captured and shared lessons learned (e.g.,
case studies) pertaining to the policy, practice, and research of climate
services development,
1. Report: Report on
crop specific climate thresholds and farmer
decision making framework for key food and income staples
identifying ways to incorporate
• Availability of short
report/case study/success story
Achieved:
Achievements listed below are for the January-December 2019 period. Readers are referred to the 2018 Annual
Report for details of accomplishments from January 2018 to December 2018. This details progress on a narrative report on crop-specific weather constraints and farmers’
decision making processes with respect to crop management and weather in in Bangladesh has been made
CSRD in South Asia Partnership, Annual Report 2018
Page | 98
Pillar Indicator(s) Milestones Measurement method Progress (Jan-Dec 2019)
adoption, and maintenance.
meteorological information.
(See Objective 1, Sub-Objective 1.3, Activity 1.3.1, Product 1).
• A systematic literature review has been completed as described in the 2018 semi-annual report. Crop
specific climate thresholds continue to be refined for
farmer decision making are being refined following CSRD partner feedback. Rather than develop a short
report, information on how the thresholds are being used are being developed and was completed in the
Q3 of 2019 as part of the methodological description
of the improved BMD bulletin described in Objective 1, Sub-Objective 1.3:
2. Report: Farmer decision making survey analysis. Information
used to further refine packaging of climactic
information presented by BMD and DAE.
• Availability of short report/case study/success story
Achieved:
• An entirely new method to estimate potential economic value of weather forecasts termed “hindcast
experiment” is developed. A choice experiment approach to understand the role of seasonal forecasts
in crop choices is also being tested for the first time. It is expected that these methods will become a standard for similar assessments in future.
• Achievements listed below are for the January-December 2019 period. Readers are referred to the
2018 Annual Report for details of accomplishments from January 2018 to December 2018.
• The surveys on farmer decision making and climate
information which included two experiments, 1) “a hindcast experiment” where past weather data is used
to create a series of hypothetical short term forecasts for wheat and rice crops to understand possible farmer responses and constraints and 2) a “choice
experiment” to understand farmers cropping system choices in response to seasonal forecasts are
completed in selected districts in Bangladesh, Nepal and Bihar.
• Understanding the value of short term forecast based
agro-advisory using a climate sensitive decision frame
CSRD in South Asia Partnership, Annual Report 2018
Page | 99
Pillar Indicator(s) Milestones Measurement method Progress (Jan-Dec 2019)
of rice-wheat farmers in Nepal, India and Bangladesh is attempted here using a decision based analysis.
Farmers are presented with the weather data of past year and asked for potential changes in decisions if the
information was available to them with a lead time of
5 days.
• The results show high untapped potential for climate
services that potentially aims to reduce the effect of unsuitable planting dates, heat stress at critical
temperature thresholds and harvest time damages.
These three services can take bulk of the value that will be created for agro-advisories in south Asia. It is
to be noted that hindcast experiments did not evaluate disease forecasts, which has obvious economic benefits. Farmers shows a high interest in
accessing these services and ex-ante evaluation shows that they are indeed capable to increase yield and
income levels in South Asia. The provision of services are only necessary condition to realize its value but not sufficient. It also needs supports from various
fronts from seed supply, financial access, manual and machine labour availability, access to irrigation water
and post-harvest storage structures. The results provide evidence to support further investment in climate services that can generate significant social
welfare effects and lead to enhanced food security for households and the nations.
3. Report: Potential for incorporation of maps
and decision tools into existing decision support platforms
(CARFT, LCAT, CPT, etc.).
• Availability of short report/case study/success
story
In progress:
• Report modified into submission of a peer-reviewed
paper and available on request.
CSRD in South Asia Partnership, Annual Report 2018
Page | 100
Pillar Indicator(s) Milestones Measurement method Progress (Jan-Dec 2019)
4. Report: Business model appropriateness
and results of PANI calibration experiments.
• Availability of short report/case study/success
story
Achieved:
• A short business model report is available upon
request, and was detailed in the 2018 mid-year report.
5. Graphical report
(Maps): Use of historical gridded
climatic data to evaluate the past frequency of occurrence of the
climactic conditions conducive to wheat
blast outbreak
• Availability of short
report/case study/success story
Achieved:
• This report is completed and available in Annex 4 of the 2018 Annual report.
6. Report: STEMPEDIA: Lentil Stemphylium blight
disease forecasting systems in Bangladesh,
Nepal, and India
• Availability of short report/case study/success
story
Achieved:
• An initial report on 2017/18 lentil disease monitoring
and model validation activities will be completed after by Q2 of 2019.
• An initial report on model performance in Nepal, Bangladesh, India will be supplied after the CSRD project is completed in the last season of
experimental evaluations.
• This item is on schedule. Two reports are being
prepared: (i) Full analysis of two years (2017-18 and 2018-19) of field data on lentil Stemphylium and other diseases in Bangladesh, India and Nepal; and (ii) a
manuscript on calibrating, testing and applying Stempedia model under South Asian agro-
environment aiming to publish in a reputed peer reviewed journal.
• Regarding the first report, analysis of lentil
Stemphylium and associated diseases of the collected data from 480 fields in the three countries during
2017-18 season have been completed. Data for 2018-19 season from the similar number of fields are being compiled and analyzed. This report will appear in the
CSRD project completed report due in the end of 2019.
CSRD in South Asia Partnership, Annual Report 2018
Page | 101
Pillar Indicator(s) Milestones Measurement method Progress (Jan-Dec 2019)
• On the second report i.e. publishing a scientific paper, the Stempedia model is being calibrated with 2017-18
datasets. For this, a custom-made R-Program has been development. The aim is to explore the avenues of
improvement of the model, as require, towards
devolving a weather-based forecasting system on aiding farmers in deciding how much and when
fungicide to use in economically managing the Stemphylium disease. The field data from 2017-18
season will be used to independently validate the
model. We are targeting one of the four reputed journals to publish the paper: PLOS One,
Phytopathology, USDopean Journal of Plant Pathology and Australasian Journal of Plant Pathology. The manuscript will be submitted in October 2019.
• Given that accessing weather data on time and space from national weather stations has been a great
constraint to run model in order to provide climate-based disease forecasting, we are exploring utilization of NASA POWER generated weather data that can be
used in the forecasting system. A section of the reports will present this analysis.
7. Report: BMD and DAE forecast and climate services assessment
report
• Availability of short report/case study/success story
Achieved:
• This report has been delivered. Please see the 2016-2017 Annual Report for the report, with implications
discussed in the 2018 mid-year report.
8. Success story or
Case study: At least 10 CSRD case studies and success stories
completed
• Availability of short
report/case study/success story
Achieved:
• During January-December 2019 three success stories related to CSRD were published. The story App decreases delays in data collection describes who to
enhance the time-efficiency of daily weather database creation, CSRD delivered a training to officials on the
Open Data Kit, a user-friendly app for easy data gathering and consolidation. The story titled “Bridging Gap between Theory and Reality” narrates about how
the workshop participants were provided with a more in depth understanding of GIS and similar technologies
CSRD in South Asia Partnership, Annual Report 2018
Page | 102
Pillar Indicator(s) Milestones Measurement method Progress (Jan-Dec 2019)
as well as how to incorporate GIS into their respective fields of work. The third story was about
“Building Resilience against Wheat Blast Disease through Collaborative Research and Action” that
describes what are being done to fight the disease
with help from national and international sources.
• Three communications and news about CSRD were
published during January-June 2019. These are Climate data matters By Tasfia Tasnim published in
DhakaTribune (National Daily, Bangladesh), Stempedia
Model: Fighting Blight in Lentil By M. Shahidul Haque Khan and Sultana Jahan published in CSISA website
and a Photo story: Six Agricultural Innovations Combating Climate Change published in CIMMYT website.
9. Scientific paper: Farmer decision making
structures: What role is there for climate information in
Bangladesh?
• Paper drafted and submitted to open-access, per review
journal
Achieved:
Surveys in Bangladesh, India and Nepal haven been
completed. An additional survey to generate data to link the CaFFSA project on rice-fish and aquaculture systems, a complementary CCAFS project in Bangladesh in
cooperation with WorldFish is also completed as a part of the exit strategy. The scientific article will be submitted in
mid 2020 that will provided detailed results from hindcast experiment framework.
10. Scientific paper:
Opportunities and constraints for agricultural climate
services in Bangladesh
• Paper drafted and submitted
to open-access, per review journal
In progress:
• This paper will be submitted by mid 2020 and is in progress.
11. Scientific paper:
Incorporating forecast information into irrigation scheduling
services in Bangladesh
• Paper drafted and submitted
to open-access, per review journal
In progress:
• Paper under development, submission before 2020 ends.
12. Scientific paper:
Towards early warning • Paper drafted and submitted
to open-access, per review
In progress:
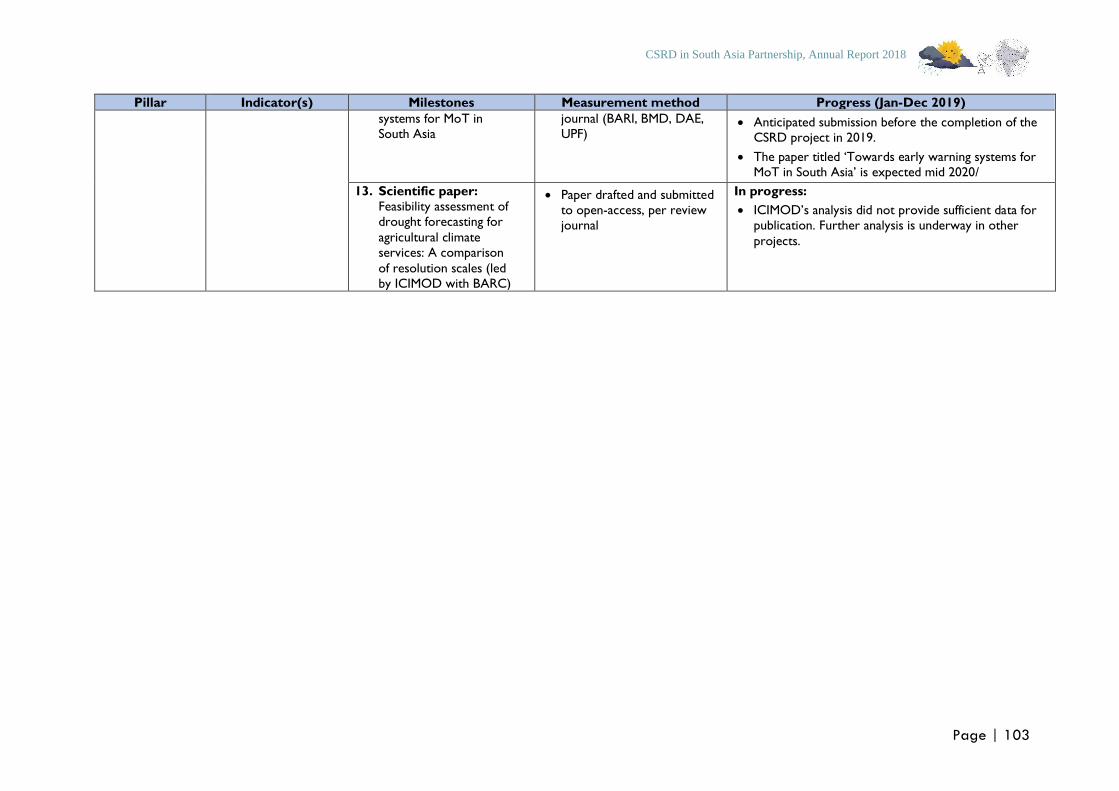
CSRD in South Asia Partnership, Annual Report 2018
Page | 103
Pillar Indicator(s) Milestones Measurement method Progress (Jan-Dec 2019)
systems for MoT in South Asia
journal (BARI, BMD, DAE, UPF)
• Anticipated submission before the completion of the CSRD project in 2019.
• The paper titled ‘Towards early warning systems for MoT in South Asia’ is expected mid 2020/
13. Scientific paper: Feasibility assessment of drought forecasting for
agricultural climate services: A comparison
of resolution scales (led
by ICIMOD with BARC)
• Paper drafted and submitted to open-access, per review journal
In progress:
• ICIMOD’s analysis did not provide sufficient data for publication. Further analysis is underway in other
projects.
CSRD in South Asia Annual Report 2018
Page | 75
Annex 4: In-kind letters of support from partners
International Centre for Climate Change and Development (ICCCAD)
____________________________________________________________ _______________________ _______ Secretariat : Plot – 16, Block-B, Aftabuddin Ahmed Road, Bashundhara R/A, Dhaka- 1212, Bangladesh
Tel- +88-02-840 1645-53, www.iub.edu.bd, www.icccad.net Research Office : House-27 (5th floor), Road-1, Block-A, Bashundhara R/A, Dhaka 1212, Bangladesh
Tel- 880-1760746401, 880-1779754662, E-Mail: [email protected]
Date: 19 December 2019
To
Timothy J. Krupnik Systems Agronomist Climate Services for Resilient Development in South Asia (CSRD) - Project Leader Cereal Systems Initiative for South Asia (CSISA) - Bangladesh Country Coordinator International Maize and Wheat Improvement Center (CIMMYT) | Sustainable Intensification Program House 10/B. Road 53. Gulshan-2. Dhaka, 1213, Bangladesh
Subject: Involvement with in-kind support in the development initiative along with Climate Services for Resilient Development in South Asia (CSRD)
Dear Dr. Krupnik, With this letter, I would like to confirm that International Centre for Climate Change and Development (ICCCAD) at Independent University, Bangladesh (IUB) has been involved with Climate Services for Resilient Development in South Asia (CSRD) Project since the January, 2018. Our 2 researchers along with me and our Deputy Director are involved with the Bangladesh Academy for Climate Services (BACS) as part of the CSRD activities. From the mid of 2019 till the end of this year, we have participated actively in organizing the ENACTS launch workshop and 2nd BACS Short Course, staring from the planning to the report writing. Also, a small team from ICCCAD is closely involved with subgrant from CIMMYT. Other than the above-mentioned activities, ICCCAD team with support from other BACS co-founders are planning to host a session in Gobeshona conference which will be held in January 2020. The team had several adhoc skype meetings in planning the sessions in Gobeshona6. Considering the involvement of our researchers and the institutional policy and payment guideline, the in-kind contribution to CRSD has been estimated at USD 22,000 which is twenty-two thousand dollars. We look forward to continuing our cooperation and support for the important CSRD work. Thank you,
Dr. Saleemul Huq Director International Centre for Climate Change and Development (ICCCAD) at Independent University, Bangladesh (IUB) House: 27, Road: 01, Block: A, Bashundhara R/A, Dhaka-1212 Email: [email protected]
CSRD in South Asia Annual Report 2018
Page | 76
CSRD in South Asia Annual Report 2018
Page | 77
CSRD in South Asia Annual Report 2018
Page | 78
CSRD in South Asia Annual Report 2018
Page | 79
CSRD in South Asia Annual Report 2018
Page | 80
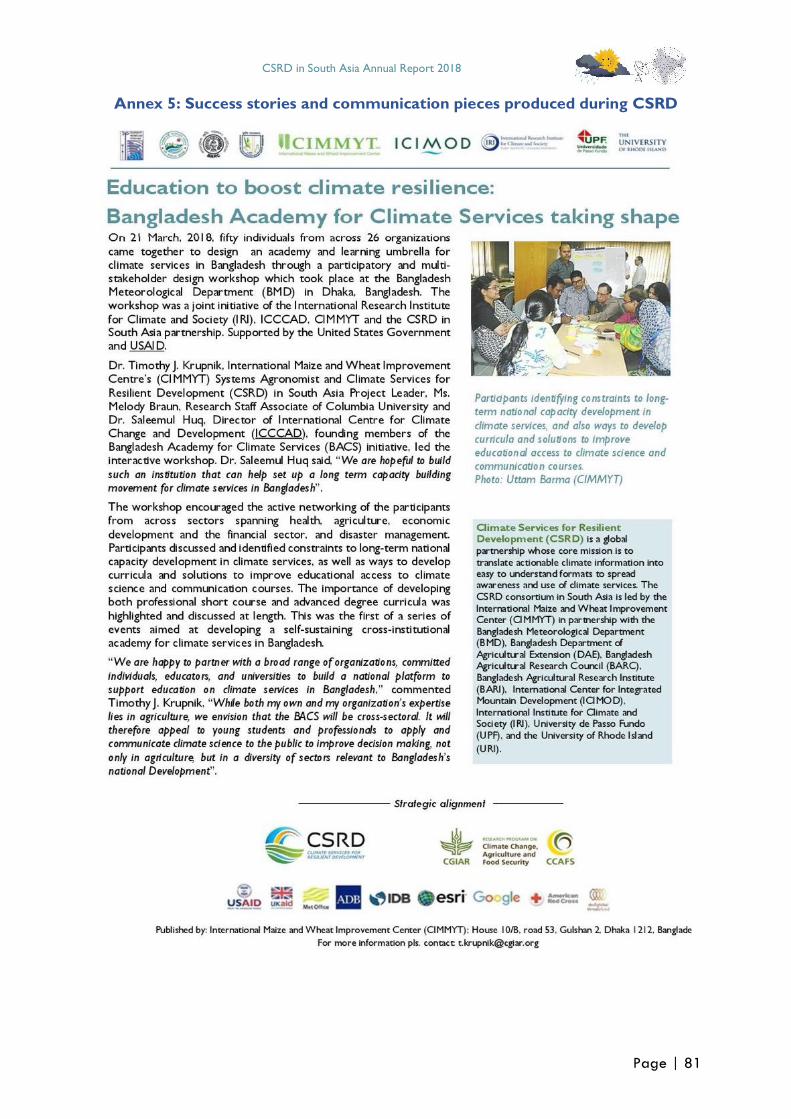
CSRD in South Asia Annual Report 2018
Page | 81
Annex 5: Success stories and communication pieces produced during CSRD
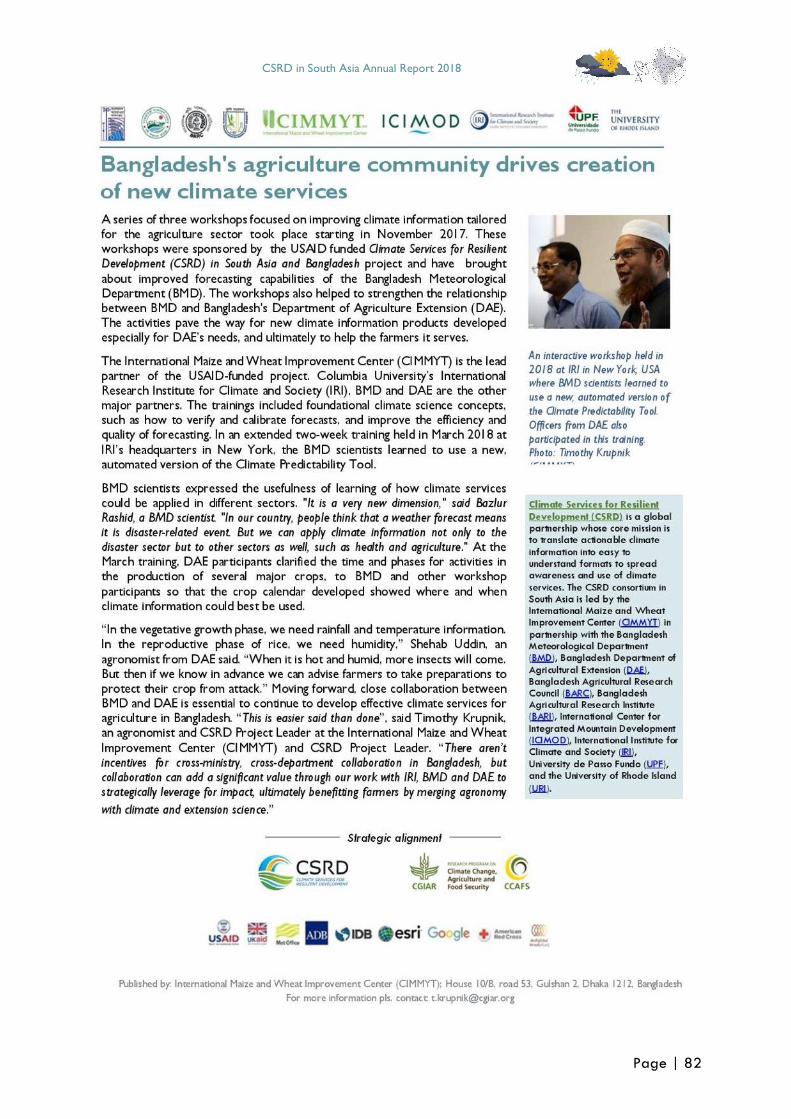
CSRD in South Asia Annual Report 2018
Page | 82
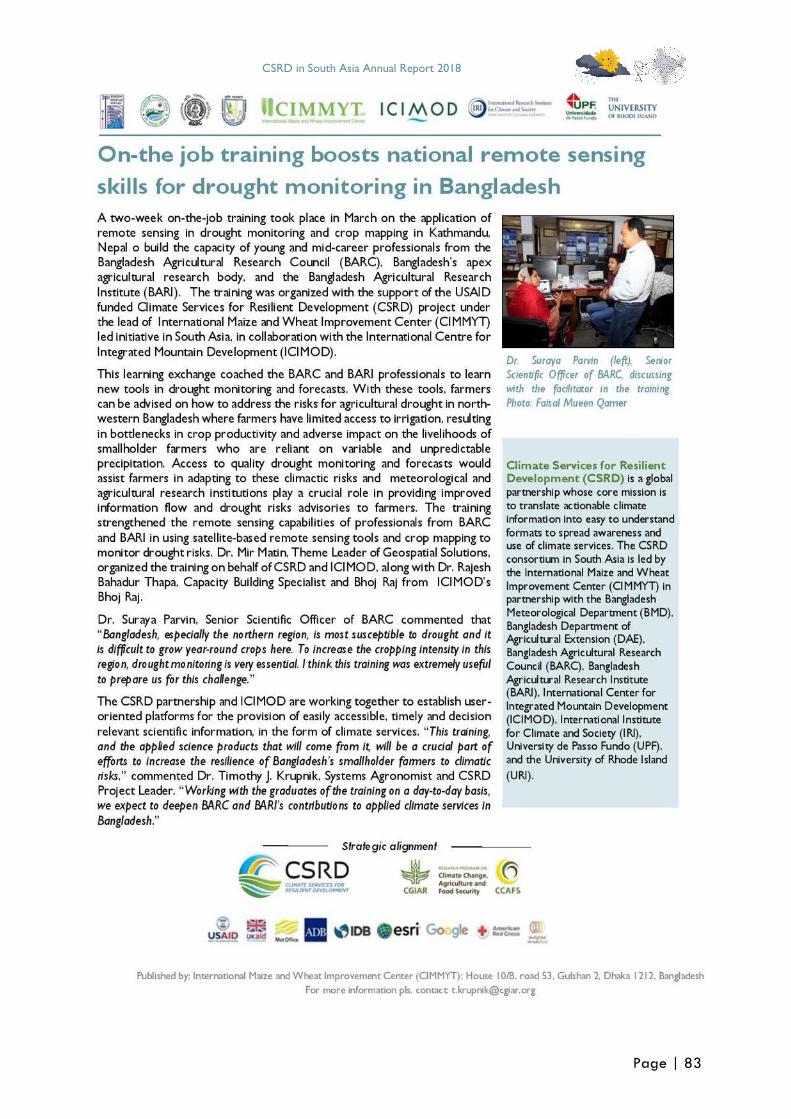
CSRD in South Asia Annual Report 2018
Page | 83
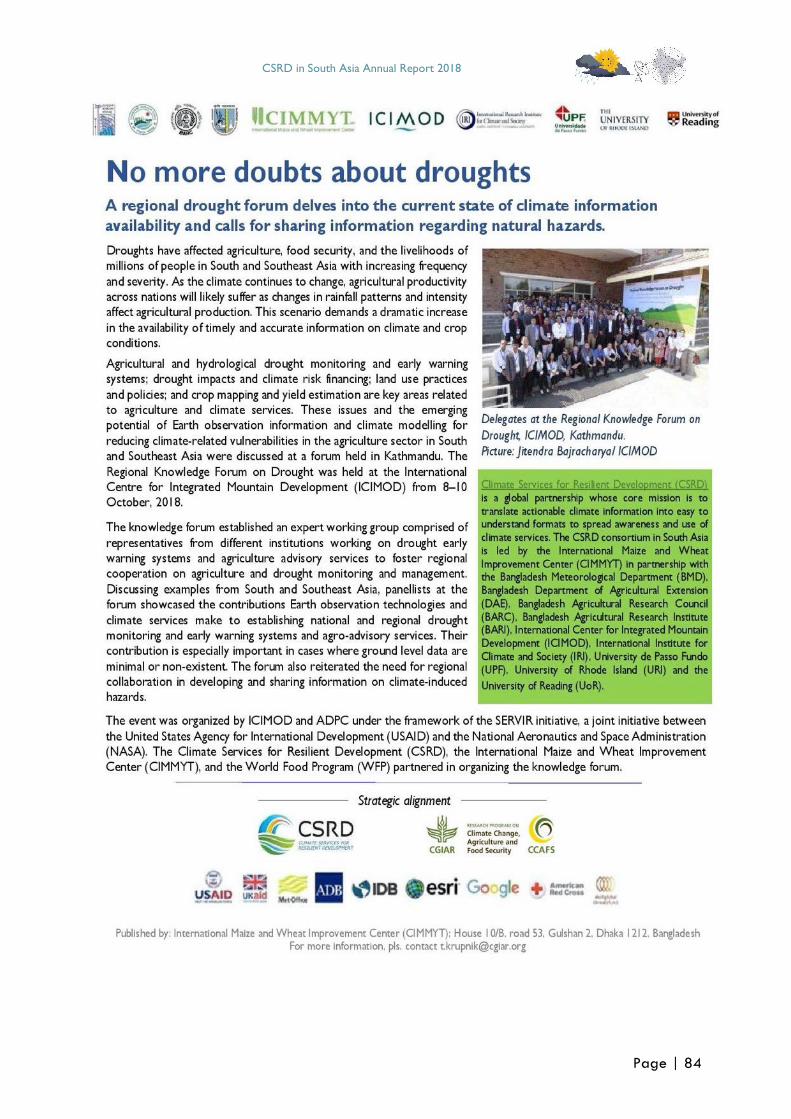
CSRD in South Asia Annual Report 2018
Page | 84
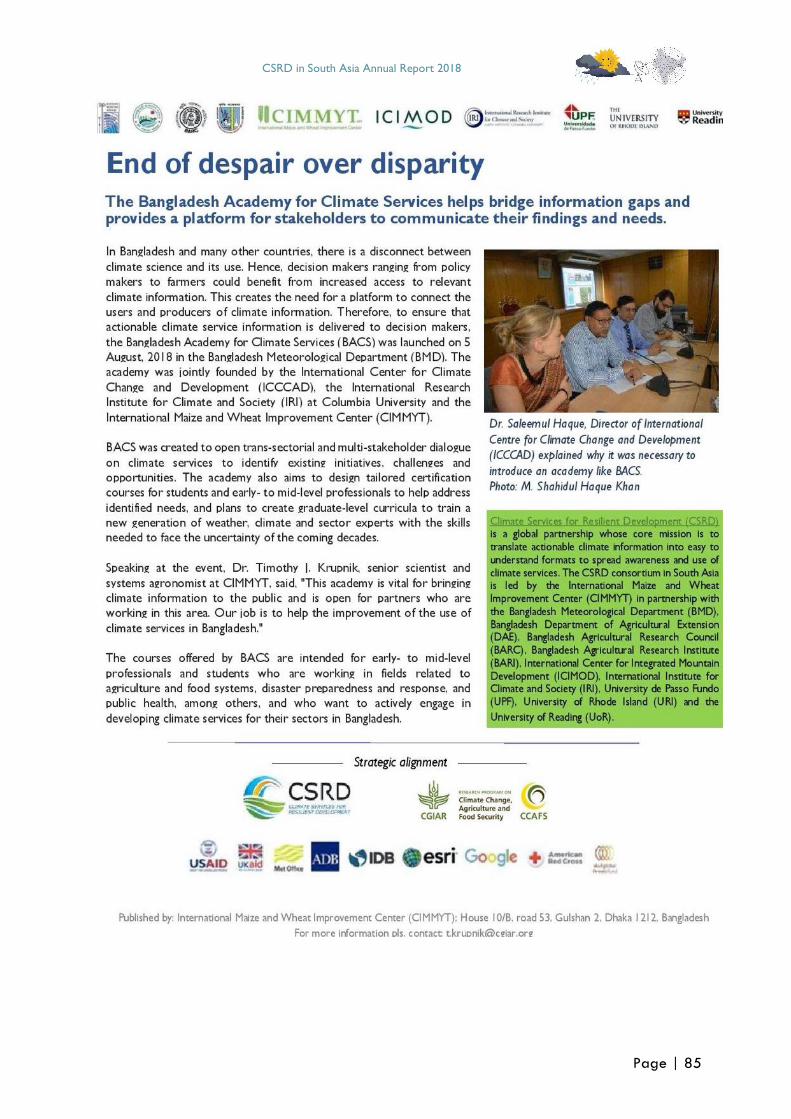
CSRD in South Asia Annual Report 2018
Page | 85
CSRD in South Asia Annual Report 2018
Page | 86
CSRD in South Asia Annual Report 2018
Page | 87
CSRD in South Asia Annual Report 2018
Page | 88
CSRD in South Asia Annual Report 2018
Page | 89
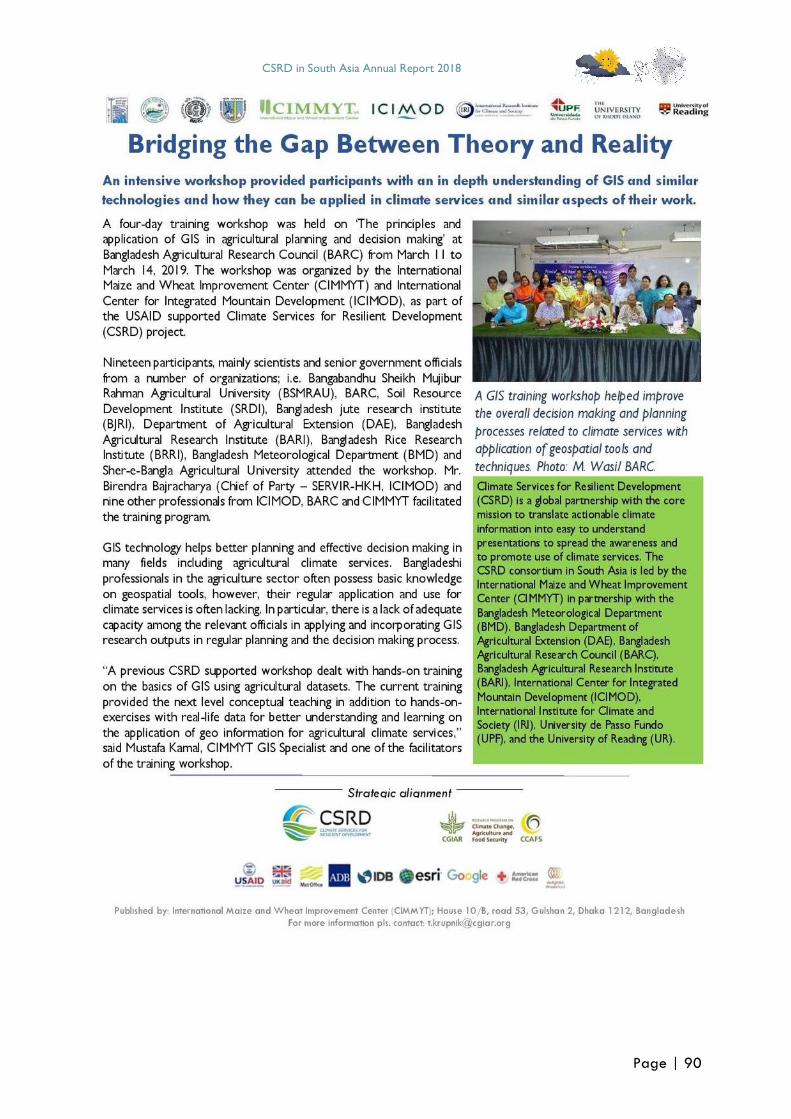
CSRD in South Asia Annual Report 2018
Page | 90
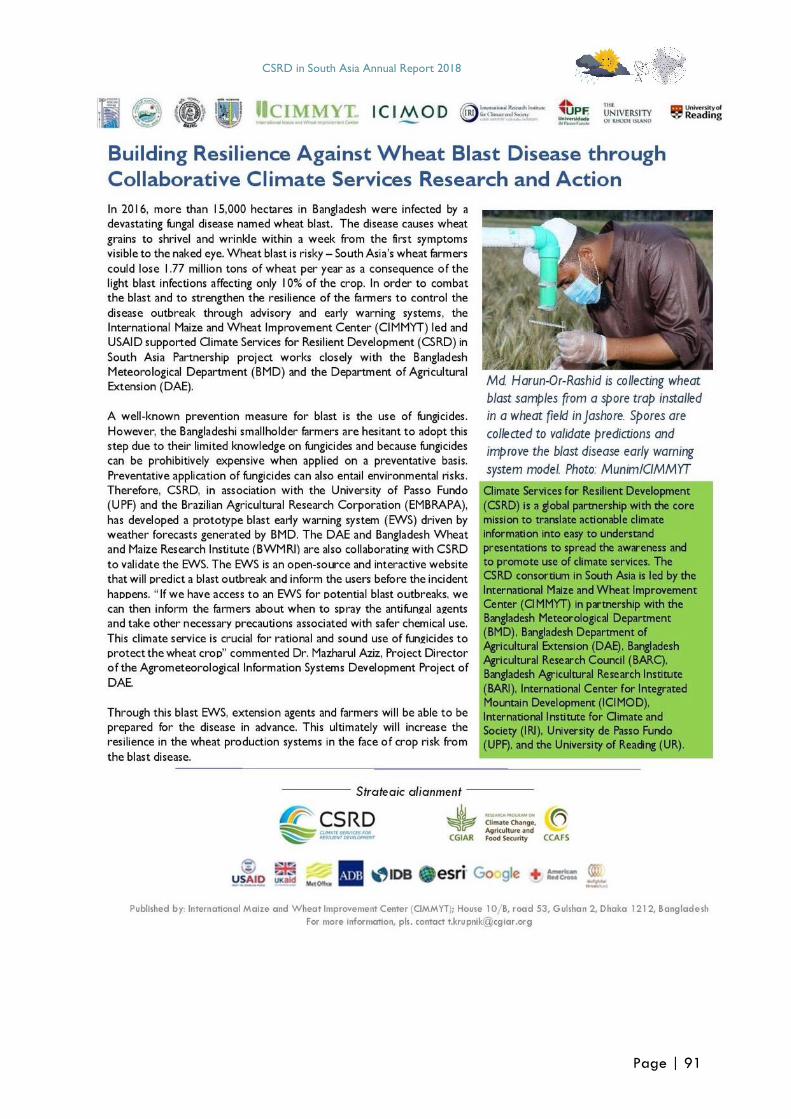
CSRD in South Asia Annual Report 2018
Page | 91
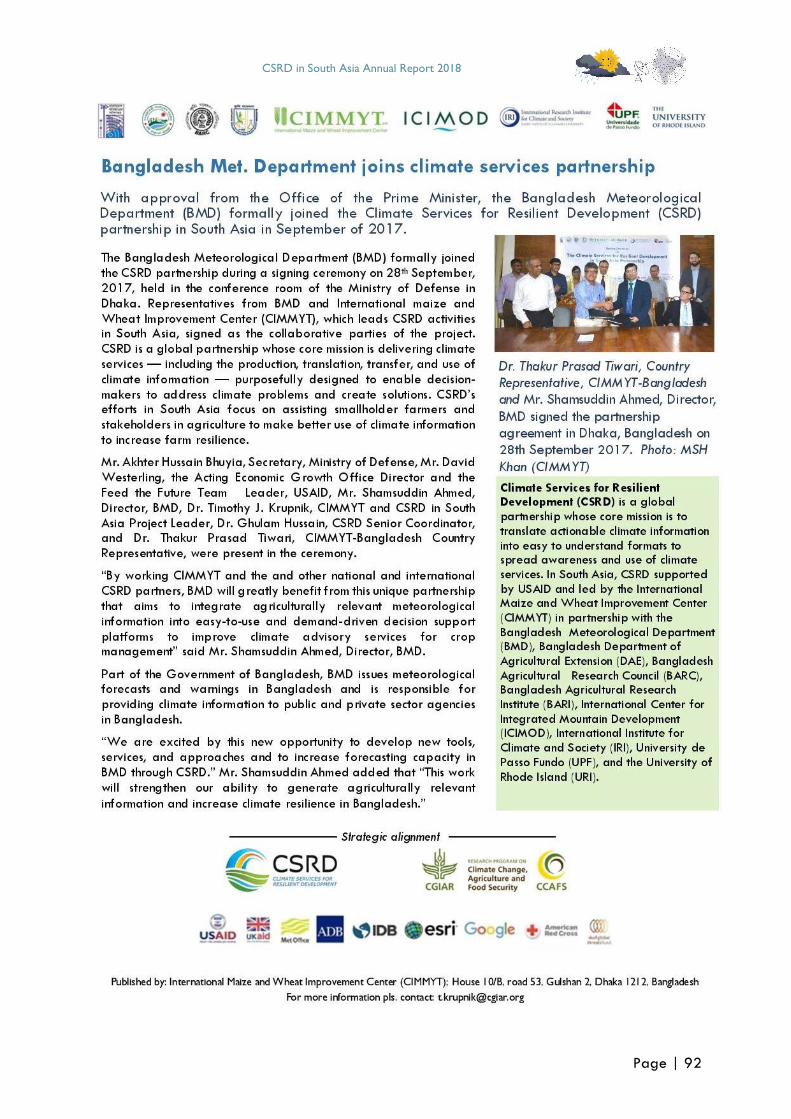
CSRD in South Asia Annual Report 2018
Page | 92
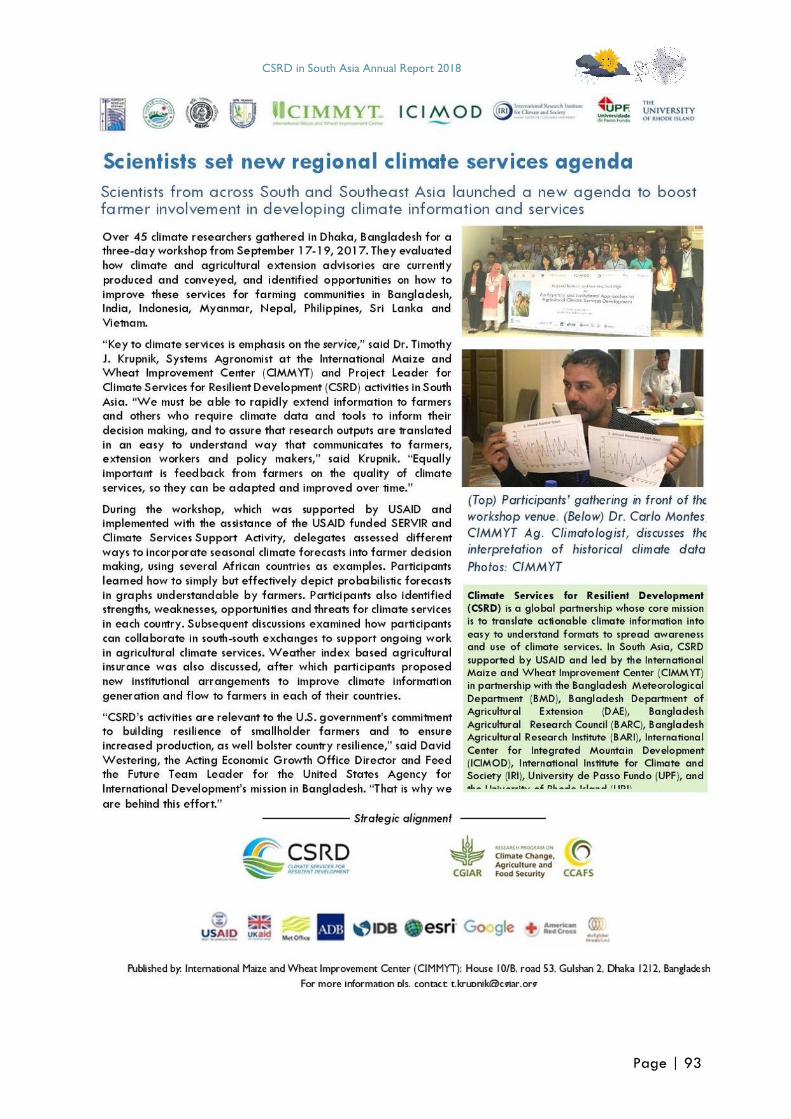
CSRD in South Asia Annual Report 2018
Page | 93
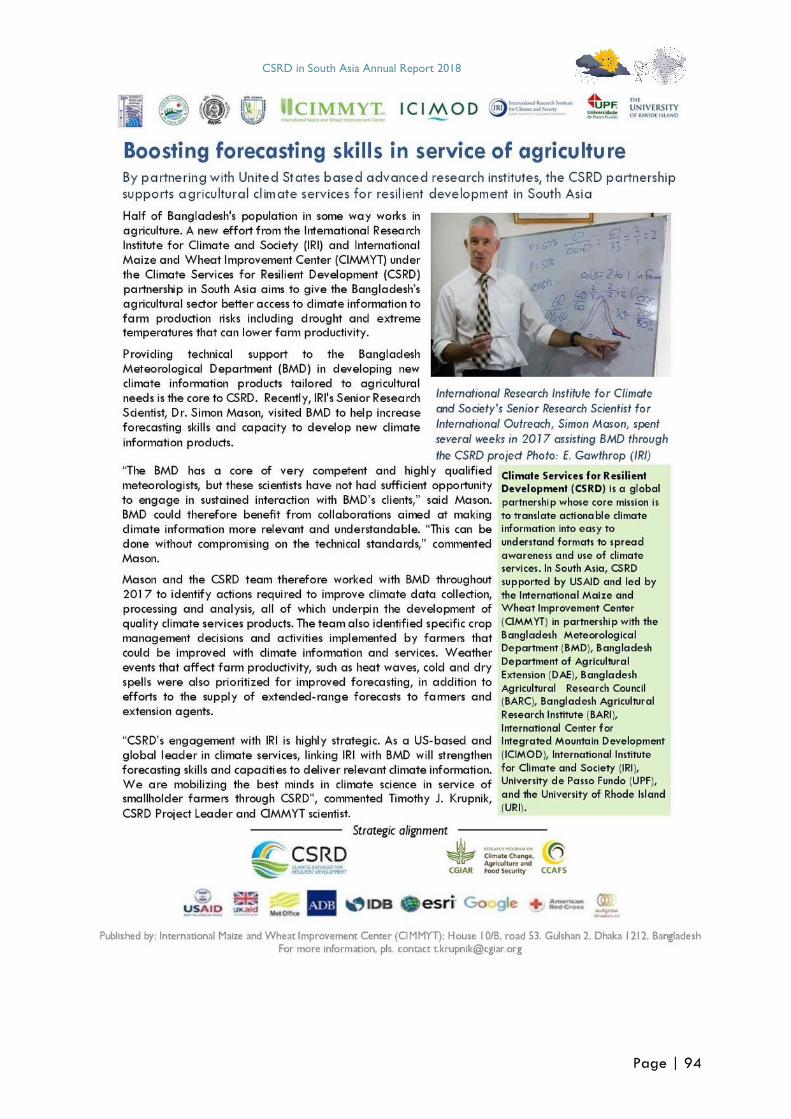
CSRD in South Asia Annual Report 2018
Page | 94
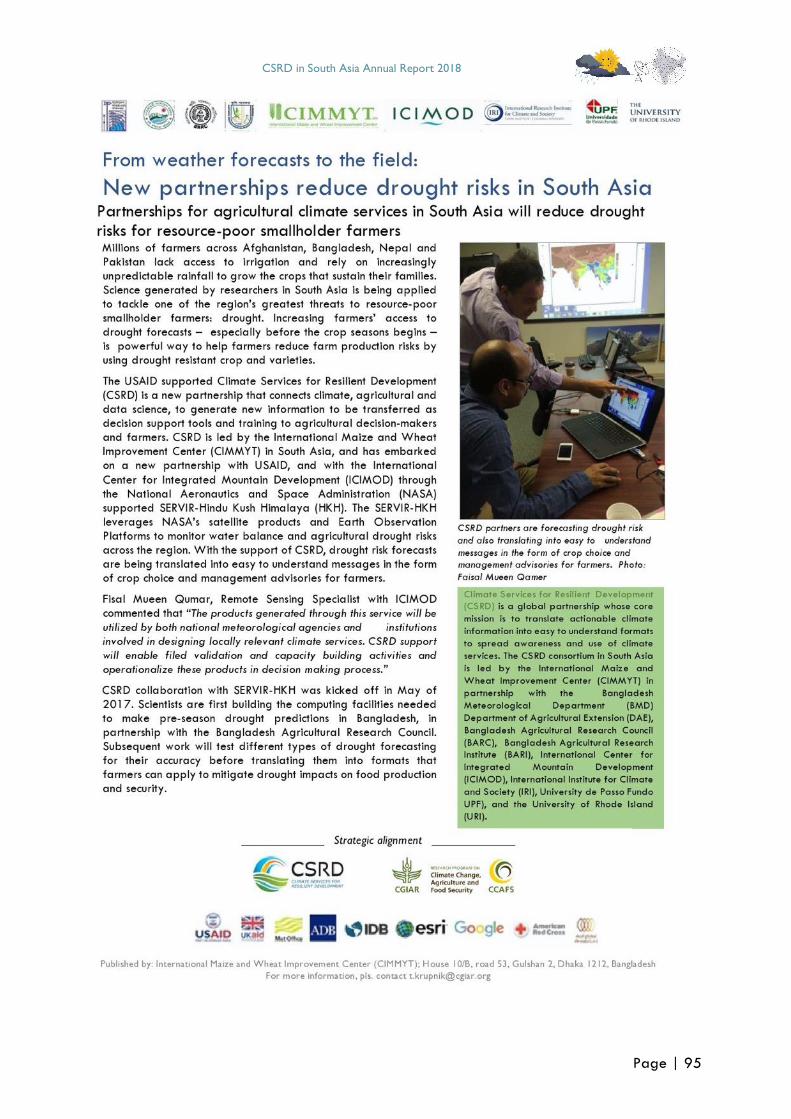
CSRD in South Asia Annual Report 2018
Page | 95
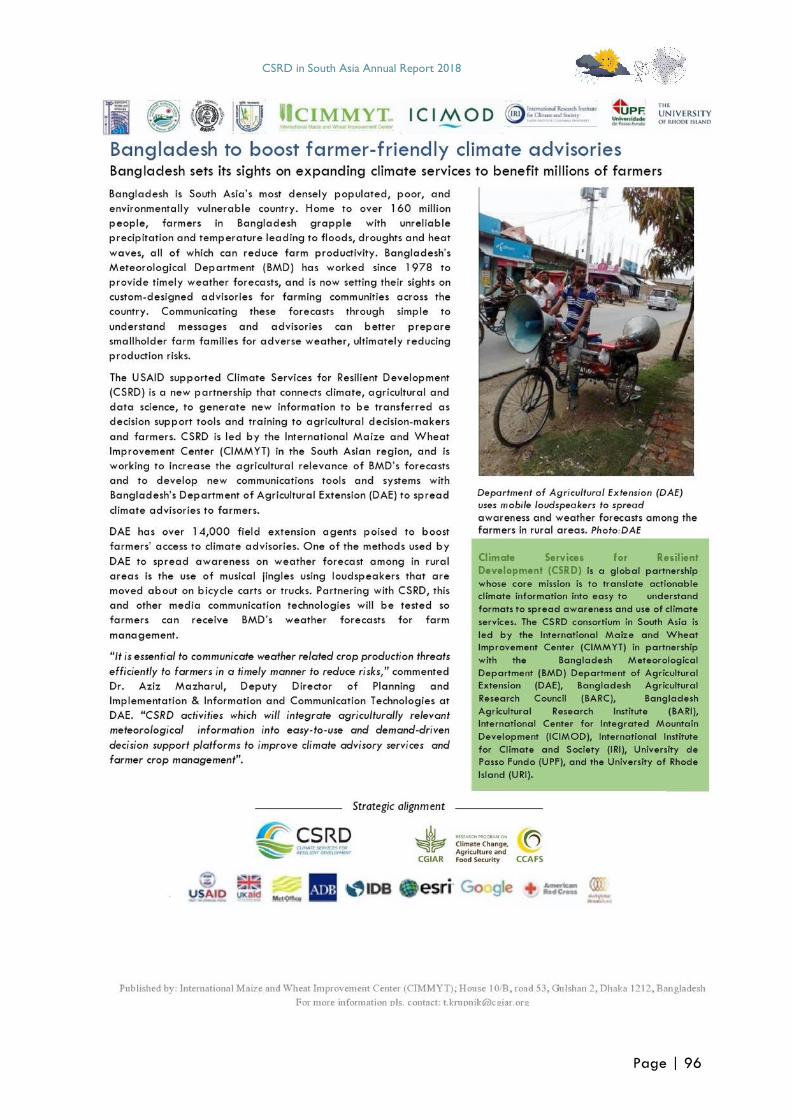
CSRD in South Asia Annual Report 2018
Page | 96
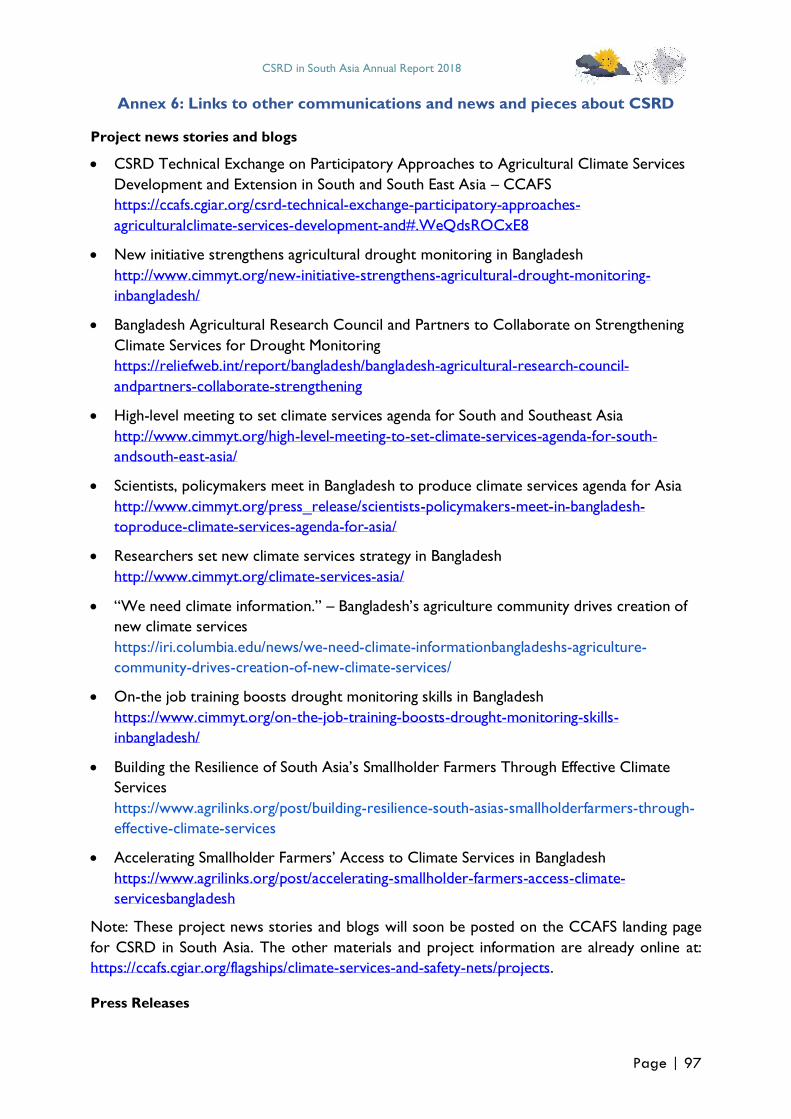
CSRD in South Asia Annual Report 2018
Page | 97
Annex 6: Links to other communications and news and pieces about CSRD
Project news stories and blogs
• CSRD Technical Exchange on Participatory Approaches to Agricultural Climate Services
Development and Extension in South and South East Asia – CCAFS
https://ccafs.cgiar.org/csrd-technical-exchange-participatory-approaches-
agriculturalclimate-services-development-and#.WeQdsROCxE8
• New initiative strengthens agricultural drought monitoring in Bangladesh
http://www.cimmyt.org/new-initiative-strengthens-agricultural-drought-monitoring-
inbangladesh/
• Bangladesh Agricultural Research Council and Partners to Collaborate on Strengthening
Climate Services for Drought Monitoring
https://reliefweb.int/report/bangladesh/bangladesh-agricultural-research-council-
andpartners-collaborate-strengthening
• High-level meeting to set climate services agenda for South and Southeast Asia
http://www.cimmyt.org/high-level-meeting-to-set-climate-services-agenda-for-south-
andsouth-east-asia/
• Scientists, policymakers meet in Bangladesh to produce climate services agenda for Asia
http://www.cimmyt.org/press_release/scientists-policymakers-meet-in-bangladesh-
toproduce-climate-services-agenda-for-asia/
• Researchers set new climate services strategy in Bangladesh
http://www.cimmyt.org/climate-services-asia/
• “We need climate information.” – Bangladesh’s agriculture community drives creation of
new climate services
https://iri.columbia.edu/news/we-need-climate-informationbangladeshs-agriculture-
community-drives-creation-of-new-climate-services/
• On-the job training boosts drought monitoring skills in Bangladesh
https://www.cimmyt.org/on-the-job-training-boosts-drought-monitoring-skills-
inbangladesh/
• Building the Resilience of South Asia’s Smallholder Farmers Through Effective Climate
Services
https://www.agrilinks.org/post/building-resilience-south-asias-smallholderfarmers-through-
effective-climate-services
• Accelerating Smallholder Farmers’ Access to Climate Services in Bangladesh
https://www.agrilinks.org/post/accelerating-smallholder-farmers-access-climate-
servicesbangladesh
Note: These project news stories and blogs will soon be posted on the CCAFS landing page
for CSRD in South Asia. The other materials and project information are already online at:
https://ccafs.cgiar.org/flagships/climate-services-and-safety-nets/projects.
Press Releases
CSRD in South Asia Annual Report 2018
Page | 98
• Scientists, policymakers meet in Bangladesh to produce climate services agenda for Asia
http://www.cimmyt.org/press_release/scientists-policymakers-meet-in-bangladesh-to-
produceclimate-services-agenda-for-asia/
Agrilinks website
• Building the Resilience of South Asia’s Smallholder Farmers Through Effective Climate
Services –
https://www.agrilinks.org/post/building-resilience-south-asias-smallholder-farmers-through-
effective-climate-services
• Accelerating Smallholder Farmers’ Access to Climate Services in Bangladesh: CIMMYT,
which leads CSRD in South Asia, is partnering with the Bangladesh Meteorological
Department (BMD), the Department of Agricultural Extension (DAE) and the University
of Reading in the United Kingdom, to adapt and pilot the ‘Participatory Integrated Climate
Services for Agriculture’ (PICSA) approach across 20+ villages in Bangladesh in 2018
https://www.agrilinks.org/post/accelerating-smallholder-farmers-access-climate-services-
bangladesh
CCAFS website
• Expanding horizons: The Bangladesh Academy for Climate Services – M. Shahidul Haque
Khan.
A first of its kind in Bangladesh, an academy was launched with the aim to embed climate
thinking in decision-making processes and close the gap between climate information
providers and end users.
https://ccafs.cgiar.org/news/expanding-horizons-bangladesh-academy-climate-
services#.XCCENVwzaUn
• Newly founded Bangladesh Academy for Climate Services held its first training course
Sector leaders in Bangladesh gathered at the Bangladesh Academy for Climate Services
training to learn about climate services and using climate information in decision-making.
https://ccafs.cgiar.org/news/newly-founded-bangladesh-academy-climate-services-held-its-
first-training-course#.XCCT8VwzaUl
CIMMYT website
• In pictures: Six agricultural innovations combating climate change – The photo
story from the International Maize and Wheat Improvement Center (CIMMYT) shows the
advantages of joint action by farmers, researchers, governments, not-for-profits and
businesses.
https://www.cimmyt.org/multimedia/in-pictures-six-agricultural-innovations-combating-
climate-change/
• On-the job training boosts drought monitoring skills in Bangladesh – A two-
week on the job training was organized with the support of the International Maize and
Wheat Improvement Center (CIMMYT)-led Climate Services for Resilient Development
(CSRD) initiative in South Asia, alongside the International Centre for Integrated
Mountain Development (ICIMOD).
https://www.cimmyt.org/on-the-job-training-boosts-drought-monitoring-skills-in-
CSRD in South Asia Annual Report 2018
Page | 99
bangladesh/
• Photo story: Six Agricultural Innovations Combating Climate Change
Highlights some encouraging innovations for improving resilience and productivity for
agriculture under climate change. These examples from the International Maize and
Wheat Improvement Center (CIMMYT) show the advantages of joint action by farmers,
researchers, governments, not-for-profits and businesses.
https://spark.adobe.com/page/Al071WqwodPXJ/
Dhaka Tribune website
• Bangladesh Academy for Climate Services launched – SM Abrar Aowsaf
Bangladesh Academy for Climate Services (BACS) was launched at the Bangladesh
Meteorological Department (BMD) in Dhaka, Bangladesh. BACS has been created to open
trans-sectoral and multi-stakeholder dialogue on climate services to identify existing
initiatives, challenges and opportunities.
https://www.dhakatribune.com/bangladesh/dhaka/2018/08/06/bangladesh-academy-for-
climate-services-launched
• Climate data matters – Tasfia Tasnim
To bridge the gap between climate scientists and decision makers, Bangladesh
Meteorological Department (BMD) together with the International Center for Climate
Change and Development (ICCCAD), the International Wheat and Maize Improvement
Center (CIMMYT), and the International Research Institute for Climate and Society (IRI)
at Columbia University have jointly founded a climate services academy and started
offering short courses.
https://www.dhakatribune.com/climate-change/2019/02/18/climate-data-matters
ICIMOD website
• Bangladesh Agricultural Research Council and Partners to Collaborate on Strengthening
Climate Services for Drought Monitoring – ICIMOD
The International Centre for Integrated Mountain Development (ICIMOD), the
Bangladesh Agricultural Research Council (BARC), and the International Maize and Wheat
Improvement Centre (CIMMYT) organized a day-long consultation and user engagement
workshop on collaborative development of agricultural drought monitoring services in
Bangladesh.
https://reliefweb.int/report/bangladesh/bangladesh-agricultural-research-council-and-
partners-collaborate-strengthening
IRI website
• “We need climate information.” – Bangladesh’s agriculture community drives creation of
new climate services – Elisabeth Gawthrop
A series of training workshops were conducted to improve the forecasting capabilities of
the Bangladesh Meteorological Department (BMD), while also strengthening the
relationship between BMD and Bangladesh’s Department of Agriculture Extension (DAE).
The activities focused on new climate information products developed especially for
DAE’s needs, which would ultimately to help the farmers it serves.
https://iri.columbia.edu/news/we-need-climate-information-bangladeshs-agriculture-
CSRD in South Asia Annual Report 2018
Page | 100
community-drives-creation-of-new-climate-services/
• Creating Climate Services in Bangladesh – Elisabeth Gawthrop
4th annual Gobeshona Conference for Research on Climate Change was held in
Bangladesh. The conference focused on research-based solutions to local vulnerabilities in
Bangladesh and brought together researchers, policymakers, government and non-
government representatives, donor agencies and international organizations.
https://iri.columbia.edu/news/creating-climate-services-in-bangladesh/
• Climate mapping tools support resilient development in East Africa – Tesfamariam
Tekeste
IRI helped to organize the Climate Services for Resilient Development (CSRD) Technical
Exchange workshop in Zanzibar on August 2017, which was held immediately after the
47th Greater Horn of Africa Climate Outlook Forum (GHACOF47) in order to capitalize
on the presence of many climate and sector experts from across the region.
https://iri.columbia.edu/news/mapping-tools-to-support-climate-services-in-east-africa/
CSISA website
• Stempedia Model: Fighting Blight in Lentil – M. Shahidul Haque Khan and Sultana Jahan
CSRD, in collaboration with CSISA project, mobilized national partners and collected data
on the incidence and severity of Stemphylium blight to enable national scientists and
extension officers in Bangladesh, India and Nepal to test the Stempedia model and assess
the regional and seasonal risks of Stemphylium blight occurring.
https://csisa.org/stempedia-model-fighting-blight-in-lentil-2/
Videos on CSRD
• Overcoming Barriers to Partnership for Climate Services and Agriculture in Bangladesh:
Video produced by Elizabeth Gawthrop at IRI on collaboration between CIMMYT, IRI,
BMD and DAE to build capacity for climate services in Bangladesh.
https://vimeo.com/344367748
• IRI Training to support Climate Services for Resilient Development (CSRD) in South Asia:
Video produced by Elizabeth Gawthrop at IRI on intensive climate services training
through CSRD at IRI for national partners Bangladesh.
https://vimeo.com/344367779
News on regional drought monitoring facilitated by CSRD
• Regional drought outlook system launched at SAARC regional training in Islamabad –
Pakistan Agricultural Research Council
• Regional drought outlook system launched at SAARC regional training in Islamabad –
Parliament Times (Pakistan)
• New Drought Monitoring System Will Reduce Climate Risks for South Asian Farmers –
ReliefWeb
CSRD in South Asia Annual Report 2018
Page | 101
Annex 7: Agvisely: Methodology and approach used to generate automated and
location-specific agricultural climate information services for farmers in
Bangladesh
SK Ghulam Hussain, Mutasim Billah, Faisal Washik, Aziz Mazharul, Md. Abdul. Mannan, Carlo
Montes, Timothy J. Krupnik
1. Background
Bangladeshi farmers experience considerable variability in two important climatic parameters –
temperature and precipitation – upon which the productivity of several crops are partially
dependent. To improve resilience to climate variability and extremes, smallholder farmers in
Bangladesh can benefit from timely access to weather forecasts and complementary crop
management advisories. The ways in which the data generated to develop advisories, however,
is of key importance. Advisories both scientifically valid and also easy for farmers to understand
and implement.
For each phase in the growth of plants, there is a temperature range within which growth and
development is optimum. When the temperature drops below a certain minimum or exceeds
a certain maximum value plant growth stops. These three temperature points are the cardinal
or threshold temperatures for a given plant. The lowest temperature at which crop growth can
occur is referred to as the base temperature; which is also known as the minimum cardinal
temperature. The maximum cardinal temperature is the highest temperature above which plant
growth can stops (Alvarado and Bradford, 2002; TNAU, 2018). Crop species including rice,
wheat, maize, potato and pulses, all tend have an optimum range of temperatures for normal
growth and development. This thermal range depends not only on the species but also on the
phenology or growth and developmental stages of a given crop, in addition to the varietal
characteristics of a particular cultivar. When temperature crosses above or below this optimal
range, the crop can experience stress that may adversely affect growth and yield. Therefore,
knowing the upper threshold (i.e., the temperature above which interference in growth and
developmental processes can be expected) and the lower threshold (i.e., the temperature
below which plant growth and development may be hampered), can be useful for advising
farmers methods to increase resilience to climate extremes.
Scientists have developed complex crop growth models that relate precipitation and
atmospheric, soil, and water temperatures to the growth rates of many crop species and
cultivars. This detailed mechanistic understanding is useful from a research perspective, but
maybe less actionable when used to develop practical and daily recommendations to tens of
thousands or even millions of farmers growing diversity of varieties in different locations or
that may be in different crop growth stages. In order to simplify and generalize advisories for
very large groups of farmers – such as those in population dense Bangladesh – the methods
described below consider atmospheric thermal stress thresholds in reference to crop species
but not particular varieties. When integrated with temperature forecasts on a down-scaled and
localized basis, we have aimed to provide ‘rule of thumb’ recommendations to farmers on
methods to overcome thermal stresses and to more wisely economize on precipitation by
optimizing irrigation, while also avoiding within-field waterlogging risks.
The text below describes how work conducted in the Climate Services for Resilient
Development (CSRD) in South Asia project and the Cereal Systems Initiative for South Asia
CSRD in South Asia Annual Report 2018
Page | 102
(see Agvisely Methods Appendix I) that led to the development of the Agvisely climate services
decision support tool. Researchers involved with these projects developed ranges for the
phenological growth stages of major crops within Bangladesh. The methods used to do this are
detailed with a description of a systematic literature review to define species- and phenological
stage-specific thermal stress thresholds. We then explain how weather forecast model outputs
are retrieved from the Bangladesh Meteorological Department and applied to these thresholds,
after which the ways in which we generated automatic climate-smart recommendations for
farmers at the sub-district scale for a variety of crops are discussed.
2. Determining Phenology and Growth Stages of Major Field Crops of Bangladesh
In Bangladesh, rice (Oryza sativa) is grown in three seasons: ‘boro‘, ‘aus‘, and ‘aman‘
corresponding to the winter, spring and summer cropping season. Since boro and aus can
overlap, their growing seasons can also be classified as relatively dry in comparison to the
wetter monsoon aman season. Boro season rice is mostly transplanted in January-February and
harvested in May-June. Aus is mostly broadcast direct-seeded. Seeds are sown during March-
April and harvested in July-August. In the aman season, rice seeding is done at the beginning of
the rainy season (July-August) and harvested in November-December. In most cases, 25-35-
day-old seedlings are recommended for transplanting. Other common field crops – wheat
(Triticum aestivum), maize (Zea mays), potato (Solanum tuberosum), and lentil (Lens culinaris)
considered are ‘rabi’ winter season crops grown generally from October through May. During
late Rabi or pre-kharif (January-May) mung bean [Vigna radiata (L.) R. Wilczek] is grown in the
country.
It is important to note that these dates are presented in broad ranges. This is because the actual
dates on which farmers may establish crops can vary considerably, both on a localized scale,
but also nationally. For example, there are typically large north-south gradients in the timing of
crop establishment in Bangladesh because of cropping systems, flooding, on set of monsoon,
etc. Many crops, both tropical and temperate origin, are cultivated in the country. Agricultural
land use at a local level is determined by the spatial and temporal distribution of crops or
cropping patterns. While, cropping pattern depends on the physiography, agricultural land
availability, environment, and socioeconomic conditions of a particular area. (Nasim et al., 2017,
Hasan et al., 2013, Shahidullah, et al., 2006). In addition to sowing and transplanting dates, the
phenology of field crops also varies with the duration of the crop in question, which is strongly
affected by the cultivar grown by farmers (BRRI, 2019; BARI, 2019; BINA,2017).
The purpose of Agvisely is to provide a national climate information service for farmers. The
complexity of seasons, sowing and transplanting dates, and diversity of cultivars grown in
Bangladesh however makes the generation of extremely localized and variety- or farmer-specific
information challenging. For example, two farmers growing the same variety of rice could
establish their crops several weeks apart from one another, despite having neighbouring fields
or using the same variety. Similarly, farmers tens or even hundreds of kilometres apart could
establish their crops on the same day, but the use of intermediate vs. a short duration variety
will have strong effects on the speed of crop growth. To make things more complex, there are
more than 90 varieties of rice that have been released by the Bangladesh Rice Research Institute
(BRRI, 2019), and potentially hundreds more local varieties grown by farmers (Kamruzzaman,
et al., 2017).
CSRD in South Asia Annual Report 2018
Page | 103
This complexity makes detailed climate information service recommendations challenging, and
calls for a simpler and actionable approach. We therefore aimed to estimate a generalizable
‘window’ of sowing and transplanting dates for the whole of Bangladesh by considering the
potential earliest and latest date within the cropping season when farmers can seed or
transplant their crops. We then calculated the generalized number of days required to complete
sequential phenological states based on information on phenological durations of crops in
Bangladesh based on the sowing, transplanting and harvesting dates provided by the Agricultural
Research Institutes (ARIs) of Bangladesh National Agricultural Research System (NARS) [BRRI,
2019; BARI, 2019].
For example, boro rice sowing typically occurs over a very long period in Bangladesh, which we
estimated in a range from the earliest possible establishment on October 31 to the latest
reasonable seeding date of December 15. After sowing, boro rice requires about 5 days to
emerge, and another 45 days before seedlings are uprooted and transplanted. As such, the
decision tree algorithm used in Agvisely assumes that transplanting is likely to take place all over
Bangladesh within the window of December 15 and January 30, respectively. About ten more
days will be required for the crop to recover from transplanting shock. Following this, maximum
tillering of boro will be reached in the next 45 days. Booting and flowering will require roughly
ten more days each, with and ripening and maturity in the following 25 to 30 days i.e., between
March 30 to April 30. Table A7.1 summarizes the phenological stage ‘windows’ growth for
major field crops of Bangladesh used in Agvisely. The phonological stages and approximate stage
to stage duration (days) for rice (Yoshida, 1981; IRRI, 2018), wheat (Large, 1954; Acevedo et
al., 2002), maize (Pringle, 2017), potato (Obidiegwu et al., 2015), mung bean (Chauhan et al.,
2010) and lentil (Sen et al., 2016) were estimated based on the literature cited.
3. Crop Species Specific Thermal Stress Thresholds
Given their importance globally and also in Bangladesh, a systematic literature review was
undertaken to identify appropriate thermal stress thresholds for different phenological stages
of rice, wheat, and maize. The literature review was carried out using four databases including
Scopus, Web of Science, CAB Direct and AGRICOLA. Comprehensive strings of database-
specific search queries/criteria were developed to identify thresholds from literature. An
example of a search query for the Scopus database, the following search string was applied in
the stated and the same key search terms was used to search for grey literature.
(TITLE-ABS-KEY (heat OR “high temp*” OR “high-temp*” OR “heat stress” OR
“heat-stress” OR “thermal stress” OR “thermal-stress” OR cold OR “cold
temp*” OR “cold-temp*” OR “cold stress” OR “cold-stress” OR “terminal heat stress” OR “terminal heat-stress” OR “terminal heat” ) AND ABS ( "zea mays"
OR maize OR corn OR "triticum aestivum" OR wheat OR "oryza sativa" OR
rice ) AND ABS ( yield ) )
Where TITLE-ABS-KEY means a search in the title, abstract, and keywords fields, * replaces
zero or more characters or truncates the search item, and ABS means a search in the abstract,
while OR and AND are operators. Resulting citations were stored in EndNote (Ver 8, Clarivate
Analytics). The combination of all searches on thermal stresses resulted in 24,506 articles
(Figure A7.1).
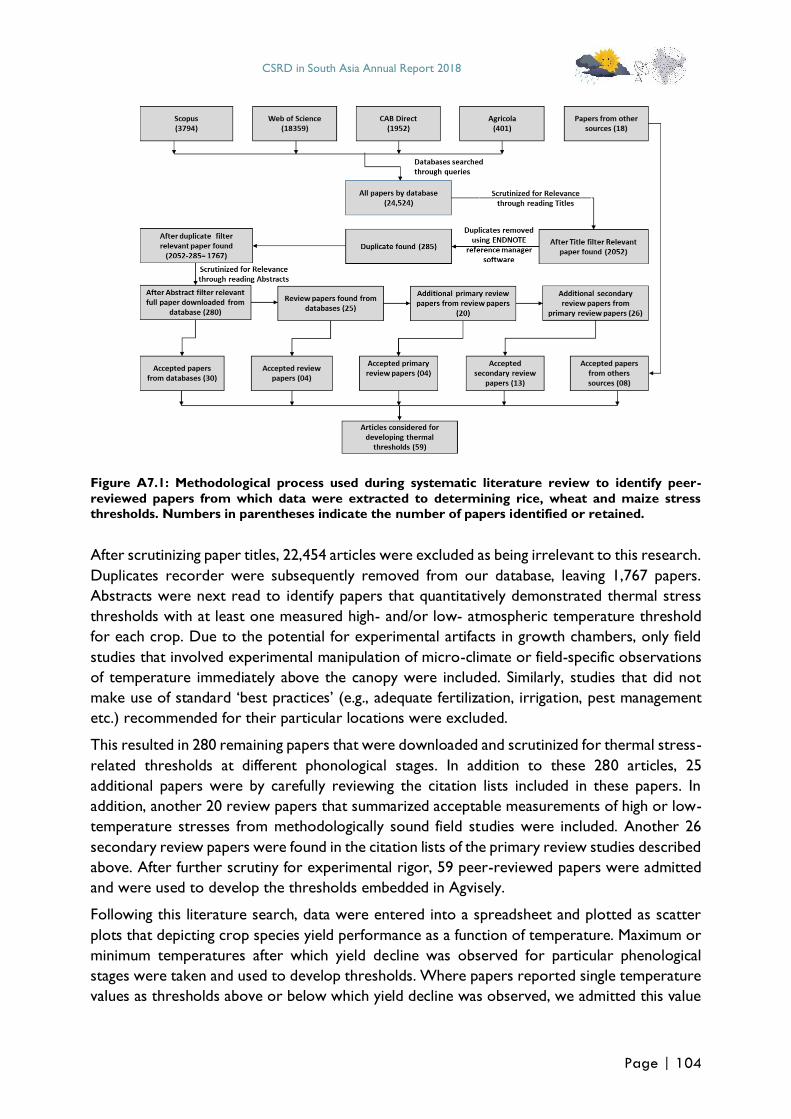
CSRD in South Asia Annual Report 2018
Page | 104
Figure A7.1: Methodological process used during systematic literature review to identify peer-
reviewed papers from which data were extracted to determining rice, wheat and maize stress
thresholds. Numbers in parentheses indicate the number of papers identified or retained.
After scrutinizing paper titles, 22,454 articles were excluded as being irrelevant to this research.
Duplicates recorder were subsequently removed from our database, leaving 1,767 papers.
Abstracts were next read to identify papers that quantitatively demonstrated thermal stress
thresholds with at least one measured high- and/or low- atmospheric temperature threshold
for each crop. Due to the potential for experimental artifacts in growth chambers, only field
studies that involved experimental manipulation of micro-climate or field-specific observations
of temperature immediately above the canopy were included. Similarly, studies that did not
make use of standard ‘best practices’ (e.g., adequate fertilization, irrigation, pest management
etc.) recommended for their particular locations were excluded.
This resulted in 280 remaining papers that were downloaded and scrutinized for thermal stress-
related thresholds at different phonological stages. In addition to these 280 articles, 25
additional papers were by carefully reviewing the citation lists included in these papers. In
addition, another 20 review papers that summarized acceptable measurements of high or low-
temperature stresses from methodologically sound field studies were included. Another 26
secondary review papers were found in the citation lists of the primary review studies described
above. After further scrutiny for experimental rigor, 59 peer-reviewed papers were admitted
and were used to develop the thresholds embedded in Agvisely.
Following this literature search, data were entered into a spreadsheet and plotted as scatter
plots that depicting crop species yield performance as a function of temperature. Maximum or
minimum temperatures after which yield decline was observed for particular phenological
stages were taken and used to develop thresholds. Where papers reported single temperature
values as thresholds above or below which yield decline was observed, we admitted this value
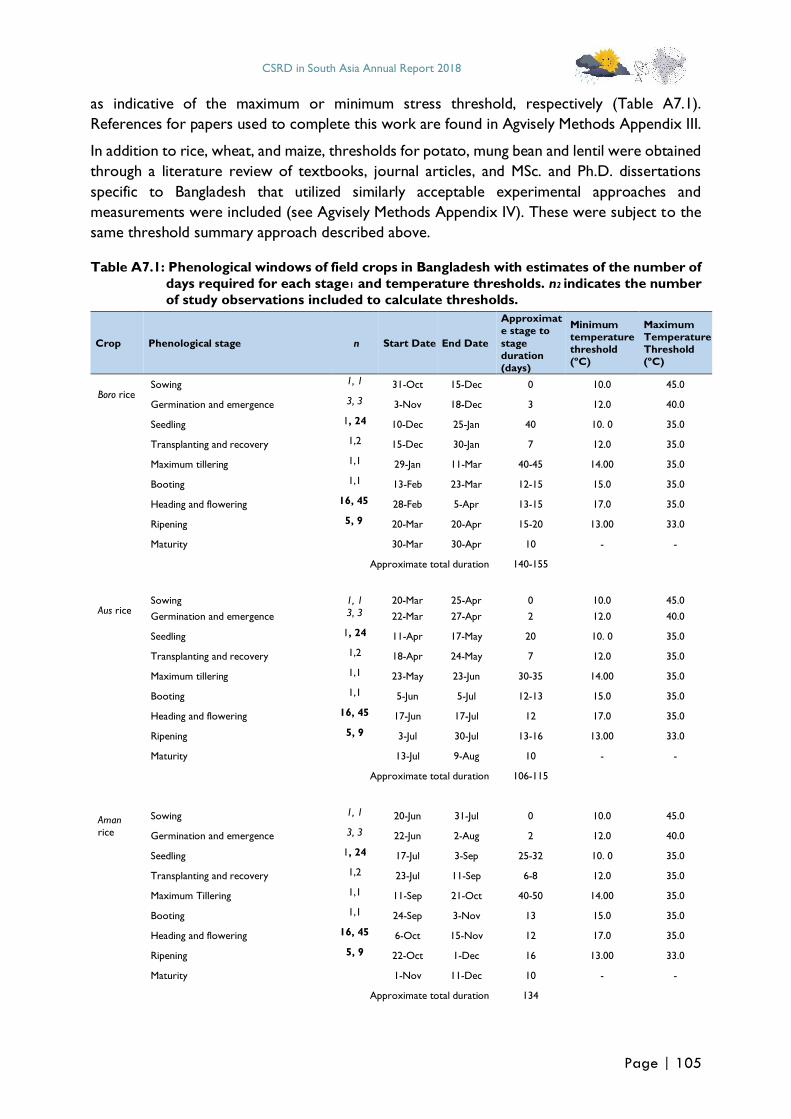
CSRD in South Asia Annual Report 2018
Page | 105
as indicative of the maximum or minimum stress threshold, respectively (Table A7.1).
References for papers used to complete this work are found in Agvisely Methods Appendix III.
In addition to rice, wheat, and maize, thresholds for potato, mung bean and lentil were obtained
through a literature review of textbooks, journal articles, and MSc. and Ph.D. dissertations
specific to Bangladesh that utilized similarly acceptable experimental approaches and
measurements were included (see Agvisely Methods Appendix IV). These were subject to the
same threshold summary approach described above.
Table A7.1: Phenological windows of field crops in Bangladesh with estimates of the number of
days required for each stage1 and temperature thresholds. n2 indicates the number
of study observations included to calculate thresholds.
Crop Phenological stage n Start Date End Date
Approximat
e stage to
stage
duration
(days)
Minimum
temperature
threshold
(ºC)
Maximum
Temperature
Threshold
(ºC)
Boro rice Sowing 1, 1 31-Oct 15-Dec 0 10.0 45.0
Germination and emergence 3, 3 3-Nov 18-Dec 3 12.0 40.0
Seedling 1, 24 10-Dec 25-Jan 40 10. 0 35.0
Transplanting and recovery 1,2 15-Dec 30-Jan 7 12.0 35.0
Maximum tillering 1,1 29-Jan 11-Mar 40-45 14.00 35.0
Booting 1,1 13-Feb 23-Mar 12-15 15.0 35.0
Heading and flowering 16, 45 28-Feb 5-Apr 13-15 17.0 35.0
Ripening 5, 9 20-Mar 20-Apr 15-20 13.00 33.0
Maturity 30-Mar 30-Apr 10 - -
Approximate total duration 140-155
Aus rice Sowing 1, 1 20-Mar 25-Apr 0 10.0 45.0
Germination and emergence 3, 3 22-Mar 27-Apr 2 12.0 40.0
Seedling 1, 24 11-Apr 17-May 20 10. 0 35.0
Transplanting and recovery 1,2 18-Apr 24-May 7 12.0 35.0
Maximum tillering 1,1 23-May 23-Jun 30-35 14.00 35.0
Booting 1,1 5-Jun 5-Jul 12-13 15.0 35.0
Heading and flowering 16, 45 17-Jun 17-Jul 12 17.0 35.0
Ripening 5, 9 3-Jul 30-Jul 13-16 13.00 33.0
Maturity 13-Jul 9-Aug 10 - -
Approximate total duration 106-115
Aman
rice
Sowing 1, 1 20-Jun 31-Jul 0 10.0 45.0
Germination and emergence 3, 3 22-Jun 2-Aug 2 12.0 40.0
Seedling 1, 24 17-Jul 3-Sep 25-32 10. 0 35.0
Transplanting and recovery 1,2 23-Jul 11-Sep 6-8 12.0 35.0
Maximum Tillering 1,1 11-Sep 21-Oct 40-50 14.00 35.0
Booting 1,1 24-Sep 3-Nov 13 15.0 35.0
Heading and flowering 16, 45 6-Oct 15-Nov 12 17.0 35.0
Ripening 5, 9 22-Oct 1-Dec 16 13.00 33.0
Maturity 1-Nov 11-Dec 10 - -
Approximate total duration 134
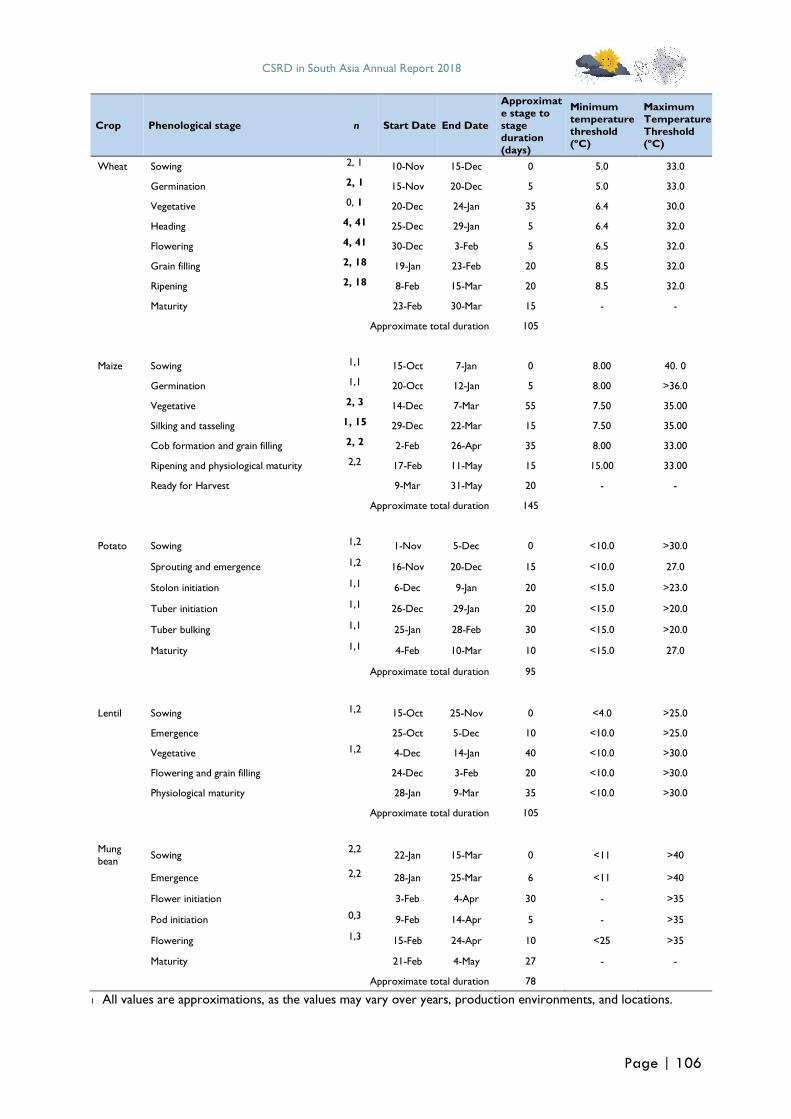
CSRD in South Asia Annual Report 2018
Page | 106
Crop Phenological stage n Start Date End Date
Approximat
e stage to
stage
duration
(days)
Minimum
temperature
threshold
(ºC)
Maximum
Temperature
Threshold
(ºC)
Wheat Sowing 2, 1 10-Nov 15-Dec 0 5.0 33.0
Germination 2, 1 15-Nov 20-Dec 5 5.0 33.0
Vegetative 0, 1 20-Dec 24-Jan 35 6.4 30.0
Heading 4, 41 25-Dec 29-Jan 5 6.4 32.0
Flowering 4, 41 30-Dec 3-Feb 5 6.5 32.0
Grain filling 2, 18 19-Jan 23-Feb 20 8.5 32.0
Ripening 2, 18 8-Feb 15-Mar 20 8.5 32.0
Maturity 23-Feb 30-Mar 15 - -
Approximate total duration 105
Maize Sowing 1,1 15-Oct 7-Jan 0 8.00 40. 0
Germination 1,1 20-Oct 12-Jan 5 8.00 >36.0
Vegetative 2, 3 14-Dec 7-Mar 55 7.50 35.00
Silking and tasseling 1, 15 29-Dec 22-Mar 15 7.50 35.00
Cob formation and grain filling 2, 2 2-Feb 26-Apr 35 8.00 33.00
Ripening and physiological maturity 2,2 17-Feb 11-May 15 15.00 33.00
Ready for Harvest 9-Mar 31-May 20 - -
Approximate total duration 145
Potato Sowing 1,2 1-Nov 5-Dec 0 <10.0 >30.0
Sprouting and emergence 1,2 16-Nov 20-Dec 15 <10.0 27.0
Stolon initiation 1,1 6-Dec 9-Jan 20 <15.0 >23.0
Tuber initiation 1,1 26-Dec 29-Jan 20 <15.0 >20.0
Tuber bulking 1,1 25-Jan 28-Feb 30 <15.0 >20.0
Maturity 1,1 4-Feb 10-Mar 10 <15.0 27.0
Approximate total duration 95
Lentil Sowing 1,2 15-Oct 25-Nov 0 <4.0 >25.0
Emergence 25-Oct 5-Dec 10 <10.0 >25.0
Vegetative 1,2 4-Dec 14-Jan 40 <10.0 >30.0
Flowering and grain filling 24-Dec 3-Feb 20 <10.0 >30.0
Physiological maturity 28-Jan 9-Mar 35 <10.0 >30.0
Approximate total duration 105
Mung
bean Sowing
2,2 22-Jan 15-Mar 0 <11 >40
Emergence 2,2 28-Jan 25-Mar 6 <11 >40
Flower initiation 3-Feb 4-Apr 30 - >35
Pod initiation 0,3 9-Feb 14-Apr 5 - >35
Flowering 1,3 15-Feb 24-Apr 10 <25 >35
Maturity 21-Feb 4-May 27 - -
Approximate total duration 78
1 All values are approximations, as the values may vary over years, production environments, and locations.
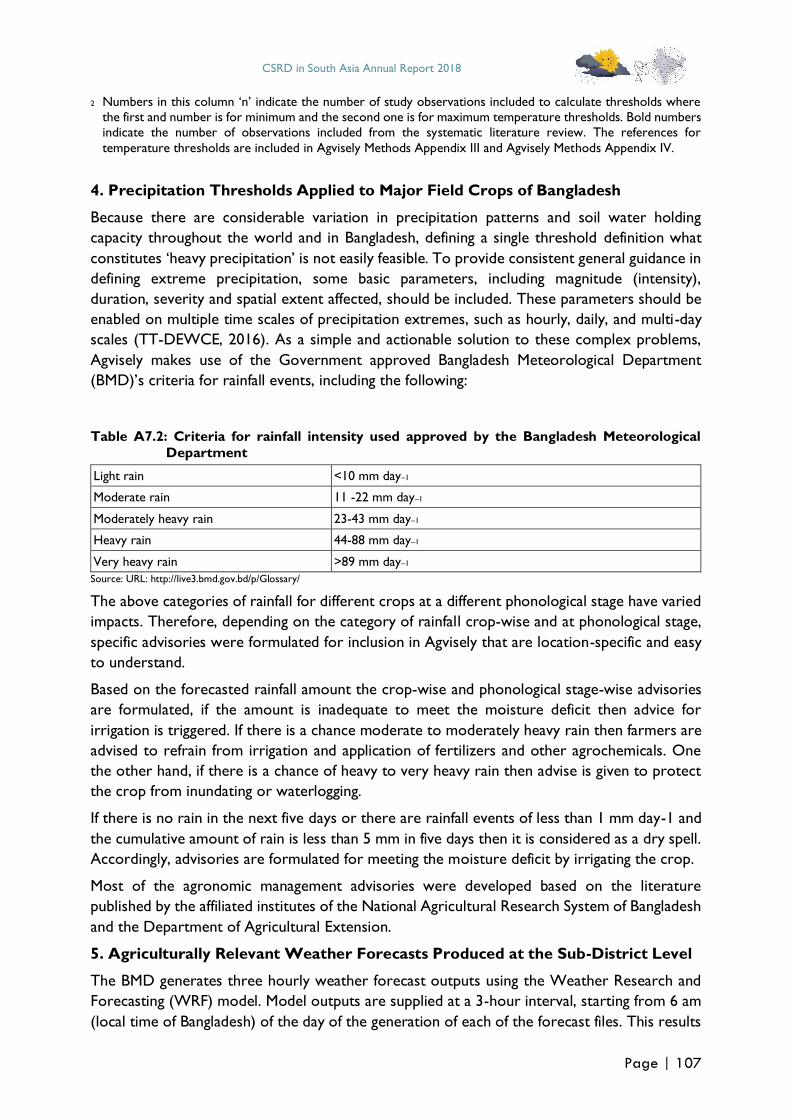
CSRD in South Asia Annual Report 2018
Page | 107
2 Numbers in this column ‘n’ indicate the number of study observations included to calculate thresholds where the first and number is for minimum and the second one is for maximum temperature thresholds. Bold numbers indicate the number of observations included from the systematic literature review. The references for
temperature thresholds are included in Agvisely Methods Appendix III and Agvisely Methods Appendix IV.
4. Precipitation Thresholds Applied to Major Field Crops of Bangladesh
Because there are considerable variation in precipitation patterns and soil water holding
capacity throughout the world and in Bangladesh, defining a single threshold definition what
constitutes ‘heavy precipitation’ is not easily feasible. To provide consistent general guidance in
defining extreme precipitation, some basic parameters, including magnitude (intensity),
duration, severity and spatial extent affected, should be included. These parameters should be
enabled on multiple time scales of precipitation extremes, such as hourly, daily, and multi-day
scales (TT-DEWCE, 2016). As a simple and actionable solution to these complex problems,
Agvisely makes use of the Government approved Bangladesh Meteorological Department
(BMD)’s criteria for rainfall events, including the following:
Table A7.2: Criteria for rainfall intensity used approved by the Bangladesh Meteorological
Department
Light rain <10 mm day–1
Moderate rain 11 -22 mm day–1
Moderately heavy rain 23-43 mm day–1
Heavy rain 44-88 mm day–1
Very heavy rain >89 mm day–1
Source: URL: http://live3.bmd.gov.bd/p/Glossary/
The above categories of rainfall for different crops at a different phonological stage have varied
impacts. Therefore, depending on the category of rainfall crop-wise and at phonological stage,
specific advisories were formulated for inclusion in Agvisely that are location-specific and easy
to understand.
Based on the forecasted rainfall amount the crop-wise and phonological stage-wise advisories
are formulated, if the amount is inadequate to meet the moisture deficit then advice for
irrigation is triggered. If there is a chance moderate to moderately heavy rain then farmers are
advised to refrain from irrigation and application of fertilizers and other agrochemicals. One
the other hand, if there is a chance of heavy to very heavy rain then advise is given to protect
the crop from inundating or waterlogging.
If there is no rain in the next five days or there are rainfall events of less than 1 mm day-1 and
the cumulative amount of rain is less than 5 mm in five days then it is considered as a dry spell.
Accordingly, advisories are formulated for meeting the moisture deficit by irrigating the crop.
Most of the agronomic management advisories were developed based on the literature
published by the affiliated institutes of the National Agricultural Research System of Bangladesh
and the Department of Agricultural Extension.
5. Agriculturally Relevant Weather Forecasts Produced at the Sub-District Level
The BMD generates three hourly weather forecast outputs using the Weather Research and
Forecasting (WRF) model. Model outputs are supplied at a 3-hour interval, starting from 6 am
(local time of Bangladesh) of the day of the generation of each of the forecast files. This results

CSRD in South Asia Annual Report 2018
Page | 108
in everyday which makes 81 forecast outputs over every ten days. The 18 km gridded WRF
forecasts are generated with each grid having a single centroid point value. With such a
resolution to cover the whole of Bangladesh requires more than 450 grid points. Bangladesh
has eight administrative Divisions, 64 districts and 491 sub-districts locally known as Upazilas.
With 18 km, the gridded data points always fall evenly within the 491 Upazilas as their size and
shape vary considerably. Responding to this problem, we modified the resolution forecast
outputs to 4.5 km data through re-gridding, placing three more points on every consecutive
two grid points. New point values were estimated through bilinear interpolation. With this
higher resolution gridded forecast, every Upazila of Bangladesh has at least one grid that falls
within each Upazila boundary. The climate forecast for any variable of a particular Upazila is
then calculated by considering all the forecast grid points falling within the Upazila boundary,
and taking the linear average of that variable of the particular instance of the forecast.
Using these model outputs for temperature and precipitation forecasts at an Upazila level, the
above described thresholds for the likely phonological stage of each crop are compared to the
forecast values. If the model forecast output is above or below the thermal threshold the
anticipated impact on the crop is detrimental or damaging, then advisory for mitigating the
impact is automatically triggered. Similarly, based on the forecasted rainfall amount as
categorized by BMD, the potential impact on crop productivity is assessed and an advisory
automatically generated for the location and crop of interest. Such automatic triggering happens
in an algorithm that is built as a series of decision trees depending on the next 5-day forecast
period (for which acceptable skill is possible), location, and the probable crop phenological stage
at the time of the forecasts. The advisories were collected from various sources such as
reference books, websites, or designed based on scientific/expert judgment and experiences,
and were designed in a consultation workshop with experts from the Bangladesh
Meteorological Organization, Bangladesh Agricultural Research Institute, Bangladesh
Agricultural Research Council, Bangladesh Wheat and Maize Research Institute, Bangladesh
Rice Research Institute, and the Department of Agricultural Extension.
6. Climate Information Service Advisories for Major Field Crops of Bangladesh
For these notifications to deploy, the web application 'Agvisely' was collaboratively developed
by the International Maize and Wheat Improvement Centre, the Department of Agricultural
Extension (DAE), and BMD in Bangladesh. Data on the climate thresholds for each phenological
stage of the crops considered in the tool are stored in a server using MongoDB database
software (Figure A7.2). Agvisely is built on Java and React, and hosted on the Google Cloud
Platform (GCP). It ingests the WRF model outputs, which Agvisely receives from BMD on a
daily basis on the GCP’s storage, that are used to can generate Upazila specific temperature
and rainfall forecasts for the next five days. Agvisely’s decision tree architecture is built on a
series of ‘if-then’ statements: If a threshold is passed for a particular Upazila at a particular time
given the crop phenological windows summarized in Table A7.1, then a crop management
advisory is automatically generated
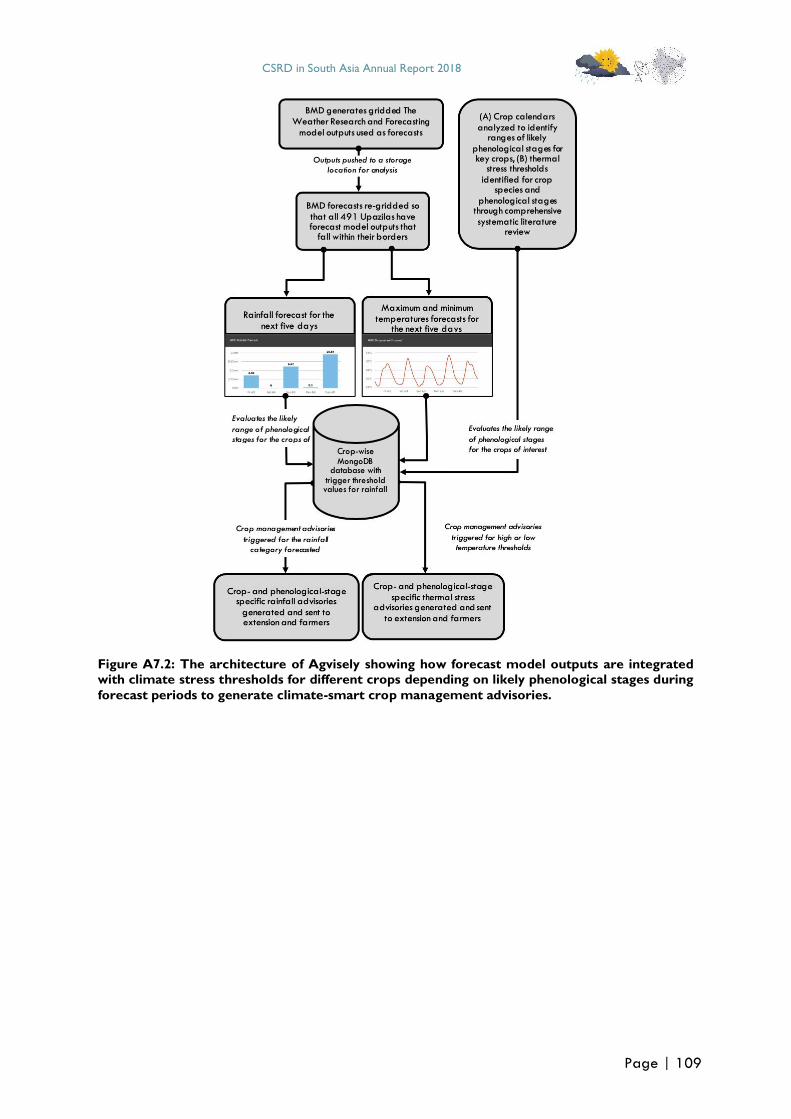
CSRD in South Asia Annual Report 2018
Page | 109
Figure A7.2: The architecture of Agvisely showing how forecast model outputs are integrated with climate stress thresholds for different crops depending on likely phenological stages during
forecast periods to generate climate-smart crop management advisories.
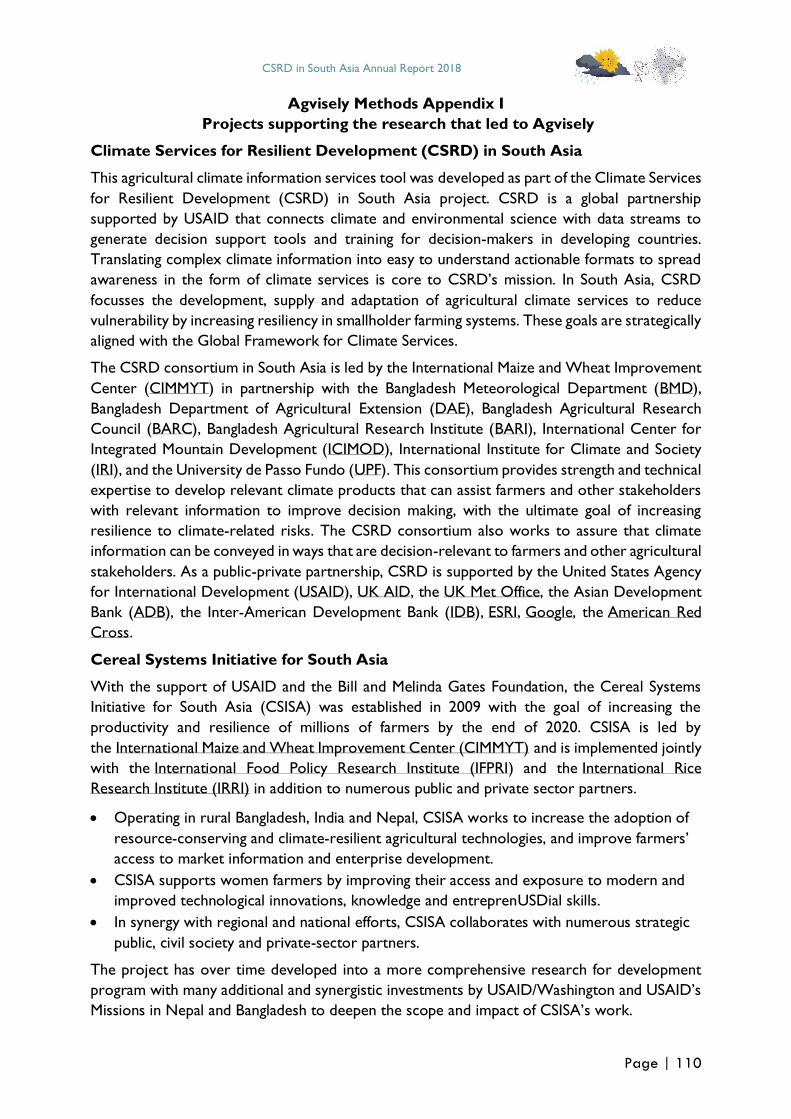
CSRD in South Asia Annual Report 2018
Page | 110
Agvisely Methods Appendix I
Projects supporting the research that led to Agvisely
Climate Services for Resilient Development (CSRD) in South Asia
This agricultural climate information services tool was developed as part of the Climate Services
for Resilient Development (CSRD) in South Asia project. CSRD is a global partnership
supported by USAID that connects climate and environmental science with data streams to
generate decision support tools and training for decision-makers in developing countries.
Translating complex climate information into easy to understand actionable formats to spread
awareness in the form of climate services is core to CSRD’s mission. In South Asia, CSRD
focusses the development, supply and adaptation of agricultural climate services to reduce
vulnerability by increasing resiliency in smallholder farming systems. These goals are strategically
aligned with the Global Framework for Climate Services.
The CSRD consortium in South Asia is led by the International Maize and Wheat Improvement
Center (CIMMYT) in partnership with the Bangladesh Meteorological Department (BMD),
Bangladesh Department of Agricultural Extension (DAE), Bangladesh Agricultural Research
Council (BARC), Bangladesh Agricultural Research Institute (BARI), International Center for
Integrated Mountain Development (ICIMOD), International Institute for Climate and Society
(IRI), and the University de Passo Fundo (UPF). This consortium provides strength and technical
expertise to develop relevant climate products that can assist farmers and other stakeholders
with relevant information to improve decision making, with the ultimate goal of increasing
resilience to climate-related risks. The CSRD consortium also works to assure that climate
information can be conveyed in ways that are decision-relevant to farmers and other agricultural
stakeholders. As a public-private partnership, CSRD is supported by the United States Agency
for International Development (USAID), UK AID, the UK Met Office, the Asian Development
Bank (ADB), the Inter-American Development Bank (IDB), ESRI, Google, the American Red
Cross.
Cereal Systems Initiative for South Asia
With the support of USAID and the Bill and Melinda Gates Foundation, the Cereal Systems
Initiative for South Asia (CSISA) was established in 2009 with the goal of increasing the
productivity and resilience of millions of farmers by the end of 2020. CSISA is led by
the International Maize and Wheat Improvement Center (CIMMYT) and is implemented jointly
with the International Food Policy Research Institute (IFPRI) and the International Rice
Research Institute (IRRI) in addition to numerous public and private sector partners.
• Operating in rural Bangladesh, India and Nepal, CSISA works to increase the adoption of
resource-conserving and climate-resilient agricultural technologies, and improve farmers’
access to market information and enterprise development.
• CSISA supports women farmers by improving their access and exposure to modern and
improved technological innovations, knowledge and entreprenUSDial skills.
• In synergy with regional and national efforts, CSISA collaborates with numerous strategic
public, civil society and private-sector partners.
The project has over time developed into a more comprehensive research for development
program with many additional and synergistic investments by USAID/Washington and USAID’s
Missions in Nepal and Bangladesh to deepen the scope and impact of CSISA’s work.

CSRD in South Asia Annual Report 2018
Page | 111
CSRD in South Asia Annual Report 2018
Page | 112
Agvisely Methods Appendix II
Search strings used to locate literature on thermal stress thresholds for rice,
wheat, and maize by database.
Scopus basic search codes: ( TITLE-ABS-KEY ( heat OR "high temp*" OR "high-temp*" OR "heat stress" OR "heat-stress" OR
"thermal stress" OR "thermal-stress" OR cold OR "cold temp*" OR "cold-temp*" OR "cold stress"
OR "cold-stress" OR "terminal heat stress" OR "terminal heat-stress" OR "terminal heat" ) AND
ABS ( "zea mays" OR maize OR corn OR "triticum aestivum" OR wheat OR "oryza sativa" OR rice )
AND ABS ( yield ) )
CAB basic Search codes: title:(“heat” OR “high temp*” OR “high-temp*” OR “heat stress” OR “heat-stress” OR
“thermal stress” OR “thermal-stress” OR “Cold” OR “cold temp*” OR “cold-temp*” OR “cold
stress” OR “cold-stress” OR “terminal heat stress” OR “terminal heat-stress” OR “terminal heat” OR “terminal-heat” OR “Threshold” OR “temp* threshold” OR “temp*-threshold” OR
“cold injury” OR “cold-injury” OR “day* temp*” OR “day*-temp*” OR “night* temp*” OR
“night*-temp*” OR “cardinal temp*” OR “cardinal-temp*”) AND ab:(“zea mays” OR “maize” OR “corn” OR “triticum aestivum” OR “wheat” OR “oryza sativa” OR “rice”) AND ab:(“yield”)
WOS advance search codes: TS=(heat OR high temp* OR high-temp* OR heat stress OR heat-stress OR thermal stress
OR thermal-stress OR Cold OR cold temp* OR cold-temp* OR cold stress OR cold-stress
OR terminal heat stress OR terminal heat-stress OR terminal heat OR terminal-heat OR Threshold OR temp* threshold OR temp*-threshold OR cold injury OR cold-injury OR day*
temp* OR day*-temp* OR night* temp* OR night*-temp* OR cardinal temp* OR cardinal-
temp*) AND TS=(Zea mays OR maize OR corn OR Triticum aestivum OR wheat OR Oryza sativa OR rice) AND TS=(yield)
AGRICOLA search codes: tkey"heat"OR"high temp*"OR"high-temp*"OR"heat stress"OR"thermal stress"OR"cold
stress"OR"cold-stress"OR "cold"OR"cold temp*"OR"cold-temp*"OR "terminal heat
stress"OR"terminal heat-stress"OR"terminal heat"OR"terminal-heat"OR"threshold"OR"temp* threshold"OR"cold injury"OR"day* temp*"OR"night* temp*"OR"cardinal temp*"AND
tkey"maize"OR "corn"or"wheat"or"rice"AND tkey"yield"
CSRD in South Asia Annual Report 2018
Page | 113
Agvisely Methods Appendix III.
Papers used in systematic literature review to determine temperature stress
thresholds for rice, wheat and maize.
1. Aghamolki, M. T. K., Yusop, M. K., Oad, F. C., Jaafar, H. Z. Khalatbari, A. M. Kharidah, S.
and Musa, M. H. 2016. Impact of heat stress on growth and yield of rice (Oryza sativa L.)
cultivars. Journal of Food, Agriculture and Environment,14: 111-116
2. Aghamolki, M. T. K., Yusop, M. K., Oad, F. C., Zakikhani, H., Jaafar, H. Z., Kharidah, S. and
Musa, M. H. 2014. Heat stress effects on yield parameters of selected rice cultivars at
reproductive growth stages. Journal of Food, Agriculture and Environment, 12:741-746
3. Ali, Z. I., Mahalakshmi, V., Singh, M., Ortiz‐Ferrara, G. and Peacock, J. M. 1994. Variation in
cardinal temperatures for germination among wheat (Triticum aestivum) genotypes. Annals
of Applied Biology, 125: 367-375. doi:10.1111/j.1744-7348.1994.tb04977.x
4. Alvarado-Sanabria, O. H., Garces-Varon, G. A. and Restrepo-Diaz, H. 2017. The effects of
night - time temperature on physiological and biochemical traits in rice. Notulae Botanicae
Horti Agrobotanici Cluj-Napoca. 45:157-163. DOI:10.15835/nbha45110627
5. Angus, J. F., Mackenzie, D. H., Morton, R. and Schafer, C. A. 1981.Phasic development in
field crops II. Thermal and photoperiodic responses of spring wheat, Field Crops Research,
4:269-283. https://doi.org/10.1016/0378-4290(81)90078-2.
6. Arshad. M., Amjath-Babu, T. S., Krupnik, T.J., Aravindakshan. S., Abbas. A., Kächele. H.
Miller, K. 2017. Climate variability and yield risk in South Asia’s rice–wheat
systems: emerging evidence from Pakistan. Paddy and Water Environment. 2;15(2):249-
261. https://doi.org/10.1007/s10333-016-0544-0
7. Asseng, S., Foster, I. and Turner, N. C. 2011. The impact of temperature variability on wheat
yields. Global Change Biology, 17: 997-1012. doi:10.1111/j.1365-2486.2010.02262.x
8. Bheemanahalli, R., Sathishraj, R., Tack, J., Nalley, L. L., Muthurajan, R., and Jagadish K.S.V.
2016. Temperature thresholds for spikelet sterility and associated warming impacts for sub-
tropical rice. Agricultural and Forest Meteorology, 221:122-130, https://doi.org/10.1016/
j.agrformet. 2016.02.003.
9. Blum, A. and Sinmena, B. 1994. Wheat seed endosperm utilization under heat stress and its
relation to thermotolerance in the autotrophic plant, Field Crops Research, 37(3):185-191.
https://doi.org/ 10.1016/0378-4290(94)90097-3.
10. Bonhomme, R., Derieux, M. and Edmeades G.O. 1994. Flowering of Diverse Maize Cultivars
in Relation to Temperature and Photoperiod in Multilocation Field Trials. Crop
Science Abstract. 34:156-164.
11. Boote, K. J., Allen, L. H., Prasad, P. V. V., Baker, J. T., Gesch, Russ. W., Snyder, A. M., Pan,
D. And Thomas, J. M. G. 2005. Elevated Temperature and CO2 impacts on pollination,
reproductive growth and yield of several globally important crops. Journal of Agricultural
Meteorology, 60:469-474
12. Cao, Y.-Y., Duan, H., Yang, L.-N., Wang, Z.-Q., Liu, L.-J., Yang, J.-C. 2009. Effect of High
Temperature during Heading and Early Filling on Grain Yield and Physiological
Characteristics in Indica Rice. Acta Agronomica Sinica. 35: Issue 3512-521.
doi.org/10.1016/S1875-2780 (08)60071-1.
13. Chakrabarti, B., Aggarwal, P. K., Singh, S. D., Nagarajan, S., and Pathak, H. 2010. Impact of
high temperature on pollen germination and spikelet sterility in rice: comparison between
basmati and non-basmati varieties. Crop and Pasture Science. 61:363-368
CSRD in South Asia Annual Report 2018
Page | 114
14. Das, S., Krishnan, P., Nayak, M. and Ramakrishnan, B. 2014. High temperature stress effects
on pollens of rice. Environmental and Experimental Botany. 101:36-46. dx.doi.org/10.1016/
j.envexpbot.2014.01.004
15. Di, H., Jing, W., Tong, D., Liping, F., Jianping, Z., Xuebiao, P. and Zhihua, P. 2014. Impact of
climate change on maize potential productivity and the potential productivity gap in
southwest china. Journal of Meteorological Research. 28:1155-1167. DOI:10.1007/s13351-
014-4047-x
16. Fu, G., Feng, B., Zhang, C., Yang, Y., Chen, T., Zhao, X., Zhang, X., Jin, Q. and Tao, L. 2016.
Heat stress is more damaging to superior spikelets than inferior of rice (oryzea sativa L.)
due to their different organ temperatures. Frontires in plant science. 7: Article1637.
DOI:10.3389/fpls.2016.01637
17. Ghadirnezhad, R. and Fallah, A. 2014. Temperature effect on yield and yield components of
different rice in flowering stage. International Journal of Agronomy, vol. 2014, Article ID
846707, 4 pages, 2014. https://doi.org/10.1155/2014/846707
18. Greaves, J. A. 1996. Improving suboptimal temperature tolerance in maize the search for
variation. Journal of Experimental Botany. 47:307-323
19. Herrero, M. P., and Johnson, R. R. 1980. High temperature stress and pollen viability of
maize. Crop Science Abstract, 20:796-800.
doi:10.2135/cropsci1980.0011183X002000060030x
20. Hlavacova, M., Klem, K., Smutna, P. Skarpa, P., Hlavinka, P., Novotna, K., and Rapantova, B.
2017. Effect of heat stress at anthesis on yield formation in winter wheat. Plant Soil
Environment, 63:139-144. DOI:10.17221/73/2017-PSE
21. Holzkamper, A., Calance, P., and Fuhrer, J. 2013. Identifying climatic limitations to grain
maize yield potentials using a suitability evaluation approach. Agricultural and Forest
Meterology. 168: 149-159. doi.org/10.1016/j.agrformet.2012.09.004
22. Hossain, A., Sarker, M.A.Z., Saifuzzaman, M., Texeira da Silva, J.A., Lozovskaya, M.V. and
Akhter, M.M. 2013. Evaluation of growth, yield, relative performance and heat susceptibility
of eight wheat (Triticum aestivum L.) genotypes grown under stress. International journal of
plant production. 7(3): 615-636. DOI: 10.22069/IJPP.2013.1121
23. Ishimaru, T., Hirabayashi, H., Ida, M., Takai, T., San-Oh, Y. A., Yoshinaga, S., Ando, I., Ogawa,
T. and Konodo, M. 2010. A genetic resource for early-morning flowering trait of wild rice
Oryza officinalis to mitigate high temperature -induced spikelet sterility at anthesis. Annals
of Botany. 106:515-520. DOI:10.1093/aob/mcq124
24. Jagadish, S.V.K., Craufurd, P.Q. and Wheeler, T.R. 2007. High temperature stress and
spikelet fertility in rice (Oryza sativa L.). Journal of Experimental Botany. 58:1627-1635.
DOI:10.1093/jxb/erm003
25. Jenner, C. F. 1991. Effects of exposure of wheat ears to high temperature on dry matter
accumulation and carbohydrate metabolism in the grain of two cultivars. I. Immediate
responses. Australian Journal of Plant Physiology, 18:165-177.
https://doi.org/10.1071/PP9910165
26. Kabir, M. S., Howlader, M., Biswas, J. K., Mahbub, M. A. A. and Nur-E-Elahi M. 2015.
Probability of low temperature stress at different growth stage of boro rice. Bangladesh rice
journal, 19:19-25
27. Karim, M. R., M Ishikawa, Ikeda, M. and Islam, M. T. 2012. Climate change model predicts
33% rice yield decrease in 2010 in Bangladesh. Agronomy for Sustainable Development,
32:821-830. DOI:10.1007/s13593-012-0096-7
CSRD in South Asia Annual Report 2018
Page | 115
28. Kumar, N., Kumar, N., Shukla, A., Shankhdhar, S.C. and Shankhdhar, D. 2015. Impact of
terminal heat stress on pollen viability and yield attributes of Rice (Oryza sativa L.). Cereal
Research Communications 43:616-626. DOI:10.1556/0806.43.2015.023
29. Liu, B., Liu, L., Asseng, S., Zou, X., Li, J. and Cao, W. 2016. Modelling the effects of heat
stress on post-heading durations in wheat: A comparison of temperature response routines.
Agricultural and Forest Meterology, 222:45-58. DOI:dx.doi.org/10.1016/ j.agrformet.
2016.03.006
30. Lizaso, J. I., Ruiz-Ramos, M., Rodriguez, L., Gabaldon-Leal, C., Oliveira, J. A., Lorite, I. J.,
Sanchez, D., Garcia, E. and Rodriguez, A. 2018. Impact of high temperatures in maize:
phenology and yield components. Field Crop Research. 216:129-140.
doi.org/10.1016/j.fcr.2017.11.013
31. Lu, D., Sun, X., Yan, F., Wang, X., Xu, R. and Lu, W. 2014. Effects of heat stress at different
grain-filling phases on the grain yield and quality of waxy maize. Cereal Chemistery. 91:189-
194 dx.doi.org/10.1094/CCHEM-05-13-0083-R
32. Matsui, T., Namuco, O. S., Ziska, L. H., and Horie, T. 1997. Effect of high temperature and
CO2 concentration on spikelet sterility in indica rice. Field Crop Research, 51:213-219
33. Matsui, T., Omasa, K. and Horie, T. 2000. High temperature at flowering inhibits swelling of
pollen grains a driving force for thecae dehiscence in rice (oryzae sativa L.). Plant Production
Science. 3:430-434. doi.org/10.1626/pps.3.430
34. Morita, S., Yonemaru, J-I. and Takanashi J-I. 2005. Grain growth and endosperm cell size
under high night temperature in rice (Oryza sativa L.). Annals of Botany. 95:695-701.
DOI:10.1093/aob/mci071
35. Nawaz, A., Farooq, M., Cheema, S. A. and Wahid, A. 2013. Differential response of wheat
cultivers to terminal heat stress. International journal of Agriculture and Biology,15(6):1353-
1358
36. Pararajasingham S. and Hunt, L. A. 1990. Wheat spike temperature in relation to base
temperature for grain filling duration. Canadian Journal of Plant Science, 71:63-69
37. Pradhan, G.P. and Prasad, P. V. V. 2015. Evaluation of Wheat Chromosome Translocation
Lines for High Temperature Stress Tolerance at Grain Filling Stage. PLOS ONE 10(2):
e0116620. https://doi.org/10.1371/journal.pone.0116620
38. Prasad P.V. V. and Djanaguiraman, M. 2014. Response of floret fertility and individual grain
weight of wheat to high temperature stress: Sensitive stages and thresholds for temperature
and duration. Functional Plant Biology, 41:1261-1269. dx.doi.org/10.1071/fpi1461
39. Ritchie, J.T., and NeSmith, D.S. 1991. Temperature and crop development. In: Hanks J,
Ritchie JT (eds) Modelling plant and soil systems. American Society of Agronomy, Madison,
Wisconsin, pp5–29
40. Saini, H.S., Sedgley, M. and Aspinall, D. 1983. Effect of heat stress during floral development
on pollen tube growth and ovary anatomy in wheat (triticum aestivum L.).Australian Journal
of Plant Physiology. 10: 137-144. doi.org/10.1071/PP9830137
41. Sanchez, B., Rasmussen, A. and Porter, J. R. 2014. Temperature and the growth and
development of maize and rice. Global Change Biology, 20:408-418
42. Satake, T. and Yoshida, S. 1978. High temperature - induced sterility in Indica rices at
flowering. Japanese Journal of Crop Science. 47: 6-17
43. Segata, V. 1964. Physiology of the cold - resistance of maize during germination. The
reaction of maize (Zea mays L.) to low temperature during germination and its cold-
resistance. Biologia Plantarum. 6:189-197
CSRD in South Asia Annual Report 2018
Page | 116
44. Steven J. Crafts-Brandner, Michael E. Salvucci. 2002. Sensitivity of Photosynthesis in a C4
Plant, Maize, to Heat Stress. American Society of Plant Physiology, 129 (4) 1773-1780;
DOI:10.1104/pp.002170
45. Subedi, K. D., Floyd, C. N., and Budhathoki, C. B. 1998. Cool temperature-induced sterility
in spring wheat (Triticum aestivum L.) at high altitude in Nepal: variation among cultivars in
response to sowing date. Field Crop Research 55:141-151
46. Subedi, K. D., Gregory, P. JM Summerfield, R. J., and Gooding, M. J. 2000. Pattern of grain
set in boron-deficient and cold-stressed wheat (Triticum aestivum L.). J- Agric. Sci. 134:25-
31.
47. Sun, T., Hasegawa, T., Tang, L., Wang, W., Zhou, J., Liu, L., Liu, B., Cao, W. and Zhu, Y.
2018. Stage-dependent temperature sensitivity function predicts seed-setting rates under
short-term extreme heat stress in rice. Agricultural and Forest Meteorology, 256-257:196-
206. doi.org/10.1016/j.agrformet.2018.03.006
48. Sun, W. and Huang, Y. 2011. Global warming over the period 1961-2008 did not increase
high-temperature stress but did not reduce low-temperature stress in irrigated rice across
china. Agricultural and Forest Meteorology, 15:1193-1201.
DOI:10.1016/j.agrformet.2011.04.009
49. Suwa, R., Hakata, H., Hara, H., El-Shemy, H. A., Adu-Gyamfi, J. J., Nguyen, N. T., Kanai, S.,
Lightfoot, D. A., Mohapatra, P. K., and Fujita, K. 2010. High Temperature effects on
photosynthate partioning and sugar metabolism during ear expansion in maize (Zea mays
L.) genotypes. Plan Physiology and Biochemistry, 48: 124-130,
DOI:10.1016/j.plaphy.2009.12.010
50. Talukder, A.S.M.H.M., McDonald, G. K. and Gill, G. S. 2014. Effect of short-term heat stress
prior to flowering and grain set on the grain yield of wheat. Field Crops Research. 160:54-
63. DOI: org/j.fcr.2014.01.013
51. Tashiro, T., and Wardlaw, I. F. 1990. The response to high temperature shock and
humidity changes prior to and during the early stages of grain development in wheat.
Functional Plant Biology, 17:551-561
52. Teixeira, E. I., Fischer, Guenther., Velthuizen, H. van., Walter, C. and Ewert, F. 2013. Global
hot-spots of heat stress on agricultural crops due to climate change. Agricultural and Forest
Meteorology, 170:206-215DOI:10.1016/j.agrformet.2011.09.002
53. Veisz, O., Balla, K., Bencze, S., Bencze, S. and Bedő, Z. 2008. Effect of heat stress on the
quantitative and qualitative components of wheat grain. Eds. Prohens, J. and Badenes, M. L.
Modern Variety Breeding for Present and Future Needs (2008) Editorial Universidad
Politécnica de Valencia, Valencia, Spain. pp654-660
54. Wardlaw, I. F. and Moncur, L. 1995. The Response of Wheat to High Temperature
Following Anthesis. I. The Rate and Duration of Kernel Filling. Functional Plant Biol.,
22(3):391-397. https://doi.org/10.1071/PP9950391
55. Wheeler, T. R., Craufurd, P. Q., Ellias, R. H., Porter, J. R. and Prasad, P.V.V. 2000.
Temperature variability and the yield of annual crops. Agriculture, Ecosystems and
Environment, 82:159-167. doi.org/10.1016/S0167-8809(00)00224-3
56. White, J. W., Kimball, B. A., Wall, G. W. and Ottman, M. J. 2012. Cardinal temperature for
wheat leaf appearance as assessed from varied sowing dates and infrared warming. Field
Crop Research. 137:213-220. dx.doi.org/10.1016/j.fcr.2012.08.013
57. Wollenweber, B., Porter, J.R. and Schellberg, J. 2003. Lack of interaction between extreme
high-temperature events at vegetative and reproductive growth stages in wheat. Agronomy
and Crop Science, 189:142-150. doi.org/10.1046/j.1439-037X.2003.00025.x
CSRD in South Asia Annual Report 2018
Page | 117
58. Zhang, L., Yang, B., Li, Sen., Hou, Y. and Huang, D. 2018. Potential rice exposure to heat
stress along the Yangtze River in China under RCP8.5 scenario. Agricultural and Forest
Meteorology, 248:185-196. dx.doi.org/10.1016/j.agrformet.2017.09.020
59. Ziska, L. H., Manalo, P. A. and Ordonez, R. A. 1996. Intraspecific variation in the response
of rice (Oryzae sativa L.) to increased CO2 and temperature: growth and yield response of
17 cultivars. Journal of Experimental Botany. 47: No. 302, pp1353-1359
doi.org/10.1093/jxb/47.9.1353
CSRD in South Asia Annual Report 2018
Page | 118
Agvisely Methods Appendix IV. Literature used to determine phenologies of all
crops, temperature stress thresholds for potato, lentil, and mung bean. And for
cereal crops for phonological stage not covered considered in the systematic
review.
1. Acevedo, E. Silva, P. and Silva, H. 2002. Wheat growth and physiology. In Bread Wheat:
Improvement and Production. Curtis B.C., Rajaram, S. and Gómez, M. H. (Eds.). FAO Plant
Production and Protection Series No. 30, Food and Agriculture Organization of the United
Nations. Rome.
2. Ahlawat, I. P. S. (nd) Agronomy – Rabi Crops Lentil. https://www.academia.edu/8115138/
Agronomy_ Rabi_ Crops_ Lentil
3. Al-Qasem, H., Kafawin, O. and Duwayri, M. 1999. Effects of seed size and temperature on
germination of two wheat cultivars. Dirasat Agric. Sci. 26(1): 1-7.
4. Alvarado, V. and Bradford, K. J. 2002. A hydrothermal time model explains the cardinal
temperatures for seed germination. Plant Cell Environ., 25(8)1061-1069.
5. Anonymous, 2019. Virginia Potato Disease Advisory – 2010. Sponsored by the Virginia Irish
Potato Board. URL: http://blogs.ext.vt.edu/ag-pest-advisory/files/2014/07/VPDAMay192010.doc. Accessed on January 08, 2019.
6. BARI (Bangladesh Agricultural Research Institute). 2019. Krishi Projukti Hatboi (Handbook
on Agro-Technology), 8th Edition. Azad et al., (Eds). Bangladesh Agricultural Research Institute, Gazipur-1701, Bangladesh
7. BINA (Bangladesh Institute of Nuclear Agriculture). 2017. BINA Varieties: At a glance.
Bangladesh Institute of Nuclear Agriculture BAU Campus, Mymensingh.
http://www.bina.gov.bd/site/ page/429b2747-9105-49fc-a141-6cebead52833/-
8. BRRI (Bangladesh Rice Research Institute). 2019. Adhunik Dhaner Chash (Cultivation of
Modern Rice) Bangladesh Rice Research Institute, Gazipur-1701.
9. Chauhan, Y.S., Douglas, C., Rachaputi, R.C.N., Agius, P., Martin, W., King, K. and Skerman,
A. 2010. Physiology of Mubg bean and Development of the Mubg bean Crop Model.
Proceedings of the 1st Australian Summer Grains Conference, Gold Coast, Australia, 21–
24 June 2010.
10. DAFF (Department: Agriculture, Forestry and Fisheries). 2010. Mung bean Production
Guidelines. Department: Agriculture, Forestry and Fisheries, Republic of South Africa.
https://www.daff.gov.za/docs/Brochures/ MbeanpGUDELINS.pdf
11. Delahunty, A., Nuttall, J., Nicolas, M., and Brand, J. (2015). "Genotypic heat tolerance in
lentil," in Proceedings of the 17th ASA Conference (Hobart), 20-24.
12. Elsheikh, A., Ranya, Shariff, Rashid, Amiri, Fazel, Ahmad, Noordin, Balasundram, Siva, and
Amin, M. 2013. Agriculture Land Suitability Evaluator (ALSE): A decision and planning support tool for tropical and subtropical crops. Computers and Electronics in Agriculture,
vol 93: 98-110. DOI 10.1016/j.compag.2013.02.003
13. Gowda, C. L. L. and Kaul, A.K. 1983. Pluses in Bangladesh. Bangladesh Agricultural Research
Institute and the Food and Agriculture Organization (FAO).
14. GRiSP (Global Rice Science Partnership). 2013. Rice almanac, 4th edition. Los Baños
(Philippines): International Rice Research Institute. pp 283
15. Hasan, M. N., Hossain, M. S., Bari, M. A. and Islam, M. R. 2013. Agricultural land availability
in Bangladesh. SRDI, Dhaka, Bangladesh.
CSRD in South Asia Annual Report 2018
Page | 119
16. Institute of Agriculture and Natural Resources (IANR). 2019. Forecasting Late Blight:
Severity Values. https://cropwatch.unl.edu/potato/late_blights_forecasting. Accessed on
January 10, 2019.
17. IRRI (International Rice Research Institute). 2018. IRRI Crop calendar - IRRI Rice
Knowledge Bank. http://www.knowledgebank.irri.org/
18. Islam, M.T. 2015. Effects of High Temperature on Photosynthesis and Yield in Mubg bean.
Bangladesh J. Bot. 44(3): 451-454
19. Kamruzzaman, M., Marjuk, O. A. and Alam, M. 2017. Local Rice Varieties in Climate
Vulnerable Areas of Bangladesh: Prospects and Barriers. Proceedings of 7th International Symposium, 7th & 8th December 2017 at South Eastern University of Sri Lanka. pp423-433.
20. Kang, J.S., Harmeet Singh, Gurbir Singh, Harrajdeep Kang, Vajinder Pal Kalra and Jagroop
KaurInt. 2017. Abiotic Stress and Its Amelioration in Cereals and Pulses: A Review
J.Curr.Microbiol.App.Sci (2017) 6(3): 1019-104
21. Kumar, K., Solanki, S., Singh, S.N. and Khan, M.A. 2016. Abiotic constraints of pulse
production in India. (In) Disease of Pulse Crops and their Sustainable Management, pp. 23–
39, Biswas, S.K., Kumar, S. and Chand, G. (Eds). Biotech Books, New Delhi, India.
22. Large, E.C. 1954. Growth stages in cereals. Illustration of the "Feekes" Scale. Plant Pathol.,
3: 128-129.
23. Miedema, P., Post, J. and Groot, P.J. 1987. The effects of low temperature on seedling
growth of maize genotypes. Wageningen: Pudoc. - Fig., tab. - (Agricultural research reports;
926) With ref. pp124.
24. Moldenhauer, K., Counce, P. and Hardke, J.T. 2018. Chapter 2: Rice Growth and
Development. Rice Production Handbook. Hardke, J. T. (Ed) University of Arkansas
Division of Agriculture Cooperative Extension Service. pp9-20.
https://www.uaex.edu/publications/pdf/mp192/chapter-2.pdf
25. Nasim, M., Shahidullah, S. M., Saha, A., Muttaleb, M. A., Aditya, T. L., Ali, M. A. and Kabir,
M. S. 2017. Distribution of Crops and Cropping Patterns in Bangladesh. Bangladesh Rice J.
21 (2): 1-55
26. Obidiegwu Jude, Bryan Glenn, Jones Hamlyn, Prashar Ankush 2015. Coping with drought:
stress and adaptive responses in potato and perspectives for improvement. Frontiers in
Plant Science, 6:542. URL=https://www.frontiersin.org/article/10.3389/fpls.2015.00542
27. Pavlista, A.D. and Stevenson, W.R. 1995. Forecasting Late Blight. Univ. Nebraska Coop.
Extension Circ. 95-1250.
28. Prange, R.K., McRae, K.B., Midmore, D.J. and Deng, R. 1990. 'Reduction in potato growth
at high temperature. Role of photosynthesis and dark respiration. American Potato Journal,
67:357-369
29. Pringle, G. 2017. Maize production: Managing critical plant growth stages. Farmer's Weekly
Magazine. URL:https://www.farmersweekly.co.za/crops/field-crops/maize-production-
managing-critical-plant-growth-stages/
30. Rahman, M. M., Bakr, M. A., Mia, M. F., Idris, K. M., Gowda, C. L. L., Kumar, J., Deb, U. K.,
Malek, M. A., and Sobhan, A. 2000. Legumes in Bangladesh. In: Legumes in rice and wheat cropping systems of the Indo-Gangetic Plain - constraints and opportunities. International
Crops Research Institute for the Semi-Arid Tropics, Patancheru, Andhra Pradesh, India, pp.
5-34.
CSRD in South Asia Annual Report 2018
Page | 120
31. Rehman, A., Khalil, S. K., Nigar, S., Rehman, S., Haq, I., Akhtar, S., Khan, A. Z. and Shah, S.
R. 2009. Phenology, plant height and yield of mung bean varieties in response to planting
date. Sarhad J. Agric. Vol.25, No.2, 2009.
32. Sale, P. J. M. (1979). Growth of potatoes (Solanum tuberosum L.) to the small tuber stage
as related to soil temperature. Australian Journal of Agricultural Research. 30, 667-675.
33. Sen, S., Ghosh, M., Mazumdar, D., Saha, B., and Dolui, S. 2016. Effect of sowing date and variety on phenology and yield of lentil during rabi season. Journal of Crop and Weed,
12:135-138.
34. Shahidullah, S. M., Talukder, M. S. A., Kabir, M. S., Khan, A.H. and Elahi. N. E. 2006. Cropping
patterns in the South East Coastal Region of Bangladesh. J. Agric. Rural Dev. 4(1&2): 53-60.
35. Simon, E. W., Minchin, A., McMenamin, M. M. and Smith, J. M. 1976. The Low Temperature
Limit for Seed Germination. The New Phytologist. Vol. 77, No. 2 (Sep., 1976), pp. 301-311.
36. Struik, P. C. 2007. Response of the potato plant to temperature. In D. Vreugenhil (Ed.),
Potato biology and biotechnology: advances and perspectives (pp. 367-393). Amsterdam:
Elsevier.
37. Sys, C., Van Ranst, E., Debaveye, J., and Beernaert, F. 1993. Land Evaluation Part III: Crop
Requirements. Agricultural Publications - N° 7. General Administration for Development
Cooperation, Place du Champ de Mars 5 bte 57 - 1050 Brussels – Belgium.
38. TNAU (Tamil Nandu Agricultural Universitiy). 2018. Agrometeorology: Temperature and
Plant Growth. URL: http://agritech.tnau.ac.in/agriculture/agri_agrometeorology_temp.
html. Accessed on 20 January, 2020.
39. TT-DEWCE (Task Team on Definitions of Extreme Weather and Climate Events) 2016.
Guidelines on the Definition and Monitoring of Extreme Weather and Climate Events. Draft
Version – First Review by TT-DEWCE, December 2015. WMO
40. Vikaspedia portal.ND. Government of India initiative.
URL:http://vikaspedia.in/agriculture/crop-production/package- of-practices/vegetables-
1/potato#section-3. Accessed on January 10, 2019.
41. Yoshida, S. 1981. Fundamentals of Rice Crop Science. International Rice Research Institute,
Los Banos, Laguna, Philippines. 269 pages.
CSRD in South Asia Annual Report 2018
Page | 121
Annex 8: Draft Paper on Regional Climatological Analysis of Wheat Blast Disease
Risks
Climate suitability for wheat blast in Asia:
A model based analysis considering interannual variability
Carlo Montes1,14 and Timothy J. Krupnik
1. Introduction
Wheat blast disease was first reported in Bangladesh in 2016, which is indicative of the
adaptability of the pathogen and the suitable conditions of the region for the development the
development of Magnaporthe oryzae Triticum (MoT) (Islam et al., 2019). As for any other fungal
crop disease, wheat blast occurrence represents a major potential abiotic stress causing
significant loses to farmers (Mottaleb et al., 2018), and although the advances in new resistant
varieties and efficient and environmentally safe chemical control are numerous, losses
associated with fungal diseases incidence are still very important and, in some cases, devastating
(Fisher et al., 2012). This is particularly important in the current context of less effective natural
barriers due to greater commercial exchange and products transportation, which increases the
exposure of crops to new diseases non-existing locally. This is the case of the appearance of
wheat blast in Bangladesh (Malaker et al., 2016), after having been reported for years only in
South America (Brazil, Bolivia, Argentina, Paraguay), generating significant yield losses in wheat
producing regions of those countries (Cruz et al., 2016; Duveiller et al., 2016).
The incidence and impact of fungal diseases and their spread in different regions depends, among
other factors, on the cultural practices associated with agronomic management, the
susceptibility of the varieties, or the prevailing environmental conditions (Anderson et al., 2004).
Multiple tools have been developed for the monitoring and forecasting of fungal diseases
outbreaks based on field observations or empirical and deterministic numerical models that
combine different weather variables to generate an early warning of potential risk of disease
outbreaks (e.g. Launay et al., 2014). Given the increase in the availability of environmental data
and computing capacities, the use of simulation models for the diagnosis and forecasting of
favorable conditions for the development of crop diseases has taken on great importance during
the last years (e.g. Donatelli et al., 2017). Applications vary from regional assessment of climate
suitability (Bebber et al., 2017), sensitivity analysis to environmental drivers and
parameterizations (Bregaglio et al., 2012) or future projections in risks of crop diseases
associated with climate change (Bregaglio et al., 2013). Given that the adequate conditions for
the establishment of fungal diseases are well described and there is agreement that factors such
as atmospheric humidity and temperature are to the main drivers that can trigger their
development, it is possible to use mathematical models to assess the potential incidence of
specific diseases in poorly studied regions and their spatial and temporal patterns and associated
factors. The later becomes relevant in the case of wheat blast in Bangladesh and the potential
expansion to new wheat producing areas in South and Southeast Asia and the associated impact
on food security in a highly populated area.
In this context, the aim of this work is to provide a general overview of the spatial and time
variability in climate suitability for the development of wheat blast in wheat-growing countries
[email protected]. 1International Maize and Wheat Improvement Center (CIMMYT), Dhaka, Bangladesh
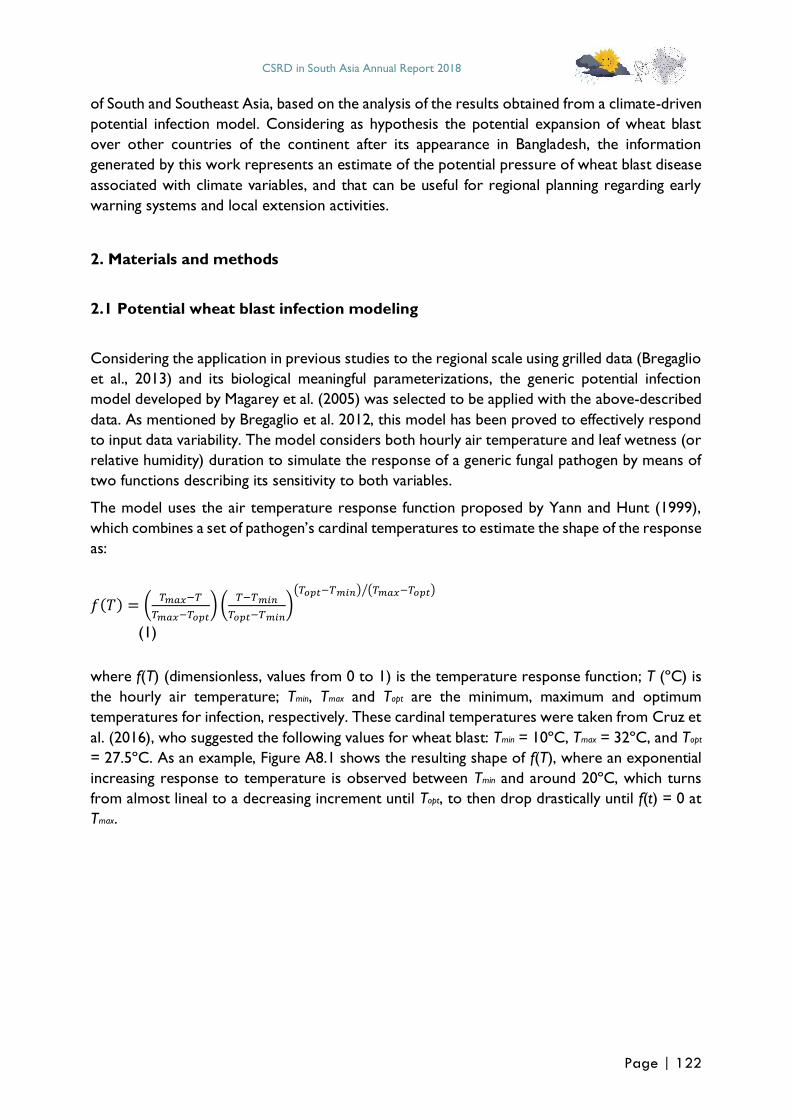
CSRD in South Asia Annual Report 2018
Page | 122
of South and Southeast Asia, based on the analysis of the results obtained from a climate-driven
potential infection model. Considering as hypothesis the potential expansion of wheat blast
over other countries of the continent after its appearance in Bangladesh, the information
generated by this work represents an estimate of the potential pressure of wheat blast disease
associated with climate variables, and that can be useful for regional planning regarding early
warning systems and local extension activities.
2. Materials and methods
2.1 Potential wheat blast infection modeling
Considering the application in previous studies to the regional scale using grilled data (Bregaglio
et al., 2013) and its biological meaningful parameterizations, the generic potential infection
model developed by Magarey et al. (2005) was selected to be applied with the above-described
data. As mentioned by Bregaglio et al. 2012, this model has been proved to effectively respond
to input data variability. The model considers both hourly air temperature and leaf wetness (or
relative humidity) duration to simulate the response of a generic fungal pathogen by means of
two functions describing its sensitivity to both variables.
The model uses the air temperature response function proposed by Yann and Hunt (1999),
which combines a set of pathogen’s cardinal temperatures to estimate the shape of the response
as:
𝑓(𝑇) = (𝑇𝑚𝑎𝑥−𝑇
𝑇𝑚𝑎𝑥−𝑇𝑜𝑝𝑡) (
𝑇−𝑇𝑚𝑖𝑛
𝑇𝑜𝑝𝑡−𝑇𝑚𝑖𝑛)
(𝑇𝑜𝑝𝑡−𝑇𝑚𝑖𝑛) (𝑇𝑚𝑎𝑥−𝑇𝑜𝑝𝑡)⁄
(1)
where f(T) (dimensionless, values from 0 to 1) is the temperature response function; T (ºC) is
the hourly air temperature; Tmin, Tmax and Topt are the minimum, maximum and optimum
temperatures for infection, respectively. These cardinal temperatures were taken from Cruz et
al. (2016), who suggested the following values for wheat blast: Tmin = 10ºC, Tmax = 32ºC, and Topt
= 27.5ºC. As an example, Figure A8.1 shows the resulting shape of f(T), where an exponential
increasing response to temperature is observed between Tmin and around 20ºC, which turns
from almost lineal to a decreasing increment until Topt, to then drop drastically until f(t) = 0 at
Tmax.
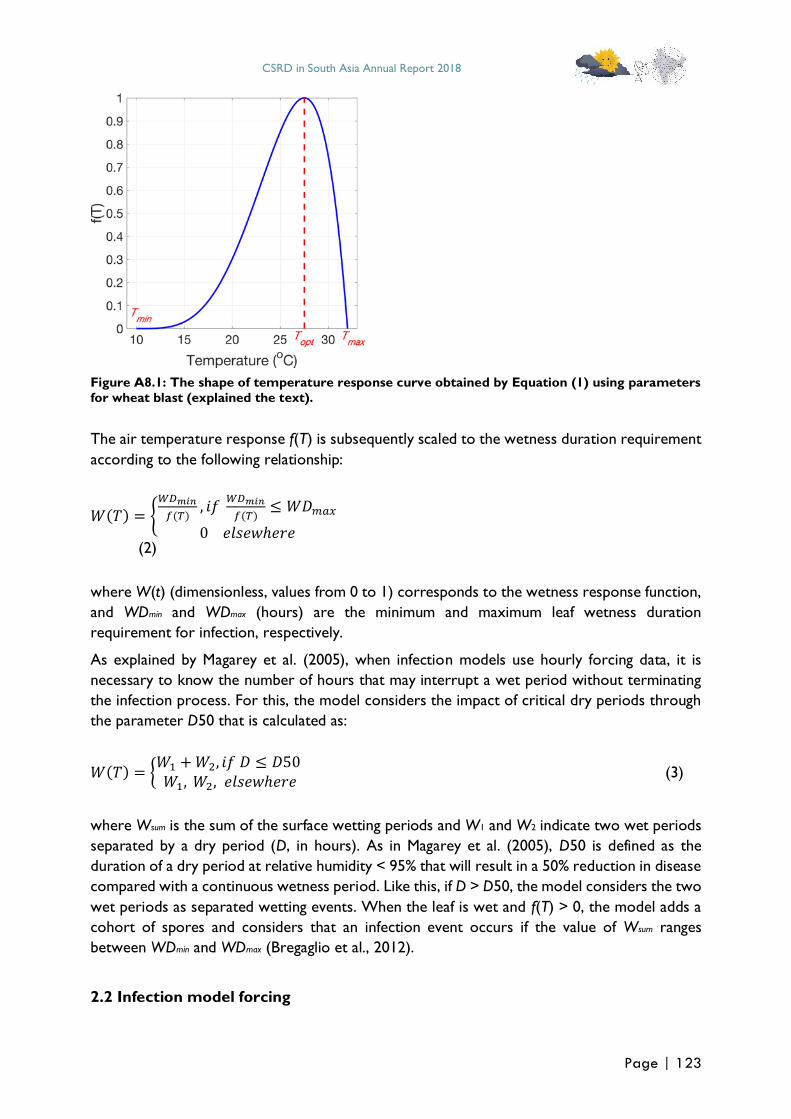
CSRD in South Asia Annual Report 2018
Page | 123
Figure A8.1: The shape of temperature response curve obtained by Equation (1) using parameters
for wheat blast (explained the text).
The air temperature response f(T) is subsequently scaled to the wetness duration requirement
according to the following relationship:
𝑊(𝑇) = {𝑊𝐷𝑚𝑖𝑛
𝑓(𝑇), 𝑖𝑓
𝑊𝐷𝑚𝑖𝑛
𝑓(𝑇)≤ 𝑊𝐷𝑚𝑎𝑥
0 𝑒𝑙𝑠𝑒𝑤ℎ𝑒𝑟𝑒
(2)
where W(t) (dimensionless, values from 0 to 1) corresponds to the wetness response function,
and WDmin and WDmax (hours) are the minimum and maximum leaf wetness duration
requirement for infection, respectively.
As explained by Magarey et al. (2005), when infection models use hourly forcing data, it is
necessary to know the number of hours that may interrupt a wet period without terminating
the infection process. For this, the model considers the impact of critical dry periods through
the parameter D50 that is calculated as:
𝑊(𝑇) = {𝑊1 + 𝑊2, 𝑖𝑓 𝐷 ≤ 𝐷50 𝑊1, 𝑊2, 𝑒𝑙𝑠𝑒𝑤ℎ𝑒𝑟𝑒
(3)
where Wsum is the sum of the surface wetting periods and W1 and W2 indicate two wet periods
separated by a dry period (D, in hours). As in Magarey et al. (2005), D50 is defined as the
duration of a dry period at relative humidity < 95% that will result in a 50% reduction in disease
compared with a continuous wetness period. Like this, if D > D50, the model considers the two
wet periods as separated wetting events. When the leaf is wet and f(T) > 0, the model adds a
cohort of spores and considers that an infection event occurs if the value of Wsum ranges
between WDmin and WDmax (Bregaglio et al., 2012).
2.2 Infection model forcing
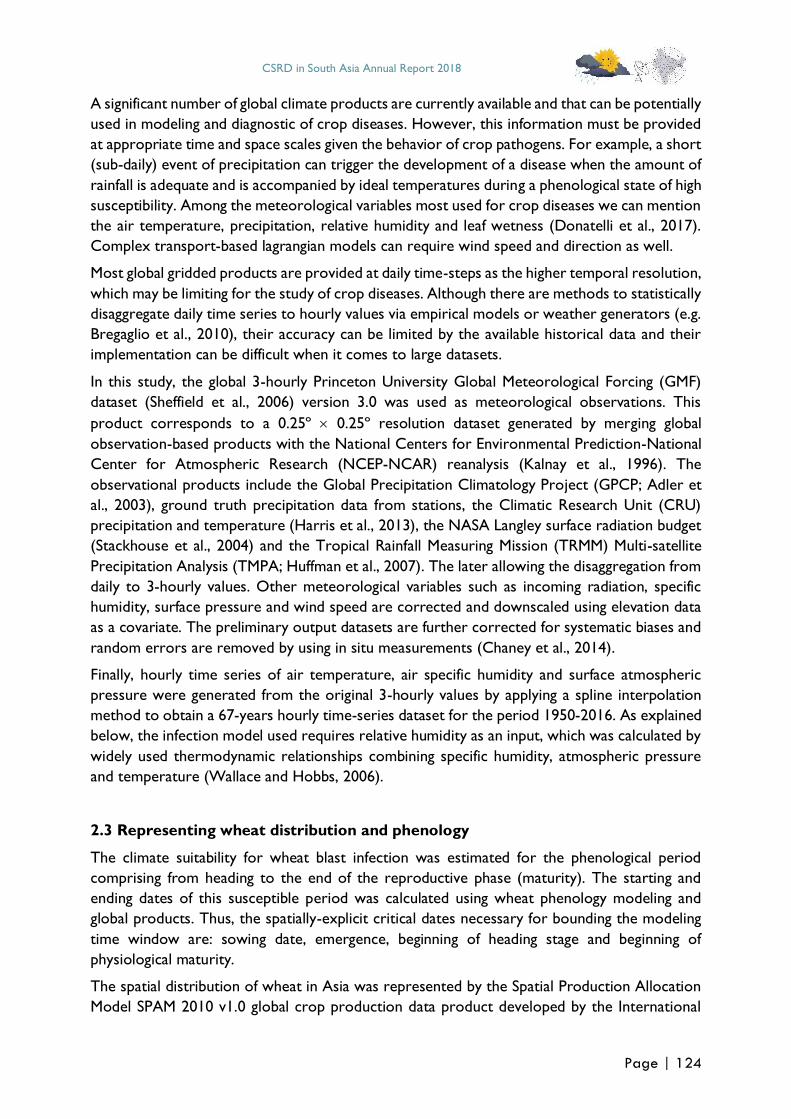
CSRD in South Asia Annual Report 2018
Page | 124
A significant number of global climate products are currently available and that can be potentially
used in modeling and diagnostic of crop diseases. However, this information must be provided
at appropriate time and space scales given the behavior of crop pathogens. For example, a short
(sub-daily) event of precipitation can trigger the development of a disease when the amount of
rainfall is adequate and is accompanied by ideal temperatures during a phenological state of high
susceptibility. Among the meteorological variables most used for crop diseases we can mention
the air temperature, precipitation, relative humidity and leaf wetness (Donatelli et al., 2017).
Complex transport-based lagrangian models can require wind speed and direction as well.
Most global gridded products are provided at daily time-steps as the higher temporal resolution,
which may be limiting for the study of crop diseases. Although there are methods to statistically
disaggregate daily time series to hourly values via empirical models or weather generators (e.g.
Bregaglio et al., 2010), their accuracy can be limited by the available historical data and their
implementation can be difficult when it comes to large datasets.
In this study, the global 3-hourly Princeton University Global Meteorological Forcing (GMF)
dataset (Sheffield et al., 2006) version 3.0 was used as meteorological observations. This
product corresponds to a 0.25º 0.25º resolution dataset generated by merging global
observation-based products with the National Centers for Environmental Prediction-National
Center for Atmospheric Research (NCEP-NCAR) reanalysis (Kalnay et al., 1996). The
observational products include the Global Precipitation Climatology Project (GPCP; Adler et
al., 2003), ground truth precipitation data from stations, the Climatic Research Unit (CRU)
precipitation and temperature (Harris et al., 2013), the NASA Langley surface radiation budget
(Stackhouse et al., 2004) and the Tropical Rainfall Measuring Mission (TRMM) Multi-satellite
Precipitation Analysis (TMPA; Huffman et al., 2007). The later allowing the disaggregation from
daily to 3-hourly values. Other meteorological variables such as incoming radiation, specific
humidity, surface pressure and wind speed are corrected and downscaled using elevation data
as a covariate. The preliminary output datasets are further corrected for systematic biases and
random errors are removed by using in situ measurements (Chaney et al., 2014).
Finally, hourly time series of air temperature, air specific humidity and surface atmospheric
pressure were generated from the original 3-hourly values by applying a spline interpolation
method to obtain a 67-years hourly time-series dataset for the period 1950-2016. As explained
below, the infection model used requires relative humidity as an input, which was calculated by
widely used thermodynamic relationships combining specific humidity, atmospheric pressure
and temperature (Wallace and Hobbs, 2006).
2.3 Representing wheat distribution and phenology
The climate suitability for wheat blast infection was estimated for the phenological period
comprising from heading to the end of the reproductive phase (maturity). The starting and
ending dates of this susceptible period was calculated using wheat phenology modeling and
global products. Thus, the spatially-explicit critical dates necessary for bounding the modeling
time window are: sowing date, emergence, beginning of heading stage and beginning of
physiological maturity.
The spatial distribution of wheat in Asia was represented by the Spatial Production Allocation
Model SPAM 2010 v1.0 global crop production data product developed by the International
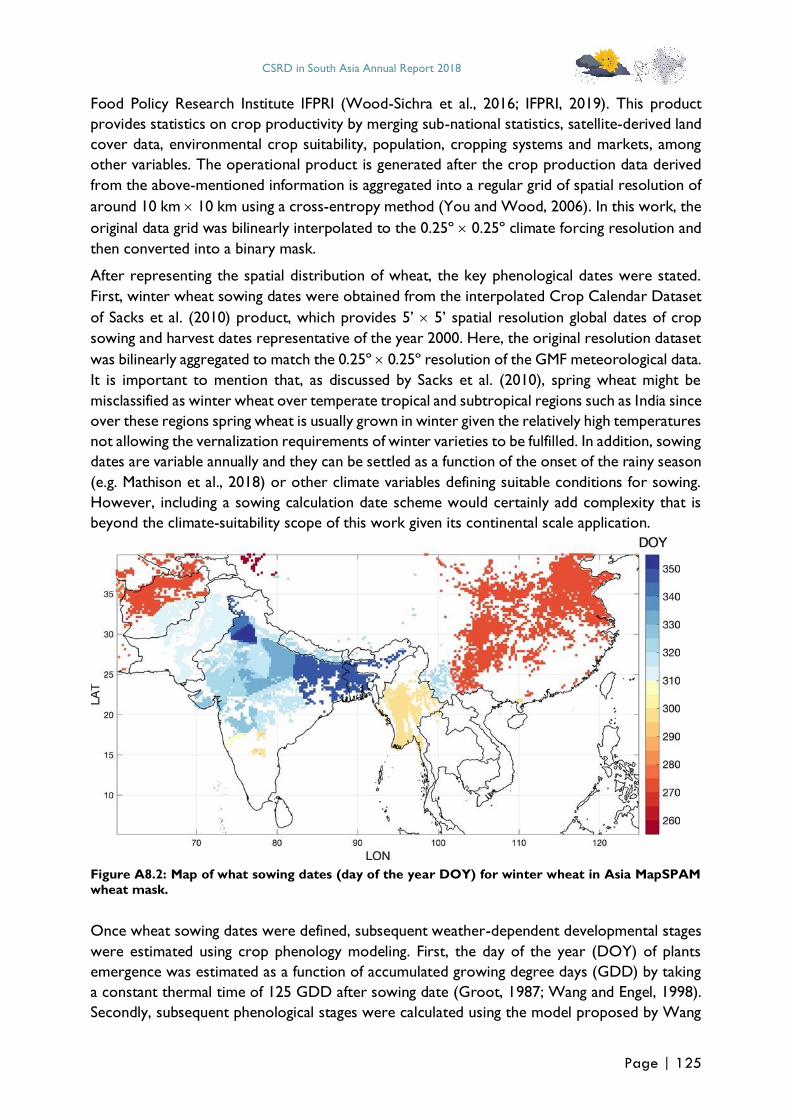
CSRD in South Asia Annual Report 2018
Page | 125
Food Policy Research Institute IFPRI (Wood-Sichra et al., 2016; IFPRI, 2019). This product
provides statistics on crop productivity by merging sub-national statistics, satellite-derived land
cover data, environmental crop suitability, population, cropping systems and markets, among
other variables. The operational product is generated after the crop production data derived
from the above-mentioned information is aggregated into a regular grid of spatial resolution of
around 10 km 10 km using a cross-entropy method (You and Wood, 2006). In this work, the
original data grid was bilinearly interpolated to the 0.25º 0.25º climate forcing resolution and
then converted into a binary mask.
After representing the spatial distribution of wheat, the key phenological dates were stated.
First, winter wheat sowing dates were obtained from the interpolated Crop Calendar Dataset
of Sacks et al. (2010) product, which provides 5’ 5’ spatial resolution global dates of crop
sowing and harvest dates representative of the year 2000. Here, the original resolution dataset
was bilinearly aggregated to match the 0.25º 0.25º resolution of the GMF meteorological data.
It is important to mention that, as discussed by Sacks et al. (2010), spring wheat might be
misclassified as winter wheat over temperate tropical and subtropical regions such as India since
over these regions spring wheat is usually grown in winter given the relatively high temperatures
not allowing the vernalization requirements of winter varieties to be fulfilled. In addition, sowing
dates are variable annually and they can be settled as a function of the onset of the rainy season
(e.g. Mathison et al., 2018) or other climate variables defining suitable conditions for sowing.
However, including a sowing calculation date scheme would certainly add complexity that is
beyond the climate-suitability scope of this work given its continental scale application.
Figure A8.2: Map of what sowing dates (day of the year DOY) for winter wheat in Asia MapSPAM wheat mask.
Once wheat sowing dates were defined, subsequent weather-dependent developmental stages
were estimated using crop phenology modeling. First, the day of the year (DOY) of plants
emergence was estimated as a function of accumulated growing degree days (GDD) by taking
a constant thermal time of 125 GDD after sowing date (Groot, 1987; Wang and Engel, 1998).
Secondly, subsequent phenological stages were calculated using the model proposed by Wang
CSRD in South Asia Annual Report 2018
Page | 126
and Engel (1998). This model allows estimating the main wheat phenological dates by combining
the effect of temperature, vernalization and photoperiod, using only air temperature as forcing
variable. The model defines a development stage parameter (DS) ranging from 0 at emergence
to 1 at anthesis (vegetative phase), until a maximum value of 2 at maturity (reproductive phase).
Like this, for the time period t between emergence (e) and maturity (m), the seasonal evolution
of developmental stages is calculated as 𝐷𝑆 = ∑ 𝑅𝑡=𝑚𝑡=𝑒 , where R is the daily developmental rate
calculated separately for the vegetative and reproductive phase according to the actual
accumulated value of DS:
𝑅 = {𝑅𝑣, 𝑖𝑓 0 ≤ 𝐷𝑆 ≤ 1𝑅𝑟 , 𝑖𝑓 1 < 𝐷𝑆 ≤ 2
(4)
with Rv and Rr the actual development rate (day-1) for vegetative and reproductive phase,
respectively. For the vegetative phase, the original model of Wang and Engel (1998) considers
the multiplicative effect of three functions representing the effect of temperature, vernalization
and photoperiod, restricting a constant maximum development rate. In this way, the
development rate during the vegetative phase Rv (emergence to anthesis) is expressed by:
𝑅𝑣 = 𝑅𝑚𝑎𝑥,𝑣𝑓(𝑇)𝑓(𝑃)𝑓(𝑣)
(5)
where Rmax,v is the reciprocal of the minimum number of days necessary to complete the
vegetative phase under optimal environmental conditions (a list of model parameters is
provided in Table A8.1), and f(T), f(P) and f(v) the corresponding response functions for
temperature, photoperiod and vernalization, respectively, which range from 0 to 1. In the case
of the reproductive phase, only the effect of temperature is considered, therefore the
development rate Rr is expressed by:
𝑅𝑟 = 𝑅𝑚𝑎𝑥,𝑟𝑓(𝑇)
(6)
with the parameter Rmax,r being the maximum development rate during the vegetative phase.
The temperature response function for both vegetative and reproductive phases is calculated
by (Wang and Engel, 1998):
𝑓(𝑇) = {
2(𝑇−𝑇𝑚𝑖𝑛)𝛼(𝑇𝑜𝑝𝑡−𝑇𝑚𝑖𝑛)𝛼
−(𝑇−𝑇𝑚𝑖𝑛)2𝛼
(𝑇𝑜𝑝𝑡−𝑇𝑚𝑖𝑛)2𝛼 , if 𝑇𝑚𝑖𝑛 ≤ 𝑇 ≤ 𝑇𝑚𝑎𝑥
0, if 𝑇 < 𝑇𝑚𝑖𝑛 or 𝑇 > 𝑇𝑚𝑎𝑥
(7)
where T is the daily mean air temperature, and Tmin, Tmax and Topt are cardinal temperatures
defining the minimum, maximum and optimum values for plant development, respectively (Table
A8.1). The parameter acts as a shape (skewness) factor and is calculated as:
CSRD in South Asia Annual Report 2018
Page | 127
𝛼 =ln2
ln[(𝑇𝑚𝑎𝑥−𝑇𝑚𝑖𝑛) (𝑇𝑜𝑝𝑡−𝑇𝑚𝑖𝑛)⁄ ]
(8)
The photoperiod response function for the vegetative phase is calculated as (Wang and Engel, 1998):
𝑓(𝑃) = 1 − exp[−𝜔(𝑃 − 𝑃𝑐)] (9)
where P is the actual photoperiod, calculated as a function of the latitude and DOY using widely
used trigonometric relationships, Pc is the critical photoperiod below which no development
occurs, and is a parameter defining photoperiod sensitivity (Table A8.1).
The effect of vernalization is simulated similar to temperature using the same set of equations
of f(T) but using specific parameters for Tmax, Topt and Tmin of 15.7ºC, 4.9ºC and -1.3ºC,
respectively (Streck et al., 2003a).
The phenological model was used to estimate a climate-dependent dates of occurrence of
heading and physiological maturity, stages in which the wheat blast infection model was applied,
for which DS values of 0.88 (heading) and 2 were used (Streck et al., 2003a). This modeling
approach has been used for multiple models such as CERES-Wheat (Ritchie, 1991) and
applications to predict winter wheat phenology (Streck et al., 2003a), specific developmental
stages (Xue et al., 2004; Streck et al., 2003b), or yields (Mahbod et al., 2015) over different
regions.
As mentioned above, since spring wheat varieties are grown during winter over a vast region
of South Asia (e.g. India), the effect of vernalization on phenological development should not be
considered in the model (f(v) = 1) over those regions, so the separation between spring and
winter wheat growing areas is necessary. For this, the global model-based product on daily
probabilities of winter and spring wheat sowing and harvesting dates around 2000 developed
by Iizumi et al. (2019) was used for the division between the two areas. Since these data
corresponds to probabilities, the areas where the probability of having winter spring is 0 were
taken as exclusive areas of winter wheat.
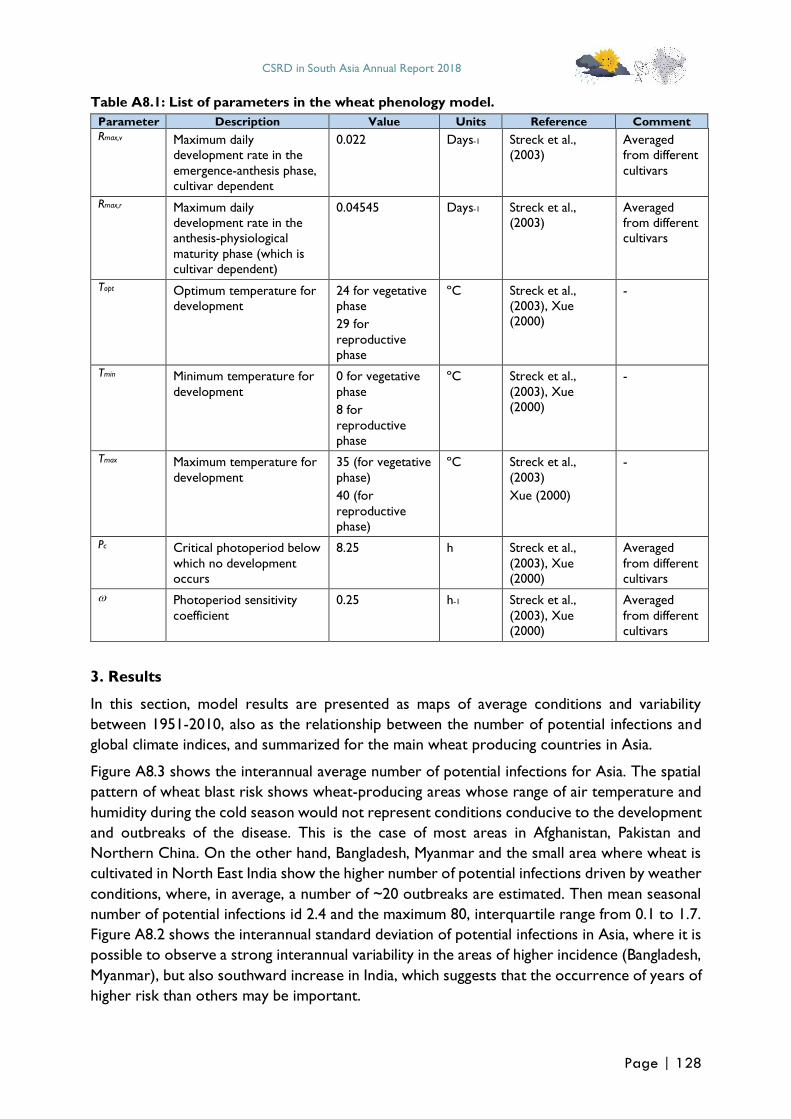
CSRD in South Asia Annual Report 2018
Page | 128
Table A8.1: List of parameters in the wheat phenology model.
Parameter Description Value Units Reference Comment
Rmax,v Maximum daily development rate in the
emergence-anthesis phase, cultivar dependent
0.022 Days-1 Streck et al., (2003)
Averaged from different
cultivars
Rmax,r Maximum daily development rate in the anthesis-physiological
maturity phase (which is cultivar dependent)
0.04545 Days-1 Streck et al., (2003)
Averaged from different cultivars
Topt Optimum temperature for development
24 for vegetative phase
29 for
reproductive phase
ºC Streck et al., (2003), Xue (2000)
-
Tmin Minimum temperature for
development
0 for vegetative
phase
8 for
reproductive phase
ºC Streck et al.,
(2003), Xue (2000)
-
Tmax Maximum temperature for
development
35 (for vegetative
phase)
40 (for
reproductive phase)
ºC Streck et al.,
(2003)
Xue (2000)
-
Pc Critical photoperiod below
which no development occurs
8.25 h Streck et al.,
(2003), Xue (2000)
Averaged
from different cultivars
Photoperiod sensitivity
coefficient
0.25 h-1 Streck et al.,
(2003), Xue (2000)
Averaged
from different cultivars
3. Results
In this section, model results are presented as maps of average conditions and variability
between 1951-2010, also as the relationship between the number of potential infections and
global climate indices, and summarized for the main wheat producing countries in Asia.
Figure A8.3 shows the interannual average number of potential infections for Asia. The spatial
pattern of wheat blast risk shows wheat-producing areas whose range of air temperature and
humidity during the cold season would not represent conditions conducive to the development
and outbreaks of the disease. This is the case of most areas in Afghanistan, Pakistan and
Northern China. On the other hand, Bangladesh, Myanmar and the small area where wheat is
cultivated in North East India show the higher number of potential infections driven by weather
conditions, where, in average, a number of ~20 outbreaks are estimated. Then mean seasonal
number of potential infections id 2.4 and the maximum 80, interquartile range from 0.1 to 1.7.
Figure A8.2 shows the interannual standard deviation of potential infections in Asia, where it is
possible to observe a strong interannual variability in the areas of higher incidence (Bangladesh,
Myanmar), but also southward increase in India, which suggests that the occurrence of years of
higher risk than others may be important.
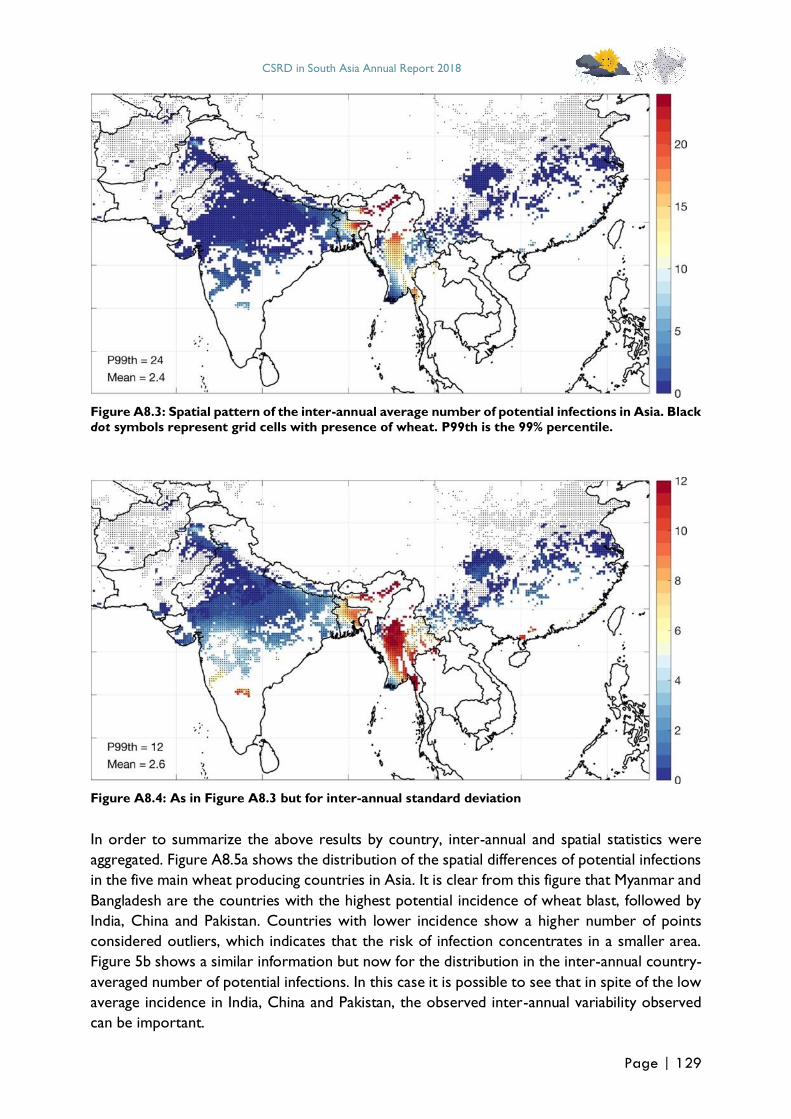
CSRD in South Asia Annual Report 2018
Page | 129
Figure A8.3: Spatial pattern of the inter-annual average number of potential infections in Asia. Black dot symbols represent grid cells with presence of wheat. P99th is the 99% percentile.
Figure A8.4: As in Figure A8.3 but for inter-annual standard deviation
In order to summarize the above results by country, inter-annual and spatial statistics were
aggregated. Figure A8.5a shows the distribution of the spatial differences of potential infections
in the five main wheat producing countries in Asia. It is clear from this figure that Myanmar and
Bangladesh are the countries with the highest potential incidence of wheat blast, followed by
India, China and Pakistan. Countries with lower incidence show a higher number of points
considered outliers, which indicates that the risk of infection concentrates in a smaller area.
Figure 5b shows a similar information but now for the distribution in the inter-annual country-
averaged number of potential infections. In this case it is possible to see that in spite of the low
average incidence in India, China and Pakistan, the observed inter-annual variability observed
can be important.
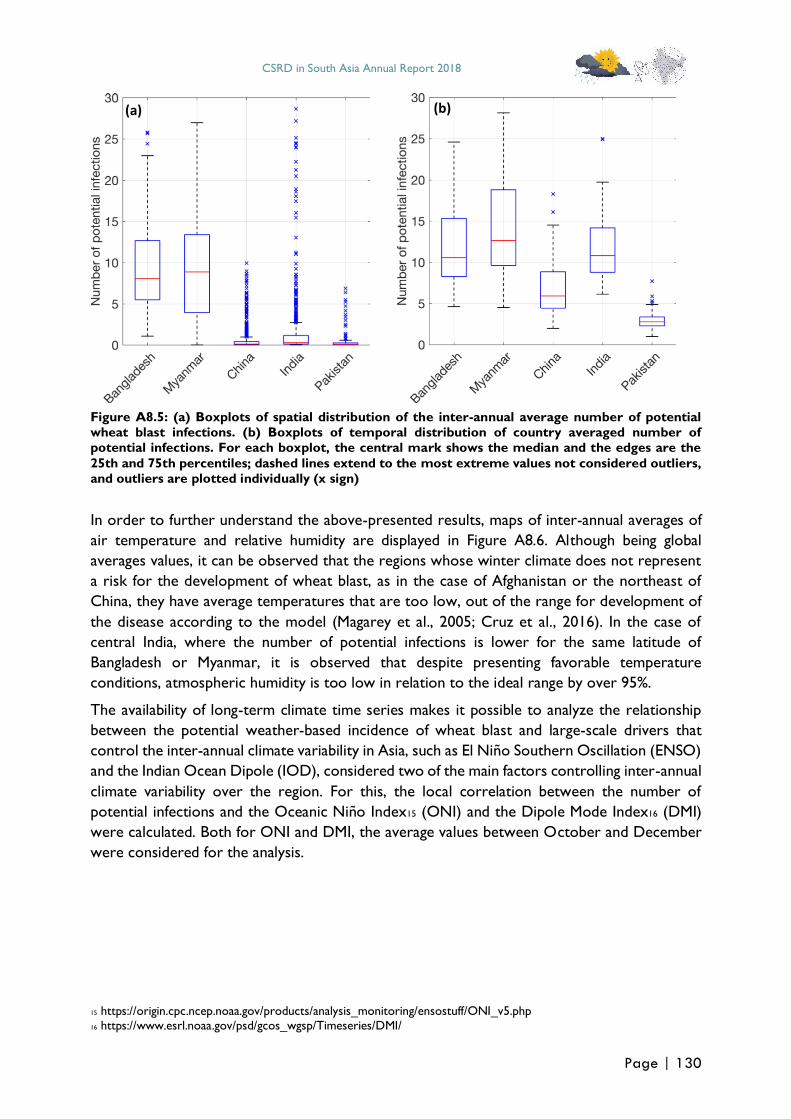
CSRD in South Asia Annual Report 2018
Page | 130
Figure A8.5: (a) Boxplots of spatial distribution of the inter-annual average number of potential wheat blast infections. (b) Boxplots of temporal distribution of country averaged number of potential infections. For each boxplot, the central mark shows the median and the edges are the
25th and 75th percentiles; dashed lines extend to the most extreme values not considered outliers, and outliers are plotted individually (x sign)
In order to further understand the above-presented results, maps of inter-annual averages of
air temperature and relative humidity are displayed in Figure A8.6. Although being global
averages values, it can be observed that the regions whose winter climate does not represent
a risk for the development of wheat blast, as in the case of Afghanistan or the northeast of
China, they have average temperatures that are too low, out of the range for development of
the disease according to the model (Magarey et al., 2005; Cruz et al., 2016). In the case of
central India, where the number of potential infections is lower for the same latitude of
Bangladesh or Myanmar, it is observed that despite presenting favorable temperature
conditions, atmospheric humidity is too low in relation to the ideal range by over 95%.
The availability of long-term climate time series makes it possible to analyze the relationship
between the potential weather-based incidence of wheat blast and large-scale drivers that
control the inter-annual climate variability in Asia, such as El Niño Southern Oscillation (ENSO)
and the Indian Ocean Dipole (IOD), considered two of the main factors controlling inter-annual
climate variability over the region. For this, the local correlation between the number of
potential infections and the Oceanic Niño Index15 (ONI) and the Dipole Mode Index16 (DMI)
were calculated. Both for ONI and DMI, the average values between October and December
were considered for the analysis.
15 https://origin.cpc.ncep.noaa.gov/products/analysis_monitoring/ensostuff/ONI_v5.php
16 https://www.esrl.noaa.gov/psd/gcos_wgsp/Timeseries/DMI/
(a) (b)
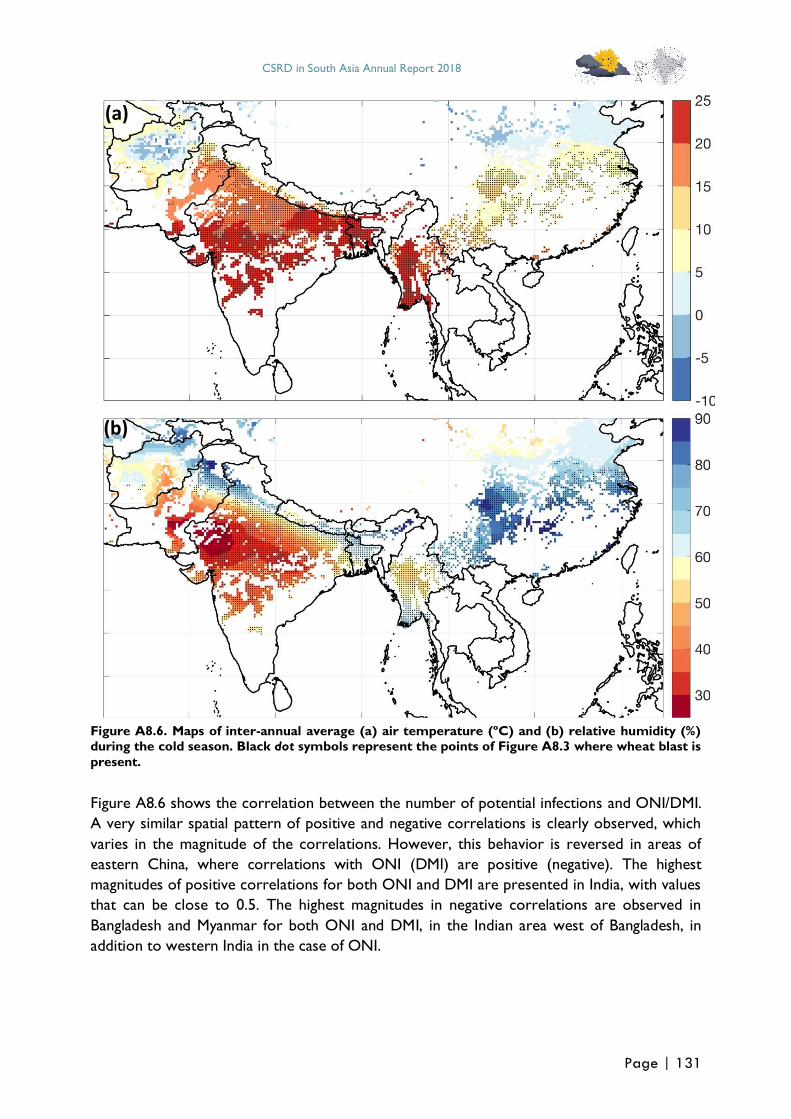
CSRD in South Asia Annual Report 2018
Page | 131
Figure A8.6. Maps of inter-annual average (a) air temperature (ºC) and (b) relative humidity (%) during the cold season. Black dot symbols represent the points of Figure A8.3 where wheat blast is
present.
Figure A8.6 shows the correlation between the number of potential infections and ONI/DMI.
A very similar spatial pattern of positive and negative correlations is clearly observed, which
varies in the magnitude of the correlations. However, this behavior is reversed in areas of
eastern China, where correlations with ONI (DMI) are positive (negative). The highest
magnitudes of positive correlations for both ONI and DMI are presented in India, with values
that can be close to 0.5. The highest magnitudes in negative correlations are observed in
Bangladesh and Myanmar for both ONI and DMI, in the Indian area west of Bangladesh, in
addition to western India in the case of ONI.
(a)
(b)
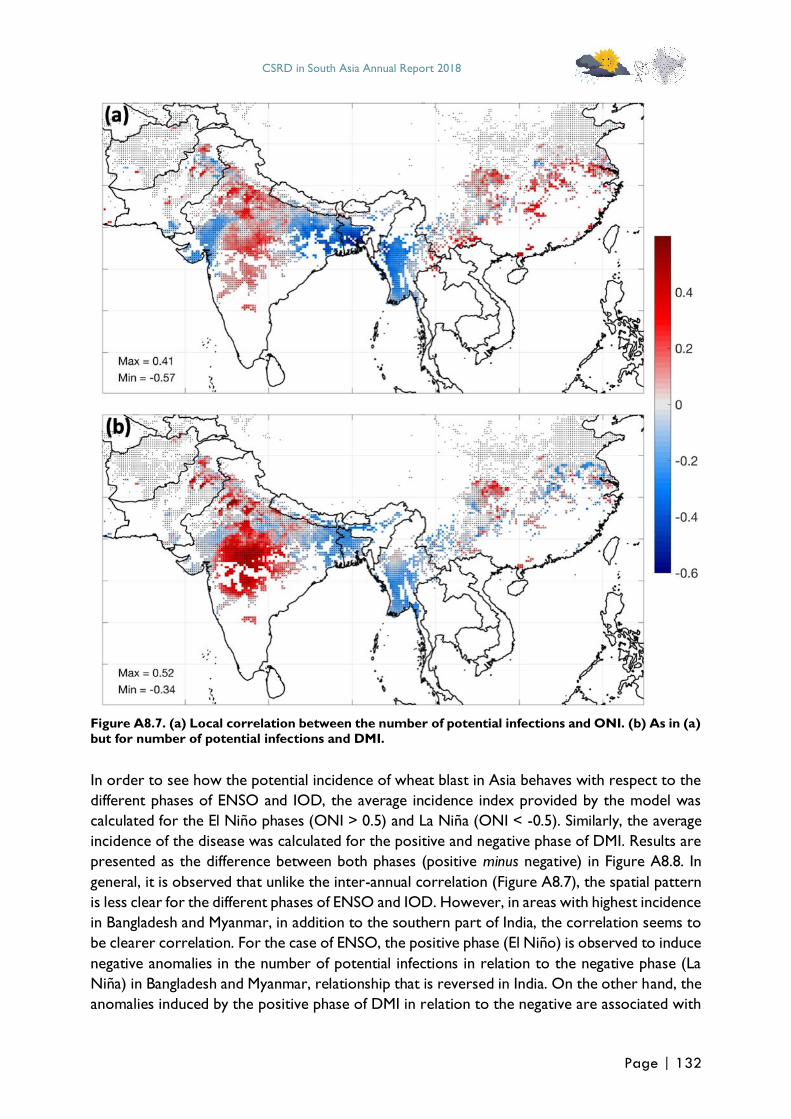
CSRD in South Asia Annual Report 2018
Page | 132
Figure A8.7. (a) Local correlation between the number of potential infections and ONI. (b) As in (a)
but for number of potential infections and DMI.
In order to see how the potential incidence of wheat blast in Asia behaves with respect to the
different phases of ENSO and IOD, the average incidence index provided by the model was
calculated for the El Niño phases (ONI > 0.5) and La Niña (ONI < -0.5). Similarly, the average
incidence of the disease was calculated for the positive and negative phase of DMI. Results are
presented as the difference between both phases (positive minus negative) in Figure A8.8. In
general, it is observed that unlike the inter-annual correlation (Figure A8.7), the spatial pattern
is less clear for the different phases of ENSO and IOD. However, in areas with highest incidence
in Bangladesh and Myanmar, in addition to the southern part of India, the correlation seems to
be clearer correlation. For the case of ENSO, the positive phase (El Niño) is observed to induce
negative anomalies in the number of potential infections in relation to the negative phase (La
Niña) in Bangladesh and Myanmar, relationship that is reversed in India. On the other hand, the
anomalies induced by the positive phase of DMI in relation to the negative are associated with
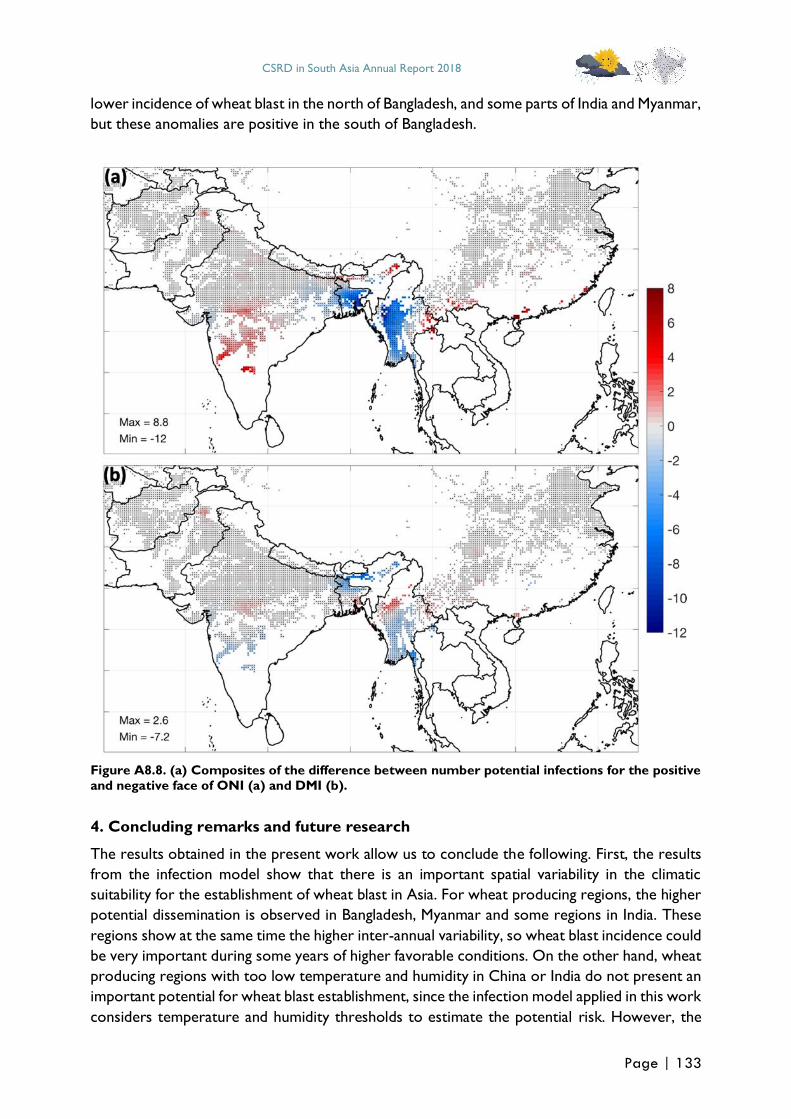
CSRD in South Asia Annual Report 2018
Page | 133
lower incidence of wheat blast in the north of Bangladesh, and some parts of India and Myanmar,
but these anomalies are positive in the south of Bangladesh.
Figure A8.8. (a) Composites of the difference between number potential infections for the positive and negative face of ONI (a) and DMI (b).
4. Concluding remarks and future research
The results obtained in the present work allow us to conclude the following. First, the results
from the infection model show that there is an important spatial variability in the climatic
suitability for the establishment of wheat blast in Asia. For wheat producing regions, the higher
potential dissemination is observed in Bangladesh, Myanmar and some regions in India. These
regions show at the same time the higher inter-annual variability, so wheat blast incidence could
be very important during some years of higher favorable conditions. On the other hand, wheat
producing regions with too low temperature and humidity in China or India do not present an
important potential for wheat blast establishment, since the infection model applied in this work
considers temperature and humidity thresholds to estimate the potential risk. However, the
CSRD in South Asia Annual Report 2018
Page | 134
high inter-annual variability presented by these areas imply that in some years the conditions
could be suitable for wheat blast. The latter results may be relevant when planning disease
prevention actions through new varieties or early warning systems.
According to the observed relationship between inter-annual variability in the number of
potential infections and the associated large-scale climatic drivers (ENSO, IOD), there is a clear
relationship with ONI and DMI indices, associated with their impact on air temperature and
humidity. In turn, the different phases of ENSO and IOD show a greater contrast in Bangladesh
and Myanmar in terms of the incidence of wheat blast, especially in the case of ONI. This should
be explored further using different indices and lead-time periods in order to establish some
statistical relationship that can be used in a forecasting system.
Currently, CIMMYT scientists are working on developing a strategy and methodology that
allows the results generated so far to be translated into an estimate of the potential economic
benefit to farmers of having a surveillance and forecasting system of potential wheat blast
infections. In this way, it would be possible to have a better perspective on the areas over Asia
where the wheat blast pressure infections can have a higher impact, in addition to its association
with factors of temporal variability in climate, and therefore where the development of
adaptation tools are a priority.
References
Adler, R.F., G.J. Huffman, A. Chang, R. Ferraro, P.-P. Xie, J. Janowiak, B. Rudolf, U. Schneider,
S. Curtis, D. Bolvin, A. Gruber, J. Susskind, P. Arkin and E. Nelkin. 2003. The Version-2 Global Precipitation Climatology Project (GPCP) monthly precipitation analysis (1979-
present), J. Hydrometeorol. 4, 1147-1167.
Anderson, P.K., A.A Cunningham, N.G. Patel, F.J. Morales, P.R. Epstein and P. Daszak. 2004 Emerging infectious diseases of plants: pathogen pollution, climate change and
agrotechnology drivers. Trends Ecol. Evol. 19, 535-544.
Bebber, D.P., A.D. Castillo and S.J. Gurr. 2017. Modelling coffee leaf rust risk in Colombia with climate reanalysis data. Phil. Trans. R. Soc. B. 371: 20150458.
Bregaglio, S., M. Donatelli, R. Confalonieri and S. Orlandini. 2010. An integrated evaluation of
thirteen modelling solutions for the generation of hourly values of air relative humidity. Theor. Appl. Climatol. 102, 329-438.
Bregaglio, S, G. Cappelli and M. Donatelli. 2012. Evaluating the suitability of a generic fungal
infection model for pest risk assessment studies. Ecol. Modell. 247, 58-63. Bregaglio, S., M. Donatelli and R. Confalonieri. 2013. Fungal infections of rice, wheat, and grape
in USDope in 2030-2050. Agron. Sustain. Dev. 33, 767-776.
Chaney, N.W., J. Sheffield, G. Villarini E.F. and Wood. 2014. Development of a high-resolution gridded daily meteorological dataset over Sub-Saharan Africa: spatial analysis of trends in
climate extremes. J. Climate. 27, 5815-5835.
Cruz, C.D., R.D. Magarey, D.N. Christie, G.A. Fowler, J.M. Fernandes, W.W. Bockus, V. Valent and J. Stack. 2016. Climate suitability for Magnaporthe oryzae Triticum pathotype in the
United States. Plant Dis. 100, 1979-1987.
Duveiller E., X. He and P.K. Singh. 2016. Wheat blast: an emerging disease in South America potentially threatening wheat production. World Wheat Book, Volume 3. A History of
Wheat. Bonjean A. and van Ginkel M. (Eds.) Pages 1107-1122. Lavoisier, Paris, France.
Donatelli, M., R.D. Magarey, S. Bregaglio, L. Willocquet, J.P.M. Whish and S. Savary. 2017. Modelling the impacts of pests and diseases on agricultural systems. Agric. Syst. 155, 213-
224.
CSRD in South Asia Annual Report 2018
Page | 135
Fisher, M.C., D.A. Henk, C.J. Briggs, J.S. Brownstein, L.C. Madoff, S.L McCraw and S.J. Gurr.
2012. Emerging fungal threats to animal, plant and ecosystem health. Nature. 484, 186-194.
Groot, J. J. R. 1987. Simulation of nitrogen balance in a system of winter wheat and soil. Simulation report CARBO-TT no. 13. Centre for Agrobioloigical Research (CABO) and
Department of Theoretical Production Ecology, Agricultural University Wageningen.
Harris, I., P.D. Jones, T.J. Osborn and D.H. Lister. 2013. Updated high-resolution grids of monthly climatic observations - the CRU TS3.10 Dataset. Int. J. Climatol. 34, 623-642.
Huffman, G.J., R.F. Adler, D.T. Bolvin, G. Gu, E.J. Nelkin, K.P. Bowman, Y. Hong, E.F. Stocker
and D.B. Wolff. 2007. The TRMM Multisatellite Precipitation Analysis (TMPA): quasi-global, multiyear, combined-sensor precipitation estimates at fine scales. J. Hydrometeorol. 8, 38-
55.
Iizumi, T., W. Kim and M. Nishimori. 2019. Modeling the global sowing and harvesting windows of major crops around the year 2000. J. Adv. Model. Earth Sy. 11, 99-112.
International Food Policy Research Institute (IFPRI), 2019, "Global Spatially-Disaggregated Crop
Production Statistics Data for 2010 Version 1.0", https://doi.org/10.7910/DVN/PRFF8V, Harvard Dataverse, V2.
Islam MT, Kim KH, Choi J. 2019. Wheat blast in Bangladesh: the current situation and future
impacts. Plant Pathol. J. 35:1-10. Kalnay, E. and Coauthors. 1996. The NCEP/NCAR 40-Year Reanalysis Project. Bull. Amer.
Meteor. Soc. 77, 437-471.
Launay, M., J. Caubel, G. Bourgeois, F. Huard, I. Garcia de Cortazar-Atauri, M.-O. Bancal and N. Brisson. 2014. Climatic indicators for crop infection risk: application to climate change
impacts on five major foliar fungal diseases in Northern France. Agric. Ecosys. Environ. 197,
147-158. Magarey, R.D., T.B. Sutton and C.L. Thayer. 2005. A simple generic infection model for foliar
fungal plant pathogens. Phytopathol. 95, 92-100.
Mahbod, M., S. Zand-Parsa and A. R. Sepaskhah. 2015. Modification of maize simulation model for predicting growth and yield of winter wheat under different applied water and nitrogen.
Agr. Water Manage. 150, 18-34.
Malaker P.K., N.C.D. Barma, T.P. Tiwari, W.J. Collis, E. Duveiller, P.K Singh and H.-J. Braun. 2016. First report of wheat blast caused by Magnaporthe oryzae pathotype Triticum in
Bangladesh. Plant Dis. 100, 2330.
Mathison, C. Deva, C., Falloon, P., & Challinor, A.J. Estimating sowing and harvest dates based on the Asian summer monsoon. Earth Sys. Dynam., 9, 563-592 (2018).
Mottaleb KA, Singh PK, Sonder K, Kruseman G, Tiwari TP, Barma NCD, et al. 2018. Threat of
wheat blast to South Asia's food security: an ex-ante analysis. PLoS ONE 13(5): e0197555. Ritchie, J.T., 1991. Wheat phasic development. In: R.J. Hanks, Ritchie J.T. (Eds.), Modeling Plant
and Soil Systems. ASA, CSSA, SSSA, Madison, WI, pp. 31-54. Sacks, W. J., D. Deryng, J. A. Foley, and N. Ramankutty, 2010: Crop planting dates: An analysis
of global patterns. Global Ecol. Biogeogr. 19, 607-620.
Sheffield, J., G. Goteti and E.F. Wood. 2006. Development of a 50-year high-resolution global dataset of meteorological forcings for land surface modeling. J. Climate. 19, 3088-3111.
Stackhouse, P.W., S.K. Gupta, S.J. Cox, J.C. Mikowitz, T. Zhang and M. Chiacchio. 2004. 12-
year surface radiation budget data set. GEWEX News, Vol. 14, No. 4. International GEWEX Project Office, Silver Spring, MD, 10–12.
Streck, N. A., A. Weiss, Q. Xue, P. S. Baenziger. 2003. Improving predictions of developmental
stages in winter wheat: a modified Wang and Engel model. Agric. Forest Meteorol. 115, 139-150.
Streck, N. A., A. Weiss, Q. Xue, P. S. Baenziger. 2003. Incorporating a chronology response
into the prediction of leaf appearance rate in winter wheat. Ann. Bot. 92, 181-190.
CSRD in South Asia Annual Report 2018
Page | 136
Wallace, J. and P. Hobbs. 2006. Atmospheric Science: an introductory survey. Amsterdam,
Elsevier Academic Press.
Wang, E. and Engel, T. 1998. Simulation of phenological development of wheat crops. Agric. Syst. 58 (1), 1-24.
Wood-Sichra U, Joglekar AB, You L. Spatial production allocation model (SPAM) 2005:
Technical documentation. Washington, D.C.: International Food Policy Research Institute (IFPRI) and St. Paul: International Science and Technology Practice and Policy (InSTePP)
Center, University of Minnesota; 2016. HarvestChoice Working Paper
Xue, Q., A. Weiss and P. S. Baenziger. 2004. Predicting leaf appearance in field-grown winter wheat: evaluating linear and non-linear models. Ecol. Model. 175, 261-270.
Yan, W. and L.A. Hun. 1999. An equation modeling the temperature response of plant growth
and development using only the cardinal temperatures. Ann. Bot. 84, 607-614. You, L. and S. Wood. 2006. An entropy approach to spatial disaggregation of agricultural
production. Agricultural Systems, Vol. 90(1-3), pp. 329-347.
Related Documents