Year 10 population test By Eleanor Heath

Geography test population
Aug 17, 2015
Welcome message from author
This document is posted to help you gain knowledge. Please leave a comment to let me know what you think about it! Share it to your friends and learn new things together.
Transcript

Year 10 population test
By Eleanor Heath

An ageing populationThe population structure of an ageing population
has more older people (over 65) than younger people because fewer people are being born and more people are surviving until old age.
Richer Countries are usually the countries with an ageing population. Most of these countries are at stage 5 of the Demographic Transition model.
Older people are dependent on the younger working population and so in an ageing population there is a higher proportion of people who are dependent.

Ageing population More elderly people than younger people.
Low birth rate and more more people surviving into old age
Over 65 years of age

Problems with an ageing population Socially
Healthcare services are stretched more because more elderly people need care.
People will need to spent more time working as unpaid careers for older family members- meaning less leisure time and more stress and worry.
People will have fewer children as they cannot afford lots of children when they have dependent elderly relatives, this decreases the BR.
The more elderly people there are the lower the pension will be provided by the government, people will have to retire later because they cant afford to get by from a state pension.
Problems with an ageing population economically
The working population’s taxes will have to increase in order to pay for more state pensions, for the health care which the elderly will need and retirement homes for the elderly to live in.
The economy of the country would grow much slower and less money will be spent to boost the economy- education and business and more money would be spent elsewhere which don’t help boost the economy- retirement homes and healthcare.
Problems with an youthful population.
Young children need health care - for example, immunisations. This is expensive for a country to provide.
Young people need to be educated - providing schools and teachers are expensive. Resources for lessons are difficult to access, and costly to buy.
In the future, more children will reach child bearing age, putting more pressure on the health service.
Benefits of an youthful population
Often in LEDCs children do not go to school and instead do work. LEDCs have a large youthful population because of their high birth and death rate.
There are lots of potential workers in the future.
Youthful Population Graph
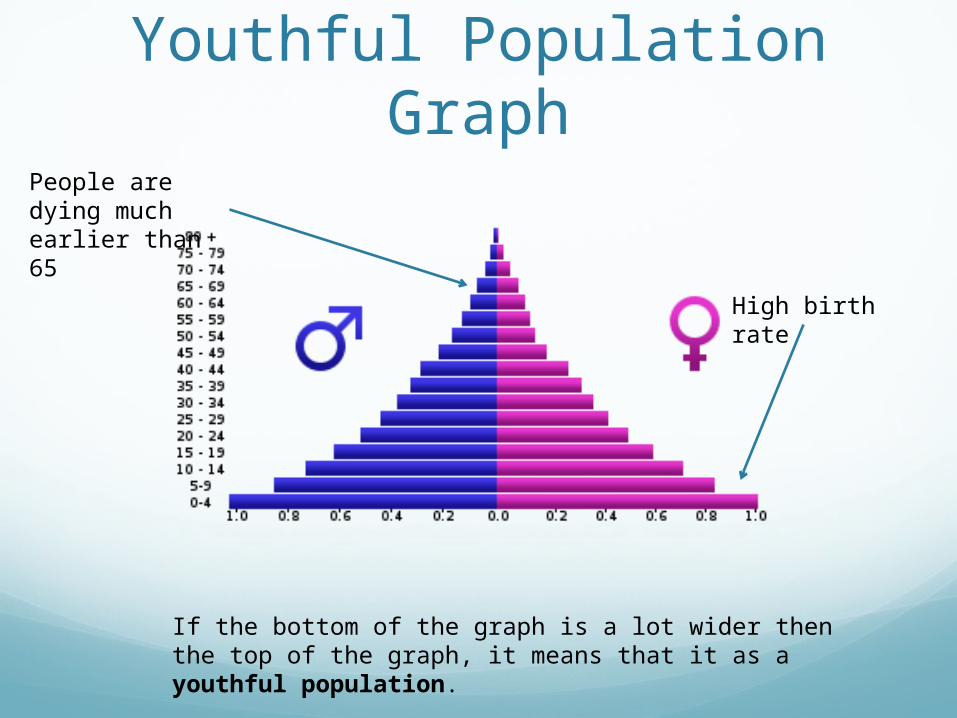
High birth rate
If the bottom of the graph is a lot wider then the top of the graph, it means that it as a youthful population.
People are dying much earlier than 65
Population PyramidsShow how many people there are of each group
in the population and how many there are of each gender.
Population pyramids change as a population becomes more economically developed.
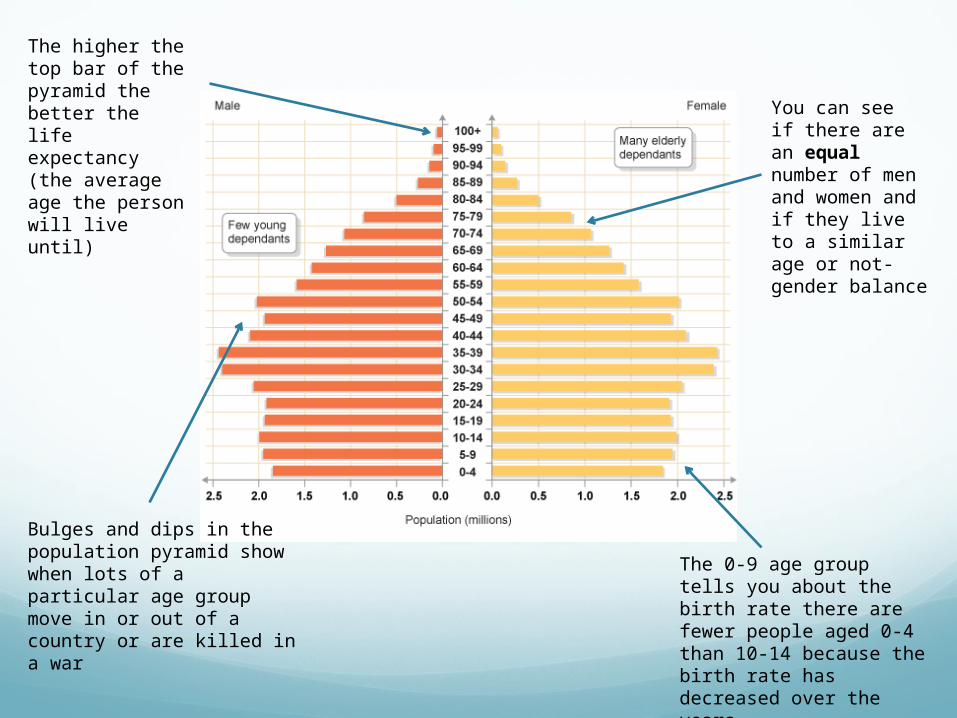
You can see if there are an equal number of men and women and if they live to a similar age or not- gender balance
The 0-9 age group tells you about the birth rate there are fewer people aged 0-4 than 10-14 because the birth rate has decreased over the years.
Bulges and dips in the population pyramid show when lots of a particular age group move in or out of a country or are killed in a war
The higher the top bar of the pyramid the better the life expectancy (the average age the person will live until)
Stage 1BR is high because there is no use of
contraception and people have lots of children as infant mortality is low.
DR is high due to poor healthcare or a famine
Population growth rate is zero
Population structure- life expectancy is low (few people reach old age) and the population is mostly made up of younger people.
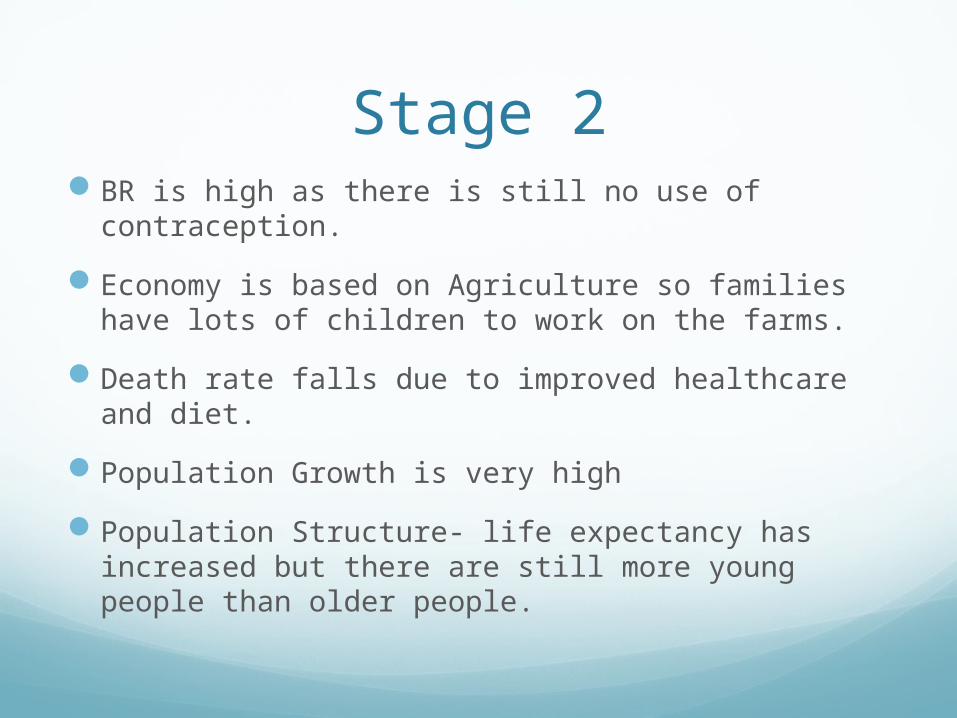
Stage 2BR is high as there is still no use of contraception.
Economy is based on Agriculture so families have lots of children to work on the farms.
Death rate falls due to improved healthcare and diet.
Population Growth is very high
Population Structure- life expectancy has increased but there are still more young people than older people.

Stage 3BR is rapidly falling due to contraception which
increases more women to work instead of having children, women have a more equal place in society and a better education.
The economy becomes industrial and so less children are needed to work on farms
DR falls to medical advances
Population growth is high and more people are living for longer.
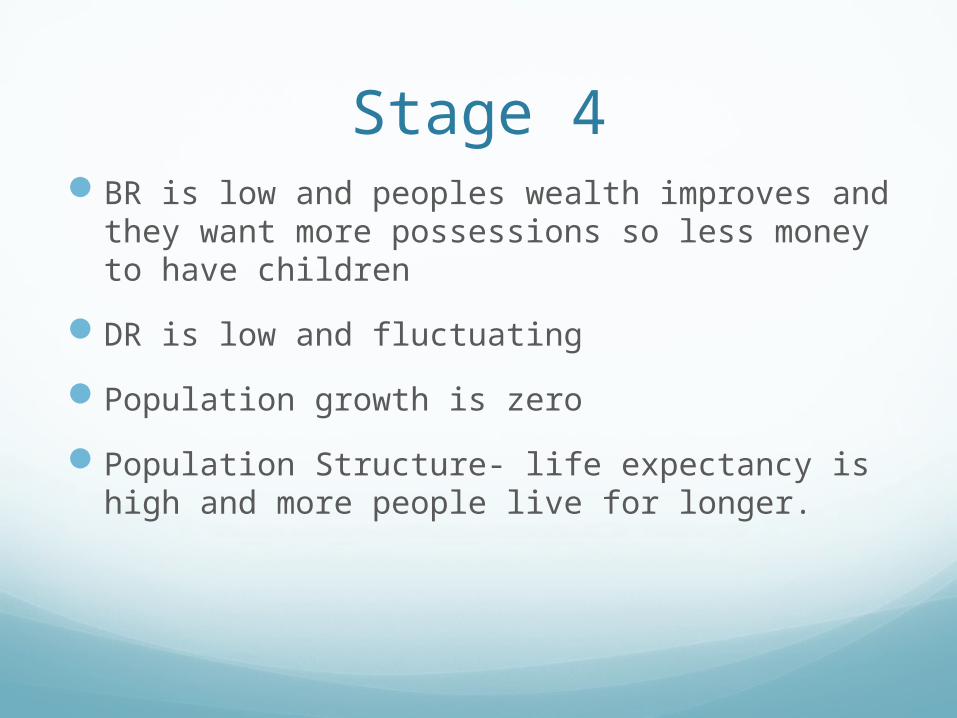
Stage 4BR is low and peoples wealth improves and they
want more possessions so less money to have children
DR is low and fluctuating
Population growth is zero
Population Structure- life expectancy is high and more people live for longer.
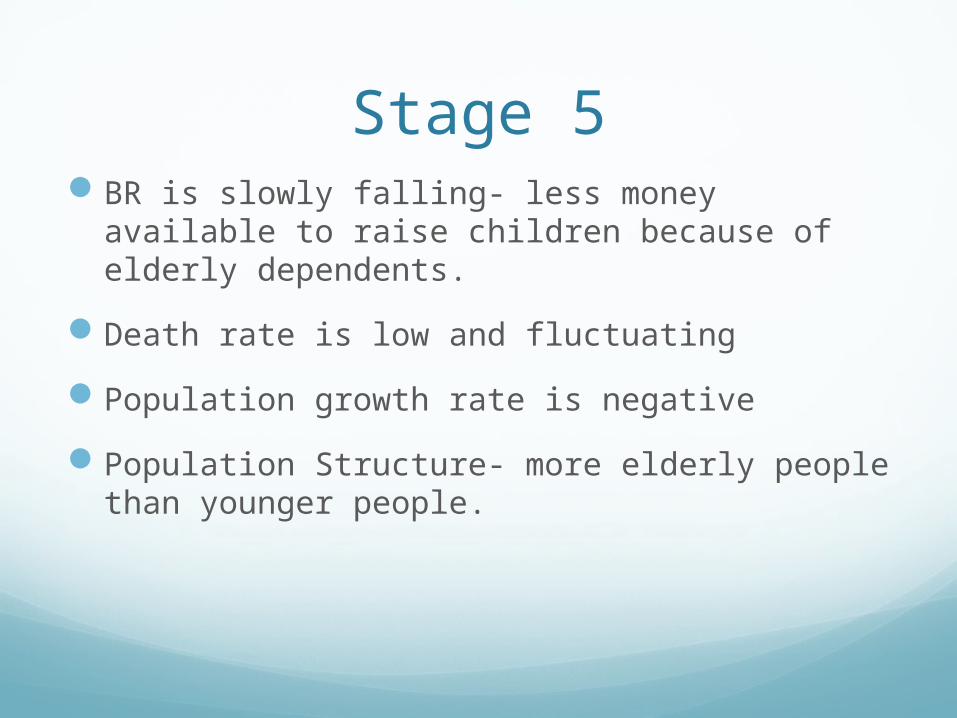
Stage 5BR is slowly falling- less money available to raise
children because of elderly dependents.
Death rate is low and fluctuating
Population growth rate is negative
Population Structure- more elderly people than younger people.

Main Causes for population change
Births - usually measured using the birth rate (number of live births per 1,000 of the population per year).
Deaths - usually measured using the death rate (number of deaths per 1,000 of the population per year).
Migration - the movement of people in and out of an area.
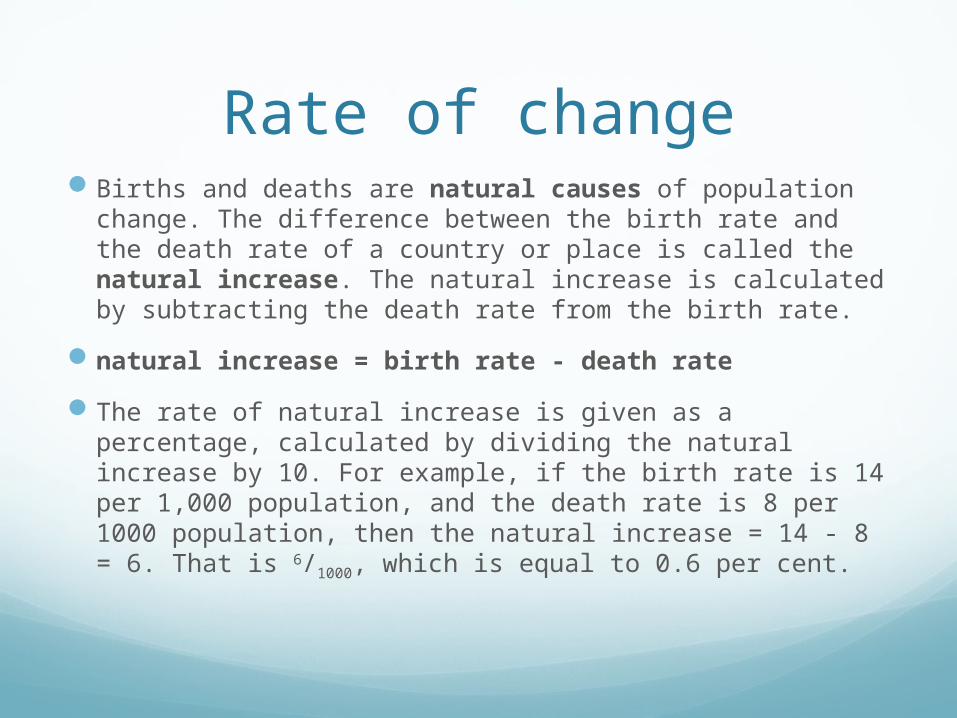
Rate of changeBirths and deaths are natural causes of population
change. The difference between the birth rate and the death rate of a country or place is called the natural increase. The natural increase is calculated by subtracting the death rate from the birth rate.
natural increase = birth rate - death rate
The rate of natural increase is given as a percentage, calculated by dividing the natural increase by 10. For example, if the birth rate is 14 per 1,000 population, and the death rate is 8 per 1000 population, then the natural increase = 14 - 8 = 6. That is 6/1000, which is equal to 0.6 per cent.
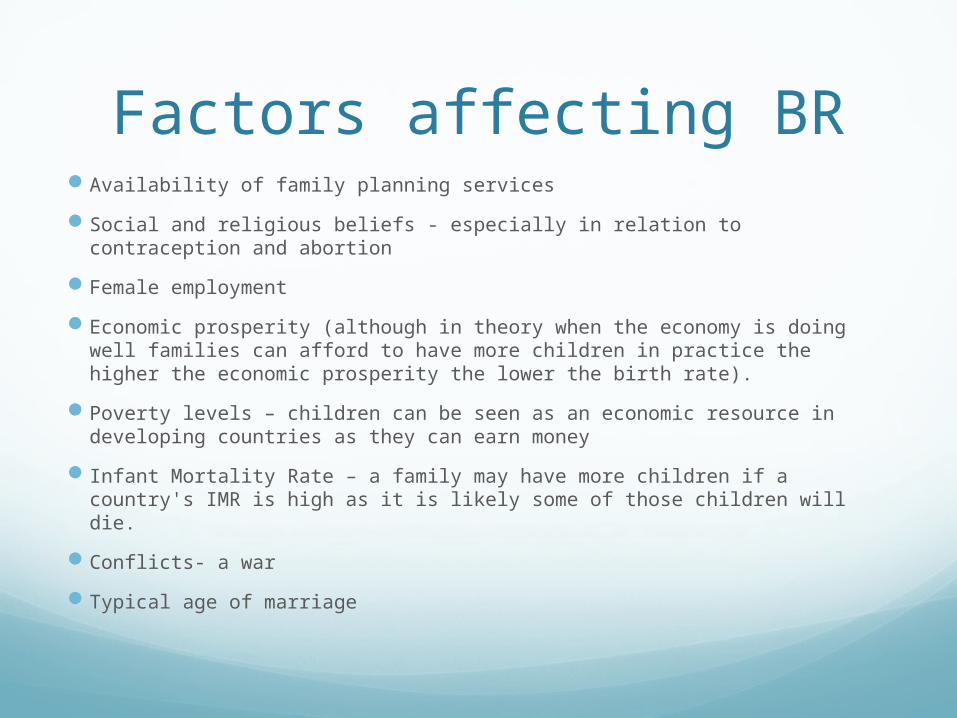
Factors affecting BR Availability of family planning services
Social and religious beliefs - especially in relation to contraception and abortion
Female employment
Economic prosperity (although in theory when the economy is doing well families can afford to have more children in practice the higher the economic prosperity the lower the birth rate).
Poverty levels – children can be seen as an economic resource in developing countries as they can earn money
Infant Mortality Rate – a family may have more children if a country's IMR is high as it is likely some of those children will die.
Conflicts- a war
Typical age of marriage

Factors affecting DRMedical facilities and health care
Nutrition levels
Living standard
Access to clean drinking water
Hygiene levels
Levels of infectious diseases
Social factors such as conflicts and levels of violent crime

MigrationImmigration- when people move into an area
Emigration- when people exit an area
International migration- moving to another country
Internal migration-moving within a region of a country

Types of migrantRefugees- people who are forced to leave a
country due to things like war, persecution or an natural disaster
Economic migrants- people who voluntarily move from a poorer country to a richer country looking for a job or higher wages. Often they migrate to earn more money and then move back to their origin.
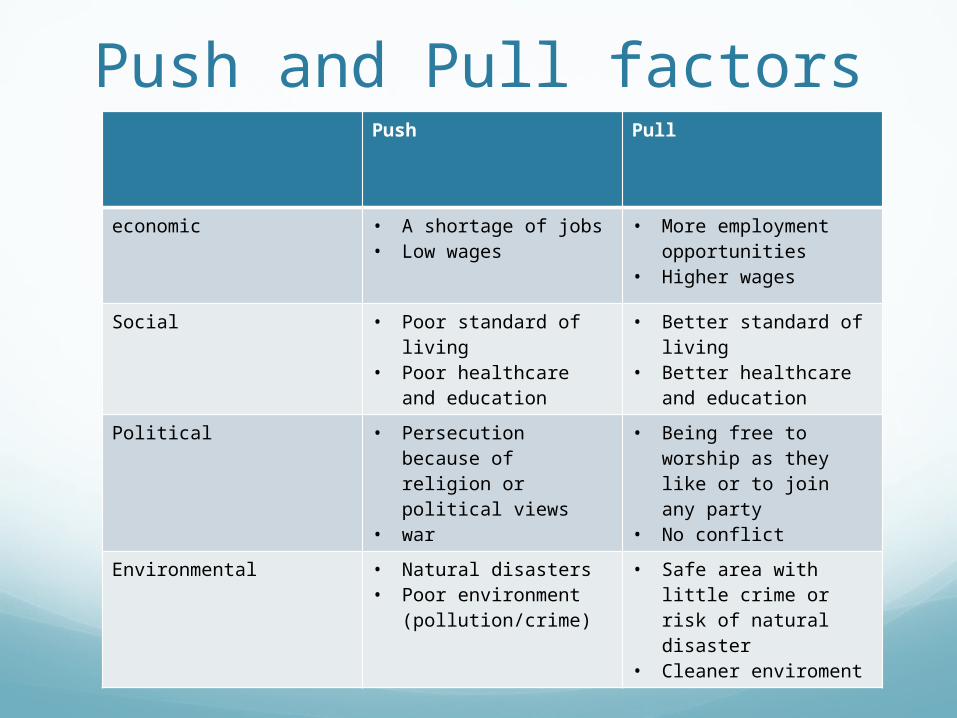
Push and Pull factorsPush Pull
economic • A shortage of jobs• Low wages
• More employment opportunities
• Higher wages
Social • Poor standard of living• Poor healthcare and
education
• Better standard of living
• Better healthcare and education
Political • Persecution because of religion or political views
• war
• Being free to worship as they like or to join any party
• No conflict
Environmental • Natural disasters • Poor environment
(pollution/crime)
• Safe area with little crime or risk of natural disaster
• Cleaner enviroment
Related Documents