Geochemical anomaly separation by multifractal modeling in Kahang (Gor Gor) porphyry system, Central Iran Peyman Afzal a, ⁎, Ahmad Khakzad b , Parviz Moarefvand c , N. Rashidnejad Omran d , Bijan Esfandiari e , Younes Fadakar Alghalandis f a Science and Research Branch, Islamic Azad University, Department of Geology, Tehran, Iran b North Tehran Branch, Islamic Azad University, Department of Geology, Tehran, Iran c Amirkabir University of Technology, Mining and Metallurgy Faculty, Tehran, Iran d Tarbiat Modares University, Department of Geology, Tehran, Iran e South Tehran Branch, Islamic Azad University, Department of Mining Engineering, Tehran, Iran f School of Earth Sciences, University of Queensland, Brisbane, Australia abstract article info Article history: Received 12 March 2009 Accepted 13 November 2009 Available online 26 November 2009 Keywords: Geochemical anomaly Porphyry system Concentration–area method Multifractal Kahang porphyry Central Iran Geochemical anomaly separation using the concentration–area (C–A) method at Kahang (Gor Gor) porphyry system in Central Iran is studied in this work. Lithogeochemical data sets were used in this geochemical survey which was conducted for the exploration for Cu mineralization in dioritic and andesitic units at Kahang Cu–Mo porphyry system. Similar surveys were also carried out for Mo and Au exploration in these rock units. The obtained results have been interpreted using rather extensive set of information available for each mineralized area, consists of detailed geological mapping, structural interpretation and alteration data. Anomalous threshold values for the mineralized zone were computed and compared with the statistical methods based on the data obtained from chemical analysis of samples for the lithological units. Several anomalies at a local scale were identified for Cu (224 ppm), Mo (63 ppm), and Au (31 ppb), and the obtained results suggests existence of local Cu anomalies whose magnitude generally is above 1000 ppm. The correlation between these threshold values and ore grades is clearly interpreted in this investigation. Also, the log–log plots show existence of three stages of Cu enrichment, and two enrichment stages for Mo and Au. The third and most important mineralization event is responsible for the presence of Cu at grades above 1995 ppm. The identified anomalies in Kahang porphyry system, and distribution of the rock types, are mainly monzodiorite and andesitic units, do have special correlation with Cu and monzonitic and dioritic rocks, especially monzodioritic type, which is of considerable emphasis. The threshold values obtained for each element are always lower than their mean content in the rocks. The study shows threshold values for Cu is clearly above the mean rock content, being a consequence of the occurrence of anomalous accumulations of phyllic, argillic and propyllitic alterations within the monzonitic and dioritic rocks especially in monzodioritic type. The obtained results were compared with fault distribution patterns which reveal a positive direct correlation between mineralization in anomalous areas and the faults present in the mineralized system. © 2009 Elsevier B.V. All rights reserved. 1. Introduction Separation of background and anomaly is a fundamental issue in exploration geochemistry. In the past and recent years, traditional statistical methods usually assumed that the concentration of chemical elements in the crust follow a normal or log-normal distribution. A geochemical anomaly as defined is a region where the concentration of a specific element is greater than a certain threshold value by statistical parameters, such as mean, median, mode, and standard deviation (Li et al., 2003). However, the traditional methods consider only the frequency distribution of the elemental concentration, and ignored its spatial variability. Specifically, the information about the spatial correlation is not always available. In addition, these methods are only applicable to cases where geochemical data follows a normal distribution. Nevertheless, the normal distribu- tion does not provide the only possible model of geochemical distribution (Li et al., 2003). Furthermore, the gathered data have to be modified in traditional methods; e.g., by rejection of outliers and normalization of data. Moreover, statistical methods e.g., by histogram analysis or Q–Q plots assuming normality or lognormality and do not consider the shape, extent and magnitude of anomalous areas (Rafiee, 2005). Fractal models can be used for solving these problems. The word “Fractal” was coined by Benoit Mandelbrot (1983) from the Latin word “fractus”, meaning broken, which he has applied to objects that were too Journal of Geochemical Exploration 104 (2010) 34–46 ⁎ Corresponding author. Department of Geology, Science and Research Branch, Islamic Azad University, Tehran, Iran. Tel.: +98 21 66944526. E-mail address: [email protected] (P. Afzal). 0375-6742/$ – see front matter © 2009 Elsevier B.V. All rights reserved. doi:10.1016/j.gexplo.2009.11.003 Contents lists available at ScienceDirect Journal of Geochemical Exploration journal homepage: www.elsevier.com/locate/jgeoexp

Welcome message from author
This document is posted to help you gain knowledge. Please leave a comment to let me know what you think about it! Share it to your friends and learn new things together.
Transcript
Journal of Geochemical Exploration 104 (2010) 34–46
Contents lists available at ScienceDirect
Journal of Geochemical Exploration
j ourna l homepage: www.e lsev ie r.com/ locate / jgeoexp
Geochemical anomaly separation by multifractal modeling in Kahang (Gor Gor)porphyry system, Central Iran
Peyman Afzal a,⁎, Ahmad Khakzad b, Parviz Moarefvand c, N. Rashidnejad Omran d,Bijan Esfandiari e, Younes Fadakar Alghalandis f
a Science and Research Branch, Islamic Azad University, Department of Geology, Tehran, Iranb North Tehran Branch, Islamic Azad University, Department of Geology, Tehran, Iranc Amirkabir University of Technology, Mining and Metallurgy Faculty, Tehran, Irand Tarbiat Modares University, Department of Geology, Tehran, Irane South Tehran Branch, Islamic Azad University, Department of Mining Engineering, Tehran, Iranf School of Earth Sciences, University of Queensland, Brisbane, Australia
⁎ Corresponding author. Department of Geology, SIslamic Azad University, Tehran, Iran. Tel.: +98 21 6694
E-mail address: [email protected] (P. Afzal).
0375-6742/$ – see front matter © 2009 Elsevier B.V. Adoi:10.1016/j.gexplo.2009.11.003
a b s t r a c t
a r t i c l e i n f oArticle history:Received 12 March 2009Accepted 13 November 2009Available online 26 November 2009
Keywords:Geochemical anomalyPorphyry systemConcentration–area methodMultifractalKahang porphyryCentral Iran
Geochemical anomaly separation using the concentration–area (C–A) method at Kahang (Gor Gor) porphyrysystem in Central Iran is studied in this work. Lithogeochemical data sets were used in this geochemical surveywhichwas conducted for the exploration for Cumineralization in dioritic and andesitic units at Kahang Cu–Moporphyry system. Similar surveys were also carried out for Mo and Au exploration in these rock units. Theobtained results have been interpreted using rather extensive set of information available for eachmineralizedarea, consists of detailed geological mapping, structural interpretation and alteration data. Anomalousthreshold values for themineralized zonewere computed and comparedwith the statistical methods based onthe data obtained from chemical analysis of samples for the lithological units. Several anomalies at a local scalewere identified for Cu (224 ppm), Mo (63 ppm), and Au (31 ppb), and the obtained results suggests existenceof local Cu anomalies whosemagnitude generally is above 1000 ppm. The correlation between these thresholdvalues and ore grades is clearly interpreted in this investigation. Also, the log–log plots show existence of threestages of Cu enrichment, and two enrichment stages for Mo and Au. The third and most importantmineralization event is responsible for the presence of Cu at grades above 1995 ppm. The identified anomaliesin Kahang porphyry system, and distribution of the rock types, aremainlymonzodiorite and andesitic units, dohave special correlation with Cu and monzonitic and dioritic rocks, especially monzodioritic type, which is ofconsiderable emphasis. The threshold values obtained for each element are always lower than their meancontent in the rocks. The study shows threshold values for Cu is clearly above the mean rock content, being aconsequence of the occurrence of anomalous accumulations of phyllic, argillic and propyllitic alterationswithin themonzonitic and dioritic rocks especially inmonzodioritic type. The obtained results were comparedwith fault distribution patterns which reveal a positive direct correlation between mineralization inanomalous areas and the faults present in the mineralized system.
cience and Research Branch,4526.
ll rights reserved.
© 2009 Elsevier B.V. All rights reserved.
1. Introduction
Separation of background and anomaly is a fundamental issue inexploration geochemistry. In the past and recent years, traditionalstatistical methods usually assumed that the concentration ofchemical elements in the crust follow a normal or log-normaldistribution. A geochemical anomaly as defined is a region wherethe concentration of a specific element is greater than a certainthreshold value by statistical parameters, such as mean, median,mode, and standard deviation (Li et al., 2003). However, the
traditional methods consider only the frequency distribution of theelemental concentration, and ignored its spatial variability. Specifically,the information about the spatial correlation is not always available. Inaddition, thesemethods are only applicable to caseswhere geochemicaldata follows a normal distribution. Nevertheless, the normal distribu-tion does not provide the only possible model of geochemicaldistribution (Li et al., 2003). Furthermore, the gathered data have tobe modified in traditional methods; e.g., by rejection of outliers andnormalization of data. Moreover, statistical methods e.g., by histogramanalysis or Q–Q plots assuming normality or lognormality and do notconsider the shape, extent and magnitude of anomalous areas (Rafiee,2005). Fractal models can be used for solving these problems. The word“Fractal”was coined by Benoit Mandelbrot (1983) from the Latin word“fractus”,meaningbroken,whichhehas applied to objects thatwere too
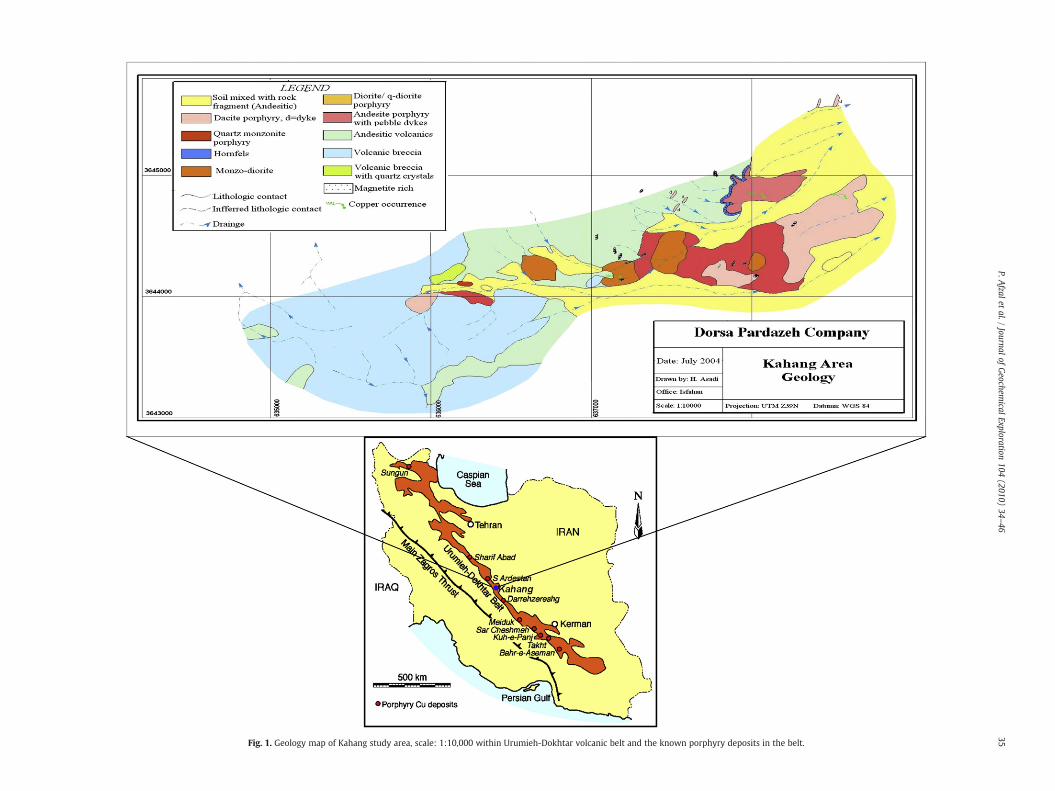
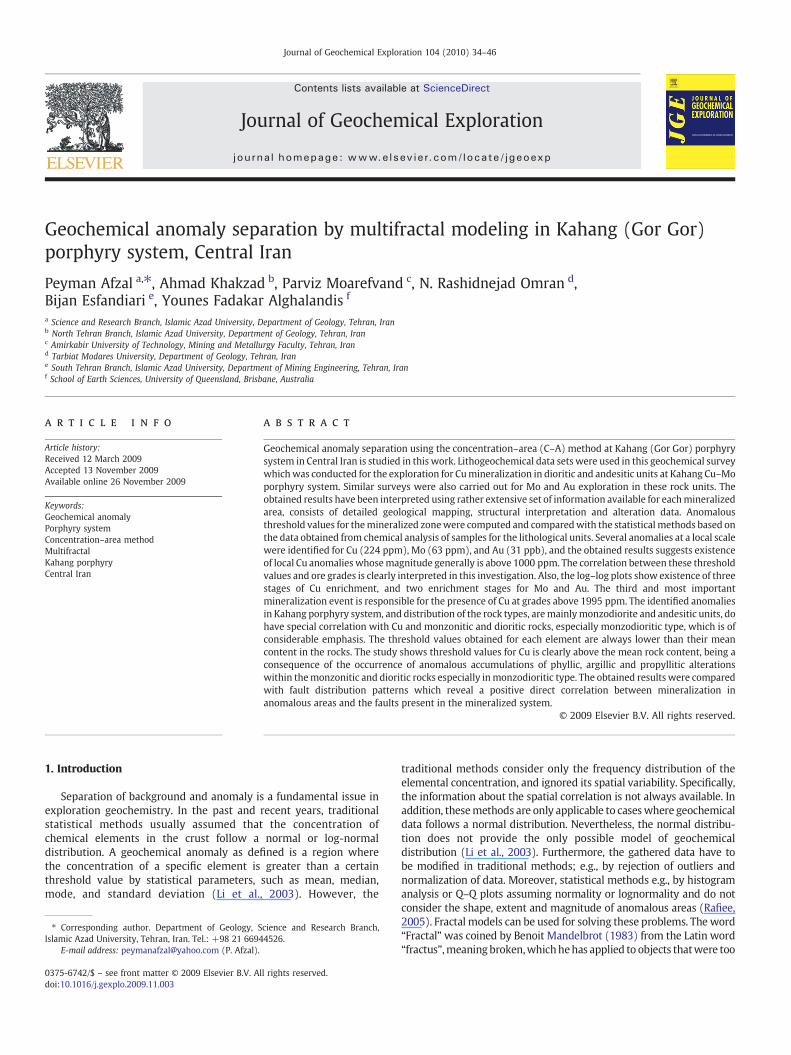
Fig. 1. Geology map of Kahang study area, scale: 1:10,000 within Urumieh-Dokhtar volcanic belt and the known porphyry deposits in the belt.
35P.A
fzalet
al./Journal
ofGeochem
icalExploration
104(2010)
34–46
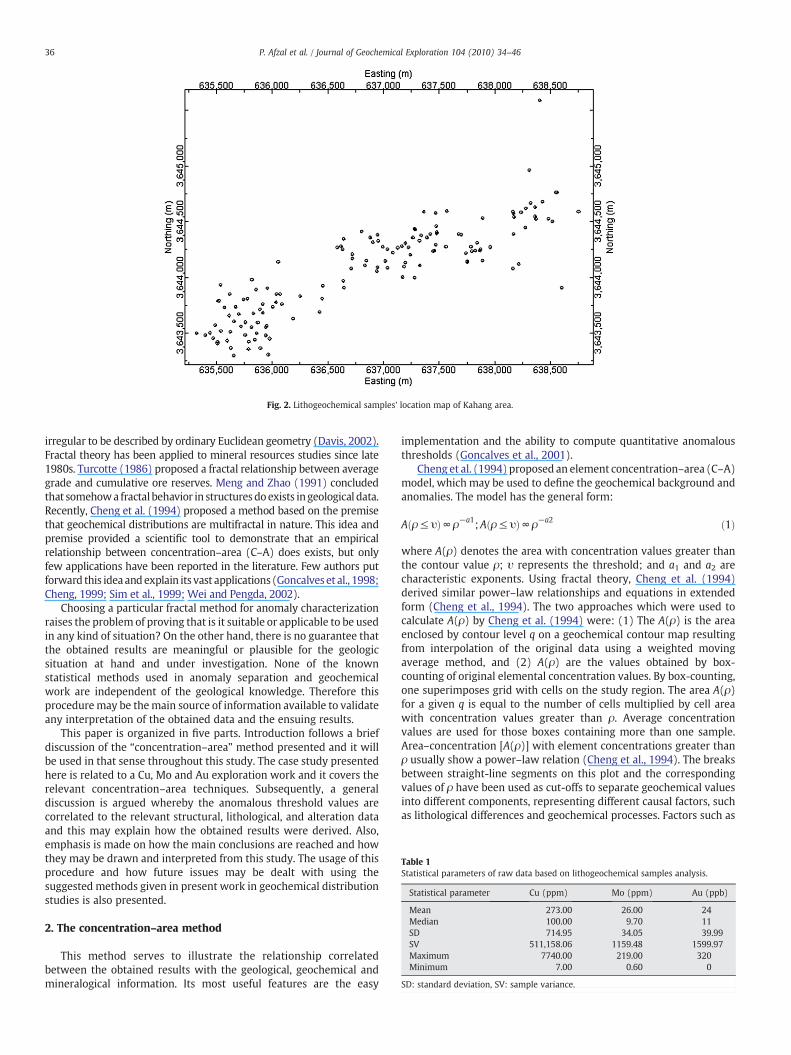
Fig. 2. Lithogeochemical samples' location map of Kahang area.
Table 1Statistical parameters of raw data based on lithogeochemical samples analysis.
Statistical parameter Cu (ppm) Mo (ppm) Au (ppb)
Mean 273.00 26.00 24Median 100.00 9.70 11SD 714.95 34.05 39.99SV 511,158.06 1159.48 1599.97Maximum 7740.00 219.00 320Minimum 7.00 0.60 0
SD: standard deviation, SV: sample variance.
36 P. Afzal et al. / Journal of Geochemical Exploration 104 (2010) 34–46
irregular to be described by ordinary Euclidean geometry (Davis, 2002).Fractal theory has been applied to mineral resources studies since late1980s. Turcotte (1986) proposed a fractal relationship between averagegrade and cumulative ore reserves. Meng and Zhao (1991) concludedthat somehowa fractal behavior in structuresdoexists ingeological data.Recently, Cheng et al. (1994) proposed a method based on the premisethat geochemical distributions are multifractal in nature. This idea andpremise provided a scientific tool to demonstrate that an empiricalrelationship between concentration–area (C–A) does exists, but onlyfew applications have been reported in the literature. Few authors putforward this ideaandexplain its vast applications (Goncalves et al., 1998;Cheng, 1999; Sim et al., 1999; Wei and Pengda, 2002).
Choosing a particular fractal method for anomaly characterizationraises the problem of proving that is it suitable or applicable to be usedin any kind of situation? On the other hand, there is no guarantee thatthe obtained results are meaningful or plausible for the geologicsituation at hand and under investigation. None of the knownstatistical methods used in anomaly separation and geochemicalwork are independent of the geological knowledge. Therefore thisproceduremay be themain source of information available to validateany interpretation of the obtained data and the ensuing results.
This paper is organized in five parts. Introduction follows a briefdiscussion of the “concentration–area” method presented and it willbe used in that sense throughout this study. The case study presentedhere is related to a Cu, Mo and Au exploration work and it covers therelevant concentration–area techniques. Subsequently, a generaldiscussion is argued whereby the anomalous threshold values arecorrelated to the relevant structural, lithological, and alteration dataand this may explain how the obtained results were derived. Also,emphasis is made on how the main conclusions are reached and howthey may be drawn and interpreted from this study. The usage of thisprocedure and how future issues may be dealt with using thesuggested methods given in present work in geochemical distributionstudies is also presented.
2. The concentration–area method
This method serves to illustrate the relationship correlatedbetween the obtained results with the geological, geochemical andmineralogical information. Its most useful features are the easy
implementation and the ability to compute quantitative anomalousthresholds (Goncalves et al., 2001).
Cheng et al. (1994) proposed an element concentration–area (C–A)model, which may be used to define the geochemical background andanomalies. The model has the general form:
Aðρ≤ υÞ∞ ρ−a1;Aðρ≤ υÞ∞ ρ−a2 ð1Þ
where A(ρ) denotes the area with concentration values greater thanthe contour value ρ; υ represents the threshold; and a1 and a2 arecharacteristic exponents. Using fractal theory, Cheng et al. (1994)derived similar power–law relationships and equations in extendedform (Cheng et al., 1994). The two approaches which were used tocalculate A(ρ) by Cheng et al. (1994) were: (1) The A(ρ) is the areaenclosed by contour level q on a geochemical contour map resultingfrom interpolation of the original data using a weighted movingaverage method, and (2) A(ρ) are the values obtained by box-counting of original elemental concentration values. By box-counting,one superimposes grid with cells on the study region. The area A(ρ)for a given q is equal to the number of cells multiplied by cell areawith concentration values greater than ρ. Average concentrationvalues are used for those boxes containing more than one sample.Area–concentration [A(ρ)] with element concentrations greater thanρ usually show a power–law relation (Cheng et al., 1994). The breaksbetween straight-line segments on this plot and the correspondingvalues of ρ have been used as cut-offs to separate geochemical valuesinto different components, representing different causal factors, suchas lithological differences and geochemical processes. Factors such as
37P. Afzal et al. / Journal of Geochemical Exploration 104 (2010) 34–46
mineralizing events, surficial geochemical element concentrations,and surficial weathering are of considerable importance (Lima et al.,2003).
Multifractal theory may be interpreted as a theoretical frameworkthat explains the power–law relations between areas enclosingconcentrations below a given value and the actual concentrations
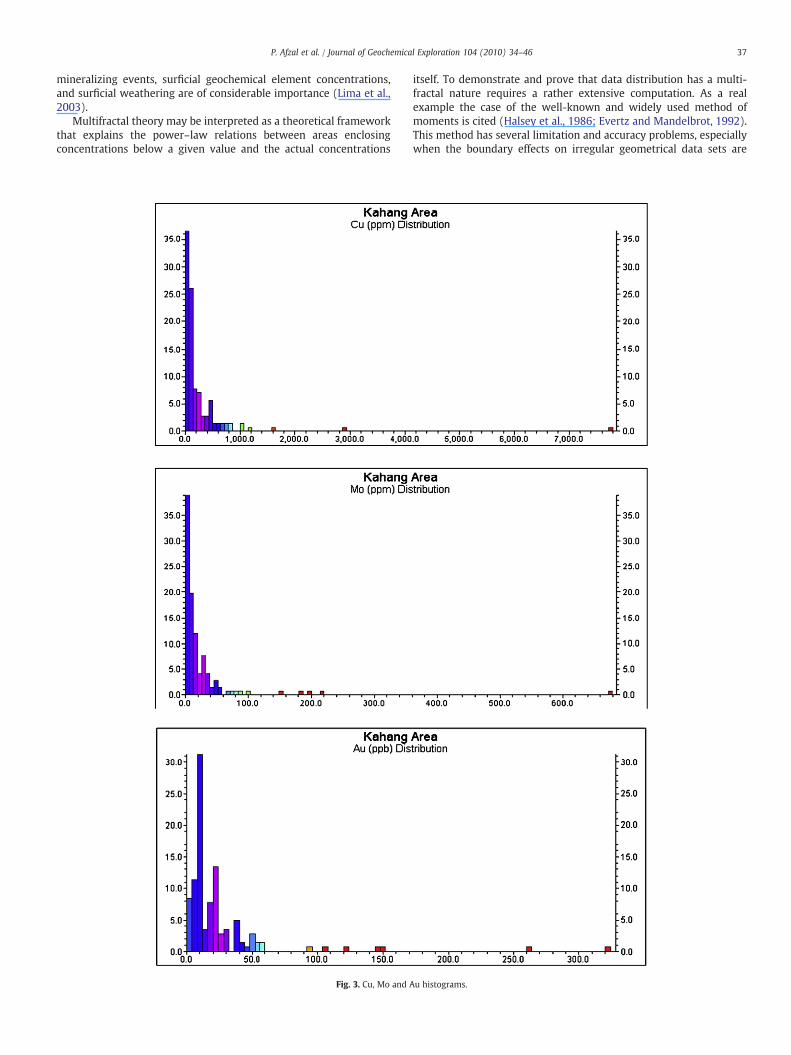
Fig. 3. Cu, Mo and A
itself. To demonstrate and prove that data distribution has a multi-fractal nature requires a rather extensive computation. As a realexample the case of the well-known and widely used method ofmoments is cited (Halsey et al., 1986; Evertz and Mandelbrot, 1992).This method has several limitation and accuracy problems, especiallywhen the boundary effects on irregular geometrical data sets are
u histograms.
38 P. Afzal et al. / Journal of Geochemical Exploration 104 (2010) 34–46
involved (Agterberg et al., 1996; Goncalves, 2001). The C–A methodseems to be equally applicable as well to all cases, which is probablyrooted in the fact that geochemical distributions mostly satisfy theproperties of a multifractal function. There exists some evidence that
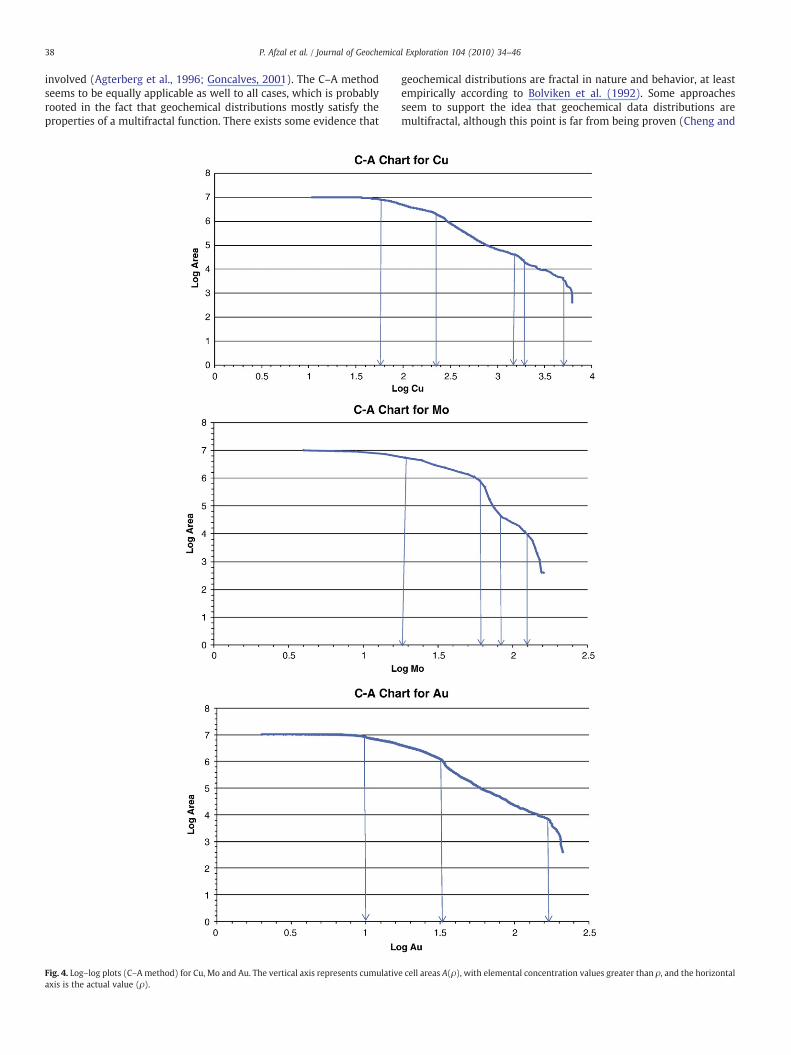
Fig. 4. Log–log plots (C–Amethod) for Cu, Mo and Au. The vertical axis represents cumulativaxis is the actual value (ρ).
geochemical distributions are fractal in nature and behavior, at leastempirically according to Bolviken et al. (1992). Some approachesseem to support the idea that geochemical data distributions aremultifractal, although this point is far from being proven (Cheng and
e cell areas A(ρ), with elemental concentration values greater than ρ, and the horizontal
39P. Afzal et al. / Journal of Geochemical Exploration 104 (2010) 34–46
Agterberg, 1996; Turcotte, 1997; Goncalves, 2001). This idea mayprovide and help the development of an alternative interpretationvalidation and useful methods to be applied to elemental geochemicaldistributions analysis.
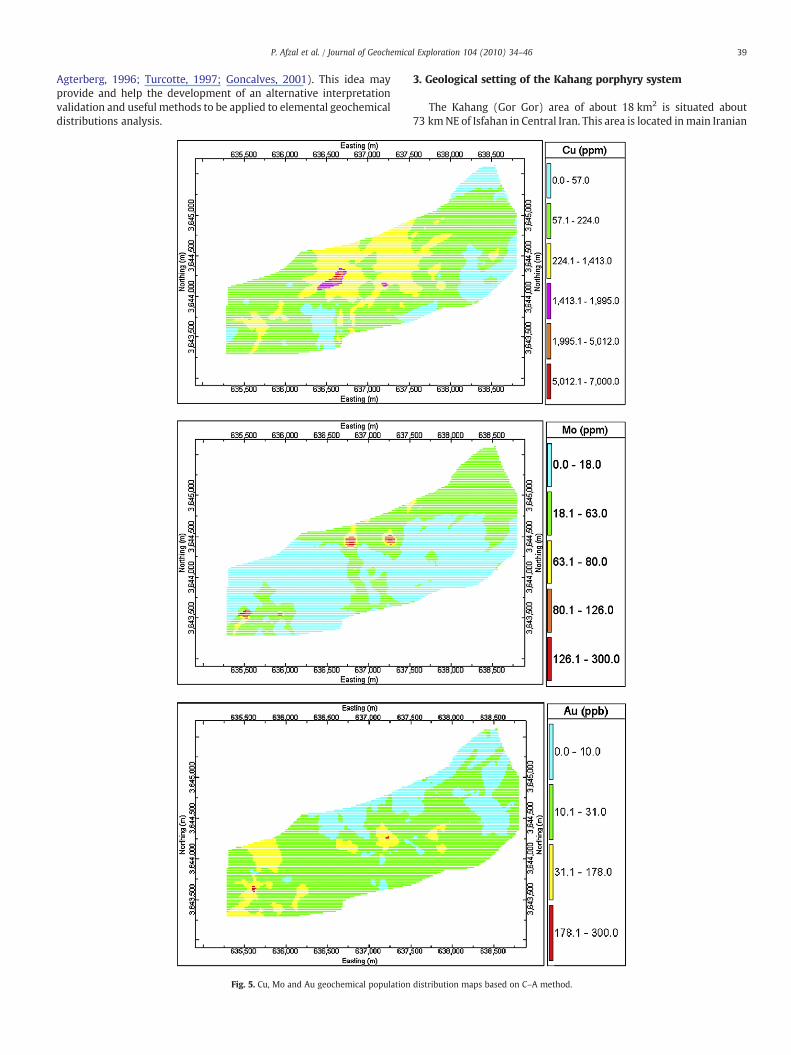
Fig. 5. Cu, Mo and Au geochemical population
3. Geological setting of the Kahang porphyry system
The Kahang (Gor Gor) area of about 18 km2 is situated about73 kmNE of Isfahan in Central Iran. This area is located inmain Iranian
distribution maps based on C–A method.
40 P. Afzal et al. / Journal of Geochemical Exploration 104 (2010) 34–46
Cenozoic magmatic belt named Urumieh-Dokhtar, which is one of thesubdivisions of Zagros orogenies (Alavi, 1994). This belt extends fromNW to SE Iran. The host all of the Iranian large porphyry copper
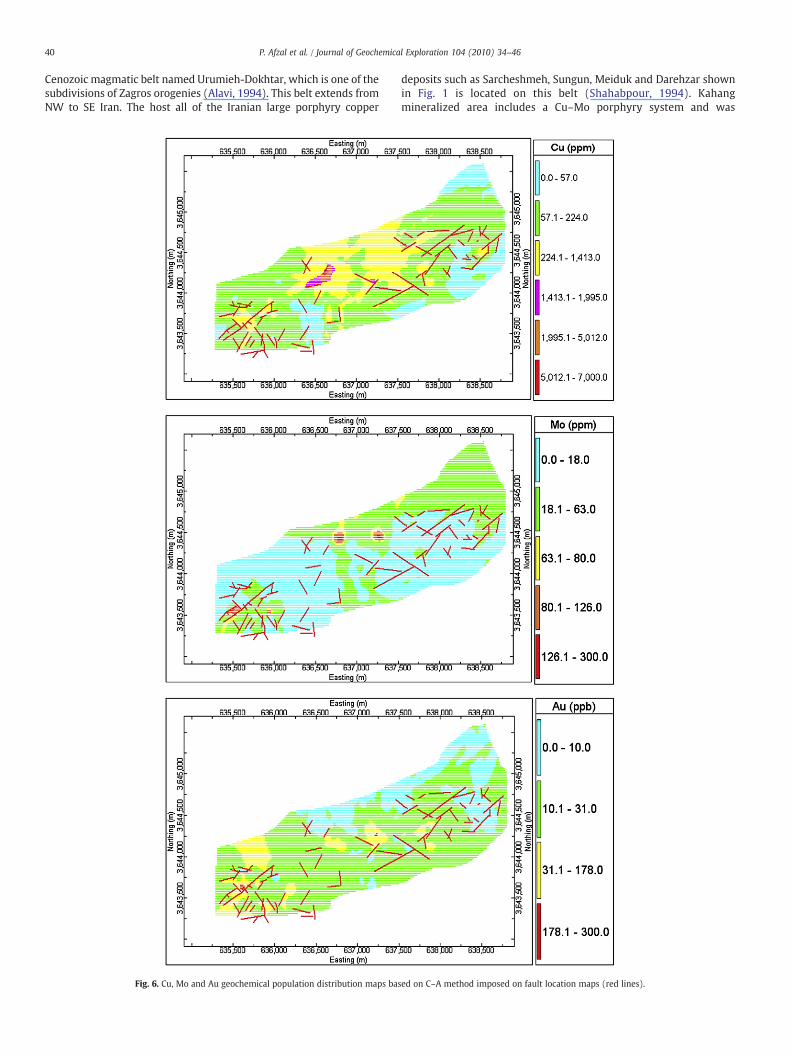
Fig. 6. Cu, Mo and Au geochemical population distribution maps bas
deposits such as Sarcheshmeh, Sungun, Meiduk and Darehzar shownin Fig. 1 is located on this belt (Shahabpour, 1994). Kahangmineralized area includes a Cu–Mo porphyry system and was
ed on C–A method imposed on fault location maps (red lines).
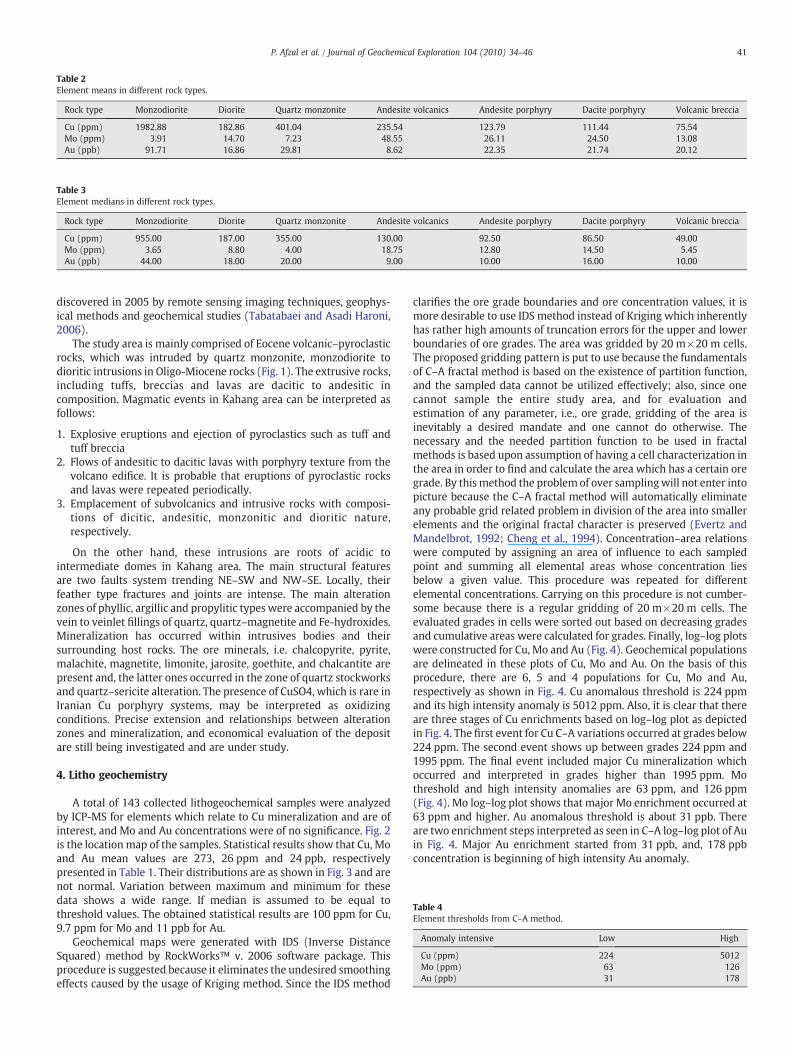
Table 2Element means in different rock types.
Rock type Monzodiorite Diorite Quartz monzonite Andesite volcanics Andesite porphyry Dacite porphyry Volcanic breccia
Cu (ppm) 1982.88 182.86 401.04 235.54 123.79 111.44 75.54Mo (ppm) 3.91 14.70 7.23 48.55 26.11 24.50 13.08Au (ppb) 91.71 16.86 29.81 8.62 22.35 21.74 20.12
Table 3Element medians in different rock types.
Rock type Monzodiorite Diorite Quartz monzonite Andesite volcanics Andesite porphyry Dacite porphyry Volcanic breccia
Cu (ppm) 955.00 187.00 355.00 130.00 92.50 86.50 49.00Mo (ppm) 3.65 8.80 4.00 18.75 12.80 14.50 5.45Au (ppb) 44.00 18.00 20.00 9.00 10.00 16.00 10.00
Table 4Element thresholds from C–A method.
Anomaly intensive Low High
Cu (ppm) 224 5012Mo (ppm) 63 126Au (ppb) 31 178
41P. Afzal et al. / Journal of Geochemical Exploration 104 (2010) 34–46
discovered in 2005 by remote sensing imaging techniques, geophys-ical methods and geochemical studies (Tabatabaei and Asadi Haroni,2006).
The study area is mainly comprised of Eocene volcanic–pyroclasticrocks, which was intruded by quartz monzonite, monzodiorite todioritic intrusions in Oligo-Miocene rocks (Fig. 1). The extrusive rocks,including tuffs, breccias and lavas are dacitic to andesitic incomposition. Magmatic events in Kahang area can be interpreted asfollows:
1. Explosive eruptions and ejection of pyroclastics such as tuff andtuff breccia
2. Flows of andesitic to dacitic lavas with porphyry texture from thevolcano edifice. It is probable that eruptions of pyroclastic rocksand lavas were repeated periodically.
3. Emplacement of subvolcanics and intrusive rocks with composi-tions of dicitic, andesitic, monzonitic and dioritic nature,respectively.
On the other hand, these intrusions are roots of acidic tointermediate domes in Kahang area. The main structural featuresare two faults system trending NE–SW and NW–SE. Locally, theirfeather type fractures and joints are intense. The main alterationzones of phyllic, argillic and propylitic types were accompanied by thevein to veinlet fillings of quartz, quartz–magnetite and Fe-hydroxides.Mineralization has occurred within intrusives bodies and theirsurrounding host rocks. The ore minerals, i.e. chalcopyrite, pyrite,malachite, magnetite, limonite, jarosite, goethite, and chalcantite arepresent and, the latter ones occurred in the zone of quartz stockworksand quartz–sericite alteration. The presence of CuSO4, which is rare inIranian Cu porphyry systems, may be interpreted as oxidizingconditions. Precise extension and relationships between alterationzones and mineralization, and economical evaluation of the depositare still being investigated and are under study.
4. Litho geochemistry
A total of 143 collected lithogeochemical samples were analyzedby ICP-MS for elements which relate to Cu mineralization and are ofinterest, and Mo and Au concentrations were of no significance. Fig. 2is the location map of the samples. Statistical results show that Cu, Moand Au mean values are 273, 26 ppm and 24 ppb, respectivelypresented in Table 1. Their distributions are as shown in Fig. 3 and arenot normal. Variation between maximum and minimum for thesedata shows a wide range. If median is assumed to be equal tothreshold values. The obtained statistical results are 100 ppm for Cu,9.7 ppm for Mo and 11 ppb for Au.
Geochemical maps were generated with IDS (Inverse DistanceSquared) method by RockWorks™ v. 2006 software package. Thisprocedure is suggested because it eliminates the undesired smoothingeffects caused by the usage of Kriging method. Since the IDS method
clarifies the ore grade boundaries and ore concentration values, it ismore desirable to use IDS method instead of Kriging which inherentlyhas rather high amounts of truncation errors for the upper and lowerboundaries of ore grades. The area was gridded by 20 m×20 m cells.The proposed gridding pattern is put to use because the fundamentalsof C–A fractal method is based on the existence of partition function,and the sampled data cannot be utilized effectively; also, since onecannot sample the entire study area, and for evaluation andestimation of any parameter, i.e., ore grade, gridding of the area isinevitably a desired mandate and one cannot do otherwise. Thenecessary and the needed partition function to be used in fractalmethods is based upon assumption of having a cell characterization inthe area in order to find and calculate the area which has a certain oregrade. By thismethod the problem of over samplingwill not enter intopicture because the C–A fractal method will automatically eliminateany probable grid related problem in division of the area into smallerelements and the original fractal character is preserved (Evertz andMandelbrot, 1992; Cheng et al., 1994). Concentration–area relationswere computed by assigning an area of influence to each sampledpoint and summing all elemental areas whose concentration liesbelow a given value. This procedure was repeated for differentelemental concentrations. Carrying on this procedure is not cumber-some because there is a regular gridding of 20 m×20 m cells. Theevaluated grades in cells were sorted out based on decreasing gradesand cumulative areas were calculated for grades. Finally, log–log plotswere constructed for Cu, Mo and Au (Fig. 4). Geochemical populationsare delineated in these plots of Cu, Mo and Au. On the basis of thisprocedure, there are 6, 5 and 4 populations for Cu, Mo and Au,respectively as shown in Fig. 4. Cu anomalous threshold is 224 ppmand its high intensity anomaly is 5012 ppm. Also, it is clear that thereare three stages of Cu enrichments based on log–log plot as depictedin Fig. 4. The first event for Cu C–A variations occurred at grades below224 ppm. The second event shows up between grades 224 ppm and1995 ppm. The final event included major Cu mineralization whichoccurred and interpreted in grades higher than 1995 ppm. Mothreshold and high intensity anomalies are 63 ppm, and 126 ppm(Fig. 4). Mo log–log plot shows that major Mo enrichment occurred at63 ppm and higher. Au anomalous threshold is about 31 ppb. Thereare two enrichment steps interpreted as seen in C–A log–log plot of Auin Fig. 4. Major Au enrichment started from 31 ppb, and, 178 ppbconcentration is beginning of high intensity Au anomaly.
42 P. Afzal et al. / Journal of Geochemical Exploration 104 (2010) 34–46
Each geochemical population in this study was assumed to havevarious kinds of distributions, and its various components, such asindividual chemical elements and their concentrations could be fittedinto a straight line on log–log plot. Obviously due to non-uniformbehavior of the elements, if plotted on log–log co-ordinates, the plotwill have different slopes and various straight-line segments whichconnects them at them an angle or with breaks on the plot. Breaksbetween the straight-line segments and the corresponding values ofCu, Mo and Au have been used as cut-offs to reclassify cell values inthe IDS interpolated maps and are presented in Fig. 5. Based on theseresults, elemental grade distribution maps were drawn as Fig. 5.Clearly most of Cu anomalies are located in central parts of the area,especially high intensity Cu anomalies. Few parts of these anomalieswere also situated in western and eastern parts of the studied area.Mo anomalies were situated in central and western parts and they aresmall. Locations of Au anomalies are in western and central parts ofthe area and the high intensive anomalies are very small located inwestern and central parts. Based on these maps, potential presence ofthese elements are located in central and western parts as shown inFig. 5. Also, several small Cu anomalies are interpreted in eastern partof the area as delineated in Fig. 5.
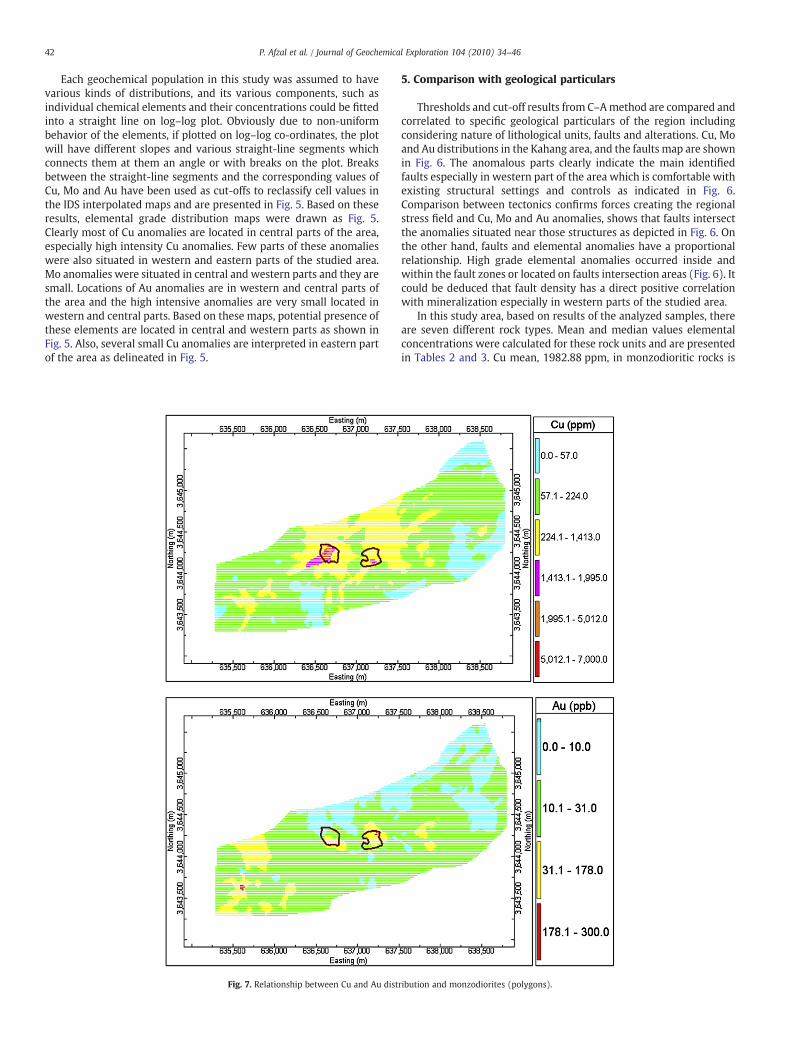
Fig. 7. Relationship between Cu and Au dist
5. Comparison with geological particulars
Thresholds and cut-off results from C–Amethod are compared andcorrelated to specific geological particulars of the region includingconsidering nature of lithological units, faults and alterations. Cu, Moand Au distributions in the Kahang area, and the faults map are shownin Fig. 6. The anomalous parts clearly indicate the main identifiedfaults especially in western part of the area which is comfortable withexisting structural settings and controls as indicated in Fig. 6.Comparison between tectonics confirms forces creating the regionalstress field and Cu, Mo and Au anomalies, shows that faults intersectthe anomalies situated near those structures as depicted in Fig. 6. Onthe other hand, faults and elemental anomalies have a proportionalrelationship. High grade elemental anomalies occurred inside andwithin the fault zones or located on faults intersection areas (Fig. 6). Itcould be deduced that fault density has a direct positive correlationwith mineralization especially in western parts of the studied area.
In this study area, based on results of the analyzed samples, thereare seven different rock types. Mean and median values elementalconcentrations were calculated for these rock units and are presentedin Tables 2 and 3. Cu mean, 1982.88 ppm, in monzodioritic rocks is
ribution and monzodiorites (polygons).
43P. Afzal et al. / Journal of Geochemical Exploration 104 (2010) 34–46
highest among all rock types as presented in Table 2. Mean Cuconcentration in monzodiorites, quartz monzonite and andesitic unitsis higher than its threshold values obtained from C–Amethod as givenin Table 2. Mo mean is lower than Mo threshold values calculated bythe C–A method, but Mo mean value in andesitic units is close tothreshold values (Table 2). The Au mean value is higher than itsthreshold obtained from C–A method at 31 ppb and is higher only inmonzodiorites to about 91.71 ppb. Also, the Au mean in quartzmonzonite is at 29.81 ppb, close to the threshold value of 31 ppb, aspresented in Table 2.
If one assumes that median is equal to threshold values obtainedfrom classical statistics the Cu, Mo and Au thresholds can be calculatedin different rock types. Cu median in monzodiorite of 955 ppm, andquartz monzonite of 355 ppm, is higher than Cu threshold from C–Amethod which is 224 ppm, but it is lower in other rock types as givenin Table 3. On the other hand, highest Cu enrichment exists inmonzodiorite and Mo median is lower than the threshold from C–Amethod at a value of 63 ppm in all rock types, but in andesitic units ishigher than the others as presented in Table 3. Aumedian is highest inmonzodiorite at 44 ppb, and higher than C–A threshold of 31 ppb inTable 3. These results show that monzodiorites are enriched in Cu andAu, but Mo enrichment exists in andesitic units. Also, theseparameters correspond with intrusive bodies' emplacement time in
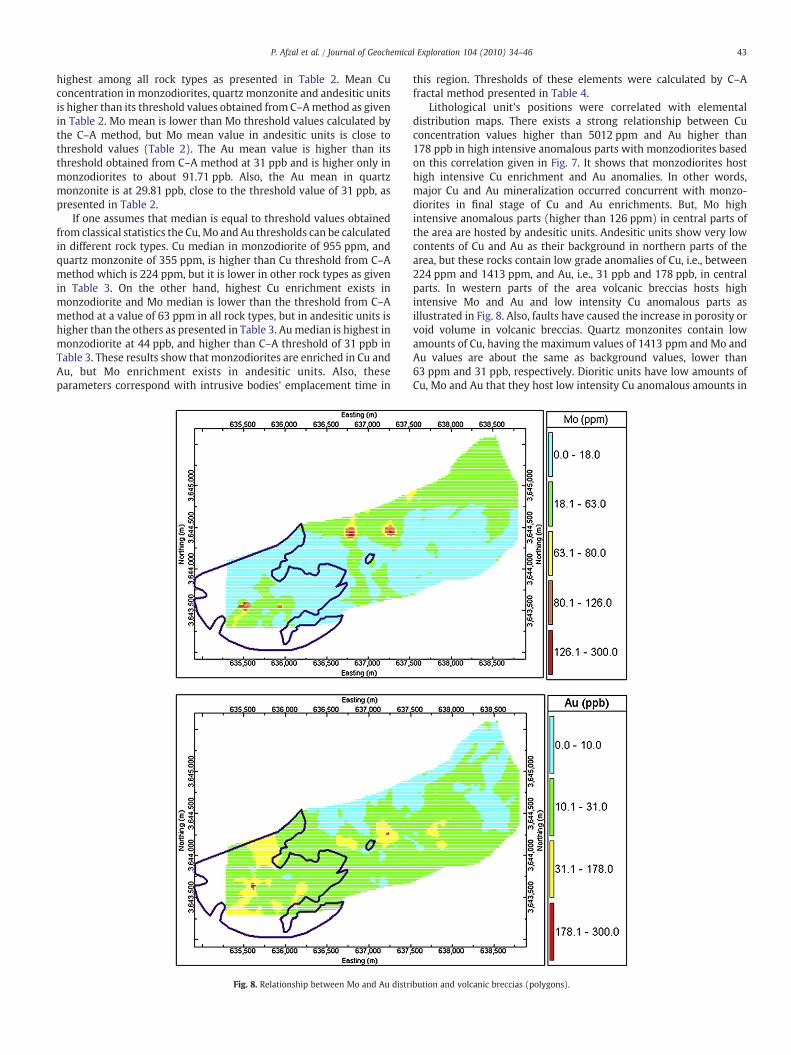
Fig. 8. Relationship between Mo and Au distr
this region. Thresholds of these elements were calculated by C–Afractal method presented in Table 4.
Lithological unit's positions were correlated with elementaldistribution maps. There exists a strong relationship between Cuconcentration values higher than 5012 ppm and Au higher than178 ppb in high intensive anomalous parts with monzodiorites basedon this correlation given in Fig. 7. It shows that monzodiorites hosthigh intensive Cu enrichment and Au anomalies. In other words,major Cu and Au mineralization occurred concurrent with monzo-diorites in final stage of Cu and Au enrichments. But, Mo highintensive anomalous parts (higher than 126 ppm) in central parts ofthe area are hosted by andesitic units. Andesitic units show very lowcontents of Cu and Au as their background in northern parts of thearea, but these rocks contain low grade anomalies of Cu, i.e., between224 ppm and 1413 ppm, and Au, i.e., 31 ppb and 178 ppb, in centralparts. In western parts of the area volcanic breccias hosts highintensive Mo and Au and low intensity Cu anomalous parts asillustrated in Fig. 8. Also, faults have caused the increase in porosity orvoid volume in volcanic breccias. Quartz monzonites contain lowamounts of Cu, having the maximum values of 1413 ppm and Mo andAu values are about the same as background values, lower than63 ppm and 31 ppb, respectively. Dioritic units have low amounts ofCu, Mo and Au that they host low intensity Cu anomalous amounts in
ibution and volcanic breccias (polygons).
44 P. Afzal et al. / Journal of Geochemical Exploration 104 (2010) 34–46
eastern part of the study area, lower than 1413 ppm concentration.Dacitic unit present in eastern part of the area is barren and does nothost these elements. Its elemental contents are equal to background,but in central and western part, dacitic units show low values of Cu,between 224 ppm and 1413 ppm, and, for Au: between 31 ppb and178 ppb. Results from C–A method are correlated with elements'median values in rock types. These concentrations show a goodrelationship with intrusions.
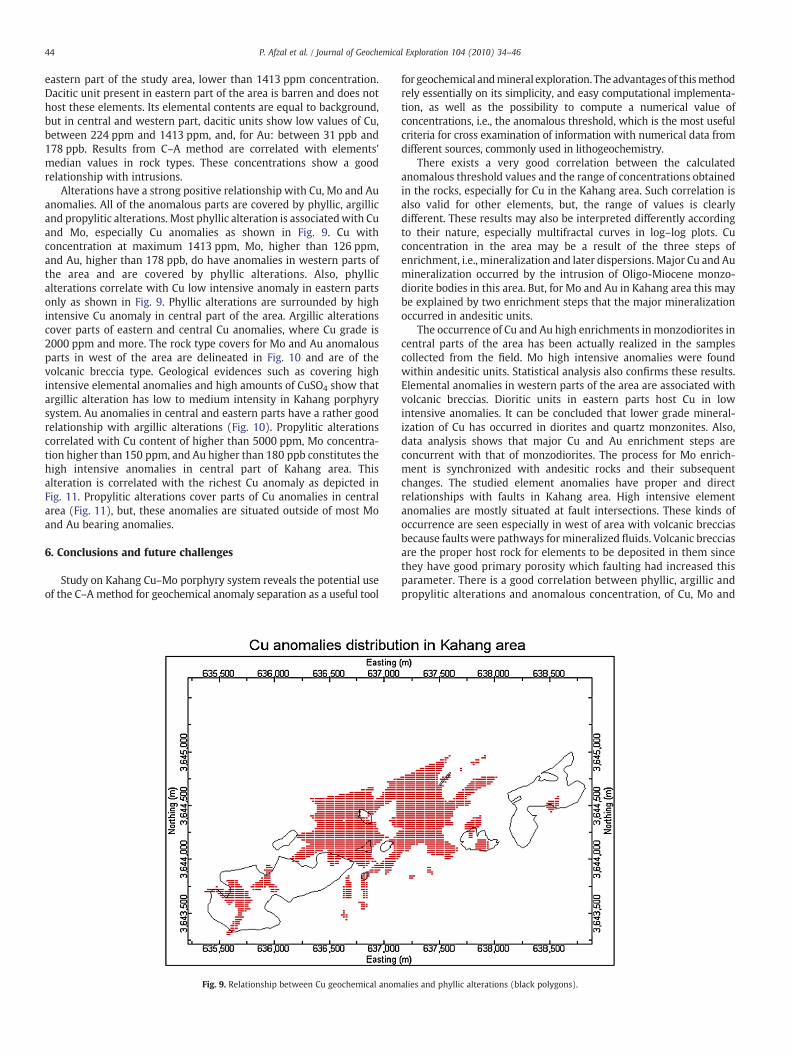
Alterations have a strong positive relationship with Cu, Mo and Auanomalies. All of the anomalous parts are covered by phyllic, argillicand propylitic alterations. Most phyllic alteration is associatedwith Cuand Mo, especially Cu anomalies as shown in Fig. 9. Cu withconcentration at maximum 1413 ppm, Mo, higher than 126 ppm,and Au, higher than 178 ppb, do have anomalies in western parts ofthe area and are covered by phyllic alterations. Also, phyllicalterations correlate with Cu low intensive anomaly in eastern partsonly as shown in Fig. 9. Phyllic alterations are surrounded by highintensive Cu anomaly in central part of the area. Argillic alterationscover parts of eastern and central Cu anomalies, where Cu grade is2000 ppm and more. The rock type covers for Mo and Au anomalousparts in west of the area are delineated in Fig. 10 and are of thevolcanic breccia type. Geological evidences such as covering highintensive elemental anomalies and high amounts of CuSO4 show thatargillic alteration has low to medium intensity in Kahang porphyrysystem. Au anomalies in central and eastern parts have a rather goodrelationship with argillic alterations (Fig. 10). Propylitic alterationscorrelated with Cu content of higher than 5000 ppm, Mo concentra-tion higher than 150 ppm, and Au higher than 180 ppb constitutes thehigh intensive anomalies in central part of Kahang area. Thisalteration is correlated with the richest Cu anomaly as depicted inFig. 11. Propylitic alterations cover parts of Cu anomalies in centralarea (Fig. 11), but, these anomalies are situated outside of most Moand Au bearing anomalies.
6. Conclusions and future challenges
Study on Kahang Cu–Mo porphyry system reveals the potential useof the C–A method for geochemical anomaly separation as a useful tool
Fig. 9. Relationship between Cu geochemical anom
for geochemical andmineral exploration. The advantages of thismethodrely essentially on its simplicity, and easy computational implementa-tion, as well as the possibility to compute a numerical value ofconcentrations, i.e., the anomalous threshold, which is the most usefulcriteria for cross examination of information with numerical data fromdifferent sources, commonly used in lithogeochemistry.
There exists a very good correlation between the calculatedanomalous threshold values and the range of concentrations obtainedin the rocks, especially for Cu in the Kahang area. Such correlation isalso valid for other elements, but, the range of values is clearlydifferent. These results may also be interpreted differently accordingto their nature, especially multifractal curves in log–log plots. Cuconcentration in the area may be a result of the three steps ofenrichment, i.e., mineralization and later dispersions. Major Cu and Aumineralization occurred by the intrusion of Oligo-Miocene monzo-diorite bodies in this area. But, for Mo and Au in Kahang area this maybe explained by two enrichment steps that the major mineralizationoccurred in andesitic units.
The occurrence of Cu and Au high enrichments in monzodiorites incentral parts of the area has been actually realized in the samplescollected from the field. Mo high intensive anomalies were foundwithin andesitic units. Statistical analysis also confirms these results.Elemental anomalies in western parts of the area are associated withvolcanic breccias. Dioritic units in eastern parts host Cu in lowintensive anomalies. It can be concluded that lower grade mineral-ization of Cu has occurred in diorites and quartz monzonites. Also,data analysis shows that major Cu and Au enrichment steps areconcurrent with that of monzodiorites. The process for Mo enrich-ment is synchronized with andesitic rocks and their subsequentchanges. The studied element anomalies have proper and directrelationships with faults in Kahang area. High intensive elementanomalies are mostly situated at fault intersections. These kinds ofoccurrence are seen especially in west of area with volcanic brecciasbecause faults were pathways for mineralized fluids. Volcanic brecciasare the proper host rock for elements to be deposited in them sincethey have good primary porosity which faulting had increased thisparameter. There is a good correlation between phyllic, argillic andpropylitic alterations and anomalous concentration, of Cu, Mo and
alies and phyllic alterations (black polygons).
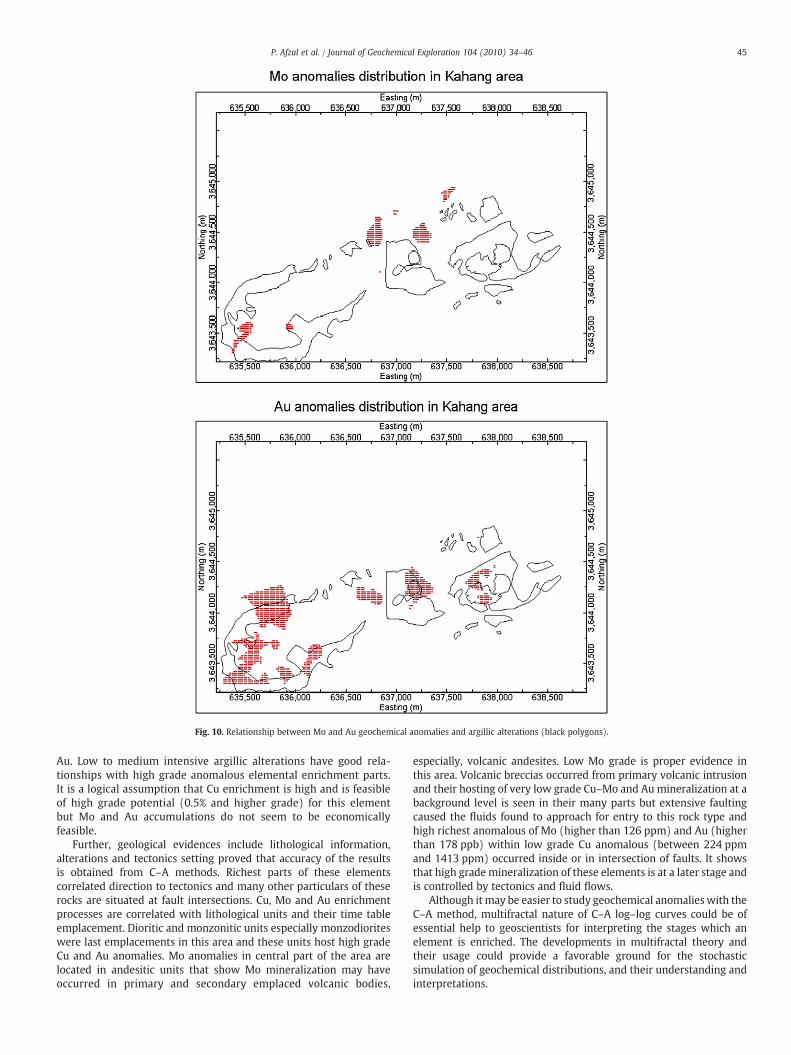
Fig. 10. Relationship between Mo and Au geochemical anomalies and argillic alterations (black polygons).
45P. Afzal et al. / Journal of Geochemical Exploration 104 (2010) 34–46
Au. Low to medium intensive argillic alterations have good rela-tionships with high grade anomalous elemental enrichment parts.It is a logical assumption that Cu enrichment is high and is feasibleof high grade potential (0.5% and higher grade) for this elementbut Mo and Au accumulations do not seem to be economicallyfeasible.
Further, geological evidences include lithological information,alterations and tectonics setting proved that accuracy of the resultsis obtained from C–A methods. Richest parts of these elementscorrelated direction to tectonics and many other particulars of theserocks are situated at fault intersections. Cu, Mo and Au enrichmentprocesses are correlated with lithological units and their time tableemplacement. Dioritic and monzonitic units especially monzodioriteswere last emplacements in this area and these units host high gradeCu and Au anomalies. Mo anomalies in central part of the area arelocated in andesitic units that show Mo mineralization may haveoccurred in primary and secondary emplaced volcanic bodies,
especially, volcanic andesites. Low Mo grade is proper evidence inthis area. Volcanic breccias occurred from primary volcanic intrusionand their hosting of very low grade Cu–Mo and Au mineralization at abackground level is seen in their many parts but extensive faultingcaused the fluids found to approach for entry to this rock type andhigh richest anomalous of Mo (higher than 126 ppm) and Au (higherthan 178 ppb) within low grade Cu anomalous (between 224 ppmand 1413 ppm) occurred inside or in intersection of faults. It showsthat high grade mineralization of these elements is at a later stage andis controlled by tectonics and fluid flows.
Although it may be easier to study geochemical anomalies with theC–A method, multifractal nature of C–A log–log curves could be ofessential help to geoscientists for interpreting the stages which anelement is enriched. The developments in multifractal theory andtheir usage could provide a favorable ground for the stochasticsimulation of geochemical distributions, and their understanding andinterpretations.
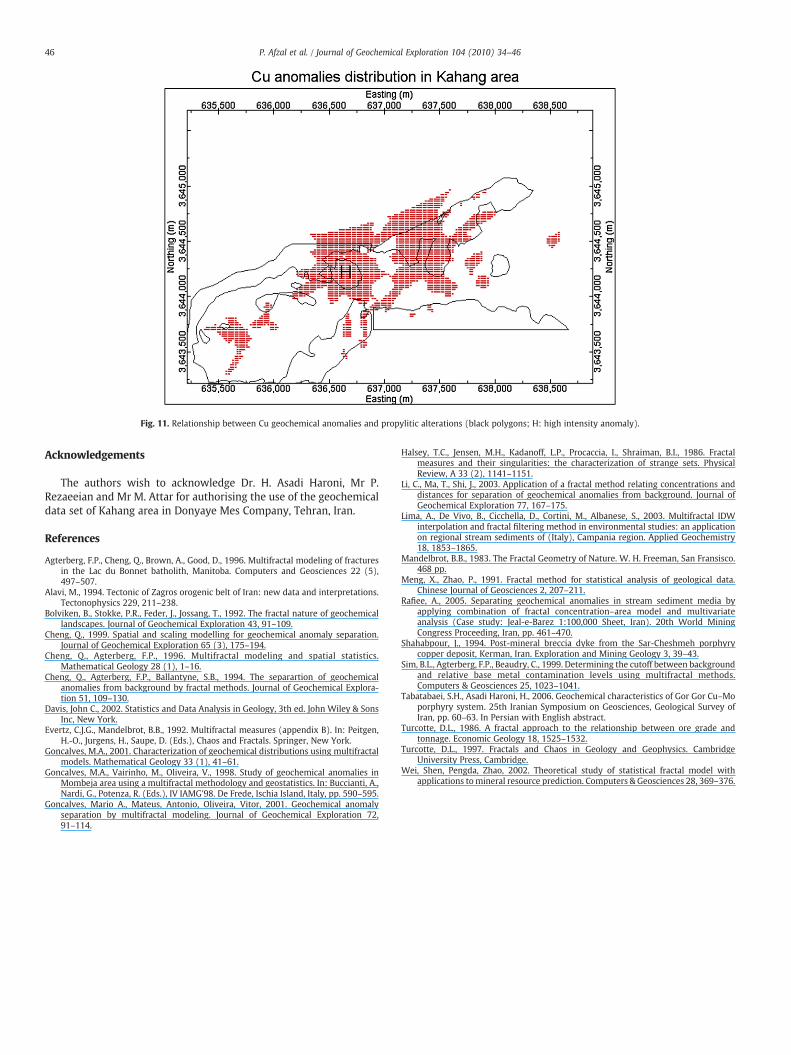
Fig. 11. Relationship between Cu geochemical anomalies and propylitic alterations (black polygons; H: high intensity anomaly).
46 P. Afzal et al. / Journal of Geochemical Exploration 104 (2010) 34–46
Acknowledgements
The authors wish to acknowledge Dr. H. Asadi Haroni, Mr P.Rezaeeian and Mr M. Attar for authorising the use of the geochemicaldata set of Kahang area in Donyaye Mes Company, Tehran, Iran.
References
Agterberg, F.P., Cheng, Q., Brown, A., Good, D., 1996. Multifractal modeling of fracturesin the Lac du Bonnet batholith, Manitoba. Computers and Geosciences 22 (5),497–507.
Alavi, M., 1994. Tectonic of Zagros orogenic belt of Iran: new data and interpretations.Tectonophysics 229, 211–238.
Bolviken, B., Stokke, P.R., Feder, J., Jossang, T., 1992. The fractal nature of geochemicallandscapes. Journal of Geochemical Exploration 43, 91–109.
Cheng, Q., 1999. Spatial and scaling modelling for geochemical anomaly separation.Journal of Geochemical Exploration 65 (3), 175–194.
Cheng, Q., Agterberg, F.P., 1996. Multifractal modeling and spatial statistics.Mathematical Geology 28 (1), 1–16.
Cheng, Q., Agterberg, F.P., Ballantyne, S.B., 1994. The separartion of geochemicalanomalies from background by fractal methods. Journal of Geochemical Explora-tion 51, 109–130.
Davis, John C., 2002. Statistics and Data Analysis in Geology, 3th ed. John Wiley & SonsInc, New York.
Evertz, C.J.G., Mandelbrot, B.B., 1992. Multifractal measures (appendix B). In: Peitgen,H.-O., Jurgens, H., Saupe, D. (Eds.), Chaos and Fractals. Springer, New York.
Goncalves, M.A., 2001. Characterization of geochemical distributions using multifractalmodels. Mathematical Geology 33 (1), 41–61.
Goncalves, M.A., Vairinho, M., Oliveira, V., 1998. Study of geochemical anomalies inMombeja area using a multifractal methodology and geostatistics. In: Buccianti, A.,Nardi, G., Potenza, R. (Eds.), IV IAMG'98. De Frede, Ischia Island, Italy, pp. 590–595.
Goncalves, Mario A., Mateus, Antonio, Oliveira, Vitor, 2001. Geochemical anomalyseparation by multifractal modeling. Journal of Geochemical Exploration 72,91–114.
Halsey, T.C., Jensen, M.H., Kadanoff, L.P., Procaccia, I., Shraiman, B.I., 1986. Fractalmeasures and their singularities: the characterization of strange sets. PhysicalReview, A 33 (2), 1141–1151.
Li, C., Ma, T., Shi, J., 2003. Application of a fractal method relating concentrations anddistances for separation of geochemical anomalies from background. Journal ofGeochemical Exploration 77, 167–175.
Lima, A., De Vivo, B., Cicchella, D., Cortini, M., Albanese, S., 2003. Multifractal IDWinterpolation and fractal filtering method in environmental studies: an applicationon regional stream sediments of (Italy), Campania region. Applied Geochemistry18, 1853–1865.
Mandelbrot, B.B., 1983. The Fractal Geometry of Nature. W. H. Freeman, San Fransisco.468 pp.
Meng, X., Zhao, P., 1991. Fractal method for statistical analysis of geological data.Chinese Journal of Geosciences 2, 207–211.
Rafiee, A., 2005. Separating geochemical anomalies in stream sediment media byapplying combination of fractal concentration–area model and multivariateanalysis (Case study: Jeal-e-Barez 1:100,000 Sheet, Iran). 20th World MiningCongress Proceeding, Iran, pp. 461–470.
Shahabpour, J., 1994. Post-mineral breccia dyke from the Sar-Cheshmeh porphyrycopper deposit, Kerman, Iran. Exploration and Mining Geology 3, 39–43.
Sim, B.L., Agterberg, F.P., Beaudry, C., 1999. Determining the cutoff between backgroundand relative base metal contamination levels using multifractal methods.Computers & Geosciences 25, 1023–1041.
Tabatabaei, S.H., Asadi Haroni, H., 2006. Geochemical characteristics of Gor Gor Cu–Moporphyry system. 25th Iranian Symposium on Geosciences, Geological Survey ofIran, pp. 60–63. In Persian with English abstract.
Turcotte, D.L., 1986. A fractal approach to the relationship between ore grade andtonnage. Economic Geology 18, 1525–1532.
Turcotte, D.L., 1997. Fractals and Chaos in Geology and Geophysics. CambridgeUniversity Press, Cambridge.
Wei, Shen, Pengda, Zhao, 2002. Theoretical study of statistical fractal model withapplications tomineral resource prediction. Computers & Geosciences 28, 369–376.
Related Documents