INTERNATIONAL TRADE & INVESTMENT FACILITATION: EXTRACTING THE V ALUE PROPOSITION FOR RENEWABLE ENERGY Genrikh Salata

Welcome message from author
This document is posted to help you gain knowledge. Please leave a comment to let me know what you think about it! Share it to your friends and learn new things together.
Transcript
INTERNATIONAL TRADE &
INVESTMENT FACILITATION:
EXTRACTING THE VALUE PROPOSITION
FOR RENEWABLE ENERGY
Genrikh Salata
OUTLINE
► The ACT Government’s objectives set in the Business Development Strategy
► The role of Innovate Canberra and Invest Canberra (trade and investment
facilitation) in achieving these goals
► Canberra’s value proposition to external stakeholders
► Value proposition specific to the renewable energy sector
BUSINESS DEVELOPMENT
STRATEGY 2.0
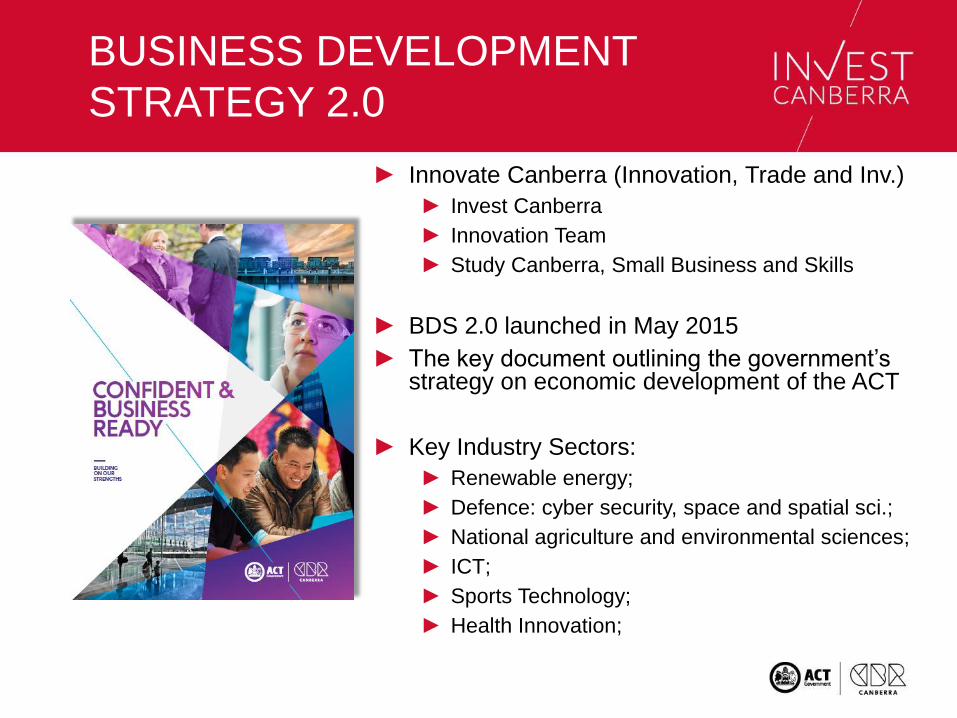
► Innovate Canberra (Innovation, Trade and Inv.)
► Invest Canberra
► Innovation Team
► Study Canberra, Small Business and Skills
► BDS 2.0 launched in May 2015
► The key document outlining the government’s strategy on economic development of the ACT
► Key Industry Sectors:
► Renewable energy;
► Defence: cyber security, space and spatial sci.;
► National agriculture and environmental sciences;
► ICT;
► Sports Technology;
► Health Innovation;
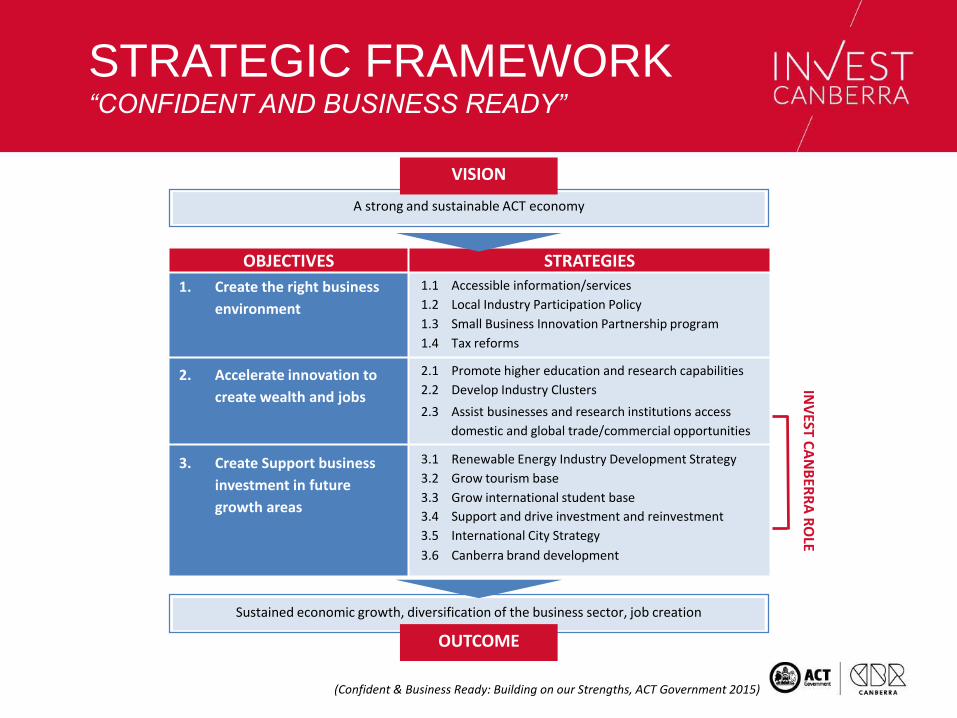
STRATEGIC FRAMEWORK “CONFIDENT AND BUSINESS READY”
OBJECTIVES STRATEGIES
Sustained economic growth, diversification of the business sector, job creation
OUTCOME
A strong and sustainable ACT economy
(Confident & Business Ready: Building on our Strengths, ACT Government 2015)
1.1 Accessible information/services
1.2 Local Industry Participation Policy
1.3 Small Business Innovation Partnership program
1.4 Tax reforms
2.1 Promote higher education and research capabilities
2.2 Develop Industry Clusters
3.1 Renewable Energy Industry Development Strategy
3.2 Grow tourism base
3.3 Grow international student base
3.6 Canberra brand development
VISION
1. Create the right business
environment
2. Accelerate innovation to
create wealth and jobs
3. Create Support business
investment in future
growth areas
INV
EST CA
NB
ERR
A R
OLE
2.3 Assist businesses and research institutions access
domestic and global trade/commercial opportunities
3.4 Support and drive investment and reinvestment
3.5 International City Strategy
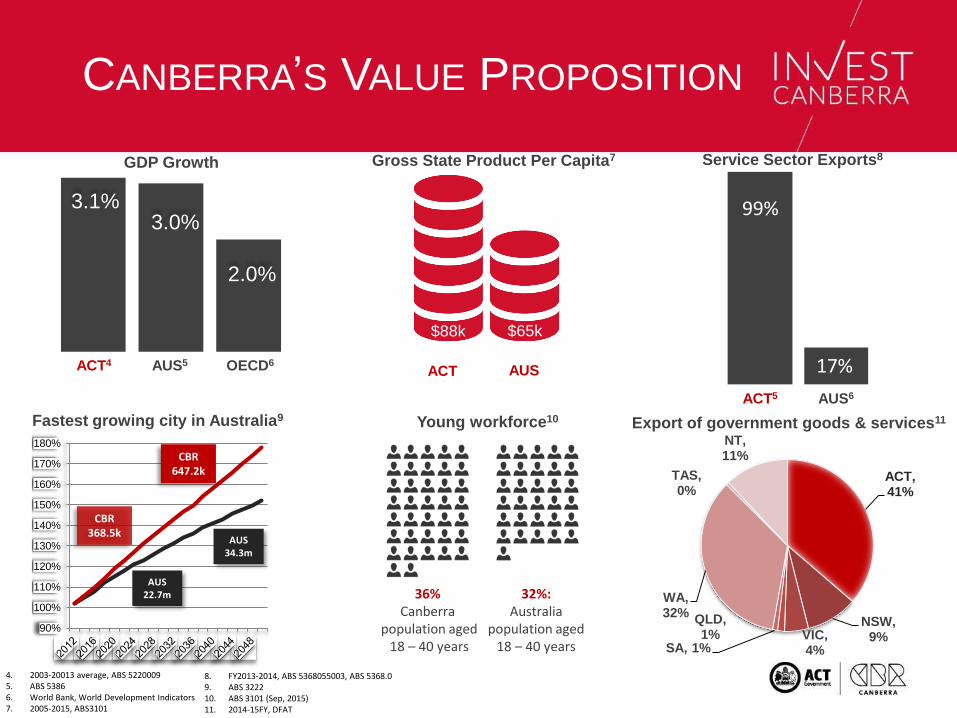
CANBERRA’S VALUE PROPOSITION
3.1%3.0%
2.0%
ACT4 AUS5 OECD6ACT
$88k $65k
AUS
4. 2003-20013 average, ABS 52200095. ABS 53866. World Bank, World Development Indicators7. 2005-2015, ABS3101
Gross State Product Per Capita7GDP Growth
36% Canberra
population aged18 – 40 years
32%:Australia
population aged18 – 40 years
Young workforce10Fastest growing city in Australia9
90%
100%
110%
120%
130%
140%
150%
160%
170%
180%
CBR 368.5k
CBR647.2k
AUS 22.7m
AUS 34.3m
Service Sector Exports8
99%
17%
ACT5 AUS6
8. FY2013-2014, ABS 5368055003, ABS 5368.09. ABS 3222 10. ABS 3101 (Sep, 2015)11. 2014-15FY, DFAT
Export of government goods & services11
ACT, 41%
NSW, 9%VIC,
4%
QLD, 1%
SA, 1%
WA, 32%
TAS, 0%
NT, 11%
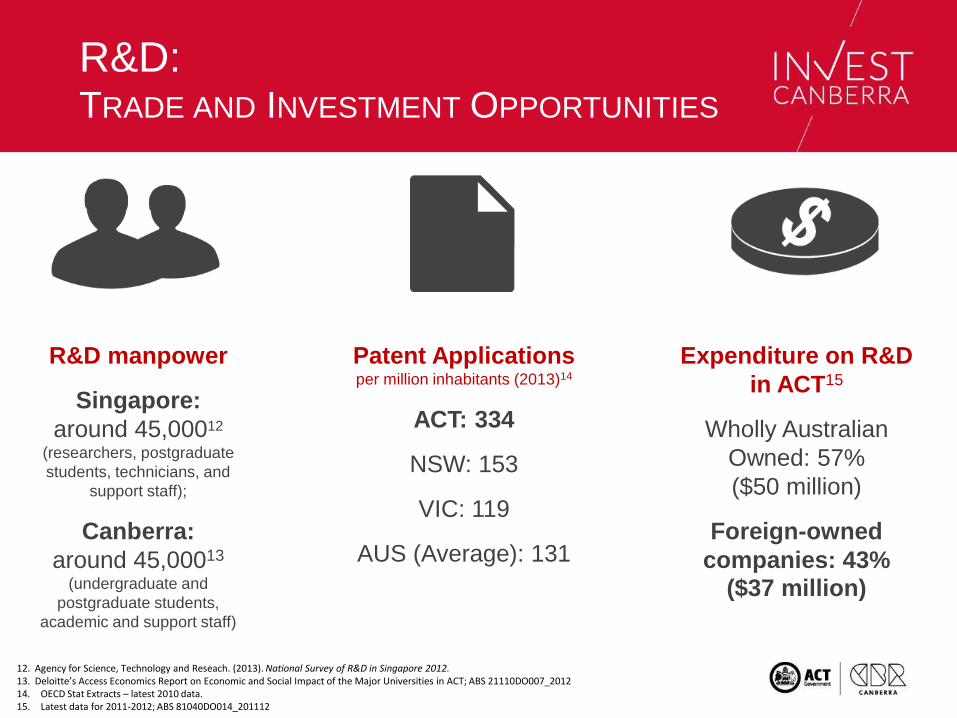
R&D:TRADE AND INVESTMENT OPPORTUNITIES
R&D manpower
Singapore:
around 45,00012
(researchers, postgraduate
students, technicians, and
support staff);
Canberra:
around 45,00013
(undergraduate and
postgraduate students,
academic and support staff)
Patent Applicationsper million inhabitants (2013)14
ACT: 334
NSW: 153
VIC: 119
AUS (Average): 131
Expenditure on R&D
in ACT15
Wholly Australian
Owned: 57%
($50 million)
Foreign-owned
companies: 43%
($37 million)
12. Agency for Science, Technology and Reseach. (2013). National Survey of R&D in Singapore 2012.13. Deloitte’s Access Economics Report on Economic and Social Impact of the Major Universities in ACT; ABS 21110DO007_201214. OECD Stat Extracts – latest 2010 data. 15. Latest data for 2011-2012; ABS 81040DO014_201112
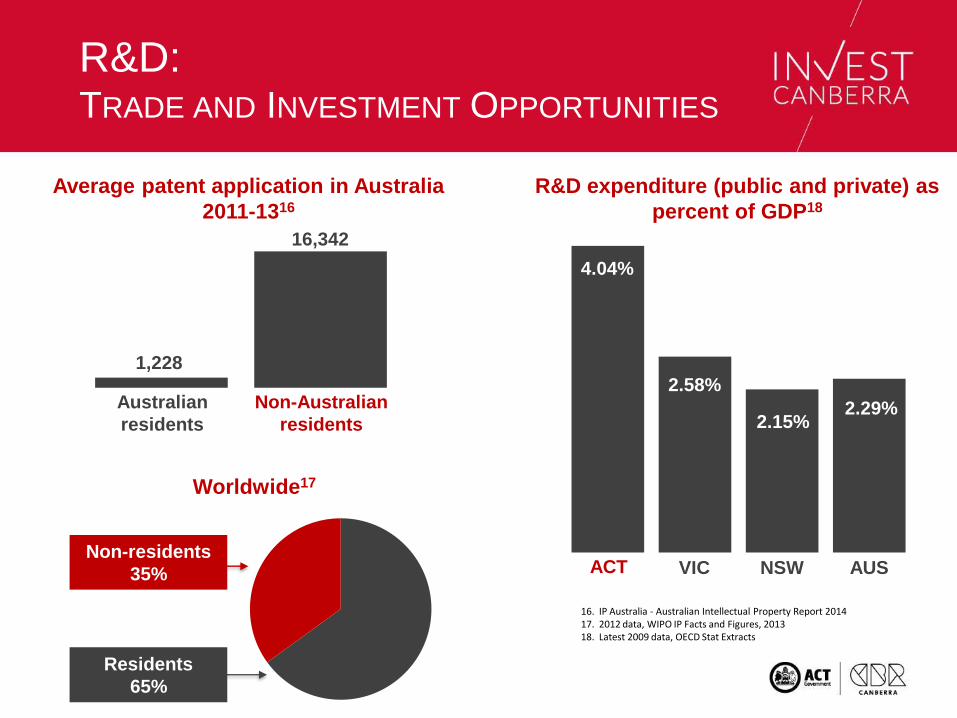
Average patent application in Australia
2011-1316
Non-Australian
residents
Australian
residents
1,228
16,342
Worldwide17
Non-residents
35%
Residents
65%
16. IP Australia - Australian Intellectual Property Report 201417. 2012 data, WIPO IP Facts and Figures, 201318. Latest 2009 data, OECD Stat Extracts
R&D expenditure (public and private) as
percent of GDP18
4.04%
2.58%
2.15%2.29%
ACT VIC NSW AUS
R&D:TRADE AND INVESTMENT OPPORTUNITIES
RENEWABLE ENERGY:TRADE AND INVESTMENT OPPORTUNITIES
100% Renewable
Energy by 2020
200MW Next Gen
Renewable
Auction
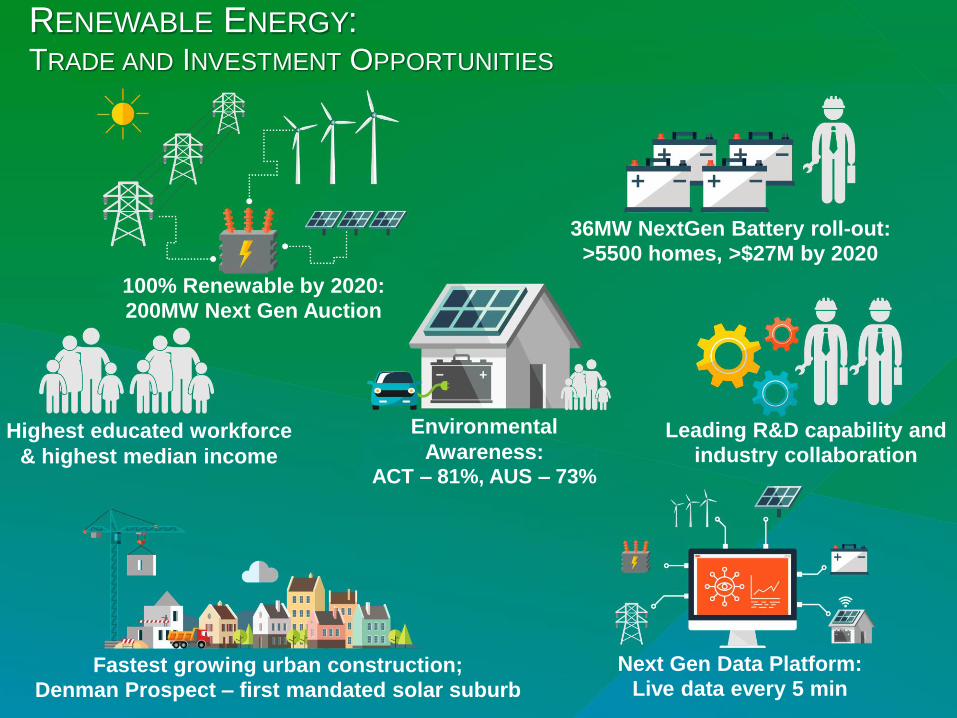
RENEWABLE ENERGY: TRADE AND INVESTMENT OPPORTUNITIES
100% Renewable by 2020:
200MW Next Gen Auction
36MW NextGen Battery roll-out:
>5500 homes, >$27M by 2020
Fastest growing urban construction;
Denman Prospect – first mandated solar suburb
Next Gen Data Platform:
Live data every 5 min
Leading R&D capability and
industry collaborationHighest educated workforce
& highest median income
Environmental
Awareness: ACT – 81%, AUS – 73%
Related Documents