LETTERS Genotype, haplotype and copy-number variation in worldwide human populations Mattias Jakobsson 1,2 *, Sonja W. Scholz 4,5 *, Paul Scheet 1,3 *, J. Raphael Gibbs 4,5 , Jenna M. VanLiere 1 , Hon-Chung Fung 4,6 , Zachary A. Szpiech 1 , James H. Degnan 1,2 , Kai Wang 7 , Rita Guerreiro 4,8 , Jose M. Bras 4,8 , Jennifer C. Schymick 4,9 , Dena G. Hernandez 4 , Bryan J. Traynor 4,10 , Javier Simon-Sanchez 4,11 , Mar Matarin 4 , Angela Britton 4 , Joyce van de Leemput 4,5 , Ian Rafferty 4 , Maja Bucan 7 , Howard M. Cann 12 , John A. Hardy 5 , Noah A. Rosenberg 1,2,3 & Andrew B. Singleton 4,13 Genome-wide patterns of variation across individuals provide a powerful source of data for uncovering the history of migration, range expansion, and adaptation of the human species. However, high-resolution surveys of variation in genotype, haplotype and copy number have generally focused on a small number of popu- lation groups 1–3 . Here we report the analysis of high-quality geno- types at 525,910 single-nucleotide polymorphisms (SNPs) and 396 copy-number-variable loci in a worldwide sample of 29 popula- tions. Analysis of SNP genotypes yields strongly supported fine- scale inferences about population structure. Increasing linkage disequilibrium is observed with increasing geographic distance from Africa, as expected under a serial founder effect for the out-of-Africa spread of human populations. New approaches for haplotype analysis produce inferences about population structure that complement results based on unphased SNPs. Despite a dif- ference from SNPs in the frequency spectrum of the copy-number variants (CNVs) detected—including a comparatively large number of CNVs in previously unexamined populations from Oceania and the Americas—the global distribution of CNVs lar- gely accords with population structure analyses for SNP data sets of similar size. Our results produce new inferences about inter-population variation, support the utility of CNVs in human population-genetic research, and serve as a genomic resource for human-genetic studies in diverse worldwide populations. The Human Genome Diversity Project (HGDP) was initiated for the purpose of assessing worldwide genetic diversity, providing cell lines maintained at the Centre d’E ´ tude du Polymorphisme Humain (CEPH) for use in population-genetic studies 4 . We genotyped a geo- graphically broad subset of 485 individuals from the HGDP–CEPH panel, with complete inclusion of HGDP–CEPH Africans (Supple- mentary Fig. 1). After correction for sample size differences across geographic regions 5 , 81.17% of SNP alleles were observed in all five of the main regions (Fig. 1a). The next most frequently observed geo- graphic distributions represented alleles found everywhere except Oceania (3.80%), everywhere except the Americas (3.01%), and everywhere except Africa (2.20%). Regionally private alleles were uncommon: 0.91% for Africa, 0.75% for Eurasia (Europe, Central/ South Asia and the Middle East, including North Africa), and near zero for other regions. Genomic analysis of population structure produced higher- resolution inferences than have previously been obtained. In a neigh- bour-joining population tree based on allele-sharing distance, with one exception, all internal branches were supported by all 1,000 boot- strap replicates across loci (Fig. 1b); nine replicates grouped the Adygei population with Russians and Basques. The tree supports the clustering of each of the main geographic regions and contains a separation of African hunter-gatherers (San, Mbuti and Biaka) from other Africans. Bayesian cluster analysis 6 was largely concordant with previous analyses of microsatellite and short insertion–deletion polymor- phisms 7–9 . Analysis with six clusters revealed groupings correspond- ing to five geographic subdivisions separated by major barriers, with a cline longitudinally across Asia and with a sixth cluster centred on the Kalash population of Pakistan (Fig. 1c). Within geographic regions, the cluster analysis subdivided groupings that were observed previously with fewer markers 9 (Fig. 1c and Supplementary Fig. 2). Multidimensional scaling (MDS) separated the populations of different geographic regions (Fig. 1d), including Europe, Central/ South Asia and the Middle East, which clustered together in the global bayesian analysis. Within regions, MDS split the individuals of distinct populations into distinct clusters (Supplementary Fig. 3), even in some cases for which bayesian analysis produced little sepa- ration between populations. The possibility of placing the MDS graph in approximate geographical orientation, with latitude and longitude representing the vertical and horizontal axes, suggests that geographic distance is a primary determinant of human genetic dif- ferentiation 10,11 . This view is supported by a linear increase in genetic distance with geographic distance from East Africa (Fig. 2a). Linkage disequilibrium (LD), as obtained with the homozygosity- based HR 2 measure 12 , declined as a function of physical distance, with the highest values occurring in the Americas, followed by Oceania, East Asia, Eurasia and Africa (Fig. 2b). Only two populations deviated from this pattern—Maya, a potentially admixed group, and Kalash, a population isolate. Although reduced LD has consistently been *These authors contributed equally to this work. 1 Center for Computational Medicine and Biology, 2 Department of Human Genetics, 3 Department of Biostatistics, University of Michigan, Ann Arbor, Michigan 48109, USA. 4 Laboratory of Neurogenetics, National Institute on Aging, National Institutes of Health, Bethesda, Maryland 20892, USA. 5 Department of Molecular Neuroscience and Reta Lila Weston Institute of Neurological Studies, Institute of Neurology, University College London, Queen Square, London WC1N 3BG, UK. 6 Department of Neurology, Chang Gung Memorial Hospital and College of Medicine, Chang Gung University, Taipei 10591, Taiwan. 7 Department of Genetics, University of Pennsylvania, Philadelphia, Pennsylvania 19104, USA. 8 Center for Neurosciences and Cell Biology, Faculty of Medicine, University of Coimbra, 3004-504 Coimbra, Portugal. 9 University of Oxford, Department of Clinical Neurology, John Radcliffe Hospital, Oxford OX3 9DU, UK. 10 Neurogenetics Branch, National Institute of Neurological Disorders and Stroke, National Institutes of Health, Bethesda, Maryland 20892, USA. 11 Unidad de Gene´tica Molecular, Departamento de Geno ´mica y Proteo ´mica, Instituto de Biomedicina de Valencia-CSIC, 46010, Valencia, Spain. 12 Fondation Jean Dausset – Centre d’E ´ tude du Polymorphisme Humain (CEPH), 27 rue Juliette Dodu, 75010 Paris, France. 13 Center for Public Health Genomics, University of Virginia, Charlottesville, Virginia 22908, USA. Vol 451 | 21 February 2008 | doi:10.1038/nature06742 998 Nature Publishing Group ©2008

Welcome message from author
This document is posted to help you gain knowledge. Please leave a comment to let me know what you think about it! Share it to your friends and learn new things together.
Transcript
LETTERS
Genotype, haplotype and copy-number variation inworldwide human populationsMattias Jakobsson1,2*, Sonja W. Scholz4,5*, Paul Scheet1,3*, J. Raphael Gibbs4,5, Jenna M. VanLiere1,Hon-Chung Fung4,6, Zachary A. Szpiech1, James H. Degnan1,2, Kai Wang7, Rita Guerreiro4,8, Jose M. Bras4,8,Jennifer C. Schymick4,9, Dena G. Hernandez4, Bryan J. Traynor4,10, Javier Simon-Sanchez4,11, Mar Matarin4,Angela Britton4, Joyce van de Leemput4,5, Ian Rafferty4, Maja Bucan7, Howard M. Cann12, John A. Hardy5,Noah A. Rosenberg1,2,3 & Andrew B. Singleton4,13
Genome-wide patterns of variation across individuals provide apowerful source of data for uncovering the history of migration,range expansion, and adaptation of the human species. However,high-resolution surveys of variation in genotype, haplotype andcopy number have generally focused on a small number of popu-lation groups1–3. Here we report the analysis of high-quality geno-types at 525,910 single-nucleotide polymorphisms (SNPs) and 396copy-number-variable loci in a worldwide sample of 29 popula-tions. Analysis of SNP genotypes yields strongly supported fine-scale inferences about population structure. Increasing linkagedisequilibrium is observed with increasing geographic distancefrom Africa, as expected under a serial founder effect for theout-of-Africa spread of human populations. New approaches forhaplotype analysis produce inferences about population structurethat complement results based on unphased SNPs. Despite a dif-ference from SNPs in the frequency spectrum of the copy-numbervariants (CNVs) detected—including a comparatively largenumber of CNVs in previously unexamined populations fromOceania and the Americas—the global distribution of CNVs lar-gely accords with population structure analyses for SNP datasets of similar size. Our results produce new inferences aboutinter-population variation, support the utility of CNVs in humanpopulation-genetic research, and serve as a genomic resource forhuman-genetic studies in diverse worldwide populations.
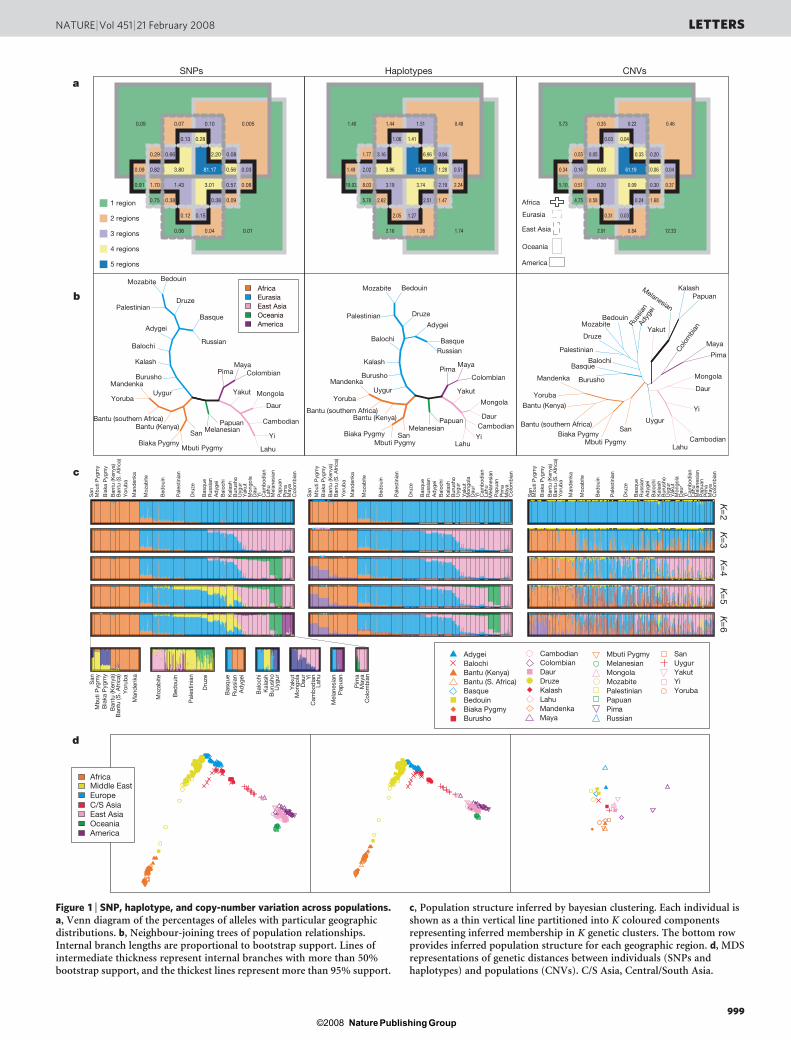
The Human Genome Diversity Project (HGDP) was initiated forthe purpose of assessing worldwide genetic diversity, providing celllines maintained at the Centre d’Etude du Polymorphisme Humain(CEPH) for use in population-genetic studies4. We genotyped a geo-graphically broad subset of 485 individuals from the HGDP–CEPHpanel, with complete inclusion of HGDP–CEPH Africans (Supple-mentary Fig. 1). After correction for sample size differences acrossgeographic regions5, 81.17% of SNP alleles were observed in all five ofthe main regions (Fig. 1a). The next most frequently observed geo-graphic distributions represented alleles found everywhere exceptOceania (3.80%), everywhere except the Americas (3.01%), andeverywhere except Africa (2.20%). Regionally private alleles wereuncommon: 0.91% for Africa, 0.75% for Eurasia (Europe, Central/
South Asia and the Middle East, including North Africa), and nearzero for other regions.
Genomic analysis of population structure produced higher-resolution inferences than have previously been obtained. In a neigh-bour-joining population tree based on allele-sharing distance, withone exception, all internal branches were supported by all 1,000 boot-strap replicates across loci (Fig. 1b); nine replicates grouped theAdygei population with Russians and Basques. The tree supportsthe clustering of each of the main geographic regions and containsa separation of African hunter-gatherers (San, Mbuti and Biaka)from other Africans.
Bayesian cluster analysis6 was largely concordant with previousanalyses of microsatellite and short insertion–deletion polymor-phisms7–9. Analysis with six clusters revealed groupings correspond-ing to five geographic subdivisions separated by major barriers, witha cline longitudinally across Asia and with a sixth cluster centred onthe Kalash population of Pakistan (Fig. 1c). Within geographicregions, the cluster analysis subdivided groupings that were observedpreviously with fewer markers9 (Fig. 1c and Supplementary Fig. 2).
Multidimensional scaling (MDS) separated the populations ofdifferent geographic regions (Fig. 1d), including Europe, Central/South Asia and the Middle East, which clustered together in theglobal bayesian analysis. Within regions, MDS split the individualsof distinct populations into distinct clusters (Supplementary Fig. 3),even in some cases for which bayesian analysis produced little sepa-ration between populations. The possibility of placing the MDSgraph in approximate geographical orientation, with latitude andlongitude representing the vertical and horizontal axes, suggests thatgeographic distance is a primary determinant of human genetic dif-ferentiation10,11. This view is supported by a linear increase in geneticdistance with geographic distance from East Africa (Fig. 2a).
Linkage disequilibrium (LD), as obtained with the homozygosity-based HR2 measure12, declined as a function of physical distance, withthe highest values occurring in the Americas, followed by Oceania,East Asia, Eurasia and Africa (Fig. 2b). Only two populations deviatedfrom this pattern—Maya, a potentially admixed group, and Kalash,a population isolate. Although reduced LD has consistently been
*These authors contributed equally to this work.
1Center for Computational Medicine and Biology, 2Department of Human Genetics, 3Department of Biostatistics, University of Michigan, Ann Arbor, Michigan 48109, USA.4Laboratory of Neurogenetics, National Institute on Aging, National Institutes of Health, Bethesda, Maryland 20892, USA. 5Department of Molecular Neuroscience and Reta LilaWeston Institute of Neurological Studies, Institute of Neurology, University College London, Queen Square, London WC1N 3BG, UK. 6Department of Neurology, Chang Gung MemorialHospital and College of Medicine, Chang Gung University, Taipei 10591, Taiwan. 7Department of Genetics, University of Pennsylvania, Philadelphia, Pennsylvania 19104, USA. 8Centerfor Neurosciences and Cell Biology, Faculty of Medicine, University of Coimbra, 3004-504 Coimbra, Portugal. 9University of Oxford, Department of Clinical Neurology, John RadcliffeHospital, Oxford OX3 9DU, UK. 10Neurogenetics Branch, National Institute of Neurological Disorders and Stroke, National Institutes of Health, Bethesda, Maryland 20892, USA.11Unidad de Genetica Molecular, Departamento de Genomica y Proteomica, Instituto de Biomedicina de Valencia-CSIC, 46010, Valencia, Spain. 12Fondation Jean Dausset – Centred’Etude du Polymorphisme Humain (CEPH), 27 rue Juliette Dodu, 75010 Paris, France. 13Center for Public Health Genomics, University of Virginia, Charlottesville, Virginia 22908,USA.
Vol 451 | 21 February 2008 | doi:10.1038/nature06742
998Nature Publishing Group©2008
Lahu
Yi
Cambodian
Mongola
Daur
Yakut
MayaColombianPima
MelanesianPapuan
Mandenka
Yoruba
Bantu (Kenya)Bantu (southern Africa)
Biaka PygmyMbuti Pygmy
San
Uygur
Burusho
Kalash
Balochi
Adygei
Palestinian
Mozabite Bedouin
Druze
Basque
RussianRussian
Biaka PygmyMbuti Pygmy
San
Mandenka
Yoruba
Bantu (southern Africa)Bantu (Kenya)
MelanesianPapuan
Mongola
DaurCambodian
LahuYi
Yakut
Maya
ColombianPima
Uygur
Burusho
Kalash
Balochi
BedouinMozabite
Palestinian Druze
Adygei
Basque Maya
Pima
Colom
bian
PapuanKalashMelanesian
Yakut
CambodianLahu
Yi
Mongola
Daur
Uygur
Mbuti PygmyBiaka Pygmy
Bantu (southern Africa)
Bantu (Kenya)
Yoruba
Mandenka
San
Burusho
Basque
Palestinian
Druze
MozabiteBedouin
Russ
ian
Adyg
ei
Balochi
SNPs
0.09 0.82
0.29 0.66
0.13
3.80
0.070.05
0.030.56
0.082.20
0.28
81.17
0.10 0.005
0.080.57
0.090.38
0.15
3.01
0.04 0.01
0.91 1.70
0.75 0.38
0.12
1.43
0.06
1 region
2 regions
3 regions
4 regions
5 regions
Haplotypes
1.49 2.02
1.77 3.16
1.06
3.96
1.441.40
0.511.28
0.946.96
1.41
12.43
1.51 0.48
2.242.19
1.472.51
1.27
3.74
1.26 1.74
18.03 8.03
5.70 2.62
2.05
3.19
2.16
CNVs
0.34 0.16
0.55 0.05
0.03
0.03
0.355.73
0.040.06
0.200.33
0.04
61.19
0.22 0.46
0.370.30
1.680.24
0.03
0.09
0.84 12.33
5.10 0.51
4.75 0.58
0.31
0.20
2.91
Africa
Eurasia
East Asia
Oceania
America
San
Mb
uti P
ygm
y
Bia
ka P
ygm
yB
antu
(Ken
ya)
Ban
tu (S
. Afr
ica)
Yor
uba
Man
den
ka
Moz
abite
Bed
ouin
Pal
estin
ian
Dru
ze
Bas
que
Rus
sian
Ad
ygei
Bal
ochi
Kal
ash
Bur
usho
Uyg
urY
akut
Mon
gola
Dau
rY
iC
amb
odia
nLa
huM
elan
esia
nP
apua
nP
ima
May
aC
olom
bia
n
San
Mb
uti P
ygm
yB
iaka
Pyg
my
Ban
tu (K
enya
)B
antu
(S. A
fric
a)Y
orub
a
Man
den
ka
Moz
abite
Bed
ouin
Pal
estin
ian
Dru
ze
Bas
que
Rus
sian
Ad
ygei
Bal
ochi
Kal
ash
Bur
usho
Uyg
urY
akut
Dau
rY
iC
amb
odia
nLa
hu
Pap
uan
Pim
a
Col
omb
ian
2=K
San
Mb
uti P
ygm
y
Bia
ka P
ygm
yB
antu
(Ken
ya)
Ban
tu (S
. Afr
ica)
Yor
uba
Man
den
ka
Moz
abite
Bed
ouin
Pal
estin
ian
Dru
ze
Bas
que
Rus
sian
Ad
ygei
Bal
ochi
Kal
ash
Bur
usho
Uyg
urY
akut
Mon
gola
Dau
rY
iC
amb
odia
nLa
huM
elan
esia
nP
apua
nP
ima
May
aC
olom
bia
n
3=K
4=K
5= K
6=K
AdygeiBalochiBantu (Kenya)Bantu (S. Africa)BasqueBedouinBiaka PygmyBurusho
CambodianColombianDaurDruzeKalashLahuMandenkaMaya
Mbuti PygmyMelanesianMongolaMozabitePalestinianPapuanPimaRussian
SanUygurYakutYiYoruba
a
b
c
d
Africa
EuropeMiddle East
C/S AsiaEast AsiaOceaniaAmerica
AfricaEurasiaEast AsiaOceaniaAmerica
Mon
gola
Mel
anes
ian
May
a
San
Mb
uti P
ygm
yB
iaka
Pyg
my
Ban
tu (K
enya
)B
antu
(S. A
fric
a)Y
orub
a
Man
den
ka
Moz
abite
Bed
ouin
Pal
estin
ian
Dru
ze
Bas
que
Rus
sian
Ad
ygei
Bal
ochi
Kal
ash
Bur
usho
Uyg
ur
Yak
utM
ongo
laD
aur Yi
Cam
bod
ian
Lahu
Mel
anes
ian
Pap
uan
Pim
aM
aya
Col
omb
ian
Figure 1 | SNP, haplotype, and copy-number variation across populations.a, Venn diagram of the percentages of alleles with particular geographicdistributions. b, Neighbour-joining trees of population relationships.Internal branch lengths are proportional to bootstrap support. Lines ofintermediate thickness represent internal branches with more than 50%bootstrap support, and the thickest lines represent more than 95% support.
c, Population structure inferred by bayesian clustering. Each individual isshown as a thin vertical line partitioned into K coloured componentsrepresenting inferred membership in K genetic clusters. The bottom rowprovides inferred population structure for each geographic region. d, MDSrepresentations of genetic distances between individuals (SNPs andhaplotypes) and populations (CNVs). C/S Asia, Central/South Asia.
NATURE | Vol 451 | 21 February 2008 LETTERS
999Nature Publishing Group©2008
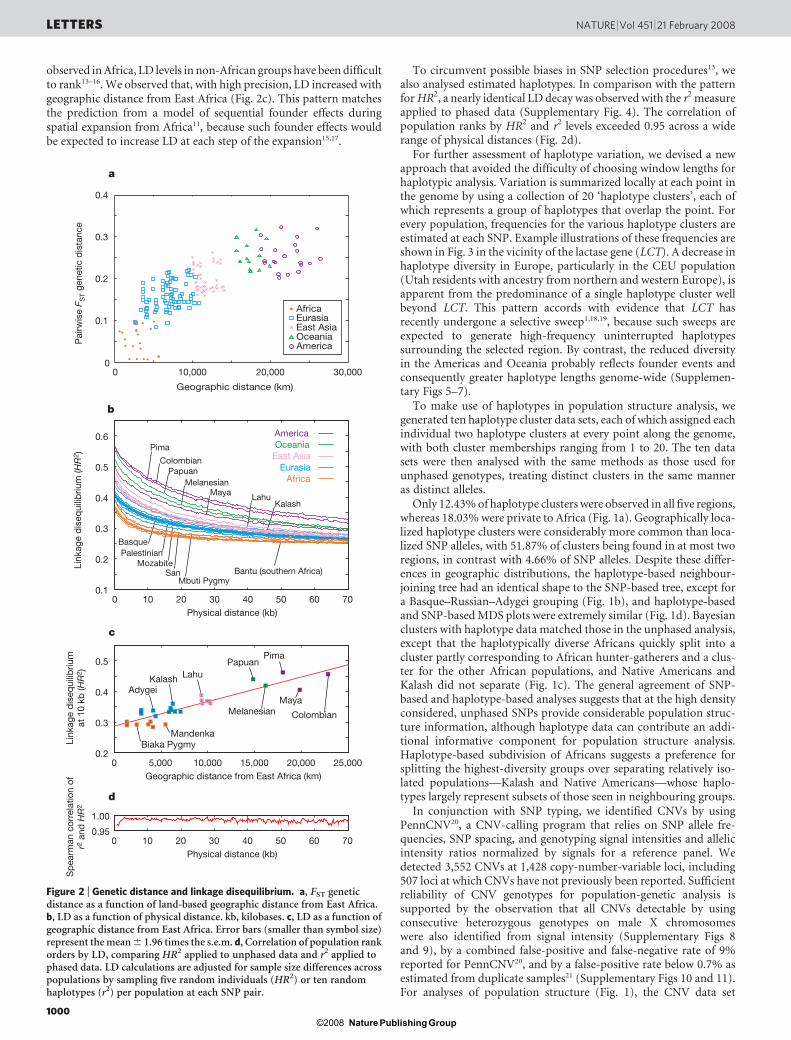
observed in Africa, LD levels in non-African groups have been difficultto rank13–16. We observed that, with high precision, LD increased withgeographic distance from East Africa (Fig. 2c). This pattern matchesthe prediction from a model of sequential founder effects duringspatial expansion from Africa11, because such founder effects wouldbe expected to increase LD at each step of the expansion15,17.
To circumvent possible biases in SNP selection procedures13, wealso analysed estimated haplotypes. In comparison with the patternfor HR2, a nearly identical LD decay was observed with the r2 measureapplied to phased data (Supplementary Fig. 4). The correlation ofpopulation ranks by HR2 and r2 levels exceeded 0.95 across a widerange of physical distances (Fig. 2d).
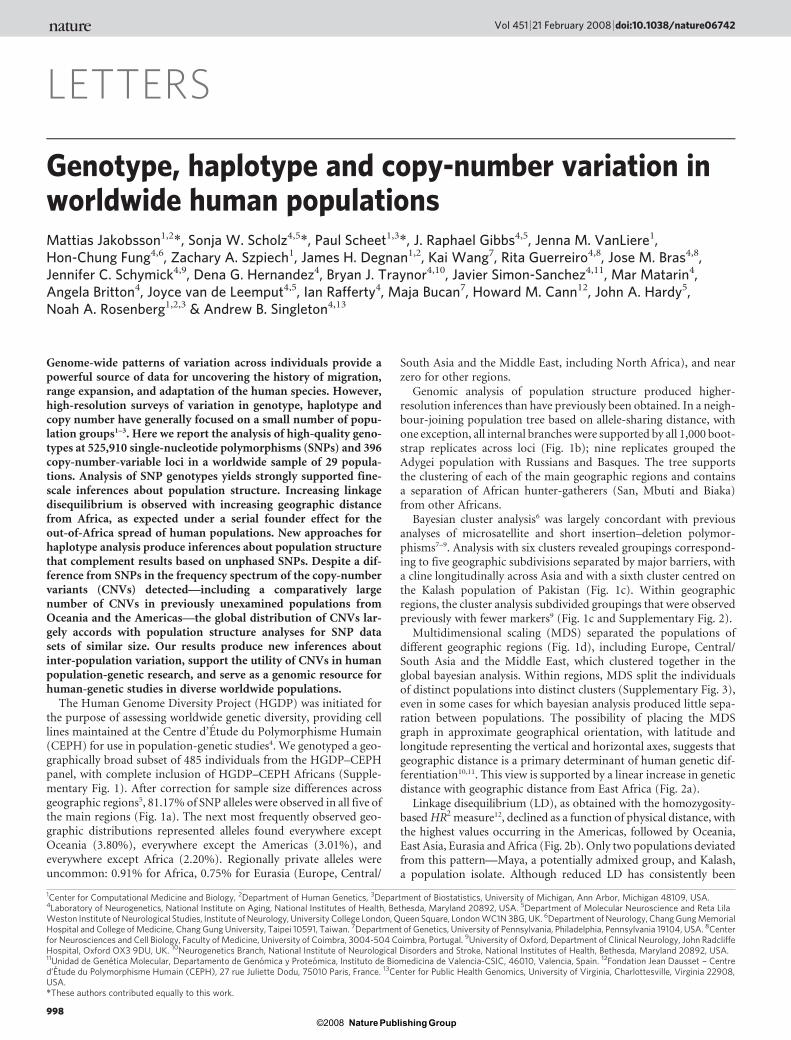
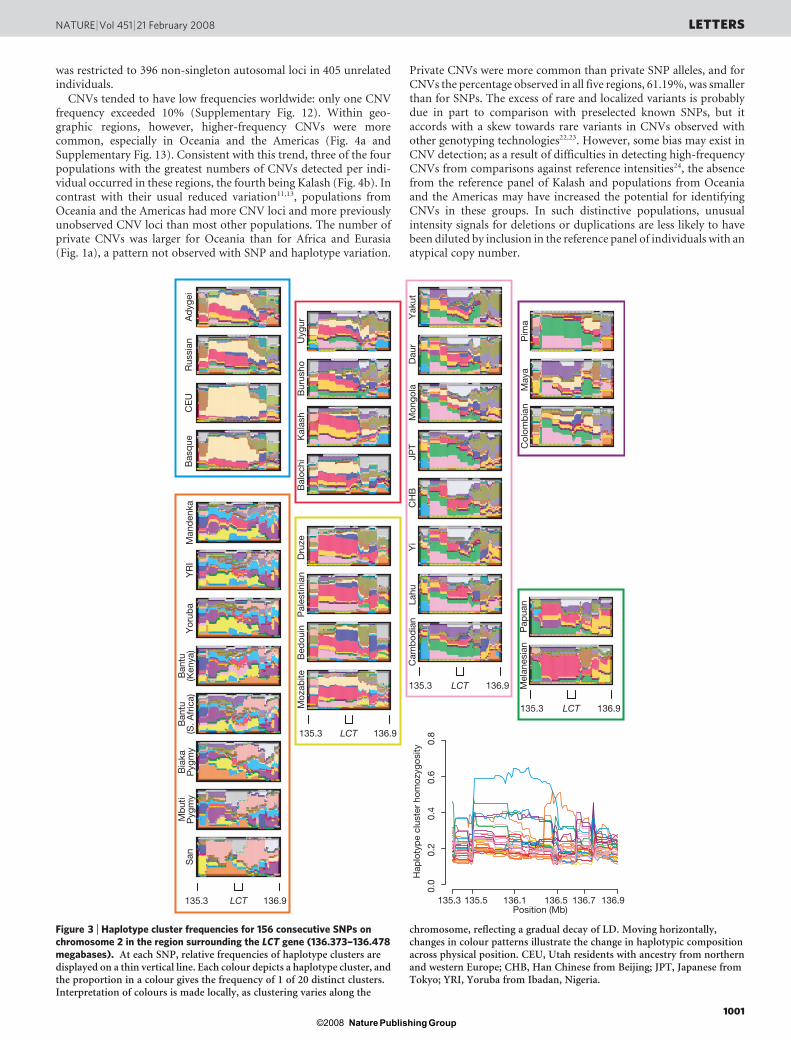
For further assessment of haplotype variation, we devised a newapproach that avoided the difficulty of choosing window lengths forhaplotypic analysis. Variation is summarized locally at each point inthe genome by using a collection of 20 ‘haplotype clusters’, each ofwhich represents a group of haplotypes that overlap the point. Forevery population, frequencies for the various haplotype clusters areestimated at each SNP. Example illustrations of these frequencies areshown in Fig. 3 in the vicinity of the lactase gene (LCT). A decrease inhaplotype diversity in Europe, particularly in the CEU population(Utah residents with ancestry from northern and western Europe), isapparent from the predominance of a single haplotype cluster wellbeyond LCT. This pattern accords with evidence that LCT hasrecently undergone a selective sweep1,18,19, because such sweeps areexpected to generate high-frequency uninterrupted haplotypessurrounding the selected region. By contrast, the reduced diversityin the Americas and Oceania probably reflects founder events andconsequently greater haplotype lengths genome-wide (Supplemen-tary Figs 5–7).
To make use of haplotypes in population structure analysis, wegenerated ten haplotype cluster data sets, each of which assigned eachindividual two haplotype clusters at every point along the genome,with both cluster memberships ranging from 1 to 20. The ten datasets were then analysed with the same methods as those used forunphased genotypes, treating distinct clusters in the same manneras distinct alleles.
Only 12.43% of haplotype clusters were observed in all five regions,whereas 18.03% were private to Africa (Fig. 1a). Geographically loca-lized haplotype clusters were considerably more common than loca-lized SNP alleles, with 51.87% of clusters being found in at most tworegions, in contrast with 4.66% of SNP alleles. Despite these differ-ences in geographic distributions, the haplotype-based neighbour-joining tree had an identical shape to the SNP-based tree, except fora Basque–Russian–Adygei grouping (Fig. 1b), and haplotype-basedand SNP-based MDS plots were extremely similar (Fig. 1d). Bayesianclusters with haplotype data matched those in the unphased analysis,except that the haplotypically diverse Africans quickly split into acluster partly corresponding to African hunter-gatherers and a clus-ter for the other African populations, and Native Americans andKalash did not separate (Fig. 1c). The general agreement of SNP-based and haplotype-based analyses suggests that at the high densityconsidered, unphased SNPs provide considerable population struc-ture information, although haplotype data can contribute an addi-tional informative component for population structure analysis.Haplotype-based subdivision of Africans suggests a preference forsplitting the highest-diversity groups over separating relatively iso-lated populations—Kalash and Native Americans—whose haplo-types largely represent subsets of those seen in neighbouring groups.
In conjunction with SNP typing, we identified CNVs by usingPennCNV20, a CNV-calling program that relies on SNP allele fre-quencies, SNP spacing, and genotyping signal intensities and allelicintensity ratios normalized by signals for a reference panel. Wedetected 3,552 CNVs at 1,428 copy-number-variable loci, including507 loci at which CNVs have not previously been reported. Sufficientreliability of CNV genotypes for population-genetic analysis issupported by the observation that all CNVs detectable by usingconsecutive heterozygous genotypes on male X chromosomeswere also identified from signal intensity (Supplementary Figs 8and 9), by a combined false-positive and false-negative rate of 9%reported for PennCNV20, and by a false-positive rate below 0.7% asestimated from duplicate samples21 (Supplementary Figs 10 and 11).For analyses of population structure (Fig. 1), the CNV data set
b
0.1
0.2
0.3
0.4
0.5
0.6
0 10 20 30 40 50 60 70Physical distance (kb)
Pima
ColombianPapuan
MelanesianMaya Lahu
Kalash
BasquePalestinian
MozabiteSan
Mbuti PygmyBantu (southern Africa)
AmericaOceania
East AsiaEurasia
Africa
d
0.95
1.00
0 10 20 30 40 50 60 70Physical distance (kb)
c
0.2
0.3
0.4
0.5
0 5,000 10,000 15,000 20,000 25,000Geographic distance from East Africa (km)
Pima
Maya
Colombian
Papuan
Melanesian
LahuKalash
MandenkaBiaka Pygmy
Adygei
0 10,000 20,000 30,0000
0.1
0.2
0.3
0.4
Geographic distance (km)
a
AfricaEurasiaEast AsiaOceaniaAmericaP
airw
ise
F ST
gene
tic d
ista
nce
Link
age
dis
equi
libriu
m (H
R2 )
Link
age
dis
equi
libriu
m
at 1
0 kb
(HR
2 )S
pea
rman
cor
rela
tion
of
r2 a
nd H
R2
Figure 2 | Genetic distance and linkage disequilibrium. a, FST geneticdistance as a function of land-based geographic distance from East Africa.b, LD as a function of physical distance. kb, kilobases. c, LD as a function ofgeographic distance from East Africa. Error bars (smaller than symbol size)represent the mean 6 1.96 times the s.e.m. d, Correlation of population rankorders by LD, comparing HR2 applied to unphased data and r2 applied tophased data. LD calculations are adjusted for sample size differences acrosspopulations by sampling five random individuals (HR2) or ten randomhaplotypes (r2) per population at each SNP pair.
LETTERS NATURE | Vol 451 | 21 February 2008
1000Nature Publishing Group©2008
was restricted to 396 non-singleton autosomal loci in 405 unrelatedindividuals.
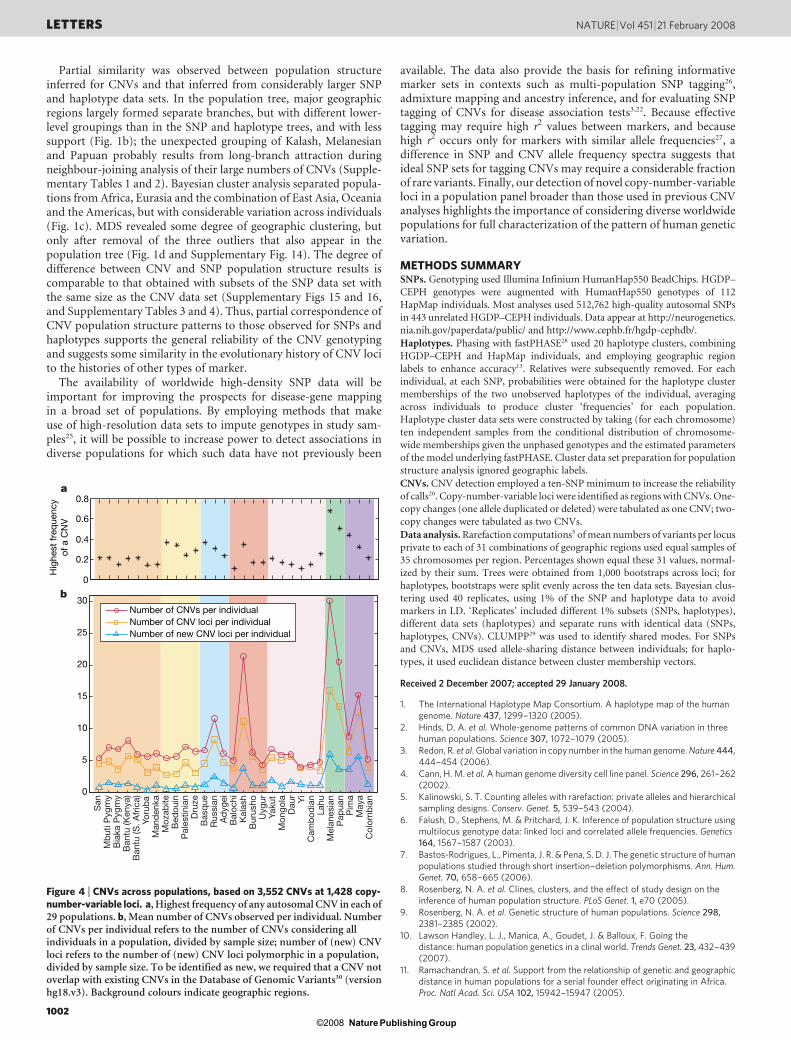
CNVs tended to have low frequencies worldwide: only one CNVfrequency exceeded 10% (Supplementary Fig. 12). Within geo-graphic regions, however, higher-frequency CNVs were morecommon, especially in Oceania and the Americas (Fig. 4a andSupplementary Fig. 13). Consistent with this trend, three of the fourpopulations with the greatest numbers of CNVs detected per indi-vidual occurred in these regions, the fourth being Kalash (Fig. 4b). Incontrast with their usual reduced variation11,13, populations fromOceania and the Americas had more CNV loci and more previouslyunobserved CNV loci than most other populations. The number ofprivate CNVs was larger for Oceania than for Africa and Eurasia(Fig. 1a), a pattern not observed with SNP and haplotype variation.
Private CNVs were more common than private SNP alleles, and forCNVs the percentage observed in all five regions, 61.19%, was smallerthan for SNPs. The excess of rare and localized variants is probablydue in part to comparison with preselected known SNPs, but itaccords with a skew towards rare variants in CNVs observed withother genotyping technologies22,23. However, some bias may exist inCNV detection; as a result of difficulties in detecting high-frequencyCNVs from comparisons against reference intensities24, the absencefrom the reference panel of Kalash and populations from Oceaniaand the Americas may have increased the potential for identifyingCNVs in these groups. In such distinctive populations, unusualintensity signals for deletions or duplications are less likely to havebeen diluted by inclusion in the reference panel of individuals with anatypical copy number.
Ad
ygei
Rus
sian
CE
UB
asq
ueM
and
enka
YR
IY
orub
aB
antu
(Ken
ya)
Ban
tu(S
. Afr
ica)
Bia
kaP
ygm
yM
but
iP
ygm
yS
an
135.3 LCT 136.9
Uyg
urB
urus
hoK
alas
hB
aloc
hiD
ruze
Pal
estin
ian
Bed
ouin
Moz
abite
135.3 LCT 136.9
Yak
utD
aur
Mon
gola
JPT
CH
BY
iLa
huC
amb
odia
n
Pap
uan
Mel
anes
ian
135.3 LCT 136.9
Pim
aM
aya
Col
omb
ian
135.3 LCT 136.9
Position (Mb)135.3 136.1 136.5 136.7 136.9135.5
0.0
0.2
0.
4
0
.6
0.8
Hap
loty
pe
clus
ter
hom
ozyg
osity
Figure 3 | Haplotype cluster frequencies for 156 consecutive SNPs onchromosome 2 in the region surrounding the LCT gene (136.373–136.478megabases). At each SNP, relative frequencies of haplotype clusters aredisplayed on a thin vertical line. Each colour depicts a haplotype cluster, andthe proportion in a colour gives the frequency of 1 of 20 distinct clusters.Interpretation of colours is made locally, as clustering varies along the
chromosome, reflecting a gradual decay of LD. Moving horizontally,changes in colour patterns illustrate the change in haplotypic compositionacross physical position. CEU, Utah residents with ancestry from northernand western Europe; CHB, Han Chinese from Beijing; JPT, Japanese fromTokyo; YRI, Yoruba from Ibadan, Nigeria.
NATURE | Vol 451 | 21 February 2008 LETTERS
1001Nature Publishing Group©2008
Partial similarity was observed between population structureinferred for CNVs and that inferred from considerably larger SNPand haplotype data sets. In the population tree, major geographicregions largely formed separate branches, but with different lower-level groupings than in the SNP and haplotype trees, and with lesssupport (Fig. 1b); the unexpected grouping of Kalash, Melanesianand Papuan probably results from long-branch attraction duringneighbour-joining analysis of their large numbers of CNVs (Supple-mentary Tables 1 and 2). Bayesian cluster analysis separated popula-tions from Africa, Eurasia and the combination of East Asia, Oceaniaand the Americas, but with considerable variation across individuals(Fig. 1c). MDS revealed some degree of geographic clustering, butonly after removal of the three outliers that also appear in thepopulation tree (Fig. 1d and Supplementary Fig. 14). The degree ofdifference between CNV and SNP population structure results iscomparable to that obtained with subsets of the SNP data set withthe same size as the CNV data set (Supplementary Figs 15 and 16,and Supplementary Tables 3 and 4). Thus, partial correspondence ofCNV population structure patterns to those observed for SNPs andhaplotypes supports the general reliability of the CNV genotypingand suggests some similarity in the evolutionary history of CNV locito the histories of other types of marker.
The availability of worldwide high-density SNP data will beimportant for improving the prospects for disease-gene mappingin a broad set of populations. By employing methods that makeuse of high-resolution data sets to impute genotypes in study sam-ples25, it will be possible to increase power to detect associations indiverse populations for which such data have not previously been
available. The data also provide the basis for refining informativemarker sets in contexts such as multi-population SNP tagging26,admixture mapping and ancestry inference, and for evaluating SNPtagging of CNVs for disease association tests3,22. Because effectivetagging may require high r2 values between markers, and becausehigh r2 occurs only for markers with similar allele frequencies27, adifference in SNP and CNV allele frequency spectra suggests thatideal SNP sets for tagging CNVs may require a considerable fractionof rare variants. Finally, our detection of novel copy-number-variableloci in a population panel broader than those used in previous CNVanalyses highlights the importance of considering diverse worldwidepopulations for full characterization of the pattern of human geneticvariation.
METHODS SUMMARYSNPs. Genotyping used Illumina Infinium HumanHap550 BeadChips. HGDP–
CEPH genotypes were augmented with HumanHap550 genotypes of 112
HapMap individuals. Most analyses used 512,762 high-quality autosomal SNPs
in 443 unrelated HGDP–CEPH individuals. Data appear at http://neurogenetics.
nia.nih.gov/paperdata/public/ and http://www.cephb.fr/hgdp-cephdb/.
Haplotypes. Phasing with fastPHASE28 used 20 haplotype clusters, combining
HGDP–CEPH and HapMap individuals, and employing geographic region
labels to enhance accuracy13. Relatives were subsequently removed. For each
individual, at each SNP, probabilities were obtained for the haplotype cluster
memberships of the two unobserved haplotypes of the individual, averaging
across individuals to produce cluster ‘frequencies’ for each population.
Haplotype cluster data sets were constructed by taking (for each chromosome)
ten independent samples from the conditional distribution of chromosome-
wide memberships given the unphased genotypes and the estimated parameters
of the model underlying fastPHASE. Cluster data set preparation for population
structure analysis ignored geographic labels.
CNVs. CNV detection employed a ten-SNP minimum to increase the reliability
of calls20. Copy-number-variable loci were identified as regions with CNVs. One-
copy changes (one allele duplicated or deleted) were tabulated as one CNV; two-
copy changes were tabulated as two CNVs.
Data analysis. Rarefaction computations5 of mean numbers of variants per locus
private to each of 31 combinations of geographic regions used equal samples of
35 chromosomes per region. Percentages shown equal these 31 values, normal-
ized by their sum. Trees were obtained from 1,000 bootstraps across loci; for
haplotypes, bootstraps were split evenly across the ten data sets. Bayesian clus-
tering used 40 replicates, using 1% of the SNP and haplotype data to avoid
markers in LD. ‘Replicates’ included different 1% subsets (SNPs, haplotypes),
different data sets (haplotypes) and separate runs with identical data (SNPs,
haplotypes, CNVs). CLUMPP29 was used to identify shared modes. For SNPs
and CNVs, MDS used allele-sharing distance between individuals; for haplo-
types, it used euclidean distance between cluster membership vectors.
Received 2 December 2007; accepted 29 January 2008.
1. The International Haplotype Map Consortium. A haplotype map of the humangenome. Nature 437, 1299–1320 (2005).
2. Hinds, D. A. et al. Whole-genome patterns of common DNA variation in threehuman populations. Science 307, 1072–1079 (2005).
3. Redon, R. et al. Global variation in copy number in the human genome. Nature 444,444–454 (2006).
4. Cann, H. M. et al. A human genome diversity cell line panel. Science 296, 261–262(2002).
5. Kalinowski, S. T. Counting alleles with rarefaction: private alleles and hierarchicalsampling designs. Conserv. Genet. 5, 539–543 (2004).
6. Falush, D., Stephens, M. & Pritchard, J. K. Inference of population structure usingmultilocus genotype data: linked loci and correlated allele frequencies. Genetics164, 1567–1587 (2003).
7. Bastos-Rodrigues, L., Pimenta, J. R. & Pena, S. D. J. The genetic structure of humanpopulations studied through short insertion–deletion polymorphisms. Ann. Hum.Genet. 70, 658–665 (2006).
8. Rosenberg, N. A. et al. Clines, clusters, and the effect of study design on theinference of human population structure. PLoS Genet. 1, e70 (2005).
9. Rosenberg, N. A. et al. Genetic structure of human populations. Science 298,2381–2385 (2002).
10. Lawson Handley, L. J., Manica, A., Goudet, J. & Balloux, F. Going thedistance: human population genetics in a clinal world. Trends Genet. 23, 432–439(2007).
11. Ramachandran, S. et al. Support from the relationship of genetic and geographicdistance in human populations for a serial founder effect originating in Africa.Proc. Natl Acad. Sci. USA 102, 15942–15947 (2005).
Hig
hest
freq
uenc
yof
a C
NV
a
b
0
5
10
15
20
25
30Number of CNVs per individualNumber of CNV loci per individualNumber of new CNV loci per individual
0
0.2
0.4
0.6
0.8
San
Mb
uti P
ygm
yB
iaka
Pyg
my
Ban
tu (K
enya
)B
antu
(S. A
fric
a)Yo
rub
aM
and
enka
Moz
abite
Bed
ouin
Pal
estin
ian
Dru
zeB
asq
ueR
ussi
anA
dyg
eiB
aloc
hiK
alas
hB
urus
hoU
ygur
Yaku
tM
ongo
laD
aur Yi
Cam
bod
ian
Lahu
Mel
anes
ian
Pap
uan
Pim
aM
aya
Col
omb
ian
Figure 4 | CNVs across populations, based on 3,552 CNVs at 1,428 copy-number-variable loci. a, Highest frequency of any autosomal CNV in each of29 populations. b, Mean number of CNVs observed per individual. Numberof CNVs per individual refers to the number of CNVs considering allindividuals in a population, divided by sample size; number of (new) CNVloci refers to the number of (new) CNV loci polymorphic in a population,divided by sample size. To be identified as new, we required that a CNV notoverlap with existing CNVs in the Database of Genomic Variants30 (versionhg18.v3). Background colours indicate geographic regions.
LETTERS NATURE | Vol 451 | 21 February 2008
1002Nature Publishing Group©2008
12. Sabatti, C. & Risch, N. Homozygosity and linkage disequilibrium. Genetics 160,1707–1719 (2002).
13. Conrad, D. F. et al. A worldwide survey of haplotype variation and linkagedisequilibrium in the human genome. Nature Genet. 38, 1251–1260 (2006).
14. Gabriel, S. B. et al. The structure of haplotype blocks in the human genome. Science296, 2225–2229 (2002).
15. Reich, D. E. et al. Linkage disequilibrium in the human genome. Nature 411,199–204 (2001).
16. Tishkoff, S. A. & Kidd, K. K. Implications of biogeography of human populations for‘race’ and medicine. Nature Genet. 36, S21–S27 (2004).
17. McVean, G. A. T. A genealogical interpretation of linkage disequilibrium. Genetics162, 987–991 (2002).
18. Bersaglieri, T. et al. Genetic signatures of strong recent positive selection at thelactase gene. Am. J. Hum. Genet. 74, 1111–1120 (2004).
19. Tishkoff, S. A. et al. Convergent adaptation of human lactase persistence in Africaand Europe. Nature Genet. 39, 31–40 (2007).
20. Wang, K. et al. PennCNV: an integrated hidden Markov model designed for high-resolution copy number variation detection in whole-genome SNP genotypingdata. Genome Res. 17, 1665–1674 (2007).
21. Wong, K. K. et al. A comprehensive analysis of common copy-number variationsin the human genome. Am. J. Hum. Genet. 80, 91–104 (2007).
22. Locke, D. P. et al. Linkage disequilibrium and heritability of copy-numberpolymorphisms within duplicated regions of the human genome. Am. J. Hum.Genet. 79, 275–290 (2006).
23. Sharp, A. J. et al. Segmental duplications and copy-number variation in the humangenome. Am. J. Hum. Genet. 77, 78–88 (2005).
24. Scherer, S. W. et al. Challenges and standards in integrating surveys of structuralvariation. Nature Genet. 39, S7–S15 (2007).
25. Servin, B. & Stephens, M. Imputation-based analysis of association studies:candidate regions and quantitative traits. PLoS Genet. 3, e114 (2007).
26. Need, A. C. & Goldstein, D. B. Genome-wide tagging for everyone. Nature Genet.38, 1227–1228 (2006).
27. Eberle, M. A., Rieder, M. J., Kruglyak, L. & Nickerson, D. A. Allele frequencymatching between SNPs reveals an excess of linkage disequilibrium in genicregions of the human genome. PLoS Genet. 2, e142 (2006).
28. Scheet, P. & Stephens, M. A fast and flexible statistical model for large-scalepopulation genotype data: applications to inferring missing genotypes andhaplotypic phase. Am. J. Hum. Genet. 78, 629–644 (2006).
29. Jakobsson, M. & Rosenberg, N. A. CLUMPP: a cluster matching and permutationprogram for dealing with label switching and multimodality in analysis ofpopulation structure. Bioinformatics 23, 1801–1806 (2007).
30. Zhang, J., Feuk, L., Duggan, G. E., Khaja, R. & Scherer, S. W. Development ofbioinformatics resources for display and analysis of copy number and otherstructural variants in the human genome. Cytogenet. Genome Res. 115, 205–214(2006).
Supplementary Information is linked to the online version of the paper atwww.nature.com/nature.
Acknowledgements We thank the Biological Resource Center at the FondationJean Dausset – CEPH for preparing HGDP–CEPH diversity panel DNA samples,and S. Chanock and A. Hutchinson for assistance with the DNAs. This work wassupported in part by NIH grants, by a postdoctoral fellowship from the University ofMichigan Center for Genetics in Health and Medicine, by grants from the AlfredP. Sloan Foundation and the Burroughs Wellcome Fund, by the National Center forMinority Health and Health Disparities, and by the Intramural Program of theNational Institute on Aging. The study used the Biowulf Linux cluster at theNational Institutes of Health (http://biowulf.nih.gov).
Author Contributions N.A.R. and A.B.S. wish to be regarded as joint last authors.
Author Information The array data described in this paper are deposited in theGene Expression Omnibus (www.ncbi.nlm.nih.gov/geo) under accession numberGSE10331. Reprints and permissions information is available at www.nature.com/reprints. Correspondence and requests for materials should be addressed to N.A.R.([email protected]) or A.B.S. ([email protected]).
NATURE | Vol 451 | 21 February 2008 LETTERS
1003Nature Publishing Group©2008
Related Documents