Estimation of human leukocyte antigen class I and class II high-resolution allele and haplotype frequencies in the Italian population and comparison with other European populations Sabina Rendine a,b, *, Norma Maria Ferrero a , Nicoletta Sacchi c , Cristina Costa c , Simona Pollichieni c , Antonio Amoroso a,b a A.O.U.S.G. Battista, Transplant Immunology Service, Torino, Italy b University of Turin, Department of Genetics, Biology and Biochemistry, Torino, Italy c Italian Bone Marrow Donor Registry (IBMDR) E.O. Ospedali, Galliera, Genoa, Italy ARTICLE INFO Article history: Received 2 August 2011 Accepted 24 January 2012 Available online 31 January 2012 Keywords: Alleles Haplotypes High-resolution typing HLA Linkage disequilibrium ABSTRACT The high-resolution (HR) allele and haplotype frequencies of class I and II human leukocyte antigen (HLA) system were determined in the Italian population from a sample of donors recruited in the Italian Bone Marrow Donor Registry (IBMDR). This study analyzed the HLA-A, -B, -C, -DRB1, and -DQB1 loci. Two different samples were used: donors HR typed at least for one allele, usually when selected for donor– recipient matching (respectively: 3596, 7591, 4715, 57345, and 8196), to make a list of the observed alleles and determine the relative frequencies of the alleles in each class of the corresponding antigen; donors HR randomly typed for both the alleles (respectively: 975, 1643, 1569, 22114, and 2087) to estimate the allele and haplotype frequencies, and two loci linkage disequilibrium. The number of alleles showing a frequency 1% on the total number of observed alleles are 18/75 HLA-A, 28/142 -B, 17/57 -C, 23/154 -DRB1, and 13/31 -DQB1. In each locus they account for more than 88% of the total cumulative frequencies. The most frequent alleles are A*02: 01, B*35: 01, C*04:01, DRB1*07:01, DQB1*03:01. The most frequent five-locus haplotype in the 338 donors randomly typed is A*01: 01-C*07:01-B*08: 01-DRB1*03:01-DQB1*02:01. The genetic comparison of the Italian population with 16 European popu- lations shows a south–north gradient. 2012 American Society for Histocompatibility and Immunogenetics. Published by Elsevier Inc. All rights reserved. 1. Introduction The human leukocyte antigen (HLA) genetic system plays a crucial role in unrelated stem-cell transplantation; HLA matching between donors and recipients affects the success of hematopoietic stem-cell transplantation by minimizing graft rejections and graft- versus-host disease [1]. Reports on strong adverse effects of HLA mismatch at high-resolution levels on transplantation outcome re-emphasize that the selection of optimal unrelated donor should be based on allele matching [2– 4]. Furthermore, matching at the haplotype level has a better likelihood of matching at other loci within the HLA region than for donors merely matched at the individual allelic level [5]. Moreover, the extreme allelic polymorphism located at several loci of this system tends to make the distribution of HLA alleles unique in each ethnic group. Hence, alleles and haplotypes deter- mination at high-resolution level in different populations is very important in transplantation medicine for the best HLA-matching donor searching. Several studies have been performed to characterize the Italian population [6 –10]. These studies analyzed serologic or molecular data at low-resolution levels of HLA-A, -B, and -DR loci, and dem- onstrated that the genetic structure of the Italian population can be represented by volunteer hematopoietic stem cell donors enrolled in the Italian Bone Marrow Registry (IBMDR), which is the primary source of unrelated marrow donor searches in Italy. Notwithstand- ing this, a high-resolution level alleles and haplotypes distribution report for HLA class I and class II in the Italian population is still not available. In this study, samples of randomly HR typed donors were extracted from IBMDR Registry, and frequencies of HLA-A, -B, -C, -DRB1, and -DQB1 alleles and haplotypes were estimated with the aim of predicting the most common alleles and two, three, four, and five loci haplotypes in the Italian population. 2. Subjects and methods 2.1. Subjects IBMDR is the third European Registry (sixth in the world) mak- ing available HLA data from volunteer hematopoietic stem cells donors on international networks. Its activity started in 1989, and * Corresponding author. E-mail address: [email protected] (S. Rendine). Human Immunology xx (2012) xxx Contents lists available at SciVerse ScienceDirect 0198-8859/$36.00 2012 American Society for Histocompatibility and Immunogenetics. Published by Elsevier Inc. All rights reserved. doi:10.1016/j.humimm.2012.01.005

Welcome message from author
This document is posted to help you gain knowledge. Please leave a comment to let me know what you think about it! Share it to your friends and learn new things together.
Transcript
hwi
lumid
Human Immunology xx (2012) xxx
Contents lists available at SciVerse ScienceDirect
d
Estimation of human leukocyte antigen class I and class II high-resolution alleleand haplotype frequencies in the Italian population and comparison with otherEuropean populationsSabina Rendine a,b,*, Norma Maria Ferrero a, Nicoletta Sacchi c, Cristina Costa c, Simona Pollichieni c,Antonio Amoroso a,b
a A.O.U.S.G. Battista, Transplant Immunology Service, Torino, Italyb University of Turin, Department of Genetics, Biology and Biochemistry, Torino, Italyc Italian Bone Marrow Donor Registry (IBMDR) E.O. Ospedali, Galliera, Genoa, Italy
A R T I C L E I N F O
Article history:Received 2 August 2011Accepted 24 January 2012Available online 31 January 2012
Keywords:AllelesHaplotypesHigh-resolution typingHLALinkage disequilibrium
A B S T R A C T
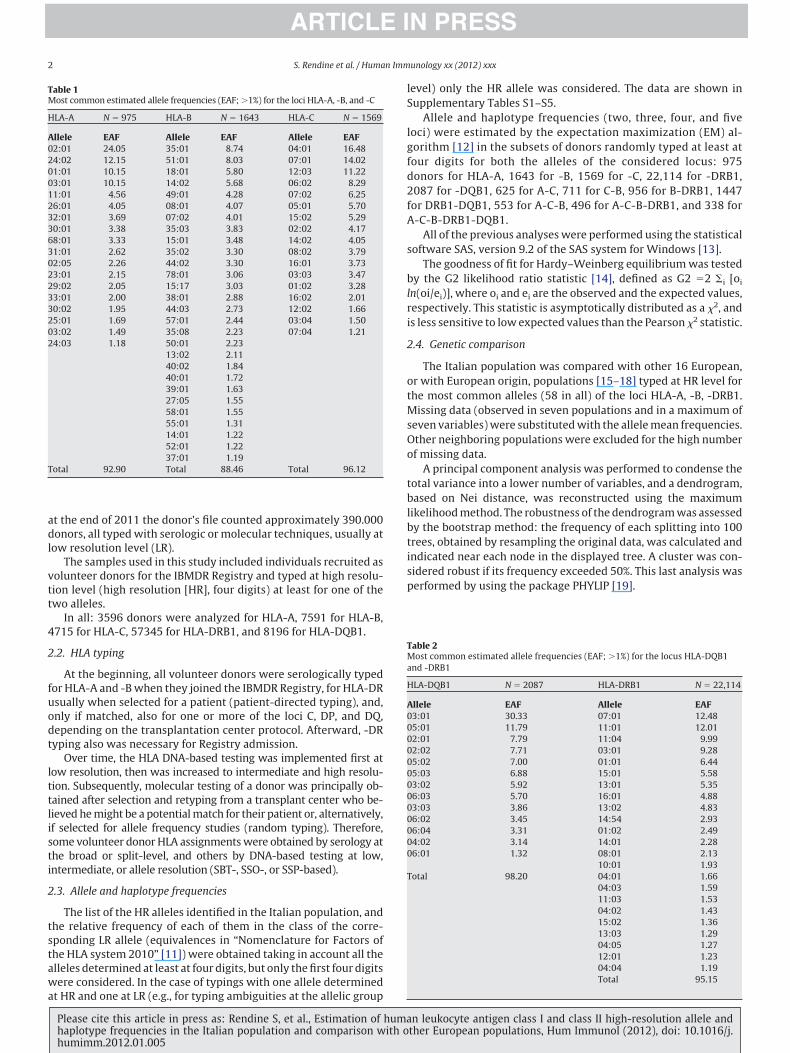
The high-resolution (HR) allele and haplotype frequencies of class I and II human leukocyte antigen (HLA)system were determined in the Italian population from a sample of donors recruited in the Italian BoneMarrow Donor Registry (IBMDR). This study analyzed the HLA-A, -B, -C, -DRB1, and -DQB1 loci. Twodifferent samples were used: donors HR typed at least for one allele, usually when selected for donor–recipient matching (respectively: 3596, 7591, 4715, 57345, and 8196), to make a list of the observedalleles and determine the relative frequencies of the alleles in each class of the corresponding antigen;donors HR randomly typed for both the alleles (respectively: 975, 1643, 1569, 22114, and 2087) toestimate the allele and haplotype frequencies, and two loci linkage disequilibrium. The number of allelesshowing a frequency �1% on the total number of observed alleles are 18/75 HLA-A, 28/142 -B, 17/57 -C,23/154 -DRB1, and 13/31 -DQB1. In each locus they account for more than 88% of the total cumulativefrequencies. The most frequent alleles are A*02: 01, B*35: 01, C*04:01, DRB1*07:01, DQB1*03:01. Themost frequent five-locus haplotype in the 338 donors randomly typed is A*01: 01-C*07:01-B*08:01-DRB1*03:01-DQB1*02:01. The genetic comparison of the Italian population with 16 European popu-lations shows a south–north gradient.
� 2012 American Society for Histocompatibility and Immunogenetics. Published by Elsevier Inc. All
rights reserved.pdorisirae-afi
2
2
i
1. Introduction
The human leukocyte antigen (HLA) genetic system plays acrucial role in unrelated stem-cell transplantation; HLA matchingbetweendonors and recipients affects the success of hematopoieticstem-cell transplantation byminimizing graft rejections and graft-versus-host disease [1]. Reports on strong adverse effects of HLAmismatch at high-resolution levels on transplantation outcomere-emphasize that the selection of optimal unrelated donor shouldbe based on allele matching [2–4]. Furthermore, matching at theaplotype level has a better likelihood of matching at other lociithin the HLA region than for donors merely matched at the
ndividual allelic level [5].Moreover, the extreme allelic polymorphism located at several
oci of this system tends to make the distribution of HLA allelesnique in each ethnic group. Hence, alleles and haplotypes deter-ination at high-resolution level in different populations is very
mportant in transplantation medicine for the best HLA-matchingonor searching.
d* Corresponding author.
E-mail address: [email protected] (S. Rendine).
0198-8859/$36.00 � 2012 American Society for Histocompatibility and Immunogeneticsoi:10.1016/j.humimm.2012.01.005
Several studies have been performed to characterize the Italianopulation [6–10]. These studies analyzed serologic or molecularata at low-resolution levels of HLA-A, -B, and -DR loci, and dem-nstrated that the genetic structure of the Italian population can beepresented by volunteer hematopoietic stem cell donors enrolledn the Italian Bone Marrow Registry (IBMDR), which is the primaryource of unrelatedmarrow donor searches in Italy. Notwithstand-ng this, a high-resolution level alleles and haplotypes distributioneport for HLA class I and class II in the Italian population is still notvailable. In this study, samples of randomly HR typed donorswerextracted from IBMDR Registry, and frequencies of HLA-A, -B, -C,DRB1, and -DQB1 alleles and haplotypes were estimated with theimof predicting themost commonalleles and two, three, four, andve loci haplotypes in the Italian population.
. Subjects and methods
.1. Subjects
IBMDR is the third European Registry (sixth in the world) mak-ng available HLA data from volunteer hematopoietic stem cells
onors on international networks. Its activity started in 1989, and. Published by Elsevier Inc. All rights reserved.
lS
lgfd2fA
s
b
S. Rendine et al. / Human Immunology xx (2012) xxx2
at the end of 2011 the donor’s file counted approximately 390.000donors, all typedwith serologic ormolecular techniques, usually atlow resolution level (LR).
The samples used in this study included individuals recruited asvolunteer donors for the IBMDR Registry and typed at high resolu-tion level (high resolution [HR], four digits) at least for one of thetwo alleles.
In all: 3596 donors were analyzed for HLA-A, 7591 for HLA-B,4715 for HLA-C, 57345 for HLA-DRB1, and 8196 for HLA-DQB1.
2.2. HLA typing
At the beginning, all volunteer donors were serologically typedfor HLA-A and -Bwhen they joined the IBMDR Registry, for HLA-DRusually when selected for a patient (patient-directed typing), and,only if matched, also for one or more of the loci C, DP, and DQ,depending on the transplantation center protocol. Afterward, -DRtyping also was necessary for Registry admission.
Over time, the HLA DNA-based testing was implemented first atlow resolution, then was increased to intermediate and high resolu-tion. Subsequently, molecular testing of a donor was principally ob-tained after selection and retyping from a transplant center who be-lievedhemight be a potentialmatch for their patient or, alternatively,if selected for allele frequency studies (random typing). Therefore,some volunteer donorHLA assignmentswere obtained by serology atthe broad or split-level, and others by DNA-based testing at low,intermediate, or allele resolution (SBT-, SSO-, or SSP-based).
2.3. Allele and haplotype frequencies
The list of the HR alleles identified in the Italian population, andthe relative frequency of each of them in the class of the corre-sponding LR allele (equivalences in “Nomenclature for Factors ofthe HLA system 2010” [11]) were obtained taking in account all thealleles determined at least at four digits, but only thefirst four digitswere considered. In the case of typings with one allele determined
Table 1Most common estimated allele frequencies (EAF; �1%) for the loci HLA-A, -B, and -C
HLA-A N � 975 HLA-B N � 1643 HLA-C N � 1569
Allele EAF Allele EAF Allele EAF02:01 24.05 35:01 8.74 04:01 16.4824:02 12.15 51:01 8.03 07:01 14.0201:01 10.15 18:01 5.80 12:03 11.2203:01 10.15 14:02 5.68 06:02 8.2911:01 4.56 49:01 4.28 07:02 6.2526:01 4.05 08:01 4.07 05:01 5.7032:01 3.69 07:02 4.01 15:02 5.2930:01 3.38 35:03 3.83 02:02 4.1768:01 3.33 15:01 3.48 14:02 4.0531:01 2.62 35:02 3.30 08:02 3.7902:05 2.26 44:02 3.30 16:01 3.7323:01 2.15 78:01 3.06 03:03 3.4729:02 2.05 15:17 3.03 01:02 3.2833:01 2.00 38:01 2.88 16:02 2.0130:02 1.95 44:03 2.73 12:02 1.6625:01 1.69 57:01 2.44 03:04 1.5003:02 1.49 35:08 2.23 07:04 1.2124:03 1.18 50:01 2.23
13:02 2.1140:02 1.8440:01 1.7239:01 1.6327:05 1.5558:01 1.5555:01 1.3114:01 1.2252:01 1.2237:01 1.19
Total 92.90 Total 88.46 Total 96.12
at HR and one at LR (e.g., for typing ambiguities at the allelic group
Please cite this article in press as: Rendine S, et al., Estimation of humahaplotype frequencies in the Italian population and comparison with ohumimm.2012.01.005
evel) only the HR allele was considered. The data are shown inupplementary Tables S1–S5.Allele and haplotype frequencies (two, three, four, and five
oci) were estimated by the expectation maximization (EM) al-orithm [12] in the subsets of donors randomly typed at least atour digits for both the alleles of the considered locus: 975onors for HLA-A, 1643 for -B, 1569 for -C, 22,114 for -DRB1,087 for -DQB1, 625 for A-C, 711 for C-B, 956 for B-DRB1, 1447or DRB1-DQB1, 553 for A-C-B, 496 for A-C-B-DRB1, and 338 for-C-B-DRB1-DQB1.All of the previous analyseswere performed using the statistical
oftware SAS, version 9.2 of the SAS system for Windows [13].The goodness of fit for Hardy–Weinberg equilibriumwas tested
y the G2 likelihood ratio statistic [14], defined as G2 �2 �i [oiln(oi/ei)], where oi and ei are the observed and the expected values,respectively. This statistic is asymptotically distributed as a �2, andis less sensitive to low expected values than the Pearson �2 statistic.
2.4. Genetic comparison
The Italian population was compared with other 16 European,or with European origin, populations [15–18] typed at HR level forthe most common alleles (58 in all) of the loci HLA-A, -B, -DRB1.Missing data (observed in seven populations and in a maximum ofseven variables)were substitutedwith the allelemean frequencies.Other neighboring populations were excluded for the high numberof missing data.
A principal component analysis was performed to condense thetotal variance into a lower number of variables, and a dendrogram,based on Nei distance, was reconstructed using the maximumlikelihoodmethod. The robustness of the dendrogramwas assessedby the bootstrap method: the frequency of each splitting into 100trees, obtained by resampling the original data, was calculated andindicated near each node in the displayed tree. A cluster was con-sidered robust if its frequency exceeded 50%. This last analysis wasperformed by using the package PHYLIP [19].
Table 2Most common estimated allele frequencies (EAF; �1%) for the locus HLA-DQB1and -DRB1
HLA-DQB1 N � 2087 HLA-DRB1 N � 22,114
Allele EAF Allele EAF03:01 30.33 07:01 12.4805:01 11.79 11:01 12.0102:01 7.79 11:04 9.9902:02 7.71 03:01 9.2805:02 7.00 01:01 6.4405:03 6.88 15:01 5.5803:02 5.92 13:01 5.3506:03 5.70 16:01 4.8803:03 3.86 13:02 4.8306:02 3.45 14:54 2.9306:04 3.31 01:02 2.4904:02 3.14 14:01 2.2806:01 1.32 08:01 2.13
10:01 1.93Total 98.20 04:01 1.66
04:03 1.5911:03 1.5304:02 1.4315:02 1.3613:03 1.2904:05 1.2712:01 1.2304:04 1.19Total 95.15
n leukocyte antigen class I and class II high-resolution allele andther European populations, Hum Immunol (2012), doi: 10.1016/j.
no
3
3
aeate
iaaf05a
st(g
f
4�
(
aqaDDda
aoDDD
Ie
isrI
3
�
S. Rendine et al. / Human Immunology xx (2012) xxx 3
2.5. Linkage disequilibrium
The SAS/GENETICS software was also used to calculate relativelinkage disequilibria (Drel of Lewontin [20]) in the subsets of do-ors described above between all of the pairs of alleles of contigu-us loci: A-C, B–C, B-DRB1, and DRB1-DQB1.
. Results
.1. Allele frequencies
The estimated allele frequencies (EAF) of HLA-A, -B, -C, -DRB1,nd -DQB1 alleles are reported in Supplementary Tables S1–S5. Forach locus are indicated the LR antigens, the associated molecularlleles at HR level, and the relative allele frequencies determined inhe class of each LR antigen. Tables 1 and 2 show themost commonstimated allele frequencies (EAF �1%) in the analyzed loci.A total of 75 different HLA-A alleles (four digits) were detected
n the HR typed donors, 48 in the randomly HR typed sample,mong which 18 show a frequency �1% (accounting for 93% of thellele frequencies). The most frequent allele is A*02: 01, with arequency of 24%, followed by A*24: 02 (12%), A*01: 01 (10%), A*03:1 (10%). The other alleles are present with a frequency lower than%. The LR A*02 group displays the higher diversity, including 18lleles.HLA-B locus exhibited 142 alleles in all, 98 in the random HR
ubsample, of which 28 with a frequency �1%, accounting 88% ofhe allele frequencies. The most frequent alleles are B*35: 018.74%), B*51: 01 (8%), B*18: 01 (5.8%), B*14: 02 (5.7%). The B*35roup shows the higher diversity, including 13 alleles.At locus HLA-C were identified 57 alleles, with 17 showing a
requency �1% (totaling 96% of the allele frequencies) among the
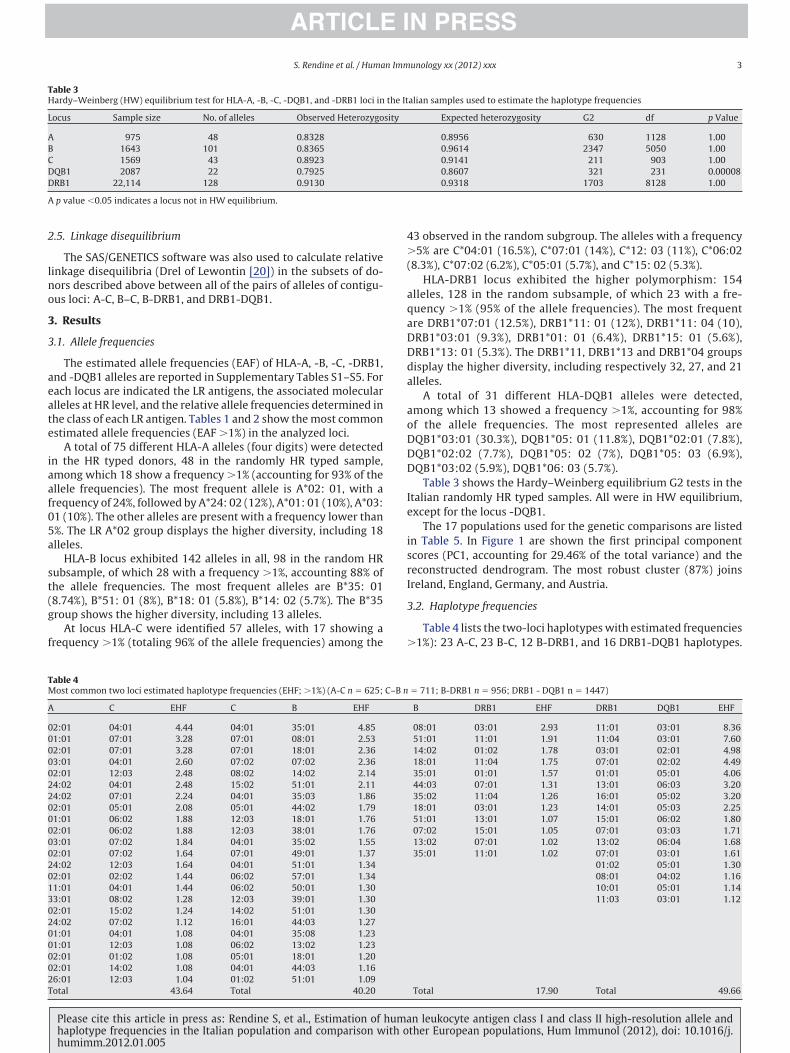
Table 4Most common two loci estimated haplotype frequencies (EHF; �1%) (A-C n � 625;
A C EHF C B EHF
02:01 04:01 4.44 04:01 35:01 4.8501:01 07:01 3.28 07:01 08:01 2.5302:01 07:01 3.28 07:01 18:01 2.3603:01 04:01 2.60 07:02 07:02 2.3602:01 12:03 2.48 08:02 14:02 2.1424:02 04:01 2.48 15:02 51:01 2.1124:02 07:01 2.24 04:01 35:03 1.8602:01 05:01 2.08 05:01 44:02 1.7901:01 06:02 1.88 12:03 18:01 1.7602:01 06:02 1.88 12:03 38:01 1.7603:01 07:02 1.84 04:01 35:02 1.5502:01 07:02 1.64 07:01 49:01 1.3724:02 12:03 1.64 04:01 51:01 1.3402:01 02:02 1.44 06:02 57:01 1.3411:01 04:01 1.44 06:02 50:01 1.3033:01 08:02 1.28 12:03 39:01 1.3002:01 15:02 1.24 14:02 51:01 1.3024:02 07:02 1.12 16:01 44:03 1.2701:01 04:01 1.08 04:01 35:08 1.2301:01 12:03 1.08 06:02 13:02 1.2302:01 01:02 1.08 05:01 18:01 1.2002:01 14:02 1.08 04:01 44:03 1.1626:01 12:03 1.04 01:02 51:01 1.09
Table 3Hardy–Weinberg (HW) equilibrium test for HLA-A, -B, -C, -DQB1, and -DRB1 loci in
Locus Sample size No. of alleles Observed Heterozygo
A 975 48 0.8328B 1643 101 0.8365C 1569 43 0.8923DQB1 2087 22 0.7925DRB1 22,114 128 0.9130
A p value �0.05 indicates a locus not in HW equilibrium.
Total 43.64 Total 40.20
Please cite this article in press as: Rendine S, et al., Estimation of humahaplotype frequencies in the Italian population and comparison with ohumimm.2012.01.005
3 observed in the random subgroup. The alleles with a frequency5% are C*04:01 (16.5%), C*07:01 (14%), C*12: 03 (11%), C*06:028.3%), C*07:02 (6.2%), C*05:01 (5.7%), and C*15: 02 (5.3%).
HLA-DRB1 locus exhibited the higher polymorphism: 154lleles, 128 in the random subsample, of which 23 with a fre-uency �1% (95% of the allele frequencies). The most frequentre DRB1*07:01 (12.5%), DRB1*11: 01 (12%), DRB1*11: 04 (10),RB1*03:01 (9.3%), DRB1*01: 01 (6.4%), DRB1*15: 01 (5.6%),RB1*13: 01 (5.3%). The DRB1*11, DRB1*13 and DRB1*04 groupsisplay the higher diversity, including respectively 32, 27, and 21lleles.A total of 31 different HLA-DQB1 alleles were detected,
mong which 13 showed a frequency �1%, accounting for 98%f the allele frequencies. The most represented alleles areQB1*03:01 (30.3%), DQB1*05: 01 (11.8%), DQB1*02:01 (7.8%),QB1*02:02 (7.7%), DQB1*05: 02 (7%), DQB1*05: 03 (6.9%),QB1*03:02 (5.9%), DQB1*06: 03 (5.7%).Table 3 shows the Hardy–Weinberg equilibrium G2 tests in the
talian randomly HR typed samples. All were in HW equilibrium,xcept for the locus -DQB1.The 17 populations used for the genetic comparisons are listed
n Table 5. In Figure 1 are shown the first principal componentcores (PC1, accounting for 29.46% of the total variance) and theeconstructed dendrogram. The most robust cluster (87%) joinsreland, England, Germany, and Austria.
.2. Haplotype frequencies
Table 4 lists the two-loci haplotypeswith estimated frequencies1%): 23 A-C, 23 B-C, 12 B-DRB1, and 16 DRB1-DQB1 haplotypes.
� 711; B-DRB1 n � 956; DRB1 - DQB1 n � 1447)
B DRB1 EHF DRB1 DQB1 EHF
08:01 03:01 2.93 11:01 03:01 8.3651:01 11:01 1.91 11:04 03:01 7.6014:02 01:02 1.78 03:01 02:01 4.9818:01 11:04 1.75 07:01 02:02 4.4935:01 01:01 1.57 01:01 05:01 4.0644:03 07:01 1.31 13:01 06:03 3.2035:02 11:04 1.26 16:01 05:02 3.2018:01 03:01 1.23 14:01 05:03 2.2551:01 13:01 1.07 15:01 06:02 1.8007:02 15:01 1.05 07:01 03:03 1.7113:02 07:01 1.02 13:02 06:04 1.6835:01 11:01 1.02 07:01 03:01 1.61
01:02 05:01 1.3008:01 04:02 1.1610:01 05:01 1.1411:03 03:01 1.12
alian samples used to estimate the haplotype frequencies
Expected heterozygosity G2 df p Value
0.8956 630 1128 1.000.9614 2347 5050 1.000.9141 211 903 1.000.8607 321 231 0.000080.9318 1703 8128 1.00
C–B n
the It
sity
Total 17.90 Total 49.66
n leukocyte antigen class I and class II high-resolution allele andther European populations, Hum Immunol (2012), doi: 10.1016/j.

l
populations. Numbers near each node represent the frequencies (%) of the clusterings in 1its frequency exceeds 50%. On the right are reported the first principal component (PC 1)
TPu
FGIIIMPPPUU
Name prefixes: C � central Europe; S � southern Europe; U � USA; W � westernEurope.
S. Rendine et al. / Human Immunology xx (2012) xxx4
Please cite this article in press as: Rendine S, et al., Estimation of humahaplotype frequencies in the Italian population and comparison with ohumimm.2012.01.005
The most common resulted respectively: A*01: 01-C*04:01 (hf �4.4%), C*04:01-B*35:01 (4.9%), B*08: 01-DRB1*03:01 (3%),DRB1*11: 01-DQB1*03:01 (8.4%).
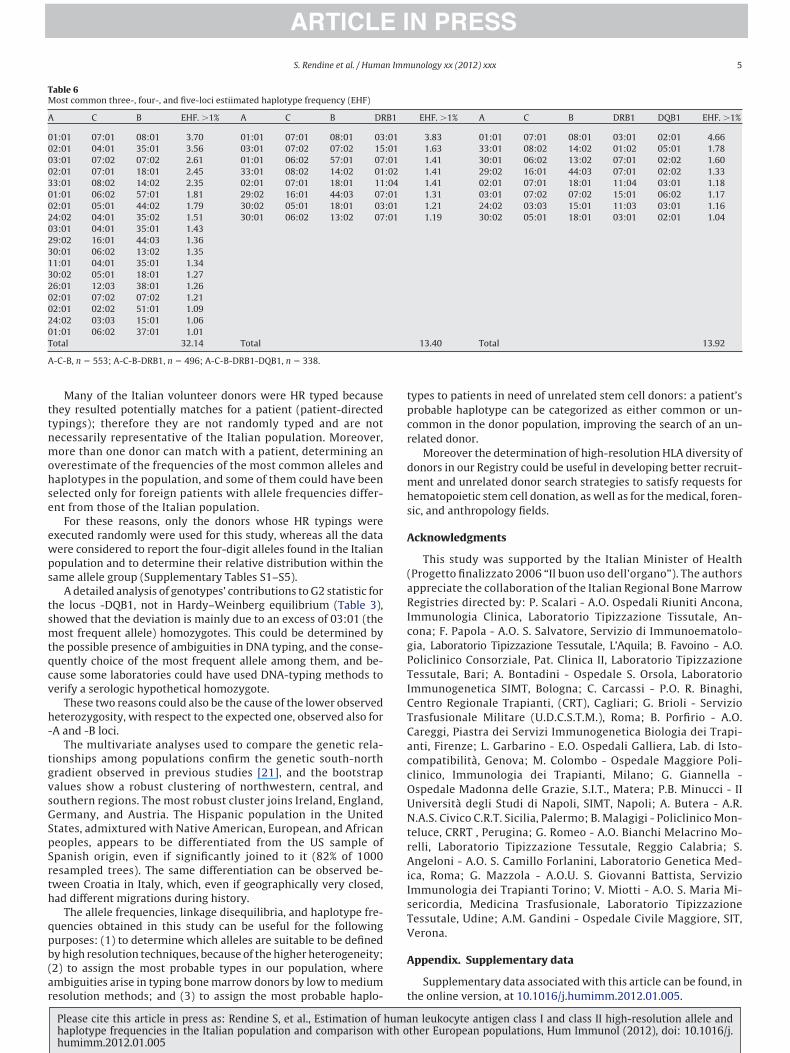
In Table 6 are shown the most common three-, four-, and five-ocus haplotypes with EHF �1%. At the top there is the haplotype:A*01: 01-B*08: 01-C*07:01-DRB1*03:01-DQB1*02:01 (hf � 4.7%).
3.3. Linkage disequilibria
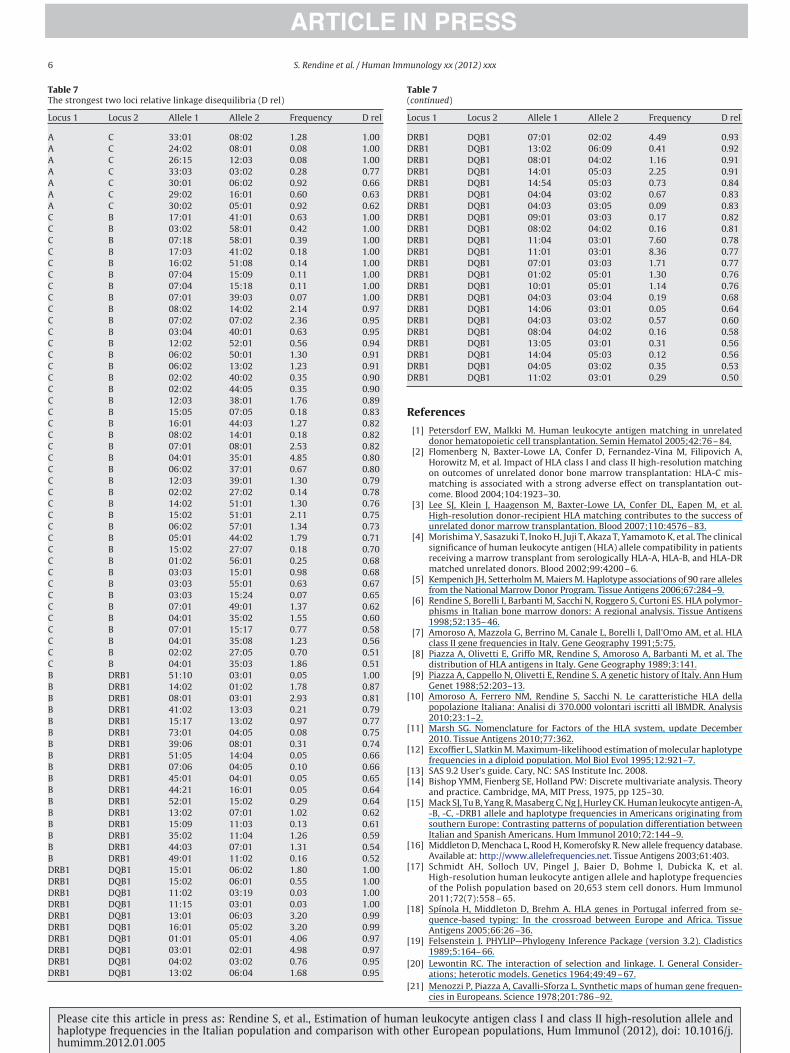
Table 7 shows the strongest relative LD values (Drel�0.50) forthe two loci haplotypes HLA-A-C, B-C, B-DRB1, DRB1-DQB1. Thestrongest associations were observed for the HLA-DRB1-DQB1 andHLA-B-C haplotypes.
4. Discussion
The HLA polymorphism in Italy was analyzed in previous stud-ies [6–10] based on the results of serologic or low-resolution typ-ings of volunteer donors enrolled in the IBMDR, themost completesource of HLA data, including at the moment more than 390,000individuals.
This study represents the first investigation in the Italian popu-lation of theHLA class I and class II allele and haplotype frequenciesat HR level, with the aim of estimating the frequencies of HLA-A, -B,
, -B, and DRB1 gene frequencies in the current Italian population and 17 other000 trees obtained resampling the original data. A cluster is considered “robust” ifscores.
Fig. 1. Dendrogram reconstructed by the maximum likelihood method using 58 HLA-A
able 5opulations used for the genetic comparison with their sample size and namesed in the dendrogram
Population (reference no.) Sample size Name
USA, Italian origin [15] 273 UitaUSA, Spanish origin [15] 279 UspaAustria [16] 200 CausCroatia [16] 150 ScroCzech Republic [16] 106 CczrEngland, Northwest [16] 298 Wennrance, Southeast [16] 130 Wfrsermany pop 6 [16] 8862 Cge6reland, Northern [16] 1000 Wirnreland, Southern [16] 250 WirstaHR (this study) S-ITadeira [16] 185 Smadoland [16] 200 Cpol1olish [17] 20,653 Cpol2ortugal Center [18] 145 SporSA-Eastern European [16] 558 UeeuSA-Hispanic pop2 [16] 2352 Uhisp
-C, -DR, and -DQ alleles with four digits.
n leukocyte antigen class I and class II high-resolution allele andther European populations, Hum Immunol (2012), doi: 10.1016/j.
ttnmohse
ewps
tsmtqcv
h-
tgvsGSpSrth
qpb(ar
tpcr
dmhs
A
(aRIcgPTICTCaccOUNtrAiIsTV
A
S. Rendine et al. / Human Immunology xx (2012) xxx 5
Many of the Italian volunteer donors were HR typed becausehey resulted potentially matches for a patient (patient-directedypings); therefore they are not randomly typed and are notecessarily representative of the Italian population. Moreover,ore than one donor can match with a patient, determining anverestimate of the frequencies of the most common alleles andaplotypes in the population, and some of them could have beenelected only for foreign patients with allele frequencies differ-nt from those of the Italian population.For these reasons, only the donors whose HR typings were
xecuted randomly were used for this study, whereas all the dataere considered to report the four-digit alleles found in the Italianopulation and to determine their relative distribution within theame allele group (Supplementary Tables S1–S5).A detailed analysis of genotypes’ contributions to G2 statistic for
he locus -DQB1, not in Hardy–Weinberg equilibrium (Table 3),howed that the deviation is mainly due to an excess of 03:01 (theost frequent allele) homozygotes. This could be determined by
he possible presence of ambiguities in DNA typing, and the conse-uently choice of the most frequent allele among them, and be-ause some laboratories could have used DNA-typing methods toerify a serologic hypothetical homozygote.These two reasons could also be the cause of the lower observed
eterozygosity, with respect to the expected one, observed also forA and -B loci.
The multivariate analyses used to compare the genetic rela-ionships among populations confirm the genetic south-northradient observed in previous studies [21], and the bootstrapalues show a robust clustering of northwestern, central, andouthern regions. The most robust cluster joins Ireland, England,ermany, and Austria. The Hispanic population in the Unitedtates, admixtured with Native American, European, and Africaneoples, appears to be differentiated from the US sample ofpanish origin, even if significantly joined to it (82% of 1000esampled trees). The same differentiation can be observed be-ween Croatia in Italy, which, even if geographically very closed,ad different migrations during history.The allele frequencies, linkage disequilibria, and haplotype fre-
uencies obtained in this study can be useful for the followingurposes: (1) to determine which alleles are suitable to be definedyhigh resolution techniques, because of the higher heterogeneity;2) to assign the most probable types in our population, wherembiguities arise in typing bonemarrow donors by low tomedium
Table 6Most common three-, four-, and five-loci estiimated haplotype frequency (EHF)
A C B EHF. �1% A C B DR
01:01 07:01 08:01 3.70 01:01 07:01 08:01 0302:01 04:01 35:01 3.56 03:01 07:02 07:02 1503:01 07:02 07:02 2.61 01:01 06:02 57:01 0702:01 07:01 18:01 2.45 33:01 08:02 14:02 0133:01 08:02 14:02 2.35 02:01 07:01 18:01 1101:01 06:02 57:01 1.81 29:02 16:01 44:03 0702:01 05:01 44:02 1.79 30:02 05:01 18:01 0324:02 04:01 35:02 1.51 30:01 06:02 13:02 0703:01 04:01 35:01 1.4329:02 16:01 44:03 1.3630:01 06:02 13:02 1.3511:01 04:01 35:01 1.3430:02 05:01 18:01 1.2726:01 12:03 38:01 1.2602:01 07:02 07:02 1.2102:01 02:02 51:01 1.0924:02 03:03 15:01 1.0601:01 06:02 37:01 1.01Total 32.14 Total
A-C-B, n � 553; A-C-B-DRB1, n � 496; A-C-B-DRB1-DQB1, n � 338.
esolution methods; and (3) to assign the most probable haplo- t
Please cite this article in press as: Rendine S, et al., Estimation of humahaplotype frequencies in the Italian population and comparison with ohumimm.2012.01.005
ypes to patients in need of unrelated stem cell donors: a patient’srobable haplotype can be categorized as either common or un-ommon in the donor population, improving the search of an un-elated donor.
Moreover the determination of high-resolution HLA diversity ofonors in our Registry could be useful in developing better recruit-ent and unrelated donor search strategies to satisfy requests forematopoietic stem cell donation, as well as for themedical, foren-ic, and anthropology fields.
cknowledgments
This study was supported by the Italian Minister of HealthProgetto finalizzato 2006 “Il buon uso dell’organo”). The authorsppreciate the collaboration of the Italian Regional BoneMarrowegistries directed by: P. Scalari - A.O. Ospedali Riuniti Ancona,mmunologia Clinica, Laboratorio Tipizzazione Tissutale, An-ona; F. Papola - A.O. S. Salvatore, Servizio di Immunoematolo-ia, Laboratorio Tipizzazione Tessutale, L’Aquila; B. Favoino - A.O.oliclinico Consorziale, Pat. Clinica II, Laboratorio Tipizzazioneessutale, Bari; A. Bontadini - Ospedale S. Orsola, Laboratoriommunogenetica SIMT, Bologna; C. Carcassi - P.O. R. Binaghi,entro Regionale Trapianti, (CRT), Cagliari; G. Brioli - Serviziorasfusionale Militare (U.D.C.S.T.M.), Roma; B. Porfirio - A.O.areggi, Piastra dei Servizi Immunogenetica Biologia dei Trapi-nti, Firenze; L. Garbarino - E.O. Ospedali Galliera, Lab. di Isto-ompatibilitÁ, Genova; M. Colombo - Ospedale Maggiore Poli-linico, Immunologia dei Trapianti, Milano; G. Giannella -spedale Madonna delle Grazie, S.I.T., Matera; P.B. Minucci - IIniversitÁ degli Studi di Napoli, SIMT, Napoli; A. Butera - A.R..A.S. Civico C.R.T. Sicilia, Palermo; B. Malagigi - PoliclinicoMon-eluce, CRRT , Perugina; G. Romeo - A.O. Bianchi Melacrino Mo-elli, Laboratorio Tipizzazione Tessutale, Reggio Calabria; S.ngeloni - A.O. S. Camillo Forlanini, Laboratorio Genetica Med-ca, Roma; G. Mazzola - A.O.U. S. Giovanni Battista, Serviziommunologia dei Trapianti Torino; V. Miotti - A.O. S. Maria Mi-ericordia, Medicina Trasfusionale, Laboratorio Tipizzazioneessutale, Udine; A.M. Gandini - Ospedale Civile Maggiore, SIT,erona.
ppendix. Supplementary data
Supplementary data associatedwith this article can be found, in
EHF. �1% A C B DRB1 DQB1 EHF. �1%
3.83 01:01 07:01 08:01 03:01 02:01 4.661.63 33:01 08:02 14:02 01:02 05:01 1.781.41 30:01 06:02 13:02 07:01 02:02 1.601.41 29:02 16:01 44:03 07:01 02:02 1.331.41 02:01 07:01 18:01 11:04 03:01 1.181.31 03:01 07:02 07:02 15:01 06:02 1.171.21 24:02 03:03 15:01 11:03 03:01 1.161.19 30:02 05:01 18:01 03:01 02:01 1.04
13.40 Total 13.92
B1
:01:01:01:02:04:01:01:01
he online version, at 10.1016/j.humimm.2012.01.005.
n leukocyte antigen class I and class II high-resolution allele andther European populations, Hum Immunol (2012), doi: 10.1016/j.
[
[
[
[[
[
[
[
[
[
[
[
TT
DRB1 DQB1 13:02 06:04 1.68 0.95
S. Rendine et al. / Human Immunology xx (2012) xxx6
Please cite this article in press as: Rendine S, et al., Estimation of humahaplotype frequencies in the Italian population and comparison with ohumimm.2012.01.005
References
[1] Petersdorf EW, Malkki M. Human leukocyte antigen matching in unrelateddonor hematopoietic cell transplantation. Semin Hematol 2005;42:76–84.
[2] Flomenberg N, Baxter-Lowe LA, Confer D, Fernandez-Vina M, Filipovich A,Horowitz M, et al. Impact of HLA class I and class II high-resolution matchingon outcomes of unrelated donor bone marrow transplantation: HLA-C mis-matching is associated with a strong adverse effect on transplantation out-come. Blood 2004;104:1923–30.
[3] Lee SJ, Klein J, Haagenson M, Baxter-Lowe LA, Confer DL, Eapen M, et al.High-resolution donor-recipient HLA matching contributes to the success ofunrelated donor marrow transplantation. Blood 2007;110:4576–83.
[4] MorishimaY, Sasazuki T, InokoH, Juji T, Akaza T, YamamotoK, et al. The clinicalsignificance of human leukocyte antigen (HLA) allele compatibility in patientsreceiving a marrow transplant from serologically HLA-A, HLA-B, and HLA-DRmatched unrelated donors. Blood 2002;99:4200–6.
[5] Kempenich JH, SetterholmM,MaiersM. Haplotype associations of 90 rare allelesfrom the National Marrow Donor Program. Tissue Antigens 2006;67:284–9.
[6] Rendine S, Borelli I, Barbanti M, Sacchi N, Roggero S, Curtoni ES. HLA polymor-phisms in Italian bone marrow donors: A regional analysis. Tissue Antigens1998;52:135–46.
[7] Amoroso A, Mazzola G, Berrino M, Canale L, Borelli I, Dall’Omo AM, et al. HLAclass II gene frequencies in Italy. Gene Geography 1991;5:75.
[8] Piazza A, Olivetti E, Griffo MR, Rendine S, Amoroso A, Barbanti M, et al. Thedistribution of HLA antigens in Italy. Gene Geography 1989;3:141.
[9] Piazza A, Cappello N, Olivetti E, Rendine S. A genetic history of Italy. Ann HumGenet 1988;52:203–13.
10] Amoroso A, Ferrero NM, Rendine S, Sacchi N. Le caratteristiche HLA dellapopolazione Italiana: Analisi di 370.000 volontari iscritti all IBMDR. Analysis2010;23:1–2.
11] Marsh SG. Nomenclature for Factors of the HLA system, update December2010. Tissue Antigens 2010;77:362.
12] Excoffier L, SlatkinM.Maximum-likelihood estimation ofmolecular haplotypefrequencies in a diploid population. Mol Biol Evol 1995;12:921–7.
13] SAS 9.2 User’s guide. Cary, NC: SAS Institute Inc. 2008.14] Bishop YMM, Fienberg SE, Holland PW: Discrete multivariate analysis. Theory
and practice. Cambridge, MA, MIT Press, 1975, pp 125–30.15] Mack SJ, TuB, YangR,Masaberg C,Ng J, Hurley CK.Human leukocyte antigen-A,
-B, -C, -DRB1 allele and haplotype frequencies in Americans originating fromsouthern Europe: Contrasting patterns of population differentiation betweenItalian and Spanish Americans. Hum Immunol 2010;72:144–9.
16] Middleton D,Menchaca L, RoodH, Komerofsky R. New allele frequency database.Available at: http://www.allelefrequencies.net. Tissue Antigens 2003;61:403.
17] Schmidt AH, Solloch UV, Pingel J, Baier D, Bohme I, Dubicka K, et al.High-resolution human leukocyte antigen allele and haplotype frequenciesof the Polish population based on 20,653 stem cell donors. Hum Immunol2011;72(7):558–65.
18] SpÎnola H, Middleton D, Brehm A. HLA genes in Portugal inferred from se-quence-based typing: In the crossroad between Europe and Africa. TissueAntigens 2005;66:26–36.
19] Felsenstein J. PHYLIP—Phylogeny Inference Package (version 3.2). Cladistics1989;5:164–66.
20] Lewontin RC. The interaction of selection and linkage. I. General Consider-ations; heterotic models. Genetics 1964;49:49–67.
Table 7(continued)
Locus 1 Locus 2 Allele 1 Allele 2 Frequency D rel
DRB1 DQB1 07:01 02:02 4.49 0.93DRB1 DQB1 13:02 06:09 0.41 0.92DRB1 DQB1 08:01 04:02 1.16 0.91DRB1 DQB1 14:01 05:03 2.25 0.91DRB1 DQB1 14:54 05:03 0.73 0.84DRB1 DQB1 04:04 03:02 0.67 0.83DRB1 DQB1 04:03 03:05 0.09 0.83DRB1 DQB1 09:01 03:03 0.17 0.82DRB1 DQB1 08:02 04:02 0.16 0.81DRB1 DQB1 11:04 03:01 7.60 0.78DRB1 DQB1 11:01 03:01 8.36 0.77DRB1 DQB1 07:01 03:03 1.71 0.77DRB1 DQB1 01:02 05:01 1.30 0.76DRB1 DQB1 10:01 05:01 1.14 0.76DRB1 DQB1 04:03 03:04 0.19 0.68DRB1 DQB1 14:06 03:01 0.05 0.64DRB1 DQB1 04:03 03:02 0.57 0.60DRB1 DQB1 08:04 04:02 0.16 0.58DRB1 DQB1 13:05 03:01 0.31 0.56DRB1 DQB1 14:04 05:03 0.12 0.56DRB1 DQB1 04:05 03:02 0.35 0.53DRB1 DQB1 11:02 03:01 0.29 0.50
able 7he strongest two loci relative linkage disequilibria (D rel)
Locus 1 Locus 2 Allele 1 Allele 2 Frequency D rel
A C 33:01 08:02 1.28 1.00A C 24:02 08:01 0.08 1.00A C 26:15 12:03 0.08 1.00A C 33:03 03:02 0.28 0.77A C 30:01 06:02 0.92 0.66A C 29:02 16:01 0.60 0.63A C 30:02 05:01 0.92 0.62C B 17:01 41:01 0.63 1.00C B 03:02 58:01 0.42 1.00C B 07:18 58:01 0.39 1.00C B 17:03 41:02 0.18 1.00C B 16:02 51:08 0.14 1.00C B 07:04 15:09 0.11 1.00C B 07:04 15:18 0.11 1.00C B 07:01 39:03 0.07 1.00C B 08:02 14:02 2.14 0.97C B 07:02 07:02 2.36 0.95C B 03:04 40:01 0.63 0.95C B 12:02 52:01 0.56 0.94C B 06:02 50:01 1.30 0.91C B 06:02 13:02 1.23 0.91C B 02:02 40:02 0.35 0.90C B 02:02 44:05 0.35 0.90C B 12:03 38:01 1.76 0.89C B 15:05 07:05 0.18 0.83C B 16:01 44:03 1.27 0.82C B 08:02 14:01 0.18 0.82C B 07:01 08:01 2.53 0.82C B 04:01 35:01 4.85 0.80C B 06:02 37:01 0.67 0.80C B 12:03 39:01 1.30 0.79C B 02:02 27:02 0.14 0.78C B 14:02 51:01 1.30 0.76C B 15:02 51:01 2.11 0.75C B 06:02 57:01 1.34 0.73C B 05:01 44:02 1.79 0.71C B 15:02 27:07 0.18 0.70C B 01:02 56:01 0.25 0.68C B 03:03 15:01 0.98 0.68C B 03:03 55:01 0.63 0.67C B 03:03 15:24 0.07 0.65C B 07:01 49:01 1.37 0.62C B 04:01 35:02 1.55 0.60C B 07:01 15:17 0.77 0.58C B 04:01 35:08 1.23 0.56C B 02:02 27:05 0.70 0.51C B 04:01 35:03 1.86 0.51B DRB1 51:10 03:01 0.05 1.00B DRB1 14:02 01:02 1.78 0.87B DRB1 08:01 03:01 2.93 0.81B DRB1 41:02 13:03 0.21 0.79B DRB1 15:17 13:02 0.97 0.77B DRB1 73:01 04:05 0.08 0.75B DRB1 39:06 08:01 0.31 0.74B DRB1 51:05 14:04 0.05 0.66B DRB1 07:06 04:05 0.10 0.66B DRB1 45:01 04:01 0.05 0.65B DRB1 44:21 16:01 0.05 0.64B DRB1 52:01 15:02 0.29 0.64B DRB1 13:02 07:01 1.02 0.62B DRB1 15:09 11:03 0.13 0.61B DRB1 35:02 11:04 1.26 0.59B DRB1 44:03 07:01 1.31 0.54B DRB1 49:01 11:02 0.16 0.52DRB1 DQB1 15:01 06:02 1.80 1.00DRB1 DQB1 15:02 06:01 0.55 1.00DRB1 DQB1 11:02 03:19 0.03 1.00DRB1 DQB1 11:15 03:01 0.03 1.00DRB1 DQB1 13:01 06:03 3.20 0.99DRB1 DQB1 16:01 05:02 3.20 0.99DRB1 DQB1 01:01 05:01 4.06 0.97DRB1 DQB1 03:01 02:01 4.98 0.97DRB1 DQB1 04:02 03:02 0.76 0.95
21] Menozzi P, Piazza A, Cavalli-Sforza L. Synthetic maps of human gene frequen-cies in Europeans. Science 1978;201:786–92.
n leukocyte antigen class I and class II high-resolution allele andther European populations, Hum Immunol (2012), doi: 10.1016/j.
Related Documents