Short Article Genome-wide risk prediction of common diseases across ancestries in one million people Highlights d An evaluation of cross-ancestry transferability of polygenic risk scores d Four common diseases in four global ancestry groups and across Europe were studied d PRS transferability was high across European ancestry and lowest for African ancestry d PRS transferability was good across population substructures in Finland Authors Nina Mars, Sini Kerminen, Yen-Chen A. Feng, ..., Andrea Ganna, Alicia R. Martin, Samuli Ripatti Correspondence samuli.ripatti@helsinki.fi In brief Combining six biobanks in Europe, the United States, and Asia, Mars et al. evaluated cross-ancestry transferability of polygenic risk scores for four common diseases: coronary artery disease, type 2 diabetes, and breast and prostate cancer. They observed good cross-ancestry transferability between individuals with different European ancestry, but poorer transferability in individuals of African, South Asian, and East Asian ancestry, which highlights the need for diversity in polygenic risk score development for clinical translation. Mars et al., 2022, Cell Genomics 2, 100118 April 13, 2022 ª 2022 The Author(s). https://doi.org/10.1016/j.xgen.2022.100118 ll

Welcome message from author
This document is posted to help you gain knowledge. Please leave a comment to let me know what you think about it! Share it to your friends and learn new things together.
Transcript

Short Article
Genome-wide risk predict
ion of common diseasesacross ancestries in one million peopleHighlights
d An evaluation of cross-ancestry transferability of polygenic
risk scores
d Four common diseases in four global ancestry groups and
across Europe were studied
d PRS transferability was high across European ancestry and
lowest for African ancestry
d PRS transferability was good across population
substructures in Finland
Mars et al., 2022, Cell Genomics 2, 100118April 13, 2022 ª 2022 The Author(s).https://doi.org/10.1016/j.xgen.2022.100118
Authors
Nina Mars, Sini Kerminen,
Yen-Chen A. Feng, ..., Andrea Ganna,
Alicia R. Martin, Samuli Ripatti
In brief
Combining six biobanks in Europe, the
United States, and Asia, Mars et al.
evaluated cross-ancestry transferability
of polygenic risk scores for four common
diseases: coronary artery disease, type 2
diabetes, and breast and prostate cancer.
They observed good cross-ancestry
transferability between individuals with
different European ancestry, but poorer
transferability in individuals of African,
South Asian, and East Asian ancestry,
which highlights the need for diversity in
polygenic risk score development for
clinical translation.
ll
OPEN ACCESS
llShort Article
Genome-wide risk prediction of common diseasesacross ancestries in one million peopleNina Mars,1 Sini Kerminen,1 Yen-Chen A. Feng,2,3,4,20 Masahiro Kanai,3,4,5 Kristi Lall,6 Laurent F. Thomas,7,8,9
Anne Heidi Skogholt,8 Pietro della Briotta Parolo,1 The Biobank Japan Project,10 FinnGen,22 Benjamin M. Neale,3,4,11
Jordan W. Smoller,2,4,11 Maiken E. Gabrielsen,8,12 Kristian Hveem,8 Reedik Magi,6 Koichi Matsuda,13
Yukinori Okada,14,15,16,21 Matti Pirinen,1,17,18 Aarno Palotie,1,3,4 Andrea Ganna,1,3,19 Alicia R. Martin,3,4,5
and Samuli Ripatti1,17,19,23,*1Institute for Molecular Medicine Finland, FIMM, HiLIFE, University of Helsinki, Biomedicum 2U, Tukholmankatu 8, 00290 Helsinki, Finland2Psychiatric and Neurodevelopmental Genetics Unit, Center for Genomic Medicine, Massachusetts General Hospital, Boston, MA, USA3Analytic and Translational Genetics Unit, Department of Medicine, Massachusetts General Hospital, Boston, MA, USA4Stanley Center for Psychiatric Research, Broad Institute of MIT and Harvard, Cambridge, MA, USA5Program in Medical and Population Genetics, Broad Institute of MIT and Harvard, Cambridge, MA, USA6Estonian Genome Centre, Institute of Genomics, University of Tartu, Tartu, Estonia7Department of Clinical and Molecular Medicine, Norwegian University of Science and Technology, Trondheim, Norway8K. G. Jebsen Center for Genetic Epidemiology, Department of Public Health and Nursing, Faculty of Medicine and Health, Norwegian
University of Science and Technology, Trondheim, Norway9BioCore - Bioinformatics Core Facility, Norwegian University of Science and Technology, Trondheim, Norway10Institute of Medical Science, The University of Tokyo, Tokyo, Japan11Harvard Medical School, Boston, MA, USA12HUNT Research Center, Department of Public Health and Nursing, Faculty of Medicine and Health Sciences, Norwegian University of
Science and Technology, Trondheim, Norway13Department of Computational Biology and Medical Sciences, Graduate school of Frontier Sciences, the University of Tokyo, Tokyo, Japan14Department of Statistical Genetics, Osaka University Graduate School of Medicine, Suita, Japan15Laboratory of Statistical Immunology, Immunology Frontier Research Center (WPI-IFReC), Osaka University, Suita, Japan16Integrated Frontier Research for Medical Science Division, Institute for Open and Transdisciplinary Research Initiatives, Osaka University,
Suita, Japan17Department of Public Health, University of Helsinki, Helsinki, Finland18Department of Mathematics and Statistics, University of Helsinki, Helsinki, Finland19Broad Institute of MIT and Harvard, Cambridge, MA, USA20Institute of Epidemiology and Preventive Medicine, College of Public Health, National Taiwan University, Taipei, Taiwan21Laboratory for Systems Genetics, RIKEN Center for Integrative Medical Sciences, Kanagawa, Japan22Further details can be found in the supplemental information23Lead contact*Correspondence: [email protected]
https://doi.org/10.1016/j.xgen.2022.100118
SUMMARY
Polygenic risk scores (PRS) measure genetic disease susceptibility by combining risk effects across thegenome. For coronary artery disease (CAD), type 2 diabetes (T2D), and breast and prostate cancer, we per-formed cross-ancestry evaluation of genome-wide PRSs in six biobanks in Europe, the United States, andAsia. We studied transferability of these highly polygenic, genome-wide PRSs across global ancestries,within European populations with different health-care systems, and local population substructures in apopulation isolate. All four PRSs had similar accuracy across European and Asian populations, with poorertransferability in the smaller group of individuals of African ancestry. The PRSs had highly similar effect sizesin different populations of European ancestry, and in early- and late-settlement regions with different recentpopulation bottlenecks in Finland. Comparing genome-wide PRSs to PRSs containing a smaller number ofvariants, the highly polygenic, genome-wide PRSs generally displayed higher effect sizes and better trans-ferability across global ancestries. Our findings indicate that in the populations investigated, the currentgenome-wide polygenic scores for common diseases have potential for clinical utility within differenthealth-care settings for individuals of European ancestry, but that the utility in individuals of African ancestryis currently much lower.
Cell Genomics 2, 100118, April 13, 2022 ª 2022 The Author(s). 1This is an open access article under the CC BY-NC-ND license (http://creativecommons.org/licenses/by-nc-nd/4.0/).

Table
1.Stu
dychara
cteristics
Biobank
Ancestry
Sample
size
Age,
mean(SD)
Women,%
CAD
T2D
Breastcancer
Prostate
cancer
Cases
N=88,830
AAO,
mean(SD)
Cases
N=110,685
AAO,
mean(SD)
Cases,
N=32,922
AAO,
mean(SD)
Cases,
N=26,700
AAO,
mean(SD)
Europeanancestry(n
=807,793)
EstonianBiobank
Estonia
EUR
110,597
43.4
(16.0)
67.3
5,064
67.5
(11.9)
7,066
60.9
(12.7)
1,379
59.5
(13.4)
1,202
68.7
(9.2)
FinnGen
Finland
EUR
258,402
60.3
(17.1)*
56.5
25,706
64.9
(11.8)
37,001
60.1
(11.9)
11,573
59.0
(11.6)
8,709
68.5
(8.1)
HUNT
Norw
ay
EUR
69,422
50.8
(17.0)
53.0
6,594
69.0
(12.5)
5,228
68.1
(13.4)
1,731
61.7
(13.4)
2,224
70.6
(9.2)
MGBBiobank
UnitedStates
EUR
25,696
60.0
(16.5)
53.1
3,206
–5,182
–1,513
–1,593
–
UKBiobank
UnitedKingdom
EUR
343,676
56.9
(8.0)
53.7
17,986
62.1
(8.9)
13,616
54.6
(8.5)
11,075
54.0
(8.1)
7,429
59.7
(6.2)
Otherancestry(n
=195,507)
BioBankJapan
Japan
EAS
178,726
63.1
(14.0)
46.3
29,080
61.7
40,121
56.2
5,316
56.1
5,192
71.1
MGBBiobank
UnitedStates
AFR
1,535
54.1
(16.3)
61.4
285
–660
–64
–80
–
UKBiobank
UnitedKingdom
AFR
7,618
51.9
(8.1)
57.0
169
56.9
(10.3)
691
50.2
(8.9)
132
50.2
(9.1)
199
57.4
(7.4)
UKBiobank
UnitedKingdom
SAS
7,628
53.4
(8.5)
46.1
740
58.6
(9.7)
1,120
50.0
(8.7)
139
51.2
(7.9)
72
59.6
(7.2)
EUR=European,E
AS=EastAsian,A
FR=African(self-reportedAfrican/C
aribbeaninUKBiobank),SAS=South
Asian,C
AD=coronary
artery
disease,T
2D=type2diabetes,A
AO=ageato
nset,
SD=standard
deviation.Diseasedefinitionsare
listedbycohortinSTARMethods.In
HUNT,weshowtheageatbaselineforthoseparticipatingineitherHUNT2orHUNT3,andameanofthese
baselineagesforindividuals
participatingin
both.*Ageattheendoffollo
w-up.
2 Cell Genomics 2, 100118, April 13, 2022
Short Articlell
OPEN ACCESS
INTRODUCTION
Polygenic risk scores (PRSs) capture an individual’s genetic sus-
ceptibility to diseases by summarizing the estimated polygenic
effects across the genome. PRSs have shown great promise
for improving detection of high-risk individuals in many common
complex diseases, such as cardiometabolic diseases and com-
mon cancers.1–4 However, these studies have been heavily
biased toward individuals of European ancestry and have pro-
vided limited understanding about the transferability of the
PRSs across ancestries. This currently limits the potential clinical
utility of the PRS and may lead to exacerbation of health dispar-
ities in implementation of the PRSs across different societies and
health-care systems.5
We evaluated the variability of the PRS risk estimates across
multiple populations and ancestry groups in four common com-
plex diseases that have shown promise beyond routinely used
clinical risk scores: coronary artery disease (CAD), type 2 dia-
betes (T2D), breast cancer, and prostate cancer.2,6–10 We com-
bined genome-wide genotype data with disease endpoints for
four ancestry groups across six biobanks covering onemillion in-
dividuals. We calculated genome-wide PRSs, obtaining input
weights from genome-wide association studies (GWASs) pub-
lished and made available by large disease genetics consor-
tia.11–14 These consortia GWASs and corresponding linkage
disequilibrium (LD) reference panels consisted primarily of indi-
viduals of European ancestry, and they provided weights for ge-
netic variants used for generating the PRS. This reflects the cur-
rent reality where most PRSs are developed and tested in
individuals of European ancestry. To extensively assess the
impact of Eurocentric study biases on PRS portability, we per-
formed a cross-ancestry evaluation of our genome-wide PRSs
of on three levels: across global ancestries, across European
populations, and locally within Finland, a European country
with a well-known population substructure.15
RESULTS
The descriptive statistics for the six biobank studies are shown in
Table 1. These include BioBank Japan (n = 178,726), Estonian
Biobank (n = 110,597), FinnGen (n = 258,402), The Trøndelag
Health Study (HUNT, n = 69,422), Mass General Brigham
(MGB) Biobank (n = 27,231), and UK Biobank (n = 358,922).
The represented ancestries are European, South Asian, East
Asian, and African ancestry. The total number of cases was
88,830 for CAD, 110,685 for T2D, 32,922 for breast cancer,
and 26,700 for prostate cancer, and the mean age ranged from
43.4 years in Estonian Biobank to 63.1 in BioBank Japan. The
proportion of women ranged from 46.3% in BioBank Japan to
67.3% in Estonian Biobank.
For each disease, our main PRSs were calculated with LDpred
(>6 million variants in each PRS; Table S1), using weights from
the largest published GWASs that do not contain data from the
UK Biobank.11–14 The PRSs were rescaled in each dataset and
for each ancestry subset, to havemean 0 and standard deviation
(SD) at 1. We then assessed the transferability of PRSs by
comparing the odds ratio (OR) estimates between biobanks
and ancestry groups on three levels of variation in ancestry: (1)

A
B
C
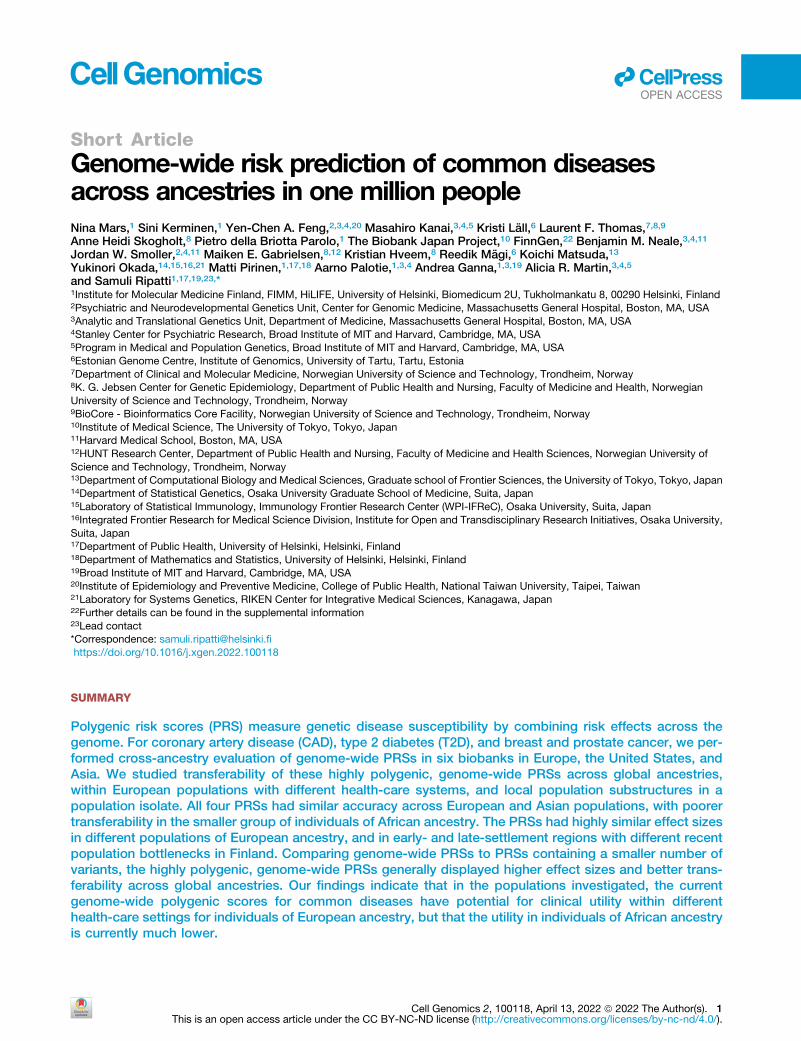
Figure 1. Effect sizes of polygenic risk scores (PRSs) across ancestries
(A) The results across ancestry groups, with ‘‘European’’ representing a pooled OR of effect sizes from (B).
(B) The results across different populations with European ancestry.
(C) The results across early- and late-settlement regions in Finland (FinnGen).
(legend continued on next page)
Cell Genomics 2, 100118, April 13, 2022 3
Short Articlell
OPEN ACCESS

Short Articlell
OPEN ACCESS
across global ancestries, (2) across populations with European
ancestry but with varying health-care systems, and (3) across
subpopulations in Finland, a country with a nationwide uniform
health-care system and a well-known early- and late-settlement
division in population structure, with previous evidence of PRS
stratification.16
Figure 1A shows the ORs per SD increase in PRS across the
three ancestry groups: European, South and East Asian, and Af-
rican ancestries. The OR estimates ranged from 1.10 to 1.53 for
CAD, from 1.24 to 1.66 for T2D, from 0.90 to 1.49 for breast can-
cer, and from 1.35 to 2.21 for prostate cancer (Table S2). For all
four diseases, the effect sizes were lowest in individuals of Afri-
can ancestry and highest in individuals of European ancestry,
followed by individuals of South and East Asian ancestry with
similar or slightly lower effect sizes. In breast cancer, we did
not detect an association for women of African ancestry (OR
1.12, 95% CI 0.93–1.35 in UK Biobank, OR 0.90, 0.69–1.35 in
MGBBiobank), but looking at the effects across different LDpred
parameters for fraction of causal variants in UK Biobank (Fig-
ure S1), the PRS would be associated with OR 1.40 (1.13–1.72)
in individuals of African ancestry, had the fraction been chosen
based on individuals of African ancestry, instead of individuals
of European ancestry. In other diseases, the choice of the frac-
tion had only a fairly small effect.
Figure 1B compares the effect sizes across different popula-
tions with European ancestry. Overall, the variation between es-
timates was much smaller in European ancestry samples,
ranging from 1.35 to 1.64 for CAD, from 1.46 to 1.78 for T2D,
from 1.45 to 1.50 for breast cancer, and from 1.66 to 1.96 for
prostate cancer. For CAD and T2D, the estimates were highest
in the UK Biobank and lowest in MGB Biobank. Breast cancer
estimates were highly similar across all biobanks, and prostate
cancer estimates were highest in Finns.
Figure 1C shows the estimates in early- and late-settlement re-
gions in Finland. The effect sizes were highly consistent
throughout the regions for all four diseases. The most similar ef-
fect sizes were again detected for breast cancer. The findings
were highly similar also across a more detailed set of geographic
regions (Figure S2).
Lastly, we compared in UK Biobank the LDpred PRSs to two
other types of PRSs generated primarily in individuals of Euro-
pean ancestry: (1) to previously published PRSs containing a
smaller number of variants3,10,17,18 and (2) to genome-wide
PRSs generated with PRS-CS, which restricts analyses to
HapMap3 variants (Figure 2, Table S3). The highest effect size
was observed in 2/4 diseases (European) and 3/4 diseases
(South Asian) for PRS-CS. In T2D, the effect sizes were fairly
similar across the three PRSs. In African/Caribbean ancestry,
the best-performing PRS varied by disease: in CAD, the LDpred
and PRS-CS had the highest and highly similar effects; in T2D,
LDpred had the highest effect size, but the difference between
the different PRSs was fairly small; in breast cancer, the PRS-
CS PRS had the highest effect size, with a considerable drop
ORs with 95% CIs (CI) are shown for 1 SD increase in PRS. See Table 1 for resp
obtained by random effects meta-analysis of effects shown in (B). In (C), out of
abroad, 4,304 born in regions ceded to the Soviet Union, 182 born in Aland Isla
(C) is provided in the description of FinnGen in STAR Methods. CAD = coronary
4 Cell Genomics 2, 100118, April 13, 2022
(to 27% of the effect size) with the LDpred PRS and a moderate
drop to 70% for the limited-variant PRS; in prostate cancer, the
limited-variant PRS had the highest effect size, with consider-
able effect size drops with the other PRSs.
Looking at the transferability of the different CAD PRSs across
ancestries in UK Biobank (Figure 2; Table S3), the best transfer-
ability was observed for the PRS-CS PRS (drop to 90% for South
Asian ancestry, and to 56% for African/Caribbean ancestry,
compared to European ancestry). For the T2D PRSs, the trans-
ferability between PRSs was highly similar (drops to 85%–91%
for South Asian ancestry and to 58%–65% for African/
Caribbean ancestry). For the breast cancer PRSs, the best trans-
ferability to South Asian ancestry was observed for the LDpred
PRS (drop to 95%) and for the PRS-CS PRS (drop to 83%),
with a drop to 62% for the limited-variant PRS. For the breast
cancer PRSs, the best transferability to African/Caribbean
ancestry was observed for the PRS-CS PRS (drop to 74%), fol-
lowed by the limited-variant PRS (drop to 60%). For prostate
cancer PRSs, all PRSs showed good transferability to South
Asian ancestry, but the best transferability to African/
Caribbean ancestry was observed for the limited-variant PRS.
DISCUSSION
By combining data across six biobankswith onemillion samples,
we show that in four major diseases with great public health
impact and well-developed genome-wide PRSs—CAD, T2D,
breast and prostate cancer—the scores transfer well across Eu-
ropean and, to a lesser extent, South and East Asian popula-
tions. We also show that the PRSs transfer much more poorly
to individuals of African ancestry. Within populations of Euro-
pean ancestry, we observed only small variability in risk esti-
mates. Within Finland, a country with well-documented genetic
differences between the early-settlement region in the South
and West and the late-settlement region in the East and North,
we observed essentially no variability in risk estimates.16
Several studies have looked at trans-ancestry performance of
PRSs for common diseases, but the majority of such studies
have used PRSs containing a small number of variants, consisting
of approximately tens to a few hundred genetic variants.18–29
Contemporary PRSs have focused on liberalizing variant inclusion
to build genome-wide PRSs, which typically contain hundreds of
thousands to a few million variants.30–33 But, only a few studies
have assessed transferability of such PRSs across ancestries,34–
36 with even fewer comparing these genome-wide PRSs to ones
containing a smaller number of variants.31,34,37 To our knowledge,
this is the largest study to date evaluating these genome-wide Eu-
ropean ancestry PRSs across ancestries, with additional evalua-
tion of effects across different cohorts of European ancestry, and
within a country with well-known east-west differences. Our order
of effect sizes by ancestry—largest in Europeans, followed by
South and East Asians, with generally lowest effect sizes detected
in Africans—are consistent with population history, and they are in
ective number of cases and controls. The pooled OR (‘‘European’’) in (A) was
258,402 in FinnGen, 8,117 individuals were excluded, comprising 3,157 born
nds, and 474 with missing data. Detailed information of the Finnish regions in
artery disease, T2D = type 2 diabetes.

1.0
1.5
2.0
2.5
3.0
CAD T2D
Breast cancer
Prostate ca
ncer
OR
per
SD
(95%
CI)
UK Biobank, European
1.0
1.5
2.0
2.5
3.0
CAD T2D
Breast cancer
Prostate ca
ncer
OR
per
SD
(95%
CI)
UK Biobank, South Asian
1.0
1.5
2.0
2.5
3.0
CAD T2D
Breast cancer
Prostate ca
ncer
OR
per
SD
(95%
CI)
UK Biobank, African / Caribbean
Limited−variant PRS
LDpred
PRS−CS
Figure 2. Comparison of polygenic risk scores (PRSs) generated with different methods
The figure shows a comparison of three types of PRSs in UKBiobank: previously publishedPRSs using a smaller number of variants (‘‘limited-variant PRS’’),3,10,17,18
PRSs generated with LDpred, and PRSs generated with PRS-CS. ORs with 95%CI are shown across ancestries for 1 SD increase in the PRS. Detailed effect size
comparisons are in Table S3. CAD = coronary artery disease, T2D = type 2 diabetes. Table 1 shows the respective number of cases and controls.
Short Articlell
OPEN ACCESS
line with the previous studies using a smaller number of variants,
with further evidence from comparisons of prediction accuracy
of anthropometric traits and lipid biomarkers.5,19,22,24,26,34,38,39
The genome-wide PRSs were also compared to the PRSs
containing a smaller number of variants. In general, the
genome-wide PRSs, particularly PRSs generated with PRS-
CS, conferred the largest effect sizes. The limited-variant PRS
in prostate cancer was an exception, but it is based on a twice
as large and a diverse GWAS18 compared to the LDpred and
PRS-CS PRSs for prostate cancer,13 which may explain why it
performed best in individuals of European ancestry. Compared
to the PRSs containing a smaller number of variants, the
genome-wide PRSs showed generally better performance and
higher transferability to individuals of South Asian and African
ancestry.13,18 The main exception was African ancestry, where
the prostate cancer PRS consisting of 269 variants outper-
formed the LDpred and PRS-CS PRSs. One reason for this
may be that theGWAS underlying the 269 PRSs is highly diverse,
containing multiple cohorts of individuals of African ancestry,18
whereas in the other PRSs across the diseases, the GWAS
was primarily based on individuals of European ancestry. This
finding further highlights the need for more diversity in genetic
discovery studies and the need for research on optimizing
trans-ancestry polygenic risk prediction.
Finland has two well-known genetic subpopulations, for which
population stratification has been observed previously.16 Previ-
ous studies have shown geographical differences in allele fre-
quencies of rare high-impact variants for recessive Mendelian
diseases as well as for common diseases in Finland with well-
documented genetic differences between early- and late-settle-
ment regions.40,41 We therefore studied whether such gradients
would impact the utility of PRSs. Despite these genetic substruc-
tures, our results showed highly similar effect sizes between
early- and late-settlement regions, indicating that fine-scale
population structures and recent genetic bottlenecks did not
affect the transferability of the PRSs.
PRSs have been particularly promising for identifying individ-
uals at risk for early-onset disease and for improving accuracy
of risk estimation in individuals carryingmutations in high-impact
disease-causing genes, such as known breast cancer suscepti-
bility genes.2,6,42 There are two key steps in creating risk func-
tions for PRS: (1) calculation of weighted sums of the genetic var-
iants using effect sizes from an independent dataset and (2)
estimating the predictive accuracy and the dose response be-
tween the PRS and the disease risk. Ancestry needs to be
considered in both steps to allow for transferability of PRSs.
Large-scale GWASs widely used for drawing weights for the var-
iants are currently heavily biased toward individuals of European
ancestry. This makes them less optimal for generating PRSs for
individuals of other ancestries due to, for example, differing allele
frequencies and genetic architectures across populations, as
well as varying LD patterns.38 The PRS distribution in each
ancestry group is also dependent on these same genetic factors
and can therefore create considerable differences of the raw
PRS distributions between the ancestry groups.43 The optimal
way to adjust for these differences is to have a reference genome
that correspond to the target ancestry group. In addition, the
PRS distributions may differ due to methodological choices
used for constructing the PRS,26 and it is likely that rescaling
should be done only for similarly processed datasets, to reduce
the influence of factors such as genotype quality control and
technical artifacts.
Several measures can be undertaken to improve the utility of
PRSs across ancestries. Most importantly, we need better repre-
sentation of different ancestries in GWASs.18,44–48 Of the four
GWASs used for generating our genome-wide PRSs, the propor-
tion of individuals of other than European ancestry was highest
for CAD (23%), the majority of whom were of South or East Asian
ancestry. In breast cancer, the proportion of individuals of East
Asian ancestry was 11%, whereas the T2D and prostate cancer
GWASswere limited to individualsofEuropeanancestry. Similarly,
we need strategies to account for genetic admixture, as well
as careful alignment of the PRSs against adequate reference
sampleswith respect to ancestry and, when relevant, with respect
to relevant subpopulations.46,49–51 Several tools are currently
being developed for improved trans-ancestry polygenic risk
Cell Genomics 2, 100118, April 13, 2022 5

Short Articlell
OPEN ACCESS
prediction,52,53 and the transferability could also be improved by
leveraging information about functional annotations.54
Limitations of the studyThis study should be interpreted in light of certain limitations.
Despite the large number of individuals studied, the sample size
in South Asian or African ancestries remained fairly small, partic-
ularly for analyses on breast and prostate cancer. While our com-
parisons show relatively small differences between cohorts with
European ancestry, it may be that the risk estimates vary consid-
erably between individuals due to, for example, admixed
ancestry, and the role of admixture in this variability warrants
further research. Differences in predictive performance and
dose response can reflect truedifferences in genetic architecture,
but the results can be affected by multiple other population and
reference sample-related factors, such as age and sex distribu-
tion, disease definitions, sample ascertainment, as well as varia-
tion in environmental risk factors.55 This study involved biobanks
with hospital-based ascertainment (BioBank Japan, MGB Bio-
bank) and population-based ascertainment (Estonian Biobank,
HUNT, UK Biobank), as well as a mixture of the two (FinnGen).
Phenotyping differences between datasets existed, ranging
from single ICD-based records to high-quality cancer and medi-
cation reimbursement registries. Despite the differences across
countries, health systems, and biobank characteristics, we
observed good transferability of all PRSs across similar popula-
tions. Our observations may help in defining the population and
ancestry-specific reference samples for PRS calculation in the
four diseases studied. Moreover, differences in risk between an-
cestries may arise from a range of factors, including socioeco-
nomic and health-care system-related factors and differing levels
of traditional disease risk factors.56–58 They may also reflect
differing impacts of clinical risk factors: for instance, weight gain
is considered particularly detrimental for risk of T2D in Asians.59
In conclusion, we observed good transferability of largely Eu-
ropean ancestry-derived, genome-wide PRSs for CAD, T2D,
breast and prostate cancer across biobanks of European and
Asian ancestry, but not for individuals of African ancestry. The
highly polygenic, genome-wide PRSs generally displayed better
transferability across ancestries than PRSs containing a smaller
number of variants. This large-scale study further emphasizes
the pressing need for diversity in genetic studies and the need
for population and ancestry-based reference samples. Without
prioritizing diversity in PRS evaluations and translation efforts,
widely adopting PRSs to clinical caremay exacerbate health dis-
parities, and efforts to overcome the lack of diversity have great
potential to improve health outcomes across ancestries.
STAR+METHODS
Detailed methods are provided in the online version of this paper
and include the following:
d KEY RESOURCES TABLE
d RESOURCE AVAILABILITY
6 Ce
B Lead contact
B Materials availability
B Data and code availability
ll Genomics 2, 100118, April 13, 2022
d EXPERIMENTAL MODEL AND SUBJECT DETAILS
B BioBank Japan
B Estonian Biobank
B FinnGen
B HUNT
B MGB biobank
B UK biobank
d METHOD DETAILS
B Polygenic risk scores
d QUANTIFICATION AND STATISTICAL ANALYSIS
SUPPLEMENTAL INFORMATION
Supplemental information can be found online at https://doi.org/10.1016/j.
xgen.2022.100118.
CONSORTIA
The members of the FinnGen Consortium are Aarno Palotie, Mark Daly,
Bridget Riley-Gills, Howard Jacob, Dirk Paul, Athena Matakidou, Adam Platt,
Heiko Runz, Sally John, George Okafo, Nathan Lawless, Robert Plenge, Jo-
seph Maranville, Mark McCarthy, Julie Hunkapiller, Margaret G. Ehm, Kirsi
Auro, Simonne Longerich, Caroline Fox, Anders Malarstig, Katherine Klinger,
Deepak Raipal, Eric Green, Robert Graham, Robert Yang, Chris O’Donnell,
Tomi P. Makela, Jaakko Kaprio, Petri Virolainen, Antti Hakanen, Terhi Kilpi,
Markus Perola, Jukka Partanen, Anne Pitkaranta, Juhani Junttila, Raisa Serpi,
Tarja Laitinen, Veli-Matti Kosma, Jari Laukkanen, Marco Hautalahti, Outi Tuo-
vila, Raimo Pakkanen, Jeffrey Waring, Bridget Riley-Gillis, Fedik Rahimov,
Ioanna Tachmazidou, Chia-Yen Chen, Heiko Runz, Zhihao Ding, Marc Jung,
Shameek Biswas, Rion Pendergrass, Julie Hunkapiller, Margaret G. Ehm, Da-
vid Pulford, Neha Raghavan, Adriana Huertas-Vazquez, Jae-Hoon Sul, Anders
Malarstig, Xinli Hu, Katherine Klinger, Robert Graham, Eric Green, Sahar Mo-
zaffari, Dawn Waterworth, Nicole Renaud, Ma’en Obeidat, Samuli Ripatti, Jo-
hanna Schleutker, Markus Perola, Mikko Arvas, Olli Carpen, Reetta Hinttala,
Johannes Kettunen, Arto Mannermaa, Katriina Aalto-Setala, Mika Kahonen,
Jari Laukkanen, Johanna Makela, Reetta Kalviainen, Valtteri Julkunen, Hilkka
Soininen, Anne Remes, Mikko Hiltunen, Jukka Peltola, Minna Raivio, Pentti
Tienari, Juha Rinne, Roosa Kallionpaa, Juulia Partanen, Ali Abbasi, Adam Zie-
mann, Nizar Smaoui, Anne Lehtonen, Susan Eaton, Heiko Runz, Sanni Lah-
denpera, Shameek Biswas, Julie Hunkapiller, Natalie Bowers, Edmond
Teng, Rion Pendergrass, Fanli Xu, David Pulford, Kirsi Auro, Laura Addis,
John Eicher, Qingqin S Li, Karen He, Ekaterina Khramtsova, Neha Raghavan,
Martti Farkkila, Jukka Koskela, Sampsa Pikkarainen, Airi Jussila, Katri Kauki-
nen, Timo Blomster, Mikko Kiviniemi, Markku Voutilainen, Mark Daly, Ali Ab-
basi, Jeffrey Waring, Nizar Smaoui, Fedik Rahimov, Anne Lehtonen, Tim Lu,
Natalie Bowers, Rion Pendergrass, Linda McCarthy, Amy Hart, Meijian
Guan, JasonMiller, Kirsi Kalpala, MelissaMiller, Xinli Hu, Kari Eklund, Antti Pal-
omaki, Pia Isomaki, Laura Pirila, Oili Kaipiainen-Seppanen, Johanna Huhta-
kangas, Nina Mars, Ali Abbasi, Jeffrey Waring, Fedik Rahimov, Apinya Lertra-
tanakul, Nizar Smaoui, Anne Lehtonen, David Close, Marla Hochfeld, Natalie
Bowers, Rion Pendergrass, Jorge Esparza Gordillo, Kirsi Auro, Dawn Water-
worth, Fabiana Farias, Kirsi Kalpala, Nan Bing, Xinli Hu, Tarja Laitinen, Margit
Pelkonen, Paula Kauppi, Hannu Kankaanranta, Terttu Harju, Riitta Lahesmaa,
Nizar Smaoui, Alex Mackay, Glenda Lassi, Susan Eaton, Hubert Chen, Rion
Pendergrass, Natalie Bowers, Joanna Betts, Kirsi Auro, Rajashree Mishra,
Majd Mouded, Debby Ngo, Teemu Niiranen, Felix Vaura, Veikko Salomaa,
Kaj Metsarinne, Jenni Aittokallio, Mika Kahonen, Jussi Hernesniemi, Daniel
Gordin, Juha Sinisalo, Marja-Riitta Taskinen, Tiinamaija Tuomi, Timo Hiltunen,
Jari Laukkanen, Amanda Elliott, Mary Pat Reeve, Sanni Ruotsalainen,
Benjamin Challis, Dirk Paul, Julie Hunkapiller, Natalie Bowers, Rion Pender-
grass, Audrey Chu, Kirsi Auro, Dermot Reilly, Mike Mendelson, Jaakko Parkki-
nen, Melissa Miller, Tuomo Meretoja, Heikki Joensuu, Olli Carpen, Johanna
Mattson, Eveliina Salminen, Annika Auranen, Peeter Karihtala, Paivi Auvinen,
Klaus Elenius, Johanna Schleutker, Esa Pitkanen, Nina Mars, Mark Daly, Relja
Popovic, Jeffrey Waring, Bridget Riley-Gillis, Anne Lehtonen, Jennifer

Short Articlell
OPEN ACCESS
Schutzman, Julie Hunkapiller, Natalie Bowers, Rion Pendergrass, Diptee Kul-
karni, Kirsi Auro, Alessandro Porello, Andrey Loboda, Heli Lehtonen, Stefan
McDonough, Sauli Vuoti, Kai Kaarniranta, Joni A Turunen, Terhi Ollila, Hannu
Uusitalo, Juha Karjalainen, Esa Pitkanen, Mengzhen Liu, Heiko Runz, Stepha-
nie Loomis, Erich Strauss, Natalie Bowers, Hao Chen, Rion Pendergrass,
Kaisa Tasanen, Laura Huilaja, Katariina Hannula-Jouppi, Teea Salmi, Sirkku
Peltonen, Leena Koulu, Nizar Smaoui, Fedik Rahimov, Anne Lehtonen, David
Choy, Rion Pendergrass, Dawn Waterworth, Kirsi Kalpala, Ying Wu, Pirkko
Pussinen, Aino Salminen, Tuula Salo, David Rice, Pekka Nieminen, Ulla Palo-
tie, Maria Siponen, Liisa Suominen, Paivi Mantyla, Ulvi Gursoy, Vuokko Antto-
nen, Kirsi Sipila, Rion Pendergrass, Hannele Laivuori, Venla Kurra, Laura Kota-
niemi-Talonen, Oskari Heikinheimo, Ilkka Kalliala, Lauri Aaltonen, Varpu
Jokimaa, Johannes Kettunen, Marja Vaarasmaki, Outi Uimari, Laure Morin-
Papunen, Maarit Niinimaki, Terhi Piltonen, Katja Kivinen, Elisabeth Widen,
Taru Tukiainen, Mary Pat Reeve, Mark Daly, Niko Valimaki, Eija Laakkonen,
Jaakko Tyrmi, Heidi Silven, Eeva Sliz, Riikka Arffman, Susanna Savukoski, Triin
Laisk, Natalia Pujol, Mengzhen Liu, Bridget Riley-Gillis, Rion Pendergrass, Ja-
net Kumar, Kirsi Auro, Iiris Hovatta, Chia-Yen Chen, Erkki Isometsa, Kumar
Veerapen, Hanna Ollila, Jaana Suvisaari, Thomas Damm Als, Antti Makitie, Ar-
gyro Bizaki-Vallaskangas, Sanna Toppila-Salmi, Tytti Willberg, Elmo Saaren-
taus, Antti Aarnisalo, Eveliina Salminen, Elisa Rahikkala, Johannes Kettunen,
Kristiina Aittomaki, Fredrik Aberg, Mitja Kurki, Samuli Ripatti, Mark Daly,
Juha Karjalainen, Aki Havulinna, Juha Mehtonen, Priit Palta, Shabbeer Has-
san, Pietro Della Briotta Parolo, Wei Zhou, Mutaamba Maasha, Kumar Veer-
apen, Shabbeer Hassan, Susanna Lemmela, Manuel Rivas, Mari E. Niemi,
Aarno Palotie, Aoxing Liu, Arto Lehisto, Andrea Ganna, Vincent Llorens, Han-
nele Laivuori, Taru Tukiainen, Mary Pat Reeve, Henrike Heyne, NinaMars, Joel
Ramo, Elmo Saarentaus, Hanna Ollila, Rodos Rodosthenous, Satu Strausz,
Tuula Palotie, Kimmo Palin, Javier Garcia-Tabuenca, Harri Siirtola, Tuomo
Kiiskinen, Jiwoo Lee, Kristin Tsuo, Amanda Elliott, Kati Kristiansson, Mikko Ar-
vas, Kati Hyvarinen, Jarmo Ritari, Olli Carpen, Johannes Kettunen, Katri Pyl-
kas, Eeva Sliz, Minna Karjalainen, Tuomo Mantere, Eeva Kangasniemi, Sami
Heikkinen, Arto Mannermaa, Eija Laakkonen, Nina Pitkanen, Samuel Lessard,
Clement Chatelain, Perttu Terho, Sirpa Soini, Jukka Partanen, Eero Punkka,
Raisa Serpi, Sanna Siltanen, Veli-Matti Kosma, Teijo Kuopio, Anu Jalanko,
Huei-Yi Shen, Risto Kajanne, Mervi Aavikko, Mitja Kurki, Juha Karjalainen, Pie-
tro Della Briotta Parolo, Arto Lehisto, JuhaMehtonen, Wei Zhou, Masahiro Ka-
nai, Mutaamba Maasha, Kumar Veerapen, Hannele Laivuori, Aki Havulinna,
Susanna Lemmela, Tuomo Kiiskinen, L. Elisa Lahtela, Mari Kaunisto, Elina Kil-
pelainen, Timo P. Sipila, Oluwaseun Alexander Dada, Awaisa Ghazal, Anasta-
sia Kytola, Rigbe Weldatsadik, Kati Donner, Timo P. Sipila, Anu Loukola, Paivi
Laiho, Tuuli Sistonen, Essi Kaiharju, Markku Laukkanen, Elina Jarvensivu, Sini
Lahteenmaki, Lotta Mannikko, Regis Wong, Auli Toivola, Minna Brunfeldt,
Hannele Mattsson, Kati Kristiansson, Susanna Lemmela, Sami Koskelainen,
Tero Hiekkalinna, Teemu Paajanen, Priit Palta, Kalle Parn, Mart Kals, Shuang
Luo, Vishal Sinha, Tarja Laitinen, Mary Pat Reeve, Marianna Niemi, Kumar
Veerapen, Harri Siirtola, Javier Gracia-Tabuenca, Mika Helminen, Tiina Luuk-
kaala, Iida Vahatalo, Jyrki Pitkanen, Marco Hautalahti, Johanna Makela, Sarah
Smith, and Tom Southerington.
ACKNOWLEDGMENTS
We would like to thank Julius Anckar, Ulla Tuomainen, and Anne Carson for
management assistance. This work was supported by the Academy of Finland
(grant number 331671 to N.M., grant number 285380 to S.R., 128650 to A.P.,
288509 toM.P., and 323116 to A.G.); Academy of Finland Center of Excellence
in Complex Disease Genetics (grant number 312062 to S.R., 312074 to
A.P.,312076 toM.P.); European Union’s Horizon 2020 research and innovation
program under grant agreement No 101016775; University of Helsinki HiLIFE
Fellow grants 2017-2020 (to S.R.); Sigrid Juselius Foundation (to S.R., A.P.,
and M.P.); National Institutes of Health (grant number K99MH117229 to
A.M.); Estonian Research Council grant PUT (PRG687 to K.L and R.M).
The research in BioBank Japan has been supported by JSPS KAKENHI
(19H01021, 20K21834); AMED (JP21km0405211, JP21ek0109413,
JP21gm4010006, JP21km0405217, JP21ek0410075); JST Moonshot R&D
(JPMJMS2021); Takeda Science Foundation. In HUNT, the genotyping was
financed by the National Institute of health (NIH), University of Michigan, The
Norwegian Research Council, and Central Norway Regional Health Authority
and the Faculty of Medicine and Health Sciences, Norwegian University of Sci-
ence and Technology (NTNU). G.C.F. is funded by the Faculty of Medicine and
Health Sciences at NTNU and Central Norway Regional Health Authority. The
funders had no role in study design, data collection and analysis, decision to
publish, or preparation of the manuscript.
AUTHOR CONTRIBUTIONS
S.R. and N.M. conceived and designed the study. N.M., S.K., Y-C.A.F., M.K.,
K.L., L.F.T., and A.H.S. carried out the statistical and computational analyses
with advice from S.R. and A.M. Quality control of the data was carried out by
N.M., Y-C.A.F., M.K., K.L., L.F.T., and A.H.S. All authors provided critical in-
puts to interpretation of the data. The manuscript was written and revised by
N.M. and S.R. with comments from all of the co-authors. All co-authors have
approved the final version of the manuscript.
DECLARATION OF INTERESTS
A.P. is a member of the Pfizer Genetics Scientific Advisory Panel. J.W.S is an
unpaid member of the Bipolar/Depression Research Community Advisory
Panel of 23andMe, amember of the Leon Levy Foundation Neuroscience Advi-
sory Board, and received an honorarium for an internal seminar at Biogen, Inc.
He is principal investigator of a collaborative study of the genetics of depres-
sion and bipolar disorder sponsored by 23andMe for which 23andMe provides
analysis time as in-kind support but no payments. B.M.N. is a member of the
Deep Genomics Scientific Advisory Board and serves as a consultant for the
Camp4 Therapeutics Corporation, Takeda Pharmaceutical, and Biogen. The
remaining authors declare no conflict of interests.
Received: January 21, 2021
Revised: August 24, 2021
Accepted: March 18, 2022
Published: April 13, 2022
REFERENCES
1. Khera, A.V., Chaffin, M., Aragam, K.G., Haas, M.E., Roselli, C., Choi, S.H.,
Natarajan, P., Lander, E.S., Lubitz, S.A., Ellinor, P.T., and Kathiresan, S.
(2018). Genome-wide polygenic scores for common diseases identify in-
dividuals with risk equivalent to monogenic mutations. Nat. Genet. 50,
1219–1224. https://doi.org/10.1038/s41588-018-0183-z.
2. Mars, N., Koskela, J.T., Ripatti, P., Kiiskinen, T.T.J., Havulinna, A.S., Lind-
bohm, J.V., Ahola-Olli, A., Kurki, M., Karjalainen, J., Palta, P., et al. (2020).
Polygenic and clinical risk scores and their impact on age at onset and pre-
diction of cardiometabolic diseases and common cancers. Nat. Med. 26,
549–557. https://doi.org/10.1038/s41591-020-0800-0.
3. Mavaddat, N., Michailidou, K., Dennis, J., Lush, M., Fachal, L., Lee, A.,
Tyrer, J.P., Chen, T.H., Wang, Q., Bolla, M.K., et al. (2019). Polygenic
risk scores for prediction of breast cancer and breast cancer subtypes.
Am. J. Hum. Genet. 104, 21–34. https://doi.org/10.1016/j.ajhg.2018.11.
002.
4. Seibert, T.M., Fan, C.C., Wang, Y., Zuber, V., Karunamuni, R., Parsons,
J.K., Eeles, R.A., Easton, D.F., Kote-Jarai, Z., Al Olama, A.A., et al.
(2018). Polygenic hazard score to guide screening for aggressive prostate
cancer: development and validation in large scale cohorts. BMJ 360,
j5757. https://doi.org/10.1136/bmj.j5757.
5. Martin, A.R., Kanai, M., Kamatani, Y., Okada, Y., Neale, B.M., and Daly,
M.J. (2019). Clinical use of current polygenic risk scores may exacerbate
health disparities. Nat. Genet. 51, 584–591. https://doi.org/10.1038/
s41588-019-0379-x.
6. Lee, A., Mavaddat, N., Wilcox, A.N., Cunningham, A.P., Carver, T., Hartley,
S., Babb de Villiers, C., Izquierdo, A., Simard, J., Schmidt, M.K., et al.
(2019). BOADICEA: a comprehensive breast cancer risk prediction model
incorporating genetic and nongenetic risk factors. Genet. Med. 21, 1708–
1718. https://doi.org/10.1038/s41436-018-0406-9.
Cell Genomics 2, 100118, April 13, 2022 7

Short Articlell
OPEN ACCESS
7. Inouye, M., Abraham, G., Nelson, C.P., Wood, A.M., Sweeting, M.J., Dud-
bridge, F., Lai, F.Y., Kaptoge, S., Brozynska, M., Wang, T., et al. (2018).
Genomic risk prediction of coronary artery disease in 480,000 adults: im-
plications for primary prevention. J. Am. Coll. Cardiol. 72, 1883–1893.
https://doi.org/10.1016/j.jacc.2018.07.079.
8. Hindy, G., Aragam Krishna, G., Ng, K., Chaffin, M., Lotta Luca, A., Baras,
A., Drake, I., Orho-Melander, M., Melander, O., Kathiresan, S., and Khera
Amit, V. (2020). Genome-wide polygenic score, clinical risk factors, and
long-term trajectories of coronary artery disease. Arterioscler. Thromb.
Vasc. Biol. 40, 2738–2746. https://doi.org/10.1161/ATVBAHA.120.
314856.
9. Yanes, T., Young, M.A., Meiser, B., and James, P.A. (2020). Clinical appli-
cations of polygenic breast cancer risk: a critical review and perspectives
of an emerging field. Breast Cancer Res. 22, 21. https://doi.org/10.1186/
s13058-020-01260-3.
10. Lall, K., Magi, R., Morris, A., Metspalu, A., and Fischer, K. (2017). Person-
alized risk prediction for type 2 diabetes: the potential of genetic risk
scores. Genet. Med. 19, 322–329. https://doi.org/10.1038/gim.2016.103.
11. Michailidou, K., Lindstrom, S., Dennis, J., Beesley, J., Hui, S., Kar, S., Le-
macon, A., Soucy, P., Glubb, D., Rostamianfar, A., et al. (2017). Associa-
tion analysis identifies 65 new breast cancer risk loci. Nature 551, 92–94.
https://doi.org/10.1038/nature24284.
12. Nikpay, M., Goel, A., Won, H.H., Hall, L.M., Willenborg, C., Kanoni, S.,
Saleheen, D., Kyriakou, T., Nelson, C.P., Hopewell, J.C., et al. (2015). A
comprehensive 1,000 Genomes-based genome-wide association meta-
analysis of coronary artery disease. Nat. Genet. 47, 1121–1130. https://
doi.org/10.1038/ng.3396.
13. Schumacher, F.R., Al Olama, A.A., Berndt, S.I., Benlloch, S., Ahmed, M.,
Saunders, E.J., Dadaev, T., Leongamornlert, D., Anokian, E., Cieza-Bor-
rella, C., et al. (2018). Association analyses of more than 140,000 men
identify 63 new prostate cancer susceptibility loci. Nat. Genet. 50,
928–936. https://doi.org/10.1038/s41588-018-0142-8.
14. Scott, R.A., Scott, L.J., Magi, R., Marullo, L., Gaulton, K.J., Kaakinen, M.,
Pervjakova, N., Pers, T.H., Johnson, A.D., Eicher, J.D., et al. (2017). An
expanded genome-wide association study of type 2 diabetes in Euro-
peans. Diabetes 66, 2888–2902. https://doi.org/10.2337/db16-1253.
15. Kerminen, S., Havulinna, A.S., Hellenthal, G., Martin, A.R., Sarin, A.P., Per-
ola, M., Palotie, A., Salomaa, V., Daly, M.J., Ripatti, S., and Pirinen, M.
(2017). Fine-scale genetic structure in Finland. G3 (Bethesda) 7, 3459–
3468. https://doi.org/10.1534/g3.117.300217.
16. Kerminen, S., Martin, A.R., Koskela, J., Ruotsalainen, S.E., Havulinna,
A.S., Surakka, I., Palotie, A., Perola, M., Salomaa, V., Daly, M.J., et al.
(2019). Geographic variation and bias in the polygenic scores of complex
diseases and traits in Finland. Am. J. Hum. Genet. 104, 1169–1181.
https://doi.org/10.1016/j.ajhg.2019.05.001.
17. Abraham, G., Havulinna, A.S., Bhalala, O.G., Byars, S.G., De Livera, A.M.,
Yetukuri, L., Tikkanen, E., Perola, M., Schunkert, H., Sijbrands, E.J., et al.
(2016). Genomic prediction of coronary heart disease. Eur. Heart J. 37,
3267–3278. https://doi.org/10.1093/eurheartj/ehw450.
18. Conti, D.V., Darst, B.F., Moss, L.C., Saunders, E.J., Sheng, X., Chou, A.,
Schumacher, F.R., Olama, A.A.A., Benlloch, S., Dadaev, T., et al. (2021).
Trans-ancestry genome-wide association meta-analysis of prostate can-
cer identifies new susceptibility loci and informs genetic risk prediction.
Nat. Genet. 53, 65–75. https://doi.org/10.1038/s41588-020-00748-0.
19. Ho,W.K., Tan,M.M.,Mavaddat, N., Tai, M.C., Mariapun, S., Li, J., Ho, P.J.,
Dennis, J., Tyrer, J.P., Bolla, M.K., et al. (2020). European polygenic risk
score for prediction of breast cancer shows similar performance in Asian
women. Nat. Commun. 11, 3833. https://doi.org/10.1038/s41467-020-
17680-w.
20. Shieh, Y., Fejerman, L., Lott, P.C., Marker, K., Sawyer, S.D., Hu, D., Hunts-
man, S., Torres, J., Echeverry, M., Bohorquez, M.E., et al. (2020). A poly-
genic risk score for breast cancer in US Latinas and Latin American
women. J. Natl. Cancer Inst. 112, 590–598. https://doi.org/10.1093/jnci/
djz174.
8 Cell Genomics 2, 100118, April 13, 2022
21. Polfus, L.M., Darst, B.F., Highland, H., Sheng, X., Ng, M.C.Y., Below, J.E.,
Petty, L., Bien, S., Sim, X., Wang, W., et al. (2021). Genetic discovery and
risk characterization in type 2 diabetes across diverse populations. Hum.
Genet. Genom. Adv. 2, 100029. https://doi.org/10.1016/j.xhgg.2021.
100029.
22. Du, Z., Gao, G., Adedokun, B., Ahearn, T., Lunetta, K.L., Zirpoli, G.,
Troester, M.A., Ruiz-Narvaez, E.A., Haddad, S.A., Pal Choudhury, P.,
et al. (2021). Evaluating polygenic risk scores for breast cancer in women
of African ancestry. J. Natl. Cancer Inst. 113, 1168–1176. https://doi.org/
10.1093/jnci/djab050.
23. Du, Z., Lubmawa, A., Gundell, S., Wan, P., Nalukenge, C., Muwanga, P.,
Lutalo, M., Nansereko, D., Ndaruhutse, O., Katuku, M., et al. (2018). Ge-
netic risk of prostate cancer in Ugandan men. Prostate 78, 370–376.
https://doi.org/10.1002/pros.23481.
24. Ekoru, K., Adeyemo, A.A., Chen, G., Doumatey, A.P., Zhou, J., Bentley,
A.R., Shriner, D., and Rotimi, C.N. (2021). Genetic risk scores for cardio-
metabolic traits in sub-Saharan African populations. Int. J. Epidemiol.
50, 1283–1296. https://doi.org/10.1093/ije/dyab046.
25. Iribarren, C., Lu, M., Jorgenson, E., Martinez, M., Lluis-Ganella, C., Subir-
ana, I., Salas, E., and Elosua, R. (2018). Weightedmulti-marker genetic risk
scores for incident coronary heart disease among individuals of African,
Latino and East-Asian ancestry. Sci. Rep. 8, 6853. https://doi.org/10.
1038/s41598-018-25128-x.
26. Duncan, L., Shen, H., Gelaye, B., Meijsen, J., Ressler, K., Feldman, M., Pe-
terson, R., and Domingue, B. (2019). Analysis of polygenic risk score us-
age and performance in diverse human populations. Nat. Commun. 10,
3328. https://doi.org/10.1038/s41467-019-11112-0.
27. Qi, Q., Stilp, A.M., Sofer, T., Moon, J.Y., Hidalgo, B., Szpiro, A.A., Wang,
T., Ng, M.C.Y., Guo, X., MEta-analysis of type 2 DIabetes in African Amer-
icans (MEDIA) Consortium; and Chen, Y.I., et al. (2017). Genetics of type 2
diabetes in U.S. Hispanic/Latino individuals: results from the Hispanic
Community health study/study of Latinos (HCHS/SOL). Diabetes 66,
1419–1425. https://doi.org/10.2337/db16-1150.
28. Chande, A.T., Rishishwar, L., Conley, A.B., Valderrama-Aguirre, A.,
Medina-Rivas, M.A., and Jordan, I.K. (2020). Ancestry effects on type 2
diabetes genetic risk inference in Hispanic/Latino populations. BMC
Med. Genet. 21, 132. https://doi.org/10.1186/s12881-020-01068-0.
29. Wen, W., Shu, X.O., Guo, X., Cai, Q., Long, J., Bolla, M.K., Michailidou, K.,
Dennis, J., Wang, Q., Gao, Y.T., et al. (2016). Prediction of breast cancer
risk based on common genetic variants in women of East Asian ancestry.
Breast Cancer Res. 18, 124. https://doi.org/10.1186/s13058-016-0786-1.
30. Mak, T.S.H., Porsch, R.M., Choi, S.W., Zhou, X., and Sham, P.C. (2017).
Polygenic scores via penalized regression on summary statistics. Genet.
Epidemiol. 41, 469–480. https://doi.org/10.1002/gepi.22050.
31. Vilhjalmsson, B.J., Yang, J., Finucane, H.K., Gusev, A., Lindstrom, S.,
Ripke, S., Genovese, G., Loh, P.R., Bhatia, G., Do, R., et al. (2015).
Modeling linkage disequilibrium increases accuracy of polygenic risk
scores. Am. J. Hum. Genet. 97, 576–592. https://doi.org/10.1016/j.ajhg.
2015.09.001.
32. Ge, T., Chen, C.Y., Ni, Y., Feng, Y.A., and Smoller, J.W. (2019). Polygenic
prediction via Bayesian regression and continuous shrinkage priors. Nat.
Commun. 10, 1776. https://doi.org/10.1038/s41467-019-09718-5.
33. Prive, F., Arbel, J., and Vilhjalmsson, B.J. (2020). LDpred2: better, faster,
stronger. Bioinformatics 36, 5424–5431. https://doi.org/10.1093/bioinfor-
matics/btaa1029.
34. Dikilitas, O., Schaid, D.J., Kosel, M.L., Carroll, R.J., Chute, C.G., Denny,
J.A., Fedotov, A., Feng, Q., Hakonarson, H., Jarvik, G.P., et al. (2020). Pre-
dictive utility of polygenic risk scores for coronary heart disease in three
major racial and ethnic groups. Am. J. Hum. Genet. 106, 707–716.
https://doi.org/10.1016/j.ajhg.2020.04.002.
35. Fahed, A.C., Aragam, K.G., Hindy, G., Chen, Y.I., Chaudhary, K., Dobbyn,
A., Krumholz, H.M., Sheu, W.H.H., Rich, S.S., Rotter, J.I., et al. (2020).
Transethnic transferability of a genome-wide polygenic score for coronary

Short Articlell
OPEN ACCESS
artery disease. Circ. Genom. Precis. Med. 14, e003092. https://doi.org/10.
1161/CIRCGEN.120.003092.
36. Wang, M., Menon, R., Mishra, S., Patel, A.P., Chaffin, M., Tanneeru, D.,
Deshmukh, M., Mathew, O., Apte, S., Devanboo, C.S., et al. (2020). Valida-
tion of a genome-wide polygenic score for coronary artery disease in
South Asians. J. Am. Coll. Cardiol. 76, 703–714. https://doi.org/10.1016/
j.jacc.2020.06.024.
37. Lamri, A., Mao, S., Desai, D., Gupta, M., Pare, G., and Anand, S.S. (2020).
Fine-tuning of genome-wide polygenic risk scores and prediction of gesta-
tional diabetes in South Asian women. Sci. Rep. 10, 8941. https://doi.org/
10.1038/s41598-020-65360-y.
38. Wang, Y., Guo, J., Ni, G., Yang, J., Visscher, P.M., and Yengo, L. (2020).
Theoretical and empirical quantification of the accuracy of polygenic
scores in ancestry divergent populations. Nat. Commun. 11, 3865.
https://doi.org/10.1038/s41467-020-17719-y.
39. Kuchenbaecker, K., Telkar, N., Reiker, T., Walters, R.G., Lin, K., Eriksson,
A., Gurdasani, D., Gilly, A., Southam, L., Tsafantakis, E., et al. (2019). The
transferability of lipid loci across African, Asian and European cohorts.
Nat. Commun. 10, 4330. https://doi.org/10.1038/s41467-019-12026-7.
40. Norio, R. (2003). Finnish Disease Heritage I: characteristics, causes, back-
ground. Hum. Genet. 112, 441–456. https://doi.org/10.1007/s00439-002-
0875-3.
41. Martin, A.R., Karczewski, K.J., Kerminen, S., Kurki, M.I., Sarin, A.P., Arto-
mov, M., Eriksson, J.G., Esko, T., Genovese, G., Havulinna, A.S., et al.
(2018). Haplotype sharing provides insights into fine-scale population his-
tory and disease in Finland. Am. J. Hum. Genet. 102, 760–775. https://doi.
org/10.1016/j.ajhg.2018.03.003.
42. Fahed, A.C., Wang, M., Homburger, J.R., Patel, A.P., Bick, A.G., Neben,
C.L., Lai, C., Brockman, D., Philippakis, A., Ellinor, P.T., et al. (2020). Poly-
genic background modifies penetrance of monogenic variants for tier 1
genomic conditions. Nat. Commun. 11, 3635. https://doi.org/10.1038/
s41467-020-17374-3.
43. Martin, A.R., Gignoux, C.R., Walters, R.K., Wojcik, G.L., Neale, B.M.,
Gravel, S., Daly, M.J., Bustamante, C.D., and Kenny, E.E. (2017). Human
demographic history impacts genetic risk prediction across diverse pop-
ulations. Am. J. Hum. Genet. 100, 635–649. https://doi.org/10.1016/j.
ajhg.2017.03.004.
44. Sirugo, G., Williams, S.M., and Tishkoff, S.A. (2019). The missing diversity
in human genetic studies. Cell 177, 1080. https://doi.org/10.1016/j.cell.
2019.04.032.
45. Wojcik, G.L., Graff, M., Nishimura, K.K., Tao, R., Haessler, J., Gignoux,
C.R., Highland, H.M., Patel, Y.M., Sorokin, E.P., Avery, C.L., et al.
(2019). Genetic analyses of diverse populations improves discovery for
complex traits. Nature 570, 514–518. https://doi.org/10.1038/s41586-
019-1310-4.
46. Koyama, S., Ito, K., Terao, C., Akiyama, M., Horikoshi, M., Momozawa, Y.,
Matsunaga, H., Ieki, H., Ozaki, K., Onouchi, Y., et al. (2020). Population-
specific and trans-ancestry genome-wide analyses identify distinct and
shared genetic risk loci for coronary artery disease. Nat. Genet. 52,
1169–1177. https://doi.org/10.1038/s41588-020-0705-3.
47. Marquez-Luna, C., Loh, P.R., and South Asian Type 2 Diabetes (SAT2D)
Consortium; SIGMA Type 2 Diabetes Consortium; and Price, A.L. (2017).
Multiethnic polygenic risk scores improve risk prediction in diverse popu-
lations. Genet. Epidemiol. 41, 811–823. https://doi.org/10.1002/gepi.
22083.
48. Gettler, K., Levantovsky, R., Moscati, A., Giri, M., Wu, Y., Hsu, N.Y.,
Chuang, L.S., Sazonovs, A., Venkateswaran, S., Korie, U., et al. (2020).
Common and rare variant prediction and penetrance of IBD in a large,
multi-ethnic, health system-based biobank cohort. Gastroenterology
160, 1546–1557. https://doi.org/10.1053/j.gastro.2020.12.034.
49. Sakaue, S., Hirata, J., Kanai, M., Suzuki, K., Akiyama, M., Lai Too, C., Ara-
yssi, T., Hammoudeh, M., Al Emadi, S., Masri, B.K., et al. (2020). Dimen-
sionality reduction reveals fine-scale structure in the Japanese population
with consequences for polygenic risk prediction. Nat. Commun. 11, 1569.
https://doi.org/10.1038/s41467-020-15194-z.
50. Marnetto, D., Parna, K., Lall, K., Molinaro, L., Montinaro, F., Haller, T., Met-
spalu, M., Magi, R., Fischer, K., and Pagani, L. (2020). Ancestry deconvo-
lution and partial polygenic score can improve susceptibility predictions in
recently admixed individuals. Nat. Commun. 11, 1628. https://doi.org/10.
1038/s41467-020-15464-w.
51. Bitarello, B.D., and Mathieson, I. (2020). Polygenic scores for height in ad-
mixed populations. G3 (Bethesda) 10, 4027–4036. https://doi.org/10.
1534/g3.120.401658.
52. Ruan, Y., Anne Feng, Y.-C., Chen, C.-Y., Lam, M., Stanley Global Asia, I.,
Sawa, A., Martin, A.R., Qin, S., Huang, H., and Ge, T. (2021). Improving
polygenic prediction in ancestrally diverse populations. Preprint at medR-
xiv. https://doi.org/10.1101/2020.12.27.20248738.
53. Weissbrod, O., Kanai, M., Shi, H., Gazal, S., Peyrot, W., Khera, A., Okada,
Y., The Biobank Japan, Project; Martin, A., Finucane, H., and Price, A.L.
(2021). Leveraging fine-mapping and non-European training data to
improve trans-ethnic polygenic risk scores. Preprint at medRxiv. https://
doi.org/10.1101/2021.01.19.21249483.
54. Amariuta, T., Ishigaki, K., Sugishita, H., Ohta, T., Koido,M., Dey, K.K., Mat-
suda, K., Murakami, Y., Price, A.L., Kawakami, E., et al. (2020). Improving
the trans-ancestry portability of polygenic risk scores by prioritizing vari-
ants in predicted cell-type-specific regulatory elements. Nat. Genet. 52,
1346–1354. https://doi.org/10.1038/s41588-020-00740-8.
55. Mostafavi, H., Harpak, A., Agarwal, I., Conley, D., Pritchard, J.K., and
Przeworski, M. (2020). Variable prediction accuracy of polygenic scores
within an ancestry group. Elife 9, e48376. https://doi.org/10.7554/eLife.
48376.
56. Gathani, T., Ali, R., Balkwill, A., Green, J., Reeves, G., Beral, V., andMoser,
K.A.; Million Women Study Collaborators (2014). Ethnic differences in
breast cancer incidence in England are due to differences in known risk
factors for the disease: prospective study. Br. J. Cancer 110, 224–229.
https://doi.org/10.1038/bjc.2013.632.
57. Fiscella, K., and Sanders, M.R. (2016). Racial and ethnic disparities in the
quality of health care. Annu. Rev. Publ. Health 37, 375–394. https://doi.
org/10.1146/annurev-publhealth-032315-021439.
58. Carnethon, M.R., Pu, J., Howard, G., Albert, M.A., Anderson, C.A.M., Ber-
toni, A.G., Mujahid, M.S., Palaniappan, L., Taylor, H.A., Jr., Willis, M., et al.
(2017). Cardiovascular health in African Americans: a scientific statement
from the American heart association. Circulation 136, e393–e423. https://
doi.org/10.1161/CIR.0000000000000534.
59. Shai, I., Jiang, R., Manson, J.E., Stampfer, M.J., Willett, W.C., Colditz,
G.A., and Hu, F.B. (2006). Ethnicity, obesity, and risk of type 2 diabetes
in women: a 20-year follow-up study. Diabetes Care 29, 1585–1590.
https://doi.org/10.2337/dc06-0057.
60. Tamlander, M., Mars, N., Pirinen, M., Finn, G., Widen, E., and Ripatti, S.
(2022). Integration of questionnaire-based risk factors improves polygenic
risk scores for human coronary heart disease and type 2 diabetes. Com-
mun. Biol. 5, 158. https://doi.org/10.1038/s42003-021-02996-0.
61. Mars, N., Widen, E., Kerminen, S., Meretoja, T., Pirinen, M., della Briotta
Parolo, P., Palta, P., Havulinna, A., Elliott, A., Shcherban, A., et al.
(2020). The role of polygenic risk and susceptibility genes in breast cancer
over the course of life. Nat. Commun. 11, 6383. https://doi.org/10.1038/
s41467-020-19966-5.
62. Nagai, A., Hirata, M., Kamatani, Y., Muto, K., Matsuda, K., Kiyohara, Y., Ni-
nomiya, T., Tamakoshi, A., Yamagata, Z., Mushiroda, T., et al. (2017).
Overview of the BioBank Japan project: study design and profile.
J. Epidemiol. 27, S2–S8. https://doi.org/10.1016/j.je.2016.12.005.
63. Ishigaki, K., Akiyama, M., Kanai, M., Takahashi, A., Kawakami, E., Sugish-
ita, H., Sakaue, S., Matoba, N., Low, S.-K., Okada, Y., et al. (2020). Large-
scale genome-wide association study in a Japanese population identifies
novel susceptibility loci across different diseases. Nat. Genet. 52,
669–679. https://doi.org/10.1038/s41588-020-0640-3.
Cell Genomics 2, 100118, April 13, 2022 9

Short Articlell
OPEN ACCESS
64. Akiyama, M., Ishigaki, K., Sakaue, S., Momozawa, Y., Horikoshi, M., Hir-
ata, M., Matsuda, K., Ikegawa, S., Takahashi, A., Kanai, M., et al. (2019).
Characterizing rare and low-frequency height-associated variants in the
Japanese population. Nat. Commun. 10, 4393. https://doi.org/10.1038/
s41467-019-12276-5.
65. Loh, P.R., Danecek, P., Palamara, P.F., Fuchsberger, C., Reshef, Y.A., Fi-
nucane, H.K., Schoenherr, S., Forer, L., McCarthy, S., Abecasis, G.R.,
et al. (2016). Reference-based phasing using the haplotype reference con-
sortium panel. Nat. Genet. 48, 1443–1448. https://doi.org/10.1038/ng.
3679.
66. Chang, C.C., Chow, C.C., Tellier, L.C., Vattikuti, S., Purcell, S.M., and Lee,
J.J. (2015). Second-generation PLINK: rising to the challenge of larger and
richer datasets. Gigascience 4, 7. https://doi.org/10.1186/s13742-015-
0047-8.
67. Leitsalu, L., Haller, T., Esko, T., Tammesoo, M.L., Alavere, H., Snieder, H.,
Perola, M., Ng, P.C., Magi, R., Milani, L., et al. (2015). Cohort profile:
Estonian biobank of the Estonian genome center, University of Tartu. Int.
J. Epidemiol. 44, 1137–1147. https://doi.org/10.1093/ije/dyt268.
68. Mitt, M., Kals, M., Parn, K., Gabriel, S.B., Lander, E.S., Palotie, A., Ripatti,
S., Morris, A.P., Metspalu, A., Esko, T., et al. (2017). Improved imputation
accuracy of rare and low-frequency variants using population-specific
high-coverage WGS-based imputation reference panel. Eur. J. Hum.
Genet. 25, 869–876. https://doi.org/10.1038/ejhg.2017.51.
69. Krokstad, S., Langhammer, A., Hveem, K., Holmen, T.L., Midthjell, K.,
Stene, T.R., Bratberg, G., Heggland, J., and Holmen, J. (2013). Cohort pro-
file: the HUNT study, Norway. Int. J. Epidemiol. 42, 968–977. https://doi.
org/10.1093/ije/dys095.
10 Cell Genomics 2, 100118, April 13, 2022
70. Das, S., Forer, L., Schonherr, S., Sidore, C., Locke, A.E., Kwong, A.,
Vrieze, S.I., Chew, E.Y., Levy, S., McGue,M., et al. (2016). Next-generation
genotype imputation service and methods. Nat. Genet. 48, 1284–1287.
https://doi.org/10.1038/ng.3656.
71. McCarthy, S., Das, S., Kretzschmar, W., Delaneau, O., Wood, A.R.,
Teumer, A., Kang, H.M., Fuchsberger, C., Danecek, P., Sharp, K., et al.
(2016). A reference panel of 64,976 haplotypes for genotype imputation.
Nat. Genet. 48, 1279–1283. https://doi.org/10.1038/ng.3643.
72. Karlson, E.W., Boutin, N.T., Hoffnagle, A.G., and Allen, N.L. (2016). Build-
ing the partners HealthCare biobank at partners personalized medicine:
informed consent, return of research results, recruitment lessons and
operational considerations. J. Personalized Med. 6, 2. https://doi.org/10.
3390/jpm6010002.
73. Genomes Project Consortium; Auton, A., Brooks, L.D., Durbin, R.M.,
Garrison, E.P., Kang, H.M., Korbel, J.O., Marchini, J.L., McCarthy, S.,
McVean, G.A., and Abecasis, G.R. (2015). A global reference for human
genetic variation. Nature 526, 68–74. https://doi.org/10.1038/na-
ture15393.
74. Huang, J., Howie, B., McCarthy, S., Memari, Y., Walter, K., Min, J.L., Da-
necek, P., Malerba, G., Trabetti, E., Zheng, H.F., et al. (2015). Improved
imputation of low-frequency and rare variants using the UK10K haplotype
reference panel. Nat. Commun. 6, 8111. https://doi.org/10.1038/
ncomms9111.
75. Bycroft, C., Freeman, C., Petkova, D., Band, G., Elliott, L.T., Sharp, K.,
Motyer, A., Vukcevic, D., Delaneau, O., O’Connell, J., et al. (2018). The
UK Biobank resource with deep phenotyping and genomic data. Nature
562, 203–209. https://doi.org/10.1038/s41586-018-0579-z.

Short Articlell
OPEN ACCESS
STAR+METHODS
KEY RESOURCES TABLE
REAGENT or RESOURCE SOURCE IDENTIFIER
Deposited data
The FinnGen data may be accessed through Finnish
Biobanks’ FinBB portal
- http://www.finnbb.fi
GWAS genotype data of BioBank Japan are available
at the National Bioscience Database Center Human
Database
Nagai et al., 2017 Research ID: hum0014; https://humandbs.
biosciencedbc.jp/en/hum0014-v21
UK Biobank data are available through a procedure
described at http://www.ukbiobank.ac.uk/
using-the-resource/
Bycroft et al., 2018 http://www.ukbiobank.ac.uk/using-the-resource/
The Trøndelag Health Study (HUNT). The HUNT data
may be accessed by application to the HUNT
Research Centre.
Krokstad et al., 2013 https://www.ntnu.edu/hunt
De-identified data of the MGB Biobank that supports
this study is available from the MGB Biobank portal.
Restrictions apply to the availability of these data,
which are available to MGB-affiliated researchers via a
formal application.
Karlson et al., 2016 https://biobank.partners.org/
Estonian Biobank. Researchers interested
in Estonian Biobank can request the access at
https://www.geenivaramu.ee/en/access-biobank
Leitsalu et al., 2015 https://www.geenivaramu.ee/en/access-biobank
PGS Catalog/LDpred polygenic risk scores This paper https://www.pgscatalog.org/
PGS002241–PGS002244
PGSCatalog/PRS-CS polygenic risk score for prostate
cancer
This paper https://www.pgscatalog.org/
PGS002240
PGS Catalog/PRS-CS polygenic risk score for breast
cancer
Mars et al., 2020 https://www.pgscatalog.org/
PGS000335
PGS Catalog/PRS-CS polygenic risk score for
coronary artery disease and type 2 diabetes
Tamlander et al., 2022 https://www.pgscatalog.org/
PGS001780, PGS001781
Software and algorithms
PRS-CS (version Sep 10, 2020) Ge et al., 2019 https://github.com/getian107/PRScs
PLINK v2.00a2.3LM Chang et al., 2015 https://www.cog-genomics.org/plink/2.0/
STEROID 0.1 - https://genomics.ut.ee/en/tools/steroid
Eagle v2.3.5 Loh P-R et al. 2016 https://alkesgroup.broadinstitute.org/Eagle/
R statistical programming v3.2.0 or later - https://www.r-project.org/
LDpred v1.0.7 Vilhjalmsson et al. 2015 https://github.com/bvilhjal/ldpred
Other
PRS-CS pipeline - https://github.com/FINNGEN/CS-PRS-pipeline
Project code This paper https://doi.org/10.5281/zenodo.6203211
RESOURCE AVAILABILITY
Lead contactFurther information and requests should be directed to the lead contact, Samuli Ripatti ([email protected]).
Materials availabilityThis study did not generate new materials.
Cell Genomics 2, 100118, April 13, 2022 e1

Short Articlell
OPEN ACCESS
Data and code availabilityd The FinnGen data can be accessed through the Fingenious� services (https://site.fingenious.fi/en/) managed by FINBB.
GWAS genotype data of BioBank Japan are available at the National Bioscience Database Center Human Database (research
ID: hum0014; https://humandbs.biosciencedbc.jp/en/hum0014-v21). UK Biobank data are available through a procedure
described at http://www.ukbiobank.ac.uk/using-the-resource/.The HUNT data may be accessed by application to the
HUNT Research Centre (https://www.ntnu.edu/hunt). Researchers interested in Estonian Biobank can request the access at
https://www.geenivaramu.ee/en/access-biobank. De-identified data of the MGB Biobank that supports this study is available
from theMGBBiobank portal (https://biobank.partners.org/). Restrictions apply to the availability of these data, which are avail-
able to MGB-affiliated researchers via a formal application. Weights for the LDpred PRSs are available at PGS Catalog
([email protected]) with PGS IDs PGS002241–PGS002244, and weights for the PRS-CS PRSs with PGS001780–
PGS001781,60 PGS000335,61 and PGS002240.
d Original code generated within this project has been deposited at Zenodo and is publicly available. DOIs are listed in the key
resources table.
d Any additional information is available from the lead contact upon request.
EXPERIMENTAL MODEL AND SUBJECT DETAILS
Each of the six studies had undergone the pre-processing, imputation and quality control steps according to local pipelines. All an-
alyses were limited to adults (age R18).
BioBank JapanBioBank Japan (BBJ) is a multi-institutional hospital-based biobank with DNA and serum samples from 12 medical institutions in
Japan and approximately 200,000 participants.62 The individuals are mainly of Japanese ancestry, and all patients have a diagnosis
of at least 1 of 47 diseases. The study participants have been followed up for their health record after an initial visit, collecting
information on disease onset and cause of death. Each participant has provided written informed consent and the BBJ project
was approved by the research ethics committees of the RIKEN Center for Integrative Medical Sciences and the Institute of Medical
Sciences at the University of Tokyo.
All disease endpoints were defined based on physician’s diagnosis. The coronary artery disease (CAD) diagnosis comprises in-
dividuals diagnosed with myocardial infarction, stable angina, or unstable angina. Age at disease onset was available for a subset
of individual: for 11,717 with CAD, for 30,475 with type 2 diabetes (T2D), for 4,962 with breast cancer and for 4,374 with prostate
cancer. The detailed definitions can be found elsewhere.63 Age at diagnosis was retrieved from medical records.
We genotyped samples with either (i) the Illumina HumanOmniExpressExome BeadChip or (ii) a combination of the Illumina
HumanOmniExpress and HumanExome BeadChips. We applied standard quality control criteria for both samples and variants as
detailed elsewhere.64We then prephased genotypes with Eagle65 and imputed dosages withMinimac3 using 1000Genomes Project
Phase 3 (version 5) data (n = 2,504) and Japanese whole-genome sequencing (WGS) data (n = 1,037) as a reference.64 The dataset
uses genome build 37 (hg19). The polygenic risk score (PRS) calculation was performed with PLINK v2.00a2LM66 using genotype
dosages.
Estonian BiobankThe Estonian Biobank is a population-based biobank of the EstonianGenomeCenter at theUniversity of Tartu (EstBB).67 The biobank
consists of Estonians (83%), Russians (14%), and other nationalities (3%). The genotypes have been linked to several national health
records, including National Health Insurance Fund, hospital databases, prescription data, infraction registries, the cancer registry,
and the Causes of Death registry. All biobank participants have signed a broad informed consent form. Analysis in the EstBB was
carried out under ethics approval 1.1-12/624 from the Estonian Committee on Bioethics and Human Research.
The disease diagnoses were defined based on ICD-10 codes (International Classification of Diseases, 10th revision) as follows: for
CAD, any of I21-I23 or Z95; for type 2 diabetes (T2D), any of E11, excluding gestational diabetes with E10; for breast cancer, any of
C50; for prostate cancer, any of C61. Age at diagnosis was defined as the time in years from birth until the date of first record for each
diagnosis.
All EstBB participants have been genotyped at the Core Genotyping Lab of the Institute of Genomics, University of Tartu, using
Illumina GSAv1.0, GSAv2.0, and GSAv2.0_EST arrays. Samples were genotyped and PLINK format files were created using Illumina
GenomeStudio v2.0.4. Individuals were excluded from the analysis if their call-rate was < 95% or if sex defined based on heterozy-
gosity of X chromosome did not match sex in phenotype data. Before imputation, variants were filtered by call-rate < 95%, HWE
p-value < 1e-4 (autosomal variants only), and minor allele frequency < 1%. Variant positions were updated to b37 (hg19) and all var-
iants were changed to be from TOP strand using GSAMD-24v1-0_20011747_A1-b37.strand.RefAlt.zip files from https://www.well.
ox.ac.uk/�wrayner/strand/ webpage. Pre-phasing was done using Eagle v2.3 software22 (number of conditioning haplotypes
Eagle2 uses when phasing each sample was set to: –Kpbwt=20000) and imputation was done using Beagle v.28Sep18.79323
e2 Cell Genomics 2, 100118, April 13, 2022

Short Articlell
OPEN ACCESS
with effective population size ne=20,000. Population specific imputation reference of 2297 WGS samples was used.68 The PRS
calculation was performed with STEROID 0.1 (https://genomics.ut.ee/en/tools/steroid) using imputed genotype dosages.
FinnGenFinnGen is a collection of prospective epidemiological and disease-based cohorts and hospital biobank samples, aiming for a collec-
tion of 500,000 genotype samples from Finnish individuals by 2023. The Data Freeze 6 consists of 258,402 adult individuals, with their
genotypes linked to national health registries, including the national hospital discharge (available from 1968), death (1969–), cancer
(1953–) andmedication reimbursement (1964–) and purchase (1995–) registries. Information on region of birth was obtained from the
Finnish Population Information System.
CADwas defined as A) any of I20–I25, I46, R96 or R98 (ICD-10), or 410–414 or 798 (ICD-9) as underlying or direct cause of death, or
B) any of I20.0, I21–I22 (ICD-10) or 410, 4110 (ICD-9) as the main diagnosis at hospital discharge, or C) coronary bypass surgery or
coronary angioplasty at hospital discharge or identified from the specific country-wide register of invasive cardiac procedures. T2D
was defined as any of E11.[0-9] (ICD-10), 250.[0-8]A (ICD-9), or use of blood-glucose lowering drugs, and by excluding individuals
with type 1 diabetes with E10.[0-9] (ICD-10), 250.[0-8]B (ICD-9) or with eligibility for special reimbursement for insulin with ICD-10
E10.[0-9]. Breast cancer cases were identified from the cancer registry with diagnosis C50 (International Classification of Diseases
for Oncology, 3rd Edition; ICD-O-3), from the death registry with C50 (ICD-10) and 174 (ICD-9), and from the drug reimbursement
registry by selecting individuals with a reimbursement code for C50 (ICD-10). Similarly, prostate cancer cases were identified
from the cancer registry with diagnosis C61 (ICD-O-3), from the death registry with C61 (ICD-10) and 185 (ICD-9), and from the reim-
bursement registry with C61 (ICD-10). Age at diagnosis was defined as the date of first record for each diagnosis.
The early- and late-settlement analyses were based on information about birthplace. Early settlement comprised the regions
Central Ostrobothnia, Ostrobothnia, South Ostrobothnia, Southwest Finland, Pirkanmaa, Uusimaa, Paijat-Hame, Satakunta,
Kanta-Hame; late settlement contained the regions Kainuu, North Karelia, North Savo and North Ostrobothnia; the borderline
area contained the regions South Savo, Central Finland, Lapland, Kymenlaakso, and South Karelia.
The samples are genotypedwith Illumina and Affymetrix arrays (Illumina Inc., San Diego, and Thermo Fisher Scientific, Santa Clara,
CA, USA). The genotypes have been imputed with using the SISu v3 population-specific reference panel developed from high-quality
data for 3,775 high-coverage (25-30x) whole-genome sequencing in Finns. The detailed genotype imputation workflow can be found
at https://dx.doi.org/10.17504/protocols.io.xbgfijw. The dataset uses genome build 38 (hg38). The PRS calculation was performed
with PLINK v2.00a2.3LM.66
Patients and control subjects in FinnGen provided informed consent for biobank research, based on the Finnish Biobank Act. Alter-
natively, older research cohorts, collected prior the start of FinnGen (in August 2017), were collected based on study-specific con-
sents and later transferred to the Finnish biobanks after approval by Valvira, the National Supervisory Authority for Welfare and
Health. Recruitment protocols followed the biobank protocols approved by Valvira. The Ethics Review Board of the Hospital District
of Helsinki and Uusimaa approved the FinnGen study protocol Nr HUS/990/2017. The FinnGen project is approved by the Finnish
Institute for Health and Welfare (THL), approval number THL/2031/6.02.00/2017, amendments THL/1101/5.05.00/2017, THL/341/
6.02.00/2018, THL/2222/6.02.00/2018, THL/283/6.02.00/2019), Digital and population data service agency VRK43431/2017-3,
VRK/6909/2018-3, the Social Insurance Institution (KELA) KELA 58/522/2017, KELA 131/522/2018, KELA 70/522/2019 and Statistics
Finland TK-53-1041-17.
Following biobanks are acknowledged for collecting the FinnGen project samples: Auria Biobank (https://www.auria.fi/biopankki),
THL Biobank (https://thl.fi/fi/web/thl-biopankki), Helsinki Biobank (https://www.terveyskyla.fi/helsinginbiopankki), Biobank Borealis
of Northern Finland (https://www.oulu.fi/university/node/38474), Finnish Clinical Biobank Tampere (https://www.tays.fi/en-US/
Research_and_development/Finnish_Clinical_Biobank_Tampere), Biobank of Eastern Finland (https://ita-suomenbiopankki.fi), Cen-
tral Finland Biobank (https://www.ksshp.fi/fi-FI/Potilaalle/Biopankki), Finnish Red Cross Blood Service Biobank (https://www.
veripalvelu.fi/verenluovutus/biopankkitoiminta) and Terveystalo Biobank (https://www.terveystalo.com/fi/Yritystietoa/
Terveystalo-Biopankki/Biopankki/). All Finnish Biobanks are members of BBMRI.fi infrastructure (www.bbmri.fi).
The FinnGen project is funded by two grants from Business Finland (HUS 4685/31/2016 and UH 4386/31/2016) and by twelve in-
dustry partners (AbbVie Inc, AstraZeneca UK Ltd, Biogen MA Inc, Celgene Corporation, Celgene International II Sarl, Genentech Inc,
Merck Sharp & Dohme Corp, Pfizer Inc., GlaxoSmithKline Intellectual Property Development Ltd., Sanofi US Services Inc., Maze
Therapeutics Inc., Janssen Biotech Inc, and Novartis AG).
HUNTThe Trøndelag Health Study (HUNT) is a large population-based cohort from the county Nord-Trøndelag in Norway. All residents in
the county, aged 20 years and older, have been invited to participate. Data was collected through three cross-sectional surveys,
HUNT1 (1984-1986), HUNT2 (1995-1997) and HUNT3 (2006-2008), and has been described in detail previously,69 with the fourth
survey recently completed (HUNT4, 2017-2019). DNA from whole blood was collected from HUNT2 and HUNT3, with genotypes
available from 71,860 participants. Participation in the HUNT Study is based on informed consent and the study has been approved
by the Data Inspectorate and the Regional Ethics Committee for Medical Research in Norway (REK: 2014/144, 2015/1205).
CADwas defined as A) any I20.0, I21, or I22 (ICD-10) or 410 or 411 (ICD-9) in the Hospital Registry, or B) any ICD-10 I21-5, I46, R96
or R98 in the Cause of Death Registry. T2D was defined as any E11 (ICD-10) in the Hospital Registry, breast cancer as any C50 in the
Cell Genomics 2, 100118, April 13, 2022 e3

Short Articlell
OPEN ACCESS
Cancer Registry or the Hospital Registry, and prostate cancer as any C61 in the Cancer Registry or the Hospital Registry. Age used as
a covariate was coded as birth year. Age given in the population overview was defined in two ways; The first as estimated age at first
diagnosis occurrence. Age estimation was calculated by subtracting birthyear June 1st from date at first diagnosis occurrence. The
second was estimated age at date of death. Age estimation was calculated by subtracting birthyear June 1st from date of death.
Imputation was performed on the 69,716 samples of recent European ancestry using Minimac3 (v2.0.1, http://genome.sph.umich.
edu/wiki/Minimac3)70 with default settings (2.5 Mb reference-based chunking with 500kb windows) and a customized Haplotype
Reference consortium release 1.1 (HRC v1.1) for autosomal variants and HRC v1.1 for chromosome X variants.71 The customized
reference panel represented the merged panel of two reciprocally imputed reference panels: (1) 2,201 low-coverage whole-genome
sequences samples from the HUNT study and (2) HRC v1.1 with 1,023 HUNTWGS samples removed before merging. We excluded
imputed variants with Rsq < 0.3 resulting in over 24.9 million well-imputed variants. The dataset uses genome build 37 (hg19). The
PRS calculation was performed with PLINK v2.00a2.3LM.66
The Trøndelag Health Study (HUNT) is a collaboration between HUNT Research Centre (Faculty of Medicine and Health Sciences,
Norwegian University of Science and Technology NTNU), Trøndelag County Council, Central Norway Regional Health Authority, and
the Norwegian Institute of Public Health. The genotype quality control and imputation has been conducted by the K. G. Jebsen center
for genetic epidemiology, Department of public health and nursing, Faculty of medicine and health sciences, Norwegian University of
Science and Technology (NTNU).
MGB biobankThe Mass General Brigham (MGB) Biobank [https://biobank.partners.org] is a hospital-based research program launched in 2010
designed to empower genomic and translational research for human health. Participants are patients above age 18 who provided
informed consent to join the biobank in the Mass General Brigham network (previously Partners HealthCare), including Massachu-
setts General Hospital, Brigham andWomen’s Hospital, and other affiliated institutions. Sample recruitment of theMGBBiobankwas
approved by the Partners Human Research Committee (PHRC) (the Institutional Review Board). PHRC provides continued ethical
and scientific oversight of the MGB activities.72 For each consented subject, a collection of blood samples is obtained (plasma,
serum, and DNA), which are then linked to their clinical data in the electronic health records (EHR) as well as survey data on lifestyle,
behavioral and environmental factors, and family history.72 To date, MGB Biobank has enrolled more than 120,000 participants and
released genotyping array data for 36,424 subjects (December 2019). MGB investigators can access the de-identified datasets from
the MGB Biobank under a Data Use Agreement (DUA) without additional study protocols.
The biobank samples are genotyped on Multi-Ethnic Global array (MEGA) from Illumina (Illumina Inc., San Diego, USA) and are
released in several batches. We performed batch-specific genotype data QC to remove SNPs with genotype missing rate >0.05,
samples with genotype missing rate >0.02, and SNPs with differential missing rate >0.01 between any two batches, after which
different batchesweremerged for subsequent QC steps. AsMGBBiobank included individuals from diverse populations, we inferred
genetic ancestry of biobank participants using 1000 Genomes samples (1KG)73 as the population reference panel. Specifically, we
computed principal components (PCs) for biobank samples and 1KG samples combined, and trained a Random Forest classifier to
assign a ‘‘super population’’ label for biobank samples with a prediction probabilityR0.9 using the first 6 PCs of the 1KG samples as
the training data. This resulted in 26,677 individuals classified as European (EUR), 1,607 as African (AFR), 1,840 as Admixed American
(AMR), 504 as East Asian (EAS) and 297 as South Asian (SAS) ancestry. Within each ancestry, we removed samples with a mis-
matched reported and genetic sex, outliers of the absolute value of heterozygosity (>5SD from the mean), and one from each pair
of related individuals (IBD >0.2); SNPs that showed significant batch associations at P < 1 3 10�4, with a missing rate > 0.02 or
HWE test P < 1 3 10�10 were also discarded. Next, we used Michigan Imputation Server (Minimac4) to impute genotype dosages
for biobank samples, with the Haplotype Reference Consortium (HRC) as the reference panel for EUR ancestry and 1KG phase3 AFR
data as the reference for AFR samples. Lastly, we removed markers with imputation quality INFO score <0.8, minor allele frequency
(MAF) <0.01, a significant deviation fromHWEwith P < 1 3 10�10, andmissing rate >0.02. The dataset uses genome build 37 (hg19).
EUR and AFR ancestries were chosen for PRS analysis in the present study based on having >50 cases available for all four dis-
eases. The disease diagnoses were the following ICD-10 diagnoses in the linked EHR data for biobank participants (with ICD-9 codes
converted to ICD-10): for CAD, any of a I20.0, I21, or I22; for T2D, any of E11.[0-9]; for breast cancer, any of C50; for prostate cancer,
any of C61. Age at disease onset was not available from the de-identified dataset. The PRS calculation was performed with PLINK2
using genotype dosages.
UK biobankUK Biobank is a prospective cohort study comprising approximately 500,000 individuals from across the United Kingdom, aged be-
tween 40 and 69 at recruitment. The cohort contains deep phenotyping, including biological measurements, lifestyle factors, and
clinically relevant blood biomarkers. Although most individuals in the cohort are of European ancestry, over 20,000 individuals
have a self-reported ethnic background originating outside Europe. The dataset has been imputed using the merged UK10K and
1000 Genomes (phase 3) reference panels.74 Details on the cohort, as well as data generation and imputation have been previously
described.75 The dataset uses genome build 37 (hg19). The PRS calculation was performed with PLINK v2.00a2.3LM.66
We thank all participants in the UKBiobank study. This research was conducted using the UKBiobank Resource under Application
Number 22627. UK Biobank has obtained ethics approval from the North-West Multi-centre Research Ethics Committee (approval
e4 Cell Genomics 2, 100118, April 13, 2022

Short Articlell
OPEN ACCESS
number: 11/NW/0382) that covers analysis of data by approved researchers. UK Biobank obtained informed consent from all
participants.
CAD was defined as A) any of I20–I25, I46, or R96 (ICD-10) as the primary or secondary cause of death (from data fields 40001 and
40002, age from data field 40007), B) any of I20.0, I21–I22 (ICD-10) or 410, 4110 (ICD-9) in the hospital inpatient records (from data
fields 41270 and 41271, age defined based on data fields 41280 and 41281), or C) any coronary revascularization procedure
(OPCS-4, variable 41272, codes K40, K41, K42, K43, K44, K45, K46, K49, K501, and K75, and age defined based on data field
41282; OPSC-3, data field 41273, code 3043, age defined based on data field 41283; self-reported operations, data field 20004, co-
des 1070 and 1095, age defined based on data field 20010).
T2D was defined as A) diabetes diagnosed by doctor (data field 2443, age from data field 2976) excluding individuals with age at
diagnosis under 18, and individuals with type 1 diabetes by ICD-10 diagnosis E10 (from data field 41270), or B) ICD-10 E11 as the
primary or secondary cause of death (from data fields 40001 and 40002, age from data field 40007). Breast cancer was defined as A)
ICD-10 C50 in the Cancer register (data field 40006, age at diagnosis from data field 40008), B) C50 (ICD-10) or 174 (ICD-9) in the
hospital inpatient records (from data fields 41270 and 41271, age defined based on data fields 41280 and 41281), or C) C50 (ICD-
10) as the primary or secondary cause of death (from data fields 40001 and 40002, age from data field 40007). Prostate cancer
was defined as A) ICD-10 C61 in the Cancer register (data field 40006, age at diagnosis from data field 40008), B) C61 (ICD-10) in
the hospital inpatient records (from data field 41270, age defined based on data field 41280), or C) C61 (ICD-10) as the primary or
secondary cause of death (from data fields 40001 and 40002, age from data field 40007).
White British individuals within the UK Biobank represented European ancestry, with all European-ancestry pairs unrelated to
KING’s kinship value 0.0442. South Asian ancestry was defined based on self-report (data field 21000) of being Indian, Pakistani,
or Bangladeshi (codes 3001, 3002, 3003). Black / Caribbean ancestry was similarly defined based on self-report of being Caribbean,
African, or any other Black background (codes 4001, 4002, 4003). These two non-European ancestry groups where chosen based on
having >50 cases available for analysis for all four diseases.
METHOD DETAILS
Polygenic risk scoresThe PRSs were derived with LDpred,31 a software that weights the single-nucleotide polymorphisms in GWAS summary statistics by
their effect sizes by accounting for linkage disequilibrium (LD) between markers. The input weights were obtained from the largest
available disease consortia GWAS (Table S4).11–14 The LD reference panel consisted of 503 European individuals from 1000 Ge-
nomes phase 3.73 Out of 10 candidate PRSs concerning the LDpred default parameters for the fraction of causal variants, the
PRSs with the best discriminative capacity (measured with maximum area under the receiver-operator curve, AUC) were chosen
based on an earlier FinnGen data freeze (DF4) with 176,899 individuals. The PRSs were then calculated over autosomal chromo-
somes as the weighted sum of effect alleles. The number of variants used for each LDpred PRS are shown in Table S1. The
number of variants available for PRS calculation (e.g. due to being polymorphic in the population) was lowest in BioBank Japan
(67.1%-67.5%) and in individuals of African ancestry in MGB Biobank (75.9%-77.3%), with amount for the rest ranging from
89.9% to 100%. To perform the analysis in a setting as similar as possible to clinical use cases, where variant optimization cannot
always be done for the derivation and test sets, we did not seek to optimize variant overlap between datasets. Some of our datasets
had small overlap with the GWASs used for building the PRSs. These overlapping proportions were 5.9% for CAD and 7.5% for T2D
in Estonian Biobank and 2.0% in FinnGen for CAD, which may result in slight overestimation of effects within Estonian biobank and
FinnGen.
In UKBiobank, the LDpred PRSs were compared to two other types of PRSs generatedmostly in individuals of European ancestry:
1) to previously published PRSs containing a smaller number of variants (PGS Catalog IDs PGS000012, PGS000020, PGS000004,
PGS000662)3,10,17,18 and 2) to genome-wide PRSs generated with PRS-CS. In the smaller PRSs, the number of variants in the final
score in UK Biobank (out of the variants in the original score) was 48,523/49,310 for CAD, 7,491/7,502 for T2D, 306/313 for breast
cancer, and 267/269 for prostate cancer. PRS-CS uses HapMap3 variants when inferring posterior effect sizes,32 and we used 1000
Genomes Project European sample (N = 503) as the external LD reference panel, using autosomes.73 The PRS-CS scores were
generated with the PRS-CS-auto approach in the FinnGen dataset, using the same GWASs used for generating the LDpred
PRSs. The number of variants in UK Biobank (out of the variants in the original PRS-CS score) was 1,087,714/1,090,048 for CAD,
1,089,342/1,091,673 for T2D, 1,077,906/1,079,089 for breast cancer, and 1,089,645/1,092,093 for prostate cancer.When comparing
decreases in effect sizes between different PRSs and across ancestries, the decreases were calculated from regression estimates
(log odds).
QUANTIFICATION AND STATISTICAL ANALYSIS
All sample sizes are shown in Tables 1 and Table S2. In each study, each PRSwas scaled to zeromean and unit variance by ancestry.
In analyses by settlement in FinnGen, the scaling was done in the full FinnGen dataset. The odds ratio for risk of disease by one SD
increase for the PRS was assessed using a logistic regression model (Figures 1, 2, S1, and S2; Tables S2 and S3). In all models, the
covariates were age (age at baseline, at the end of follow-up, or birth year; depending on biobank) sex (for CHD and T2D), batch or
Cell Genomics 2, 100118, April 13, 2022 e5

Short Articlell
OPEN ACCESS
genotyping array (when available), and the first 10 principal components of ancestry. Incident and prevalent cases were considered
jointly. For statistical analyses, each biobank used R (version 3.2.0 or later). ORs by ancestry were pooled by random effects meta-
analysis with function metagen() in R package meta (Figure 1, Table S2). All tests were two-tailed. P-value for heterogeneity was
calculated based on Cochran’s heterogeneity statistic (Table S2).
e6 Cell Genomics 2, 100118, April 13, 2022

Cell Genomics, Volume 2
Supplemental information
Genome-wide risk prediction of common diseases
across ancestries in one million people
Nina Mars, Sini Kerminen, Yen-Chen A. Feng, Masahiro Kanai, Kristi Läll, Laurent F.Thomas, Anne Heidi Skogholt, Pietro della Briotta Parolo, The Biobank JapanProject, FinnGen, Benjamin M. Neale, Jordan W. Smoller, Maiken E.Gabrielsen, Kristian Hveem, Reedik Mägi, Koichi Matsuda, Yukinori Okada, MattiPirinen, Aarno Palotie, Andrea Ganna, Alicia R. Martin, and Samuli Ripatti

Table S1. Number of variants included in the LDpred polygenic risk scores (PRS). The table shows the number of variants used for
calculating the PRS in each dataset shown in Figure 1. The table also shows the proportion (%) of variants out of the original LDpred-
adjusted summary statistics used for calculating the PRS.
CAD T2D Breast cancer Prostate cancer
p = 0.003 p = 0.003 p = 0.03 p = 0.01
Variants % Variants % Variants % Variants % Original summary statistics 6 576 338 - 6 431 973 - 6 494 889 - 6 497 734 - BioBank Japan 4 410 149 67.1 4 344 264 67.5 4 375 073 67.4 4 375 963 67.3 Estonian Biobank 6 259 397 95.2 6 429 286 100.0 6 490 064 99.9 6 492 877 99.9 FinnGen 6 068 083 92.3 6 320 939 98.3 6 375 257 98.2 6 377 882 98.2 HUNT 6 472 970 98.4 6 376 169 99.1 6 420 662 98.9 6 423 074 98.9 MGB Biobank
European 5 911 460 89.9 5 796 975 90.1 5 806 787 89.4 5 804 880 89.3 African 5 086 035 77.3 4 881 847 75.9 4 918 230 75.7 4 917 955 75.7
UK Biobank
European 6 165 767 93.8 6 422 449 99.9 6 480 780 99.8 6 483 638 99.8 African / Caribbean
South Asian
CAD = coronary artery disease, T2D = type 2 diabetes. p denotes the LDpred parameter for the fraction of causal variants in the selected PRS. The PRSs with the best discriminative capacity (measured with maximum area under the receiver-operator curve, AUC) were chosen based on an earlier FinnGen data freeze (DF4) with 176,899 individuals.

Table S2. Effect sizes, and case and control counts corresponding to Figure 1. Odds ratios (OR) with 95%
confidence intervals (CI) are presented for 1-SD increase in the polygenic risk scores.
Disease OR 95% CI
p-value for test of
heterogeneity Number of
cases Number of
controls Figure 1, Panel A
MGB Biobank, African CAD 1.10 0.96-1.26
0.06
285
1 250
UK Biobank, African / Caribbean CAD 1.32 1.13-1.54 169
7 459
BioBank Japan CAD 1.32 1.30-1.34 29 080
149 646
UK Biobank, South Asian CAD 1.41 1.30-1.53 740
6 888
European (pooled estimate) CAD 1.54 1.53-1.55 - -
MGB Biobank, African T2D 1.24 1.09-1.42
7.38e-06
660
875
UK Biobank, African / Caribbean T2D 1.46 1.32-1.62 691
6 656
BioBank Japan T2D 1.37 1.36-1.39 40 121
137 024
UK Biobank, South Asian T2D 1.66 1.55-1.79 1 120
6 145
European (pooled estimate) T2D 1.62 1.61-1.64 - -
MGB Biobank, African Breast cancer 0.90 0.69-1.17
0.03
64
879
UK Biobank, African / Caribbean Breast cancer 1.12 0.93-1.35 132
4 210
BioBank Japan Breast cancer 1.25 1.21-1.28 5 316
69 629
UK Biobank, South Asian Breast cancer 1.47 1.23-1.75 139
3 375
European (pooled estimate) Breast cancer 1.49 1.47-1.51 - -
MGB Biobank, African Prostate cancer 1.19 0.91-1.55
0.001
80
512
UK Biobank, African / Caribbean Prostate cancer 1.35 1.14-1.61 199
3 077
BioBank Japan Prostate cancer 1.69 1.64-1.74 5 192
90 773
UK Biobank, South Asian Prostate cancer 2.21 1.73-2.81 72
4 042
European (pooled estimate) Prostate cancer 1.89 1.86-1.92 - -
Figure 1, Panel B
MGB Biobank, European CAD 1.35 1.29 - 1.40
3.55e-28
3 206
22 490
Estonian Biobank CAD 1.47 1.43 - 1.52 5 064
105 533
FinnGen CAD 1.53 1.50 - 1.55 25 706
232 696
HUNT CAD 1.44 1.40 - 1.48 6 594
62 827
UK Biobank, European CAD 1.64 1.61 - 1.67 17 986
325 690
MGB Biobank, European T2D 1.46 1.41 - 1.51
3.48e-35
5 182
20 514
Estonian Biobank T2D 1.55 1.51 - 1.59 7 066
103 531
FinnGen T2D 1.58 1.56 - 1.60 37 001
213 319
HUNT T2D 1.64 1.60 - 1.69 5 228
64 191
UK Biobank, European T2D 1.78 1.75 - 1.81 13 616
326 173

MGB Biobank, European Breast cancer 1.45 1.38 - 1.54
0.63
1 513 12 139
Estonian Biobank Breast cancer 1.45 1.37 - 1.53 1 379
73 053
FinnGen Breast cancer 1.48 1.45 - 1.51 11 573
134 561
HUNT Breast cancer 1.50 1.43 - 1.58 1 731
35 053
UK Biobank, European Breast cancer 1.50 1.47 - 1.53 11 075
173 498
MGB Biobank, European Prostate cancer 1.66 1.57 - 1.76
2.91e-07
1 593
10 451
Estonian Biobank Prostate cancer 1.79 1.68 - 1.91 1 202
34 963
FinnGen Prostate cancer 1.96 1.91 - 2.01 8 709
103 559
HUNT Prostate cancer 1.80 1.72 - 1.88 2 224
30 413
UK Biobank, European Prostate cancer 1.91 1.86 – 1.96 7 429
151 674
Figure 1, Panel C
Early settlement CAD 1.54 1.51-1.58
0.56
12 487 131 981
Borderline CAD 1.51 1.45-1.56 4 809 42 888
Late settlement CAD 1.54 1.50-1.59 6 837 51 283
Early settlement T2D 1.59 1.56-1.62
0.32
19 937 119 799
Borderline T2D 1.55 1.51-1.60 6 636 39 561
Late settlement T2D 1.59 1.55-1.63 9 045 47 429
Early settlement Breast cancer 1.49 1.45-1.53
0.70
6 866 75 151
Borderline Breast cancer 1.48 1.42-1.55 2 098 25 506
Late settlement Breast cancer 1.46 1.40-1.52 2 260 29 856
Early settlement Prostate cancer 1.93 1.87-1.99 0.07
5 161 57 290
Borderline Prostate cancer 2.09 1.97-2.22 1 451 18 642 Late settlement Prostate cancer 1.95 1.84-2.06 1 651 24 353
CAD = coronary artery disease, T2D = type 2 diabetes. In Panel A, ORs from Panel B are combined by random effects meta-analysis to the European pooled estimate; In Panel C, out of 258,402 in FinnGen, 8,117 individuals were excluded, comprising 3,157 born abroad, 4,304 born in regions ceded to Soviet, 182 born in Åland Islands, and 474 with missing data. Detailed information of the Finnish regions in Panel C provided in supplementary methods. P-value for heterogeneity was calculated based on Cochran’s heterogeneity statistic.

Table S3. Comparison of polygenic risk scores (PRS) in UK Biobank. Related to Figure 2, the table shows
a comparison of PRSs developed with different methodologies. The decreases in effect sizes were calculated
from regression estimates (log odds). The number of cases and controls in each category is listed in Table 1.
OR 95% CI
Decrease in effect size
compared to European ancestry
Decrease in effect size compared to
PRS-CS in European ancestry
Decrease in effect size compared to PRS-CS in South
Asian ancestry
Decrease in effect size compared to
PRS-CS in African / Caribbean
ancestry Coronary artery disease Limited-variant PRS
European 1.41 1.39-1.43 Ref 64 % South Asian 1.34 1.23-1.46 85 % 61 % African / Caribbean 1.18 0.96-1.46 49 % 63 %
LDpred PRS European 1.64 1.61-1.67 Ref 93 % South Asian 1.41 1.30-1.53 69 % 71 % African / Caribbean 1.32 1.13-1.54 56 % 104 %
PRS-CS PRS European 1.70 1.68-1.73 Ref Ref South Asian 1.61 1.48-1.75 90 % Ref African / Caribbean 1.30 1.12-1.52 56 % Ref
Type 2 diabetes Limited-variant PRS
European 1.69 1.66-1.72 Ref 92 % South Asian 1.61 1.50-1.74 91 % 98 % African / Caribbean 1.35 1.22-1.49 57 % 89 %
LDpred PRS European 1.78 1.75-1.81 Ref 101 % South Asian 1.66 1.55-1.79 88 % 105 % African / Caribbean 1.46 1.32-1.62 65 % 113 %
PRS-CS PRS European 1.77 1.74-1.80 Ref Ref South Asian 1.63 1.51-1.75 85 % Ref African / Caribbean 1.40 1.25-1.55 58 % Ref
Breast cancer Limited-variant PRS
European 1.64 1.61-1.67 Ref 86 % South Asian 1.36 1.14-1.62 62 % 65 % African / Caribbean 1.34 1.13-1.60 60 % 70 %
LDpred PRS European 1.50 1.47-1.53 Ref 71 % South Asian 1.47 1.23-1.75 95 % 81 % African / Caribbean 1.12 0.93-1.35 28 % 27 %
PRS-CS PRS European 1.77 1.74-1.81 Ref Ref South Asian 1.61 1.35-1.92 83 % Ref African / Caribbean 1.53 1.27-1.84 74 % Ref
Prostate cancer Limited-variant PRS
European 2.20 2.14-2.25 Ref 104 % South Asian 2.06 1.60-2.64 92 % 77 % African / Caribbean 1.72 1.46-2.02 69 % 151 %
LDpred PRS European 1.91 1.86-1.96 Ref 85 % South Asian 2.21 1.73-2.81 123 % 85 % African / Caribbean 1.35 1.14-1.61 47 % 84 %
PRS-CS PRS European 2.14 2.09-2.19 Ref Ref South Asian 2.54 1.98-3.26 123 % Ref African / Caribbean 1.43 1.21-1.69 47 % Ref

Table S4. Information on genome-wide association study (GWAS) summary statistics. Information on GWAS used for constructing the polygenic risk
scores in Figure 1.
Disease GWAS Ethnicity N Cases / N Controls Proportion of test datasets overlapping with GWAS
Coronary artery disease Nikpay et al. https://doi.org/10.1038/ng.3396
European 77%, 13% South Asian, 6% East Asian, 4% other
60,801 / 123,504 5.9% of Estonian Biobank, 2.0% of FinnGen
Type 2 diabetes Scott et al. https://doi.org/10.2337/db16-1253
European 26,676 / 132,532 7.5% of Estonian Biobank
Breast cancer Michailidou et al. https://doi.org/10.1038/nature24284
European 89%, East Asian 11% 137,045 / 119,078 No overlap detected
Prostate cancer Schumacher et al. https://doi.org/10.1038/s41588-018-0142-8
European 46,939 / 27,910 No overlap detected

Figure S1. Impact of LDpred parameter choice. Effect sizes across ancestries in UK Biobank with the different default fractions of causal variants with
LDpred. Odds ratios (OR) with 95% confidence intervals (CI) are shown for 1-SD increase in the polygenic risk scores. The fraction of causal variants used in
the main analyses in Figure 1 are bolded. The number of cases and controls in each category is listed in Table 1.
1.0
1.5
2.0
2.5
p1.0000e−04
p3.0000e−04
p1.0000e−03
p3.0000e−03
p1.0000e−02
p3.0000e−02
p1.0000e−01
p3.0000e−01
p1.0000e+00 inf
OR
per S
D (9
5% C
I)
Coronary artery disease
1.0
1.5
2.0
2.5
p1.0000e−04
p3.0000e−04
p1.0000e−03
p3.0000e−03
p1.0000e−02
p3.0000e−02
p1.0000e−01
p3.0000e−01
p1.0000e+00 inf
OR
per S
D (9
5% C
I)
Type 2 diabetes
1.0
1.5
2.0
2.5
p1.0000e−04
p3.0000e−04
p1.0000e−03
p3.0000e−03
p1.0000e−02
p3.0000e−02
p1.0000e−01
p3.0000e−01
p1.0000e+00 inf
OR
per S
D (9
5% C
I)
Breast cancer
1.0
1.5
2.0
2.5
p1.0000e−04
p3.0000e−04
p1.0000e−03
p3.0000e−03
p1.0000e−02
p3.0000e−02
p1.0000e−01
p3.0000e−01
p1.0000e+00 inf
OR
per S
D (9
5% C
I)
Prostate cancer
European
South Asian
African / Caribbean

Figure S2. Detailed effect size comparison across early- and late-settlement regions in Finland. The figure shows detailed results by region within the
settlement regions shown in Figure 1 panel C, using the same PRSs as in Figure 1. The early-settlement region is shown in blue, the late-settlement region in
red, and the borderline region in gray.
OR = odds ratio, CAD = coronary artery disease, T2D = type 2 diabetes. Regions are based on data on birthplace. Out out of 258,402 individuals in FinnGen, 8,117 individuals excluded, including 3,157 born abroad, 4,304 born in regions ceded to Soviet, 182 born in Åland Islands (not shown in the map due to the exclusion; excluded due to low sample size), and 474 with missing data.
Related Documents


