Genome-Wide Computational Prediction and Analysis of Core Promoter Elements across Plant Monocots and Dicots Sunita Kumari 1 , Doreen Ware 1,2 * 1 Cold Spring Harbor Laboratory, Cold Spring Harbor, New York, United States of America,, 2 United States Department of Agriculture-Agriculture Research Service, Robert W. Holley Center for Agriculture and Health, Ithaca, New York, United States of America Abstract Transcription initiation, essential to gene expression regulation, involves recruitment of basal transcription factors to the core promoter elements (CPEs). The distribution of currently known CPEs across plant genomes is largely unknown. This is the first large scale genome-wide report on the computational prediction of CPEs across eight plant genomes to help better understand the transcription initiation complex assembly. The distribution of thirteen known CPEs across four monocots (Brachypodium distachyon, Oryza sativa ssp. japonica, Sorghum bicolor, Zea mays) and four dicots (Arabidopsis thaliana, Populus trichocarpa, Vitis vinifera, Glycine max) reveals the structural organization of the core promoter in relation to the TATA-box as well as with respect to other CPEs. The distribution of known CPE motifs with respect to transcription start site (TSS) exhibited positional conservation within monocots and dicots with slight differences across all eight genomes. Further, a more refined subset of annotated genes based on orthologs of the model monocot (O. sativa ssp. japonica) and dicot (A. thaliana) genomes supported the positional distribution of these thirteen known CPEs. DNA free energy profiles provided evidence that the structural properties of promoter regions are distinctly different from that of the non-regulatory genome sequence. It also showed that monocot core promoters have lower DNA free energy than dicot core promoters. The comparison of monocot and dicot promoter sequences highlights both the similarities and differences in the core promoter architecture irrespective of the species-specific nucleotide bias. This study will be useful for future work related to genome annotation projects and can inspire research efforts aimed to better understand regulatory mechanisms of transcription. Citation: Kumari S, Ware D (2013) Genome-Wide Computational Prediction and Analysis of Core Promoter Elements across Plant Monocots and Dicots. PLoS ONE 8(10): e79011. doi:10.1371/journal.pone.0079011 Editor: Shin-Han Shiu, Michigan State University, United States of America Received February 11, 2013; Accepted September 18, 2013; Published October 29, 2013 This is an open-access article, free of all copyright, and may be freely reproduced, distributed, transmitted, modified, built upon, or otherwise used by anyone for any lawful purpose. The work is made available under the Creative Commons CC0 public domain dedication. Funding: This work is funded by USDA (1907-21000-030) and Gramene (DBI 0703908). The funders had no role in study design, data collection and analysis, decision to publish, or preparation of the manuscript. Competing Interests: The authors have declared that no competing interests exist. * E-mail: [email protected] Introduction Despite numerous technological advances in biological and computational sciences in the post- genome era, our basic understanding of gene regulatory mechanisms remains primitive. Currently, the fundamental need to understand RNA polymerase II (polII) mediated transcription initiation is well recognized for developing system level understanding of the condition-specific gene regulatory networks (GRNs). It is now well known that the TATA-box motif, once thought to be necessary for formation of polII pre-initiation complex (PIC) assembly, only accounts for a small fraction of the expressed genome [1,2,3]. Furthermore, it is still challenging to accurately identify the transcription start site (TSS) and predict the functional genomic elements in the promoter region. Therefore, incorporation of TSS and cis- regulatory element identification tools into genome annotation pipelines has yet to become a common practice. While experi- mental approaches like yeast-1-hybrid (Y1H) [4] and chromatin- immunoprecipitation (ChIP) assays [5] have made great strides in identifying transcription factor binding sites (TFBS) for a few model organisms, there are still technical and cost barriers to implement these methods on a large scale. There is a need for robust bioinformatics methods that can accurately identify TSS and predict the TFBS for the plant genomes. Reliable prediction of core promoter elements holds the promise to bridge this gap. Promoter regions can be categorized into two classes: core (proximal) and extended (distal). The core promoter is the primary docking site of polII PIC and directs basal transcription [6,7]. The cis-regulatory elements in the extended promoter region are thought to control spatial and temporal expression of their associated gene(s) [8]. Transcription of protein coding genes depends on the formation of the PIC assembly that includes RNA polymerase II, the general transcription factors (TFIIB, TFIID, TFIIE, TFIIF, TFIIH) along with co-activators and other protein complexes [9,10]. A subunit of transcription factor TFIID complex, the TATA-binding protein (TBP), binds to the TATA- box, which is located ,30 bp upstream of the TSS and nucleates PIC assembly [11,12]. However, only 13% of yeast promoters and 10% of human promoters contain the TATA-box [13]. In Arabidopsis, around 29% of promoters have been reported to contain a TATA-box, ,32 bp upstream with respect to the TSS [14] whereas in rice around 19% of promoters contain TATA-box [15]. Previous studies in yeast and human have reported that the TATA-box is generally associated with tissue specific expression and mostly regulated by stress stimuli whereas TATA-less genes PLOS ONE | www.plosone.org 1 October 2013 | Volume 8 | Issue 10 | e79011

Welcome message from author
This document is posted to help you gain knowledge. Please leave a comment to let me know what you think about it! Share it to your friends and learn new things together.
Transcript

Genome-Wide Computational Prediction and Analysis ofCore Promoter Elements across Plant Monocots andDicotsSunita Kumari1, Doreen Ware1,2*
1 Cold Spring Harbor Laboratory, Cold Spring Harbor, New York, United States of America,, 2 United States Department of Agriculture-Agriculture Research Service, Robert
W. Holley Center for Agriculture and Health, Ithaca, New York, United States of America
Abstract
Transcription initiation, essential to gene expression regulation, involves recruitment of basal transcription factors to thecore promoter elements (CPEs). The distribution of currently known CPEs across plant genomes is largely unknown. This isthe first large scale genome-wide report on the computational prediction of CPEs across eight plant genomes to help betterunderstand the transcription initiation complex assembly. The distribution of thirteen known CPEs across four monocots(Brachypodium distachyon, Oryza sativa ssp. japonica, Sorghum bicolor, Zea mays) and four dicots (Arabidopsis thaliana,Populus trichocarpa, Vitis vinifera, Glycine max) reveals the structural organization of the core promoter in relation to theTATA-box as well as with respect to other CPEs. The distribution of known CPE motifs with respect to transcription start site(TSS) exhibited positional conservation within monocots and dicots with slight differences across all eight genomes. Further,a more refined subset of annotated genes based on orthologs of the model monocot (O. sativa ssp. japonica) and dicot (A.thaliana) genomes supported the positional distribution of these thirteen known CPEs. DNA free energy profiles providedevidence that the structural properties of promoter regions are distinctly different from that of the non-regulatory genomesequence. It also showed that monocot core promoters have lower DNA free energy than dicot core promoters. Thecomparison of monocot and dicot promoter sequences highlights both the similarities and differences in the core promoterarchitecture irrespective of the species-specific nucleotide bias. This study will be useful for future work related to genomeannotation projects and can inspire research efforts aimed to better understand regulatory mechanisms of transcription.
Citation: Kumari S, Ware D (2013) Genome-Wide Computational Prediction and Analysis of Core Promoter Elements across Plant Monocots and Dicots. PLoSONE 8(10): e79011. doi:10.1371/journal.pone.0079011
Editor: Shin-Han Shiu, Michigan State University, United States of America
Received February 11, 2013; Accepted September 18, 2013; Published October 29, 2013
This is an open-access article, free of all copyright, and may be freely reproduced, distributed, transmitted, modified, built upon, or otherwise used by anyone forany lawful purpose. The work is made available under the Creative Commons CC0 public domain dedication.
Funding: This work is funded by USDA (1907-21000-030) and Gramene (DBI 0703908). The funders had no role in study design, data collection and analysis,decision to publish, or preparation of the manuscript.
Competing Interests: The authors have declared that no competing interests exist.
* E-mail: [email protected]
Introduction
Despite numerous technological advances in biological and
computational sciences in the post- genome era, our basic
understanding of gene regulatory mechanisms remains primitive.
Currently, the fundamental need to understand RNA polymerase
II (polII) mediated transcription initiation is well recognized for
developing system level understanding of the condition-specific
gene regulatory networks (GRNs). It is now well known that the
TATA-box motif, once thought to be necessary for formation of
polII pre-initiation complex (PIC) assembly, only accounts for a
small fraction of the expressed genome [1,2,3]. Furthermore, it is
still challenging to accurately identify the transcription start site
(TSS) and predict the functional genomic elements in the
promoter region. Therefore, incorporation of TSS and cis-
regulatory element identification tools into genome annotation
pipelines has yet to become a common practice. While experi-
mental approaches like yeast-1-hybrid (Y1H) [4] and chromatin-
immunoprecipitation (ChIP) assays [5] have made great strides in
identifying transcription factor binding sites (TFBS) for a few
model organisms, there are still technical and cost barriers to
implement these methods on a large scale. There is a need for
robust bioinformatics methods that can accurately identify TSS
and predict the TFBS for the plant genomes. Reliable prediction
of core promoter elements holds the promise to bridge this gap.
Promoter regions can be categorized into two classes: core
(proximal) and extended (distal). The core promoter is the primary
docking site of polII PIC and directs basal transcription [6,7]. The
cis-regulatory elements in the extended promoter region are
thought to control spatial and temporal expression of their
associated gene(s) [8]. Transcription of protein coding genes
depends on the formation of the PIC assembly that includes RNA
polymerase II, the general transcription factors (TFIIB, TFIID,
TFIIE, TFIIF, TFIIH) along with co-activators and other protein
complexes [9,10]. A subunit of transcription factor TFIID
complex, the TATA-binding protein (TBP), binds to the TATA-
box, which is located ,30 bp upstream of the TSS and nucleates
PIC assembly [11,12]. However, only 13% of yeast promoters and
10% of human promoters contain the TATA-box [13]. In
Arabidopsis, around 29% of promoters have been reported to
contain a TATA-box, ,32 bp upstream with respect to the TSS
[14] whereas in rice around 19% of promoters contain TATA-box
[15]. Previous studies in yeast and human have reported that the
TATA-box is generally associated with tissue specific expression
and mostly regulated by stress stimuli whereas TATA-less genes
PLOS ONE | www.plosone.org 1 October 2013 | Volume 8 | Issue 10 | e79011

are constitutively expressed and predominantly involved in
housekeeping processes [13,16,17,18]. These findings suggest that
core promoter architecture has a strong influence on the
transcriptional regulation. As TATA-containing promoters are
far less prevalent than TATA-less promoters, other DNA-elements
must be responsible for coordinating transcription in a sizeable
number of promoters. In Saccharomyces cerevisiae, Drosophila melano-
gaster, and mammals, several other CPEs have been identified in
TATA and TATA-less promoters that include the initiator (Inr)
element located at or surrounding the TSS which is recognized by
TAF1 and TAF2 subunits of the TFIID complex [14], the TFIIB
recognition element (BRE) located immediately upstream (BREu)
[19] and/or downstream (BREd) of the TATA-box [20], the
downstream promoter element (DPE) located between positions
+28 to +33 (relative to the TSS) which is recognized by TAF6 and
TAF9 subunits of the TFIID complex [21], the motif ten element
(MTE) located between positions +18 and +29 [22], and the
downstream core element (DCE) located around positions +6 to
+35 [23]. Other less characterized downstream elements include
the X gene Core Promoter Element 1 (XCPE1) located between
positions 28 to +2 in hepatitis B virus X gene promoter and found
in ,1% of human TATA-less genes [24], and the Multiple start
site Element Downstream (MED-1) identified in the majority of
TATA-less promoters of mammalian genes analyzed [25]. The
CCAAT-box is located between 2300 to 280 bp from TSS in
human promoters [26] and there is evidence for conservation of
this element in other eukaryotes including plants [27,28,29]. Based
on a further comparison of CPEs of mammalian and plants, CpG
islands were found mainly in mammalian promoters whereas the
Y-patch (also called the pyrimidine patch) was found to be plant
specific [30].
Very little is known about the cis-regulatory elements of
transcription control in plants. In the past decade, considerable
work has focused on model animal species like D. melanogaster
[1,31,32,33,34,35,36,37,38], Caenorhabditis elegans [39,40,41], Rattus
norvegicus [42,43,44,45,46,47,48], Mus musculus [49,50,51,52,
53,54,55,56,57,58,59,60,61], and Homo sapiens [2,31,51,60,62,
63,64,65,66,67,68,69,70,71,72,73,74]. However, plant core pro-
moters have yet to be thoroughly analyzed [75]. Previous studies
in plants have focused mainly on Arabidopsis and rice and
generally included the identification of TATA-box and Y-patch
elements in selected sets of promoter sequences [14,15]. It was
reported that , 50% of rice gene promoters possess one or more
Y-patches in their core promoters [15]. The plant promoter
database (ppdb) [76] also identifies putative TATA-box and Y-
patch elements in several plant genomes using the computational
method of local distribution of short sequences (LDSS) [77]. Cis-
regulatory regions have been predicted based on the free energy of
DNA melting in Arabidopsis and rice genomes [78]. The
packaging of DNA into chromatin, DNA methylation, and
chromatin structure demonstrates the uniqueness in the promoter
structure and create multiple levels of complexity to the regulation
of gene expression [79,80]. Thus, the identification of CPEs is
essential in understanding the logic behind transcriptional
regulation [30,81,82]. Analysis of CPEs at the whole genome
level in different plant genomes will contribute to fundamental
insights into the mechanisms by which transcription occurs in
plants and how it differs from other eukaryotes.
Due to the complexity, diversity and inherent degenerate nature
of regulatory motifs within promoters, the prediction of cis-
regulatory elements is quite challenging and in silico prediction is
still in its early stage. Though the number of computational motif
discovery methods has significantly increased in last two decades
[83], there is no single method that adequately captures all types of
regulatory motif patterns [84,85,86,87]. Existing promoter analysis
tools cannot reliably identify cis regulatory elements in a genomic
sequence, thus predicting too many false positives because these
tools are generally focused only on the sequence content [88].
Position weight matrices (PWMs) use the log-likelihood scoring
function for computing a match score for potential binding sites
and therefore have been reported to be better measure than the
consensus sequence [89,90]. However, it is still challenging for
PWM based predictive methods to distinguish functional TFBS
from non-functional predictions without applying additional
refinements such as cross-species conservation [91,92,93]. Func-
tional studies on understanding the role of conserved genomic
regions from species to species have shown positional conservation
to be one of the key biological characteristics of the DNA-motifs in
a regulatory context [94,95,96]. Therefore, predictions of TFBS
with respect to TSS of orthologous genes are expected to reduce
false positive rates and might be potentially functional. Our study
leveraged monocot and dicot orthologous genes to provide
additional metric for giving higher confidence to the TFBS
prediction results that we believe to be testable for biological
relevance. Recently, DNA free energy profiles have also been used
for predicting TSS that significantly improved the motif discovery
in yeast [81,97].
We performed a genome-wide prediction of known CPEs in
eight plant species spanning both monocots and dicots, by
developing a systematic and unbiased high-throughput methodol-
ogy using PWMs, DNA free energy profiles, and homology to
significantly reduce the false positive rate of motif discovery. The
CPE profiles were compared to see the similarities and differences
in promoter sequence architecture within and across monocots
and dicots.
Results
Core promoter regions are generally reported within a tight
window of TSS650bases [2,14,98]. Even though each CPE’s
reported motif signal position in this region is strong and likely
represents the binding site location ultimately responsible for polII
assembly in eukaryotes [1,35,99,100], it is not known if this
represents local or global maxima in the CPE’s relative abundance
with respect to TSS. Experimental studies of promoter structure
and function have reported high core promoter activity in regions
that are on average 300bases upstream of TSS [2]. This led us to
broaden the search space to TSS6500bases to produce a more
comprehensive frequency profile for each CPE.
To predict CPEs, the promoter sequences of protein coding
genes in eight plant genomes were extracted from the Gramene
core databases (version 34b) [www.gramene.org]. These eight
plant genomes included four monocots (Brachypodium distachyon
(Bdi), Oryza sativa ssp. japonica (Osa), Sorghum bicolor (Sbi), Zea mays
(Zma)) and four dicots (Arabidopsis thaliana (Ath), Populus trichocarpa
(Ptr), Vitis vinifera (Vvi), Glycine max (Gma)). For each genome, only
the transcripts annotated with a 59 untranslated region (59UTR)
and high quality filtered gene-set (after discarding transposable
elements) were used for CPEs predictions (Table S1). Among
dicots 77% Ath, 67% Gma, 59% Ptr, and 57% Vvi whereas
among monocots 37% Bdi, 65% Osa, 36% Sbi, and 73% Zma
coding transcripts were found to have 59UTR annotations (Table
S1). The distribution of the number of transcripts with respect to
59UTR length in dicots and monocots is shown in Figure S1.
We selected only those CPEs for this study that had PWM
information publically available. These included TATA-box,
Initiator element (Inr) and CCAAT-box from PlantProm database
[101]. In PlantProm, Inr element is also referred as TSS [101].
Core Promoter Prediction in Eight Plant Genomes
PLOS ONE | www.plosone.org 2 October 2013 | Volume 8 | Issue 10 | e79011

Other CPEs included TFIIB Recognition Elements BREu and
BREd, GC-box, X-Core Promoter Element (XCPE1), Multiple
start site Element Downstream (MED-1), Motif-Ten element
(MTE), Downstream Core Element (DCE-S1, DCE-S2, DCE-S3),
and Downstream Promoter Element (DPE) from the JASPAR
POLII database [102]; and pyrimidine patch (Y-patch) from
literature [15]. A brief description of the CPEs with PWM logo is
given in Table S2. For each motif, CPE prediction results were
filtered based on motif specific prediction score cut-off, given in
Table S3 (for details, see methods).
Experimental DesignThe flow diagram for genome-wide computational prediction of
known CPEs are given in Figure 1. It shows the prediction of
known core promoter elements in the eight plant genomes using
three approaches. First, DNA free energy profiles of the promoter
region were studied to detect differences in the structural
properties of DNA across monocots and dicots. It also differen-
tiated regulatory from non-regulatory regions and helped in
delineating the boundaries of the regulatory region. Second,
predefined PWMs were used to locate putative CPEs that are
overrepresented in a 1000 bp window centered on the TSS.
Third, predictions based on orthologous promoter sequences were
used as an additional metric to select and increase the confidence
of putative CPEs identified in the previous step. Arabidopsis thaliana
and Oryza sativa ssp. japonica were used as the model dicot and
monocot genomes respectively for homology-based CPE predic-
tions. CPE predictions were further filtered based on a motif-
specific prediction score cut-off, frequency of a CPE-motif
occurrence in a sequence, and foreground CPE-motif signal cutoff
based on CPE-motif signal observed in the background genomic
sequences. These predictions were used to build frequency
distribution profiles for each PWM for each plant genome (see
methods for details). PromPredict [103], was used for building
DNA free energy profiles; whereas Search Tool for Occurrences of
Regulatory Motifs (STORM) [60,104,105] was used for identify-
ing each known CPE pattern (encoded as a PWM) in the core
promoter sequences.
To assess the reliability of our prediction methodology and to
tune our prediction pipeline, we also examined the above
mentioned known CPEs using experimentally derived set of
promoter elements of Drosophila melanogaster from Eukaryotic
promoter database [106] and compared the predictions of selected
CPEs that have been experimentally confirmed and reported in
literature [22,35,107].
Delineation of core promoter region using DNA freeenergy profiles
Based on the differences in the average DNA free energy
profiles, regulatory regions can be discriminated from non-
regulatory regions and start sites of transcription can be
approximated [78]. DNA free energy profiles were generated for
promoter regions [TSS6500] as foreground and non-promoter
regions [randomly selected 1000 bp long windows] as background
in eight genomes using PromPredict [103](Figure 2). The free
energy of DNA melting depends on the base stacking energy of
dinucleotide sequences and on GC content. As shown in Figure
S2, monocot transcripts have distinctly higher GC content (50–
65%) than dicots (35–45%). In addition, the average free energy
values for the upstream and downstream region with respect to
TSS are different depending on the GC content of the region in
each genome. The free energy profiles were obtained by averaging
DNA free energy of each base across all promoter sequences and
were distinctly segregated into monocot and dicot specific clusters
(Figure 2A). On average, regulatory regions in the monocots had
lower DNA free energy (220 kcal/mol60.14 SD) as compared to
dicots (217.6 kcal/mol60.15 SD). However the shape of the
regulatory genome energy profile across all eight genomes was
remarkably consistent and distinctly different from the shape of
non-regulatory genome energy profile (Figure 2B). The energy
profile of non-regulatory genomic regions across all genomes,
though consistently flat, had a nearly five-fold higher standard
deviation as compared to the regulatory genome (monocots
averaged 218.5 kcal/mol60.68 and dicots averaged 216.8 kcal/
mol60.77). The energy profile around the TSS [2100 to +50 with
respect to the TSS] goes through at least two distinct local minima
and two distinct local maxima with Vvi being an exception with
only one distinct local minima and one distinct local maxima. This
entire window of 150bases around the TSS exhibits a tight and
significantly alternating pattern in DNA structure stability and
instability, thus making it a putative hotspot of polII assembly and
transcription initiation. Based on these observations, it is
reasonable to think that the free energy profile in this window of
,150bases defines the characteristic signature of a core regulatory
region that distinguishes it from non-regulatory regions. This
region, taken together with the energy profile of its flanking
regions, further helps in demarcating the boundaries of the
regulatory region.
Figure 1. Flow diagram of computational prediction of knowncore promoter elements in eight plant genomes. Methodsincluded the use of DNA free energy profiles and prediction of knownCPE types using published PWM profiles. Overrepresentation near TSSand conservation of putative sites among orthologous genes withindicot and monocot groups were used as filters to increase theconfidence of CPE calls.doi:10.1371/journal.pone.0079011.g001
Core Promoter Prediction in Eight Plant Genomes
PLOS ONE | www.plosone.org 3 October 2013 | Volume 8 | Issue 10 | e79011

Computational prediction of CPEs based on thepositional and orthologous gene conservation acrossgenomes
The genome-wide distributions of the above-mentioned CPEs
were predicted in known protein coding genes’ core promoter
sequences flanked with 59UTR in eight plant genomes using PWM
(Figures 3–15). For each genome, the frequency distribution profile
of the individual CPE was constructed and compared against its
profile generated from the randomly generated background
sequences to locate CPE abundance signal (background profiles
are not shown). Only those promoter regions where the
foreground signal was statistically significant from the background
signal were considered as the candidate CPE localization ranges
(see methods for details). The frequency distribution profiles of
these CPEs in A. thaliana and O. sativa ssp. japonica were selected as
representative models to compare dicots and monocots, as shown
in Figures S3 and S4 respectively. The similarities and differences
in promoter architecture between monocots and dicots, under-
scored by differences in DNA free energy profile studies, provided
insights into the positional preference of the CPEs and reduced the
false positive predictions (Table S4).
Furthermore, we also predicted these CPEs based on the gene
conservation across genomes by selecting Ath (orthologous pairs of
Ath:Gma, Ath:Ptr, and Ath:Vvi) and Osa (orthologous pairs of
Osa: Bdi, Osa:Sbi, and Osa:Zma) ortholog gene promoter
sequences. The brown dotted line in Figures 3–15 corresponds
to the orthology-based CPE frequency distribution profiles (see
methods for details). The predicted range of each CPE for each
Figure 2. Genome-wide distribution of promoter-region DNA free energy profiles across eight plant genomes. Panel A: DNA freeenergy distribution profile of the core promoter-region across four dicots -Arabidopsis thaliana (Ath - solid navy blue), Glycine max (Gma-solid darkblue), Populus trichocarpa (Ptr –solid blue sapphire), and Vitis vinifera (Vvi -solid blue green) and four monocots - Brachypodium distachyon (Bdi-solidbronze yellow), Oryza sativa ssp. japonica (Osa-solid red), Sorghum bicolor (Sbi-solid bronze), and Zea mays (Zma -solid purple). The dicots showedhigher average free energy than the monocots and their free energy profiles were distinctly separated from monocot energy profiles. The corepromoter region between two vertical dotted black lines (around TSS) shows a sharp peak of instability near the TSS, against an overall trend ofincreasing stability going from upstream to downstream of the TSS. Panel B: The DNA free energy distribution of random 1000-bp windows ofgenomic sequence for the same species, showing flat profiles.doi:10.1371/journal.pone.0079011.g002
Core Promoter Prediction in Eight Plant Genomes
PLOS ONE | www.plosone.org 4 October 2013 | Volume 8 | Issue 10 | e79011

monocot and dicot based on positional and orthologous gene
conservation is given in Table S4. For each CPE motif, a
consensus localization range was determined independently in the
monocot and dicot groups using both qualitative and quantitative
measures. To see the similarities and differences in promoter
sequences across monocots and dicots, the comparison of each
motif across monocots and dicots is described next.
The Inr motif signal spanned over a wider range in dicots as
compared to the monocots. In dicots, the first significant Inr signal
peak appeared at 220 and continued till +240 while in monocots
it started at 260 and stretched till +60, showing group level
differences in the general genome wide organization of the Inr
signal between dicots and monocots (Figure 3). In monocots, a
sharper peak further appeared downstream of TSS from +100 to
+120. Therefore, monocots had a relatively focused TSS motif
signal as compared to dicots. The Inr profile based on Arabidopsis
orthologs and rice orthologs also agrees with respective dicot and
monocot Inr profiles (Table S4).
The TATA-box binding site was remarkably conserved across
all dicots and monocots and in ortholog sequences, with a sharp
peak ranging from 260 to 220 except Vvi and Sbi that ranged
from 270 to 220. The difference in relative TATA abundance
peaks among species is due to the difference in total number of
genes annotated with 59UTR in the corresponding species
(Figure 4).
The CCAAT-box detection signal, though found to be present
upstream of the TSS across all plant genomes, ranged from 2120
to 240 in dicots and from 2460 to 2140 in monocots, a pattern
Figure 3. Normalized frequency distribution profile of Inr with respect to TSS across monocots and dicots. Panel A: Genome-widepositional distribution of Inr frequency profile across four dicots: Arabidopsis thaliana (Ath - solid navy blue), Glycine max (Gma-solid dark blue),Populus trichocarpa (Ptr –solid blue sapphire), and Vitis vinifera (Vvi -solid blue green). Genome-wide functional distribution profile of Inr based on theortholog mapping of Ath with rest of the dicots (Ath:Gma, Ath:Ptr, and Ath:Vvi) is shown in dotted brown colored line. Panel B: Genome-widepositional distribution of Inr element frequency profile across four monocots: Brachypodium distachyon (Bdi-solid bronze yellow), Oryza sativa ssp.japonica (Osa-solid red), Sorghum bicolor (Sbi-solid bronze), and Zea mays (Zma -solid purple). Genome-wide functional distribution profile of Inrbased on the ortholog mapping of Osa with rest of the monocots (Osa:Bdi, Osa:Sbi, and Osa:Zma) is shown in dotted brown colored line. X-axisshows [2500,+500 with respect to TSS] that is binned into 20 base-pair bins, where each bin is represented by the bin-center. Y-axis shows thenormalized frequency distribution of the Inr element.doi:10.1371/journal.pone.0079011.g003
Core Promoter Prediction in Eight Plant Genomes
PLOS ONE | www.plosone.org 5 October 2013 | Volume 8 | Issue 10 | e79011

that was recapitulated in the profiles built for Arabidopsis and rice
ortholog sets respectively (Figure 5).
The BREu motif signal appeared bi-modal in dicots and uni-
modal in monocots. In both taxa, the BREu signal trended
upward from the TATA-box and peaked , 110 bp beyond the
TSS. However, the TATA-box was found to distinctly segregate
the first signal peak (ranging from 2100 to 240) from the second
signal peak (ranging from +40 to +200) in dicots (Figure 6).
Notably, in monocots, the BREu signal was predominantly
downstream of TSS with a broad peak that declined gradually
beyond +180 (Figure 6). The BREu frequency distribution in the
Arabidopsis orthologs and rice orthologs respectively agreed with
dicots and monocots frequency distribution profiles.
The BREd frequency distribution appears bimodal in both
dicots and monocots (Figure 7). In dicots, small distance separated
the two peaks which ranged from 280 to 240 and from 220 to
+10 (Figure 7). As observed for BREu, the region separating these
BREd peaks coincides with the TATA-box peak. However, in
monocots, the two peaks were more distantly separated, the first
ranging from 2140 to 2100 and the second from 240 to +40.
This suggested that elements in addition to the TATA-box may be
Figure 4. Normalized frequency distribution profile of TATA-box with respect to TSS across monocots and dicots. Panel A: Genome-wide positional distribution of TATA-box frequency profile across four dicots: Arabidopsis thaliana (Ath - solid navy blue), Glycine max (Gma-solid darkblue), Populus trichocarpa (Ptr –solid blue sapphire), and Vitis vinifera (Vvi -solid blue green). Genome-wide functional distribution profile of TATA-boxbased on the ortholog mapping of Ath with rest of the dicots (Ath:Gma, Ath:Ptr, and Ath:Vvi) is shown in dotted brown colored line. Panel B:Genome-wide positional distribution of TATA-box element frequency profile across four monocots: Brachypodium distachyon (Bdi-solid bronzeyellow), Oryza sativa ssp. japonica (Osa-solid red), Sorghum bicolor (Sbi-solid bronze), and Zea mays (Zma -solid purple). Genome-wide functionaldistribution profile of TATA-box based on the ortholog mapping of Osa with rest of the monocots (Osa:Bdi, Osa:Sbi, and Osa:Zma) is shown in dottedbrown colored line. X-axis shows [2500,+500 with respect to TSS] that is binned into 20 base-pair bins, where each bin is represented by the bin-center. Y-axis shows the normalized frequency distribution of the TATA-box element.doi:10.1371/journal.pone.0079011.g004
Core Promoter Prediction in Eight Plant Genomes
PLOS ONE | www.plosone.org 6 October 2013 | Volume 8 | Issue 10 | e79011

intervening. In our analysis, the monocot Inr and DCE-S1 are the
only CPEs that overlap this region.
The GC-box signal exhibited a broad range (270 to +250) in
both dicots and monocots (Figure 8). Although a similar range was
found in rice orthologs, the GC-box distribution was narrower in
the Arabidopsis ortholog set. The PWM given in JASPAR
database [102] for GC-box was derived from 502 unrelated
promoter sequences from four eukaryotic RNA polymerase II
promoter elements [108]. Given the broad range of GC-box signal
in both monocots and dicots, it could be inferred that GC-box
might be delocalized in plants.
The DCE-S1 frequency distribution showed a peak at +100 to
+160 in all eight plant genomes (Figure 9). In monocots, an
additional distinct peak was also evident from 240 to +40, which
substantially overlaps with Inr and BREd signals around TSS and
partially overlaps with the Y-patch signal (see below). The
respective ranges in dicots and monocots were also confirmed by
the Arabidopsis orthologs and rice orthologs.
The DCE-S2 signal is multimodal in dicots and monocots
(ranging from 2140 to 2100, 220 to +1, and +100 to +160)
(Figure 10). The DCE-S2 peak in monocots around the TSS is
distinctive. These multi-modalities in DCE-S1 and DCE-S2 motif
Figure 5. Normalized frequency distribution profile of CCAAT-box with respect to TSS across monocots and dicots. Panel A: Genome-wide positional distribution of CCAAT-box frequency profile across four dicots: Arabidopsis thaliana (Ath - solid navy blue), Glycine max (Gma-soliddark blue), Populus trichocarpa (Ptr –solid blue sapphire), and Vitis vinifera (Vvi -solid blue green). Genome-wide functional distribution profile ofCCAAT-box based on the ortholog mapping of Ath with rest of the dicots (Ath:Gma, Ath:Ptr, and Ath:Vvi) is shown in dotted brown colored line. PanelB: Genome-wide positional distribution of CCAAT-box element frequency profile across four monocots: Brachypodium distachyon (Bdi-solid bronzeyellow), Oryza sativa ssp. japonica (Osa-solid red), Sorghum bicolor (Sbi-solid bronze), and Zea mays (Zma-solid purple). Genome-wide functionaldistribution profile of CCAAT-box based on the ortholog mapping of Osa with rest of the monocots (Osa:Bdi, Osa:Sbi, and Osa:Zma) is shown indotted brown colored line. X-axis shows [2500,+500 with respect to TSS] that is binned into 20 base-pair bins, where each bin is represented by thebin-center. Y-axis shows the normalized frequency distribution of the CCAAT-box element.doi:10.1371/journal.pone.0079011.g005
Core Promoter Prediction in Eight Plant Genomes
PLOS ONE | www.plosone.org 7 October 2013 | Volume 8 | Issue 10 | e79011

signals could suggest a diverse role of DCE-variants in Pol-II PIC
formation, depending on the position of these motifs around the
TSS. The DCE-S2 profile in rice orthologs also confirmed the
observed range in monocots; however Arabidopsis orthologs
showed a peak from +280 to +300 in addition to the observed
range (220 to +1 and +100 to +210).
The DCE-S3 foreground signal was not statistically different
from background signal and therefore, the prediction of DCE-S3
was not included in this study.
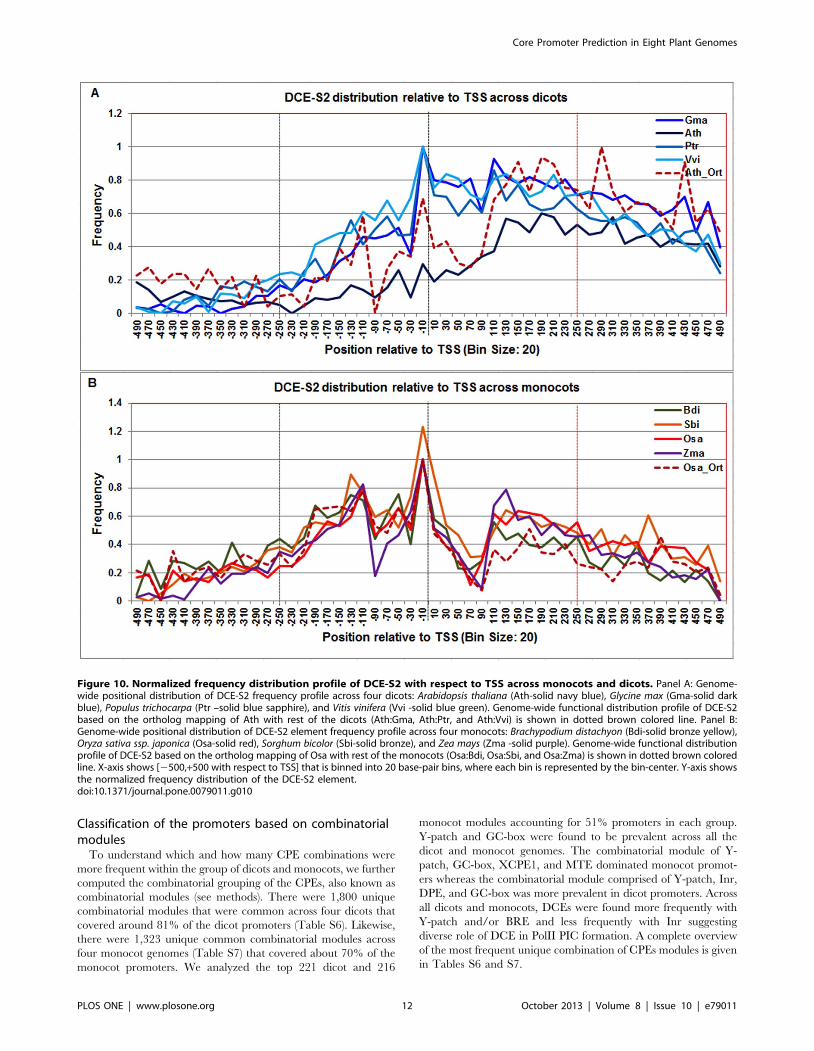
The DPE motif signal covered a broad range both in dicots
(+40 to +360) and monocots (+100 to +400) (Figure 11). Given this
long and flat profile, it can be hypothesized that the consensus
sequence of DPE used to develop the PWM, lacks sufficient
specificity to refine the range of DPE elements in plants. The DPE
profile in Arabidopsis and rice orthologs also confirmed this range.
The XCPE-1 signal differs between dicots and monocots. In
dicots, it showed peaks at 270 and drops at 230 and sharply
plateaued from around +100 till +180, gradually falling off
thereafter (Figure 12) whereas in monocots, XCPE-1 signal is
Figure 6. Normalized frequency distribution profile of BREu with respect to TSS across monocots and dicots. Panel A: Genome-widepositional distribution of BREu element frequency profile across four dicots: Arabidopsis thaliana (Ath -solid navy blue), Glycine max (Gma-solid darkblue), Populus trichocarpa (Ptr –solid blue sapphire), and Vitis vinifera (Vvi -solid blue green). Genome-wide functional distribution profile of BREubased on the ortholog mapping of Ath with rest of the dicots (Ath:Gma, Ath:Ptr, and Ath:Vvi) is shown in dotted brown colored line. Panel B:Genome-wide positional distribution of BREu element frequency profile across four monocots: Brachypodium distachyon (Bdi-solid bronze yellow),Oryza sativa ssp. japonica (Osa-solid red), Sorghum bicolor (Sbi-solid bronze), and Zea mays (Zma -solid purple). Genome-wide functional distributionprofile of BREu based on the ortholog mapping of Osa with rest of the monocots (Osa:Bdi, Osa:Sbi, and Osa:Zma) is shown in dotted brown coloredline. X-axis shows [2500,+500 with respect to TSS] that is binned into 20 base-pair bins, where each bin is represented by the bin-center. Y-axis showsthe normalized frequency distribution of the BREu element.doi:10.1371/journal.pone.0079011.g006
Core Promoter Prediction in Eight Plant Genomes
PLOS ONE | www.plosone.org 8 October 2013 | Volume 8 | Issue 10 | e79011

shifted downstream with an initial rise at +60 and reaching a
broad plateau from +130 to +240. The profiles based on the
Arabidopsis orthologs and rice orthologs also agreed with these
results.
The MED-1 showed a robust and consistent frequency
distribution across all plant genomes. It appeared to be bimodal,
with a peak around 210 and other signal from +100 to +200 and
the profiles based on Arabidopsis and rice orthologs also
confirmed this range (Figure 13, Table S4).
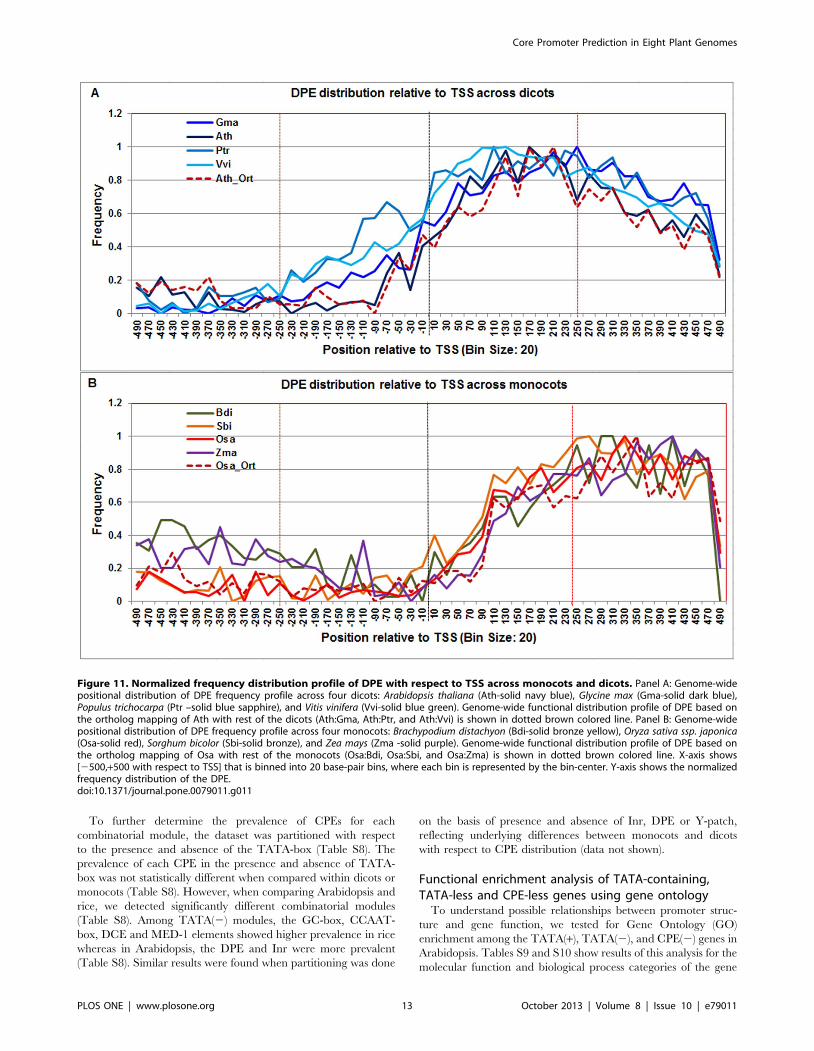
The MTE frequency distribution profile was found to be
consistently high across all plant genomes between +20 to +220.
However in monocots, it starts at 220 and ends at +240 whereas
in dicots it starts at +20 and ends at +220. This observation was
also confirmed in respective model monocot and dicot orthologs
(Figure 14).
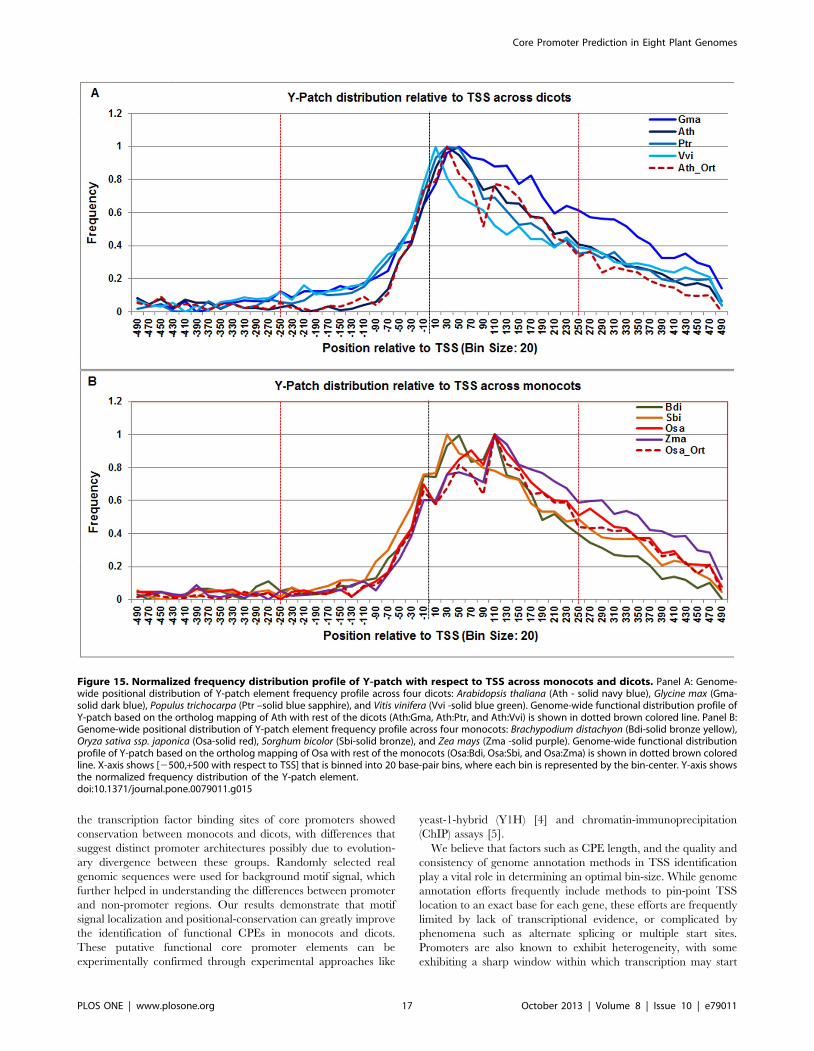
Our predictions showed a very strong and robust Y-patchfrequency distribution across all plant genomes between +20 to
+80. However, the overall signal span was shorter in dicots (from
220 to +80) and longer in monocots (from +20 to +160)
(Figure 15). The Y-patch profile in the Arabidopsis orthologs also
agreed with the observed dicot range.
Figure 7. Normalized frequency distribution profile of BREd with respect to TSS across monocots and dicots. Panel A: Genome-widepositional distribution of BREd element frequency profile across four dicots: Arabidopsis thaliana (Ath - solid navy blue), Glycine max (Gma-solid darkblue), Populus trichocarpa (Ptr –solid blue sapphire), and Vitis vinifera (Vvi -solid blue green). Genome-wide functional distribution profile of BREdbased on the ortholog mapping of Ath with rest of the dicots (Ath:Gma, Ath:Ptr, and Ath:Vvi) is shown in dotted brown colored line. Panel B:Genome-wide positional distribution of BREd element frequency profile across four monocots: Brachypodium distachyon (Bdi-solid bronze yellow),Oryza sativa ssp. japonica (Osa-solid red), Sorghum bicolor (Sbi-solid bronze), and Zea mays (Zma -solid purple). Genome-wide functional distributionprofile of BREd based on the ortholog mapping of Osa with rest of the monocots (Osa:Bdi, Osa:Sbi, and Osa:Zma) is shown in dotted brown coloredline. X-axis shows [2500,+500 with respect to TSS] that is binned into 20 base-pair bins, where each bin is represented by the bin-center. Y-axis showsthe normalized frequency distribution of the BREd element.doi:10.1371/journal.pone.0079011.g007
Core Promoter Prediction in Eight Plant Genomes
PLOS ONE | www.plosone.org 9 October 2013 | Volume 8 | Issue 10 | e79011

To assess the reliability of our prediction methodology, we
applied it to a set of ,2000 experimentally determined D.
melanogaster promoters available from the Eukaryotic Promoter
Database (EPD) [109] using PWMs from the JASPAR POLII
database [102]. Out of the 13 core promoter elements examined
above, four CPEs (Inr (+1), TATA-box (225), DPE (28–33 bps),
and MTE (17–22 bps)) have been experimentally confirmed in
Drosophila promoters [22,35,107]. We compared our prediction
results for these four CPEs with their positional distribution
described in the literature. Inr element was found to be present
from 220 bp upstream of TSS to +19 bp downstream of TSS,
TATA-box from 240 to 221 bp upstream of TSS, MTE from +1
to +19 bp downstream of TSS, and DPE from +20 to +39 bp
(Figure S5). These results are in close proximity to the reported
literature on these CPEs [22,35,107].
Genome-wide prevalence of TATA-containing, TATA-less,and CPE-less promoters
Based on the putative range of each CPE (Table S4), we
calculated the percentage distribution of each CPE for eight
genomes (Table S5). There is statistically significant difference
in the prevalence of each CPE (except TATA-box, DPE and
Figure 8. Normalized frequency distribution profile of GC-box with respect to TSS across monocots and dicots. Panel A: Genome-widepositional distribution of GC-box frequency profile across four dicots: Arabidopsis thaliana (Ath - solid navy blue), Glycine max (Gma-solid dark blue),Populus trichocarpa (Ptr –solid blue sapphire), and Vitis vinifera (Vvi -solid blue green) is shown. Genome-wide functional distribution profile of GC-box based on the ortholog mapping of Ath with rest of the dicots (Ath:Gma, Ath:Ptr, and Ath:Vvi) is shown in dotted brown colored line. Panel B:Genome-wide positional distribution of GC-box element frequency profile across four monocots: Brachypodium distachyon (Bdi-solid bronze yellow),Oryza sativa ssp. japonica (Osa-solid red), Sorghum bicolor (Sbi-solid bronze), and Zea mays (Zma -solid purple). Genome-wide functional distributionprofile of GC-box based on the ortholog mapping of Osa with rest of the monocots (Osa:Bdi, Osa:Sbi, and Osa:Zma) is shown in dotted brown coloredline. X-axis shows [2500,+500 with respect to TSS] that is binned into 20 base-pair bins, where each bin is represented by the bin-center. Y-axis showsthe normalized frequency distribution of the GC-box element.doi:10.1371/journal.pone.0079011.g008
Core Promoter Prediction in Eight Plant Genomes
PLOS ONE | www.plosone.org 10 October 2013 | Volume 8 | Issue 10 | e79011

Y-patch) between Arabidopsis and rice (two sample t-test = 0.009)
(Table S5). On the average, Inr and DPE are significantly
prevalent in dicots whereas CCAAT-box, GC-box, XCPE1,
MED1 are significantly prevalent in monocots (Table S5).
We categorized promoters into three broad classes: 1) promoters
having a putative TATA-box (TATA(+)), 2) promoters lacking a
putative TATA-box, but containing at least one other putative
CPE (TATA(2)), and 3) promoters lacking all of the thirteen CPEs
(CPE(2)). An account of the TATA(+), TATA(2), and CPE(2)
genes for each genome is given in Table 1. Dicots and monocots
have ,18% TATA(+) promoters, except Zma and Sbi in which
,13% and ,22% of their respective promoters contained TATA-
box (Table 1). On average, ,81% of dicot and monocot
promoters were categorized as TATA(2). Further, we noted that
on average 1.45% dicot and 0.76% monocot promoters lacked
known CPEs within the selected range of the putative promoter
sequences. Given the low proportion of transcripts with annotated
59UTR, especially Bdi and Sbi in which fewer than 50%
transcripts are annotated with 59UTR information, these numbers
may change in future as the genome annotations improve
(Table 1).
Figure 9. Normalized frequency distribution profile of DCE-S1 with respect to TSS across monocots and dicots. Panel A: Genome-widepositional distribution of DCE-S1 frequency profile across four monocots: Arabidopsis thaliana (Ath - solid navy blue), Glycine max (Gma-solid darkblue), Populus trichocarpa (Ptr –solid blue sapphire), and Vitis vinifera (Vvi -solid blue green). Genome-wide functional distribution profile of DCE-S1based on the ortholog mapping of Ath with rest of the dicots (Ath:Gma, Ath:Ptr, and Ath:Vvi) is shown in dotted brown colored line. Panel B:Genome-wide positional distribution of DCE-S1frequency profile across four monocots: Brachypodium distachyon (Bdi-solid bronze yellow), Oryzasativa ssp. japonica (Osa-solid red), Sorghum bicolor (Sbi-solid bronze), and Zea mays (Zma -solid purple). Genome-wide functional distribution profileof DCE-S1 based on the ortholog mapping of Osa with rest of the monocots (Osa:Bdi, Osa:Sbi, and Osa:Zma) is shown in dotted brown colored line. X-axis shows [2500,+500 with respect to TSS] that is binned into 20 base-pair bins, where each bin is represented by the bin-center. Y-axis shows thenormalized frequency distribution of the DCE-S1 element.doi:10.1371/journal.pone.0079011.g009
Core Promoter Prediction in Eight Plant Genomes
PLOS ONE | www.plosone.org 11 October 2013 | Volume 8 | Issue 10 | e79011
Classification of the promoters based on combinatorialmodules
To understand which and how many CPE combinations were
more frequent within the group of dicots and monocots, we further
computed the combinatorial grouping of the CPEs, also known as
combinatorial modules (see methods). There were 1,800 unique
combinatorial modules that were common across four dicots that
covered around 81% of the dicot promoters (Table S6). Likewise,
there were 1,323 unique common combinatorial modules across
four monocot genomes (Table S7) that covered about 70% of the
monocot promoters. We analyzed the top 221 dicot and 216
monocot modules accounting for 51% promoters in each group.
Y-patch and GC-box were found to be prevalent across all the
dicot and monocot genomes. The combinatorial module of Y-
patch, GC-box, XCPE1, and MTE dominated monocot promot-
ers whereas the combinatorial module comprised of Y-patch, Inr,
DPE, and GC-box was more prevalent in dicot promoters. Across
all dicots and monocots, DCEs were found more frequently with
Y-patch and/or BRE and less frequently with Inr suggesting
diverse role of DCE in PolII PIC formation. A complete overview
of the most frequent unique combination of CPEs modules is given
in Tables S6 and S7.
Figure 10. Normalized frequency distribution profile of DCE-S2 with respect to TSS across monocots and dicots. Panel A: Genome-wide positional distribution of DCE-S2 frequency profile across four dicots: Arabidopsis thaliana (Ath-solid navy blue), Glycine max (Gma-solid darkblue), Populus trichocarpa (Ptr –solid blue sapphire), and Vitis vinifera (Vvi -solid blue green). Genome-wide functional distribution profile of DCE-S2based on the ortholog mapping of Ath with rest of the dicots (Ath:Gma, Ath:Ptr, and Ath:Vvi) is shown in dotted brown colored line. Panel B:Genome-wide positional distribution of DCE-S2 element frequency profile across four monocots: Brachypodium distachyon (Bdi-solid bronze yellow),Oryza sativa ssp. japonica (Osa-solid red), Sorghum bicolor (Sbi-solid bronze), and Zea mays (Zma -solid purple). Genome-wide functional distributionprofile of DCE-S2 based on the ortholog mapping of Osa with rest of the monocots (Osa:Bdi, Osa:Sbi, and Osa:Zma) is shown in dotted brown coloredline. X-axis shows [2500,+500 with respect to TSS] that is binned into 20 base-pair bins, where each bin is represented by the bin-center. Y-axis showsthe normalized frequency distribution of the DCE-S2 element.doi:10.1371/journal.pone.0079011.g010
Core Promoter Prediction in Eight Plant Genomes
PLOS ONE | www.plosone.org 12 October 2013 | Volume 8 | Issue 10 | e79011
To further determine the prevalence of CPEs for each
combinatorial module, the dataset was partitioned with respect
to the presence and absence of the TATA-box (Table S8). The
prevalence of each CPE in the presence and absence of TATA-
box was not statistically different when compared within dicots or
monocots (Table S8). However, when comparing Arabidopsis and
rice, we detected significantly different combinatorial modules
(Table S8). Among TATA(2) modules, the GC-box, CCAAT-
box, DCE and MED-1 elements showed higher prevalence in rice
whereas in Arabidopsis, the DPE and Inr were more prevalent
(Table S8). Similar results were found when partitioning was done
on the basis of presence and absence of Inr, DPE or Y-patch,
reflecting underlying differences between monocots and dicots
with respect to CPE distribution (data not shown).
Functional enrichment analysis of TATA-containing,TATA-less and CPE-less genes using gene ontology
To understand possible relationships between promoter struc-
ture and gene function, we tested for Gene Ontology (GO)
enrichment among the TATA(+), TATA(2), and CPE(2) genes in
Arabidopsis. Tables S9 and S10 show results of this analysis for the
molecular function and biological process categories of the gene
Figure 11. Normalized frequency distribution profile of DPE with respect to TSS across monocots and dicots. Panel A: Genome-widepositional distribution of DPE frequency profile across four dicots: Arabidopsis thaliana (Ath-solid navy blue), Glycine max (Gma-solid dark blue),Populus trichocarpa (Ptr –solid blue sapphire), and Vitis vinifera (Vvi-solid blue green). Genome-wide functional distribution profile of DPE based onthe ortholog mapping of Ath with rest of the dicots (Ath:Gma, Ath:Ptr, and Ath:Vvi) is shown in dotted brown colored line. Panel B: Genome-widepositional distribution of DPE frequency profile across four monocots: Brachypodium distachyon (Bdi-solid bronze yellow), Oryza sativa ssp. japonica(Osa-solid red), Sorghum bicolor (Sbi-solid bronze), and Zea mays (Zma -solid purple). Genome-wide functional distribution profile of DPE based onthe ortholog mapping of Osa with rest of the monocots (Osa:Bdi, Osa:Sbi, and Osa:Zma) is shown in dotted brown colored line. X-axis shows[2500,+500 with respect to TSS] that is binned into 20 base-pair bins, where each bin is represented by the bin-center. Y-axis shows the normalizedfrequency distribution of the DPE.doi:10.1371/journal.pone.0079011.g011
Core Promoter Prediction in Eight Plant Genomes
PLOS ONE | www.plosone.org 13 October 2013 | Volume 8 | Issue 10 | e79011

ontology respectively. In general, little overlap was observed
between enriched GO categories amongst the three classes of
promoter.
The TATA(+) class showed significant overrepresentation of
molecular functions involved in transcription regulation, ion and
DNA binding activities, electron transport and enzyme inhibitor
activities (Figure 16A). The biological process enrichment showed
categories that included response to stress, abiotic, biotic and
hormonal stimuli, regulation of carbohydrate and nucleic acid
metabolic process, secondary metabolic process, lipid transport
and cell wall modification (Figure 16B).
The TATA(2) class showed enrichment in a variety of
molecular functions, including transferase activities, hydrolase
activities, and various nucleotide related binding activities
(Figure 17A). These genes were enriched in biological processes
related to nitrogen and phosphorous metabolism (Figure 17B).
The CPE(2) class showed evidence of unique enrichment in
genes involved in ATP binding, signal transduction activities,
apoptosis as compared to the TATA(+) and TATA(2) class of
genes (Figures 18A,B).
Figure 12. Normalized frequency distribution profile of XCPE1 with respect to TSS across monocots and dicots. Panel A: Genome-widepositional distribution of XCPE1 element frequency profile across four dicots: Arabidopsis thaliana (Ath-solid navy blue), Glycine max (Gma-solid darkblue), Populus trichocarpa (Ptr –solid blue sapphire), and Vitis vinifera (Vvi -solid blue green) is shown. Genome-wide functional distribution profile ofXCPE1 based on the ortholog mapping of Ath with rest of the dicots (Ath:Gma, Ath:Ptr, and Ath:Vvi) is shown in dotted brown colored line. Panel B:Genome-wide positional distribution of XCPE1 element frequency profile across four monocots: Brachypodium distachyon (Bdi-solid bronze yellow),Oryza sativa ssp. japonica (Osa-solid red), Sorghum bicolor (Sbi-solid bronze), and Zea mays (Zma -solid purple). Genome-wide functional distributionprofile of XCPE1 based on the ortholog mapping of Osa with rest of the monocots (Osa:Bdi, Osa:Sbi, and Osa:Zma) is shown in dotted brown coloredline. X-axis shows [2500,+500 with respect to TSS] that is binned into 20 base-pair bins, where each bin is represented by the bin-center. Y-axis showsthe normalized frequency distribution of the XCPE1 element.doi:10.1371/journal.pone.0079011.g012
Core Promoter Prediction in Eight Plant Genomes
PLOS ONE | www.plosone.org 14 October 2013 | Volume 8 | Issue 10 | e79011

Discussion
The genome-wide characterization of the gene expression
regulation is a complex process and presents one of the major
challenges in comprehensive identification of the transcriptional
regulatory elements in plant genomes. The RNA polymerase II
core promoter, also known as gateway to transcription [110], is a
complex regulatory element that provides considerable diversity to
the core promoter structure and function [111]. Several CPEs
have been previously identified in eukaryotes [31,49,59,112,113,
114,115,116,117,118], however, they have not been well studied
in evolutionarily diverse plants. In addition, there are promoters
that lack any known CPEs suggesting that one or more novel
classes of motifs might be involved in the transcription regulation.
Here, we have used a systematic and unbiased high-throughput
computational approach that involves sequence and structural
properties of DNA to identify the core promoter region and CPEs
across monocots and dicots. Our results suggest that many CPEs
identified in animals are evolutionarily conserved in plants, thus
indicating their essential role in transcriptional regulation. Since,
majority of the CPEs were derived from animal genomes, it is
possible that their positional conservation profiles might be slightly
off and broader than expected in plants. However, we speculate
Figure 13. Normalized frequency distribution profile of MED-1 with respect to TSS across monocots and dicots. Panel A: Genome-wide positional distribution of MED-1 frequency profile across four dicots: Arabidopsis thaliana (Ath - solid navy blue), Glycine max (Gma-solid darkblue), Populus trichocarpa (Ptr –solid blue sapphire), and Vitis vinifera (Vvi -solid blue green) is shown. Genome-wide functional distribution profile ofMED-1 based on the ortholog mapping of Ath with rest of the dicots (Ath:Gma, Ath:Ptr, and Ath:Vvi) is shown in dotted brown colored line. Panel B:Genome-wide positional distribution of MED-1 element frequency profile across four monocots: Brachypodium distachyon (Bdi-solid bronze yellow),Oryza sativa ssp. japonica (Osa-solid red), Sorghum bicolor (Sbi-solid bronze), and Zea mays (Zma -solid purple). Genome-wide functional distributionprofile of MED-1 based on the ortholog mapping of Osa with rest of the monocots (Osa:Bdi, Osa:Sbi, and Osa:Zma) is shown in dotted brown coloredline. X-axis shows [2500,+500 with respect to TSS] that is binned into 20 base-pair bins, where each bin is represented by the bin-center. Y-axis showsthe normalized frequency distribution of the MED-1 element.doi:10.1371/journal.pone.0079011.g013
Core Promoter Prediction in Eight Plant Genomes
PLOS ONE | www.plosone.org 15 October 2013 | Volume 8 | Issue 10 | e79011
that with the knowledge of the plant specific PWMs, CPE signal
profile can be expected to improve. We have redefined basic
promoter features and analyzed the conservation and diversity of
plant promoters on a genome-wide scale.
The conserved motifs can be detected by analyzing distribution
profiles in a large set of promoter sequences and promoter
architecture can thus be deduced. The genome-wide prevalence of
these CPEs across four monocots and four dicots was based on the
positional conservation of the regulatory elements that share
common content features. By using positional conservation, false
positive signals can be reduced significantly and therefore,
biologically relevant motifs can be discriminated from the false
predictions [94,95,96]. Furthermore, it has been reported that the
orthologous genes have also been used to identify the regulatory
modules that are conserved between species belonging to different
plant families [119,120]. Conserved DNA motifs show that the
preferential appearance of a set of sequences might be due to
evolutionary pressure and thus suggest the potential functional role
in transcription regulation or some other biological processes.
Therefore, based on comparative genomics studies, the CPEs that
are commonly conserved among orthologous genes across
monocots and dicots are more likely to be functional. Generally,
Figure 14. Normalized frequency distribution profile of MTE with respect to TSS across monocots and dicots. Panel A: Genome-widepositional distribution of MTE frequency profile across four dicots: Arabidopsis thaliana (Ath - solid navy blue), Glycine max (Gma-solid dark blue),Populus trichocarpa (Ptr –solid blue sapphire), and Vitis vinifera (Vvi -solid blue green). Genome-wide functional distribution profile of MTE based onthe ortholog mapping of Ath with rest of the dicots (Ath:Gma, Ath:Ptr, and Ath:Vvi) is shown in dotted brown colored line. Panel B: Genome-widepositional distribution of MTE element frequency profile across four monocots: Brachypodium distachyon (Bdi-solid bronze yellow), Oryza sativa ssp.japonica (Osa-solid red), Sorghum bicolor (Sbi-solid bronze), and Zea mays (Zma -solid purple). Genome-wide functional distribution profile of MTEbased on the ortholog mapping of Osa with rest of the monocots (Osa:Bdi, Osa:Sbi, and Osa:Zma) is shown in dotted brown colored line. X-axisshows [2500,+500 with respect to TSS] that is binned into 20 base-pair bins, where each bin is represented by the bin-center. Y-axis shows thenormalized frequency distribution of the MTE element.doi:10.1371/journal.pone.0079011.g014
Core Promoter Prediction in Eight Plant Genomes
PLOS ONE | www.plosone.org 16 October 2013 | Volume 8 | Issue 10 | e79011
the transcription factor binding sites of core promoters showed
conservation between monocots and dicots, with differences that
suggest distinct promoter architectures possibly due to evolution-
ary divergence between these groups. Randomly selected real
genomic sequences were used for background motif signal, which
further helped in understanding the differences between promoter
and non-promoter regions. Our results demonstrate that motif
signal localization and positional-conservation can greatly improve
the identification of functional CPEs in monocots and dicots.
These putative functional core promoter elements can be
experimentally confirmed through experimental approaches like
yeast-1-hybrid (Y1H) [4] and chromatin-immunoprecipitation
(ChIP) assays [5].
We believe that factors such as CPE length, and the quality and
consistency of genome annotation methods in TSS identification
play a vital role in determining an optimal bin-size. While genome
annotation efforts frequently include methods to pin-point TSS
location to an exact base for each gene, these efforts are frequently
limited by lack of transcriptional evidence, or complicated by
phenomena such as alternate splicing or multiple start sites.
Promoters are also known to exhibit heterogeneity, with some
exhibiting a sharp window within which transcription may start
Figure 15. Normalized frequency distribution profile of Y-patch with respect to TSS across monocots and dicots. Panel A: Genome-wide positional distribution of Y-patch element frequency profile across four dicots: Arabidopsis thaliana (Ath - solid navy blue), Glycine max (Gma-solid dark blue), Populus trichocarpa (Ptr –solid blue sapphire), and Vitis vinifera (Vvi -solid blue green). Genome-wide functional distribution profile ofY-patch based on the ortholog mapping of Ath with rest of the dicots (Ath:Gma, Ath:Ptr, and Ath:Vvi) is shown in dotted brown colored line. Panel B:Genome-wide positional distribution of Y-patch element frequency profile across four monocots: Brachypodium distachyon (Bdi-solid bronze yellow),Oryza sativa ssp. japonica (Osa-solid red), Sorghum bicolor (Sbi-solid bronze), and Zea mays (Zma -solid purple). Genome-wide functional distributionprofile of Y-patch based on the ortholog mapping of Osa with rest of the monocots (Osa:Bdi, Osa:Sbi, and Osa:Zma) is shown in dotted brown coloredline. X-axis shows [2500,+500 with respect to TSS] that is binned into 20 base-pair bins, where each bin is represented by the bin-center. Y-axis showsthe normalized frequency distribution of the Y-patch element.doi:10.1371/journal.pone.0079011.g015
Core Promoter Prediction in Eight Plant Genomes
PLOS ONE | www.plosone.org 17 October 2013 | Volume 8 | Issue 10 | e79011

while transcription in others occurs over a dispersed range
[121,122]. These phenomena further complicate annotation
efforts, which generally attempt to define a single TSS than a
range of start sites. In the end some genes will have more reliable
annotation than others. Methods to characterize DNA physical
properties and core promoter motifs, as described here, may hold
promise to augment and refine annotation methodologies in the
future.
DNA free energy profiles of core promoter regionOur study of DNA free energy profiles in both dicots and
monocots demonstrated consistent distinction between promoter
and non-promoter regions on the basis of DNA physical
properties. Our observations are also consistent with a number
of previous studies on DNA energy profiles [81,123,124,125,126].
While the non-regulatory genome’s energy profile was consistently
flat, the regulatory genome’s profiles exhibited interesting prop-
erties. Both dicots and monocots showed similar average free
energy profiles, characterized by a sharp peak of instability near
the TSS, which punctuated an overall trend of increasing stability
ranging across the promoter and downstream regions. Differences
in baseline free-energy profiles across different species are
associated with differences in their GC content. Monocots have
higher GC content (50–65%) as compared to dicots (35–45%).
Nevertheless, despite the impact of these differences on absolute
free-energy, the shape of the curves (i.e. the pattern of relative
changes in free-energy across promoter space) showed remarkable
conservation across species. The most dynamic portion of the free-
energy profile falls within a 150 bp window centered on the TSS,
wherein free-energy can vary by up to 3.5 kcal/mol (Figure 2). At
least two local peaks could be discerned, the larger at , 230 and
the smaller at the TSS itself. Our observations provide basis for the
potential future use of free-energy profiling as an in silico
annotation tool to predict the locations of core promoters and
sites of transcription at a genomic scale. DNA free energy profiles
or stability profiles (based on the melting of DNA double strand)
provide insights into the physicochemical properties of the
promoter region [127,128] and can be helpful in gaining
understanding of nucleosome organization and chromatin struc-
ture.
Positional and orthologous conservation of CPEs acrosseight genomes
The PWMs of TATA-box, Inr, and CCAAT-box were
constructed from plant sequences in PlantProm database [101].
Similarly Y-patch PWM is derived from rice genome [15]. All
other PWMs were derived from Drosophila and other animals or
fungi and were taken from JASPAR POLII database [102]. We
analyzed the distribution between TATA-box and Y-patch
promoters with 59 UTR length, and found that about 80% and
51% of the TATA-box containing promoters have 160 bp or
smaller 59UTR length whereas 77% and 61% of the Y-patch
containing promoters have 210 bp or smaller 59UTR length in A.
thaliana and O. sativa japonica respectively.
Based on the genome-wide percentage of each CPE in eight
genomes, we found that TATA-box was present in around 16–
22% of the promoters. In Arabidopsis and rice, it was present in
around 18% of the promoters. It is consistent with the recent
publications on TATA-box in Arabidopsis and rice [15,129,130].
However, earlier work in Arabidopsis by Molina and Grotewold
[14] reported around 29% of promoters that contain TATA-box
in a set of highly expressed genes (around 12,749 transcripts). The
higher percentage of TATA-box in their studies can be due to
ascertainment bias of highly expressed genes and therefore, is
likely to be overrepresented in the smaller gene sets.
Additionally, we found that the positional preferences of the
BREu and BREd motifs in plants are different from animals, as the
latter were reported to have these motifs immediately upstream
and downstream of the TATA-box respectively [19,128]. The
BREu motif signal appeared to be bimodal in dicots surrounding
TATA-box, but the second peak of BREu extends far downstream
whereas in monocots, BREu is unimodal but it is downstream of
TSS. BREd abundance signal appears to be bimodal in both
dicots and monocots. Based on these results and given the
differences in location, BRE may be expected to function
differently in plants compared to animals and found to be less
associated with TATA-box. Our results also differ from a previous
Table 1. 59UTR annotated transcripts in TATA(+), TATA(2) and CPE(2) class of promoters.
TATA(+) TATA(2) CPE(2) Genome
Species Transcripts % Transcripts % Transcripts %Transcriptswith 59UTR
Annotated59UTR (%)
Arabidopsis thaliana (Ath) 4907 18.1 21638 79.9 551 2.0 27096 77
Glycine max (Gma) 7196 19.3 29453 79.1 593 1.6 37242 67
Populus trichocarpa (Ptr) 4167 16.4 20904 82.4 293 1.2 25364 59
Vitis vinifera (Vvi) 2873 16.8 14038 82.2 174 1.0 17085 57
Brachypodium distachyon (Bdi) 2000 17.4 9407 81.9 78 0.7 11485 37
Oryza sativa (Osa)* 3614 18.2 16210 81.5 75 0.4 19899 65
Sorghum bicolor (Sbi) 2871 22.3 9993 77.5 36 0.3 12900 36
Zea mays (Zma)* 3750 13.0 24536 85.3 488 1.7 28774 73
Dicot average 17.67 80.88 1.45
Monocot average 17.72 81.53 0.76
Dicot standard deviation 1.32 1.66 0.46
Monocot standard deviation 3.78 3.20 0.65
*Osa and Zma – based on filtered gene set (after removing transposons).doi:10.1371/journal.pone.0079011.t001
Core Promoter Prediction in Eight Plant Genomes
PLOS ONE | www.plosone.org 18 October 2013 | Volume 8 | Issue 10 | e79011
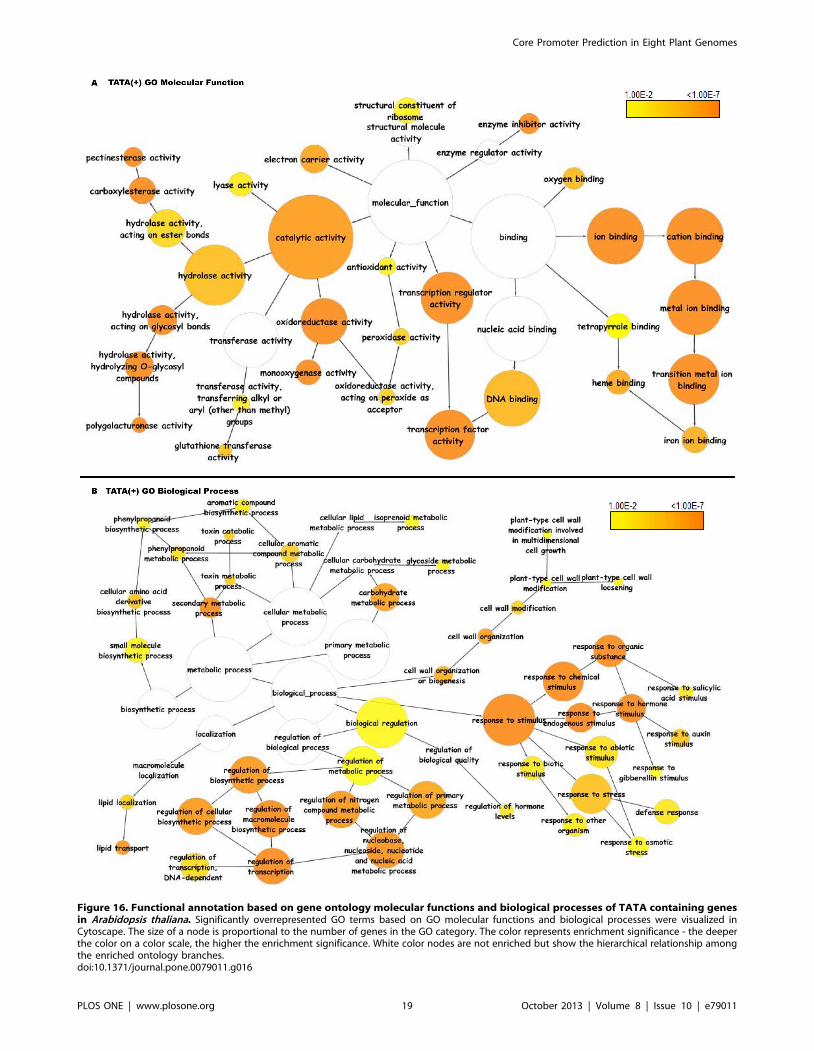
Figure 16. Functional annotation based on gene ontology molecular functions and biological processes of TATA containing genesin Arabidopsis thaliana. Significantly overrepresented GO terms based on GO molecular functions and biological processes were visualized inCytoscape. The size of a node is proportional to the number of genes in the GO category. The color represents enrichment significance - the deeperthe color on a color scale, the higher the enrichment significance. White color nodes are not enriched but show the hierarchical relationship amongthe enriched ontology branches.doi:10.1371/journal.pone.0079011.g016
Core Promoter Prediction in Eight Plant Genomes
PLOS ONE | www.plosone.org 19 October 2013 | Volume 8 | Issue 10 | e79011

Figure 17. Functional annotation based on gene ontology molecular functions and biological processes of TATAless genes inArabidopsis thaliana. Significantly overrepresented GO terms based on GO molecular functions and biological processes were visualized inCytoscape. The size of a node is proportional to the number of genes in the GO category. The color represents enrichment significance - the deeperthe color on a color scale, the higher the enrichment significance. White color nodes are not enriched but show the hierarchical relationship amongthe enriched ontology branches.doi:10.1371/journal.pone.0079011.g017
Core Promoter Prediction in Eight Plant Genomes
PLOS ONE | www.plosone.org 20 October 2013 | Volume 8 | Issue 10 | e79011

Figure 18. Functional annotation based on gene ontology molecular functions and biological processes of coreless genes inArabidopsis thaliana. Significantly overrepresented GO terms based on GO molecular functions and biological processes were visualized inCytoscape. The size of a node is proportional to the number of genes in the GO category. The color represents enrichment significance - the deeperthe color on a color scale, the higher the enrichment significance. White color nodes are not enriched but show the hierarchical relationship amongthe enriched ontology branches.doi:10.1371/journal.pone.0079011.g018
Core Promoter Prediction in Eight Plant Genomes
PLOS ONE | www.plosone.org 21 October 2013 | Volume 8 | Issue 10 | e79011

report that BRE motifs are missing in plants, as well as yeast [131].
Other CPEs also showed differences in abundance signal in dicots
as compared to monocots. The GC-box signal appeared more
robust in monocots than dicots, as did DCE-S1 and DCE-S2. We
observed that the predicted range of plant CPEs on the promoter
is broader than reported in literature [2,14,98], possibly because of
the PWMs derived from animal genomes. Furthermore, previous
studies in the plants used a relatively narrow core window size of
TSS650 [14,77] and thus precluded the examination of distal
downstream elements like DCE, DPE, MTE, and MED that our
study explores. This is expected as the distal elements usually
cluster after +100 base pairs. We observed that the CPE
abundance signal of potentially functional elements are consis-
tently better in monocots than in dicots, possibly due to differences
in the quality of genome annotations and the relative degree of
evolutionary distance among closely related species. It should be
noted that all species in our monocot group are in the grass family,
thus representing less diversity than the species in the dicot group.
Classification of promoters based on combinatorialmodules
The role of CPEs is more diverse than previously thought and
therefore, combinatorial modules of CPEs present in the promoter
region can act to regulate specific classes of genes as well. Based on
our in silico analysis of the core promoters across eight plant
genomes, we classified plant promoters into three types, TATA(+),
TATA(2), and CPE(2), and sought to understand how these
classes relate to combinatorial modules of regulatory domains. It
has been reported that in mammalian promoters in mouse and
human, TATA(+) promoter is associated with sharp TSS clusters,
whereas, the TATA(2) promoters have broad type TSS clusters
[132,133]. Based on our genome-wide studies, plant promoters
appear to have dispersed promoter and thus can not be associated
with sharp or broad TSS clusters. However, TATA-box appeared
to be the best recognized core element based on its signal, which is
highly conserved across plant genomes.
In the TATA(2) class of promoters, the presence of Inr, DPE,
and MTE, which have also been found in a subset of TATA(+),
can provide additional insights into the transcription of TATA(2)
genes. Though the sequences of Inr and DPE elements are
different than TATA-box, TFIID can recognize and bind directly
to these CPEs by using the TAF subunits [31,134]. Based on in
silico and experimental studies from literature related to RNA Pol-
II dependent transcription initiation, TFIID, though not a
universal factor, seems to be a key driver of the RNA Pol-II PIC
assembly for TATA-containing core promoters as well as for other
core promoters primarily driven by core elements like DPE, MTE,
Inr, and BRE [19,22]. Interestingly, our studies suggested that the
BREs (BREu and BREd) show an independent distribution among
core promoters. Based on the prevalence of core promoter
elements in combinatorial modules among dicots and monocots,
GC-box and Y-patch were found to be the most prevalent CPEs
that participated in putative combinatorial modules either
individually or jointly with one or more of the rest of the CPEs
across all the dicot and monocot genomes. In addition to this,
XCPE1 and MTE dominated monocot promoters whereas Inr
and DPE dominated dicot promoters. We found similar trend in
the prevalence of CPE in the promoter sequences that do not
contain TATA-box. It seems, in absence of TATA-box, Inr and
DPE play significant roles in dicots whereas GC-box, CCAAT-
box, DCE and MED-1 elements play regulatory role in monocots.
The DPE motif was reported in the literature to be functionally
dependent on the Inr in D.melanogaster [21]. However, in our
studies, DPE showed more prevalence in the promoter sequences
of dicots that did not contain Inr element. Similarly, Inr had
higher prevalence in the promoter sequences of dicots that did not
contain DPE. We further analyzed predicted combinatorial
modules to find out if combinatorial constraints (INR/DPE,
INR/MTE, and INR/DPE/MTE) could help refine the respec-
tively predicted signals of DPE and MTE motifs. Contrary to the
speculation, further analysis of these CPEs as combinatorial
modules did not narrow down the DPE and/or MTE signal. It can
be due to broad positional range of the Inr and the percent
distribution of both MTE and DPE is relatively higher in the
Inr(2) class of promoters than the Inr(+) class of promoter.
Functional enrichment of TATA(+),TATA(2) and CPE(2)There are various reports on heterogeneity in the plant core
promoter types that vary with respect to CPE composition
[30,129,135,136,137]. The core promoter type also seems to
correlate with gene structure and expression characteristics. For
example, in spite of the absence of core elements, the CPE(2) type
promoters manifested constitutive gene expression, whereas
TATA(+) promoters were found in genes with tissue-specific gene
expression [130]. Functional annotation of CPE based on GO
analysis in yeast, human and Arabidopsis had reported that the
TATA-type promoters were enriched in environmental response
genes whereas TATA-less genes are more often involved in
housekeeping processes [13,16,17,18,129]. Our studies on GO
enrichment analysis also suggested that the TATA(+) class of
promoters were mainly involved in stress responses and TATA(2)
were involved in housekeeping functions, while CPE(2) were
mainly involved in signaling activities.
All of the mechanisms involved in the expression and regulation
of genes ultimately depend on the core promoter. It was found that
nearly all of the Homeotic (Hox) genes that lack TATA-box in D.
melanogaster have DPE-dependent promoters [121]. It is well
reported that the Hox genes code for transcription factors which
are necessary for the sequential development of many anatomical
structures, and the expression and regulation of these genes are
dependent on the CPEs present in their promoters [121]. Based on
our GO analysis of DPE containing promoters that lack TATA-
box in Arabidopsis and rice, we also found that these genes were
mainly enriched in developmental process, especially during shoot
system development, flower development and proximal/distal
pattern formation. This example underscores how evolution has
used the diversity of CPEs to regulate the expression of an
important class of proteins.
ConclusionIn this paper, we have presented a strategy for annotating CPEs
by computational prediction at the whole genome level in different
plant genomes. Identification and characterization of the core
promoter binding site motifs of the transcription factors partici-
pating in the formation of PIC complex will help us understand
the core promoter architecture and establish the processes by
which plant basal transcription machinery functions. Our analysis
of CPEs across all eight genomes revealed that the predicted range
of most of CPEs in our study is broader than typically reported in
the literature. This may be due to inherent differences in core
promoter architecture in plants as compared to E.coli, yeast,
Drosophila and mammalian genomes [1,16,21,22,23,30,31,
98,131,138]. However, there can be few other possible reasons:
(i) if the majority of promoters are of the dispersed type as opposed
to the focused type, corresponding core DNA sequence motifs are
likely to be spread over a broader range as well [110,139]; (ii) for a
study of this size, we made a conscious decision to report our
finding at the genome-group level and highlight the monocot and
Core Promoter Prediction in Eight Plant Genomes
PLOS ONE | www.plosone.org 22 October 2013 | Volume 8 | Issue 10 | e79011

dicot specific differences where necessary without compromising
comprehension; (iii) not all genomes in a group have the same
quality of annotation, for example, Arabidopsis thaliana by far is the
best annotated genome among dicots, while rice annotation likely
exceeds other genomes among monocots; (iv) not all CPE
consensus sequence and PWMs are as robust as TATA-box and
Y-patch across the board [75]; (v) though the window size of 20 bp
was found to be optimal for genome-wide CPE profiles across
species, this might have an effect on the broader CPE distribution
range in our study; and (vi) most of the PWMs used in this study
were developed for non-plant species and may have reduced
specificity when used in plants. As the genome annotations
improve over time and the 59UTR information becomes available
for rest of the genes, the CPE distribution profiles discussed in this
study might need to be reassessed using our recommended
methodology. Nevertheless, this study demonstrates that our
prediction methodology is reliable, robust, tunable, and automat-
able. Due to the large number of reference genomes currently
available, we were able to study core promoter element
localization and their positional-conservation across species. Thus
our comprehensive analysis of plant promoter sequences can be
exploited in developing a full-fledged in silico tool for plant
promoter prediction. Based on these studies, we believe that results
are sensitive and specific enough to guide verification by
subsequent wet lab experiments.
There is very little knowledge of core promoter elements in
plants and our study offers a new insight in the field with an
important distinction of dicots vs. monocots. Our study docu-
ments, in a single comprehensive catalog, the computational
prediction and prevalence of thirteen known core promoter
elements in four monocots and four dicots. The core promoter
region free energy profile seems to possess a characteristic
signature that distinctly differentiates it from the non-promoter
genomic regions and has the potential to be used for delineating
the promoter region as well as for computational TSS identifica-
tion. It can help build better computational models for predicting
the TSS in the promoter region, which remains one of the most
challenging problems. We also examined the prevalence of each
CPE in the combinatorial modules in dicots and monocots and in
the presence and absence of TATA-box in all eight genomes.
TATA-box was found to be present in 16–22% of the plant
promoters. GC-box, XCPE1 and Y-patch were found to be the
most prevalent CPEs across all eight genomes. In conclusion, this
study expands the CPE repertoire in plants, providing impetus for
future wet-lab research.
Materials and Methods
Genome SequenceThe core promoter sequences [TSS6500] of protein coding
genes with known 59UTR information were extracted from the
Gramene core databases (version 34b) [www.gramene.org] for
four monocots (Bdi, Osa, Sbi, Zma) and four dicots (Ath, Gma,
Vvi, Ptr). To see cross-species conservation of CPEs based on
orthologs, A.thaliana and O.sativa ssp japonica orthologous protein
coding genes with sequence identity $50% with their respective
dicots (Ath:Gma, Ath:Ptr, Ath:Vvi) and monocots (Osa:Bdi,
Osa:Sbi, Osa:Zma) were selected for orthologous conservation
study. 9225 and 7958 orthologous protein coding genes for Ath
and Osa were selected for this study. The ortholog dataset was
retrieved from Gramene biomart [140] that itself depends on the
Ensembl Compara pipeline, which is based on a phylogenetic
analysis[141].
The promoter sequences for Drosophila melanogaster were extract-
ed from Eukaryotic promoter database [http://epd.vital-it.ch/]
[109] as a gold standard to test the reliability of our CPE
predictions.
DNA free energy profiles of core promoter regionDNA free energy profiles of the promoter regions and randomly
generated background sequences as negative control related to
eight plant genomes were constructed using PromPredict – an
algorithm based on GC content of the genome as well as difference
in the GC content of the promoter region and the genomic
sequence flanking the promoter region [103]. It uses experimen-
tally established dinucleotide free energy values in a sliding
window of size 15bps as proposed by Allawai and Santalucia [142]
and Santalucia [143]. An average free energy profile was
calculated by taking the mean value of free energy at each
position over all the promoter sequences from a genome.
Positional and orthologous conservation of CPEs acrosseight genomes
For positional conservation, we analyzed the promoters for
which 59UTR information was available for all eight genomes. For
orthologous conservation, Arabidopsis thaliana as a dicot model and
Oryza sativa ssp. japonica as a monocot model were selected as
mentioned before. It provided an additional approach to increase
the confidence in putative CPEs predictions made based on the
positional conservation.
Search Tool for Occurrences of Regulatory Motifs (STORM)
was used to identify motifs based on predefined PWMs
[60,104,105]. STORM has been successfully used in whole
genome mapping and analysis of active promoters in mouse
embryonic stem cells and adult organs using known vertebrate
motif PWMs from TRANSFAC [144] and JASPAR [60],[102].
For a given genome, the promoter sequences were processed
through STORM to detect the presence of CPE binding site
consensus sequences. STORM does not make any prior assump-
tion about distribution of nucleotides in the promoter sequences
rather it uses actual nucleotide composition of the genome to
increase accuracy in estimating statistical significance of the
binding site predictions. We considered only those putative cis-
regulatory motifs that were overrepresented in promoter sequenc-
es of protein coding genes as compared to a background set of
same number of random genomic sequences. STORM runs for
CPE predictions were set to detect each core-element at a p-value
#0.001. STORM used this p-value to calculate core-element
specific scoring threshold that depends on the information content
and length of each motif [145].
We generated and tested several background models specifically
derived from corresponding real genomic sequences from non-
regulatory regions as well as a pseudo random background model
designed from a large set of sequences that had been generated
artificially in silico according to the real nucleotide composition of
the genomes in our data set. It established motif’s positional signal
detection base-line threshold. The range in which foreground CPE
abundance was at least 1.5 standard deviations higher than the
background CPE abundance was considered as a candidate
binding site region. Further, overlaying of individual species
frequency distribution profiles within monocots and dicots
provided positional conservation of the binding site region across
species. Overlaying of frequency distribution profiles based on A.
thaliana orthologous gene promoters among dicots and O. sativa
japonica orthologous gene promoters among monocots provided
further confidence in cross species conservation of CPEs. Based on
Core Promoter Prediction in Eight Plant Genomes
PLOS ONE | www.plosone.org 23 October 2013 | Volume 8 | Issue 10 | e79011

these approaches, the consensus range for each CPE was
determined independently in the monocots and dicots.
Classification of promoters based on combinatorialmodules
For each genome, a list of each core promoter element’s
putative distribution range was determined based on the
qualitative and quantitative measures as mentioned earlier.
Custom perl scripts were used to determine the specific core
element present in each promoter sequence of the genome. The
set of core elements found to be present in a particular promoter
sequence defined that promoter’s combinatorial module. Though,
with this approach one combinatorial module per promoter was
obtained, however often a combinatorial module was found to be
present in more than one promoter. Therefore, only the set of
unique combinatorial modules was analyzed. To further deter-
mine prevalent CPEs contributing to the majority of the
combinatorial modules, this dataset was partitioned with respect
to the presence and absence of the TATA-box.
Functional enrichment analysis of TATA, TATAless andcoreless genes using gene ontologies
A. thaliana protein coding genes in TATA, TATA-less, and
CPE-less categories were analyzed for gene ontology functional
enrichment by using BiNGO [146]. BiNGO is a Cytoscape [147]
plugin that calculates statistically over-represented ontology terms
(GO molecular function and/or GO biological process) in a given
set of foreground genes as compared to the background set of
genes (entire genome). A hypergeometric distribution-based
statistical enrichment method was used to assess functional
enrichment in each category (p-value #0.01) and the Benjamini
and Hochberg method [148] was used for multiple testing
correction.
Supporting Information
Figure S1 The distribution of the number of transcriptswith respect to 59UTR length across dicots and mono-cots. The panel A shows the distribution of 59 UTR length in four
dicots: Arabidopsis thaliana (Ath - solid navy blue), Glycine max (Gma-
solid dark blue), Populus trichocarpa (Ptr –solid blue sapphire), and
Vitis vinifera (Vvi -solid blue green). The panel B shows the
distribution of 59UTR length in four monocots: Brachypodium
distachyon (Bdi-solid bronze yellow), Oryza sativa ssp. japonica (Osa-
solid red), Sorghum bicolor (Sbi-solid bronze), and Zea mays (Zma -
solid purple). X-axis shows bins of 59 UTR length, where each bin
is 10 base-pair long. Y-axis shows the number of transcripts.
(TIF)
Figure S2 The GC content distribution across dicotsand monocots. X-axis shows the percentage GC across eight
genomes whereas Y –axis shows the number of transcripts. GC
percentage in monocots and dicots showed the demarcation of GC
content distribution between dicots and monocots.
(TIF)
Figure S3 The distribution of all known core promoterelements in dicot model (Arabidopsis thaliana). X-axis
shows [2500,+500 with respect to TSS] promoter region that is
binned into 20 base-pair bins, where each bin is represented by the
bin-center. Y-axis shows the frequency distribution signal of the
CPEs along the promoter with respect to TSS. CPEs include:
MTE (golden), Inr (dark-grey), GC-box (black), CCAAT-box
(purple), DPE (dark-green), BREu (brown), BREd (sky-blue),
DCE-S1 (yellowish-green), XCPE1 (blue), TATA-box (red), MED-
1 (light-grey), and Y-patch (green).
(TIF)
Figure S4 The distribution of all known core promoterelements in monocot model (Oryza sativa ssp. japonica).X-axis shows [2500,+500 with respect to TSS] promoter region
that is binned into 20 base-pair bins, where each bin is represented
by the bin-center. Y-axis shows the frequency distribution signal of
the CPEs along the promoter with respect to TSS. CPEs include:
MTE (golden), Inr (dark-grey), GC-box (black), CCAAT-box
(purple), DPE (dark-green), BREu (brown), BREd (sky-blue),
DCE-S1 (yellowish-green), XCPE1 (blue), TATA-Box (red),
MED-1 (light-grey), and Y-patch (green).
(TIF)
Figure S5 The distribution of selected known corepromoter elements in Drosophila melanogaster. Ge-
nome-wide motif distribution profiles of core elements – TATA-
box (solid red), Inr (solid blue), MTE (solid black), and DPE (solid
green) in D. melanogaster genome showing positional conservation of
these CPEs with respect to TSS. X-axis shows [2500,+500 with
respect to TSS] promoter region that is binned into 20 base-pair
bins, where each bin is represented by the bin-center. Y-axis shows
the frequency distribution of the elements along the promoter with
respect to TSS.
(TIF)
Table S1 Genomic information of the eight plantspecies from Gramene.
(XLSX)
Table S2 Brief information on core promoter elementswith sequence logo of the respective position weightmatrix.
(XLSX)
Table S3 Position weight matrix specific score thresh-old cut off for each core promoter element for eightplant species.
(XLSX)
Table S4 Putative binding site distribution of the corepromoter elements relative to transcription start sitesbased on positional and orthologous gene conservationacross species.
(XLSX)
Table S5 Percentage distribution of the core promoterelements in eight plant genomes.
(XLSX)
Table S6 CPE combinatorial modules selected based onthe positional distribution range across dicots.
(XLSX)
Table S7 CPE combinatorial modules selected based onthe positional distribution range across monocots.
(XLSX)
Table S8 Prevalence of core promoter elements incombinatorial CPE modules in TATA(+) and TATA(2)promoter genes.
(XLSX)
Table S9 Functional annotation based on gene ontologymolecular function enrichment of TATA, TATAless andCoreless genes.
(XLSX)
Core Promoter Prediction in Eight Plant Genomes
PLOS ONE | www.plosone.org 24 October 2013 | Volume 8 | Issue 10 | e79011

Table S10 Functional annotation based on gene ontol-ogy biological process enrichment of TATA, TATAlessand Coreless genes.(XLSX)
Acknowledgments
The authors would like to thank Lalit Kumar Verma for critical
constructive comments and stimulating discussions on data analysis and
Joshua Stein, Andrew Smith, Vivek Kumar and Akshay Kumar for reading
of the manuscript. The authors also thank three anonymous reviewers for
helpful suggestions.
Author Contributions
Conceived and designed the experiments: SK DW. Performed the
experiments: SK. Analyzed the data: SK. Contributed reagents/materi-
als/analysis tools: SK DW. Wrote the paper: SK DW.
References
1. Ohler U, Liao GC, Niemann H, Rubin GM (2002) Computational analysis of
core promoters in the Drosophila genome. Genome biology 3: RE-
SEARCH0087.
2. Cooper SJ, Trinklein ND, Anton ED, Nguyen L, Myers RM (2006)
Comprehensive analysis of transcriptional promoter structure and function in
1% of the human genome. Genome research 16: 1–10.
3. Birney E, Stamatoyannopoulos JA, Dutta A, Guigo R, Gingeras TR, et al.
(2007) Identification and analysis of functional elements in 1% of the human
genome by the ENCODE pilot project. Nature 447: 799–816.
4. Deplancke B, Dupuy D, Vidal M, Walhout AJ (2004) A gateway-compatible
yeast one-hybrid system. Genome research 14: 2093–2101.
5. Orlando V (2000) Mapping chromosomal proteins in vivo by formaldehyde-
crosslinked-chromatin immunoprecipitation. Trends in biochemical sciences
25: 99–104.
6. Nikolov DB, Burley SK (1997) RNA polymerase II transcription initiation: a
structural view. Proceedings of the National Academy of Sciences of the United
States of America 94: 15–22.
7. Berk AJ (1999) Activation of RNA polymerase II transcription. Current opinion
in cell biology 11: 330–335.
8. Fessele S, Maier H, Zischek C, Nelson PJ, Werner T (2002) Regulatory context
is a crucial part of gene function. Trends in genetics: TIG 18: 60–63.
9. Sikorski TW, Buratowski S (2009) The basal initiation machinery: beyond the
general transcription factors. Current opinion in cell biology 21: 344–351.
10. Roeder RG (1996) The role of general initiation factors in transcription by
RNA polymerase II. Trends in biochemical sciences 21: 327–335.
11. Koleske AJ, Young RA (1994) An RNA polymerase II holoenzyme responsive
to activators. Nature 368: 466–469.
12. Ranish JA, Yudkovsky N, Hahn S (1999) Intermediates in formation and
activity of the RNA polymerase II preinitiation complex: holoenzyme
recruitment and a postrecruitment role for the TATA box and TFIIB. Genes
& development 13: 49–63.
13. Yang C, Bolotin E, Jiang T, Sladek FM, Martinez E (2007) Prevalence of the
initiator over the TATA box in human and yeast genes and identification of
DNA motifs enriched in human TATA-less core promoters. Gene 389: 52–65.
14. Molina C, Grotewold E (2005) Genome wide analysis of Arabidopsis core
promoters. BMC genomics 6: 25.
15. Civan P, Svec M (2009) Genome-wide analysis of rice (Oryza sativa L. subsp.
japonica) TATA box and Y Patch promoter elements. Genome/National
Research Council Canada = Genome/Conseil national de recherches Canada
52: 294–297.
16. Basehoar AD, Zanton SJ, Pugh BF (2004) Identification and distinct regulation
of yeast TATA box-containing genes. Cell 116: 699–709.
17. Tirosh I, Weinberger A, Carmi M, Barkai N (2006) A genetic signature of
interspecies variations in gene expression. Nature genetics 38: 830–834.
18. Landry CR, Lemos B, Rifkin SA, Dickinson WJ, Hartl DL (2007) Genetic
properties influencing the evolvability of gene expression. Science 317: 118–
121.
19. Lagrange T, Kapanidis AN, Tang H, Reinberg D, Ebright RH (1998) New
core promoter element in RNA polymerase II-dependent transcription:
sequence-specific DNA binding by transcription factor IIB. Genes &
development 12: 34–44.
20. Deng W, Roberts SG (2005) A core promoter element downstream of the
TATA box that is recognized by TFIIB. Genes & development 19: 2418–2423.
21. Kutach AK, Kadonaga JT (2000) The downstream promoter element DPE
appears to be as widely used as the TATA box in Drosophila core promoters.
Molecular and cellular biology 20: 4754–4764.
22. Lim CY, Santoso B, Boulay T, Dong E, Ohler U, et al. (2004) The MTE, a
new core promoter element for transcription by RNA polymerase II. Genes &
development 18: 1606–1617.
23. Lee DH, Gershenzon N, Gupta M, Ioshikhes IP, Reinberg D, et al. (2005)
Functional characterization of core promoter elements: the downstream core
element is recognized by TAF1. Molecular and cellular biology 25: 9674–9686.
24. Tokusumi Y, Ma Y, Song X, Jacobson RH, Takada S (2007) The new core
promoter element XCPE1 (X Core Promoter Element 1) directs activator-,
mediator-, and TATA-binding protein-dependent but TFIID-independent
RNA polymerase II transcription from TATA-less promoters. Molecular and
cellular biology 27: 1844–1858.
25. Ince TA, Scotto KW (1995) A conserved downstream element defines a new
class of RNA polymerase II promoters. The Journal of biological chemistry
270: 30249–30252.
26. Tasanen K, Oikarinen J, Kivirikko KI, Pihlajaniemi T (1992) Promoter of the
gene for the multifunctional protein disulfide isomerase polypeptide. Functional
significance of the six CCAAT boxes and other promoter elements. The
Journal of biological chemistry 267: 11513–11519.
27. Rieping M, Schoffl F (1992) Synergistic effect of upstream sequences, CCAAT
box elements, and HSE sequences for enhanced expression of chimaeric heat
shock genes in transgenic tobacco. Molecular & general genetics: MGG 231:
226–232.
28. Ito T, Fujimoto Y, Nakayama T, Iwabuchi M (1995) A far-upstream sequence
of the wheat histone H3 promoter functions differently in rice and tobacco
cultured cells. Plant & cell physiology 36: 1281–1289.
29. Kehoe DM, Degenhardt J, Winicov I, Tobin EM (1994) Two 10-bp regions are
critical for phytochrome regulation of a Lemna gibba Lhcb gene promoter.
The Plant cell 6: 1123–1134.
30. Yamamoto YY, Ichida H, Abe T, Suzuki Y, Sugano S, et al. (2007)
Differentiation of core promoter architecture between plants and mammals
revealed by LDSS analysis. Nucleic acids research 35: 6219–6226.
31. Burke TW, Kadonaga JT (1997) The downstream core promoter element,
DPE, is conserved from Drosophila to humans and is recognized by TAFII60
of Drosophila. Genes & development 11: 3020–3031.
32. Santel A, Kaufmann J, Hyland R, Renkawitz-Pohl R (2000) The initiator
element of the Drosophila beta2 tubulin gene core promoter contributes to
gene expression in vivo but is not required for male germ-cell specific
expression. Nucleic acids research 28: 1439–1446.
33. Wu CH, Madabusi L, Nishioka H, Emanuel P, Sypes M, et al. (2001) Analysis
of core promoter sequences located downstream from the TATA element in
the hsp70 promoter from Drosophila melanogaster. Molecular and cellular
biology 21: 1593–1602.
34. Bielinska B, Lu J, Sturgill D, Oliver B (2005) Core promoter sequences
contribute to ovo-B regulation in the Drosophila melanogaster germline.
Genetics 169: 161–172.
35. Ohler U (2006) Identification of core promoter modules in Drosophila and
their application in accurate transcription start site prediction. Nucleic acids
research 34: 5943–5950.
36. Hendrix DA, Hong JW, Zeitlinger J, Rokhsar DS, Levine MS (2008) Promoter
elements associated with RNA Pol II stalling in the Drosophila embryo.
Proceedings of the National Academy of Sciences of the United States of
America 105: 7762–7767.
37. Nechaev S, Fargo DC, dos Santos G, Liu L, Gao Y, et al. (2010) Global
analysis of short RNAs reveals widespread promoter-proximal stalling and
arrest of Pol II in Drosophila. Science 327: 335–338.
38. Hoskins RA, Landolin JM, Brown JB, Sandler JE, Takahashi H, et al. (2011)
Genome-wide analysis of promoter architecture in Drosophila melanogaster.
Genome research 21: 182–192.
39. Baugh LR, Demodena J, Sternberg PW (2009) RNA Pol II accumulates at
promoters of growth genes during developmental arrest. Science 324: 92–94.
40. Zhou Q, Jiang X, Zhang H, Du A (2009) [Act-1 core promoter region
introduces high-performance transcription of EGFP gene expressed in
Caenorhabditis elegans]. Sheng wu gong cheng xue bao = Chinese journal
of biotechnology 25: 336–340.
41. Grishkevich V, Hashimshony T, Yanai I (2011) Core promoter T-blocks
correlate with gene expression levels in C. elegans. Genome research 21: 707–
717.
42. Cassidy B, Haglund R, Rothblum LI (1987) Regions upstream from the core
promoter of the rat ribosomal gene are required for the formation of a stable
transcription initiation complex by RNA polymerase I in vitro. Biochimica et
biophysica acta 909: 133–144.
43. Garg LC, Dixit A, Jacob ST (1989) A 37-base pair element in the far upstream
spacer region can enhance transcription of rat rDNA in vitro and can bind to
the core promoter-binding factor(s). The Journal of biological chemistry 264:
220–224.
44. Zhang J, Jacob ST (1990) Purification and characterization of a novel factor
which stimulates rat ribosomal gene transcription in vitro by interacting with
enhancer and core promoter elements. Molecular and cellular biology 10:
5177–5186.
Core Promoter Prediction in Eight Plant Genomes
PLOS ONE | www.plosone.org 25 October 2013 | Volume 8 | Issue 10 | e79011

45. Kariya K, Karns LR, Simpson PC (1994) An enhancer core element mediates
stimulation of the rat beta-myosin heavy chain promoter by an alpha 1-adrenergic agonist and activated beta-protein kinase C in hypertrophy of
cardiac myocytes. The Journal of biological chemistry 269: 3775–3782.
46. Niu H, Zhang J, Jacob ST (1995) E1BF/Ku interacts physically and
functionally with the core promoter binding factor CPBF and promotes thebasal transcription of rat and human ribosomal RNA genes. Gene expression 4:
111–124.
47. Kobayashi T, Urakami S, Cheadle JP, Aspinwall R, Harris P, et al. (1997)
Identification of a leader exon and a core promoter for the rat tuberoussclerosis 2 (Tsc2) gene and structural comparison with the human homolog.
Mammalian genome: official journal of the International Mammalian Genome
Society 8: 554–558.
48. Zhao B, Butler AP (2001) Core promoter involvement in the induction of ratornithine decarboxylase by phorbol esters. Molecular carcinogenesis 32: 92–99.
49. Clos J, Normann A, Ohrlein A, Grummt I (1986) The core promoter of mouserDNA consists of two functionally distinct domains. Nucleic acids research 14:
7581–7595.
50. Tamura T, Sumita K, Hirose S, Mikoshiba K (1990) Core promoter of the
mouse myelin basic protein gene governs brain-specific transcription in vitro.The EMBO journal 9: 3101–3108.
51. Ishikawa Y, Safrany G, Hisatake K, Tanaka N, Maeda Y, et al. (1991)Structure of the core promoter of human and mouse ribosomal RNA gene.
Asymmetry of species-specific transcription. Journal of molecular biology 218:
55–67.
52. Tamura T, Sumita K, Mikoshiba K (1991) Sequences involved in brain-specificin vitro transcription from the core promoter of the mouse myelin basic protein
gene. Biochimica et biophysica acta 1129: 83–86.
53. Avraham S, Avraham H, Austen KF, Stevens RL (1992) Negative and positive
cis-acting elements in the promoter of the mouse gene that encodes the serine/
glycine-rich peptide core of secretory granule proteoglycans. The Journal ofbiological chemistry 267: 610–617.
54. Uetsuki T, Takagi K, Sugiura H, Yoshikawa K (1996) Structure and expression
of the mouse necdin gene. Identification of a postmitotic neuron-restrictive core
promoter. The Journal of biological chemistry 271: 918–924.
55. Ali M, Girimaji SC, Kumar A (2003) Identification of a core promoter and anovel isoform of the human TSC1 gene transcript and structural comparison
with mouse homolog. Gene 320: 145–154.
56. Sharan R, Ovcharenko I, Ben-Hur A, Karp RM (2003) CREME: a framework
for identifying cis-regulatory modules in human-mouse conserved segments.
Bioinformatics 19 Suppl 1: i283–291.
57. Sakata-Takatani K, Matsuo N, Sumiyoshi H, Tsuda T, Yoshioka H (2004)Identification of a functional CBF-binding CCAAT-like motif in the core
promoter of the mouse pro-alpha 1(V) collagen gene (Col5a1). Matrix biology:
journal of the International Society for Matrix Biology 23: 87–99.
58. Somboonthum P, Ohta H, Yamada S, Onishi M, Ike A, et al. (2005) cAMP-
responsive element in TATA-less core promoter is essential for haploid-specificgene expression in mouse testis. Nucleic acids research 33: 3401–3411.
59. Jin VX, Singer GA, Agosto-Perez FJ, Liyanarachchi S, Davuluri RV (2006)
Genome-wide analysis of core promoter elements from conserved human and
mouse orthologous pairs. BMC bioinformatics 7: 114.
60. Smith AD, Sumazin P, Xuan Z, Zhang MQ (2006) DNA motifs in human andmouse proximal promoters predict tissue-specific expression. Proceedings of the
National Academy of Sciences of the United States of America 103: 6275–
6280.
61. Sun H, Wu J, Wickramasinghe P, Pal S, Gupta R, et al. (2011) Genome-wide
mapping of RNA Pol-II promoter usage in mouse tissues by ChIP-seq. Nucleicacids research 39: 190–201.
62. Khachigian LM, Fries JW, Benz MW, Bonthron DT, Collins T (1994) Novel
cis-acting elements in the human platelet-derived growth factor B-chain core
promoter that mediate gene expression in cultured vascular endothelial cells.The Journal of biological chemistry 269: 22647–22656.
63. Wariishi S, Miyahara K, Toda K, Ogoshi S, Doi Y, et al. (1995) A SP1 bindingsite in the GC-rich region is essential for a core promoter activity of the human
endothelial nitric oxide synthase gene. Biochemical and biophysical researchcommunications 216: 729–735.
64. Halle JP, Haus-Seuffert P, Woltering C, Stelzer G, Meisterernst M (1997) Aconserved tissue-specific structure at a human T-cell receptor beta-chain core
promoter. Molecular and cellular biology 17: 4220–4229.
65. Koritschoner NP, Bocco JL, Panzetta-Dutari GM, Dumur CI, Flury A, et al.
(1997) A novel human zinc finger protein that interacts with the core promoterelement of a TATA box-less gene. The Journal of biological chemistry 272:
9573–9580.
66. Martinez E, Ge H, Tao Y, Yuan CX, Palhan V, et al. (1998) Novel cofactors
and TFIIA mediate functional core promoter selectivity by the humanTAFII150-containing TFIID complex. Molecular and cellular biology 18:
6571–6583.
67. Kuhlman TC, Cho H, Reinberg D, Hernandez N (1999) The general
transcription factors IIA, IIB, IIF, and IIE are required for RNA polymerase IItranscription from the human U1 small nuclear RNA promoter. Molecular and
cellular biology 19: 2130–2141.
68. Solecki D, Wimmer E, Lipp M, Bernhardt G (1999) Identification and
characterization of the cis-acting elements of the human CD155 gene corepromoter. The Journal of biological chemistry 274: 1791–1800.
69. Tsai FT, Sigler PB (2000) Structural basis of preinitiation complex assembly on
human pol II promoters. The EMBO journal 19: 25–36.
70. Zhou T, Chiang CM (2002) Sp1 and AP2 regulate but do not constitute
TATA-less human TAF(II)55 core promoter activity. Nucleic acids research
30: 4145–4157.
71. Itoh A, Wang Z, Ito Y, Reddy UR, Itoh T (2004) SP3 acts as a positive
regulator on the core promoter of human ZPK gene. Biochemical and
biophysical research communications 313: 612–618.
72. Yang MQ, Elnitski LL (2008) Diversity of core promoter elements comprising
human bidirectional promoters. BMC genomics 9 Suppl 2: S3.
73. Darvish H, Nabi MO, Firouzabadi SG, Karimlou M, Heidari A, et al. (2011)
Exceptional human core promoter nucleotide compositions. Gene 475: 79–86.
74. Yamashita R, Sathira NP, Kanai A, Tanimoto K, Arauchi T, et al. (2011)
Genome-wide characterization of transcriptional start sites in humans by
integrative transcriptome analysis. Genome research 21: 775–789.
75. Pandey SP, Krishnamachari A (2006) Computational analysis of plant RNA
Pol-II promoters. Bio Systems 83: 38–50.
76. Yamamoto YY, Obokata J (2008) ppdb: a plant promoter database. Nucleic
acids research 36: D977–981.
77. Yamamoto YY, Ichida H, Matsui M, Obokata J, Sakurai T, et al. (2007)
Identification of plant promoter constituents by analysis of local distribution of
short sequences. BMC genomics 8: 67.
78. Morey C, Mookherjee S, Rajasekaran G, Bansal M (2011) DNA free energy-
based promoter prediction and comparative analysis of Arabidopsis and rice
genomes. Plant physiology 156: 1300–1315.
79. Struhl K (1999) Fundamentally different logic of gene regulation in eukaryotes
and prokaryotes. Cell 98: 1–4.
80. Klingenhoff A, Frech K, Werner T (2002) Regulatory modules shared within
gene classes as well as across gene classes can be detected by the same in silico
approach. In silico biology 2: S17–26.
81. Florquin K, Saeys Y, Degroeve S, Rouze P, Van de Peer Y (2005) Large-scale
structural analysis of the core promoter in mammalian and plant genomes.
Nucleic acids research 33: 4255–4264.
82. Bernard V, Brunaud V, Lecharny A (2010) TC-motifs at the TATA-box
expected position in plant genes: a novel class of motifs involved in the
transcription regulation. BMC genomics 11: 166.
83. Rombauts S, Florquin K, Lescot M, Marchal K, Rouze P, et al. (2003)
Computational approaches to identify promoters and cis-regulatory elements in
plant genomes. Plant physiology 132: 1162–1176.
84. Elemento O, Slonim N, Tavazoie S (2007) A universal framework for
regulatory element discovery across all genomes and data types. Molecular cell
28: 337–350.
85. Hannenhalli S (2008) Eukaryotic transcription factor binding sites--modeling
and integrative search methods. Bioinformatics 24: 1325–1331.
86. Zhou Q, Liu JS (2008) Extracting sequence features to predict protein-DNA
interactions: a comparative study. Nucleic acids research 36: 4137–4148.
87. Carmack CS, McCue LA, Newberg LA, Lawrence CE (2007) PhyloScan:
identification of transcription factor binding sites using cross-species evidence.
Algorithms for molecular biology: AMB 2: 1.
88. Fickett JW, Hatzigeorgiou AG (1997) Eukaryotic promoter recognition.
Genome research 7: 861–878.
89. Bulyk ML (2003) Computational prediction of transcription-factor binding site
locations. Genome biology 5: 201.
90. Megraw M, Baev V, Rusinov V, Jensen ST, Kalantidis K, et al. (2006)
MicroRNA promoter element discovery in Arabidopsis. RNA 12: 1612–1619.
91. Cai YH, Huang H (2012) Advances in the study of protein-DNA interaction.
Amino acids 43: 1141–1146.
92. Jothi R, Cuddapah S, Barski A, Cui K, Zhao K (2008) Genome-wide
identification of in vivo protein-DNA binding sites from ChIP-Seq data.
Nucleic acids research 36: 5221–5231.
93. Schmid CD, Bucher P (2007) ChIP-Seq data reveal nucleosome architecture of
human promoters. Cell 131:831-832; author reply 832–833.
94. Li N, Tompa M (2006) Analysis of computational approaches for motif
discovery. Algorithms for molecular biology: AMB 1: 8.
95. Hughes JD, Estep PW, Tavazoie S, Church GM (2000) Computational
identification of cis-regulatory elements associated with groups of functionally
related genes in Saccharomyces cerevisiae. Journal of molecular biology 296:
1205–1214.
96. Casimiro AC, Vinga S, Freitas AT, Oliveira AL (2008) An analysis of the
positional distribution of DNA motifs in promoter regions and its biological
relevance. BMC bioinformatics 9: 89.
97. Gordan R, Hartemink AJ (2008) Using DNA duplex stability information for
transcription factor binding site discovery. Pacific Symposium on Biocomput-
ing Pacific Symposium on Biocomputing: 453–464.
98. Smale ST (2001) Core promoters: active contributors to combinatorial gene
regulation. Genes & development 15: 2503–2508.
99. Xie X, Lu J, Kulbokas EJ, Golub TR, Mootha V, et al. (2005) Systematic
discovery of regulatory motifs in human promoters and 39 UTRs by
comparison of several mammals. Nature 434: 338–345.
100. Down TA, Bergman CM, Su J, Hubbard TJ (2007) Large-scale discovery of
promoter motifs in Drosophila melanogaster. PLoS computational biology 3:
e7.
Core Promoter Prediction in Eight Plant Genomes
PLOS ONE | www.plosone.org 26 October 2013 | Volume 8 | Issue 10 | e79011

101. Shahmuradov IA, Gammerman AJ, Hancock JM, Bramley PM, Solovyev VV
(2003) PlantProm: a database of plant promoter sequences. Nucleic acidsresearch 31: 114–117.
102. Bryne JC, Valen E, Tang MH, Marstrand T, Winther O, et al. (2008)
JASPAR, the open access database of transcription factor-binding profiles: newcontent and tools in the 2008 update. Nucleic acids research 36: D102–106.
103. Rangannan V, Bansal M (2009) Relative stability of DNA as a generic criterionfor promoter prediction: whole genome annotation of microbial genomes with
varying nucleotide base composition. Molecular bioSystems 5: 1758–1769.
104. Schones DE, Sumazin P, Zhang MQ (2005) Similarity of position frequencymatrices for transcription factor binding sites. Bioinformatics 21: 307–313.
105. Smith AD, Sumazin P, Zhang MQ (2005) Identifying tissue-selectivetranscription factor binding sites in vertebrate promoters. Proceedings of the
National Academy of Sciences of the United States of America 102: 1560–1565.
106. Perier RC, Junier T, Bonnard C, Bucher P (1999) The Eukaryotic Promoter
Database (EPD): recent developments. Nucleic acids research 27: 307–309.107. Burke TW, Kadonaga JT (1996) Drosophila TFIID binds to a conserved
downstream basal promoter element that is present in many TATA-box-deficient promoters. Genes & development 10: 711–724.
108. Bucher P (1990) Weight matrix descriptions of four eukaryotic RNA
polymerase II promoter elements derived from 502 unrelated promotersequences. Journal of molecular biology 212: 563–578.
109. Schmid CD, Perier R, Praz V, Bucher P (2006) EPD in its twentieth year:towards complete promoter coverage of selected model organisms. Nucleic
acids research 34: D82–85.110. Kadonaga JT (2012) Perspectives on the RNA polymerase II core promoter.
WIREs Dev Biol 1: 40–51.
111. Kadonaga JT (2002) The DPE, a core promoter element for transcription byRNA polymerase II. Experimental & molecular medicine 34: 259–264.
112. Carroll SL, Bergsma DJ, Schwartz RJ (1988) A 29-nucleotide DNA segmentcontaining an evolutionarily conserved motif is required in cis for cell-type-
restricted repression of the chicken alpha-smooth muscle actin gene core
promoter. Molecular and cellular biology 8: 241–250.113. Aso T, Conaway JW, Conaway RC (1994) Role of core promoter structure in
assembly of the RNA polymerase II preinitiation complex. A common pathwayfor formation of preinitiation intermediates at many TATA and TATA-less
promoters. The Journal of biological chemistry 269: 26575–26583.114. Ham J, Steger G, Yaniv M (1994) Cooperativity in vivo between the E2
transactivator and the TATA box binding protein depends on core promoter
structure. The EMBO journal 13: 147–157.115. Verrijzer CP, Yokomori K, Chen JL, Tjian R (1994) Drosophila TAFII150:
similarity to yeast gene TSM-1 and specific binding to core promoter DNA.Science 264: 933–941.
116. Chen KH, Wood T, He F, Narayan S, Wilson SH (1995) The bovine DNA
polymerase beta promoter: cloning, characterization and comparison with thehuman core promoter. Gene 164: 323–327.
117. Colgan J, Manley JL (1995) Cooperation between core promoter elementsinfluences transcriptional activity in vivo. Proceedings of the National Academy
of Sciences of the United States of America 92: 1955–1959.118. Sakurai H, Ohishi T, Fukasawa T (1996) Core promoter elements are essential
as selective determinants for function of the yeast transcription factor GAL11.
FEBS letters 398: 113–119.119. Stuart JM, Segal E, Koller D, Kim SK (2003) A gene-coexpression network for
global discovery of conserved genetic modules. Science 302: 249–255.120. Kim DW, Lee SH, Choi SB, Won SK, Heo YK, et al. (2006) Functional
conservation of a root hair cell-specific cis-element in angiosperms with
different root hair distribution patterns. The Plant cell 18: 2958–2970.121. Juven-Gershon T, Hsu JY, Theisen JW, Kadonaga JT (2008) The RNA
polymerase II core promoter - the gateway to transcription. Current opinion incell biology 20: 253–259.
122. Rach EA, Winter DR, Benjamin AM, Corcoran DL, Ni T, et al. (2011)
Transcription initiation patterns indicate divergent strategies for generegulation at the chromatin level. PLoS genetics 7: e1001274.
123. Tabach Y, Brosh R, Buganim Y, Reiner A, Zuk O, et al. (2007) Wide-scaleanalysis of human functional transcription factor binding reveals a strong bias
towards the transcription start site. PloS one 2: e807.
124. Fukue Y, Sumida N, Tanase J, Ohyama T (2005) A highly distinctive
mechanical property found in the majority of human promoters and itstranscriptional relevance. Nucleic acids research 33: 3821–3827.
125. Aerts S, Thijs G, Dabrowski M, Moreau Y, De Moor B (2004) Comprehensive
analysis of the base composition around the transcription start site in Metazoa.BMC genomics 5: 34.
126. Pedersen AG, Baldi P, Chauvin Y, Brunak S (1998) DNA structure in humanRNA polymerase II promoters. Journal of molecular biology 281: 663–673.
127. Abeel T, Saeys Y, Bonnet E, Rouze P, Van de Peer Y (2008) Generic
eukaryotic core promoter prediction using structural features of DNA. Genomeresearch 18: 310–323.
128. Deng W, Roberts SG (2006) Core promoter elements recognized bytranscription factor IIB. Biochemical Society transactions 34: 1051–1053.
129. Yamamoto YY, Yoshitsugu T, Sakurai T, Seki M, Shinozaki K, et al. (2009)Heterogeneity of Arabidopsis core promoters revealed by high-density TSS
analysis. The Plant journal: for cell and molecular biology 60: 350–362.
130. Yamamoto YY, Yoshioka Y, Hyakumachi M, Obokata J (2011) Characteristicsof core promoter types with respect to gene structure and expression in
Arabidopsis thaliana. DNA research: an international journal for rapidpublication of reports on genes and genomes 18: 333–342.
131. Smale ST, Kadonaga JT (2003) The RNA polymerase II core promoter.
Annual review of biochemistry 72: 449–479.132. Carninci P, Sandelin A, Lenhard B, Katayama S, Shimokawa K, et al. (2006)
Genome-wide analysis of mammalian promoter architecture and evolution.Nature genetics 38: 626–635.
133. Carninci P (2006) Tagging mammalian transcription complexity. Trends ingenetics: TIG 22: 501–510.
134. Verrijzer CP, Chen JL, Yokomori K, Tjian R (1995) Binding of TAFs to core
elements directs promoter selectivity by RNA polymerase II. Cell 81: 1115–1125.
135. Joshi CP (1987) An inspection of the domain between putative TATA box andtranslation start site in 79 plant genes. Nucleic acids research 15: 6643–6653.
136. Yamamoto Y, Tsuji H, Obokata J (1993) Structure and expression of a nuclear
gene for the PSI-D subunit of photosystem I in Nicotiana sylvestris. Plantmolecular biology 22: 985–994.
137. Nakamura M, Tsunoda T, Obokata J (2002) Photosynthesis nuclear genesgenerally lack TATA-boxes: a tobacco photosystem I gene responds to light
through an initiator. The Plant journal: for cell and molecular biology 29: 1–10.
138. Butler JE, Kadonaga JT (2002) The RNA polymerase II core promoter: a key
component in the regulation of gene expression. Genes & development 16:2583–2592.
139. Juven-Gershon T, Hsu JY, Kadonaga JT (2006) Perspectives on the RNApolymerase II core promoter. Biochemical Society transactions 34: 1047–1050.
140. Spooner W, Youens-Clark K, Staines D, Ware D (2012) GrameneMart: the
BioMart data portal for the Gramene project. Database: the journal ofbiological databases and curation 2012: bar056.
141. Hubbard TJ, Aken BL, Ayling S, Ballester B, Beal K, et al. (2009) Ensembl2009. Nucleic acids research 37: D690–697.
142. Allawi HT, SantaLucia J, Jr. (1997) Thermodynamics and NMR of internalG.T mismatches in DNA. Biochemistry 36: 10581–10594.
143. SantaLucia J, Jr. (1998) A unified view of polymer, dumbbell, and
oligonucleotide DNA nearest-neighbor thermodynamics. Proceedings of theNational Academy of Sciences of the United States of America 95: 1460–1465.
144. Matys V, Kel-Margoulis OV, Fricke E, Liebich I, Land S, et al. (2006)TRANSFAC and its module TRANSCompel: transcriptional gene regulation
in eukaryotes. Nucleic acids research 34: D108–110.
145. Schones DE, Smith AD, Zhang MQ (2007) Statistical significance of cis-regulatory modules. BMC bioinformatics 8: 19.
146. Maere S, Heymans K, Kuiper M (2005) BiNGO: a Cytoscape plugin to assessoverrepresentation of gene ontology categories in biological networks.
Bioinformatics 21: 3448–3449.
147. Shannon P, Markiel A, Ozier O, Baliga NS, Wang JT, et al. (2003) Cytoscape:a software environment for integrated models of biomolecular interaction
networks. Genome research 13: 2498–2504.148. Benjamini Y HY (1995) Controlling the false discovery rate: A practical and
powerful approach to multiple testing. J Roy Statist Soc Ser: 12.
Core Promoter Prediction in Eight Plant Genomes
PLOS ONE | www.plosone.org 27 October 2013 | Volume 8 | Issue 10 | e79011
Related Documents