NATURE GENETICS VOLUME 42 | NUMBER 5 | MAY 2010 441 Consistent but indirect evidence has implicated genetic factors in smoking behavior 1,2 . We report meta-analyses of several smoking phenotypes within cohorts of the Tobacco and Genetics Consortium (n = 74,053). We also partnered with the European Network of Genetic and Genomic Epidemiology (ENGAGE) and Oxford-GlaxoSmithKline (Ox-GSK) consortia to follow up the 15 most significant regions (n > 140,000). We identified three loci associated with number of cigarettes smoked per day. The strongest association was a synonymous 15q25 SNP in the nicotinic receptor gene CHRNA3 (rs1051730[A], b = 1.03, standard error (s.e.) = 0.053, P = 2.8 × 10 −73 ). Two 10q25 SNPs (rs1329650[G], b = 0.367, s.e. = 0.059, P = 5.7 × 10 −10 ; and rs1028936[A], b = 0.446, s.e. = 0.074, P = 1.3 × 10 −9 ) and one 9q13 SNP in EGLN2 (rs3733829[G], b = 0.333, s.e. = 0.058, P = 1.0 × 10 −8 ) also exceeded genome-wide significance for cigarettes per day. For smoking initiation, eight SNPs exceeded genome-wide significance, with the strongest association at a nonsynonymous SNP in BDNF on chromosome 11 (rs6265[C], odds ratio (OR) = 1.06, 95% confidence interval (Cl) 1.04–1.08, P = 1.8 × 10 −8 ). One SNP located near DBH on chromosome 9 (rs3025343[G], OR = 1.12, 95% Cl 1.08–1.18, P = 3.6 × 10 −8 ) was significantly associated with smoking cessation. Previous genome-wide association studies (GWAS) for smoking behavior (Supplementary Table 1) have identified a chromosome-15 nicotinic acetylcholine receptor gene cluster as being associated with smoking quantity 3 . The Tobacco and Genetics (TAG) Consortium conducted GWAS meta-analyses across 16 studies originally designed to evaluate other phenotypes (for example, cardiovascular disease and type 2 diabetes). We examined four carefully harmonized smoking phenotypes (see Online Methods)—smoking initiation (ever versus never been a regular smoker), age of smoking initiation, smoking quantity (number of cigarettes smoked per day, CPD) and smok- ing cessation (former versus current smokers)—among people of European ancestry (Table 1). Smoking cessation contrasted former versus current smokers, where current smokers reported at interview that they presently smoked and former smokers had quit smoking at least 1 year before interview. Smokers who had quit smoking for less than 1 year at interview were excluded from the analysis to minimize misclassification, as relapse after initial smoking cessation occurs in 70% to 80% of former smokers within the first year 4 . The 16 TAG studies performed their own genotyping, quality con- trol and imputation (see Supplementary Tables 2 and 3 and Online Methods). Studies ranged in size from n = 585 to n = 22,037 and were genotyped on six different platforms. Genotype imputation 5 resulted in a common set of ~2.5 million SNPs (Supplementary Table 3). Imputed allele dosages for each SNP (that is, the number of copies of the minor allele) were tested for association with each smoking phenotype, using an additive model. We performed a fixed-effect meta-analysis for each smoking pheno- type by computing pooled inverse variance–weighted β coefficients, s.e. values and z-scores for each SNP 6 . Fixed-effects analyses are regarded as the most efficient method for discovery in the GWAS setting 7,8 . Heterogeneity across studies was investigated using the I 2 statistic 9 . Random-effects analyses are presented in Supplementary Table 4. We used a significance threshold of P < 5 × 10 −8 (refs. 10,11). In the initial TAG meta-analysis, only one locus contained SNPs that exceeded genome-wide significance for one of the four pheno- types (Fig. 1 and Supplementary Table 4). A total of 130 SNPs in the 15q25.1 nicotinic receptor gene cluster were significantly associated with CPD (n = 38,181, minimum P = 4.2 × 10 −35 at rs12914385 in CHRNA3). One SNP approached significance for smoking cessation (n = 41,278, minimum P = 5.5 × 10 −8 for rs7872903, located ~17 kb 5′ of DBH on chromosome 9). No SNPs were significantly associated with ever versus never regular smokers (n = 74,035, minimum P = 2.2 × 10 −7 at rs16941640 in CDC27) or age of smoking initiation (n = 24,114, minimum P = 1.6 × 10 −6 at rs2806464, located 3′ of DISC1) in the initial TAG meta-analysis. To follow up associations identified in the TAG Consortium analyses, we partnered with the ENGAGE and Oxford-GlaxoSmithKline (Ox-GSK) consortia and conducted a reciprocal exchange of sum- mary results for the 15 most significant genetic regions for three smoking phenotypes 12,13 . Our regions were defined by clusters of P values < 10 −4 (that is, where the correlations (r 2 ) were >0.5 and/or the SNPs were located <50 kb apart; Supplementary Table 5). Sample sizes across the three consortia were n = 143,023 for smoking initia- tion, n = 73,853 for CPD and n = 64,924 for smoking cessation (data on age of smoking initiation were not available in ENGAGE or Ox-GSK). Genome-wide meta-analyses identify multiple loci associated with smoking behavior * Complete lists of authors and affiliations appear at the end of this paper. Received 19 October 2009; accepted 18 March 2010; published online 25 April 2010; doi:10.1038/ng.571 The Tobacco and Genetics Consortium * LETTERS © 2010 Nature America, Inc. All rights reserved.

Welcome message from author
This document is posted to help you gain knowledge. Please leave a comment to let me know what you think about it! Share it to your friends and learn new things together.
Transcript

Nature GeNetics VOLUME 42 | NUMBER 5 | MAY 2010 441
Consistent but indirect evidence has implicated genetic factors in smoking behavior1,2. We report meta-analyses of several smoking phenotypes within cohorts of the Tobacco and Genetics Consortium (n = 74,053). We also partnered with the European Network of Genetic and Genomic Epidemiology (ENGAGE) and Oxford-GlaxoSmithKline (Ox-GSK) consortia to follow up the 15 most significant regions (n > 140,000). We identified three loci associated with number of cigarettes smoked per day. The strongest association was a synonymous 15q25 SNP in the nicotinic receptor gene CHRNA3 (rs1051730[A], b = 1.03, standard error (s.e.) = 0.053, P = 2.8 × 10−73). Two 10q25 SNPs (rs1329650[G], b = 0.367, s.e. = 0.059, P = 5.7 × 10⁻¹⁰; and rs1028936[A], b = 0.446, s.e. = 0.074, P = 1.3 × 10⁻⁹) and one 9q13 SNP in EGLN2 (rs3733829[G], b = 0.333, s.e. = 0.058, P = 1.0 × 10⁻⁸) also exceeded genome-wide significance for cigarettes per day. For smoking initiation, eight SNPs exceeded genome-wide significance, with the strongest association at a nonsynonymous SNP in BDNF on chromosome 11 (rs6265[C], odds ratio (OR) = 1.06, 95% confidence interval (Cl) 1.04–1.08, P = 1.8 × 10⁻⁸). One SNP located near DBH on chromosome 9 (rs3025343[G], OR = 1.12, 95% Cl 1.08–1.18, P = 3.6 × 10⁻⁸) was significantly associated with smoking cessation.
Previous genome-wide association studies (GWAS) for smoking behavior (Supplementary Table 1) have identified a chromosome-15 nicotinic acetylcholine receptor gene cluster as being associated with smoking quantity3. The Tobacco and Genetics (TAG) Consortium conducted GWAS meta-analyses across 16 studies originally designed to evaluate other phenotypes (for example, cardiovascular disease and type 2 diabetes). We examined four carefully harmonized smoking phenotypes (see Online Methods)—smoking initiation (ever versus never been a regular smoker), age of smoking initiation, smoking quantity (number of cigarettes smoked per day, CPD) and smok-ing cessation (former versus current smokers)—among people of European ancestry (Table 1). Smoking cessation contrasted former versus current smokers, where current smokers reported at interview that they presently smoked and former smokers had quit smoking at least 1 year before interview. Smokers who had quit smoking for less than 1 year at interview were excluded from the analysis to minimize
misclassification, as relapse after initial smoking cessation occurs in 70% to 80% of former smokers within the first year4.
The 16 TAG studies performed their own genotyping, quality con-trol and imputation (see Supplementary Tables 2 and 3 and Online Methods). Studies ranged in size from n = 585 to n = 22,037 and were genotyped on six different platforms. Genotype imputation5 resulted in a common set of ~2.5 million SNPs (Supplementary Table 3). Imputed allele dosages for each SNP (that is, the number of copies of the minor allele) were tested for association with each smoking phenotype, using an additive model.
We performed a fixed-effect meta-analysis for each smoking pheno-type by computing pooled inverse variance–weighted β coefficients, s.e. values and z-scores for each SNP6. Fixed-effects analyses are regarded as the most efficient method for discovery in the GWAS setting7,8. Heterogeneity across studies was investigated using the I2 statistic9. Random-effects analyses are presented in Supplementary Table 4. We used a significance threshold of P < 5 × 10⁻⁸ (refs. 10,11).
In the initial TAG meta-analysis, only one locus contained SNPs that exceeded genome-wide significance for one of the four pheno-types (Fig. 1 and Supplementary Table 4). A total of 130 SNPs in the 15q25.1 nicotinic receptor gene cluster were significantly associated with CPD (n = 38,181, minimum P = 4.2 × 10⁻³⁵ at rs12914385 in CHRNA3). One SNP approached significance for smoking cessation (n = 41,278, minimum P = 5.5 × 10⁻⁸ for rs7872903, located ~17 kb 5′ of DBH on chromosome 9). No SNPs were significantly associated with ever versus never regular smokers (n = 74,035, minimum P = 2.2 × 10⁻⁷ at rs16941640 in CDC27) or age of smoking initiation (n = 24,114, minimum P = 1.6 × 10⁻⁶ at rs2806464, located 3′ of DISC1) in the initial TAG meta-analysis.
To follow up associations identified in the TAG Consortium analyses, we partnered with the ENGAGE and Oxford-GlaxoSmithKline (Ox-GSK) consortia and conducted a reciprocal exchange of sum-mary results for the 15 most significant genetic regions for three smoking phenotypes12,13. Our regions were defined by clusters of P values < 10−4 (that is, where the correlations (r2) were >0.5 and/or the SNPs were located <50 kb apart; Supplementary Table 5). Sample sizes across the three consortia were n = 143,023 for smoking initia-tion, n = 73,853 for CPD and n = 64,924 for smoking cessation (data on age of smoking initiation were not available in ENGAGE or Ox-GSK).
Genome-wide meta-analyses identify multiple loci associated with smoking behavior
*Complete lists of authors and affiliations appear at the end of this paper.
Received 19 October 2009; accepted 18 March 2010; published online 25 April 2010; doi:10.1038/ng.571
The Tobacco and Genetics Consortium*
l e t t e r s©
201
0 N
atu
re A
mer
ica,
Inc.
All
rig
hts
res
erve
d.

442 VOLUME 42 | NUMBER 5 | MAY 2010 Nature GeNetics
l e t t e r s
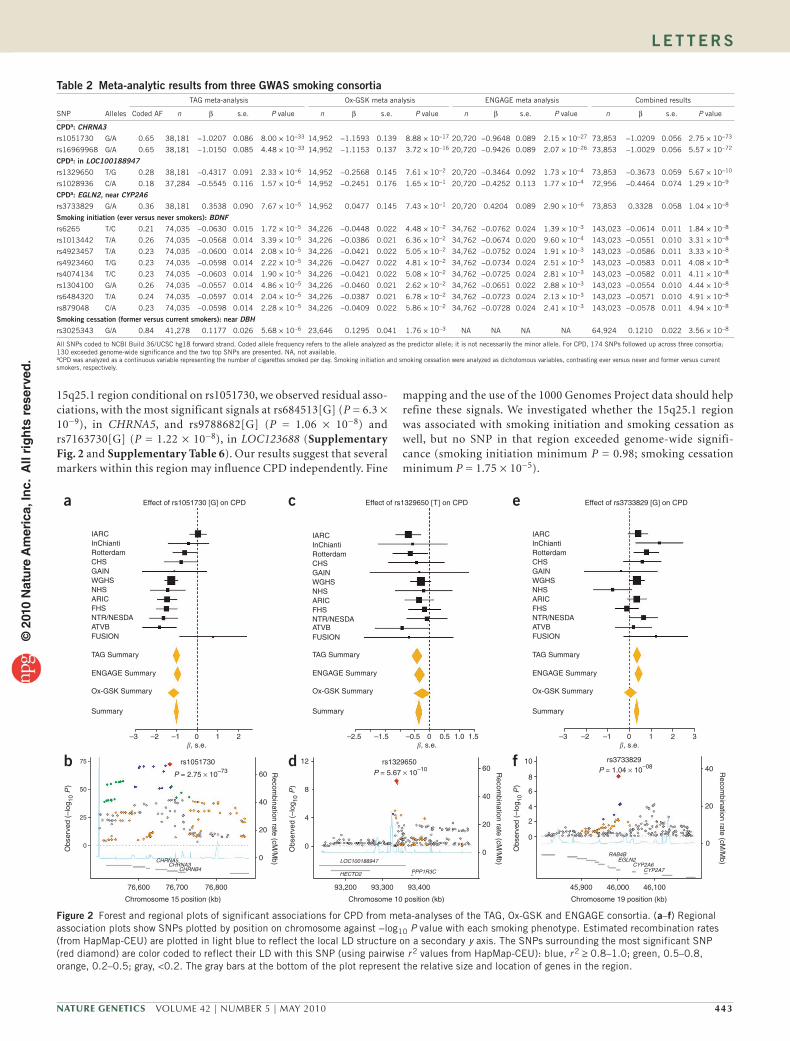
Results of the most significant SNPs for each smoking phenotype across the three consortia are summarized in Table 2. We identified three loci associated with CPD. The synonymous SNP rs1051730 in CHRNA3 showed the strongest association: each copy of the A allele corresponded to an increase in smoking quantity of 1 CPD
(β = 1.03, s.e. = 0.056, P = 2.8 × 10−73, I2 = 0.66; Fig. 2) and accounted for 0.5% of the variance in CPD. The SNP rs16969968[G], which has been proposed as a causal variant in this region14, was the sec-ond most significant SNP associated with CPD (P = 5.57 × 10−72; Supplementary Fig. 1). In tests of association for SNPs within the
table 1 Descriptive characteristics of the 16 studies participating in the tAG Consortium
Study n (% female) Agea, mean (s.d.) Ever smokers (%) CPD, mean (s.d.)bAge of initiation of smokinga,
mean (s.d.)b Former smokers (%)b
Population-based cohort studies
Atherosclerosis Risk in Communities (ARIC) 8,330 (52.9) 54.3 (5.7) 60.4 21.0 (11.7) 18.6 (5.1) 57.4
Baltimore Longitudinal Study of Aging (BLSA) 856 (46.0) 48.1 (17.8) 54.0 NA 19.3 (5.9) NA
Cardiovascular Health Study (CHS) 3,236 (60.8) 72.3 (5.4) 52.3 17.8 (11.8) 19.6 (6.6) 77.8
Invecchiare in Chianti (InCHIANTI) 1,200 (55.2) 68.4 (15.5) 43.9 14.8 (9.4) 32.2 (16.7) 57.0
Rotterdam Study 5,610 (60.3) 69.1 (8.9) 59.2 15.8 (11.7) 20.4 (8.2) 62.6
Framingham Heart Study (FHS) 7,257 (53.7) 45.4 (10.9) 54.2 15.5 (10.8) 17.9 (4.2) 61.7
Women’s Genome Health Study (WGHS) 22,037 (100) 54.7 (7.1) 49.2 16.0 (11.0) NA 75.2
Case-control studies
Atherosclerotic Disease Vascular Function and Genetic Epidemiology (ADVANCE)
585 (58.8) 45.8 (5.9) 47.7 13.1 (14.2) 17.0 (4.6) 65.2
Atherosclerosis, Thrombosis and Vascular Biology Italian Study Group (ATVB)
3,260 (11.6) 39.6 (4.9) 68.1 23.4 (14.7) 17.4 (4.0) 21.3
Diabetes Genetic Initiative (DGI) 2,504 (50.0) 61.6 (10.6) 37.7 NA 19.0 (5.5) NA
Finland-United States Investigation of NIDDM Genetics (FUSION)
1,055 (52.8) 64.0 (7.5) 46.8 16.3 (12.4) 21.0 (7.0) 65.0
International Agency for Research on Cancer (IARC) 8,381 (24.7) 59.6 (10.1) 75.2 19.3 (12.9) 18.7 (5.6) 31.4
Myocardial Infarction Genetics Consortium (MIGen) 2,647 (38.5) 48.8 (8.2) 64.3 NA NA 41.1
Nurses’ Health Study (NHS) 2,249 (100) 70.5 (6.4) 53.8 18.5 (10.5) 19.6 (3.6) 88.7
Netherlands Twin Registry-Netherlands Study of Depression and Anxiety (NTR/NESDA)
3,438 (66.9) 43.8 (13.4) 64.9 14.5 (9.8) 16.4 (4.2) 52.6
MGS (GAIN):controls 1,390 (54.1) 51.1 (17) 55.9 19.3 (16.4) NA 62.9
aAge in years. bCalculated among ever regular smokers. NA, not available.
a
b
c Ever versus neversmokers
Former versus currentsmokers
d Age of smoking initiation
CPD
Chromosome
–log
10 (P
)–l
og10
(P
)
–log
10 (P
)–l
og10
(P
)
35
30
25
20
15
10
5
1 2 3 4 5 6 7 8 9 10 11 12 13 14 15 16 17 18 19 20 21 22
Chromosome
1 2 3 4 5 6 7 8 9 10 11 12 13 14 15 16 17 18 19 20 21 22
3
4
5
6
7
8
3
4
5
6
7
8
3
4
5
6
7
89
Chromosome
1 2 3 4 5 6 7 8 9 10 11 12 13 14 15 16 17 18 19 20 21 22
Chromosome
1 2 3 4 5 6 7 8 9 10 11 12 13 14 15 16 17 18 19 20 21 22
Figure 1 Genome-wide association results for the TAG Consortium. Manhattan plots showing significance of association of all SNPs in the TAG Consortium meta-analyses for four smoking phenotypes. (a–d) Manhattan plots show SNPs plotted on the x axis according to their position on each chromosome against, on the y axis (shown as −log10 P value), the association with CPD (a), former versus current smoking (b), ever versus never smoking (c) and age of smoking initiation (d).
© 2
010
Nat
ure
Am
eric
a, In
c. A
ll ri
gh
ts r
eser
ved
.
Nature GeNetics VOLUME 42 | NUMBER 5 | MAY 2010 443
l e t t e r s
15q25.1 region conditional on rs1051730, we observed residual asso-ciations, with the most significant signals at rs684513[G] (P = 6.3 × 10⁻⁹), in CHRNA5, and rs9788682[G] (P = 1.06 × 10⁻⁸) and rs7163730[G] (P = 1.22 × 10⁻⁸), in LOC123688 (Supplementary Fig. 2 and Supplementary Table 6). Our results suggest that several markers within this region may influence CPD independently. Fine
mapping and the use of the 1000 Genomes Project data should help refine these signals. We investigated whether the 15q25.1 region was associated with smoking initiation and smoking cessation as well, but no SNP in that region exceeded genome-wide signifi-cance (smoking initiation minimum P = 0.98; smoking cessation minimum P = 1.75 × 10⁻⁵).
table 2 Meta-analytic results from three GWAs smoking consortia
SNP Alleles
TAG meta-analysis Ox-GSK meta analysis ENGAGE meta analysis Combined results
Coded AF n β s.e. P value n β s.e. P value n β s.e. P value n β s.e. P value
CPDa: CHRNA3
rs1051730 G/A 0.65 38,181 −1.0207 0.086 8.00 × 10⁻³³ 14,952 −1.1593 0.139 8.88 × 10⁻¹⁷ 20,720 −0.9648 0.089 2.15 × 10⁻²⁷ 73,853 −1.0209 0.056 2.75 × 10−73
rs16969968 G/A 0.65 38,181 −1.0150 0.085 4.48 × 10⁻³³ 14,952 −1.1153 0.137 3.72 × 10⁻¹⁶ 20,720 −0.9426 0.089 2.07 × 10⁻²⁶ 73,853 −1.0029 0.056 5.57 × 10−72
CPDa: in LOC100188947
rs1329650 T/G 0.28 38,181 −0.4317 0.091 2.33 × 10⁻⁶ 14,952 −0.2568 0.145 7.61 × 10⁻² 20,720 −0.3464 0.092 1.73 × 10⁻⁴ 73,853 −0.3673 0.059 5.67 × 10⁻¹⁰
rs1028936 C/A 0.18 37,284 −0.5545 0.116 1.57 × 10⁻⁶ 14,952 −0.2451 0.176 1.65 × 10⁻¹ 20,720 −0.4252 0.113 1.77 × 10⁻⁴ 72,956 −0.4464 0.074 1.29 × 10⁻⁹
CPDa: EGLN2, near CYP2A6
rs3733829 G/A 0.36 38,181 0.3538 0.090 7.67 × 10⁻⁵ 14,952 0.0477 0.145 7.43 × 10⁻¹ 20,720 0.4204 0.089 2.90 × 10⁻⁶ 73,853 0.3328 0.058 1.04 × 10⁻⁸
smoking initiation (ever versus never smokers): BDNF
rs6265 T/C 0.21 74,035 −0.0630 0.015 1.72 × 10⁻⁵ 34,226 −0.0448 0.022 4.48 × 10⁻² 34,762 −0.0762 0.024 1.39 × 10⁻³ 143,023 −0.0614 0.011 1.84 × 10⁻⁸
rs1013442 T/A 0.26 74,035 −0.0568 0.014 3.39 × 10⁻⁵ 34,226 −0.0386 0.021 6.36 × 10⁻² 34,762 −0.0674 0.020 9.60 × 10⁻⁴ 143,023 −0.0551 0.010 3.31 × 10⁻⁸
rs4923457 T/A 0.23 74,035 −0.0600 0.014 2.08 × 10⁻⁵ 34,226 −0.0421 0.022 5.05 × 10⁻² 34,762 −0.0752 0.024 1.91 × 10⁻³ 143,023 −0.0586 0.011 3.33 × 10⁻⁸
rs4923460 T/G 0.23 74,035 −0.0598 0.014 2.22 × 10⁻⁵ 34,226 −0.0427 0.022 4.81 × 10⁻² 34,762 −0.0734 0.024 2.51 × 10⁻³ 143,023 −0.0583 0.011 4.08 × 10⁻⁸
rs4074134 T/C 0.23 74,035 −0.0603 0.014 1.90 × 10⁻⁵ 34,226 −0.0421 0.022 5.08 × 10⁻² 34,762 −0.0725 0.024 2.81 × 10⁻³ 143,023 −0.0582 0.011 4.11 × 10⁻⁸
rs1304100 G/A 0.26 74,035 −0.0557 0.014 4.86 × 10⁻⁵ 34,226 −0.0460 0.021 2.62 × 10⁻² 34,762 −0.0651 0.022 2.88 × 10⁻³ 143,023 −0.0554 0.010 4.44 × 10⁻⁸
rs6484320 T/A 0.24 74,035 −0.0597 0.014 2.04 × 10⁻⁵ 34,226 −0.0387 0.021 6.78 × 10⁻² 34,762 −0.0723 0.024 2.13 × 10⁻³ 143,023 −0.0571 0.010 4.91 × 10⁻⁸
rs879048 C/A 0.23 74,035 −0.0598 0.014 2.28 × 10⁻⁵ 34,226 −0.0409 0.022 5.86 × 10⁻² 34,762 −0.0728 0.024 2.41 × 10⁻³ 143,023 −0.0578 0.011 4.94 × 10⁻⁸
smoking cessation (former versus current smokers): near DBH
rs3025343 G/A 0.84 41,278 0.1177 0.026 5.68 × 10⁻⁶ 23,646 0.1295 0.041 1.76 × 10⁻³ NA NA NA NA 64,924 0.1210 0.022 3.56 × 10⁻⁸
All SNPs coded to NCBI Build 36/UCSC hg18 forward strand. Coded allele frequency refers to the allele analyzed as the predictor allele; it is not necessarily the minor allele. For CPD, 174 SNPs followed up across three consortia; 130 exceeded genome-wide significance and the two top SNPs are presented. NA, not available. aCPD was analyzed as a continuous variable representing the number of cigarettes smoked per day. Smoking initiation and smoking cessation were analyzed as dichotomous variables, contrasting ever versus never and former versus current smokers, respectively.
a
25
50
O
bser
ved
(–lo
g 10 P
)
Obs
erve
d (–
log 10
P)
Obs
erve
d (–
log 10
P)
Chromosome 15 position (kb)
76,600
75
76,700 76,800
0
40
20
60 Recom
bination rate (cM/M
b)
Recom
bination rate (cM/M
b)
Recom
bination rate (cM/M
b)
rs1051730
P = 2.75 × 10–73 P = 5.67 × 10⁻¹⁰
0
CHRNA5CHRNA3
CHRNB4
b
c e
0
4
6
45,900
10
46,000 46,100
rs3733829
RAB4B
CYP2A6CYP2A7
EGLN2
fd
Effect of rs1051730 [G] on CPD
�, s.e. �, s.e. �, s.e.
Effect of rs3733829 [G] on CPDEffect of rs1329650 [T] on CPD
0
4
8
Chromosome 10 position (kb) Chromosome 19 position (kb)
93,200
12
93,300 93,400
rs1329650
LOC100188947
PPP1R3CHECTD2
2
8
IARCInChiantiRotterdamCHSGAINWGHSNHSARICFHSNTR/NESDAATVBFUSION
TAG Summary
ENGAGE Summary
Ox-GSK Summary
Summary
–3 –2 –1 0 1 2 –2.5 –1.5 –0.5 0 0.5 1.0 1.5
IARCInChiantiRotterdamCHSGAINWGHSNHSARICFHSNTR/NESDAATVBFUSION
TAG Summary
ENGAGE Summary
Ox-GSK Summary
Summary
IARCInChiantiRotterdamCHSGAINWGHSNHSARICFHSNTR/NESDAATVBFUSION
TAG Summary
ENGAGE Summary
Ox-GSK Summary
Summary
–3 –2 –1 0 1 2 3
0
40
20
0
40
20
60 P = 1.04 × 10–08
Figure 2 Forest and regional plots of significant associations for CPD from meta-analyses of the TAG, Ox-GSK and ENGAGE consortia. (a–f) Regional association plots show SNPs plotted by position on chromosome against −log10 P value with each smoking phenotype. Estimated recombination rates (from HapMap-CEU) are plotted in light blue to reflect the local LD structure on a secondary y axis. The SNPs surrounding the most significant SNP (red diamond) are color coded to reflect their LD with this SNP (using pairwise r 2 values from HapMap-CEU): blue, r 2 ≥ 0.8–1.0; green, 0.5–0.8, orange, 0.2–0.5; gray, <0.2. The gray bars at the bottom of the plot represent the relative size and location of genes in the region.
© 2
010
Nat
ure
Am
eric
a, In
c. A
ll ri
gh
ts r
eser
ved
.

444 VOLUME 42 | NUMBER 5 | MAY 2010 Nature GeNetics
l e t t e r s
In addition, markers within regions on chromosomes 10q23 and 19q13 were sig-nificantly associated with CPD. The SNPs rs1329650[G] (β = 0.367, s.e. = 0.059, P = 5.7 × 10⁻¹⁰; Fig. 2) and rs1028936[A] (β = 0.446, s.e. = 0.074, P = 1.3 × 10⁻⁹; Supplementary Fig. 1) are located in a non-coding RNA (LOC100188947), where each additional copy of a risk allele corresponded to an increase in smoking quantity of ~0.5 CPD. Linkage disequilibrium (LD) between these SNPs is moderate (r 2 = 0.46), suggest-ing that they may represent one signal. To our knowledge, this region has not been previously investigated in relation to smoking behavior or other addiction phenotypes.
The third locus identified for CPD lies in the first intron of EGLN2 on chromosome 19q13, 40 kb from the 3′ end of CYP2A6. One SNP, rs3733829, exceeded genome-wide significance, and each copy of the G allele corresponded to an increase in smoking quantity of <0.5 CPD (β = 0.333, s.e. = 0.058, P = 1.0 × 10⁻⁸; Fig. 2). CYP2A6 is an established candidate gene for smoking, as it encodes for an enzyme involved in the metabolic inactivation of nicotine to cotinine15. Many allelic variants of CYP2A6 result in slower metabolism of nicotine16 and are associated with lower prevalence of smoking and lower amounts of cigarette use16,17. We interpret this finding with caution, as only one SNP upstream of CYP2A6 was observed and the strength of its association was moderate. However, the 19q13 region merits continued investigation given its biological plausibility as involved in nicotine metabolism and because several markers within this region were identified in the ENGAGE Consortium12. The SNP identified in our study (rs3733829) lies directly between, and shows moderate LD with, the two most significant markers identified in ENGAGE.
Eight SNPs around BDNF exceeded genome-wide significance for smoking initiation analyses across the three consortia (Fig. 3). The minimum P value was at the missense variant rs6265 (P = 1.8 × 10⁻⁸) located in the first exon of BDNF on chromosome 11. Each copy of rs6265[C] conferred a 6% increase in the relative risk of regular smoking (OR = 1.06, 95% c.i. 1.04–1.08); rs6265 accounted for 0.03% of the variance. BDNF belongs to a family of neurotrophins that regulate synaptic plasticity and survival of cholinergic and dopamin-ergic neurons18. The eight SNPs overlap an antisense transcript (BDNFos). BDNF is expressed at high levels in the prefrontal cortex and hippocampus, which are brain regions implicated in the
cognitive-enhancing effects of nicotine19. Although the molecular mechanisms underlying this association have yet to be elucidated, it is plausible that genetic variation at BDNF could alter the rewarding effects of nicotine through modulation of dopamine reward circuits and could contribute to the salience of nicotine’s effects by altering formation of drug-related memories that promote continued use after initial exposure. The SNP rs6265 has been found to be associ-ated with substance-related disorders, eating disorders and schizo-phrenia20. Most recently, it was identified in a GWAS for body mass index21; the allele associated with a greater body mass index was the same allele associated with regular smoking in our study.
For smoking cessation, one SNP, located 23 kb 5′ of DBH on chromosome 9, achieved genome-wide significance: rs3025343[G] was associated with former smoking status (OR = 1.12, 95% c.i. 1.08–1.18, P = 3.6 × 10⁻⁸; Fig. 3) and accounted for 0.19% of the variance in smoking cessation. Because DBH catalyzes conversion of dopamine to norepinephrine, there has been interest in DBH as a candidate gene for various psychiatric phenotypes, including smoking behavior22. Although the SNP identified in this study does not cause amino acid residue changes in DBH, gene expression may be modified either directly or through other variant(s) in strong LD. This view is supported by evidence that a genetic variant (C1021T or rs1611115), located upstream of the DBH translational start site, accounts for 51% of the variation in plasma-DBH activity in European-Americans22. Alternatively, the SNP identified in our study or a variant in LD may influence expression of other genes nearby (ADAMTSL2, FAM163B or SARDH), which would introduce new pathways to our current understanding of addiction biology.
To our knowledge, the sample sizes for the TAG Consortium alone and combined with the ENGAGE and Ox-GSK consortia are among the largest genetic meta-analyses yet conducted23. Notably,
0
4
6
10
0
40
20
0
4
2
6
8
10
0
40
60
20
BDNFosBDNF
ADAMTSL2
DBHSARDH
FAM163B
a
b
c
d
8
2
Chromosome 11 position (kb)
Obs
erve
d (–
log 10
P)
rs6265P = 1.84 × 10–08
Recom
bination rate (cM/M
b)
Obs
erve
d (–
log 10
P)
27,70027,60027,500
Effect of rs3026343 [G] on former versus currentEffect of rs6265 [T] on ever versus never
Chromosome 9 position (kb)
135,600135,500135,400
Recom
bination rate (cM/M
b)
Odds ratio
rs3025343P = 3.56 × 10–08
Odds ratio
CHS GAINFHSNHSRotterdamIARCMIGENNTR/NESDAATVBWGHSARICCHSInChiantiADVANCE
TAG Summary
Ox-GSK Summary
Summary
ATVBInChiantiARICNTR/NESDAMIGENFHSWGHSBLSAIARCDGINHSGAINADVANCERotterdamFUSION
TAG Summary
ENGAGE Summary
Ox-GSK Summary
Summary
0.63 0.79 1.00 1.26 0.50 0.63 0.79 1.00 1.26 1.58 2.00
Figure 3 Forest and regional plots of significant associations for smoking behavior. (a–d) Shown are plots for smoking initiation (a,b) and smoking cessation (c,d) from meta-analyses of the TAG, Ox-GSK and ENGAGE consortia. Regional association plots show SNPs plotted by position on the chromosome against −log10 P value with each smoking phenotype. Estimated recombination rates (from HapMap-CEU) are plotted in light blue to reflect the local LD structure on a secondary y axis. The SNPs surrounding the most significant SNP (red diamond) are color coded to reflect their LD with this SNP (using pairwise r 2 values from HapMap CEU): blue, r 2 ≥ 0.8–1.0; green, 0.5–0.8; orange, 0.2–0.5; gray, <0.2. The gray bars at the bottom of the plot represent the relative size and location of genes in the region.
© 2
010
Nat
ure
Am
eric
a, In
c. A
ll ri
gh
ts r
eser
ved
.

Nature GeNetics VOLUME 42 | NUMBER 5 | MAY 2010 445
l e t t e r s
most of the loci identified in this study reside in or near known can-didate genes involved in the neurobiology of smoking, which dif-fers from the results of previous GWAS, in which variants identified have generally not been in regions previously suspected. The lack of findings for smoking initiation and cessation is noteworthy in light of considerable genetic epidemiological data suggesting a role for genetic factors in different aspects of smoking behavior (for exam-ple, heritability estimates are often >0.50)1, and we note that the loci identified do not of themselves account for more than small fractions of the phenotypic heritability. Additional smoking behavior loci may be identified with improved genomic coverage and analysis of gene-gene and gene-environment interaction, copy number variation or epigenetic effects. We acknowledge that imprecision in phenotypic assessment and differences across studies could have added noise suf-ficient to blur all but the most prominent genetic signals. Smoking behavior obtained by questionnaires may be subject to phenotypic misclassification. Recent work24 has shown that genetic variation at 15q25.1 influences cotinine (the main and long-lived metabolite of nicotine) measurements more strongly than it influences CPD values obtained by means of a questionnaire. Future smoking GWAS that use biomarkers or longitudinal assessments that refine phenotypic assessments by incorporating time to quitting or relapsing to smoking may be required. In addition, inclusion of multiple ethnic groups will enhance the investigation of the genetics of smoking.
Notably, the five significant loci identified in these meta-analyses were each associated with only one specific smoking phenotype. Our findings suggests that separate genetic loci contribute modestly to phenotypic variability in each aspect of smoking behavior, which, in turn, may have implications for the way in which smoking cessation therapies and tobacco control efforts are designed and targeted.
METhOdSMethods and any associated references are available in the online version of the paper at http://www.nature.com/naturegenetics/.
Note: Supplementary information is available on the Nature Genetics website.
ACknowledGmenTsThis work was funded by the University of North Carolina Lineberger Comprehensive Cancer Center University Cancer Research Fund Award and by US National Cancer Institute K07 CA118412 to H.F. Statistical analyses were carried out on the Genetic Cluster Computer (see URLs), which is supported by the Netherlands Scientific Organization (NWO 480-05-003). Acknowledgments for studies included in TAG are listed in the Supplementary Note.
AUTHoR ConTRIBUTIonsTAG: study conception, design, management: H.F., P.F.S., Y.K., J. Dackor; TAG Statistical Working Group: D.-Y.L., P.K., J.P.A.I., D.P., H.F., Y.K., J. Dackor, S.P.F., N.F., E.H.L., J.D.M., J.M.V., D.I.B., D.L., B.M.E., E.L.T., B. McKnight, P.F.S., D. Absher; TAG Phenotype Working Group: C. Lerman, J.K., H.H.M., L.M.T., J.A.-M., E.H.L., J.E.R., M.D.L., J.M.V., H.F., Y.K., J. Dackor, S.P.F., P.F.S., E.L.T.; data analysis: Y.K., D.M.A., F.G., E.H.L., J.D.M., J.M.V., A.U.J., L. Bernardinelli, S.R.P., S.-J.H., B.M.E., C. Ladenvall, J.R.B.P., T.T., E.L.T., J.C.B., G.L., S.W.; TAG Manuscript Writing Group: H.F., Y.K., J. Dackor, P.F.S., C. Lerman, M.D.L., J.K., J.A.-M., P.K. All authors reviewed and approved the final version of the manuscript. The corresponding authors had access to the full data set of summary results contributed by each study.ARIC: study conception, design, management: E.B.; phenotype collection, data management: N.F.; sample processing and genotyping: N.F.; data analysis: Y.K., N.F.
Atherosclerosis Thrombosis and Vascular Biology Italian Study Group: study conception, design, management: L. Bernardinelli, P.M.M., P.A.M., D. Ardissino; phenotype collection, data management: F.M., L. Bernandinelli; data analysis: L. Bernandinelli.ADVANCE: study conception, design, management: S.P.F., D. Absher, T.Q., C.I., T.L.A., J.W.K.; phenotype collection, data management: S.P.F., T.Q., C.I., T.L.A., J.W.K.; sample processing and genotyping: D. Absher, T.Q.; data analysis: S.P.F., D. Absher, T.L.A., J.W.K.
Baltimore Longitudinal Study of Aging: study conception, design, management: L. Ferrucci; phenotype collection, data management: L. Ferrucci; data analysis: T.T.CHS: study conception, design, management: B.M.P., J.C.B., C.D.F.; phenotype collection, data management: B.M.P.; sample processing and genotyping: T.H., K.D.T.; data analysis: B.M.P., E.L.T., J.C.B., B. McKnight.DGI: study conception, design, management: L.G.; phenotype collection, data management: P.A.; data analysis: P.A., C. Ladenvall.FUSION: study conception, design, management: K.L.M., M.B.; phenotype collection, data management: H.M.S., J.T.; data analysis: H.M.S., A.U.J.
Framingham Heart Study: study conception, design, management: R.S.V., E.J.B., D.L.; phenotype collection, data management: S.R.P., R.S.V., S.-J.H., E.J.B., D.L.; data analysis: S.R.P., S.-J.H.GAIN: study conception, design, management: D.F.L., P.V.G.; phenotype collection, data management: A.R.S., D.F.L., J. Duan, J.S., P.V.G.; sample processing and genotyping: J. Duan, P.V.G.; data analysis: A.R.S., D.F.L., J. Duan, J.S., P.V.G.IARC/ARCAGE/Central European GWAS: phenotype collection, data management: D.Z., N.S.-D., J.L., P.R., E.F., D.M., V.B., L. Foretova, V.J., S. Benhamou, P.L., I.H., L.R., K.K., A.A., X.C., T.V.M., L. Barzan, C.C., R.L., D.I. Conway, A.Z., C.M.H., P.B.; sample processing and genotyping: J.D.M., M.L., P.B.; data analysis: E.H.L., J.D.M.InCHIANTI: study conception, design, management: T.M.F., J.M.G., S. Bandinelli; phenotype collection, data management: Y.M.; data analysis: J.R.B.P.MIGEN: study conception, design, management: R.E., V.S., O.M., C.J.O., D. Altshuler; phenotype collection, data management: G.L., S.M.S., R.E., V.S., B.F.V., O.M., S.K., C.J.O.; sample processing and genotyping: S.K., D. Altshuler; data analysis: G.L., B.F.V., D. AltshulerNESDA: study conception, design, management: B.W.P., J.H.S.; phenotype collection, data management: B.W.P., J.H.S., N.V.; sample processing and genotyping: B.W.P., J.H.S.; data analysis: N.V.NTR: study conception, design, management: D.I.B., G.W., E.J.C.d.G.; phenotype collection, data management: D.I.B., G.W., E.J.C.d.G., J.M.V.; sample processing and genotyping: D.I.B., G.W., E.J.C.d.G.; data analysis: J.M.V.NHS: phenotype collection, data management: S.E.H., D.J.H., P.K., F.G.; sample processing and genotyping: S.J.C., S.E.H., D.J.H., P.K.; data analysis: S.J.C., F.G., P.K.Rotterdam: study conception, design, management: A.H.; phenotype collection, data management: H.T., A.G.U.; sample processing and genotyping: H.T., A.G.U.; data analysis: H.T., A.G.U., S.W., C.M.v.D.WGHS: study conception, design, management: B.M.E., G.P., D.I. Chasman, P.M.R.; phenotype collection, data management: B.M.E., G.P., D.I. Chasman, P.M.R.; sample processing and genotyping: G.P., D.I. Chasman; data analysis: B.M.E., G.P., D.I. Chasman.
ComPeTInG FInAnCIAl InTeResTsThe authors declare no competing financial interests.
Published online at http://www.nature.com/naturegenetics/. Reprints and permissions information is available online at http://npg.nature.com/reprintsandpermissions/.
1. Rose, R.J., Broms, U., Korhonen, T., Dick, D.M. & Kaprio, J. Genetics of Smoking Behavior. in Handbook of Behavior Genetics, 1 (ed. Kim, Y.-K.) 411–432 (Springer, New York, 2009).
2. Li, M.D. Identifying susceptibility loci for nicotine dependence: 2008 update based on recent genome-wide linkage analyses. Hum. Genet. 123, 119–131 (2008).
3. Thorgeirsson, T.E. et al. A variant associated with nicotine dependence, lung cancer and peripheral arterial disease. Nature 452, 638–642 (2008).
4. Fiore, M.C., Smith, S.S., Jorenby, D.E. & Baker, T.B. The effectiveness of the nicotine patch for smoking cessation. A meta-analysis. J. Am. Med. Assoc. 271, 1940–1947 (1994).
5. Li, Y., Willer, C., Sanna, S. & Abecasis, G. Genotype imputation. Annu. Rev. Genomics Hum. Genet. 10, 387–406 (2009).
6. de Bakker, P.I. et al. Practical aspects of imputation-driven meta-analysis of genome-wide association studies. Hum. Mol. Genet. 17, R122–R128 (2008).
7. Kraft, P., Zeggini, E. & Ioannidis, J.P.A. Replication in genome-wide association studies. Stat. Sci. published online, doi:10.1214/09-STS290 (2010).
8. Pereira, T.V., Patsopoulos, N.A., Salanti, G. & Ioannidis, J.P. Discovery properties of genome-wide association signals from cumulatively combined data sets. Am. J. Epidemiol. 170, 1197–1206 (2009).
9. Ioannidis, J.P., Patsopoulos, N.A. & Evangelou, E. Heterogeneity in meta-analyses of genome-wide association investigations. PLoS One 2, e841 (2007).
10. Pe’er, I. et al. Evaluating and improving power in whole-genome association studies using fixed marker sets. Nat. Genet. 38, 663–667 (2006).
11. Pe’er, I., Yelensky, R., Altshuler, D. & Daly, M.J. Estimation of the multiple testing burden for genomewide association studies of nearly all common variants. Genet. Epidemiol. 32, 381–385 (2008).
12. Thorgeirsson, T. et al. Sequence variants at CHRNB3-CHRNA6 and CYP2A6 affect smoking behavior. Nat. Genet. 42, 448–453 (2010).
© 2
010
Nat
ure
Am
eric
a, In
c. A
ll ri
gh
ts r
eser
ved
.

446 VOLUME 42 | NUMBER 5 | MAY 2010 Nature GeNetics
l e t t e r s
13. Liu, J. et al. Meta-analysis and imputation refines the association of 15q25 with smoking quantity. Nat. Genet. 42, 436–440 (2010).
14. Saccone, N.L. et al. Multiple distinct risk loci for nicotine dependence identified by dense coverage of the complete family of nicotinic receptor subunit (CHRN) genes. Am. J. Med. Genet. B. Neuropsychiatr. Genet. 150B, 453–466 (2009).
15. Nakajima, M. et al. Role of human cytochrome P4502A6 in C-oxidation of nicotine. Drug Metab. Dispos. 24, 1212–1217 (1996).
16. Mwenifumbo, J.C. & Tyndale, R.F. Molecular genetics of nicotine metabolism. Handb. Exp. Pharmacol. 192, 235–259 (2009).
17. Ray, R., Tyndale, R.F. & Lerman, C. Nicotine dependence pharmacogenetics: role of genetic variation in nicotine-metabolizing enzymes. J. Neurogenet. 23, 252–261 (2009).
18. Zhang, L.I. & Poo, M.M. Electrical activity and development of neural circuits. Nat. Neurosci. 4 Suppl, 1207–1214 (2001).
19. Levin, E.D., McClernon, F.J. & Rezvani, A.H. Nicotinic effects on cognitive function: behavioral characterization, pharmacological specification, and anatomic localization. Psychopharmacology (Berl.) 184, 523–539 (2006).
20. Gratacòs, M. et al. Brain-derived neurotrophic factor Val66Met and psychiatric disorders: meta-analysis of case-control studies confirm association to substance-related disorders, eating disorders, and schizophrenia. Biol. Psychiatry 61, 911–922 (2007).
21. Thorleifsson, G. et al. Genome-wide association yields new sequence variants at seven loci that associate with measures of obesity. Nat. Genet. 41, 18–24 (2009).
22. Zabetian, C.P. et al. A quantitative-trait analysis of human plasma-dopamine beta-hydroxylase activity: evidence for a major functional polymorphism at the DBH locus. Am. J. Hum. Genet. 68, 515–522 (2001).
23. Hindorff, L.A. et al. Potential etiologic and functional implications of genome-wide association loci for human diseases and traits. Proc. Natl. Acad. Sci. USA 106, 9362–9367 (2009).
24. Keskitalo, K. et al. Association of serum cotinine level with a cluster of three nicotinic acetylcholine receptor genes (CHRNA3/CHRNA5/CHRNB4) on chromosome 15. Hum. Mol. Genet. 18, 4007–4012 (2009).
Helena Furberg1,2, YunJung kim1, Jennifer dackor1, eric Boerwinkle3, nora Franceschini4, diego Ardissino5, luisa Bernardinelli6,7, Pier m mannucci8, Francesco mauri9, Piera A merlini9, devin Absher10, Themistocles l Assimes11, stephen P Fortmann12, Carlos Iribarren13, Joshua w knowles11, Thomas Quertermous11, luigi Ferrucci14, Toshiko Tanaka15, Joshua C Bis16,17, Curt d Furberg18, Talin Haritunians19, Barbara mcknight16,20, Bruce m Psaty16,17,21,22, kent d Taylor19, evan l Thacker16,23, Peter Almgren24, leif Groop24, Claes ladenvall24, michael Boehnke25, Anne U Jackson25, karen l mohlke1,2, Heather m stringham25, Jaakko Tuomilehto26–28, emelia J Benjamin29,30, shih-Jen Hwang31, daniel levy32, sarah Rosner Preis31, Ramachandran s Vasan29,32, Jubao duan33, Pablo V Gejman33, douglas F levinson34, Alan R sanders33, Jianxin shi35, esther H lips36, James d mckay36, Antonio Agudo37, luigi Barzan38, Vladimir Bencko39, simone Benhamou40,41, Xavier Castellsagué37, Cristina Canova42, david I Conway43, eleonora Fabianova44, lenka Foretova45, Vladimir Janout46, Claire m Healy47, Ivana Holcátová39, kristina kjaerheim48, Pagona lagiou49, Jolanta lissowska50, Ray lowry51, Tatiana V macfarlane52, dana mates53, lorenzo Richiardi54, Peter Rudnai55, neonilia szeszenia-dabrowska56, david Zaridze57, Ariana Znaor58, mark lathrop59,60, Paul Brennan36, stefania Bandinelli61, Timothy m Frayling62, Jack m Guralnik63, Yuri milaneschi64, John R B Perry62, david Altshuler65–70, Roberto elosua71, sek kathiresan65,68,72, Gavin lucas71, olle melander73, Christopher J o’donnell74, Veikko salomaa75, stephen m schwartz16, Benjamin F Voight76, Brenda w Penninx77,78, Johannes H smit77,78, nicole Vogelzangs77,78, dorret I Boomsma79, eco J C de Geus79, Jacqueline m Vink79, Gonneke willemsen79, stephen J Chanock80, Fangyi Gu81, susan e Hankinson82, david J Hunter81, Albert Hofman83, Henning Tiemeier83,84, Andre G Uitterlinden83,85, Cornelia m van duijn83,86, stefan walter83,87, daniel I Chasman88, Brendan m everett88,89, Guillaume Paré88, Paul m Ridker88,89, ming d li90, Hermine H maes91,92, Janet Audrain-mcGovern93, danielle Posthuma94,95, laura m Thornton96, Caryn lerman93,97, Jaakko kaprio26,75,98, Jed e Rose99, John P A Ioannidis100–102, Peter kraft81, dan-Yu lin103 & Patrick F sullivan1,2
1Department of Genetics, University of North Carolina, Chapel Hill, North Carolina, USA. 2University of North Carolina Lineberger Comprehensive Cancer Center, University of North Carolina, Chapel Hill, North Carolina, USA. 3Human Genetics Center and Institute for Molecular Medicine, University of Texas Health Science Center, Houston, Texas, USA. 4Department of Epidemiology, University of North Carolina, Chapel Hill, North Carolina, USA. 5Division of Cardiology, Azienda Ospedaliero-Universitaria di Parma, Parma, Italy. 6Statistical Laboratory, Centre for Mathematical Sciences, University of Cambridge, Cambridge, UK. 7Department of Applied Health Sciences, University of Pavia, Pavia, Italy. 8Department of Internal Medicine and Medical Specialties, Fondazione Istituto di Ricovero e Cura a Carattere Scientifico, Ospedale Maggiore, Mangiagalli e Regina Elena, University of Milan, Milan, Italy. 9Department of Cardiology, Azienda Ospedaliera Niguarda Ca’ Granda, Milan, Italy. 10HudsonAlpha Institute for Biotechnology, Huntsville, Alabama, USA. 11Cardiovascular Medicine, Stanford University, Stanford, California, USA. 12Stanford Prevention Research Center, Stanford University, Stanford, California, USA. 13Kaiser Permanente Northern California Division of Research, Oakland, California, USA. 14National Institute on Aging, Baltimore, Maryland, USA. 15Medstart Research Institute, National Institute on Aging, Baltimore, Maryland, USA. 16Cardiovascular Health Research Unit, University of Washington, Seattle, Washington, USA. 17Department of Medicine, University of Washington, Seattle, Washington, USA. 18Division of Public Health Sciences, Wake Forest University Health Sciences, Winston-Salem, North Carolina, USA. 19Medical Genetics Institute, Cedars-Sinai Medical Center, Los Angeles, California, USA. 20Department of Biostatistics, University of Washington, Seattle, Washington, USA. 21Department of Epidemiology and Health Services, University of Washington, Seattle, Washington, USA. 22Group Health Research Institute, Seattle, Washington, USA. 23Department of Epidemiology, University of Washington, Seattle, Washington, USA. 24Department of Clinical Sciences, Diabetes and Endocrinology Unit, Lund University, Malmö, Sweden. 25Department of Biostatistics, School of Public Health, University of Michigan, Ann Arbor, Michigan, USA. 26Hjelt Institute, Department of Public Health, University of Helsinki, Helsinki, Finland. 27Diabetes Prevention Unit, National Institute for Health and Welfare, Helsinki, Finland. 28Finland South Ostrobothnia Central Hospital, Seinäjoki, Finland. 29Boston University School of Medicine, Boston, Massachusetts, USA. 30Boston University School of Public Health, Boston, Massachusetts, USA. 31Center for Population Studies, National Heart, Lung, and Blood Institute, Bethesda, Maryland, USA. 32Department of Medicine, Sections of Preventive Medicine and Cardiology, Boston University School of Medicine, Boston, Massachusetts, USA. 33Center for Psychiatric Genetics, NorthShore University HealthSystem Research Institute, Evanston, Illinois, USA. 34Department of Psychiatry and Behavioral Sciences, Stanford University, Stanford, California, USA. 35Biostatistics Branch, Division of Cancer Epidemiology and Genetics, National Cancer Institute, Bethesda, Maryland, USA. 36International Agency for Research on Cancer (IARC), Lyon, France. 37Institut Català d’Oncologia, Barcelona, Spain. 38General Hospital, Pordenone, Italy. 39Institute of Hygiene and Epidemiology,
© 2
010
Nat
ure
Am
eric
a, In
c. A
ll ri
gh
ts r
eser
ved
.

Nature GeNetics VOLUME 42 | NUMBER 5 | MAY 2010 447
l e t t e r s
First Faculty of Medicine, Charles University, Prague, Czech Republic. 40Institut National de la santé et de la Recherche Medicalé (INSERM) U794, Paris, France. 41Institut Gustave Roussy, Villejuif, France. 42Department of Environmental Medicine and Public Health, University of Padua, Padua, Italy. 43University of Glasgow Medical Faculty Dental School, Glasgow, UK. 44Specialized Institute of Hygiene and Epidemiology, Banska Bystrica, Slovakia. 45Department of Cancer Epidemiology and Genetics, Masaryk Memorial Cancer Institute, Brno, Czech Republic. 46Palacky University, Olomouc, Czech Republic. 47Trinity College School of Dental Science, Dublin, Ireland. 48Cancer Registry of Norway, Oslo, Norway. 49University of Athens School of Medicine, Athens, Greece. 50Department of Cancer Epidemiology and Prevention, Maria Sklodowska-Curie Cancer Center and Institute of Oncology, Warsaw, Poland. 51University of Newcastle Dental School, Newcastle, UK. 52University of Aberdeen School of Medicine, Aberdeen, UK. 53Institute of Public Health, Bucharest, Romania. 54Center for Experimental Research and Medical Studies, University of Turin, Turin, Italy. 55National Institute of Environmental Health, Budapest, Hungary. 56Department of Epidemiology, Institute of Occupational Medicine, Lodz, Poland. 57Institute of Carcinogenesis, Cancer Research Centre, Moscow, Russia. 58Croatian National Cancer Registry, Zagreb, Croatia. 59Centre National de Genotypage, Institut Genomique, Comissariat à l’énergie Atomique, Evry, France. 60Fondation Jean Dausset-Centre d‘Étude du Polymorphisme Humain (CEPH), Paris, France. 61Geriatric Unit, Azienda Sanitaria di Firenze, Florence, Italy. 62Genetics of Complex Traits, Peninsula Medical School, The University of Exeter, Exeter, UK. 63Laboratory of Epidemiology, Demography and Biometry, National Institute on Aging, Bethesda, Maryland, USA. 64Tuscany Health Regional Agency, Florence, Italy. 65Broad Institute of Harvard and Massachusetts Institute of Technology, Cambridge, Massachusetts, USA. 66Department of Molecular Biology, Massachusetts General Hospital, Boston, Massachusetts, USA. 67Diabetes Unit, Massachusetts General Hospital, Boston, Massachusetts, USA. 68Center for Human Genetics Research, Massachusetts General Hospital, Boston, Massachusetts, USA. 69Department of Genetics, Harvard Medical School, Boston, Massachusetts, USA. 70Department of Medicine, Harvard Medical School, Boston, Massachusetts, USA. 71Cardiovascular Epidemiology and Genetics, Institut Municipal d’Investigacio Medica, Barcelona, Spain. 72Harvard Medical School, Boston, Massachusetts, USA. 73Department of Clinical Sciences, Hypertension and Cardiovascular Diseases, University Hospital Malmö, Lund University, Malmö, Sweden. 74National Heart, Lung, and Blood Institute’s Framingham Heart Study, Framingham, Massachusetts, USA. 75National Institute for Health and Welfare (THL), Helsinki, Finland. 76Program in Medical and Population Genetics, Broad Institute of Harvard and Massachusetts Institute of Technology, Cambridge, Massachusetts, USA. 77EMGO Institute, Vrije Universiteit (VU) Medical Center, Amsterdam, The Netherlands. 78Department of Psychiatry, VU University Medical Center, Amsterdam, The Netherlands. 79Biological Psychology, VU University Amsterdam, Amsterdam, The Netherlands. 80Division of Cancer Epidemiology and Genetics, National Cancer Institute, Bethesda, Maryland, USA. 81Program in Molecular and Genetic Epidemiology, Department of Epidemiology, Harvard University, Boston, Massachusetts, USA. 82Channing Laboratory, Department of Medicine, Brigham and Women’s Hospital and Harvard Medical School, Boston, Massachusetts, USA. 83Department of Epidemiology, Erasmus Medical Center, Member of the Netherlands Consortium on Healthy Aging, Rotterdam, The Netherlands. 84Department of Child and Adolescent Psychiatry, Erasmus Medical Center, Rotterdam, The Netherlands. 85Department of Internal Medicine, Erasmus Medical Center, Rotterdam, The Netherlands. 86Centre for Medical Systems Biology, Erasmus Medical Center, Rotterdam, The Netherlands. 87Department of Public Health, Erasmus Medical Center, Rotterdam, The Netherlands. 88Division of Preventive Medicine, Department of Medicine, Brigham and Women’s Hospital, Harvard Medical School, Boston, Massachusetts, USA. 89Division of Cardiovascular Medicine, Department of Medicine, Brigham and Women’s Hospital, Harvard Medical School, Boston, Massachusetts, USA. 90Department of Psychiatry and Neurobehavioural Sciences, University of Virginia, Charlottesville, Virginia, USA. 91Virginia Institute for Psychiatric and Behavioral Genetics, Virginia Commonwealth University, Richmond, Virginia, USA. 92Massey Cancer Center, Virginia Commonwealth University, Richmond, Virginia, USA. 93Department of Psychiatry, University of Pennsylvania, Philadelphia, Pennsylvania, USA. 94Department of Functional Genomics, VU Amsterdam, Amsterdam, The Netherlands. 95Department of Medical Genomics, VU University Medical Center Amsterdam, Amsterdam, The Netherlands. 96Department of Psychiatry, University of North Carolina, Chapel Hill, North Carolina, USA. 97Abramson Cancer Center, University of Pennsylvania, Philadelphia, Pennsylvania, USA. 98Institute for Molecular Medicine, University of Helsinki, Helsinki, Finland. 99Department of Psychiatry and Behavioral Sciences, Duke University Medical Center, Durham, North Carolina, USA. 100Department of Hygiene and Epidemiology, University of Ioannina School of Medicine, Ioannina, Greece. 101Tufts Clinical and Translational Science Institute, Tufts University School of Medicine, Boston, Massachusetts, USA. 102Center for Genetic Epidemiology and Modeling, Institute for Clinical Research and Health Policy Studies, Tufts Medical Center, Boston, Massachusetts, USA. 103Department of Biostatistics, University of North Carolina, Chapel Hill, North Carolina, USA. Correspondence should be addressed to H.F. ([email protected]) or P.F.S. ([email protected]).
© 2
010
Nat
ure
Am
eric
a, In
c. A
ll ri
gh
ts r
eser
ved
.

Nature GeNetics doi:10.1038/ng.571
ONLINE METhOdSPhenotype harmonization and selection. We spent substantial effort harmo-nizing the smoking phenotypes across studies. Briefly, first, we created the Phenotype Working Group (PWG) to address these crucial issues. Second, we obtained English versions of the exact smoking-related questions, responses and summary data from each study. These were entered into a master database and examined for completeness, outliers and distributions of all smoking vari-ables. Third, we produced a list of candidate smoking phenotypes available from each study. Fourth, as has been recommended25, we calculated heritabilities and intercorrelations between the candidate smoking variables using data from the Swedish Twin Registry26,27 and the Finnish Twin Cohort Study28,29, two popula-tion-based twin registries containing extensive smoking data. Finally, the PWG integrated all these data to derive the operational phenotypes to be used in the meta-analyses.
The central criteria were that a candidate phenotype had to (i) be exactly or nearly exactly assessed in nearly all studies, (ii) have distributional proper-ties similar across studies and conducive to meta-analyses (for example, suf-ficiently prevalent to allow reasonable statistical power), (iii) have reasonable heritability so that genetic analysis was suitable and (iv) have face validity to senior researchers in the field.
These analyses yielded unexpected results. For example, the Fagerström Test for Nicotine Dependence is commonly used in the field, as either a continu-ous or dichotomized variable. However, item-level twin analyses showed it to be a composite measure of some items with high heritability (for example, CPD) but some items with heritability near zero and with important common environmental effects (unpublished data).
We examined three elements of smoking behavior: smoking initiation, smoking heaviness and smoking cessation. Smoking initiation was assessed in two ways: by contrasting individuals who reported having ever versus never smoked regularly, and age of smoking initiation.
Ever versus never regular smokers. Regular smokers were defined as those who reported having smoked ≥100 cigarettes during their lifetime and never regular smokers were defined as those who reported having smoked between 0 and 99 cigarettes during their lifetime. This definition is consistent with the Centers for Disease Control classification of “ever smoker”30.
Age of smoking initiation. Age of smoking initiation was the reported age the participant started smoking cigarettes. Some studies collected the age at which the participant first tried smoking, whereas others collected the age the participant began smoking regularly. As both variables (age first tried and age began smoking regularly) were available in the Swedish Twin Registry, we calculated the univariate heritabilities for each variable and the genetic correlation between them. We studied only females due to the confounding effects of prevalent smokeless tobacco (‘snus’) use in Swedish males31. The heritabilities for the two variables were similar and the genetic correlation was 0.97, which suggested a great deal of overlap in the genetic contributors to each trait and supported the idea of using either value in a general assessment of age of smoking initiation in the meta-analysis.
Cigarettes per day. Smoking quantity was assessed as the CPD value. Some studies collected the average CPD, whereas other studies collected the maximum CPD. Longitudinal data from the Finnish Twin Cohort Study revealed a high correlation (>0.71) between these variables over time and supported the idea of using either value in a general assessment of CPD in the meta-analysis.
Smoking cessation. Smoking cessation contrasted former versus current smokers, where current smokers reported that they smoked at the time of the interview and former smokers had quit smoking at least 1 year before the inter-view. As relapse to smoking is highest within the first year of quitting smoking, smokers who had quit smoking for less than 1 year at interview were excluded from the analysis. Descriptive characteristics of the 16 studies participating in the TAG Consortium are presented in Table 1.
Genotyping and imputation. The 16 TAG studies performed their own geno-typing, quality control and imputation (Supplementary Tables 2 and 3). Studies ranged in size from n = 585 to n = 22,037 and were genotyped on six different
GWAS platforms. Each study applied its own set of quality control filters, which were comparable among studies. Each study excluded SNPs with a call rate <89%, <1% minor allele frequency or departure from Hardy-Weinberg equilibrium. Subjects were excluded for non-European ancestry using PLINK multidimensional scaling32, STRUCTURE33 or EigenSoft principal component analysis34. In addition, subjects were excluded for <90% call rate, excess auto-somal heterozygosity, mismatch between reported and genetically determined sex or first- or second-degree relatedness. Genotype imputation5 was used to harmonize genotyping across different studies, as well as to infer genotypes for SNPs that were not genotyped directly on the platforms but that were genotyped on the HapMap-2 CEU samples32. SNP imputation was performed using either MACH35, IMPUTE36 or BIMBAM10 v0.9937 and resulted in a common set of ~2.5 million SNPs after removal of SNPs with minor allele frequency <1% or poor imputation performance (Supplementary Table 3). Imputed allele dosages for each SNP (that is, the number of copies of the minor allele) were tested for association with each smoking phenotype using an additive model.
Study-specific GWAS analysis. Each study conducted uniform cross- sectional analyses for each smoking phenotype using an additive genetic model. Linear regression was used for quantitative traits (CPD and age of smoking initiation), and logistic regression was used for discrete traits (ever versus never smokers and former versus current smokers). Age of smoking initiation was transformed using the natural logarithm owing to heavy tails and non- normality. The dependent variables were the smoking phenotypes and the independent variables were the imputed allele dosage for a SNP plus an indica-tor variable for whether a subject was classified as a case in the primary study. If the primary study was case-control in design and the phenotype being studied was known to be associated with smoking, we adjusted for case status to reduce potential confounding38. Individual study results were corrected for residual inflation of the test statistic using genomic control39.
Due to the known differences in the prevalences of the smoking phenotypes between the two sexes40, all TAG Consortium analyses were run separately for males and females. We then tested whether associations between ~2.5 million SNPs and each smoking phenotype differed by sex by meta-analyzing males and females separately and performing a t-test of their parameter estimates for each SNP using a significance threshold of P < 5 × 10⁻⁸ (ref. 41).
Meta-analysis of GWAS results. We performed fixed-effect meta-analysis for each smoking phenotype by computing pooled inverse-variance–weighted β coefficients, standard errors and z-scores for each SNP6. Fixed effects analyses were chosen because they are regarded as the most efficient method for discovery in the GWAS setting7,8. Meta-analyses were performed using METAL (see URLs). Heterogeneity across studies was investigated using the I2 statistic9. We used a significance threshold of P < 5 × 10⁻⁸ (refs. 10,11).
In silico follow-up of top regions. To validate potential associations identified in the TAG Consortium analyses, we partnered with two other smoking GWAS consortia and conducted a reciprocal exchange of the 15 most significant genetic regions for each smoking phenotype in each study12,13. Regions were defined by SNPs with P values <10−4 that clustered together (r2 > 0.5 and/or locations <50 kb apart). The ENGAGE Smoking GWAS Consortium consisted of 34,762 individuals and the Ox-GSK Smoking GWAS Consortium consisted of 34,226 individuals, making the final sample size across the three consortia n = 143,023. Studies that participated in multiple consortia were only repre-sented once in the final analyses.
URLs. Genetic Computing Cluster, http://www.geneticcluster.org/; METAL, http://www.sph.umich.edu/csg/abecasis/metal/.
25. Pomerleau, O.F. et al. Genetic research on complex behaviors: an examination of attempts to identify genes for smoking. Nicotine Tob. Res. 9, 883–901 (2007).
26. Lichtenstein, P. et al. The Swedish Twin Registry: a unique resource for clinical, epidemiological and genetic studies. J. Intern. Med. 252, 184–205 (2002).
27. Furberg, H., Lichtenstein, P., Pedersen, N.L., Bulik, C. & Sullivan, P.F. Cigarettes and oral snuff use in Sweden: prevalence and transitions. Addiction. 10, 1509–1515 (2006).
© 2
010
Nat
ure
Am
eric
a, In
c. A
ll ri
gh
ts r
eser
ved
.

Nature GeNeticsdoi:10.1038/ng.571
28. Kaprio, J., Pulkkinen, L. & Rose, R.J. Genetic and environmental factors in health-related behaviors: studies on Finnish twins and twin families. Twin Res. 5, 366–371 (2002).
29. Kaprio, J. & Koskenvuo, M. Genetic and environmental factors in complex diseases: the older Finnish Twin Cohort. Twin Res. 5, 358–365 (2002).
30. Centers for Disease Control and Prevention (CDC). Cigarette smoking among adults–United States, 2007. MMWR Morb. Mortal. Wkly. Rep. 57, 1221–1226 (2008); erratum 57, 1281 (2008).
31. Furberg, H., Lichtenstein, P., Pedersen, N.L., Bulik, C. & Sullivan, P.F. Cigarettes and oral snuff use in Sweden: Prevalence and transitions. Addiction 101, 1509–1515 (2006).
32. Frazer, K.A. et al. A second generation human haplotype map of over 3.1 million SNPs. Nature 449, 851–861 (2007).
33. Pritchard, J.K., Stephens, M. & Donnelly, P. Inference of population structure using multilocus genotype data. Genetics 155, 945–959 (2000).
34. Price, A.L. et al. Principal components analysis corrects for stratification in genome-wide association studies. Nat. Genet. 38, 904–909 (2006).
35. Li, Y., Ding, J. & Abecasis, G.R. MACH 1.0: rapid haplotype reconstruction and missing genotype inference. Am. J. Hum. Genet. s79, 2290 (2006).
36. Marchini, J., Howie, B., Myers, S., McVean, G. & Donnelly, P. A new multipoint method for genome-wide association studies by imputation of genotypes. Nat. Genet. 39, 906–913 (2007).
37. Servin, B. & Stephens, M. Imputation-based analysis of association studies: candidate regions and quantitative traits. PLoS Genet. 3, e114 (2007).
38. Lin, D.Y. & Zeng, D. Proper analysis of secondary phenotype data in case-control association studies. Genet. Epidemiol. 33, 256–265 (2009).
39. Devlin, B. & Roeder, K. Genomic control for association studies. Biometrics 55, 997–1004 (1999).
40. Centers for Disease Control and Prevention (CDC). Cigarette smoking among adults-United States, 2006. MMWR CDC Surveill. Summ. 56, 1157–1161 (2007).
41. Dudbridge, F. & Gusnanto, A. Estimation of significance thresholds for genomewide association scans. Genet. Epidemiol. 32, 227–234 (2008).
© 2
010
Nat
ure
Am
eric
a, In
c. A
ll ri
gh
ts r
eser
ved
.
Related Documents