A comprehensive radiation hybrid map of the bovine genome comprising 5593 loci Tomohito Itoh a,b,1 , Toshio Watanabe a,1 , Naoya Ihara a , Paola Mariani c , Craig W. Beattie d , Yoshikazu Sugimoto a , Akiko Takasuga a, T a Shirakawa Institute of Animal Genetics, Odakura, Nishigo, Nishi-shirakawa, Fukushima 961-8061, Japan b Livestock Improvement Association of Japan, Inc., Maebashi, Gunma 351-0121, Japan c FPTP–CERSA, Palazzo LITA, 5th Floor, Via F.lli Cervi 93, 20090 Segrate (MI), Italy d Department of Animal Biotechnology, University of Nevada, Reno, NV 89557, USA Received 30 September 2004; accepted 29 December 2004 Abstract A bovine whole genome 7000-rad radiation hybrid (RH) panel, SUNbRH 7000-rad , was constructed to build a high-resolution RH map. The Shirakawa–USDA linkage map served as a scaffold to construct a framework map of 3216 microsatellites on which 2377 ESTs were ordered. The resulting RH map provided essentially complete coverage across the genome, with 1 cR 7000 corresponding to 114 kb, and a cattle–human comparative map of 1716 bovine genes and sequences annotated in the human genome, which covered 79 and 72% of the bovine and human genomes, respectively. We then integrated the bovine RH and comparative maps with BAC fingerprint information in http://www.bcgsc.ca/ lab/mapping/bovine to construct a detailed, BAC-based physical map covering a reported 40-cM quantitative trait locus region for intramuscular fat or bmarblingQ on BTA 4. In summary, the new, high-resolution SUNbRH 7000-rad , comparative, Shirakawa–USDA linkage, and BAC fingerprint maps provide a set of genomic tools for fine mapping regions of interest in cattle. D 2005 Elsevier Inc. All rights reserved. Keywords: Radiation hybrid map; Cattle; Microsatellite; EST; Comparative map Recent progress in identifying genes associated with disease susceptibility in human and mouse are due in large part to the success of whole genome sequencing [1,2]. In species whose genomes have not been sequenced, high- density, radiation hybrid (RH)-based, comparative maps provide a significant source of information for fine mapping and identification of genes potentially accounting for some or all of the genetic variation describing a phenotype as well as a scaffold on which to build future, sequence-based maps in a species of interest. Comparative maps have also been incorporated into a positional candidate cloning approach to identify several genes for heritable diseases [3] and economically important traits in livestock [4,5]. In cattle, a whole genome sequencing project has recently released a 3.3-fold coverage of the bovine genome (http:// www.hgsc.bcm.tmc.edu/projects/bovine/). The first whole genome radiation hybrid (WG-RH) map for cattle was constructed using a 5000-rad RH panel [6] and ordered 319 microsatellites and 768 ESTs at low resolution. The map revealed 105 chromosomal segments conserved between the bovine and the human genomes [7]. Later, a WG-RH 3000-rad framework map of 1148 micro- satellites and 90 genes incorporated virtually all the informative markers publicly available at that time [8]. These initial, low-resolution, bovine RH maps provided the basis for the first comparative maps between BTA X and HSA X [9], BTA 18 and HSA 16/19 [10], BTA 26/28 and HSA 10 [11], and BTA 15/29 and HSA 11 [12,13]. The initial maps clearly indicated that even conserved segments exhibited significant rearrangement between the bovine and 0888-7543/$ - see front matter D 2005 Elsevier Inc. All rights reserved. doi:10.1016/j.ygeno.2004.12.007 T Corresponding author. Fax: +81 248 25 5725. E-mail address: [email protected] (A. Takasuga). 1 These authors contributed equally to this work. Genomics 85 (2005) 413 – 424 www.elsevier.com/locate/ygeno

Welcome message from author
This document is posted to help you gain knowledge. Please leave a comment to let me know what you think about it! Share it to your friends and learn new things together.
Transcript
www.elsevier.com/locate/ygeno
Genomics 85 (20
A comprehensive radiation hybrid map of the bovine genome
comprising 5593 loci
Tomohito Itoha,b,1, Toshio Watanabea,1, Naoya Iharaa, Paola Marianic, Craig W. Beattied,
Yoshikazu Sugimotoa, Akiko Takasugaa,TaShirakawa Institute of Animal Genetics, Odakura, Nishigo, Nishi-shirakawa, Fukushima 961-8061, Japan
bLivestock Improvement Association of Japan, Inc., Maebashi, Gunma 351-0121, JapancFPTP–CERSA, Palazzo LITA, 5th Floor, Via F.lli Cervi 93, 20090 Segrate (MI), ItalydDepartment of Animal Biotechnology, University of Nevada, Reno, NV 89557, USA
Received 30 September 2004; accepted 29 December 2004
Abstract
A bovine whole genome 7000-rad radiation hybrid (RH) panel, SUNbRH7000-rad, was constructed to build a high-resolution RH map. The
Shirakawa–USDA linkage map served as a scaffold to construct a framework map of 3216 microsatellites on which 2377 ESTs were ordered.
The resulting RH map provided essentially complete coverage across the genome, with 1 cR7000 corresponding to 114 kb, and a cattle–human
comparative map of 1716 bovine genes and sequences annotated in the human genome, which covered 79 and 72% of the bovine and human
genomes, respectively. We then integrated the bovine RH and comparative maps with BAC fingerprint information in http://www.bcgsc.ca/
lab/mapping/bovine to construct a detailed, BAC-based physical map covering a reported 40-cM quantitative trait locus region for
intramuscular fat or bmarblingQ on BTA 4. In summary, the new, high-resolution SUNbRH7000-rad, comparative, Shirakawa–USDA linkage,
and BAC fingerprint maps provide a set of genomic tools for fine mapping regions of interest in cattle.
D 2005 Elsevier Inc. All rights reserved.
Keywords: Radiation hybrid map; Cattle; Microsatellite; EST; Comparative map
Recent progress in identifying genes associated with
disease susceptibility in human and mouse are due in large
part to the success of whole genome sequencing [1,2]. In
species whose genomes have not been sequenced, high-
density, radiation hybrid (RH)-based, comparative maps
provide a significant source of information for fine mapping
and identification of genes potentially accounting for some
or all of the genetic variation describing a phenotype as
well as a scaffold on which to build future, sequence-based
maps in a species of interest. Comparative maps have also
been incorporated into a positional candidate cloning
approach to identify several genes for heritable diseases
[3] and economically important traits in livestock [4,5]. In
0888-7543/$ - see front matter D 2005 Elsevier Inc. All rights reserved.
doi:10.1016/j.ygeno.2004.12.007
T Corresponding author. Fax: +81 248 25 5725.
E-mail address: [email protected] (A. Takasuga).1 These authors contributed equally to this work.
cattle, a whole genome sequencing project has recently
released a 3.3-fold coverage of the bovine genome (http://
www.hgsc.bcm.tmc.edu/projects/bovine/).
The first whole genome radiation hybrid (WG-RH) map
for cattle was constructed using a 5000-rad RH panel [6]
and ordered 319 microsatellites and 768 ESTs at low
resolution. The map revealed 105 chromosomal segments
conserved between the bovine and the human genomes [7].
Later, a WG-RH3000-rad framework map of 1148 micro-
satellites and 90 genes incorporated virtually all the
informative markers publicly available at that time [8].
These initial, low-resolution, bovine RH maps provided the
basis for the first comparative maps between BTA X and
HSA X [9], BTA 18 and HSA 16/19 [10], BTA 26/28 and
HSA 10 [11], and BTA 15/29 and HSA 11 [12,13]. The
initial maps clearly indicated that even conserved segments
exhibited significant rearrangement between the bovine and
05) 413–424
T. Itoh et al. / Genomics 85 (2005) 413–424414
the human genomes. The possibility of a significant number
of additional rearrangements within synteny groups between
the bovine and the human genomes, the limited number of
anchors tied to the available bovine genetic maps, and the
reliance on in silico comparative mapping to direct the
assignment of bovine coding sequences and identify synteny
breaks [7,13,14] prompted us to build a well-anchored,
high-resolution, bovine–human comparative map directly,
using bovine sequences, and subsequently compare marker
synteny and order with the human sequence map. A well-
anchored map ensures the quality of the RH map, provides
an opportunity for fine mapping through linkage, and acts as
a platform for positional candidate cloning. Our recently
reported, high-density Shirakawa–USDA linkage map of
~1800 new microsatellite markers, 3960 markers total [15],
provided a scaffold to construct the comprehensive RH and
comparative maps reported here.
The bovine, comprehensive RH map consists of 3216
framework microsatellites and 2377 ESTs ordered on the
7000-rad Shirakawa Institute–University of Nevada bovine
RH panel (SUNbRH7000-rad). The new RH map also
provided a sufficient number of anchors to construct a
BAC (http://www.bcgsc.ca/lab/mapping/bovine) contig map
spanning ~40 cM (357 cR7000) on BTA 4. Taken together,
the current maps will facilitate positional cloning and
provide an RH-BAC platform on which to assemble an
initial sequence of the bovine genome.
Results and discussion
Framework map
We used microsatellite markers mapped on the Shira-
kawa–USDA linkage map [15] (see also http://www.marc.
usda.gov/genome/) to construct a dense and robust frame-
work map. Microsatellites that amplified well on bovine
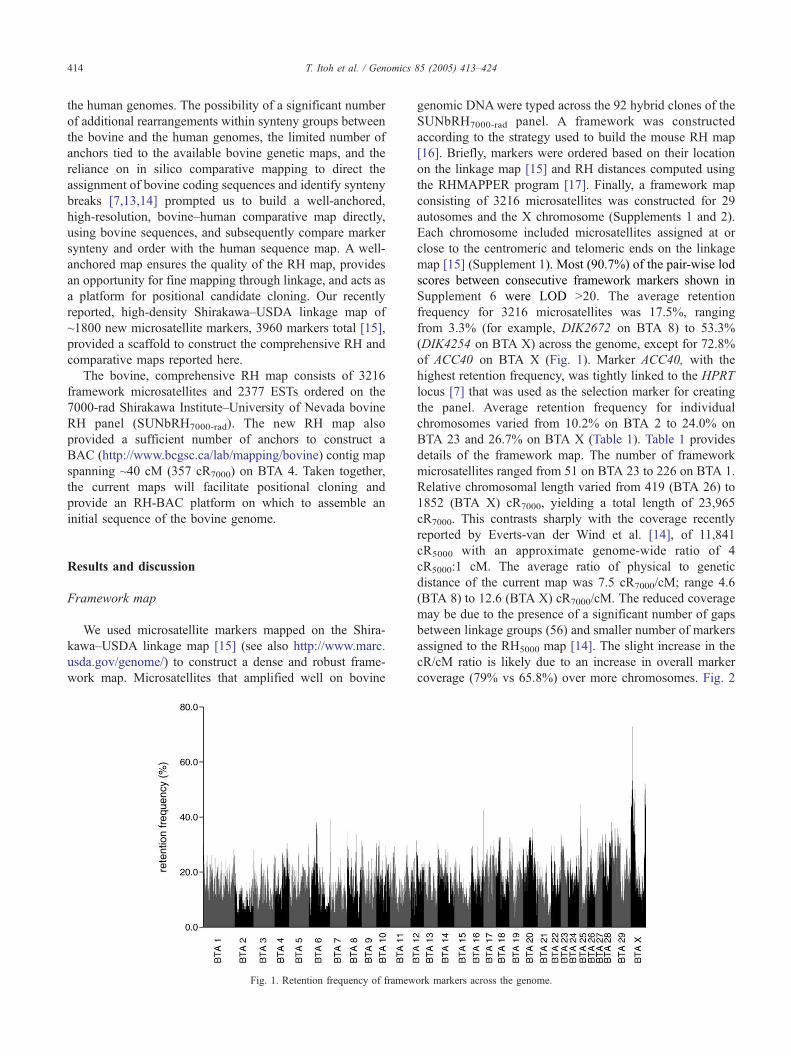
Fig. 1. Retention frequency of framew
genomic DNAwere typed across the 92 hybrid clones of the
SUNbRH7000-rad panel. A framework was constructed
according to the strategy used to build the mouse RH map
[16]. Briefly, markers were ordered based on their location
on the linkage map [15] and RH distances computed using
the RHMAPPER program [17]. Finally, a framework map
consisting of 3216 microsatellites was constructed for 29
autosomes and the X chromosome (Supplements 1 and 2).
Each chromosome included microsatellites assigned at or
close to the centromeric and telomeric ends on the linkage
map [15] (Supplement 1). Most (90.7%) of the pair-wise lod
scores between consecutive framework markers shown in
Supplement 6 were LOD N20. The average retention
frequency for 3216 microsatellites was 17.5%, ranging
from 3.3% (for example, DIK2672 on BTA 8) to 53.3%
(DIK4254 on BTA X) across the genome, except for 72.8%
of ACC40 on BTA X (Fig. 1). Marker ACC40, with the
highest retention frequency, was tightly linked to the HPRT
locus [7] that was used as the selection marker for creating
the panel. Average retention frequency for individual
chromosomes varied from 10.2% on BTA 2 to 24.0% on
BTA 23 and 26.7% on BTA X (Table 1). Table 1 provides
details of the framework map. The number of framework
microsatellites ranged from 51 on BTA 23 to 226 on BTA 1.
Relative chromosomal length varied from 419 (BTA 26) to
1852 (BTA X) cR7000, yielding a total length of 23,965
cR7000. This contrasts sharply with the coverage recently
reported by Everts-van der Wind et al. [14], of 11,841
cR5000 with an approximate genome-wide ratio of 4
cR5000:1 cM. The average ratio of physical to genetic
distance of the current map was 7.5 cR7000/cM; range 4.6
(BTA 8) to 12.6 (BTA X) cR7000/cM. The reduced coverage
may be due to the presence of a significant number of gaps
between linkage groups (56) and smaller number of markers
assigned to the RH5000 map [14]. The slight increase in the
cR/cM ratio is likely due to an increase in overall marker
coverage (79% vs 65.8%) over more chromosomes. Fig. 2
ork markers across the genome.
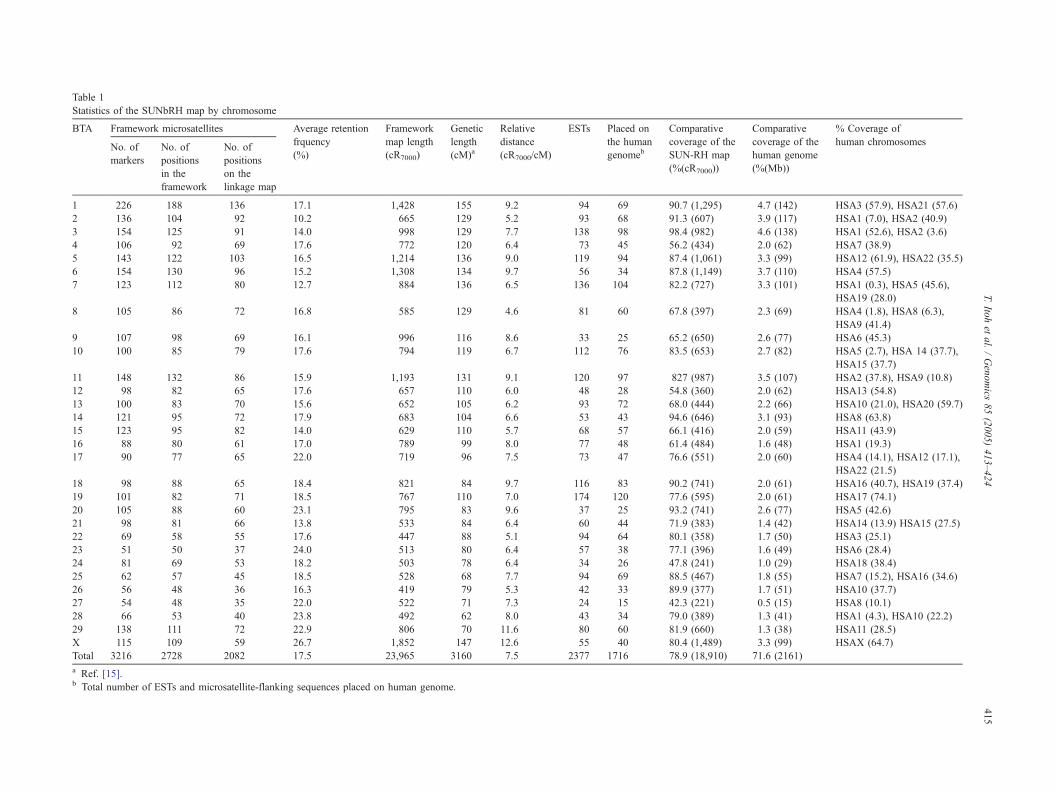
Table 1
Statistics of the SUNbRH map by chromosome
BTA Framework microsatellites Average retention
frquency
(%)
Framework
map length
(cR7000)
Genetic
length
(cM)a
Relative
distance
(cR7000/cM)
ESTs Placed on
the human
genomeb
Comparati
coverage o e
SUN-RH m
(%(cR7000)
Comparative
coverage of the
human genome
(%(Mb))
% Coverage of
human chromosomesNo. of
markers
No. of
positions
in the
framework
No. of
positions
on the
linkage map
1 226 188 136 17.1 1,428 155 9.2 94 69 90.7 (1,29 4.7 (142) HSA3 (57.9), HSA21 (57.6)
2 136 104 92 10.2 665 129 5.2 93 68 91.3 (607) 3.9 (117) HSA1 (7.0), HSA2 (40.9)
3 154 125 91 14.0 998 129 7.7 138 98 98.4 (982) 4.6 (138) HSA1 (52.6), HSA2 (3.6)
4 106 92 69 17.6 772 120 6.4 73 45 56.2 (434) 2.0 (62) HSA7 (38.9)
5 143 122 103 16.5 1,214 136 9.0 119 94 87.4 (1,06 3.3 (99) HSA12 (61.9), HSA22 (35.5)
6 154 130 96 15.2 1,308 134 9.7 56 34 87.8 (1,14 3.7 (110) HSA4 (57.5)
7 123 112 80 12.7 884 136 6.5 136 104 82.2 (727) 3.3 (101) HSA1 (0.3), HSA5 (45.6),
HSA19 (28.0)
8 105 86 72 16.8 585 129 4.6 81 60 67.8 (397) 2.3 (69) HSA4 (1.8), HSA8 (6.3),
HSA9 (41.4)
9 107 98 69 16.1 996 116 8.6 33 25 65.2 (650) 2.6 (77) HSA6 (45.3)
10 100 85 79 17.6 794 119 6.7 112 76 83.5 (653) 2.7 (82) HSA5 (2.7), HSA 14 (37.7),
HSA15 (37.7)
11 148 132 86 15.9 1,193 131 9.1 120 97 827 (987) 3.5 (107) HSA2 (37.8), HSA9 (10.8)
12 98 82 65 17.6 657 110 6.0 48 28 54.8 (360) 2.0 (62) HSA13 (54.8)
13 100 83 70 15.6 652 105 6.2 93 72 68.0 (444) 2.2 (66) HSA10 (21.0), HSA20 (59.7)
14 121 95 72 17.9 683 104 6.6 53 43 94.6 (646) 3.1 (93) HSA8 (63.8)
15 123 95 82 14.0 629 110 5.7 68 57 66.1 (416) 2.0 (59) HSA11 (43.9)
16 88 80 61 17.0 789 99 8.0 77 48 61.4 (484) 1.6 (48) HSA1 (19.3)
17 90 77 65 22.0 719 96 7.5 73 47 76.6 (551) 2.0 (60) HSA4 (14.1), HSA12 (17.1),
HSA22 (21.5)
18 98 88 65 18.4 821 84 9.7 116 83 90.2 (741) 2.0 (61) HSA16 (40.7), HSA19 (37.4)
19 101 82 71 18.5 767 110 7.0 174 120 77.6 (595) 2.0 (61) HSA17 (74.1)
20 105 88 60 23.1 795 83 9.6 37 25 93.2 (741) 2.6 (77) HSA5 (42.6)
21 98 81 66 13.8 533 84 6.4 60 44 71.9 (383) 1.4 (42) HSA14 (13.9) HSA15 (27.5)
22 69 58 55 17.6 447 88 5.1 94 64 80.1 (358) 1.7 (50) HSA3 (25.1)
23 51 50 37 24.0 513 80 6.4 57 38 77.1 (396) 1.6 (49) HSA6 (28.4)
24 81 69 53 18.2 503 78 6.4 34 26 47.8 (241) 1.0 (29) HSA18 (38.4)
25 62 57 45 18.5 528 68 7.7 94 69 88.5 (467) 1.8 (55) HSA7 (15.2), HSA16 (34.6)
26 56 48 36 16.3 419 79 5.3 42 33 89.9 (377) 1.7 (51) HSA10 (37.7)
27 54 48 35 22.0 522 71 7.3 24 15 42.3 (221) 0.5 (15) HSA8 (10.1)
28 66 53 40 23.8 492 62 8.0 43 34 79.0 (389) 1.3 (41) HSA1 (4.3), HSA10 (22.2)
29 138 111 72 22.9 806 70 11.6 80 60 81.9 (660) 1.3 (38) HSA11 (28.5)
X 115 109 59 26.7 1,852 147 12.6 55 40 80.4 (1,48 3.3 (99) HSAX (64.7)
Total 3216 2728 2082 17.5 23,965 3160 7.5 2377 1716 78.9 (18,9 71.6 (2161)
a Ref. [15].b Total number of ESTs and microsatellite-flanking sequences placed on human genome.
T.Ito
het
al./Genomics
85(2005)413–424
415
ve
f th
ap
)
5)
1)
9)
9)
10)
T. Itoh et al. / Genomics 85 (2005) 413–424416
T. Itoh et al. / Genomics 85 (2005) 413–424 417
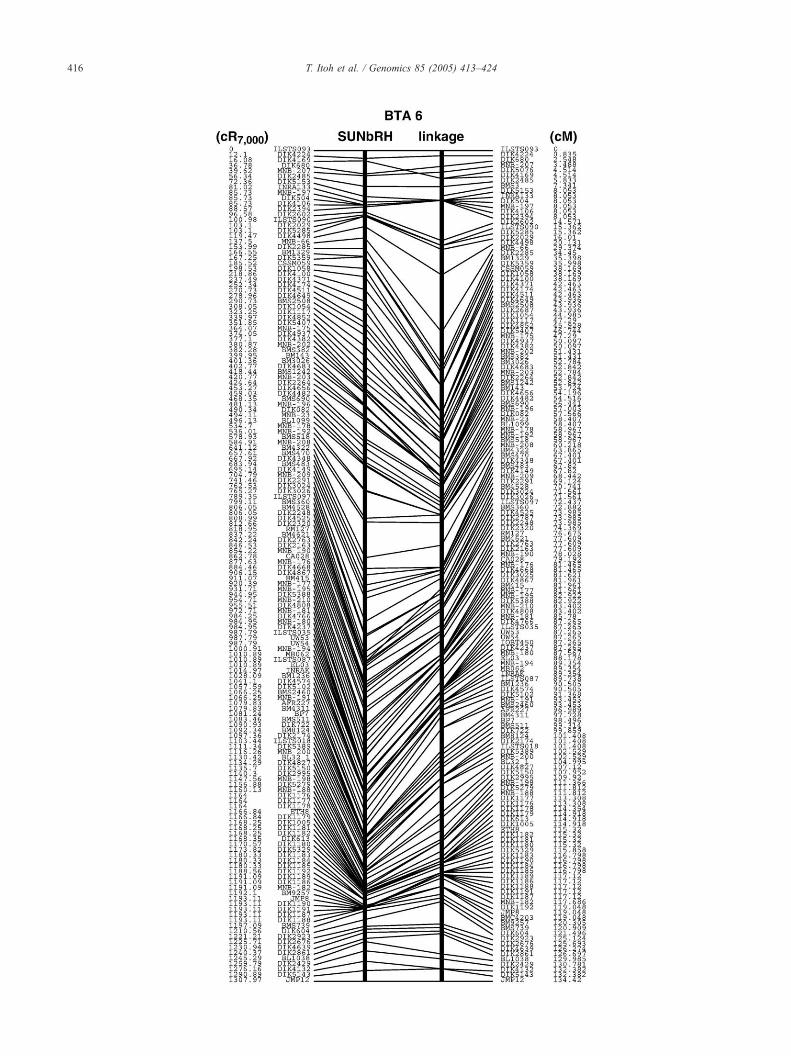
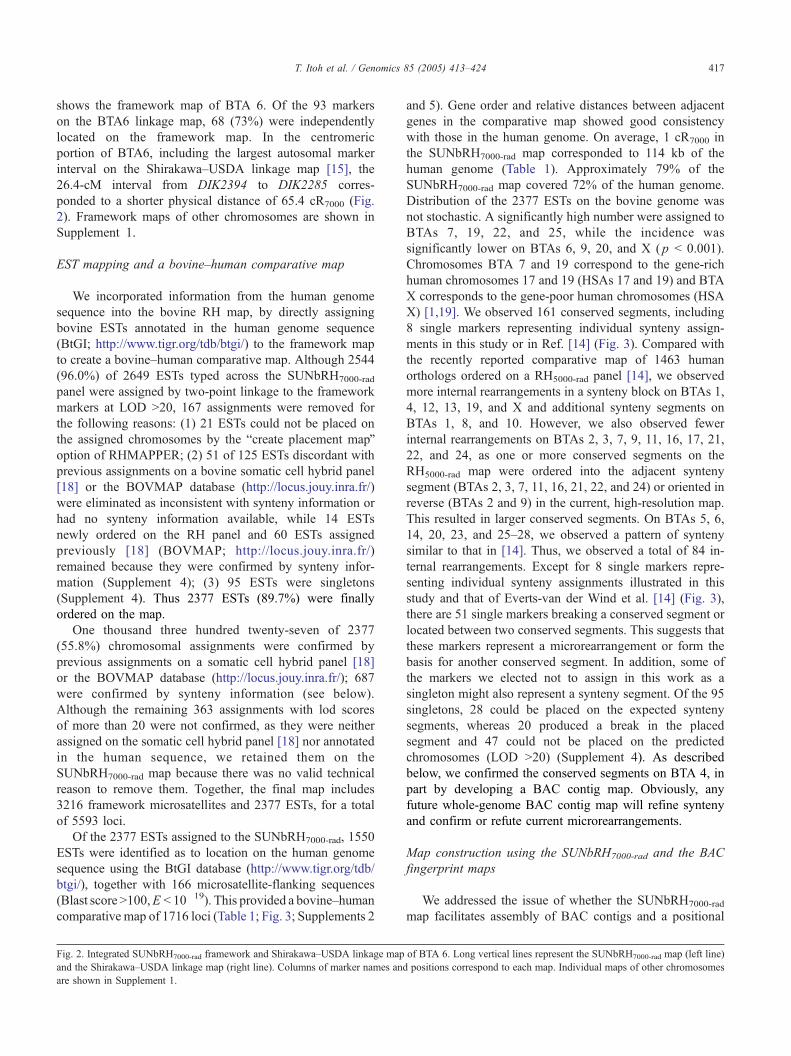
shows the framework map of BTA 6. Of the 93 markers
on the BTA6 linkage map, 68 (73%) were independently
located on the framework map. In the centromeric
portion of BTA6, including the largest autosomal marker
interval on the Shirakawa–USDA linkage map [15], the
26.4-cM interval from DIK2394 to DIK2285 corres-
ponded to a shorter physical distance of 65.4 cR7000 (Fig.
2). Framework maps of other chromosomes are shown in
Supplement 1.
EST mapping and a bovine–human comparative map
We incorporated information from the human genome
sequence into the bovine RH map, by directly assigning
bovine ESTs annotated in the human genome sequence
(BtGI; http://www.tigr.org/tdb/btgi/) to the framework map
to create a bovine–human comparative map. Although 2544
(96.0%) of 2649 ESTs typed across the SUNbRH7000-rad
panel were assigned by two-point linkage to the framework
markers at LOD N20, 167 assignments were removed for
the following reasons: (1) 21 ESTs could not be placed on
the assigned chromosomes by the bcreate placement mapQoption of RHMAPPER; (2) 51 of 125 ESTs discordant with
previous assignments on a bovine somatic cell hybrid panel
[18] or the BOVMAP database (http://locus.jouy.inra.fr/)
were eliminated as inconsistent with synteny information or
had no synteny information available, while 14 ESTs
newly ordered on the RH panel and 60 ESTs assigned
previously [18] (BOVMAP; http://locus.jouy.inra.fr/)
remained because they were confirmed by synteny infor-
mation (Supplement 4); (3) 95 ESTs were singletons
(Supplement 4). Thus 2377 ESTs (89.7%) were finally
ordered on the map.
One thousand three hundred twenty-seven of 2377
(55.8%) chromosomal assignments were confirmed by
previous assignments on a somatic cell hybrid panel [18]
or the BOVMAP database (http://locus.jouy.inra.fr/); 687
were confirmed by synteny information (see below).
Although the remaining 363 assignments with lod scores
of more than 20 were not confirmed, as they were neither
assigned on the somatic cell hybrid panel [18] nor annotated
in the human sequence, we retained them on the
SUNbRH7000-rad map because there was no valid technical
reason to remove them. Together, the final map includes
3216 framework microsatellites and 2377 ESTs, for a total
of 5593 loci.
Of the 2377 ESTs assigned to the SUNbRH7000-rad, 1550
ESTs were identified as to location on the human genome
sequence using the BtGI database (http://www.tigr.org/tdb/
btgi/), together with 166 microsatellite-flanking sequences
(Blast scoreN100,E b 10�19). This provided a bovine–human
comparative map of 1716 loci (Table 1; Fig. 3; Supplements 2
Fig. 2. Integrated SUNbRH7000-rad framework and Shirakawa–USDA linkage map
and the Shirakawa–USDA linkage map (right line). Columns of marker names and
are shown in Supplement 1.
and 5). Gene order and relative distances between adjacent
genes in the comparative map showed good consistency
with those in the human genome. On average, 1 cR7000 in
the SUNbRH7000-rad map corresponded to 114 kb of the
human genome (Table 1). Approximately 79% of the
SUNbRH7000-rad map covered 72% of the human genome.
Distribution of the 2377 ESTs on the bovine genome was
not stochastic. A significantly high number were assigned to
BTAs 7, 19, 22, and 25, while the incidence was
significantly lower on BTAs 6, 9, 20, and X ( p b 0.001).
Chromosomes BTA 7 and 19 correspond to the gene-rich
human chromosomes 17 and 19 (HSAs 17 and 19) and BTA
X corresponds to the gene-poor human chromosomes (HSA
X) [1,19]. We observed 161 conserved segments, including
8 single markers representing individual synteny assign-
ments in this study or in Ref. [14] (Fig. 3). Compared with
the recently reported comparative map of 1463 human
orthologs ordered on a RH5000-rad panel [14], we observed
more internal rearrangements in a synteny block on BTAs 1,
4, 12, 13, 19, and X and additional synteny segments on
BTAs 1, 8, and 10. However, we also observed fewer
internal rearrangements on BTAs 2, 3, 7, 9, 11, 16, 17, 21,
22, and 24, as one or more conserved segments on the
RH5000-rad map were ordered into the adjacent synteny
segment (BTAs 2, 3, 7, 11, 16, 21, 22, and 24) or oriented in
reverse (BTAs 2 and 9) in the current, high-resolution map.
This resulted in larger conserved segments. On BTAs 5, 6,
14, 20, 23, and 25–28, we observed a pattern of synteny
similar to that in [14]. Thus, we observed a total of 84 in-
ternal rearrangements. Except for 8 single markers repre-
senting individual synteny assignments illustrated in this
study and that of Everts-van der Wind et al. [14] (Fig. 3),
there are 51 single markers breaking a conserved segment or
located between two conserved segments. This suggests that
these markers represent a microrearrangement or form the
basis for another conserved segment. In addition, some of
the markers we elected not to assign in this work as a
singleton might also represent a synteny segment. Of the 95
singletons, 28 could be placed on the expected synteny
segments, whereas 20 produced a break in the placed
segment and 47 could not be placed on the predicted
chromosomes (LOD N20) (Supplement 4). As described
below, we confirmed the conserved segments on BTA 4, in
part by developing a BAC contig map. Obviously, any
future whole-genome BAC contig map will refine synteny
and confirm or refute current microrearrangements.
Map construction using the SUNbRH7000-rad and the BAC
fingerprint maps
We addressed the issue of whether the SUNbRH7000-rad
map facilitates assembly of BAC contigs and a positional
of BTA 6. Long vertical lines represent the SUNbRH7000-rad map (left line
positions correspond to each map. Individual maps of other chromosomes
)
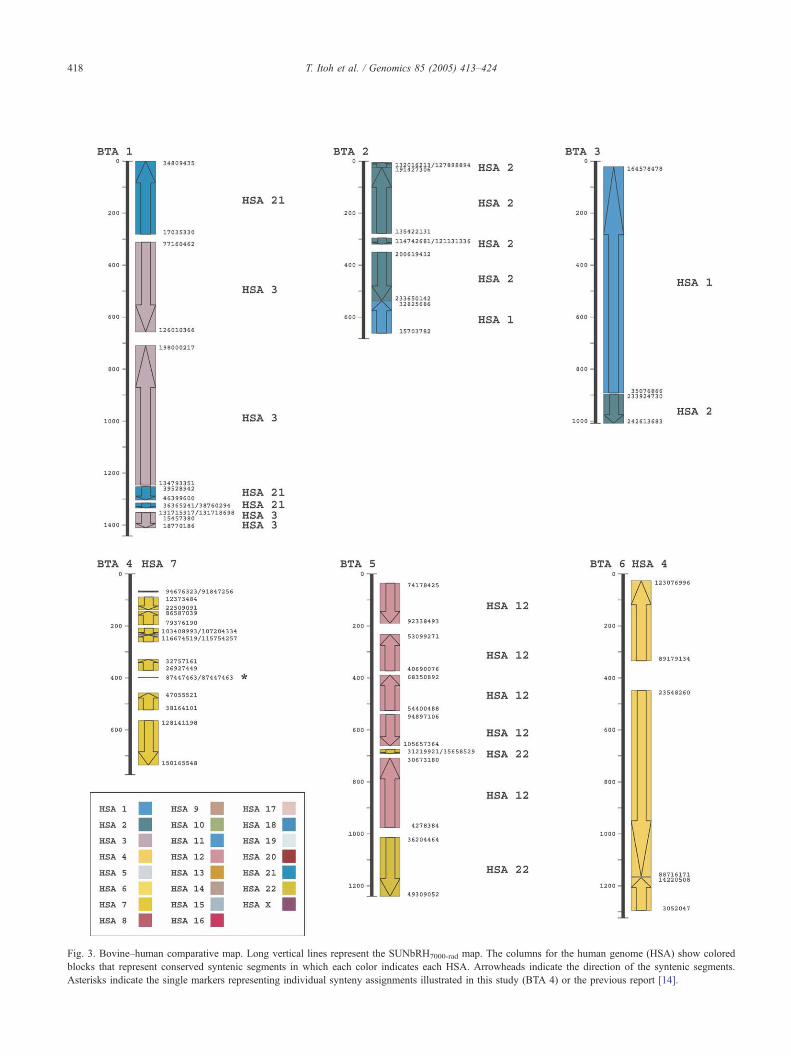
Fig. 3. Bovine–human comparative map. Long vertical lines represent the SUNbRH7000-rad map. The columns for the human genome (HSA) show colored
blocks that represent conserved syntenic segments in which each color indicates each HSA. Arrowheads indicate the direction of the syntenic segments
Asterisks indicate the single markers representing individual synteny assignments illustrated in this study (BTA 4) or the previous report [14].
T. Itoh et al. / Genomics 85 (2005) 413–424418
.
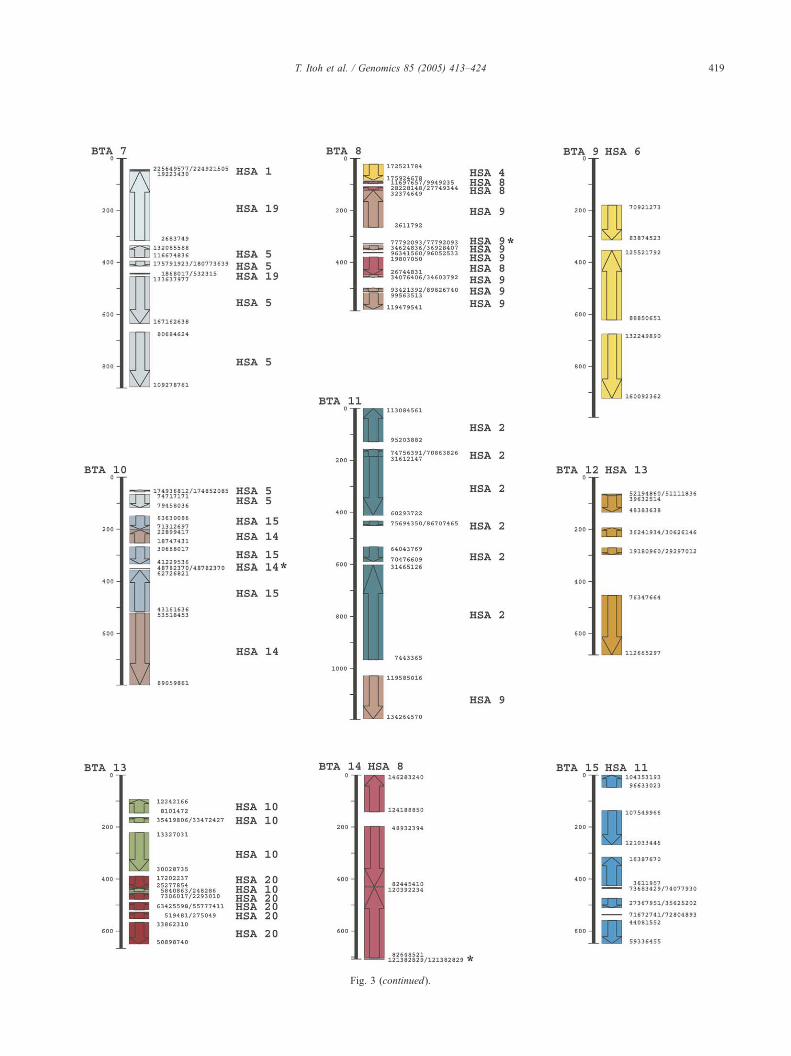
Fig. 3 (continued).
T. Itoh et al. / Genomics 85 (2005) 413–424 419
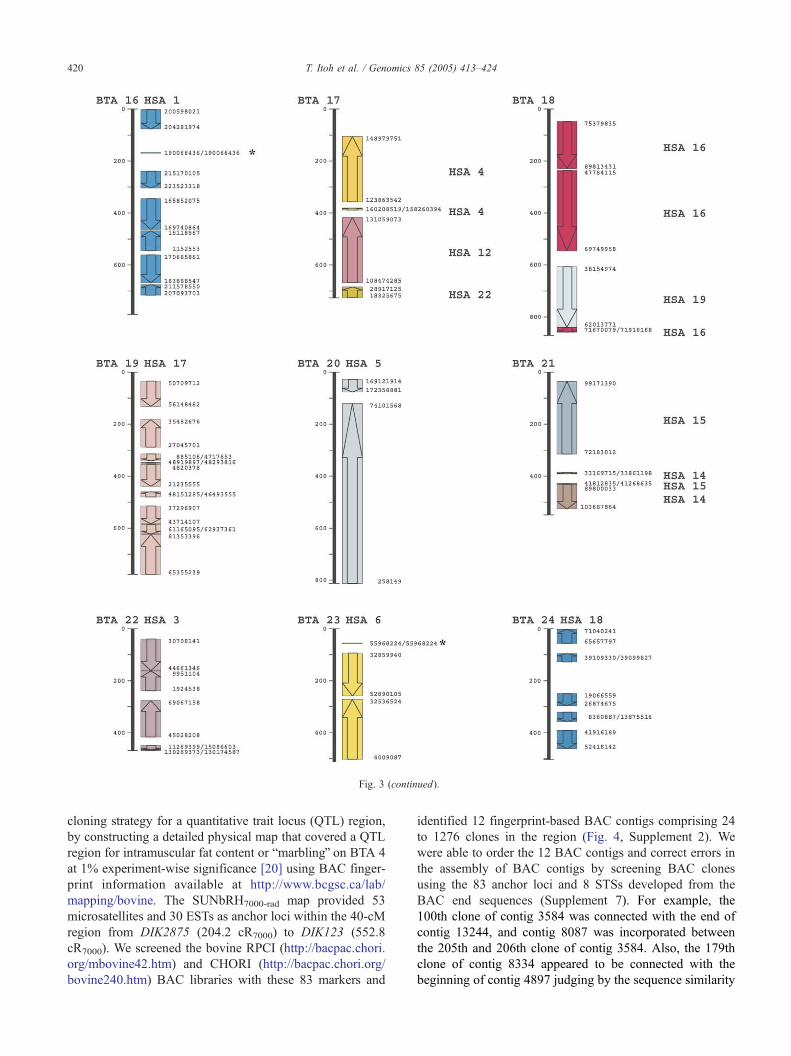
Fig. 3 (continued).
T. Itoh et al. / Genomics 85 (2005) 413–424420
cloning strategy for a quantitative trait locus (QTL) region,
by constructing a detailed physical map that covered a QTL
region for intramuscular fat content or bmarblingQ on BTA 4
at 1% experiment-wise significance [20] using BAC finger-
print information available at http://www.bcgsc.ca/lab/
mapping/bovine. The SUNbRH7000-rad map provided 53
microsatellites and 30 ESTs as anchor loci within the 40-cM
region from DIK2875 (204.2 cR7000) to DIK123 (552.8
cR7000). We screened the bovine RPCI (http://bacpac.chori.
org/mbovine42.htm) and CHORI (http://bacpac.chori.org/
bovine240.htm) BAC libraries with these 83 markers and
identified 12 fingerprint-based BAC contigs comprising 24
to 1276 clones in the region (Fig. 4, Supplement 2). We
were able to order the 12 BAC contigs and correct errors in
the assembly of BAC contigs by screening BAC clones
using the 83 anchor loci and 8 STSs developed from the
BAC end sequences (Supplement 7). For example, the
100th clone of contig 3584 was connected with the end of
contig 13244, and contig 8087 was incorporated between
the 205th and 206th clone of contig 3584. Also, the 179th
clone of contig 8334 appeared to be connected with the
beginning of contig 4897 judging by the sequence similarity
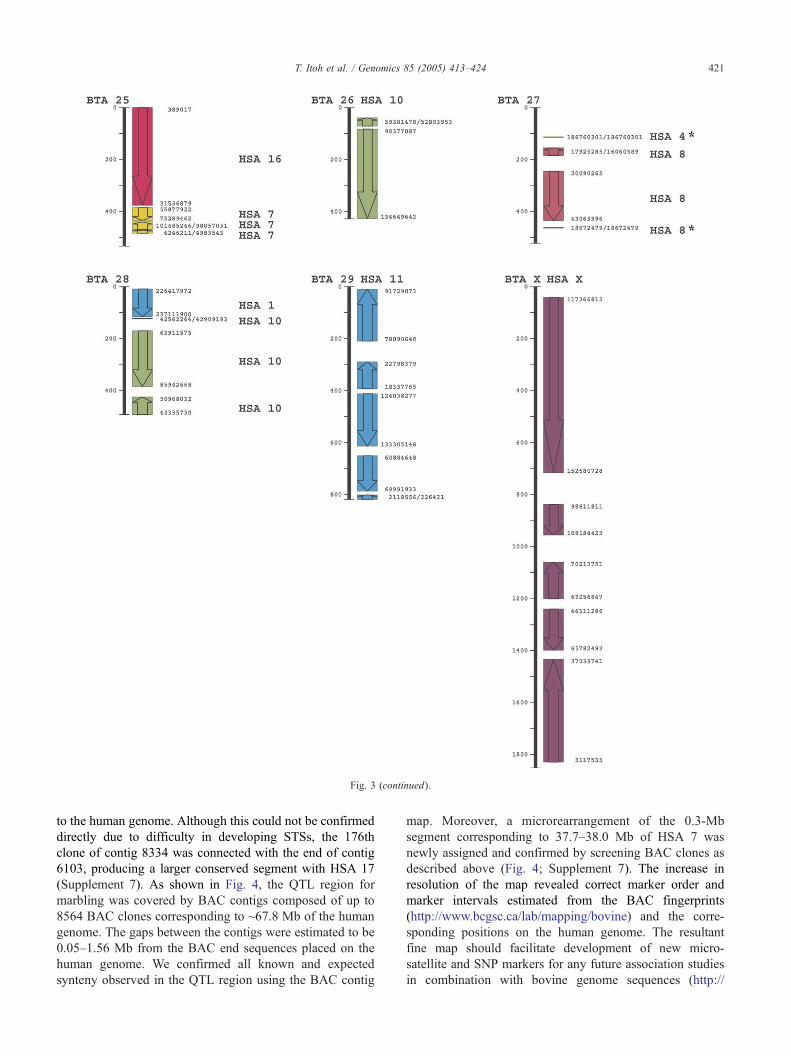
Fig. 3 (continued).
T. Itoh et al. / Genomics 85 (2005) 413–424 421
to the human genome. Although this could not be confirmed
directly due to difficulty in developing STSs, the 176th
clone of contig 8334 was connected with the end of contig
6103, producing a larger conserved segment with HSA 17
(Supplement 7). As shown in Fig. 4, the QTL region for
marbling was covered by BAC contigs composed of up to
8564 BAC clones corresponding to ~67.8 Mb of the human
genome. The gaps between the contigs were estimated to be
0.05–1.56 Mb from the BAC end sequences placed on the
human genome. We confirmed all known and expected
synteny observed in the QTL region using the BAC contig
map. Moreover, a microrearrangement of the 0.3-Mb
segment corresponding to 37.7–38.0 Mb of HSA 7 was
newly assigned and confirmed by screening BAC clones as
described above (Fig. 4; Supplement 7). The increase in
resolution of the map revealed correct marker order and
marker intervals estimated from the BAC fingerprints
(http://www.bcgsc.ca/lab/mapping/bovine) and the corre-
sponding positions on the human genome. The resultant
fine map should facilitate development of new micro-
satellite and SNP markers for any future association studies
in combination with bovine genome sequences (http://
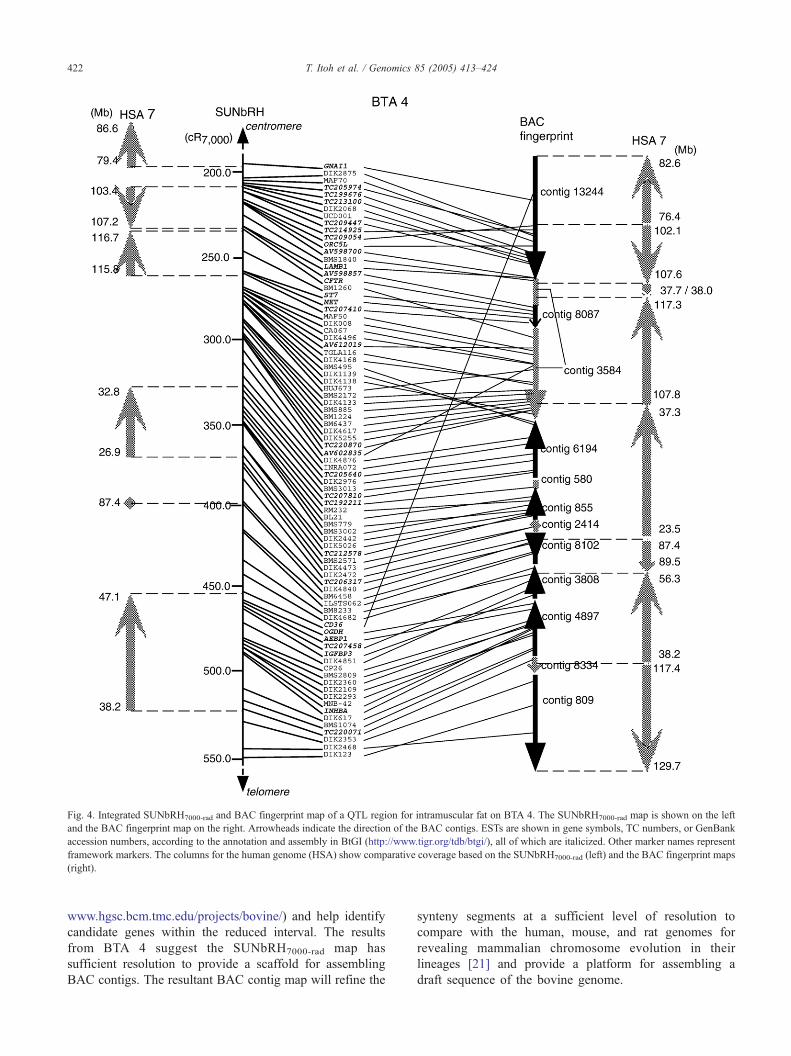
Fig. 4. Integrated SUNbRH7000-rad and BAC fingerprint map of a QTL region for intramuscular fat on BTA 4. The SUNbRH7000-rad map is shown on the left
and the BAC fingerprint map on the right. Arrowheads indicate the direction of the BAC contigs. ESTs are shown in gene symbols, TC numbers, or GenBank
accession numbers, according to the annotation and assembly in BtGI (http://www.tigr.org/tdb/btgi/), all of which are italicized. Other marker names represent
framework markers. The columns for the human genome (HSA) show comparative coverage based on the SUNbRH7000-rad (left) and the BAC fingerprint maps
(right).
T. Itoh et al. / Genomics 85 (2005) 413–424422
www.hgsc.bcm.tmc.edu/projects/bovine/) and help identify
candidate genes within the reduced interval. The results
from BTA 4 suggest the SUNbRH7000-rad map has
sufficient resolution to provide a scaffold for assembling
BAC contigs. The resultant BAC contig map will refine the
synteny segments at a sufficient level of resolution to
compare with the human, mouse, and rat genomes for
revealing mammalian chromosome evolution in their
lineages [21] and provide a platform for assembling a
draft sequence of the bovine genome.
T. Itoh et al. / Genomics 85 (2005) 413–424 423
Materials and methods
Construction of the SUNbRH7000-rad panel. Bovine fibro-
blasts were derived from male muscle tissue biopsies.
Approximately 1.8 � 107 fibroblasts were irradiated with
7000 rad and fused to HPRT� Wg3hCl2 hamster cells
[22]. Fused cells were grown in RPMI 1640 medium
supplemented with 10% fetal bovine serum and 1� HAT
at 378C. The irradiated bovine and hamster fibroblasts
were plated onto 1� HAT medium and incubated at
378C as controls. Independent colonies were picked and
grown in four 300-cm2 flasks for DNA extraction.
Ninety-two hybrid clones were randomly chosen and
characterized by FISH to determine donor DNA content,
followed by estimation of chromosome retention fre-
quency using 62 microsatellites that spanned all bovine
chromosomes at relatively even intervals (P. Mariani, Y.
Sugimoto, and C. W. Beattie, unpublished). The
SUNbRH7000-rad panel is available upon request.
Marker amplification by PCR. Microsatellite markers were
obtained from the Shirakawa–USDA linkage map [15] (see
also http://www.marc.usda.gov/genome/). EST markers
were derived from 3V ESTs as described previously
[18,23] and published by others [7]. Additional sets of
primers were designed for 88 genes, from assembled EST
sequences (http://www.tigr.org/tdb/btgi/) using Primer3
(http://www-genome.wi.mit.edu/genome_software/other/
primer3.html) (Supplement 3). Forward (EST markers) or
reverse (microsatellite markers) primers were fluorescently
labeled. The PCR mixtures were composed of 10 mM
Tris–HCl (pH 8.3), 50 mM KCl, 1.5 mM MgCl2, 0.4 U
Taq polymerase, 0.2 mM each dNTP, 0.4 AM primers, and
50 ng template DNA in a 15-Al volume. Amplification was
performed under the following conditions: denaturation at
948C for 4 min followed by 30 cycles of 948C for 1 min
for denaturation, 50 to 658C for 1 min for annealing, and
728C for 1 min for extension, followed by a final
extension step at 728C for 5 min. PCR products were
purified using MultiScreen-PCR (Millipore, Cambridge,
MA, USA) or NucleoFast 96 PCR plates (MACHEREY-
NAGEL GmbH & Co., Germany), followed by electro-
phoresis using an ABI 3700 DNA analyzer (Applied
Biosystems, Foster City, CA, USA). Detailed marker
information is available in Supplement 2. Each micro-
satellite and EST was independently scored as amplified (1),
not amplified (0), or ambiguous (2) for each hybrid using
Genotyper (Applied Biosystems) in triplicate and duplicate,
respectively. The results with discrepancies were reex-
amined and reanalyzed and any remaining discrepancies
scored as ambiguous. Only three ambiguities per marker
were allowed.
Construction of framework map. The framework was
constructed according to the strategy used by Van Etten
et al. [16]. Initially, microsatellites were ordered according
to their location on the linkage map [15], in which
microsatellites with the same typing data, but distinct
positions on the linkage map, were removed, and RH
distances were computed using the RHMAPPER program
[17]. The loci were subjected to the bexpansionQ test in
which any locus whose inclusion expanded the map
distance more than 30 cR7000 was excluded. The remain-
ing microsatellites were subjected to a brippleQ test using
the brippleQ function in RHMAPPER, in which four
consecutive loci were permuted to determine if any
permutation yielded a significantly higher likelihood.
The best permutation was reinserted into the order and
the next four were then considered. The microsatellites
that had been removed in the previous steps were inserted
back into the map using the bplacementQ function of
RHMAPPER, if they showed a strong pair-wise linkage
(LOD N20) to another marker in the genetic linkage
group. However, the markers introducing unusual apparent
breaks or mapped to a significantly different location were
again excluded. Finally, all markers located at a chromo-
somal end apart from the next marker or in a large
interval apart from the adjacent markers on the linkage
map were inserted back into the map.
To determine the appropriate lod score threshold for
mapping new loci, the highest lod score of each framework
marker with a marker on a different chromosome was
calculated according to Van Etten et al. [16] (Supplement 6).
We chose LOD 20 as the threshold, because a cross-
chromosomal lod score exceeded 20 in only 5% of the
framework microsatellite markers.
EST mapping. ESTs were assigned to chromosomes to
which they showed the strongest pair-wise linkage with a
minimum lod score of 20 using the RHMAPPER program.
ESTs were placed on the assigned chromosomes using the
bcreate placement mapQ option of RHMAPPER, using 20
cR7000 as a maximum distance from terminal framework
markers.
Construction of a bovine–human comparative map. The
information on ESTs about assembling, annotation, and
placement on the human genome was obtained from BtGI
(http://www.tigr.org/tdb/btgi/) (Release 9.0, 2003). Map-
Viewer build 34 version 1 of the human genome assembly
(http://www.ncbi.nlm.nih.gov/mapview/) was used. For the
ESTs that were not placed on the human genome, the 5VEST sequence was used to search the human genome
sequence (Supplement 2). The annotation in BtGI is based
on the similarity with known proteins. To convert the
annotation into gene symbols, GenBank accession numbers
of the known proteins were searched against LocusLink
(cattle, human, mouse, rat, pig, and dog) (ftp://ftp.ncbi.nlm.
nih.gov/refseq/LocusLink/) and either bofficial symbolsQ orbpreferred symbolsQ were obtained. The annotations includ-ing bsimilar toQ or bweakly similar toQ were eliminated to
avoid connecting to paralogs.
T. Itoh et al. / Genomics 85 (2005) 413–424424
Bovine mapping data published previously was obtained
from the BOVMAP database (http://locus.jouy.inra.fr/). The
human orthologs were searched using bovine gene symbols
against bgene symbolsQ in LocusLink (http://www.ncbi.
nlm.nih.gov/LocusLink/), and human genomic positions
were obtained from the placement of breference sequencesQon the human genome.
Microsatellite-flanking sequences were masked with
repetitive sequences using RepeatMasker and Repbase 6.4
[24] and submitted to the Blast search using Blastn [25]
against human genomic sequences (ftp://ftp.ncbi.nih.gov/
genomes/H_sapiens/). The human sequences with a mini-
mum Blast score of 100 (E b 10�19) were queried for the
genomic position on MapViewer build 34 version 1 (http://
www.ncbi.nlm.nih.gov/mapview/) of the human genome.
Conserved segments were defined by more than one
consecutive loci on the comparative map, except for the
single markers judged as representing individual synteny
assignments from this study or the previous report [14].
Synteny coverage of the conserved segment on the human
genome was defined by the starting positions of the most
distant intrasegmental orthologs in the human genome. The
number of internal rearrangements was calculated as the
number of breaks in the human chromosome segment on a
bovine chromosome.
Placement of BAC contigs on the bovine and the human
genomes. PCR-based screening was performed on the RPCI-
42 (http://bacpac.chori.org/mbovine42.htm) or the CHORI-
240 (http://bacpac.chori.org/bovine240.htm) bovine BAC
libraries using microsatellite and EST markers. Identified
BAC clone IDs were submitted to search against the BAC
fingerprint map (http://www.bcgsc.ca/lab/mapping/bovine),
to obtain the contig IDs and the clone IDs included in the
contigs. The contigs were ordered and oriented using the
microsatellites anchored on the RH map. BAC end
sequences were searched in GenBank (http://www.
ncbi.nlm.nih.gov/Genbank/), followed by the Blast search
using Blastn [25] against human genomic sequences (ftp://
ftp.ncbi.nih.gov/genomes/H_sapiens/) to place them on the
human genome.
Acknowledgments
The authors thank I. Fujita, T. Fujii, Y. Midorikawa, C.
Itoh, and C. Sohma for laboratory assistance. This work was
supported by grants from the Japan Racing and Livestock
Promotion Foundation.
Appendix A. Supplementary data
Supplementary data associated with this article can be
found, in the online version, at doi:10.1016/j.ygeno.
2004.12.007.
References
[1] Human Genome Consortium, Initial sequencing and analysis of the
human genome, Nature 409 (2001) 860–921.
[2] X.S. Puente, L.M. Sanchez, C.M. Overall, C. Lopez-Otin, Human and
mouse proteases, a comparative genomic approach, Nat. Rev. 4 (2003)
544–558.
[3] H. Takeda, et al., Positional cloning of the gene LIMBIN responsible
for bovine chondrodysplastic dwarfism, Proc. Natl. Acad. Sci. USA
99 (2002) 10549–10554.
[4] B. Grisart, et al., Positional candidate cloning of a QTL in dairy cattle,
identification of a missense mutation in the bovine DGAT1 gene with
major effect on milk yield and composition, Genome Res. 12 (2002)
222–231.
[5] A.S. Van Laere, et al., A regulatory mutation in IGF2 causes a
major QTL effect on muscle growth in the pig, Nature 425 (2003)
832–836.
[6] J.E. Womack, et al., A whole-genome radiation hybrid panel for
bovine gene mapping, Mamm. Genome 8 (1997) 854–856.
[7] M.R. Band, et al., An ordered comparative map of the cattle and
human genomes, Genome Res. 10 (2000) 1359–1368.
[8] J.L. Williams, et al., A bovine whole-genome radiation hybrid panel
and outline map, Mamm. Genome 13 (2002) 469–474.
[9] M.E. Amaral, S.R. Kata, J.E. Womack, A radiation hybrid map of
bovine X chromosome (BTAX), Mamm. Genome 13 (2002) 268–271.
[10] T. Goldammer, et al., A comparative radiation hybrid map of bovine
chromosome 18 and homologous chromosomes in human and mice,
Proc. Natl. Acad. Sci. USA 99 (2002) 2106–2111.
[11] M. Gautier, H. Hayes, A. Eggen, A comprehensive radiation hybrid
map of bovine chromosome 26 (BTA26), comparative chromosomal
organization between HSA10q and BTA26 and BTA28, Mamm.
Genome 14 (2003) 711–721.
[12] M. Gautier, H. Hayes, A. Eggen, An extensive and comprehensive
radiation hybrid map of bovine chromosome 15, comparison with
human chromosome 11, Mamm. Genome 13 (2002) 316–319.
[13] D.M. Larkin, et al., A cattle–human comparative map built with cattle
BAC-ends and human genome sequence, Genome Res. 13 (2003)
1966–1972.
[14] A. Everts-van der Wind, et al., A 1463 gene cattle–human
comparative map with anchor points defined by human genome
sequence coordinates, Genome Res. 14 (2004) 1424–1437.
[15] N. Ihara, et al., A comprehensive genetic map of the cattle genome
based on 3802 microsatellites, Genome Res. 14 (2004) 1987–1998.
[16] W.J. Van Etten, et al., Radiation hybrid map of the mouse genome,
Nat. Genet. 22 (1999) 384–387.
[17] D. Slonim, L. Kruglyak, L. Stein, E.S. Lander, Building human genome
maps with radiation hybrids, J. Comput. Biol. 4 (1997) 487–504.
[18] T. Itoh, A. Takasuga, T. Watanabe, Y. Sugimoto, Mapping of 1400
EST on bovine genome using a somatic cell hybrid panel, Anim.
Genet. 34 (2003) 362–370.
[19] J.C. Venter, et al., The sequence of the human genome, Science 291
(2001) 1304–1351.
[20] K. Mizoshita, et al., Quantitative trait loci analysis for growth and
carcass traits in a half-sib family of purebred Japanese Black (Wagyu)
cattle, J. Anim. Sci. 82 (2004) 3415–3420.
[21] G. Bourque, P.A. Pevzner, G. Tesler, Reconstructing the genome
architecture of ancestral mammals, lessons from human, mouse, and
rat genomes, Genome Res. 14 (2004) 507–516.
[22] S.J. Goss, H. Harris, New method for mapping genes in human
chromosomes, Nature 255 (1975) 680–684.
[23] A. Takasuga, et al., Establishment of a high throughput ESTsequencing
system using poly(A) tail-removed cDNA libraries and determination
of 36,000 bovine ESTs, Nucleic Acids Res. 29 (2001) E108.
[24] J. Jurka, Repbase update, Trends Genet. 16 (2000) 418–420.
[25] J. Zhang, T.L. Madden, PowerBLAST, a new network BLAST
application for interactive or automated sequence analysis and
annotation, Genome Res. 7 (1997) 649–656.
Related Documents