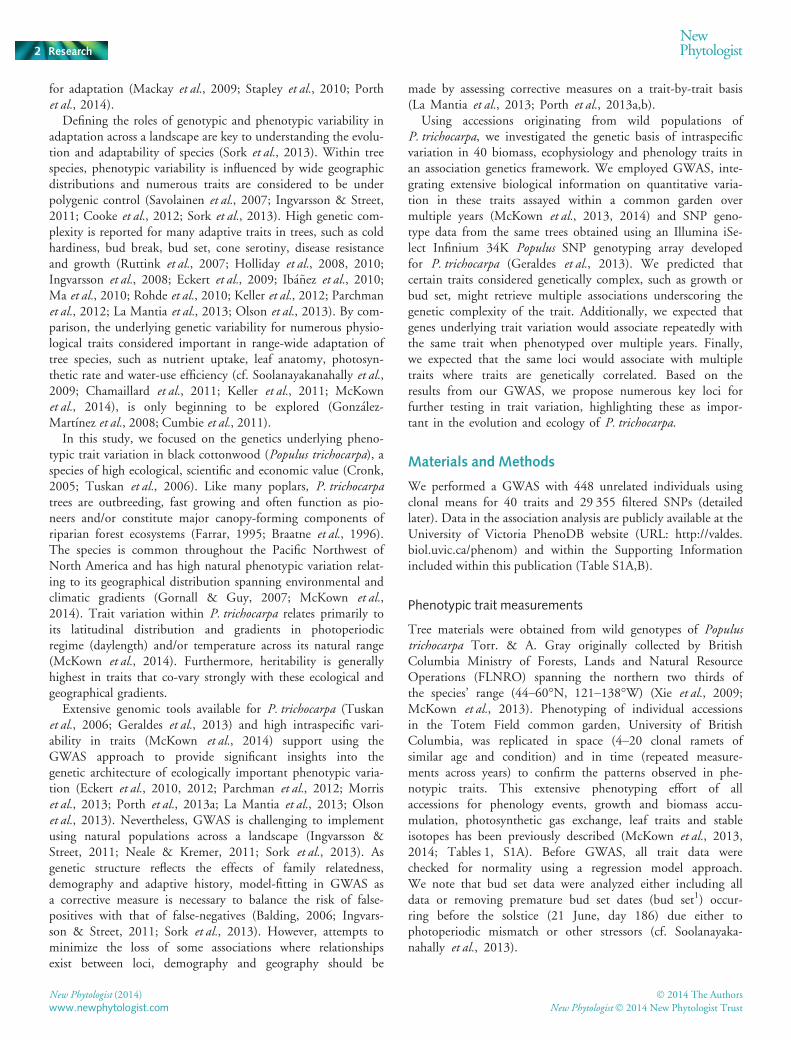
Genome-wide association implicates numerous genes underlying ecological trait variation in natural populations of Populus trichocarpa Athena D. McKown 1 *, Jaroslav Kla ´ps ˇte ˇ 1,2 *, Robert D. Guy 1 , Armando Geraldes 3 , Ilga Porth 1,4 , Jan Hannemann 5 , Michael Friedmann 3 , Wellington Muchero 6 , Gerald A. Tuskan 6 ,J€ urgen Ehlting 5 , Quentin C. B. Cronk 3 , Yousry A. El-Kassaby 1 , Shawn D. Mansfield 4 and Carl J. Douglas 3 1 Department of Forest and Conservation Sciences, Faculty of Forestry, University of British Columbia, Forest Sciences Centre, 2424 Main Mall, Vancouver, BC, V6T 1Z4, Canada; 2 Department of Dendrology and Forest Tree Breeding, Faculty of Forestry and Wood Sciences, Czech University of Life Sciences, Prague 165 21, Czech Republic; 3 Department of Botany, University of British Columbia, Vancouver, BC, V6T 1Z4, Canada; 4 Department of Wood Science, Faculty of Forestry, University of British Columbia, Forest Sciences Centre, 2424 Main Mall, Vancouver, BC, V6T 1Z4, Canada; 5 Department of Biology and Centre for Forest Biology, University of Victoria, Victoria, BC, V8W 3N5, Canada; 6 BioSciences Division, Oak Ridge National Laboratory, Oak Ridge, TN 37831, USA Author for correspondence: Athena D. McKown Tel: +1 604 822 6023 Email: [email protected] Received: 7 November 2013 Accepted: 14 March 2014 New Phytologist (2014) doi: 10.1111/nph.12815 Key words: biomass, ecophysiology, genome-wide association study (GWAS), phenology, pleiotropy, poplar, single nucleotide polymorphisms (SNP) array, Unified Mixed Model. Summary In order to uncover the genetic basis of phenotypic trait variation, we used 448 unrelated wild accessions of black cottonwood (Populus trichocarpa) from much of its range in western North America. Extensive data from large-scale trait phenotyping (with spatial and temporal replications within a common garden) and genotyping (with a 34 K Populus single nucleotide polymorphism (SNP) array) of all accessions were used for gene discovery in a genome-wide association study (GWAS). We performed GWAS with 40 biomass, ecophysiology and phenology traits and 29 355 filtered SNPs representing 3518 genes. The association analyses were carried out using a Unified Mixed Model accounting for population structure effects among accessions. We uncovered 410 significant SNPs using a Bonferroni-corrected threshold (P < 1.7 9 10 6 ). Markers were found across 19 chromosomes, explained 1–13% of trait variation, and implicated 275 unique genes in trait associations. Phenology had the largest number of associated genes (240 genes), followed by biomass (53 genes) and ecophysiology traits (25 genes). The GWAS results propose numerous loci for further investigation. Many traits had signifi- cant associations with multiple genes, underscoring their genetic complexity. Genes were also identified with multiple trait associations within and/or across trait categories. In some cases, traits were genetically correlated while in others they were not. Introduction The genetic basis of phenotypic variability is the fundamental underpinning of evolutionary biology and key in understanding factors that define speciation, biogeographical distributions and fitness under natural conditions (Stapley et al., 2010; Savolainen et al., 2013). Achieving such understanding is becoming more attainable as the ability to cast a wider net for gene discovery in traits of interest emerges. In plant biology, the integration of extensive genetic and phenotypic data is finding application in development and improvement of crop species, but is also extending our understanding of the genetics underlying traits of evolutionary and ecological importance (Ingvarsson et al., 2008; Eckert et al., 2009, 2010, 2012; Fournier-Level et al., 2011; Parchman et al., 2012; Olson et al., 2013). Genome-wide asso- ciation studies (GWAS) can be powerful for identifying puta- tive causal genes, or suites of genes, underlying phenotypic variation, particularly in traits with complex genetic architecture (Vandenkoornhuyse et al., 2010; Ingvarsson & Street, 2011; Savolainen et al., 2013; Sork et al., 2013). Where traits are complex (i.e. involving a number of genes or gene networks), GWAS using high genome coverage of single nucleotide poly- morphisms (SNP) markers has been very effective for identify- ing the genetic architecture underlying variability in these traits (Eckert et al., 2012; Parchman et al., 2012; Riedelsheimer et al., 2012; Morris et al., 2013; Porth et al., 2013a). GWAS can also uncover loci with potential pleiotropic effects that may be important to natural variation within species and their capacity *These authors contributed equally to this work. Ó 2014 The Authors New Phytologist Ó 2014 New Phytologist Trust New Phytologist (2014) 1 www.newphytologist.com Research

Welcome message from author
This document is posted to help you gain knowledge. Please leave a comment to let me know what you think about it! Share it to your friends and learn new things together.
Transcript
Genome-wide association implicates numerous genes underlyingecological trait variation in natural populations of Populustrichocarpa
Athena D. McKown1*, Jaroslav Klapste1,2*, Robert D. Guy1, Armando Geraldes3, Ilga Porth1,4, Jan Hannemann5,
Michael Friedmann3, Wellington Muchero6, Gerald A. Tuskan6, J€urgen Ehlting5, Quentin C. B. Cronk3,
Yousry A. El-Kassaby1, Shawn D. Mansfield4 and Carl J. Douglas3
1Department of Forest and Conservation Sciences, Faculty of Forestry, University of British Columbia, Forest Sciences Centre, 2424 Main Mall, Vancouver, BC, V6T 1Z4, Canada;
2Department of Dendrology and Forest Tree Breeding, Faculty of Forestry and Wood Sciences, Czech University of Life Sciences, Prague 165 21, Czech Republic; 3Department of Botany,
University of British Columbia, Vancouver, BC, V6T 1Z4, Canada; 4Department of Wood Science, Faculty of Forestry, University of British Columbia, Forest Sciences Centre, 2424 Main
Mall, Vancouver, BC, V6T 1Z4, Canada; 5Department of Biology and Centre for Forest Biology, University of Victoria, Victoria, BC, V8W 3N5, Canada; 6BioSciences Division, Oak Ridge
National Laboratory, Oak Ridge, TN 37831, USA
Author for correspondence:Athena D. McKownTel: +1 604 822 6023
Email: [email protected]
Received: 7 November 2013Accepted: 14 March 2014
New Phytologist (2014)doi: 10.1111/nph.12815
Key words: biomass, ecophysiology,genome-wide association study (GWAS),phenology, pleiotropy, poplar, singlenucleotide polymorphisms (SNP) array,Unified Mixed Model.
Summary
� In order to uncover the genetic basis of phenotypic trait variation, we used 448 unrelated
wild accessions of black cottonwood (Populus trichocarpa) from much of its range in western
North America. Extensive data from large-scale trait phenotyping (with spatial and temporal
replications within a common garden) and genotyping (with a 34 K Populus single nucleotide
polymorphism (SNP) array) of all accessions were used for gene discovery in a genome-wide
association study (GWAS).� We performed GWAS with 40 biomass, ecophysiology and phenology traits and 29 355
filtered SNPs representing 3518 genes. The association analyses were carried out using a
Unified Mixed Model accounting for population structure effects among accessions.� We uncovered 410 significant SNPs using a Bonferroni-corrected threshold (P< 1.79 10�6).
Markers were found across 19 chromosomes, explained 1–13% of trait variation, and implicated
275 unique genes in trait associations. Phenology had the largest number of associated genes (240
genes), followed by biomass (53 genes) and ecophysiology traits (25 genes).� The GWAS results propose numerous loci for further investigation. Many traits had signifi-
cant associations with multiple genes, underscoring their genetic complexity. Genes were also
identified with multiple trait associations within and/or across trait categories. In some cases,
traits were genetically correlated while in others they were not.
Introduction
The genetic basis of phenotypic variability is the fundamentalunderpinning of evolutionary biology and key in understandingfactors that define speciation, biogeographical distributions andfitness under natural conditions (Stapley et al., 2010; Savolainenet al., 2013). Achieving such understanding is becoming moreattainable as the ability to cast a wider net for gene discovery intraits of interest emerges. In plant biology, the integration ofextensive genetic and phenotypic data is finding application indevelopment and improvement of crop species, but is alsoextending our understanding of the genetics underlying traits ofevolutionary and ecological importance (Ingvarsson et al., 2008;
Eckert et al., 2009, 2010, 2012; Fournier-Level et al., 2011;Parchman et al., 2012; Olson et al., 2013). Genome-wide asso-ciation studies (GWAS) can be powerful for identifying puta-tive causal genes, or suites of genes, underlying phenotypicvariation, particularly in traits with complex genetic architecture(Vandenkoornhuyse et al., 2010; Ingvarsson & Street, 2011;Savolainen et al., 2013; Sork et al., 2013). Where traits arecomplex (i.e. involving a number of genes or gene networks),GWAS using high genome coverage of single nucleotide poly-morphisms (SNP) markers has been very effective for identify-ing the genetic architecture underlying variability in these traits(Eckert et al., 2012; Parchman et al., 2012; Riedelsheimer et al.,2012; Morris et al., 2013; Porth et al., 2013a). GWAS can alsouncover loci with potential pleiotropic effects that may beimportant to natural variation within species and their capacity*These authors contributed equally to this work.
� 2014 The Authors
New Phytologist� 2014 New Phytologist TrustNew Phytologist (2014) 1
www.newphytologist.com
Research
for adaptation (Mackay et al., 2009; Stapley et al., 2010; Porthet al., 2014).
Defining the roles of genotypic and phenotypic variability inadaptation across a landscape are key to understanding the evolu-tion and adaptability of species (Sork et al., 2013). Within treespecies, phenotypic variability is influenced by wide geographicdistributions and numerous traits are considered to be underpolygenic control (Savolainen et al., 2007; Ingvarsson & Street,2011; Cooke et al., 2012; Sork et al., 2013). High genetic com-plexity is reported for many adaptive traits in trees, such as coldhardiness, bud break, bud set, cone serotiny, disease resistanceand growth (Ruttink et al., 2007; Holliday et al., 2008, 2010;Ingvarsson et al., 2008; Eckert et al., 2009; Ib�a~nez et al., 2010;Ma et al., 2010; Rohde et al., 2010; Keller et al., 2012; Parchmanet al., 2012; La Mantia et al., 2013; Olson et al., 2013). By com-parison, the underlying genetic variability for numerous physio-logical traits considered important in range-wide adaptation oftree species, such as nutrient uptake, leaf anatomy, photosyn-thetic rate and water-use efficiency (cf. Soolanayakanahally et al.,2009; Chamaillard et al., 2011; Keller et al., 2011; McKownet al., 2014), is only beginning to be explored (Gonz�alez-Mart�ınez et al., 2008; Cumbie et al., 2011).
In this study, we focused on the genetics underlying pheno-typic trait variation in black cottonwood (Populus trichocarpa), aspecies of high ecological, scientific and economic value (Cronk,2005; Tuskan et al., 2006). Like many poplars, P. trichocarpatrees are outbreeding, fast growing and often function as pio-neers and/or constitute major canopy-forming components ofriparian forest ecosystems (Farrar, 1995; Braatne et al., 1996).The species is common throughout the Pacific Northwest ofNorth America and has high natural phenotypic variation relat-ing to its geographical distribution spanning environmental andclimatic gradients (Gornall & Guy, 2007; McKown et al.,2014). Trait variation within P. trichocarpa relates primarily toits latitudinal distribution and gradients in photoperiodicregime (daylength) and/or temperature across its natural range(McKown et al., 2014). Furthermore, heritability is generallyhighest in traits that co-vary strongly with these ecological andgeographical gradients.
Extensive genomic tools available for P. trichocarpa (Tuskanet al., 2006; Geraldes et al., 2013) and high intraspecific vari-ability in traits (McKown et al., 2014) support using theGWAS approach to provide significant insights into thegenetic architecture of ecologically important phenotypic varia-tion (Eckert et al., 2010, 2012; Parchman et al., 2012; Morriset al., 2013; Porth et al., 2013a; La Mantia et al., 2013; Olsonet al., 2013). Nevertheless, GWAS is challenging to implementusing natural populations across a landscape (Ingvarsson &Street, 2011; Neale & Kremer, 2011; Sork et al., 2013). Asgenetic structure reflects the effects of family relatedness,demography and adaptive history, model-fitting in GWAS asa corrective measure is necessary to balance the risk of false-positives with that of false-negatives (Balding, 2006; Ingvars-son & Street, 2011; Sork et al., 2013). However, attempts tominimize the loss of some associations where relationshipsexist between loci, demography and geography should be
made by assessing corrective measures on a trait-by-trait basis(La Mantia et al., 2013; Porth et al., 2013a,b).
Using accessions originating from wild populations ofP. trichocarpa, we investigated the genetic basis of intraspecificvariation in 40 biomass, ecophysiology and phenology traits inan association genetics framework. We employed GWAS, inte-grating extensive biological information on quantitative varia-tion in these traits assayed within a common garden overmultiple years (McKown et al., 2013, 2014) and SNP geno-type data from the same trees obtained using an Illumina iSe-lect Infinium 34K Populus SNP genotyping array developedfor P. trichocarpa (Geraldes et al., 2013). We predicted thatcertain traits considered genetically complex, such as growth orbud set, might retrieve multiple associations underscoring thegenetic complexity of the trait. Additionally, we expected thatgenes underlying trait variation would associate repeatedly withthe same trait when phenotyped over multiple years. Finally,we expected that the same loci would associate with multipletraits where traits are genetically correlated. Based on theresults from our GWAS, we propose numerous key loci forfurther testing in trait variation, highlighting these as impor-tant in the evolution and ecology of P. trichocarpa.
Materials and Methods
We performed a GWAS with 448 unrelated individuals usingclonal means for 40 traits and 29 355 filtered SNPs (detailedlater). Data in the association analysis are publicly available at theUniversity of Victoria PhenoDB website (URL: http://valdes.biol.uvic.ca/phenom) and within the Supporting Informationincluded within this publication (Table S1A,B).
Phenotypic trait measurements
Tree materials were obtained from wild genotypes of Populustrichocarpa Torr. & A. Gray originally collected by BritishColumbia Ministry of Forests, Lands and Natural ResourceOperations (FLNRO) spanning the northern two thirds ofthe species’ range (44–60�N, 121–138�W) (Xie et al., 2009;McKown et al., 2013). Phenotyping of individual accessionsin the Totem Field common garden, University of BritishColumbia, was replicated in space (4–20 clonal ramets ofsimilar age and condition) and in time (repeated measure-ments across years) to confirm the patterns observed in phe-notypic traits. This extensive phenotyping effort of allaccessions for phenology events, growth and biomass accu-mulation, photosynthetic gas exchange, leaf traits and stableisotopes has been previously described (McKown et al., 2013,2014; Tables 1, S1A). Before GWAS, all trait data werechecked for normality using a regression model approach.We note that bud set data were analyzed either including alldata or removing premature bud set dates (bud set1) occur-ring before the solstice (21 June, day 186) due either tophotoperiodic mismatch or other stressors (cf. Soolanayaka-nahally et al., 2013).
New Phytologist (2014) � 2014 The Authors
New Phytologist� 2014 New Phytologist Trustwww.newphytologist.com
Research
NewPhytologist2
SNP genotyping
A total of 448 unrelated, phenotyped P. trichocarpa accessions(with > 0.03% genetic distance) were successfully genotyped witha 34K Populus Illumina Infinium® SNP genotyping arraydesigned for P. trichocarpa (Table S1B). Full details of SNPdiscovery/selection, array development, performance and datafiltering criteria are given in Geraldes et al. (2011, 2013).Candidate gene selection for the chip resulted in the inclusionof 34 131 SNP markers within 3543 genes and intergenicregions (� 2 kb up- or downstream from the longest transcript)across the genome. Genotyping was carried out as described by
Geraldes et al. (2013) and array hybridizations performed atOak Ridge National Laboratory (ORNL, TN). Genotype callswere filtered with GenomeStudio v2010.3 (http://support.illu-mina.com/array/array_software/genomestudio.ilmn).
Only SNPs with GenTrain score ≥ 0.5 and genotypes withGenCall score ≥ 0.15 were exported, criteria maximizing geno-type call accuracy while minimizing missing data (Geraldes et al.,2013). We further excluded SNPs with minor allele frequency< 0.05 and call rate < 0.9. Following this filtering process, weused 29 355 SNPs representing 3518 genes for associations. Eachsignificant trait-associated SNP identified by GWAS was visuallyinspected for quality using the corresponding clustering plot
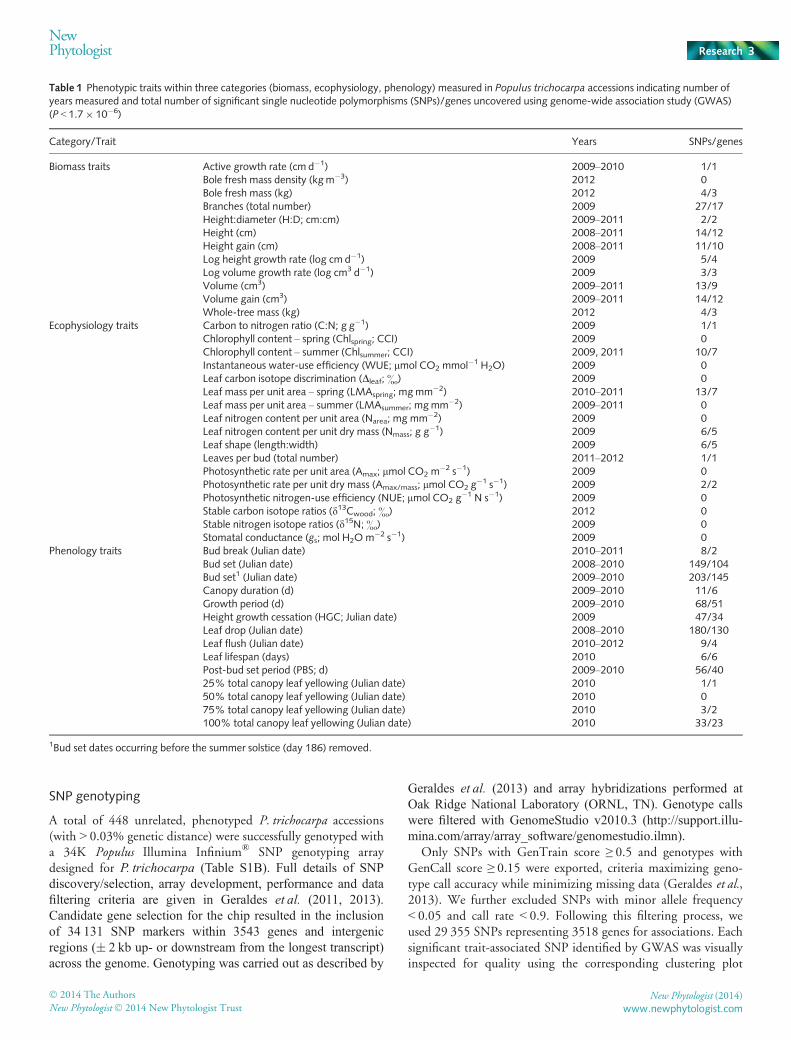
Table 1 Phenotypic traits within three categories (biomass, ecophysiology, phenology) measured in Populus trichocarpa accessions indicating number ofyears measured and total number of significant single nucleotide polymorphisms (SNPs)/genes uncovered using genome-wide association study (GWAS)(P < 1.79 10�6)
Category/Trait Years SNPs/genes
Biomass traits Active growth rate (cm d�1) 2009–2010 1/1Bole fresh mass density (kgm�3) 2012 0Bole fresh mass (kg) 2012 4/3Branches (total number) 2009 27/17Height:diameter (H:D; cm:cm) 2009–2011 2/2Height (cm) 2008–2011 14/12Height gain (cm) 2008–2011 11/10Log height growth rate (log cm d�1) 2009 5/4Log volume growth rate (log cm3 d�1) 2009 3/3Volume (cm3) 2009–2011 13/9Volume gain (cm3) 2009–2011 14/12Whole-tree mass (kg) 2012 4/3
Ecophysiology traits Carbon to nitrogen ratio (C:N; g g�1) 2009 1/1Chlorophyll content – spring (Chlspring; CCI) 2009 0Chlorophyll content – summer (Chlsummer; CCI) 2009, 2011 10/7Instantaneous water-use efficiency (WUE; lmol CO2 mmol�1 H2O) 2009 0Leaf carbon isotope discrimination (Dleaf;&) 2009 0Leaf mass per unit area – spring (LMAspring; mgmm�2) 2010–2011 13/7Leaf mass per unit area – summer (LMAsummer; mgmm�2) 2009–2011 0Leaf nitrogen content per unit area (Narea; mg mm�2) 2009 0Leaf nitrogen content per unit dry mass (Nmass; g g�1) 2009 6/5Leaf shape (length:width) 2009 6/5Leaves per bud (total number) 2011–2012 1/1Photosynthetic rate per unit area (Amax; lmol CO2 m
�2 s�1) 2009 0Photosynthetic rate per unit dry mass (Amax/mass; lmol CO2 g
�1 s�1) 2009 2/2Photosynthetic nitrogen-use efficiency (NUE; lmol CO2 g
�1 N s�1) 2009 0Stable carbon isotope ratios (d13Cwood;&) 2012 0Stable nitrogen isotope ratios (d15N;&) 2009 0Stomatal conductance (gs; mol H2O m�2 s�1) 2009 0
Phenology traits Bud break (Julian date) 2010–2011 8/2Bud set (Julian date) 2008–2010 149/104Bud set1 (Julian date) 2009–2010 203/145Canopy duration (d) 2009–2010 11/6Growth period (d) 2009–2010 68/51Height growth cessation (HGC; Julian date) 2009 47/34Leaf drop (Julian date) 2008–2010 180/130Leaf flush (Julian date) 2010–2012 9/4Leaf lifespan (days) 2010 6/6Post-bud set period (PBS; d) 2009–2010 56/4025% total canopy leaf yellowing (Julian date) 2010 1/150% total canopy leaf yellowing (Julian date) 2010 075% total canopy leaf yellowing (Julian date) 2010 3/2100% total canopy leaf yellowing (Julian date) 2010 33/23
1Bud set dates occurring before the summer solstice (day 186) removed.
� 2014 The Authors
New Phytologist� 2014 New Phytologist TrustNew Phytologist (2014)
www.newphytologist.com
NewPhytologist Research 3
(GenomeStudio v2010.3). The ‘Nisqually-1’ genome sequenceP. trichocarpa v2.2 SNP positions and gene models described inGeraldes et al. (2013) were translated into v3.0 positions byaligning sequences flanking the SNP with the latest Populus refer-ence genome assembly on Phytozome 9.1 (http://www.phyto-zome.net/).
Population structure analysis
We evaluated the effects of genetic structure within our popula-tion using the Unified Mixed Model framework (Balding, 2006;Yu et al., 2006) and compared log likelihood values betweenmodels with the Bayesian Information Criterion (BIC) (Yu et al.,2006). We assessed a number of options for population structurefit on a trait-by-trait basis. We constructed family relatednessusing a kinship (K) model and population structure using a prin-cipal component analysis (P) model or a clustering matrix (Q)model. We also calculated combinations of structures (P +K,Q +K), and a ‘simple’ model (i.e. simple linear regression with-out any additional correction).
SNPs used for population and kinship estimates were furtherfiltered for Hardy-Weinberg Equilibrium using the ‘Chisq’function in the R package ‘HardyWeinberg’ (Graffelman &Morales, 2008) and for linkage disequilibrium (LD) at r2 < 0.2(Wang et al., 2009). Following these filtering criteria, 8749SNPs (distributed throughout the genome) were used to fit allmodel analyses. The K model was calculated following Loiselleet al. (1995) and the relationship matrix was estimated by firstmultiplying the kinship matrix by two, then setting diagonalelements as one and negative off-diagonal elements as zero (Yuet al., 2006). The ‘nearPD’ function implemented in the Rpackage ‘Matrix’ (Higham, 2002) was used to obtain thepositive definite relationship matrix required in the mixedmodel framework. The P model was done using the ‘prcomp’function implemented in the base R package (R Core Develop-ment Team, 2011) and significant principal components (PC)were selected according to the broken-stick rule (Jackson, 1993)implemented in the R package ‘vegan’. Within our population,only PC1 was significant. The parametric clustering model-based inference (Q matrix) was performed using the R package‘popgen’ (Marchini, 2013) which implements both the uncorre-lated allele frequency model of STRUCTURE (Pritchard et al.,2000) when using the function ‘ps’, and the correlated allele fre-quency model (Falush et al., 2003) by using the function ‘ps’and ‘popdiv’ in conjunction. The number of populations testedranged from K = 1 to K = 10 populations. Both the burn-inperiod and the number of sampling iterations after the burn-inperiod were set to 60 000, and thinning was set at the default(1). For each scenario (K), 20 runs were performed to obtainboth mean and standard deviation for the log likelihood valueto construct a delta coefficient for the most probable number ofpopulations (Evanno et al., 2005). While the uncorrelated allelefrequency model did not detect any population structure (i.e.no peak appeared indicating the best fit was reached in the sce-nario considering K = 1, results confirmed with GENELAND;Guillot et al., 2005), the correlated allele frequency model
detected K = 5. We used the K = 5 cluster results from the corre-lated allele frequency for the Q matrix in our GWAS.
We evaluated the model fit on a trait-by-trait basis using theBayesian Information Criterion (BIC) where the lowest BICvalue indicates the best model fit. Among all studied traits, BICselected the simple, P or Q models depending on the trait (TableS2). In no case was the kinship (K) component within the K,P + K or Q +K models considered the best fit for the data struc-ture. This lack of importance of the K component confirmed theabsence of familial relatedness within the study population (seealso La Mantia et al., 2013; Porth et al., 2013a). By comparison,QQ plots (i.e. the ranking of observed P-values from smallest tohighest against the expected values) showed that inclusion of theK component generated a uniform distribution of P-values (sim-ply reflecting the tested null hypothesis that no marker is a causalvariant) and indicated a substantial decrease in the power todetect true positives (Figs S1–S3). We consider this result likelyto be related to the presence of linkage between the actual truepositives and other SNPs due to dense SNP coverage, rather thanto the confounding effect of population structure in our sampleset (Pearson & Manolio, 2008). In such a case, the QQ plot mayfail to identify the real source of deviation from the null hypothe-sis and thus risks exaggerating confounding factors resulting in anexcess of false-negatives.
Association genetics
We used the GLM procedure implemented in TASSEL (Brad-bury et al., 2007) to perform the association analysis as follows:
y ¼ lþ Saþ Xbþ e Eqn 1
(y, vector of measurements; l, overall population mean; S and X,index matrices assigning fixed effects for both SNP genotype andpopulation to the measurements, respectively; a and b, vectors offixed effects for both SNP genotype and population, respectively;e, residual effect). Following the GWAS, we used Bonferronimultiple testing correction (a/29 355) rather than the false dis-covery rate (FDR) correction owing to nonindependence of thetests where test statistics were correlated due to LD between SNPsused in the array (cf. Schwartzman & Lin, 2011). We consideredSNP–trait associations significant at a = 0.05/29 355 whereP < 1.79 10�6 and report these. As subsidiary signal, we alsoincluded trait associations at a = 0.1/29 355 whereP < 3.49 10�6 in the Supporting Information if the SNP inquestion was already considered significant by association toanother trait at the lower cut-off of P < 1.79 10�6. Compositepairwise LD between all significant trait-associated SNPs wascalculated based on genotype correlations (Weir et al., 2004).
Cumulative R2 of significant SNPs
In order to address the total phenotypic variance accounted forby all trait-associated SNPs on a trait-by-trait basis, we calculateda ‘cumulative R2’ metric. These values were obtained by the dif-ference in R2 between full and reduced models (Ingvarsson et al.,
New Phytologist (2014) � 2014 The Authors
New Phytologist� 2014 New Phytologist Trustwww.newphytologist.com
Research
NewPhytologist4
2008). The full model comprises all significant SNPs detectedby GWAS for the trait in question and population structure(as selected by BIC, see ‘Population structure analysis’ above)while the reduced model contains only population structure.Analysis was performed using the ‘glm’ function and R2 valueswere extracted using the ‘RsquareAdj’ function implemented inthe R package ‘vegan’ (Peres-Neto et al., 2006). We then repeatedthis test using P < 3.49 10�6 to include our subsidiary SNPassociation information (see above).
Genetic correlations between phenotypic traits
In order to confirm that trait correlation was not solely responsi-ble for detection of potential functional pleiotropy, we assessedthe pairwise genetic correlations of all traits to identify a commongenetic basis for independent variation (Porth et al., 2013b).These genetic correlations are ‘broad-sense’ (i.e. using phenotypetrait data from all clonal replicates) and based on clonal best lin-ear unbiased predictions (BLUPs) using PC1 from the PCA forstructure correction (McKown et al., 2014). The broad-sensegenetic correlation matrix was performed using the ‘cor’ functionin the ‘stats’ R package and Pearson product-moment correla-tions were estimated following:
rGx ;y ¼Covgxgyffiffiffiffiffiffiffiffiffiffiffiffiffiffiffiffiffiffiffiffiffiffiffiffiffiffi
Vargx � Vargyp Eqn 2
(Covgxgy, covariance between clonal BLUPs of traits x and y;Vargx, variance in clonal BLUPs for trait x; Vargy,variance inclonal BLUPs for trait y). The clonal breeding values wereobtained from linear mixed model results presented in McKownet al. (2014).
Tests for Gene Ontology enrichment
All genes uncovered by GWAS were tested for Gene Ontology(GO) enrichment using ‘function’ and ‘process’ categorizationsagainst the available genes from the SNP array (i.e. genesincluded in GWAS following SNP filtering). We tested all genes,and subgroupings of genes based on individual trait categories orgroupings of categories. Significant GO terms were determinedwith GOTermFinder software (http://go.princeton.edu/cgi-bin/GOTermFinder) using FDR correction for multiple comparisons(Boyle et al., 2004).
Results
SNP discovery through GWAS
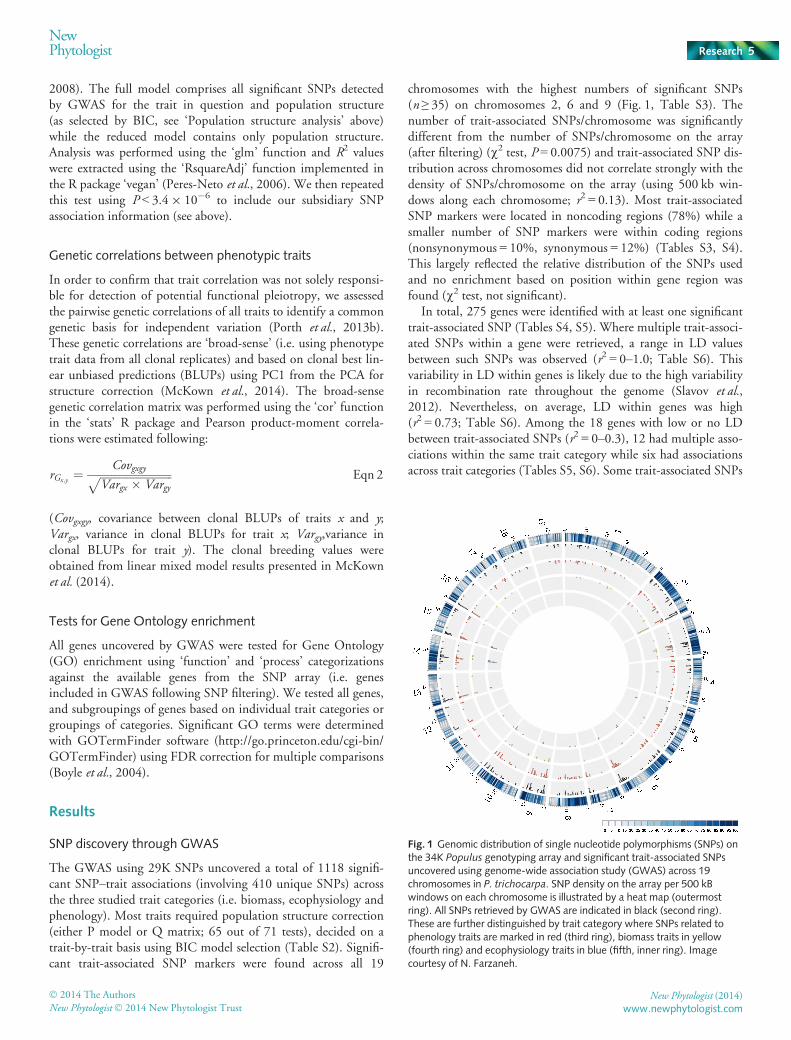
The GWAS using 29K SNPs uncovered a total of 1118 signifi-cant SNP–trait associations (involving 410 unique SNPs) acrossthe three studied trait categories (i.e. biomass, ecophysiology andphenology). Most traits required population structure correction(either P model or Q matrix; 65 out of 71 tests), decided on atrait-by-trait basis using BIC model selection (Table S2). Signifi-cant trait-associated SNP markers were found across all 19
chromosomes with the highest numbers of significant SNPs(n ≥ 35) on chromosomes 2, 6 and 9 (Fig. 1, Table S3). Thenumber of trait-associated SNPs/chromosome was significantlydifferent from the number of SNPs/chromosome on the array(after filtering) (v2 test, P = 0.0075) and trait-associated SNP dis-tribution across chromosomes did not correlate strongly with thedensity of SNPs/chromosome on the array (using 500 kb win-dows along each chromosome; r2 = 0.13). Most trait-associatedSNP markers were located in noncoding regions (78%) while asmaller number of SNP markers were within coding regions(nonsynonymous = 10%, synonymous = 12%) (Tables S3, S4).This largely reflected the relative distribution of the SNPs usedand no enrichment based on position within gene region wasfound (v2 test, not significant).
In total, 275 genes were identified with at least one significanttrait-associated SNP (Tables S4, S5). Where multiple trait-associ-ated SNPs within a gene were retrieved, a range in LD valuesbetween such SNPs was observed (r2 = 0–1.0; Table S6). Thisvariability in LD within genes is likely due to the high variabilityin recombination rate throughout the genome (Slavov et al.,2012). Nevertheless, on average, LD within genes was high(r2 = 0.73; Table S6). Among the 18 genes with low or no LDbetween trait-associated SNPs (r2 = 0–0.3), 12 had multiple asso-ciations within the same trait category while six had associationsacross trait categories (Tables S5, S6). Some trait-associated SNPs
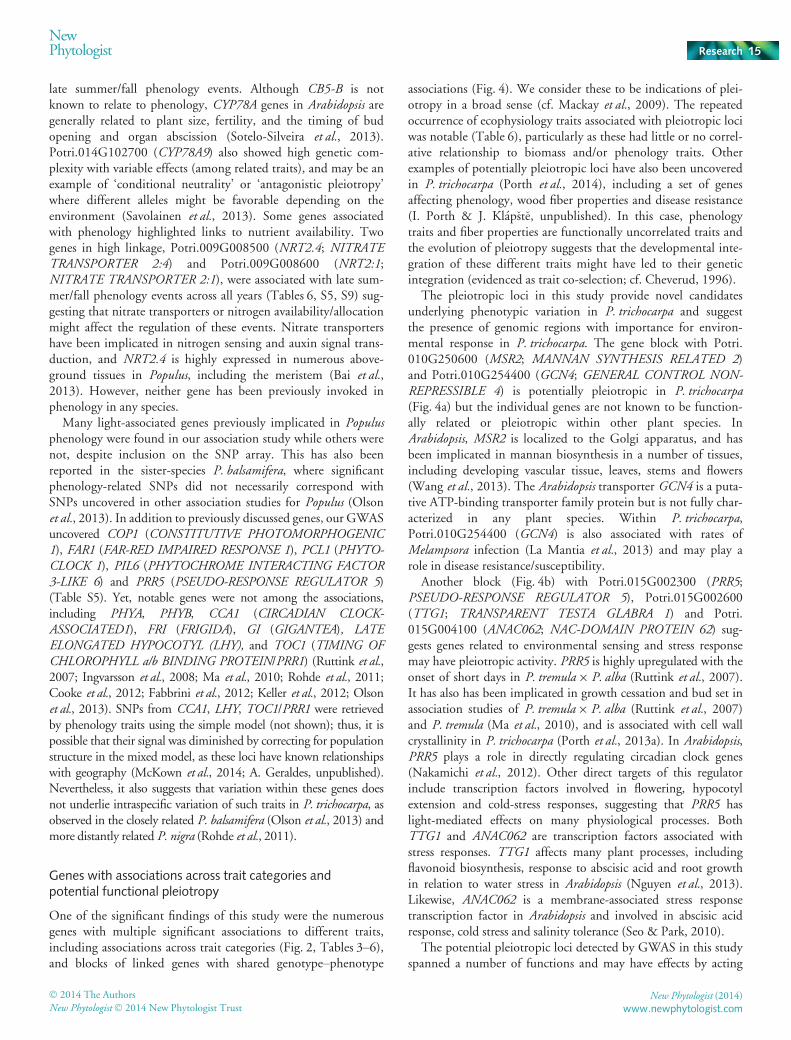
Fig. 1 Genomic distribution of single nucleotide polymorphisms (SNPs) onthe 34K Populus genotyping array and significant trait-associated SNPsuncovered using genome-wide association study (GWAS) across 19chromosomes in P. trichocarpa. SNP density on the array per 500 kBwindows on each chromosome is illustrated by a heat map (outermostring). All SNPs retrieved by GWAS are indicated in black (second ring).These are further distinguished by trait category where SNPs related tophenology traits are marked in red (third ring), biomass traits in yellow(fourth ring) and ecophysiology traits in blue (fifth, inner ring). Imagecourtesy of N. Farzaneh.
� 2014 The Authors
New Phytologist� 2014 New Phytologist TrustNew Phytologist (2014)
www.newphytologist.com
NewPhytologist Research 5
located in different genes but within the same genomic regionsalso showed moderate to complete linkage (r2 = 0.35–1.0; TableS6). Among these, two genomic regions had multiple associationswithin the same trait category while four had associations acrosstrait categories.
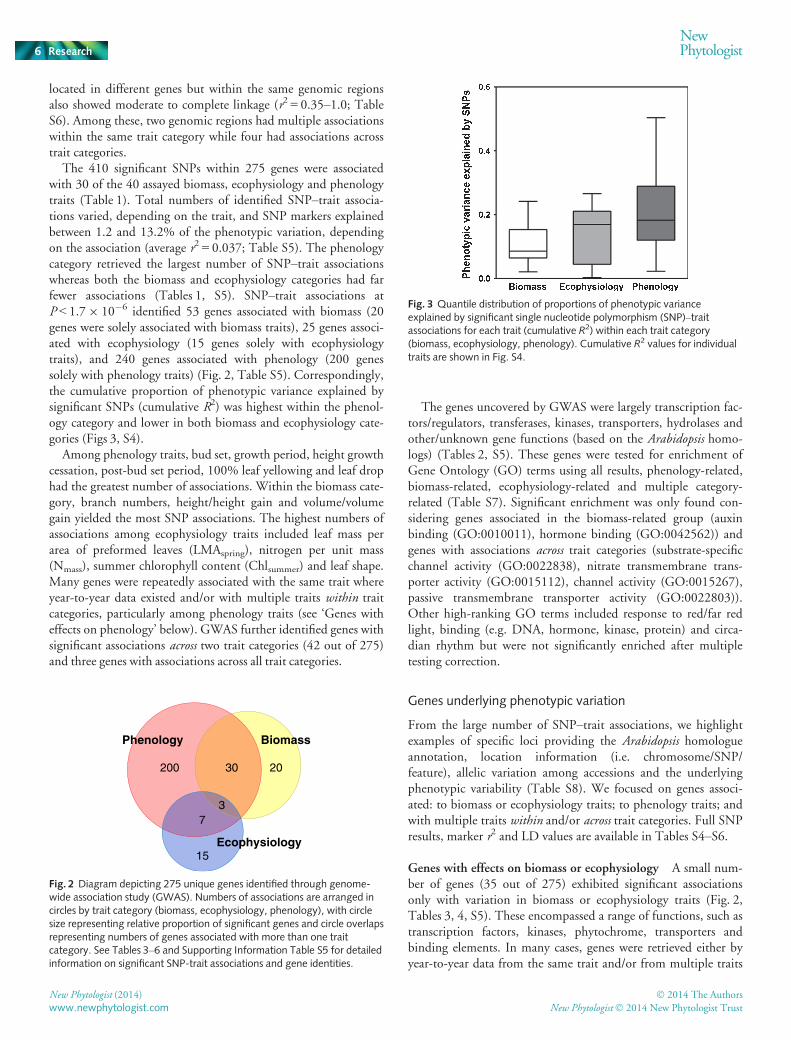
The 410 significant SNPs within 275 genes were associatedwith 30 of the 40 assayed biomass, ecophysiology and phenologytraits (Table 1). Total numbers of identified SNP–trait associa-tions varied, depending on the trait, and SNP markers explainedbetween 1.2 and 13.2% of the phenotypic variation, dependingon the association (average r2 = 0.037; Table S5). The phenologycategory retrieved the largest number of SNP–trait associationswhereas both the biomass and ecophysiology categories had farfewer associations (Tables 1, S5). SNP–trait associations atP < 1.79 10�6 identified 53 genes associated with biomass (20genes were solely associated with biomass traits), 25 genes associ-ated with ecophysiology (15 genes solely with ecophysiologytraits), and 240 genes associated with phenology (200 genessolely with phenology traits) (Fig. 2, Table S5). Correspondingly,the cumulative proportion of phenotypic variance explained bysignificant SNPs (cumulative R2) was highest within the phenol-ogy category and lower in both biomass and ecophysiology cate-gories (Figs 3, S4).
Among phenology traits, bud set, growth period, height growthcessation, post-bud set period, 100% leaf yellowing and leaf drophad the greatest number of associations. Within the biomass cate-gory, branch numbers, height/height gain and volume/volumegain yielded the most SNP associations. The highest numbers ofassociations among ecophysiology traits included leaf mass perarea of preformed leaves (LMAspring), nitrogen per unit mass(Nmass), summer chlorophyll content (Chlsummer) and leaf shape.Many genes were repeatedly associated with the same trait whereyear-to-year data existed and/or with multiple traits within traitcategories, particularly among phenology traits (see ‘Genes witheffects on phenology’ below). GWAS further identified genes withsignificant associations across two trait categories (42 out of 275)and three genes with associations across all trait categories.
The genes uncovered by GWAS were largely transcription fac-tors/regulators, transferases, kinases, transporters, hydrolases andother/unknown gene functions (based on the Arabidopsis homo-logs) (Tables 2, S5). These genes were tested for enrichment ofGene Ontology (GO) terms using all results, phenology-related,biomass-related, ecophysiology-related and multiple category-related (Table S7). Significant enrichment was only found con-sidering genes associated in the biomass-related group (auxinbinding (GO:0010011), hormone binding (GO:0042562)) andgenes with associations across trait categories (substrate-specificchannel activity (GO:0022838), nitrate transmembrane trans-porter activity (GO:0015112), channel activity (GO:0015267),passive transmembrane transporter activity (GO:0022803)).Other high-ranking GO terms included response to red/far redlight, binding (e.g. DNA, hormone, kinase, protein) and circa-dian rhythm but were not significantly enriched after multipletesting correction.
Genes underlying phenotypic variation
From the large number of SNP–trait associations, we highlightexamples of specific loci providing the Arabidopsis homologueannotation, location information (i.e. chromosome/SNP/feature), allelic variation among accessions and the underlyingphenotypic variability (Table S8). We focused on genes associ-ated: to biomass or ecophysiology traits; to phenology traits; andwith multiple traits within and/or across trait categories. Full SNPresults, marker r2 and LD values are available in Tables S4–S6.
Genes with effects on biomass or ecophysiology A small num-ber of genes (35 out of 275) exhibited significant associationsonly with variation in biomass or ecophysiology traits (Fig. 2,Tables 3, 4, S5). These encompassed a range of functions, such astranscription factors, kinases, phytochrome, transporters andbinding elements. In many cases, genes were retrieved either byyear-to-year data from the same trait and/or from multiple traits
15
200 20
73
30
Ecophysiology
Phenology Biomass
Fig. 2 Diagram depicting 275 unique genes identified through genome-wide association study (GWAS). Numbers of associations are arranged incircles by trait category (biomass, ecophysiology, phenology), with circlesize representing relative proportion of significant genes and circle overlapsrepresenting numbers of genes associated with more than one traitcategory. See Tables 3–6 and Supporting Information Table S5 for detailedinformation on significant SNP-trait associations and gene identities.
Fig. 3 Quantile distribution of proportions of phenotypic varianceexplained by significant single nucleotide polymorphism (SNP)–traitassociations for each trait (cumulative R2) within each trait category(biomass, ecophysiology, phenology). Cumulative R2 values for individualtraits are shown in Fig. S4.
New Phytologist (2014) � 2014 The Authors
New Phytologist� 2014 New Phytologist Trustwww.newphytologist.com
Research
NewPhytologist6
in the same category. Within the biomass-related category,Potri.010G250500 (protein binding EXO70G1; EXOCYSTSUBUNIT EXO70 FAMILY PROTEIN G1) was associated withactive growth rate, height (2009–2011), and bole and whole-treemass (Table 3). Effects of the SNP (10_22286918; intergenic)linked the common allele with substantially greater biomass over-all. Without any apparent geographic pattern, accessions homo-zygous for the common allele were 39% taller (each year) andhad greater bole and whole tree mass (76% and 89%, respec-tively) compared to the minor homozygotes, with heterozygousaccessions being intermediate compared to both homozygotes(Table S8). Among the genes uncovered within the ecophysiol-ogy category, leaf N content (Nmass) and the correlated C : Nratio were associated with Potri.010G221600 (EMB1144;EMBRYO DEFECTIVE 1144 chorismate synthase) (Table 4).
Accessions homozygous for the minor allele (SNP 10_20651512;30UTR) had 14% lower Nmass and 1.29 greater C : N ratio com-pared to the other accessions, but no difference was observedcomparing heterozygotes with homozygotes of the major allele(Table S8). Another gene, Potri.011G024000 (SPK1; SPIKE1),was associated with maximum photosynthetic rate per unit mass(Amax/mass) (Table 4). Allelic effects of the SNP (11_2007822;intron) linked the minor homozygotes with 22% higher photo-synthesis than the major homozygotes, and heterozygotes withhaving intermediate trait values (Table S8).
Genes with effects on phenology The majority of genes uncov-ered by GWAS had SNPs associated with phenology traits(Fig. 2, Tables 5, S5). Genes ranged in function, including cyto-chromes, hydrolases, ion binding/transport, transcription factors/regulators and transferases. Many encoded proteins putativelyrelated to light perception, photoperiod and/or circadian rhythm,or were phytohormone-related/response proteins (involving auxin,cytokinin, gibberellin, abscisic acid, and ethylene). Numerousgenes were repeatedly associated with phenology traits acrossdifferent years (Tables 5, 6, S5). Among 89 genes associated withphenology traits measured over multiple years, 80 genes werefound to be associated with the same trait in at least 2 yr. In addi-tion, we found 13 genes with associations to the same trait inmultiple years just below our stringent cutoff criteria(P < 3.49 10�6). Similarly, GWAS uncovered 185 genes withassociations to 2–7 different phenology traits, and an additional15 genes had multiple phenology trait associations detected justbelow our stringent cutoff criteria (P < 3.49 10�6). Analysesusing all bud set dates available for the population vs removingpremature bud set dates occurring before the solstice (i.e. budset1) largely resulted in the same SNP–trait associations; however,a handful of genes were found only using bud set1.
Relating to light perception, Potri.010G215200 (PRR7;PSEUDO-RESPONSE REGULATOR 7 transcription regulator),was associated with fall phenology events of bud set (2008–2010), growth period, height growth cessation and leaf drop(Table 5). Allelic effects of the SNP (10_202495; codingsequence, nonsynonymous) linked the minor homozygote acces-sions with earlier height growth cessation, bud set and leaf drop(32, 36 and 23 d, respectively) and correspondingly shortergrowth period (51 d) compared to the major homozygotes,with the heterozygous state intermediate to both homozygotes(Table S8). Among the phytohormone-related genes, Potri.018G033600 (GA3OX1; GIBBERELLIN 3-OXIDASE 1) waslinked with multiple phenology traits. A single SNP(18_2683640; intergenic) was associated with bud set (2008–2010), growth period (2009–2010), height growth cessation,post-bud set period and leaf drop (Table 5). The minorhomozygotes showed later height growth cessation, bud set andleaf drop (25, 31, and 31 d, respectively) resulting in a longergrowth period (44 d) and shorter post-bud set period(28 d) compared to the major homozygotes with the heterozy-gous state intermediate to both homozygotes (Table S8).Transcription factor Potri.009G017400 (BLH1; BEL1-LIKEHOMEODOMAIN 1) was associated with bud set (2009–2010),
Table 2 General functional classifications of genes identified by genome-wide association study (GWAS) with significant single nucleotidepolymorphism (SNP) markers associated to growth, ecophysiology andphenology traits
Putative function1 Number2
Actin-related3 3Apoptosis 1Aquaporin3 3Binding - other3 8Calmodulin3 4Cell division 1Cell wall metabolism 7Cytochrome3 4Cytoskeleton3 4Dehydratase/dehydrogenase 8DNA repair 1Hydrolase 12Ion binding 8Ion transporter3 8Kinase3 15Laccase3 3Ligase3 6Membrane3 4Other3,4 27Oxygenase/oxidase 5Peroxidase3 1Phosphatase 3Phytochrome 1Phytohormone 4Protease3 5Protein binding4 8Ribosome 1RNA binding 2Senescence 2Transcription factor/regulator3,4 62Transferase3 20Transporter3 9Unknown3 20Zinc finger3 5
1Functional gene prediction based on Geraldes et al. (2013).2Number of genes with SNPs associated with trait variation. Full details aregiven in Table S5.3Includes genes with associations across two trait categories.4Includes genes with associations across three trait categories.
� 2014 The Authors
New Phytologist� 2014 New Phytologist TrustNew Phytologist (2014)
www.newphytologist.com
NewPhytologist Research 7
growth period, post-bud set period, leaf yellowing and leaf drop(2008,10) (Table 5). Both significant SNP markers(09_2874013; coding sequence, synonymous/09_2874898;intron) are in high pairwise LD (r2 = 0.95). The double minorhomozygote accessions had earlier bud set, canopy yellowing andleaf drop (22, 17, and 12 d, respectively), and subsequentlyshorter growth period (26 d) and longer post-bud set period(18 d) compared to the double major homozygote accessions(Table S8). The common heterozygote had equivalent traitvalues to the double major homozygote, while the less common
heterozygote (6 trees total) showed trait values similar to the dou-ble minor homozygote.
Individual genes with effects across trait categories GWASidentified 40 genes with SNPs associated with variation in twotrait categories, and three genes with SNPs associated across alltrait categories (Fig. 2, Tables 6, S5). All genes with multiple traitcategory effects had associations to phenology events, particularlybud set and leaf drop. One example, Potri.001G057400 (HK3;HISTIDINE KINASE 3 cytokinin receptor) was associated with
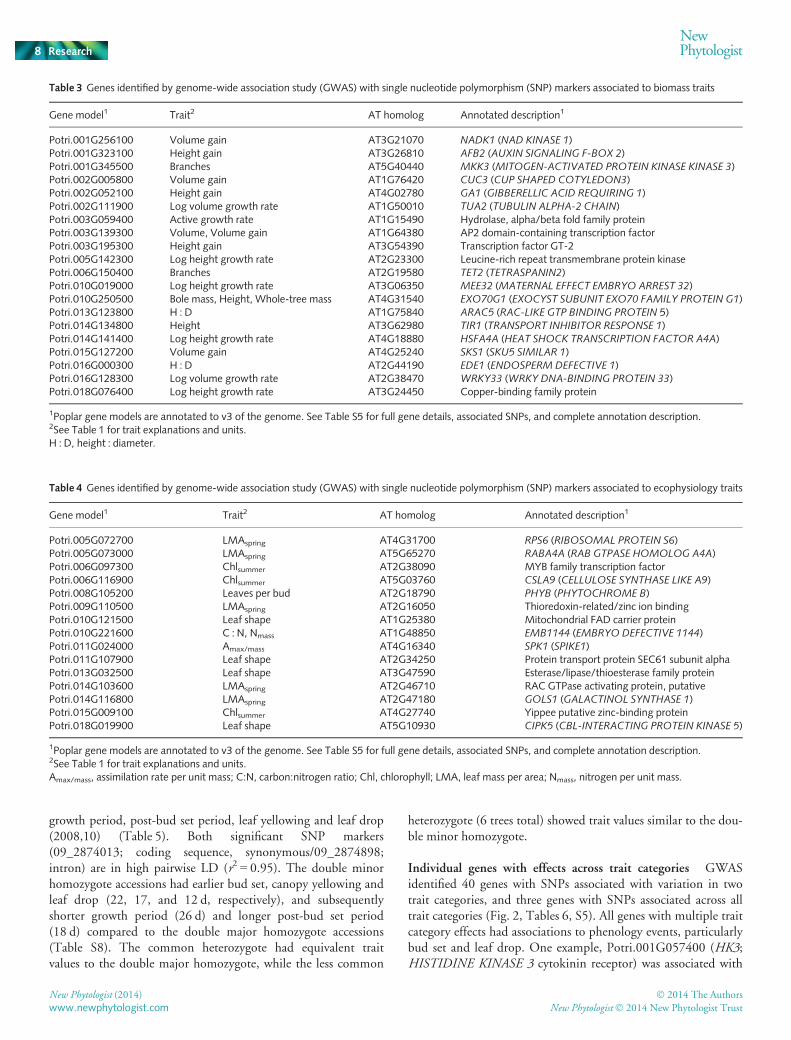
Table 3 Genes identified by genome-wide association study (GWAS) with single nucleotide polymorphism (SNP) markers associated to biomass traits
Gene model1 Trait2 AT homolog Annotated description1
Potri.001G256100 Volume gain AT3G21070 NADK1 (NAD KINASE 1)Potri.001G323100 Height gain AT3G26810 AFB2 (AUXIN SIGNALING F-BOX 2)Potri.001G345500 Branches AT5G40440 MKK3 (MITOGEN-ACTIVATED PROTEIN KINASE KINASE 3)Potri.002G005800 Volume gain AT1G76420 CUC3 (CUP SHAPED COTYLEDON3)Potri.002G052100 Height gain AT4G02780 GA1 (GIBBERELLIC ACID REQUIRING 1)Potri.002G111900 Log volume growth rate AT1G50010 TUA2 (TUBULIN ALPHA-2 CHAIN)Potri.003G059400 Active growth rate AT1G15490 Hydrolase, alpha/beta fold family proteinPotri.003G139300 Volume, Volume gain AT1G64380 AP2 domain-containing transcription factorPotri.003G195300 Height gain AT3G54390 Transcription factor GT-2Potri.005G142300 Log height growth rate AT2G23300 Leucine-rich repeat transmembrane protein kinasePotri.006G150400 Branches AT2G19580 TET2 (TETRASPANIN2)Potri.010G019000 Log height growth rate AT3G06350 MEE32 (MATERNAL EFFECT EMBRYO ARREST 32)Potri.010G250500 Bole mass, Height, Whole-tree mass AT4G31540 EXO70G1 (EXOCYST SUBUNIT EXO70 FAMILY PROTEIN G1)Potri.013G123800 H : D AT1G75840 ARAC5 (RAC-LIKE GTP BINDING PROTEIN 5)Potri.014G134800 Height AT3G62980 TIR1 (TRANSPORT INHIBITOR RESPONSE 1)Potri.014G141400 Log height growth rate AT4G18880 HSFA4A (HEAT SHOCK TRANSCRIPTION FACTOR A4A)Potri.015G127200 Volume gain AT4G25240 SKS1 (SKU5 SIMILAR 1)Potri.016G000300 H : D AT2G44190 EDE1 (ENDOSPERM DEFECTIVE 1)Potri.016G128300 Log volume growth rate AT2G38470 WRKY33 (WRKY DNA-BINDING PROTEIN 33)Potri.018G076400 Log height growth rate AT3G24450 Copper-binding family protein
1Poplar gene models are annotated to v3 of the genome. See Table S5 for full gene details, associated SNPs, and complete annotation description.2See Table 1 for trait explanations and units.H : D, height : diameter.
Table 4 Genes identified by genome-wide association study (GWAS) with single nucleotide polymorphism (SNP) markers associated to ecophysiology traits
Gene model1 Trait2 AT homolog Annotated description1
Potri.005G072700 LMAspring AT4G31700 RPS6 (RIBOSOMAL PROTEIN S6)Potri.005G073000 LMAspring AT5G65270 RABA4A (RAB GTPASE HOMOLOG A4A)Potri.006G097300 Chlsummer AT2G38090 MYB family transcription factorPotri.006G116900 Chlsummer AT5G03760 CSLA9 (CELLULOSE SYNTHASE LIKE A9)Potri.008G105200 Leaves per bud AT2G18790 PHYB (PHYTOCHROME B)Potri.009G110500 LMAspring AT2G16050 Thioredoxin-related/zinc ion bindingPotri.010G121500 Leaf shape AT1G25380 Mitochondrial FAD carrier proteinPotri.010G221600 C : N, Nmass AT1G48850 EMB1144 (EMBRYO DEFECTIVE 1144)Potri.011G024000 Amax/mass AT4G16340 SPK1 (SPIKE1)Potri.011G107900 Leaf shape AT2G34250 Protein transport protein SEC61 subunit alphaPotri.013G032500 Leaf shape AT3G47590 Esterase/lipase/thioesterase family proteinPotri.014G103600 LMAspring AT2G46710 RAC GTPase activating protein, putativePotri.014G116800 LMAspring AT2G47180 GOLS1 (GALACTINOL SYNTHASE 1)Potri.015G009100 Chlsummer AT4G27740 Yippee putative zinc-binding proteinPotri.018G019900 Leaf shape AT5G10930 CIPK5 (CBL-INTERACTING PROTEIN KINASE 5)
1Poplar gene models are annotated to v3 of the genome. See Table S5 for full gene details, associated SNPs, and complete annotation description.2See Table 1 for trait explanations and units.Amax/mass, assimilation rate per unit mass; C:N, carbon:nitrogen ratio; Chl, chlorophyll; LMA, leaf mass per area; Nmass, nitrogen per unit mass.
New Phytologist (2014) � 2014 The Authors
New Phytologist� 2014 New Phytologist Trustwww.newphytologist.com
Research
NewPhytologist8
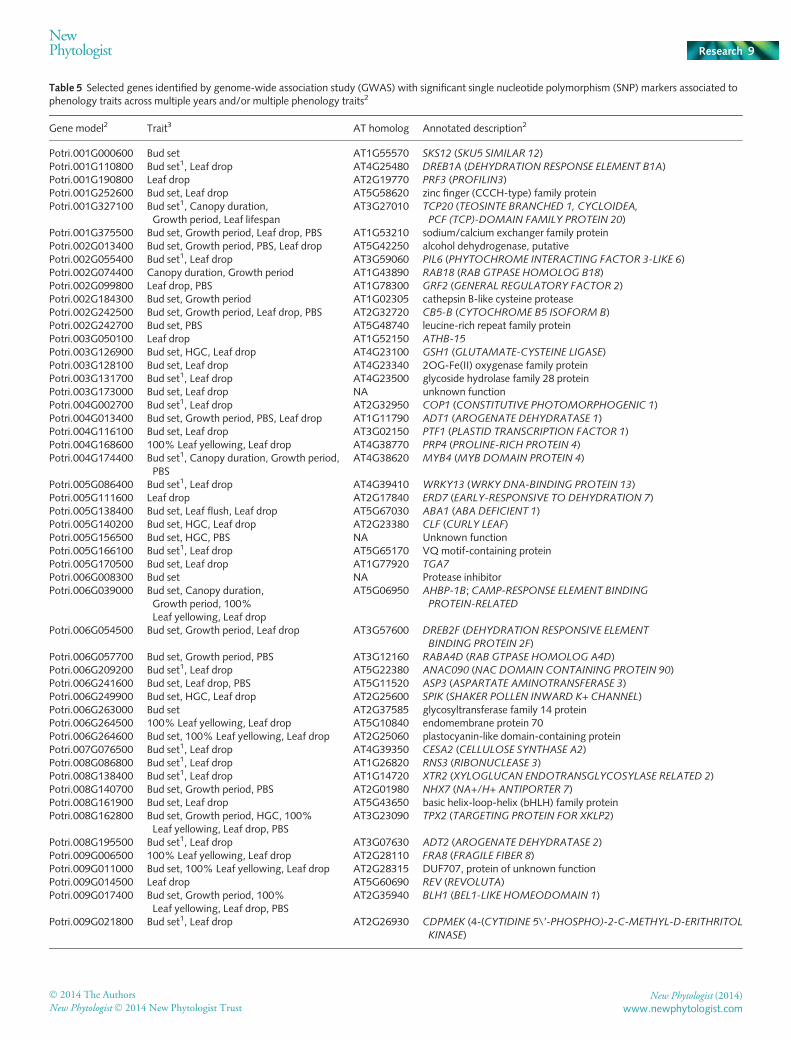
Table 5 Selected genes identified by genome-wide association study (GWAS) with significant single nucleotide polymorphism (SNP) markers associated tophenology traits across multiple years and/or multiple phenology traits2
Gene model2 Trait3 AT homolog Annotated description2
Potri.001G000600 Bud set AT1G55570 SKS12 (SKU5 SIMILAR 12)Potri.001G110800 Bud set1, Leaf drop AT4G25480 DREB1A (DEHYDRATION RESPONSE ELEMENT B1A)Potri.001G190800 Leaf drop AT2G19770 PRF3 (PROFILIN3)Potri.001G252600 Bud set, Leaf drop AT5G58620 zinc finger (CCCH-type) family proteinPotri.001G327100 Bud set1, Canopy duration,
Growth period, Leaf lifespanAT3G27010 TCP20 (TEOSINTE BRANCHED 1, CYCLOIDEA,
PCF (TCP)-DOMAIN FAMILY PROTEIN 20)Potri.001G375500 Bud set, Growth period, Leaf drop, PBS AT1G53210 sodium/calcium exchanger family proteinPotri.002G013400 Bud set, Growth period, PBS, Leaf drop AT5G42250 alcohol dehydrogenase, putativePotri.002G055400 Bud set1, Leaf drop AT3G59060 PIL6 (PHYTOCHROME INTERACTING FACTOR 3-LIKE 6)Potri.002G074400 Canopy duration, Growth period AT1G43890 RAB18 (RAB GTPASE HOMOLOG B18)Potri.002G099800 Leaf drop, PBS AT1G78300 GRF2 (GENERAL REGULATORY FACTOR 2)Potri.002G184300 Bud set, Growth period AT1G02305 cathepsin B-like cysteine proteasePotri.002G242500 Bud set, Growth period, Leaf drop, PBS AT2G32720 CB5-B (CYTOCHROME B5 ISOFORM B)Potri.002G242700 Bud set, PBS AT5G48740 leucine-rich repeat family proteinPotri.003G050100 Leaf drop AT1G52150 ATHB-15
Potri.003G126900 Bud set, HGC, Leaf drop AT4G23100 GSH1 (GLUTAMATE-CYSTEINE LIGASE)Potri.003G128100 Bud set, Leaf drop AT4G23340 2OG-Fe(II) oxygenase family proteinPotri.003G131700 Bud set1, Leaf drop AT4G23500 glycoside hydrolase family 28 proteinPotri.003G173000 Bud set, Leaf drop NA unknown functionPotri.004G002700 Bud set1, Leaf drop AT2G32950 COP1 (CONSTITUTIVE PHOTOMORPHOGENIC 1)Potri.004G013400 Bud set, Growth period, PBS, Leaf drop AT1G11790 ADT1 (AROGENATE DEHYDRATASE 1)Potri.004G116100 Bud set, Leaf drop AT3G02150 PTF1 (PLASTID TRANSCRIPTION FACTOR 1)Potri.004G168600 100% Leaf yellowing, Leaf drop AT4G38770 PRP4 (PROLINE-RICH PROTEIN 4)Potri.004G174400 Bud set1, Canopy duration, Growth period,
PBSAT4G38620 MYB4 (MYB DOMAIN PROTEIN 4)
Potri.005G086400 Bud set1, Leaf drop AT4G39410 WRKY13 (WRKY DNA-BINDING PROTEIN 13)Potri.005G111600 Leaf drop AT2G17840 ERD7 (EARLY-RESPONSIVE TO DEHYDRATION 7)Potri.005G138400 Bud set, Leaf flush, Leaf drop AT5G67030 ABA1 (ABA DEFICIENT 1)Potri.005G140200 Bud set, HGC, Leaf drop AT2G23380 CLF (CURLY LEAF)Potri.005G156500 Bud set, HGC, PBS NA Unknown functionPotri.005G166100 Bud set1, Leaf drop AT5G65170 VQ motif-containing proteinPotri.005G170500 Bud set, Leaf drop AT1G77920 TGA7Potri.006G008300 Bud set NA Protease inhibitorPotri.006G039000 Bud set, Canopy duration,
Growth period, 100%Leaf yellowing, Leaf drop
AT5G06950 AHBP-1B; CAMP-RESPONSE ELEMENT BINDING
PROTEIN-RELATED
Potri.006G054500 Bud set, Growth period, Leaf drop AT3G57600 DREB2F (DEHYDRATION RESPONSIVE ELEMENT
BINDING PROTEIN 2F)Potri.006G057700 Bud set, Growth period, PBS AT3G12160 RABA4D (RAB GTPASE HOMOLOG A4D)Potri.006G209200 Bud set1, Leaf drop AT5G22380 ANAC090 (NAC DOMAIN CONTAINING PROTEIN 90)Potri.006G241600 Bud set, Leaf drop, PBS AT5G11520 ASP3 (ASPARTATE AMINOTRANSFERASE 3)Potri.006G249900 Bud set, HGC, Leaf drop AT2G25600 SPIK (SHAKER POLLEN INWARD K+ CHANNEL)Potri.006G263000 Bud set AT2G37585 glycosyltransferase family 14 proteinPotri.006G264500 100% Leaf yellowing, Leaf drop AT5G10840 endomembrane protein 70Potri.006G264600 Bud set, 100% Leaf yellowing, Leaf drop AT2G25060 plastocyanin-like domain-containing proteinPotri.007G076500 Bud set1, Leaf drop AT4G39350 CESA2 (CELLULOSE SYNTHASE A2)Potri.008G086800 Bud set1, Leaf drop AT1G26820 RNS3 (RIBONUCLEASE 3)Potri.008G138400 Bud set1, Leaf drop AT1G14720 XTR2 (XYLOGLUCAN ENDOTRANSGLYCOSYLASE RELATED 2)Potri.008G140700 Bud set, Growth period, PBS AT2G01980 NHX7 (NA+/H+ ANTIPORTER 7)Potri.008G161900 Bud set, Leaf drop AT5G43650 basic helix-loop-helix (bHLH) family proteinPotri.008G162800 Bud set, Growth period, HGC, 100%
Leaf yellowing, Leaf drop, PBSAT3G23090 TPX2 (TARGETING PROTEIN FOR XKLP2)
Potri.008G195500 Bud set1, Leaf drop AT3G07630 ADT2 (AROGENATE DEHYDRATASE 2)Potri.009G006500 100% Leaf yellowing, Leaf drop AT2G28110 FRA8 (FRAGILE FIBER 8)Potri.009G011000 Bud set, 100% Leaf yellowing, Leaf drop AT2G28315 DUF707, protein of unknown functionPotri.009G014500 Leaf drop AT5G60690 REV (REVOLUTA)Potri.009G017400 Bud set, Growth period, 100%
Leaf yellowing, Leaf drop, PBSAT2G35940 BLH1 (BEL1-LIKE HOMEODOMAIN 1)
Potri.009G021800 Bud set1, Leaf drop AT2G26930 CDPMEK (4-(CYTIDINE 5\’-PHOSPHO)-2-C-METHYL-D-ERITHRITOL
KINASE)
� 2014 The Authors
New Phytologist� 2014 New Phytologist TrustNew Phytologist (2014)
www.newphytologist.com
NewPhytologist Research 9
leaf flush, bud set (2009–2010), growth period, height growthcessation, post-bud set period and height gain (Table 6). Alleliceffects of the SNP (01_4368872; intron) linked the minor ho-mozygotes accessions with earlier leaf flushing (6 d), later heightgrowth cessation and bud set (18, 24 d, respectively), longergrowth period (36 d), shorter post-bud set period (22 d), and cor-respondingly greater height gain (30%) compared to the majorhomozygote accessions (Table S8). The heterozygous state alsoshowed earlier leaf flushing (3 d) but other traits were equivalentto the major homozygotes.
Some genes had extensive complexity in both genetic variationand the resulting phenotype. Potri.014G102700 (CYP78A9;CYTOCHROME P450 78A9) had numerous SNPs associatedacross spring traits, including phenology events bud break(2010–2011), leaf flush (2010–2012) and the ecophysiology traitLMAspring (2010–2011) (Table 6). The six significant SNPs(14_8045578/14_8045889/14_8046287; intergenic, upstream;14_8047714; coding sequence, synonymous, 14_8048878/14_8049068; intergenic, downstream) are in moderate to highpairwise LD (average r2 = 0.47, range = 0.19–0.99) (Table S6).
Table 5 (Continued)
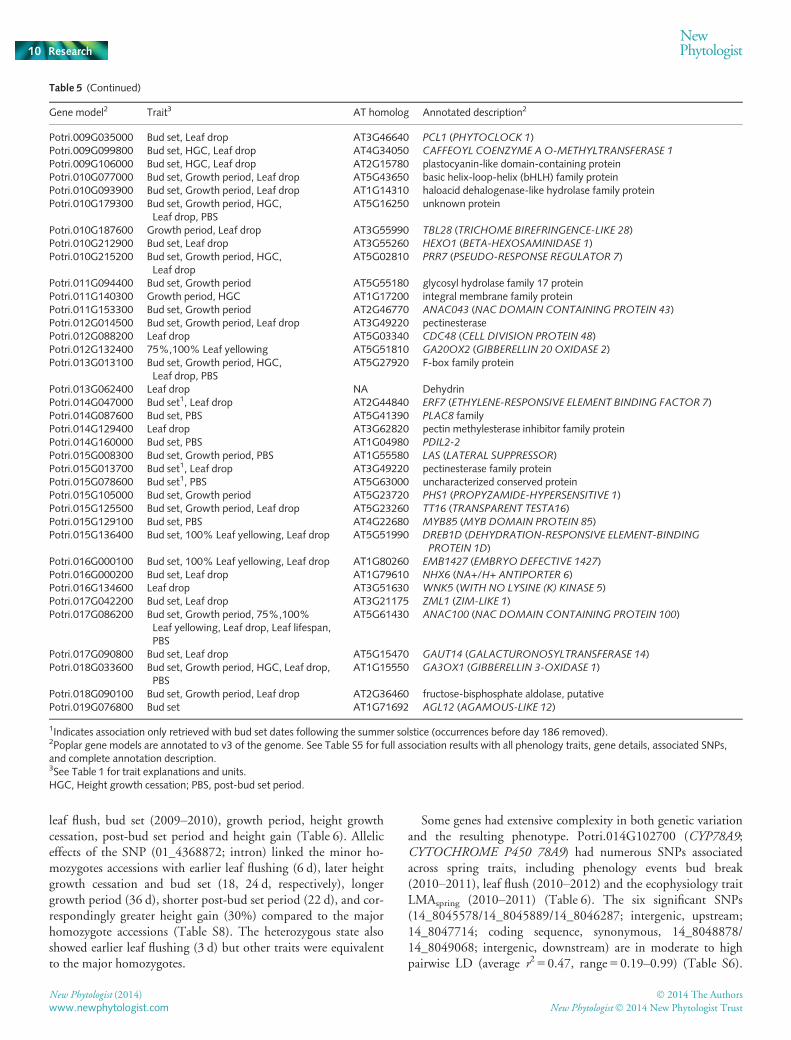
Gene model2 Trait3 AT homolog Annotated description2
Potri.009G035000 Bud set, Leaf drop AT3G46640 PCL1 (PHYTOCLOCK 1)Potri.009G099800 Bud set, HGC, Leaf drop AT4G34050 CAFFEOYL COENZYME A O-METHYLTRANSFERASE 1
Potri.009G106000 Bud set, HGC, Leaf drop AT2G15780 plastocyanin-like domain-containing proteinPotri.010G077000 Bud set, Growth period, Leaf drop AT5G43650 basic helix-loop-helix (bHLH) family proteinPotri.010G093900 Bud set, Growth period, Leaf drop AT1G14310 haloacid dehalogenase-like hydrolase family proteinPotri.010G179300 Bud set, Growth period, HGC,
Leaf drop, PBSAT5G16250 unknown protein
Potri.010G187600 Growth period, Leaf drop AT3G55990 TBL28 (TRICHOME BIREFRINGENCE-LIKE 28)Potri.010G212900 Bud set, Leaf drop AT3G55260 HEXO1 (BETA-HEXOSAMINIDASE 1)Potri.010G215200 Bud set, Growth period, HGC,
Leaf dropAT5G02810 PRR7 (PSEUDO-RESPONSE REGULATOR 7)
Potri.011G094400 Bud set, Growth period AT5G55180 glycosyl hydrolase family 17 proteinPotri.011G140300 Growth period, HGC AT1G17200 integral membrane family proteinPotri.011G153300 Bud set, Growth period AT2G46770 ANAC043 (NAC DOMAIN CONTAINING PROTEIN 43)Potri.012G014500 Bud set, Growth period, Leaf drop AT3G49220 pectinesterasePotri.012G088200 Leaf drop AT5G03340 CDC48 (CELL DIVISION PROTEIN 48)Potri.012G132400 75%,100% Leaf yellowing AT5G51810 GA20OX2 (GIBBERELLIN 20 OXIDASE 2)Potri.013G013100 Bud set, Growth period, HGC,
Leaf drop, PBSAT5G27920 F-box family protein
Potri.013G062400 Leaf drop NA DehydrinPotri.014G047000 Bud set1, Leaf drop AT2G44840 ERF7 (ETHYLENE-RESPONSIVE ELEMENT BINDING FACTOR 7)Potri.014G087600 Bud set, PBS AT5G41390 PLAC8 familyPotri.014G129400 Leaf drop AT3G62820 pectin methylesterase inhibitor family proteinPotri.014G160000 Bud set, PBS AT1G04980 PDIL2-2
Potri.015G008300 Bud set, Growth period, PBS AT1G55580 LAS (LATERAL SUPPRESSOR)Potri.015G013700 Bud set1, Leaf drop AT3G49220 pectinesterase family proteinPotri.015G078600 Bud set1, PBS AT5G63000 uncharacterized conserved proteinPotri.015G105000 Bud set, Growth period AT5G23720 PHS1 (PROPYZAMIDE-HYPERSENSITIVE 1)Potri.015G125500 Bud set, Growth period, Leaf drop AT5G23260 TT16 (TRANSPARENT TESTA16)Potri.015G129100 Bud set, PBS AT4G22680 MYB85 (MYB DOMAIN PROTEIN 85)Potri.015G136400 Bud set, 100% Leaf yellowing, Leaf drop AT5G51990 DREB1D (DEHYDRATION-RESPONSIVE ELEMENT-BINDING
PROTEIN 1D)Potri.016G000100 Bud set, 100% Leaf yellowing, Leaf drop AT1G80260 EMB1427 (EMBRYO DEFECTIVE 1427)Potri.016G000200 Bud set, Leaf drop AT1G79610 NHX6 (NA+/H+ ANTIPORTER 6)Potri.016G134600 Leaf drop AT3G51630 WNK5 (WITH NO LYSINE (K) KINASE 5)Potri.017G042200 Bud set, Leaf drop AT3G21175 ZML1 (ZIM-LIKE 1)Potri.017G086200 Bud set, Growth period, 75%,100%
Leaf yellowing, Leaf drop, Leaf lifespan,PBS
AT5G61430 ANAC100 (NAC DOMAIN CONTAINING PROTEIN 100)
Potri.017G090800 Bud set, Leaf drop AT5G15470 GAUT14 (GALACTURONOSYLTRANSFERASE 14)Potri.018G033600 Bud set, Growth period, HGC, Leaf drop,
PBSAT1G15550 GA3OX1 (GIBBERELLIN 3-OXIDASE 1)
Potri.018G090100 Bud set, Growth period, Leaf drop AT2G36460 fructose-bisphosphate aldolase, putativePotri.019G076800 Bud set AT1G71692 AGL12 (AGAMOUS-LIKE 12)
1Indicates association only retrieved with bud set dates following the summer solstice (occurrences before day 186 removed).2Poplar gene models are annotated to v3 of the genome. See Table S5 for full association results with all phenology traits, gene details, associated SNPs,and complete annotation description.3See Table 1 for trait explanations and units.HGC, Height growth cessation; PBS, post-bud set period.
New Phytologist (2014) � 2014 The Authors
New Phytologist� 2014 New Phytologist Trustwww.newphytologist.com
Research
NewPhytologist10
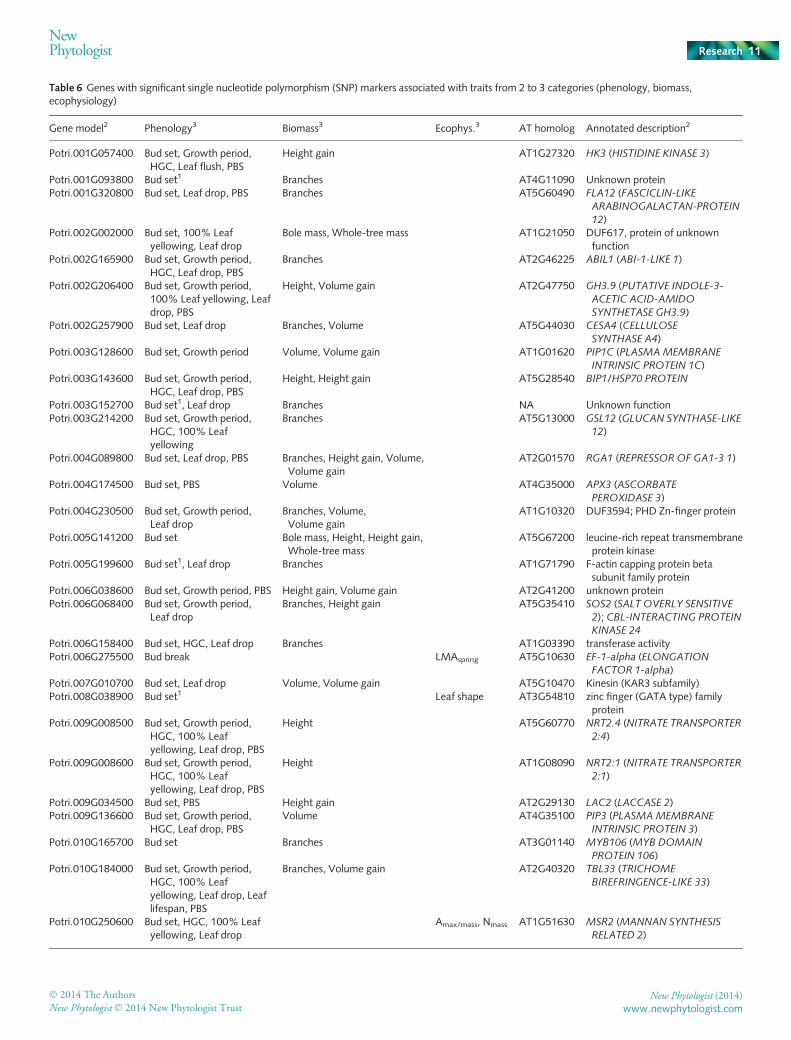
Table 6 Genes with significant single nucleotide polymorphism (SNP) markers associated with traits from 2 to 3 categories (phenology, biomass,ecophysiology)
Gene model2 Phenology3 Biomass3 Ecophys.3 AT homolog Annotated description2
Potri.001G057400 Bud set, Growth period,HGC, Leaf flush, PBS
Height gain AT1G27320 HK3 (HISTIDINE KINASE 3)
Potri.001G093800 Bud set1 Branches AT4G11090 Unknown proteinPotri.001G320800 Bud set, Leaf drop, PBS Branches AT5G60490 FLA12 (FASCICLIN-LIKE
ARABINOGALACTAN-PROTEIN
12)Potri.002G002000 Bud set, 100% Leaf
yellowing, Leaf dropBole mass, Whole-tree mass AT1G21050 DUF617, protein of unknown
functionPotri.002G165900 Bud set, Growth period,
HGC, Leaf drop, PBSBranches AT2G46225 ABIL1 (ABI-1-LIKE 1)
Potri.002G206400 Bud set, Growth period,100% Leaf yellowing, Leafdrop, PBS
Height, Volume gain AT2G47750 GH3.9 (PUTATIVE INDOLE-3-
ACETIC ACID-AMIDO
SYNTHETASE GH3.9)Potri.002G257900 Bud set, Leaf drop Branches, Volume AT5G44030 CESA4 (CELLULOSE
SYNTHASE A4)Potri.003G128600 Bud set, Growth period Volume, Volume gain AT1G01620 PIP1C (PLASMAMEMBRANE
INTRINSIC PROTEIN 1C)Potri.003G143600 Bud set, Growth period,
HGC, Leaf drop, PBSHeight, Height gain AT5G28540 BIP1/HSP70 PROTEIN
Potri.003G152700 Bud set1, Leaf drop Branches NA Unknown functionPotri.003G214200 Bud set, Growth period,
HGC, 100% Leafyellowing
Branches AT5G13000 GSL12 (GLUCAN SYNTHASE-LIKE12)
Potri.004G089800 Bud set, Leaf drop, PBS Branches, Height gain, Volume,Volume gain
AT2G01570 RGA1 (REPRESSOR OF GA1-3 1)
Potri.004G174500 Bud set, PBS Volume AT4G35000 APX3 (ASCORBATE
PEROXIDASE 3)Potri.004G230500 Bud set, Growth period,
Leaf dropBranches, Volume,Volume gain
AT1G10320 DUF3594; PHD Zn-finger protein
Potri.005G141200 Bud set Bole mass, Height, Height gain,Whole-tree mass
AT5G67200 leucine-rich repeat transmembraneprotein kinase
Potri.005G199600 Bud set1, Leaf drop Branches AT1G71790 F-actin capping protein betasubunit family protein
Potri.006G038600 Bud set, Growth period, PBS Height gain, Volume gain AT2G41200 unknown proteinPotri.006G068400 Bud set, Growth period,
Leaf dropBranches, Height gain AT5G35410 SOS2 (SALT OVERLY SENSITIVE
2); CBL-INTERACTING PROTEINKINASE 24
Potri.006G158400 Bud set, HGC, Leaf drop Branches AT1G03390 transferase activityPotri.006G275500 Bud break LMAspring AT5G10630 EF-1-alpha (ELONGATION
FACTOR 1-alpha)Potri.007G010700 Bud set, Leaf drop Volume, Volume gain AT5G10470 Kinesin (KAR3 subfamily)Potri.008G038900 Bud set1 Leaf shape AT3G54810 zinc finger (GATA type) family
proteinPotri.009G008500 Bud set, Growth period,
HGC, 100% Leafyellowing, Leaf drop, PBS
Height AT5G60770 NRT2.4 (NITRATE TRANSPORTER
2:4)
Potri.009G008600 Bud set, Growth period,HGC, 100% Leafyellowing, Leaf drop, PBS
Height AT1G08090 NRT2:1 (NITRATE TRANSPORTER2:1)
Potri.009G034500 Bud set, PBS Height gain AT2G29130 LAC2 (LACCASE 2)Potri.009G136600 Bud set, Growth period,
HGC, Leaf drop, PBSVolume AT4G35100 PIP3 (PLASMAMEMBRANE
INTRINSIC PROTEIN 3)Potri.010G165700 Bud set Branches AT3G01140 MYB106 (MYB DOMAIN
PROTEIN 106)Potri.010G184000 Bud set, Growth period,
HGC, 100% Leafyellowing, Leaf drop, Leaflifespan, PBS
Branches, Volume gain AT2G40320 TBL33 (TRICHOME
BIREFRINGENCE-LIKE 33)
Potri.010G250600 Bud set, HGC, 100% Leafyellowing, Leaf drop
Amax/mass, Nmass AT1G51630 MSR2 (MANNAN SYNTHESIS
RELATED 2)
� 2014 The Authors
New Phytologist� 2014 New Phytologist TrustNew Phytologist (2014)
www.newphytologist.com
NewPhytologist Research 11
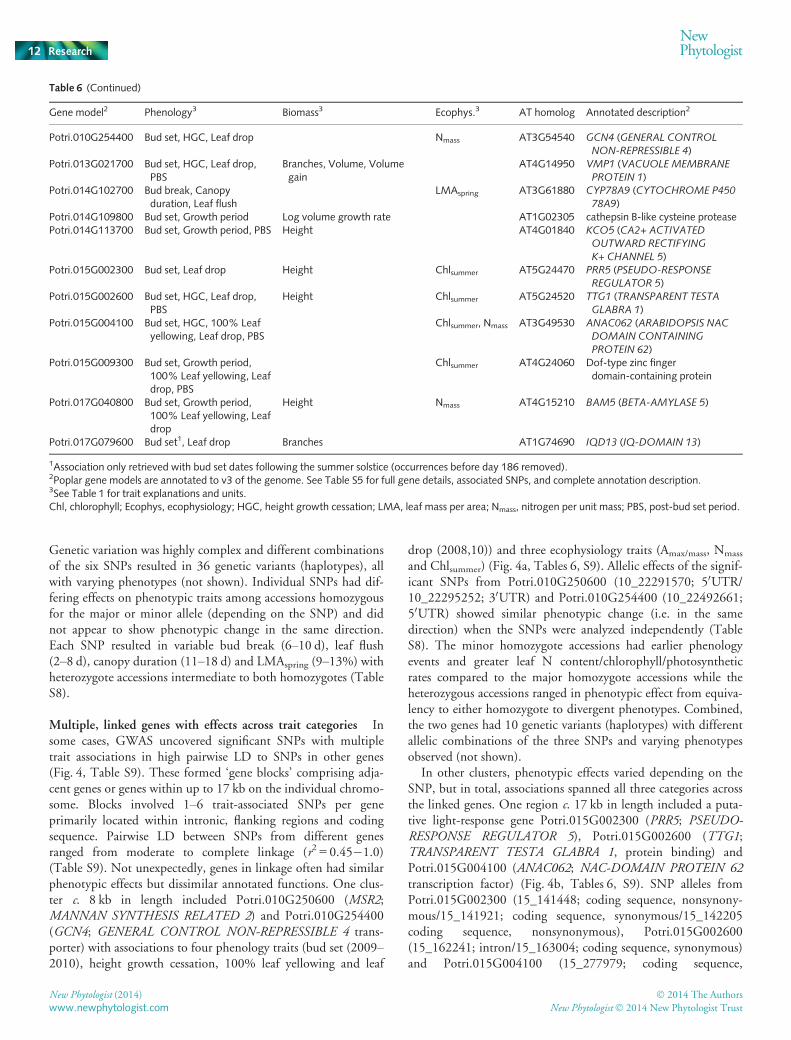
Genetic variation was highly complex and different combinationsof the six SNPs resulted in 36 genetic variants (haplotypes), allwith varying phenotypes (not shown). Individual SNPs had dif-fering effects on phenotypic traits among accessions homozygousfor the major or minor allele (depending on the SNP) and didnot appear to show phenotypic change in the same direction.Each SNP resulted in variable bud break (6–10 d), leaf flush(2–8 d), canopy duration (11–18 d) and LMAspring (9–13%) withheterozygote accessions intermediate to both homozygotes (TableS8).
Multiple, linked genes with effects across trait categories Insome cases, GWAS uncovered significant SNPs with multipletrait associations in high pairwise LD to SNPs in other genes(Fig. 4, Table S9). These formed ‘gene blocks’ comprising adja-cent genes or genes within up to 17 kb on the individual chromo-some. Blocks involved 1–6 trait-associated SNPs per geneprimarily located within intronic, flanking regions and codingsequence. Pairwise LD between SNPs from different genesranged from moderate to complete linkage (r2 = 0.45�1.0)(Table S9). Not unexpectedly, genes in linkage often had similarphenotypic effects but dissimilar annotated functions. One clus-ter c. 8 kb in length included Potri.010G250600 (MSR2;MANNAN SYNTHESIS RELATED 2) and Potri.010G254400(GCN4; GENERAL CONTROL NON-REPRESSIBLE 4 trans-porter) with associations to four phenology traits (bud set (2009–2010), height growth cessation, 100% leaf yellowing and leaf
drop (2008,10)) and three ecophysiology traits (Amax/mass, Nmass
and Chlsummer) (Fig. 4a, Tables 6, S9). Allelic effects of the signif-icant SNPs from Potri.010G250600 (10_22291570; 50UTR/10_22295252; 30UTR) and Potri.010G254400 (10_22492661;50UTR) showed similar phenotypic change (i.e. in the samedirection) when the SNPs were analyzed independently (TableS8). The minor homozygote accessions had earlier phenologyevents and greater leaf N content/chlorophyll/photosyntheticrates compared to the major homozygote accessions while theheterozygous accessions ranged in phenotypic effect from equiva-lency to either homozygote to divergent phenotypes. Combined,the two genes had 10 genetic variants (haplotypes) with differentallelic combinations of the three SNPs and varying phenotypesobserved (not shown).
In other clusters, phenotypic effects varied depending on theSNP, but in total, associations spanned all three categories acrossthe linked genes. One region c. 17 kb in length included a puta-tive light-response gene Potri.015G002300 (PRR5; PSEUDO-RESPONSE REGULATOR 5), Potri.015G002600 (TTG1;TRANSPARENT TESTA GLABRA 1, protein binding) andPotri.015G004100 (ANAC062; NAC-DOMAIN PROTEIN 62transcription factor) (Fig. 4b, Tables 6, S9). SNP alleles fromPotri.015G002300 (15_141448; coding sequence, nonsynony-mous/15_141921; coding sequence, synonymous/15_142205coding sequence, nonsynonymous), Potri.015G002600(15_162241; intron/15_163004; coding sequence, synonymous)and Potri.015G004100 (15_277979; coding sequence,
Table 6 (Continued)
Gene model2 Phenology3 Biomass3 Ecophys.3 AT homolog Annotated description2
Potri.010G254400 Bud set, HGC, Leaf drop Nmass AT3G54540 GCN4 (GENERAL CONTROL
NON-REPRESSIBLE 4)Potri.013G021700 Bud set, HGC, Leaf drop,
PBSBranches, Volume, Volumegain
AT4G14950 VMP1 (VACUOLE MEMBRANE
PROTEIN 1)Potri.014G102700 Bud break, Canopy
duration, Leaf flushLMAspring AT3G61880 CYP78A9 (CYTOCHROME P450
78A9)Potri.014G109800 Bud set, Growth period Log volume growth rate AT1G02305 cathepsin B-like cysteine proteasePotri.014G113700 Bud set, Growth period, PBS Height AT4G01840 KCO5 (CA2+ ACTIVATED
OUTWARD RECTIFYING
K+ CHANNEL 5)Potri.015G002300 Bud set, Leaf drop Height Chlsummer AT5G24470 PRR5 (PSEUDO-RESPONSE
REGULATOR 5)Potri.015G002600 Bud set, HGC, Leaf drop,
PBSHeight Chlsummer AT5G24520 TTG1 (TRANSPARENT TESTA
GLABRA 1)Potri.015G004100 Bud set, HGC, 100% Leaf
yellowing, Leaf drop, PBSChlsummer, Nmass AT3G49530 ANAC062 (ARABIDOPSIS NAC
DOMAIN CONTAINING
PROTEIN 62)Potri.015G009300 Bud set, Growth period,
100% Leaf yellowing, Leafdrop, PBS
Chlsummer AT4G24060 Dof-type zinc fingerdomain-containing protein
Potri.017G040800 Bud set, Growth period,100% Leaf yellowing, Leafdrop
Height Nmass AT4G15210 BAM5 (BETA-AMYLASE 5)
Potri.017G079600 Bud set1, Leaf drop Branches AT1G74690 IQD13 (IQ-DOMAIN 13)
1Association only retrieved with bud set dates following the summer solstice (occurrences before day 186 removed).2Poplar gene models are annotated to v3 of the genome. See Table S5 for full gene details, associated SNPs, and complete annotation description.3See Table 1 for trait explanations and units.Chl, chlorophyll; Ecophys, ecophysiology; HGC, height growth cessation; LMA, leaf mass per area; Nmass, nitrogen per unit mass; PBS, post-bud set period.
New Phytologist (2014) � 2014 The Authors
New Phytologist� 2014 New Phytologist Trustwww.newphytologist.com
Research
NewPhytologist12
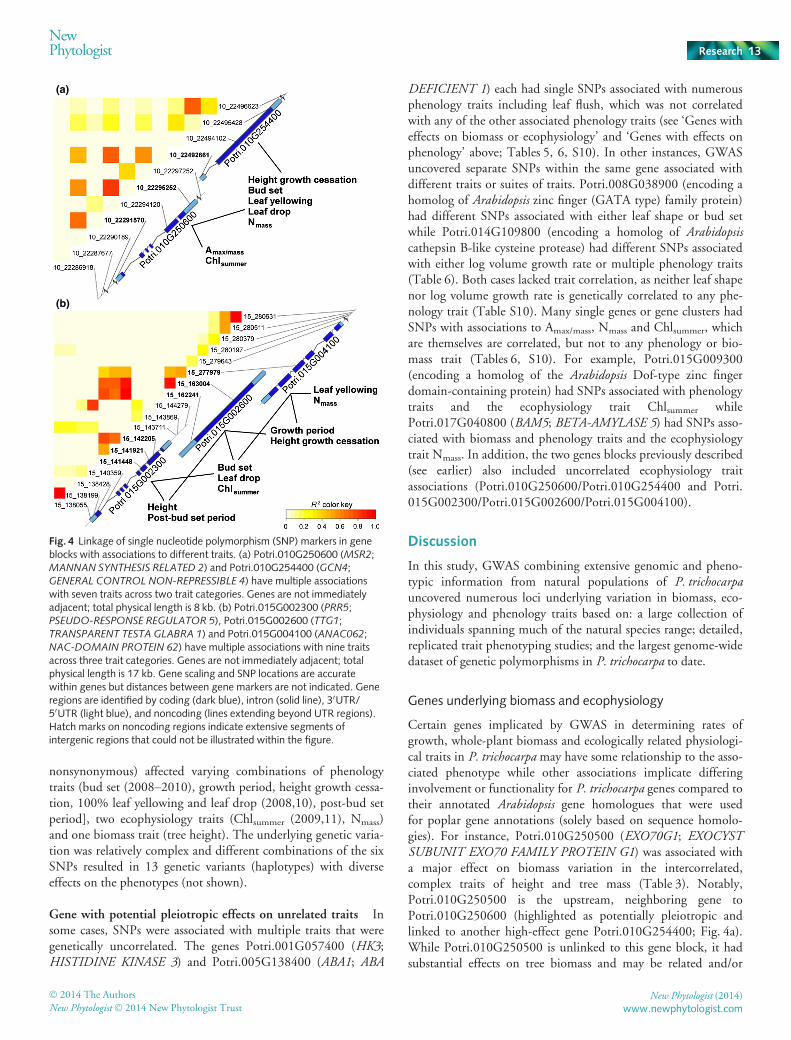
nonsynonymous) affected varying combinations of phenologytraits (bud set (2008–2010), growth period, height growth cessa-tion, 100% leaf yellowing and leaf drop (2008,10), post-bud setperiod], two ecophysiology traits (Chlsummer (2009,11), Nmass)and one biomass trait (tree height). The underlying genetic varia-tion was relatively complex and different combinations of the sixSNPs resulted in 13 genetic variants (haplotypes) with diverseeffects on the phenotypes (not shown).
Gene with potential pleiotropic effects on unrelated traits Insome cases, SNPs were associated with multiple traits that weregenetically uncorrelated. The genes Potri.001G057400 (HK3;HISTIDINE KINASE 3) and Potri.005G138400 (ABA1; ABA
DEFICIENT 1) each had single SNPs associated with numerousphenology traits including leaf flush, which was not correlatedwith any of the other associated phenology traits (see ‘Genes witheffects on biomass or ecophysiology’ and ‘Genes with effects onphenology’ above; Tables 5, 6, S10). In other instances, GWASuncovered separate SNPs within the same gene associated withdifferent traits or suites of traits. Potri.008G038900 (encoding ahomolog of Arabidopsis zinc finger (GATA type) family protein)had different SNPs associated with either leaf shape or bud setwhile Potri.014G109800 (encoding a homolog of Arabidopsiscathepsin B-like cysteine protease) had different SNPs associatedwith either log volume growth rate or multiple phenology traits(Table 6). Both cases lacked trait correlation, as neither leaf shapenor log volume growth rate is genetically correlated to any phe-nology trait (Table S10). Many single genes or gene clusters hadSNPs with associations to Amax/mass, Nmass and Chlsummer, whichare themselves are correlated, but not to any phenology or bio-mass trait (Tables 6, S10). For example, Potri.015G009300(encoding a homolog of the Arabidopsis Dof-type zinc fingerdomain-containing protein) had SNPs associated with phenologytraits and the ecophysiology trait Chlsummer whilePotri.017G040800 (BAM5; BETA-AMYLASE 5) had SNPs asso-ciated with biomass and phenology traits and the ecophysiologytrait Nmass. In addition, the two genes blocks previously described(see earlier) also included uncorrelated ecophysiology traitassociations (Potri.010G250600/Potri.010G254400 and Potri.015G002300/Potri.015G002600/Potri.015G004100).
Discussion
In this study, GWAS combining extensive genomic and pheno-typic information from natural populations of P. trichocarpauncovered numerous loci underlying variation in biomass, eco-physiology and phenology traits based on: a large collection ofindividuals spanning much of the natural species range; detailed,replicated trait phenotyping studies; and the largest genome-widedataset of genetic polymorphisms in P. trichocarpa to date.
Genes underlying biomass and ecophysiology
Certain genes implicated by GWAS in determining rates ofgrowth, whole-plant biomass and ecologically related physiologi-cal traits in P. trichocarpa may have some relationship to the asso-ciated phenotype while other associations implicate differinginvolvement or functionality for P. trichocarpa genes compared totheir annotated Arabidopsis gene homologues that were usedfor poplar gene annotations (solely based on sequence homolo-gies). For instance, Potri.010G250500 (EXO70G1; EXOCYSTSUBUNIT EXO70 FAMILY PROTEIN G1) was associated witha major effect on biomass variation in the intercorrelated,complex traits of height and tree mass (Table 3). Notably,Potri.010G250500 is the upstream, neighboring gene toPotri.010G250600 (highlighted as potentially pleiotropic andlinked to another high-effect gene Potri.010G254400; Fig. 4a).While Potri.010G250500 is unlinked to this gene block, it hadsubstantial effects on tree biomass and may be related and/or
(a)
(b)
Fig. 4 Linkage of single nucleotide polymorphism (SNP) markers in geneblocks with associations to different traits. (a) Potri.010G250600 (MSR2;MANNAN SYNTHESIS RELATED 2) and Potri.010G254400 (GCN4;GENERAL CONTROL NON-REPRESSIBLE 4) have multiple associationswith seven traits across two trait categories. Genes are not immediatelyadjacent; total physical length is 8 kb. (b) Potri.015G002300 (PRR5;PSEUDO-RESPONSE REGULATOR 5), Potri.015G002600 (TTG1;TRANSPARENT TESTA GLABRA 1) and Potri.015G004100 (ANAC062;NAC-DOMAIN PROTEIN 62) have multiple associations with nine traitsacross three trait categories. Genes are not immediately adjacent; totalphysical length is 17 kb. Gene scaling and SNP locations are accuratewithin genes but distances between gene markers are not indicated. Generegions are identified by coding (dark blue), intron (solid line), 30UTR/50UTR (light blue), and noncoding (lines extending beyond UTR regions).Hatch marks on noncoding regions indicate extensive segments ofintergenic regions that could not be illustrated within the figure.
� 2014 The Authors
New Phytologist� 2014 New Phytologist TrustNew Phytologist (2014)
www.newphytologist.com
NewPhytologist Research 13
affected by the potentially pleiotropic action of this genomicregion. In other species, the specific function of EXO70G1 isunknown but EXO70 proteins are thought to be involved inauxin efflux carrier recycling contributing to polar auxin trans-port (Drdov�a et al., 2013). Arabidopsis mutants in a related exo-cyst component (EXO70A1) show reduced fertility and alteredcellular development/organogenesis (Synek et al., 2006). Addi-tional associations implicate potentially novel functionality inP. trichocarpa related to phenotypic variation. For instance,Potri.010G019000 (MEE32; MATERNAL EFFECT EMBRYOARREST 32) was associated with log height growth inP. trichocarpa (Table 3) and has only been previously linked withtension wood growth in P. tremula (Andersson-Gunner�as et al.,2006). Another example linked Potri.008G105200 (PHYB;PHYTOCHROME B) with the number of preformed leaves interminal buds but not phenology (see later).
Despite high intraspecific variation among accessions ofP. trichocarpa in ecophysiology and biomass/growth-related traits,we found fewer associations relative to phenology and lower totalphenotypic variance accounted for by trait-associated SNPs(explained by cumulative R2) (Figs 2, 3, S4). This may be due tolack of sufficient genomic coverage (i.e. SNPs not on the geno-typing array) and would be ameliorated by using a broader sam-pling of genetic variation. Another possibility might relate to theeffects of rare alleles which are hard to detect using GWAS (Ing-varsson & Street, 2011). A third possibility is loss of associationswhere relationships between SNP loci and geography exist(Balding, 2006) and as identified by PCA for the present studypopulation (McKown et al., 2014). Finally, the heritability valuesof many biomass and ecophysiology traits are low to moderatesuggesting a high local environment-response component (McK-own et al., 2014; Fig. S5), and thus, detecting underlying geneticvariation in these traits may be inherently difficult using GWAS.
Genes underlying phenology
The greatest number of genetic associations in P. trichocarpainvolved phenology and also provided the highest cumulative R2
values found in any studied trait category (Figs 2, 3, S4) support-ing high genetic complexity in such traits. The large number ofgenes involved in phenology is not necessarily unwarranted. Inprevious studies, numerous genes have also been found that con-trol the bud activity–dormancy cycle in Populus (Ruttink et al.,2007; Jackson, 2009; Ma et al., 2010; Rohde et al., 2010, 2011;Olson et al., 2013) and distantly-related Salix (Ghelardini et al.,2014). Within this study, most SNPs provided a small contribu-tion to the overall trait, suggesting that the evolution of variationin phenological traits involves numerous loci with small effects(cf. Rockman, 2012). This complex genetic architecture for manyphenology traits in P. trichocarpa reflects the activity–dormancycycle of the meristem. The whole-plant switch from activegrowth to quiescence is intricate and triggered by a number ofsignals, including daylength, temperature and environmentalstressors (Cooke et al., 2012).
In our study, the genetic complexity of phenology traits wasobserved in the broad span of putative functions in associated
genes, particularly late summer and fall phenology traits of budset and leaf drop (Tables 5, 6, S5). Loci implicated by GWASunderlying phenology trait variation included multiple genesrelated to environmental response in Arabidopsis, such as lightperception, hormone signaling, heat shock stress, cold response,water relations and drought stress. Others were related to differ-ent types of signaling in Arabidopsis, such as calmodulins/cal-cium, ion transport, phosphatases and kinases. We note that genenumbers and cumulative R2 identified for phenology traits didnot necessarily relate to trait heritability (Figs S4, S5, Table S1).For instance, both bud break and leaf flush (H2 = 0.88, 0.85,respectively) yielded only five genes (one with associations toboth traits), while bud set and leaf drop (H2 = 0.74, 0.60, respec-tively) yielded 222 genes (80 with associations to both traits).Correspondingly, cumulative R2 was much higher in bud set andleaf drop compared to bud break and leaf flush (Fig. S4), despitethe similarly high heritability values (Fig. S5).
The timing of individual phenology events within our popula-tion is generally correlated across years but actual dates shiftedannually depending on the timing of seasonal environmental cues(McKown et al., 2013). Strong genetic correlations between dif-ferent phenology events exist and traits tend to be highly intercor-related within a ‘season’ but not across seasons (i.e. spring vs latesummer/fall; Table S10). Nevertheless, these correlations arenot necessarily predictive and intraspecific phenotypic variationin phenology can be somewhat modified from year to yeardepending on environmental conditions (e.g. the timing ofbud set and leaf drop is not fixed). Thus, retrieving repeatedassociations between SNPs and phenology traits measured acrossdifferent years supports the biological relevance of thesegenes. Genes, such as Potri.009G017400 (BLH1; BEL1-LIKEHOMEODOMAIN 1), Potri.010G215200 (PRR7; PSEUDO-RESPONSE REGULATOR 7) and Potri.018G033600 (GA3OX1;GIBBERELLIN 3-OXIDASE 1), were each associated withmultiple late summer/fall phenology traits across numerous yearsand have some precedent for understanding phenology timing. InArabidopsis, BLH1 regulates the high irradiance response ofPHYTOCHROME A (PHYA) (Staneloni et al., 2009) and modu-lates signaling by abscisic acid during development (Kim et al.,2013). BLH1 is also linked to the initiation of bud formation inP. tremula9 P. alba (Ruttink et al., 2007) and is related to latesummer Melampsora susceptibility in P. trichocarpa (La Mantiaet al., 2013). PRR7 is a core clock gene in circadian rhythm deter-mination within Arabidopsis through transcription–translationfeedback loops (Haydon et al., 2013) andmay participate in a sim-ilar role in Populus. Likewise,GA3OX1 is implicated in photoperi-odic perception (Song et al., 2013) and seed dormancy (Footittet al., 2013) in Arabidopsis, and gibberellins also have well-estab-lished roles in the transition to dormancy in Populus (Ruttinket al., 2007).
Other genes identified have a characterized function inArabidopsis, but are novel loci for understanding phenotypicvariation in P. trichocarpa. Potri.014G102700 (CYP78A9;CYTOCHROME P450 78A9) was repeatedly associated withspring phenology events while Potri.002G242500 (CB5-B;CYTOCHROME B5 ISOFORM B) was repeatedly found with
New Phytologist (2014) � 2014 The Authors
New Phytologist� 2014 New Phytologist Trustwww.newphytologist.com
Research
NewPhytologist14
late summer/fall phenology events. Although CB5-B is notknown to relate to phenology, CYP78A genes in Arabidopsis aregenerally related to plant size, fertility, and the timing of budopening and organ abscission (Sotelo-Silveira et al., 2013).Potri.014G102700 (CYP78A9) also showed high genetic com-plexity with variable effects (among related traits), and may be anexample of ‘conditional neutrality’ or ‘antagonistic pleiotropy’where different alleles might be favorable depending on theenvironment (Savolainen et al., 2013). Some genes associatedwith phenology highlighted links to nutrient availability. Twogenes in high linkage, Potri.009G008500 (NRT2.4; NITRATETRANSPORTER 2:4) and Potri.009G008600 (NRT2:1;NITRATE TRANSPORTER 2:1), were associated with late sum-mer/fall phenology events across all years (Tables 6, S5, S9) sug-gesting that nitrate transporters or nitrogen availability/allocationmight affect the regulation of these events. Nitrate transportershave been implicated in nitrogen sensing and auxin signal trans-duction, and NRT2.4 is highly expressed in numerous above-ground tissues in Populus, including the meristem (Bai et al.,2013). However, neither gene has been previously invoked inphenology in any species.
Many light-associated genes previously implicated in Populusphenology were found in our association study while others werenot, despite inclusion on the SNP array. This has also beenreported in the sister-species P. balsamifera, where significantphenology-related SNPs did not necessarily correspond withSNPs uncovered in other association studies for Populus (Olsonet al., 2013). In addition to previously discussed genes, our GWASuncovered COP1 (CONSTITUTIVE PHOTOMORPHOGENIC1), FAR1 (FAR-RED IMPAIRED RESPONSE 1), PCL1 (PHYTO-CLOCK 1), PIL6 (PHYTOCHROME INTERACTING FACTOR3-LIKE 6) and PRR5 (PSEUDO-RESPONSE REGULATOR 5)(Table S5). Yet, notable genes were not among the associations,including PHYA, PHYB, CCA1 (CIRCADIAN CLOCK-ASSOCIATED1), FRI (FRIGIDA), GI (GIGANTEA), LATEELONGATED HYPOCOTYL (LHY), and TOC1 (TIMING OFCHLOROPHYLL a/b BINDING PROTEIN/PRR1) (Ruttink et al.,2007; Ingvarsson et al., 2008; Ma et al., 2010; Rohde et al., 2011;Cooke et al., 2012; Fabbrini et al., 2012; Keller et al., 2012; Olsonet al., 2013). SNPs from CCA1, LHY, TOC1/PRR1 were retrievedby phenology traits using the simple model (not shown); thus, it ispossible that their signal was diminished by correcting for populationstructure in the mixed model, as these loci have known relationshipswith geography (McKown et al., 2014; A. Geraldes, unpublished).Nevertheless, it also suggests that variation within these genes doesnot underlie intraspecific variation of such traits in P. trichocarpa, asobserved in the closely related P. balsamifera (Olson et al., 2013) andmore distantly related P. nigra (Rohde et al., 2011).
Genes with associations across trait categories andpotential functional pleiotropy
One of the significant findings of this study were the numerousgenes with multiple significant associations to different traits,including associations across trait categories (Fig. 2, Tables 3–6),and blocks of linked genes with shared genotype–phenotype
associations (Fig. 4). We consider these to be indications of plei-otropy in a broad sense (cf. Mackay et al., 2009). The repeatedoccurrence of ecophysiology traits associated with pleiotropic lociwas notable (Table 6), particularly as these had little or no correl-ative relationship to biomass and/or phenology traits. Otherexamples of potentially pleiotropic loci have also been uncoveredin P. trichocarpa (Porth et al., 2014), including a set of genesaffecting phenology, wood fiber properties and disease resistance(I. Porth & J. Kl�ap�st�e, unpublished). In this case, phenologytraits and fiber properties are functionally uncorrelated traits andthe evolution of pleiotropy suggests that the developmental inte-gration of these different traits might have led to their geneticintegration (evidenced as trait co-selection; cf. Cheverud, 1996).
The pleiotropic loci in this study provide novel candidatesunderlying phenotypic variation in P. trichocarpa and suggestthe presence of genomic regions with importance for environ-mental response in P. trichocarpa. The gene block with Potri.010G250600 (MSR2; MANNAN SYNTHESIS RELATED 2)and Potri.010G254400 (GCN4; GENERAL CONTROL NON-REPRESSIBLE 4) is potentially pleiotropic in P. trichocarpa(Fig. 4a) but the individual genes are not known to be function-ally related or pleiotropic within other plant species. InArabidopsis, MSR2 is localized to the Golgi apparatus, and hasbeen implicated in mannan biosynthesis in a number of tissues,including developing vascular tissue, leaves, stems and flowers(Wang et al., 2013). The Arabidopsis transporter GCN4 is a puta-tive ATP-binding transporter family protein but is not fully char-acterized in any plant species. Within P. trichocarpa,Potri.010G254400 (GCN4) is also associated with rates ofMelampsora infection (La Mantia et al., 2013) and may play arole in disease resistance/susceptibility.
Another block (Fig. 4b) with Potri.015G002300 (PRR5;PSEUDO-RESPONSE REGULATOR 5), Potri.015G002600(TTG1; TRANSPARENT TESTA GLABRA 1) and Potri.015G004100 (ANAC062; NAC-DOMAIN PROTEIN 62) sug-gests genes related to environmental sensing and stress responsemay have pleiotropic activity. PRR5 is highly upregulated with theonset of short days in P. tremula9 P. alba (Ruttink et al., 2007).It has also has been implicated in growth cessation and bud set inassociation studies of P. tremula9 P. alba (Ruttink et al., 2007)and P. tremula (Ma et al., 2010), and is associated with cell wallcrystallinity in P. trichocarpa (Porth et al., 2013a). In Arabidopsis,PRR5 plays a role in directly regulating circadian clock genes(Nakamichi et al., 2012). Other direct targets of this regulatorinclude transcription factors involved in flowering, hypocotylextension and cold-stress responses, suggesting that PRR5 haslight-mediated effects on many physiological processes. BothTTG1 and ANAC062 are transcription factors associated withstress responses. TTG1 affects many plant processes, includingflavonoid biosynthesis, response to abscisic acid and root growthin relation to water stress in Arabidopsis (Nguyen et al., 2013).Likewise, ANAC062 is a membrane-associated stress responsetranscription factor in Arabidopsis and involved in abscisic acidresponse, cold stress and salinity tolerance (Seo & Park, 2010).
The potential pleiotropic loci detected by GWAS in this studyspanned a number of functions and may have effects by acting
� 2014 The Authors
New Phytologist� 2014 New Phytologist TrustNew Phytologist (2014)
www.newphytologist.com
NewPhytologist Research 15
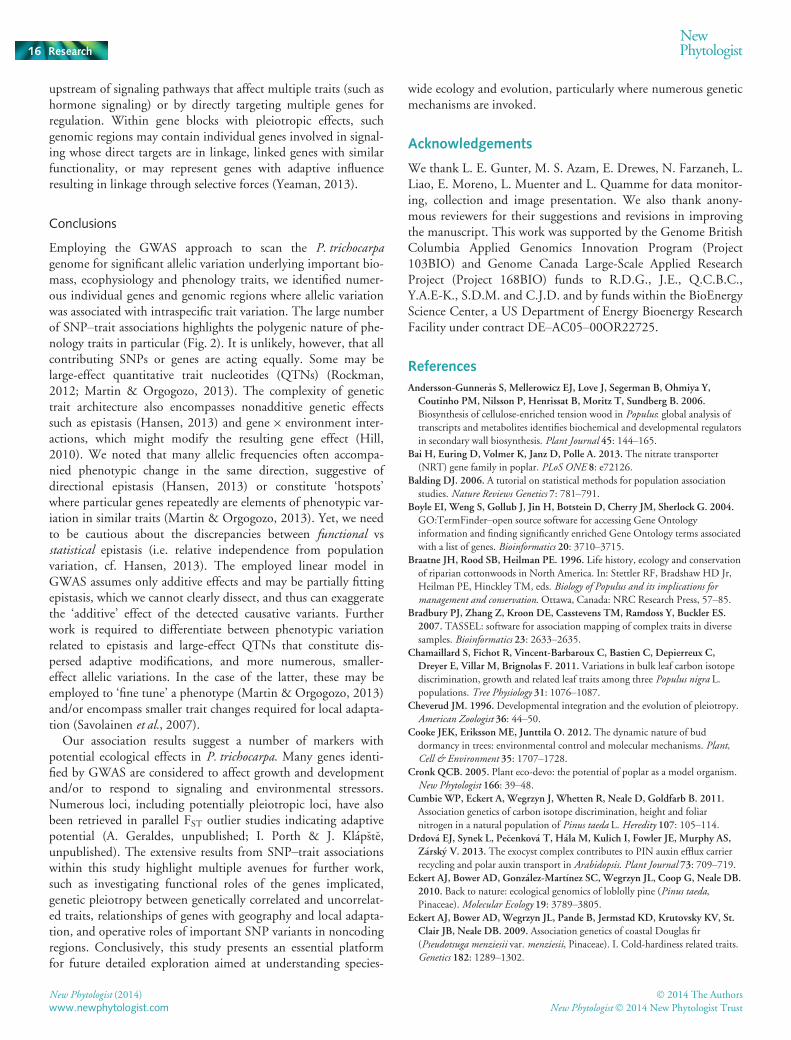
upstream of signaling pathways that affect multiple traits (such ashormone signaling) or by directly targeting multiple genes forregulation. Within gene blocks with pleiotropic effects, suchgenomic regions may contain individual genes involved in signal-ing whose direct targets are in linkage, linked genes with similarfunctionality, or may represent genes with adaptive influenceresulting in linkage through selective forces (Yeaman, 2013).
Conclusions
Employing the GWAS approach to scan the P. trichocarpagenome for significant allelic variation underlying important bio-mass, ecophysiology and phenology traits, we identified numer-ous individual genes and genomic regions where allelic variationwas associated with intraspecific trait variation. The large numberof SNP–trait associations highlights the polygenic nature of phe-nology traits in particular (Fig. 2). It is unlikely, however, that allcontributing SNPs or genes are acting equally. Some may belarge-effect quantitative trait nucleotides (QTNs) (Rockman,2012; Martin & Orgogozo, 2013). The complexity of genetictrait architecture also encompasses nonadditive genetic effectssuch as epistasis (Hansen, 2013) and gene9 environment inter-actions, which might modify the resulting gene effect (Hill,2010). We noted that many allelic frequencies often accompa-nied phenotypic change in the same direction, suggestive ofdirectional epistasis (Hansen, 2013) or constitute ‘hotspots’where particular genes repeatedly are elements of phenotypic var-iation in similar traits (Martin & Orgogozo, 2013). Yet, we needto be cautious about the discrepancies between functional vsstatistical epistasis (i.e. relative independence from populationvariation, cf. Hansen, 2013). The employed linear model inGWAS assumes only additive effects and may be partially fittingepistasis, which we cannot clearly dissect, and thus can exaggeratethe ‘additive’ effect of the detected causative variants. Furtherwork is required to differentiate between phenotypic variationrelated to epistasis and large-effect QTNs that constitute dis-persed adaptive modifications, and more numerous, smaller-effect allelic variations. In the case of the latter, these may beemployed to ‘fine tune’ a phenotype (Martin & Orgogozo, 2013)and/or encompass smaller trait changes required for local adapta-tion (Savolainen et al., 2007).
Our association results suggest a number of markers withpotential ecological effects in P. trichocarpa. Many genes identi-fied by GWAS are considered to affect growth and developmentand/or to respond to signaling and environmental stressors.Numerous loci, including potentially pleiotropic loci, have alsobeen retrieved in parallel FST outlier studies indicating adaptivepotential (A. Geraldes, unpublished; I. Porth & J. Kl�ap�st�e,unpublished). The extensive results from SNP–trait associationswithin this study highlight multiple avenues for further work,such as investigating functional roles of the genes implicated,genetic pleiotropy between genetically correlated and uncorrelat-ed traits, relationships of genes with geography and local adapta-tion, and operative roles of important SNP variants in noncodingregions. Conclusively, this study presents an essential platformfor future detailed exploration aimed at understanding species-
wide ecology and evolution, particularly where numerous geneticmechanisms are invoked.
Acknowledgements
We thank L. E. Gunter, M. S. Azam, E. Drewes, N. Farzaneh, L.Liao, E. Moreno, L. Muenter and L. Quamme for data monitor-ing, collection and image presentation. We also thank anony-mous reviewers for their suggestions and revisions in improvingthe manuscript. This work was supported by the Genome BritishColumbia Applied Genomics Innovation Program (Project103BIO) and Genome Canada Large-Scale Applied ResearchProject (Project 168BIO) funds to R.D.G., J.E., Q.C.B.C.,Y.A.E-K., S.D.M. and C.J.D. and by funds within the BioEnergyScience Center, a US Department of Energy Bioenergy ResearchFacility under contract DE–AC05–00OR22725.
References
Andersson-Gunner�as S, Mellerowicz EJ, Love J, Segerman B, Ohmiya Y,
Coutinho PM, Nilsson P, Henrissat B, Moritz T, Sundberg B. 2006.
Biosynthesis of cellulose-enriched tension wood in Populus: global analysis oftranscripts and metabolites identifies biochemical and developmental regulators
in secondary wall biosynthesis. Plant Journal 45: 144–165.Bai H, Euring D, Volmer K, Janz D, Polle A. 2013. The nitrate transporter
(NRT) gene family in poplar. PLoS ONE 8: e72126.
Balding DJ. 2006. A tutorial on statistical methods for population association
studies. Nature Reviews Genetics 7: 781–791.Boyle EI, Weng S, Gollub J, Jin H, Botstein D, Cherry JM, Sherlock G. 2004.
GO:TermFinder–open source software for accessing Gene Ontology
information and finding significantly enriched Gene Ontology terms associated
with a list of genes. Bioinformatics 20: 3710–3715.Braatne JH, Rood SB, Heilman PE. 1996. Life history, ecology and conservation
of riparian cottonwoods in North America. In: Stettler RF, Bradshaw HD Jr,
Heilman PE, Hinckley TM, eds. Biology of Populus and its implications formanagement and conservation. Ottawa, Canada: NRC Research Press, 57–85.
Bradbury PJ, Zhang Z, Kroon DE, Casstevens TM, Ramdoss Y, Buckler ES.
2007. TASSEL: software for association mapping of complex traits in diverse
samples. Bioinformatics 23: 2633–2635.Chamaillard S, Fichot R, Vincent-Barbaroux C, Bastien C, Depierreux C,
Dreyer E, Villar M, Brignolas F. 2011. Variations in bulk leaf carbon isotope
discrimination, growth and related leaf traits among three Populus nigra L.populations. Tree Physiology 31: 1076–1087.
Cheverud JM. 1996. Developmental integration and the evolution of pleiotropy.
American Zoologist 36: 44–50.Cooke JEK, Eriksson ME, Junttila O. 2012. The dynamic nature of bud
dormancy in trees: environmental control and molecular mechanisms. Plant,Cell & Environment 35: 1707–1728.
Cronk QCB. 2005. Plant eco-devo: the potential of poplar as a model organism.
New Phytologist 166: 39–48.Cumbie WP, Eckert A, Wegrzyn J, Whetten R, Neale D, Goldfarb B. 2011.
Association genetics of carbon isotope discrimination, height and foliar
nitrogen in a natural population of Pinus taeda L. Heredity 107: 105–114.Drdov�a EJ, Synek L, Pe�cenkov�a T, H�ala M, Kulich I, Fowler JE, Murphy AS,
Z�arsk�y V. 2013. The exocyst complex contributes to PIN auxin efflux carrier
recycling and polar auxin transport in Arabidopsis. Plant Journal 73: 709–719.Eckert AJ, Bower AD, Gonz�alez-Mart�ınez SC, Wegrzyn JL, Coop G, Neale DB.
2010. Back to nature: ecological genomics of loblolly pine (Pinus taeda,Pinaceae).Molecular Ecology 19: 3789–3805.
Eckert AJ, Bower AD, Wegrzyn JL, Pande B, Jermstad KD, Krutovsky KV, St.
Clair JB, Neale DB. 2009. Association genetics of coastal Douglas fir
(Pseudotsuga menziesii var. menziesii, Pinaceae). I. Cold-hardiness related traits.Genetics 182: 1289–1302.
New Phytologist (2014) � 2014 The Authors
New Phytologist� 2014 New Phytologist Trustwww.newphytologist.com
Research
NewPhytologist16
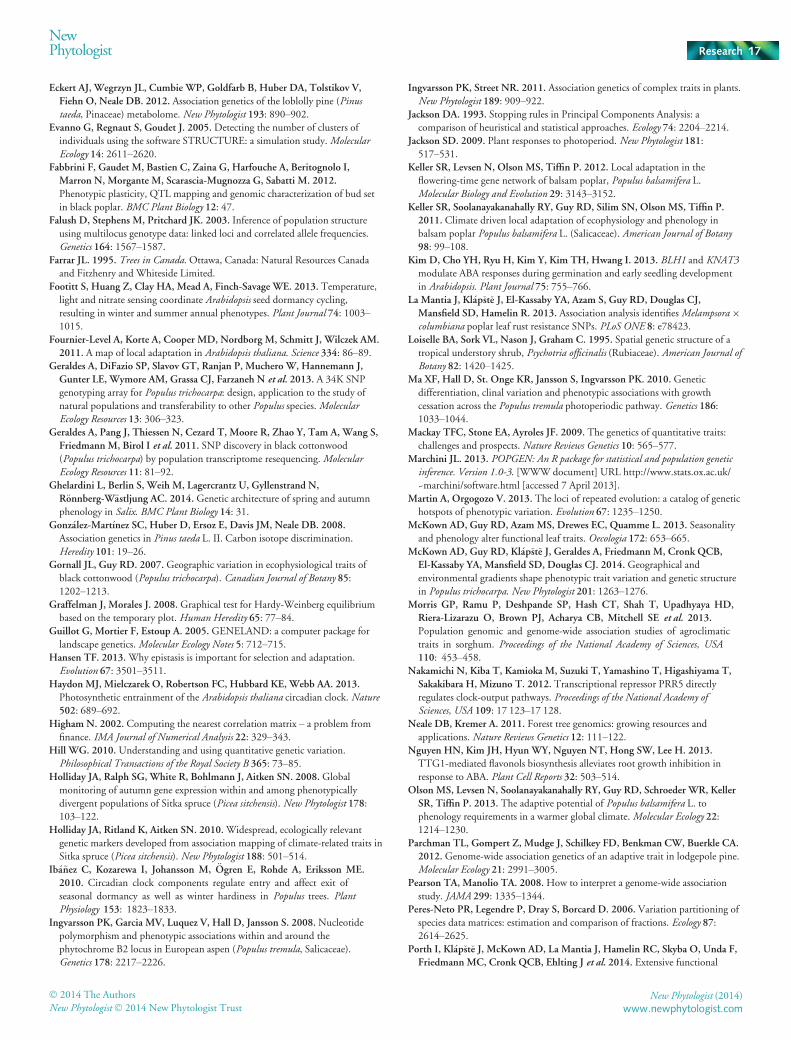
Eckert AJ, Wegrzyn JL, Cumbie WP, Goldfarb B, Huber DA, Tolstikov V,
Fiehn O, Neale DB. 2012. Association genetics of the loblolly pine (Pinustaeda, Pinaceae) metabolome. New Phytologist 193: 890–902.
Evanno G, Regnaut S, Goudet J. 2005. Detecting the number of clusters of
individuals using the software STRUCTURE: a simulation study.MolecularEcology 14: 2611–2620.
Fabbrini F, Gaudet M, Bastien C, Zaina G, Harfouche A, Beritognolo I,
Marron N, Morgante M, Scarascia-Mugnozza G, Sabatti M. 2012.
Phenotypic plasticity, QTL mapping and genomic characterization of bud set
in black poplar. BMC Plant Biology 12: 47.Falush D, Stephens M, Pritchard JK. 2003. Inference of population structure
using multilocus genotype data: linked loci and correlated allele frequencies.
Genetics 164: 1567–1587.Farrar JL. 1995. Trees in Canada. Ottawa, Canada: Natural Resources Canada
and Fitzhenry and Whiteside Limited.
Footitt S, Huang Z, Clay HA, Mead A, Finch-Savage WE. 2013. Temperature,
light and nitrate sensing coordinate Arabidopsis seed dormancy cycling,
resulting in winter and summer annual phenotypes. Plant Journal 74: 1003–1015.
Fournier-Level A, Korte A, Cooper MD, Nordborg M, Schmitt J, Wilczek AM.
2011. A map of local adaptation in Arabidopsis thaliana. Science 334: 86–89.Geraldes A, DiFazio SP, Slavov GT, Ranjan P, Muchero W, Hannemann J,
Gunter LE, Wymore AM, Grassa CJ, Farzaneh N et al. 2013. A 34K SNP
genotyping array for Populus trichocarpa: design, application to the study of
natural populations and transferability to other Populus species.MolecularEcology Resources 13: 306–323.
Geraldes A, Pang J, Thiessen N, Cezard T, Moore R, Zhao Y, Tam A, Wang S,
Friedmann M, Birol I et al. 2011. SNP discovery in black cottonwood
(Populus trichocarpa) by population transcriptome resequencing.MolecularEcology Resources 11: 81–92.
Ghelardini L, Berlin S, Weih M, Lagercrantz U, Gyllenstrand N,
R€onnberg-W€astljung AC. 2014. Genetic architecture of spring and autumn
phenology in Salix. BMC Plant Biology 14: 31.Gonz�alez-Mart�ınez SC, Huber D, Ersoz E, Davis JM, Neale DB. 2008.
Association genetics in Pinus taeda L. II. Carbon isotope discrimination.
Heredity 101: 19–26.Gornall JL, Guy RD. 2007. Geographic variation in ecophysiological traits of
black cottonwood (Populus trichocarpa). Canadian Journal of Botany 85:1202–1213.
Graffelman J, Morales J. 2008. Graphical test for Hardy-Weinberg equilibrium
based on the temporary plot. Human Heredity 65: 77–84.Guillot G, Mortier F, Estoup A. 2005. GENELAND: a computer package for
landscape genetics.Molecular Ecology Notes 5: 712–715.Hansen TF. 2013.Why epistasis is important for selection and adaptation.
Evolution 67: 3501–3511.Haydon MJ, Mielczarek O, Robertson FC, Hubbard KE, Webb AA. 2013.
Photosynthetic entrainment of the Arabidopsis thaliana circadian clock. Nature502: 689–692.
Higham N. 2002. Computing the nearest correlation matrix – a problem from
finance. IMA Journal of Numerical Analysis 22: 329–343.Hill WG. 2010. Understanding and using quantitative genetic variation.
Philosophical Transactions of the Royal Society B 365: 73–85.Holliday JA, Ralph SG, White R, Bohlmann J, Aitken SN. 2008. Global
monitoring of autumn gene expression within and among phenotypically
divergent populations of Sitka spruce (Picea sitchensis). New Phytologist 178:103–122.
Holliday JA, Ritland K, Aitken SN. 2010.Widespread, ecologically relevant
genetic markers developed from association mapping of climate-related traits in
Sitka spruce (Picea sitchensis). New Phytologist 188: 501–514.Ib�a~nez C, Kozarewa I, Johansson M, €Ogren E, Rohde A, Eriksson ME.
2010. Circadian clock components regulate entry and affect exit of
seasonal dormancy as well as winter hardiness in Populus trees. PlantPhysiology 153: 1823–1833.
Ingvarsson PK, Garcia MV, Luquez V, Hall D, Jansson S. 2008. Nucleotide
polymorphism and phenotypic associations within and around the
phytochrome B2 locus in European aspen (Populus tremula, Salicaceae).Genetics 178: 2217–2226.
Ingvarsson PK, Street NR. 2011. Association genetics of complex traits in plants.
New Phytologist 189: 909–922.Jackson DA. 1993. Stopping rules in Principal Components Analysis: a
comparison of heuristical and statistical approaches. Ecology 74: 2204–2214.Jackson SD. 2009. Plant responses to photoperiod. New Phytologist 181:517–531.
Keller SR, Levsen N, Olson MS, Tiffin P. 2012. Local adaptation in the
flowering-time gene network of balsam poplar, Populus balsamifera L.Molecular Biology and Evolution 29: 3143–3152.
Keller SR, Soolanayakanahally RY, Guy RD, Silim SN, Olson MS, Tiffin P.
2011. Climate driven local adaptation of ecophysiology and phenology in
balsam poplar Populus balsamifera L. (Salicaceae). American Journal of Botany98: 99–108.
Kim D, Cho YH, Ryu H, Kim Y, Kim TH, Hwang I. 2013. BLH1 and KNAT3modulate ABA responses during germination and early seedling development
in Arabidopsis. Plant Journal 75: 755–766.La Mantia J, Kl�ap�st�e J, El-Kassaby YA, Azam S, Guy RD, Douglas CJ,
Mansfield SD, Hamelin R. 2013. Association analysis identifiesMelampsora9columbiana poplar leaf rust resistance SNPs. PLoS ONE 8: e78423.
Loiselle BA, Sork VL, Nason J, Graham C. 1995. Spatial genetic structure of a
tropical understory shrub, Psychotria officinalis (Rubiaceae). American Journal ofBotany 82: 1420–1425.
Ma XF, Hall D, St. Onge KR, Jansson S, Ingvarsson PK. 2010. Genetic
differentiation, clinal variation and phenotypic associations with growth
cessation across the Populus tremula photoperiodic pathway. Genetics 186:1033–1044.
Mackay TFC, Stone EA, Ayroles JF. 2009. The genetics of quantitative traits:
challenges and prospects. Nature Reviews Genetics 10: 565–577.Marchini JL. 2013. POPGEN: An R package for statistical and population geneticinference. Version 1.0-3. [WWW document] URL http://www.stats.ox.ac.uk/
~marchini/software.html [accessed 7 April 2013].
Martin A, Orgogozo V. 2013. The loci of repeated evolution: a catalog of genetic
hotspots of phenotypic variation. Evolution 67: 1235–1250.McKown AD, Guy RD, Azam MS, Drewes EC, Quamme L. 2013. Seasonality
and phenology alter functional leaf traits. Oecologia 172: 653–665.McKown AD, Guy RD, Kl�ap�st�e J, Geraldes A, Friedmann M, Cronk QCB,
El-Kassaby YA, Mansfield SD, Douglas CJ. 2014. Geographical and
environmental gradients shape phenotypic trait variation and genetic structure
in Populus trichocarpa. New Phytologist 201: 1263–1276.Morris GP, Ramu P, Deshpande SP, Hash CT, Shah T, Upadhyaya HD,
Riera-Lizarazu O, Brown PJ, Acharya CB, Mitchell SE et al. 2013.Population genomic and genome-wide association studies of agroclimatic
traits in sorghum. Proceedings of the National Academy of Sciences, USA110: 453–458.
Nakamichi N, Kiba T, Kamioka M, Suzuki T, Yamashino T, Higashiyama T,
Sakakibara H, Mizuno T. 2012. Transcriptional repressor PRR5 directly
regulates clock-output pathways. Proceedings of the National Academy ofSciences, USA 109: 17 123–17 128.
Neale DB, Kremer A. 2011. Forest tree genomics: growing resources and
applications. Nature Reviews Genetics 12: 111–122.Nguyen HN, Kim JH, Hyun WY, Nguyen NT, Hong SW, Lee H. 2013.
TTG1-mediated flavonols biosynthesis alleviates root growth inhibition in
response to ABA. Plant Cell Reports 32: 503–514.Olson MS, Levsen N, Soolanayakanahally RY, Guy RD, Schroeder WR, Keller
SR, Tiffin P. 2013. The adaptive potential of Populus balsamifera L. tophenology requirements in a warmer global climate.Molecular Ecology 22:1214–1230.
Parchman TL, Gompert Z, Mudge J, Schilkey FD, Benkman CW, Buerkle CA.
2012. Genome-wide association genetics of an adaptive trait in lodgepole pine.
Molecular Ecology 21: 2991–3005.Pearson TA, Manolio TA. 2008.How to interpret a genome-wide association
study. JAMA 299: 1335–1344.Peres-Neto PR, Legendre P, Dray S, Borcard D. 2006. Variation partitioning of
species data matrices: estimation and comparison of fractions. Ecology 87:2614–2625.
Porth I, Kl�ap�st�e J, McKown AD, La Mantia J, Hamelin RC, Skyba O, Unda F,
Friedmann MC, Cronk QCB, Ehlting J et al. 2014. Extensive functional
� 2014 The Authors
New Phytologist� 2014 New Phytologist TrustNew Phytologist (2014)
www.newphytologist.com
NewPhytologist Research 17
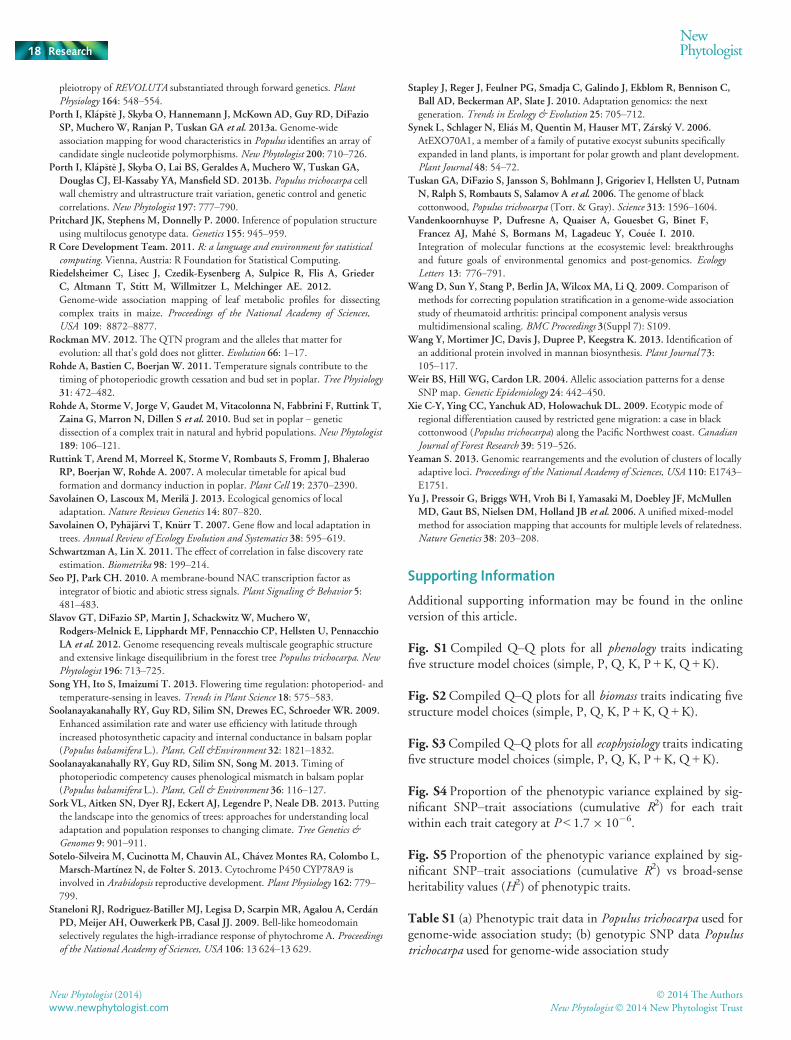
pleiotropy of REVOLUTA substantiated through forward genetics. PlantPhysiology 164: 548–554.
Porth I, Kl�ap�st�e J, Skyba O, Hannemann J, McKown AD, Guy RD, DiFazio
SP, Muchero W, Ranjan P, Tuskan GA et al. 2013a. Genome-wide
association mapping for wood characteristics in Populus identifies an array of
candidate single nucleotide polymorphisms. New Phytologist 200: 710–726.Porth I, Kl�ap�st�e J, Skyba O, Lai BS, Geraldes A, Muchero W, Tuskan GA,
Douglas CJ, El-Kassaby YA, Mansfield SD. 2013b. Populus trichocarpa cellwall chemistry and ultrastructure trait variation, genetic control and genetic
correlations. New Phytologist 197: 777–790.Pritchard JK, Stephens M, Donnelly P. 2000. Inference of population structure
using multilocus genotype data. Genetics 155: 945–959.R Core Development Team. 2011. R: a language and environment for statisticalcomputing. Vienna, Austria: R Foundation for Statistical Computing.
Riedelsheimer C, Lisec J, Czedik-Eysenberg A, Sulpice R, Flis A, Grieder
C, Altmann T, Stitt M, Willmitzer L, Melchinger AE. 2012.
Genome-wide association mapping of leaf metabolic profiles for dissecting
complex traits in maize. Proceedings of the National Academy of Sciences,USA 109: 8872–8877.
Rockman MV. 2012. The QTN program and the alleles that matter for
evolution: all that’s gold does not glitter. Evolution 66: 1–17.Rohde A, Bastien C, Boerjan W. 2011. Temperature signals contribute to the
timing of photoperiodic growth cessation and bud set in poplar. Tree Physiology31: 472–482.
Rohde A, Storme V, Jorge V, Gaudet M, Vitacolonna N, Fabbrini F, Ruttink T,
Zaina G, Marron N, Dillen S et al. 2010. Bud set in poplar – geneticdissection of a complex trait in natural and hybrid populations. New Phytologist189: 106–121.
Ruttink T, Arend M, Morreel K, Storme V, Rombauts S, Fromm J, Bhalerao
RP, Boerjan W, Rohde A. 2007. A molecular timetable for apical bud
formation and dormancy induction in poplar. Plant Cell 19: 2370–2390.Savolainen O, Lascoux M, Meril€a J. 2013. Ecological genomics of local
adaptation. Nature Reviews Genetics 14: 807–820.Savolainen O, Pyh€aj€arvi T, Kn€urr T. 2007. Gene flow and local adaptation in
trees. Annual Review of Ecology Evolution and Systematics 38: 595–619.Schwartzman A, Lin X. 2011. The effect of correlation in false discovery rate
estimation. Biometrika 98: 199–214.Seo PJ, Park CH. 2010. A membrane-bound NAC transcription factor as
integrator of biotic and abiotic stress signals. Plant Signaling & Behavior 5:481–483.
Slavov GT, DiFazio SP, Martin J, Schackwitz W, Muchero W,
Rodgers-Melnick E, Lipphardt MF, Pennacchio CP, Hellsten U, Pennacchio
LA et al. 2012. Genome resequencing reveals multiscale geographic structure
and extensive linkage disequilibrium in the forest tree Populus trichocarpa. NewPhytologist 196: 713–725.
Song YH, Ito S, Imaizumi T. 2013. Flowering time regulation: photoperiod- and
temperature-sensing in leaves. Trends in Plant Science 18: 575–583.Soolanayakanahally RY, Guy RD, Silim SN, Drewes EC, Schroeder WR. 2009.
Enhanced assimilation rate and water use efficiency with latitude through
increased photosynthetic capacity and internal conductance in balsam poplar
(Populus balsamifera L.). Plant, Cell &Environment 32: 1821–1832.Soolanayakanahally RY, Guy RD, Silim SN, Song M. 2013. Timing of
photoperiodic competency causes phenological mismatch in balsam poplar
(Populus balsamifera L.). Plant, Cell & Environment 36: 116–127.Sork VL, Aitken SN, Dyer RJ, Eckert AJ, Legendre P, Neale DB. 2013. Putting
the landscape into the genomics of trees: approaches for understanding local
adaptation and population responses to changing climate. Tree Genetics &Genomes 9: 901–911.
Sotelo-Silveira M, Cucinotta M, Chauvin AL, Ch�avez Montes RA, Colombo L,
Marsch-Mart�ınez N, de Folter S. 2013. Cytochrome P450 CYP78A9 is
involved in Arabidopsis reproductive development. Plant Physiology 162: 779–799.
Staneloni RJ, Rodriguez-Batiller MJ, Legisa D, Scarpin MR, Agalou A, Cerd�an
PD, Meijer AH, Ouwerkerk PB, Casal JJ. 2009. Bell-like homeodomain
selectively regulates the high-irradiance response of phytochrome A. Proceedingsof the National Academy of Sciences, USA 106: 13 624–13 629.
Stapley J, Reger J, Feulner PG, Smadja C, Galindo J, Ekblom R, Bennison C,
Ball AD, Beckerman AP, Slate J. 2010. Adaptation genomics: the next
generation. Trends in Ecology & Evolution 25: 705–712.Synek L, Schlager N, Eli�as M, Quentin M, Hauser MT, Z�arsk�y V. 2006.
AtEXO70A1, a member of a family of putative exocyst subunits specifically
expanded in land plants, is important for polar growth and plant development.
Plant Journal 48: 54–72.Tuskan GA, DiFazio S, Jansson S, Bohlmann J, Grigoriev I, Hellsten U, Putnam
N, Ralph S, Rombauts S, Salamov A et al. 2006. The genome of black
cottonwood, Populus trichocarpa (Torr. & Gray). Science 313: 1596–1604.Vandenkoornhuyse P, Dufresne A, Quaiser A, Gouesbet G, Binet F,
Francez AJ, Mah�e S, Bormans M, Lagadeuc Y, Cou�ee I. 2010.
Integration of molecular functions at the ecosystemic level: breakthroughs
and future goals of environmental genomics and post-genomics. EcologyLetters 13: 776–791.
Wang D, Sun Y, Stang P, Berlin JA, Wilcox MA, Li Q. 2009. Comparison of
methods for correcting population stratification in a genome-wide association
study of rheumatoid arthritis: principal component analysis versus
multidimensional scaling. BMC Proceedings 3(Suppl 7): S109.Wang Y, Mortimer JC, Davis J, Dupree P, Keegstra K. 2013. Identification of
an additional protein involved in mannan biosynthesis. Plant Journal 73:105–117.
Weir BS, Hill WG, Cardon LR. 2004. Allelic association patterns for a dense
SNP map. Genetic Epidemiology 24: 442–450.Xie C-Y, Ying CC, Yanchuk AD, Holowachuk DL. 2009. Ecotypic mode of
regional differentiation caused by restricted gene migration: a case in black
cottonwood (Populus trichocarpa) along the Pacific Northwest coast. CanadianJournal of Forest Research 39: 519–526.
Yeaman S. 2013. Genomic rearrangements and the evolution of clusters of locally
adaptive loci. Proceedings of the National Academy of Sciences, USA 110: E1743–E1751.
Yu J, Pressoir G, Briggs WH, Vroh Bi I, Yamasaki M, Doebley JF, McMullen
MD, Gaut BS, Nielsen DM, Holland JB et al. 2006. A unified mixed-model
method for association mapping that accounts for multiple levels of relatedness.
Nature Genetics 38: 203–208.
Supporting Information
Additional supporting information may be found in the onlineversion of this article.
Fig. S1Compiled Q–Q plots for all phenology traits indicatingfive structure model choices (simple, P, Q, K, P +K, Q +K).
Fig. S2Compiled Q–Q plots for all biomass traits indicating fivestructure model choices (simple, P, Q, K, P +K, Q +K).
Fig. S3Compiled Q–Q plots for all ecophysiology traits indicatingfive structure model choices (simple, P, Q, K, P +K, Q +K).
Fig. S4 Proportion of the phenotypic variance explained by sig-nificant SNP–trait associations (cumulative R2) for each traitwithin each trait category at P < 1.79 10�6.
Fig. S5 Proportion of the phenotypic variance explained by sig-nificant SNP–trait associations (cumulative R2) vs broad-senseheritability values (H2) of phenotypic traits.
Table S1 (a) Phenotypic trait data in Populus trichocarpa used forgenome-wide association study; (b) genotypic SNP data Populustrichocarpa used for genome-wide association study
New Phytologist (2014) � 2014 The Authors
New Phytologist� 2014 New Phytologist Trustwww.newphytologist.com
Research
NewPhytologist18
Table S2 Bayesian Information Criterion (BIC) indicating loglikelihood values for model selection in genome-wide associationstudy
Table S3Comparison of significant genes and SNPs fromgenome-wide association study by chromosome
Table S4 Annotations of SNPs uncovered from ‘Nisqually-1’genome Populus trichocarpa v2.2 to v3.0
Table S5 Full details of SNP–trait associations using genome-wide association studies indicating population structurecorrection model, associated P-values, significance (a), markerR2, closest Arabidopsis homolog and putative gene function/annotation
Table S6 Pairwise linkage disequilibrium (LD) r2 values betweenall SNP markers significant at P < 1.79 10�6
Table S7Comparison of Gene Ontology (GO) terms (catego-rized as function or process) assigned to genes uncovered
through SNP discovery (P < 1.79 10�6) and genes on thearray
Table S8Candidate genes/SNPs with multiple associations totraits and average phenotypic value associated with each allelicvariant
Table S9 Pairwise linkage disequilibrium (LD) r2 values betweenSNP markers of different genes with effects across multiple traitcategories
Table S10Genetic trait correlations among biomass, ecophysiol-ogy, and phenology traits indicating Pearson’s Product-MomentCorrelation coefficients (r)
Please note: Wiley Blackwell are not responsible for the contentor functionality of any supporting information supplied by theauthors. Any queries (other than missing material) should bedirected to the New Phytologist Central Office.
New Phytologist is an electronic (online-only) journal owned by the New Phytologist Trust, a not-for-profit organization dedicatedto the promotion of plant science, facilitating projects from symposia to free access for our Tansley reviews.
Regular papers, Letters, Research reviews, Rapid reports and both Modelling/Theory and Methods papers are encouraged. We are committed to rapid processing, from online submission through to publication ‘as ready’ via Early View – our average timeto decision is <25 days. There are no page or colour charges and a PDF version will be provided for each article.
The journal is available online at Wiley Online Library. Visit www.newphytologist.com to search the articles and register for tableof contents email alerts.
If you have any questions, do get in touch with Central Office ([email protected]) or, if it is more convenient,our USA Office ([email protected])
For submission instructions, subscription and all the latest information visit www.newphytologist.com
� 2014 The Authors
New Phytologist� 2014 New Phytologist TrustNew Phytologist (2014)
www.newphytologist.com
NewPhytologist Research 19
Related Documents