TECHNICAL ADVANCE A microarray-based genotyping and genetic mapping approach for highly heterozygous outcrossing species enables localization of a large fraction of the unassembled Populus trichocarpa genome sequence Derek R. Drost 1,2 , Evandro Novaes 2 , Carolina Boaventura-Novaes 2 , Catherine I. Benedict 2 , Ryan S. Brown 2 , Tongming Yin 3,4 , Gerald A. Tuskan 3,5 and Matias Kirst 1,2,6,* 1 Graduate Program in Plant Molecular and Cellular Biology, University of Florida, Gainesville, FL 32611, USA, 2 School of Forest Resources and Conservation, University of Florida, Gainesville, FL 32611, USA, 3 Environmental Sciences Division, Oak Ridge National Laboratory, Oak Ridge, TN 37831, USA, 4 The Key Laboratory of Forest Genetics and Gene Engineering, Nanjing Forestry University, Nanjing 210037, China, 5 Department of Plant Sciences, University of Tennessee, Knoxville, TN 37996, USA, and 6 Genetics Institute, University of Florida, Gainesville, FL 32611, USA Received 10 October 2008; accepted 27 January 2009; published online 18 March 2009. * For correspondence (fax +1 352 846 1277; e-mail mkirst@ufl.edu). SUMMARY Microarrays have demonstrated significant power for genome-wide analyses of gene expression, and recently have also revolutionized the genetic analysis of segregating populations by genotyping thousands of loci in a single assay. Although microarray-based genotyping approaches have been successfully applied in yeast and several inbred plant species, their power has not been proven in an outcrossing species with extensive genetic diversity. Here we have developed methods for high-throughput microarray-based genotyping in such species using a pseudo-backcross progeny of 154 individuals of Populus trichocarpa and P. deltoides analyzed with long-oligonucleotide in situ-synthesized microarray probes. Our analysis resulted in high-confidence geno- types for 719 single-feature polymorphism (SFP) and 1014 gene expression marker (GEM) candidates. Using these genotypes and an established microsatellite (SSR) framework map, we produced a high-density genetic map comprising over 600 SFPs, GEMs and SSRs. The abundance of gene-based markers allowed us to localize over 35 million base pairs of previously unplaced whole-genome shotgun (WGS) scaffold sequence to putative locations in the genome of P. trichocarpa. A high proportion of sampled scaffolds could be verified for their placement with independently mapped SSRs, demonstrating the previously un-utilized power that high- density genotyping can provide in the context of map-based WGS sequence reassembly. Our results provide a substantial contribution to the continued improvement of the Populus genome assembly, while demonstrat- ing the feasibility of microarray-based genotyping in a highly heterozygous population. The strategies presented are applicable to genetic mapping efforts in all plant species with similarly high levels of genetic diversity. Keywords: Populus, microarray, single-feature polymorphism, gene expression marker, genome assembly. INTRODUCTION Microarrays revolutionized the study of gene expression, and have recently been applied for high-throughput geno- typing of sequence- and expression-level polymorphisms. Single-feature polymorphisms (SFPs) detected by differen- tial hybridization of genomic DNA to whole-genome microarrays were first reported in yeast (Winzeler et al., 1054 ª 2009 The Authors Journal compilation ª 2009 Blackwell Publishing Ltd The Plant Journal (2009) 58, 1054–1067 doi: 10.1111/j.1365-313X.2009.03828.x

Welcome message from author
This document is posted to help you gain knowledge. Please leave a comment to let me know what you think about it! Share it to your friends and learn new things together.
Transcript
TECHNICAL ADVANCE
A microarray-based genotyping and genetic mappingapproach for highly heterozygous outcrossing speciesenables localization of a large fraction of the unassembledPopulus trichocarpa genome sequence
Derek R. Drost1,2, Evandro Novaes2, Carolina Boaventura-Novaes2, Catherine I. Benedict2, Ryan S. Brown2, Tongming Yin3,4,
Gerald A. Tuskan3,5 and Matias Kirst1,2,6,*
1Graduate Program in Plant Molecular and Cellular Biology, University of Florida, Gainesville, FL 32611, USA,2School of Forest Resources and Conservation, University of Florida, Gainesville, FL 32611, USA,3Environmental Sciences Division, Oak Ridge National Laboratory, Oak Ridge, TN 37831, USA,4The Key Laboratory of Forest Genetics and Gene Engineering, Nanjing Forestry University, Nanjing 210037, China,5Department of Plant Sciences, University of Tennessee, Knoxville, TN 37996, USA, and6Genetics Institute, University of Florida, Gainesville, FL 32611, USA
Received 10 October 2008; accepted 27 January 2009; published online 18 March 2009.*For correspondence (fax +1 352 846 1277; e-mail [email protected]).
SUMMARY
Microarrays have demonstrated significant power for genome-wide analyses of gene expression, and recently
have also revolutionized the genetic analysis of segregating populations by genotyping thousands of loci in a
single assay. Although microarray-based genotyping approaches have been successfully applied in yeast and
several inbred plant species, their power has not been proven in an outcrossing species with extensive genetic
diversity. Here we have developed methods for high-throughput microarray-based genotyping in such species
using a pseudo-backcross progeny of 154 individuals of Populus trichocarpa and P. deltoides analyzed with
long-oligonucleotide in situ-synthesized microarray probes. Our analysis resulted in high-confidence geno-
types for 719 single-feature polymorphism (SFP) and 1014 gene expression marker (GEM) candidates. Using
these genotypes and an established microsatellite (SSR) framework map, we produced a high-density genetic
map comprising over 600 SFPs, GEMs and SSRs. The abundance of gene-based markers allowed us to localize
over 35 million base pairs of previously unplaced whole-genome shotgun (WGS) scaffold sequence to putative
locations in the genome of P. trichocarpa. A high proportion of sampled scaffolds could be verified for their
placement with independently mapped SSRs, demonstrating the previously un-utilized power that high-
density genotyping can provide in the context of map-based WGS sequence reassembly. Our results provide a
substantial contribution to the continued improvement of the Populus genome assembly, while demonstrat-
ing the feasibility of microarray-based genotyping in a highly heterozygous population. The strategies
presented are applicable to genetic mapping efforts in all plant species with similarly high levels of genetic
diversity.
Keywords: Populus, microarray, single-feature polymorphism, gene expression marker, genome assembly.
INTRODUCTION
Microarrays revolutionized the study of gene expression,
and have recently been applied for high-throughput geno-
typing of sequence- and expression-level polymorphisms.
Single-feature polymorphisms (SFPs) detected by differen-
tial hybridization of genomic DNA to whole-genome
microarrays were first reported in yeast (Winzeler et al.,
1054 ª 2009 The AuthorsJournal compilation ª 2009 Blackwell Publishing Ltd
The Plant Journal (2009) 58, 1054–1067 doi: 10.1111/j.1365-313X.2009.03828.x
1998; Brem et al., 2002) and Arabidopsis (Borevitz et al.,
2003; Singer et al., 2006), and later in rice (Kumar et al.,
2007). Subsequent reports showed that hybridization of RNA
could also identify SFPs in haploid yeast (Ronald et al., 2005)
and several inbred plants (Cui et al., 2005; Rostoks et al.,
2005; West et al., 2006, 2007; Luo et al., 2007; Coram et al.,
2008), while concurrently generating estimates of gene
expression from segregants (Ronald et al., 2005; West et al.,
2007). Utilizing RNA to characterize SFPs also creates the
opportunity to identify gene expression markers (GEMs) –
genes that are differentially expressed between parents of
mapping populations and show Mendelian segregation of
expression values within progeny (West et al., 2006). Gen-
erating genotypic and gene expression data in a common
assay establishes a framework for powerful forward-genetic
approaches, including genetical genomics studies (Jansen
and Nap, 2001). However, while microarray-based mapping
has been successfully applied to haploid or homozygote
lines, the approach has yet to be demonstrated in out-
crossing plant species with high genetic diversity, in which
up to four alleles can segregate for each locus in a full-
sibling pedigree.
RNA-based SFP genotyping requires robust separation of
the microarray signal variance associated with differential
hybridization kinetics between alleles from the variance due
to differences in mRNA abundance (Ronald et al., 2005).
Previous studies in species with limited genetic diversity
have relied on short (£25-mer) oligonucleotide probes to
detect genetic variants, because a unique single-nucleotide
polymorphism (SNP) can result in differential hybridization
and detection of SFP (Kirst et al., 2006). Short oligonucleo-
tide-based microarrays typically utilize multiple probes per
gene (a probe set) to estimate gene expression. Thus, SFP-
containing probes can be detected by comparing individual
probe signals with the signal measured across the probe set.
Probes for which the signal deviates significantly from the
probe set mean in a subset of the segregating population
suggest the presence of a segregating SFP, while the
remainder of the probe set provides an estimate of gene
expression (Ronald et al., 2005; West et al., 2006; Luo et al.,
2007). However, in outcrossing species with extensive
genetic diversity, abundant SNP variation and heterozygos-
ity can result in significant bias for estimates of gene
expression, as SFPs may be present within many probes in
a given probe set (Kirst et al., 2006). Such biases render
platforms that utilize short probes less reliable for concur-
rent analysis of gene expression and genetic polymor-
phisms in these experimental settings. Utilizing long
oligonucleotide probes may improve estimates of gene
expression in these cases. However, approaches to select
optimal long oligonucleotide probes for gene expression
analysis in highly diverse species or across multiple related
species and their hybrids are lacking. Similarly, the ability
of longer probes to detect a useful quantity of segregating
polymorphisms for genetic mapping has yet to be
demonstrated.
Our first objective in this study was to develop an
approach to select optimal long oligonucleotide probes for
gene expression analysis and microarray-based genotyping
in a highly heterozygous population. We utilized an inter-
specific pseudo-backcross of P. trichocarpa · P. deltoides
and a long-oligonucleotide (>50-mer) microarray platform to
develop a two-step method to discover candidate SFP in
parent lines, then genotype sequence- and expression-
based polymorphic features in the progeny. We show that
genotypic data generated by this method can contribute to
the development of an accurate high-density, gene-based
genetic map. Additionally, the value of these markers is
demonstrated by the positioning of almost half of the
previously unassembled whole-genome shotgun (WGS)
sequence scaffolds within the complex and highly hetero-
zygous genome of P. trichocarpa. The results we describe
provide an indication of both the challenges and opportu-
nities presented when undertaking a microarray-based
genetic mapping study in a genetically diverse plant species.
We believe that the techniques we present provide a strong
framework for future microarray-based genotyping in crops,
forest tree species, and other complex plant genomes.
Similarly, our approach for optimal probe selection for gene
expression analysis within or between highly diverse spe-
cies may prove useful for other agricultural and forest tree
species with similar levels of genetic diversity.
RESULTS
SSR framework map of genotype 52-225
We constructed a single-tree framework microsatellite map
(Figure S1) for the maternal P. trichocarpa · P. deltoides
hybrid parent (genotype 52-225) of family 52-124 based on
167 SSR markers, using a pseudo-testcross strategy
(Grattapaglia and Sederoff, 1994; Ma et al., 2008). The
framework map represented the 19 consensus linkage
groups (LG) of poplar (Cervera et al., 2001), although an
unresolved gap remained in linkage group (LG) VI due to a
lack of informative markers in this region. Markers shared
with the genetic map of genotype 52-225 produced for a
different population (family 13, for which the genotype also
serves as the maternal parent; Yin et al., 2004) were largely
collinear. Framework SSR loci represented a subset of the
sequence-tagged sites used to assemble the P. trichocarpa
WGS contigs and scaffolds into chromosomes (Tuskan
et al., 2006). Based on this information, we anchored and
oriented the framework map relative to the genome
assembly. The framework map spanned 2970 cM, with
mean marker intervals of 17.8 cM, and served as the basis
for subsequent grouping of SFP and GEM markers into
linkage groups.
Microarray-based Populus genotyping and mapping 1055
ª 2009 The AuthorsJournal compilation ª 2009 Blackwell Publishing Ltd, The Plant Journal, (2009), 58, 1054–1067
Identification of probes for genotyping family 52-124
A microarray analysis was initially performed in each parent
line to (i) identify candidate SFP probes segregating in the
pedigree and (ii) identify a single optimal probe for gene
expression analysis in the progeny. To develop a microarray
platform that could be used for concurrent genotyping and
transcript profiling of the progeny of family 52-124, we
began by testing six or seven probes per gene in the two
parents. The custom platform comprised 384 287 60-mer
probes representing 55 793 annotated gene models (probe
sets) from the sequenced genome of P. trichocarpa. This
gene set included 45 555 predicted gene models reported
previously, plus 10 238 ESTs and less supported gene
models with transcriptional evidence (Tuskan et al., 2006).
For the probe selection study, RNA extracted from the
root, leaf and secondary xylem of each parent of family 52-
124 was converted to double-stranded cDNA, labeled, and
hybridized to the microarrays. After normalization, the data
were assessed by analysis of variance (ANOVA), with geno-
type, tissue, tissue-by-genotype interaction, probe and
genotype-by-probe interaction effects. Genotype effect
accounts for overall differences in signal in a probe set
between the two parental genotypes, and primarily reflects
a difference in gene expression level between them
[Figure 1(c,d)]. The tissue effect accounts for differences in
(a) (b)
(d)(c)
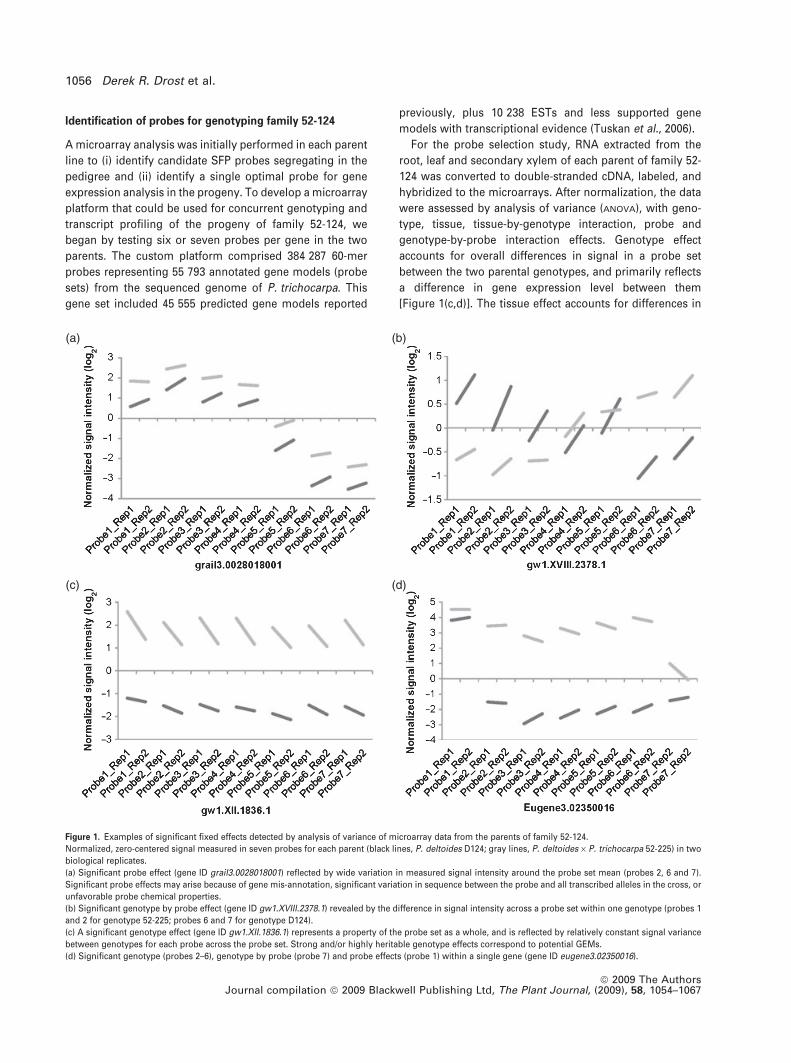
Figure 1. Examples of significant fixed effects detected by analysis of variance of microarray data from the parents of family 52-124.
Normalized, zero-centered signal measured in seven probes for each parent (black lines, P. deltoides D124; gray lines, P. deltoides · P. trichocarpa 52-225) in two
biological replicates.
(a) Significant probe effect (gene ID grail3.0028018001) reflected by wide variation in measured signal intensity around the probe set mean (probes 2, 6 and 7).
Significant probe effects may arise because of gene mis-annotation, significant variation in sequence between the probe and all transcribed alleles in the cross, or
unfavorable probe chemical properties.
(b) Significant genotype by probe effect (gene ID gw1.XVIII.2378.1) revealed by the difference in signal intensity across a probe set within one genotype (probes 1
and 2 for genotype 52-225; probes 6 and 7 for genotype D124).
(c) A significant genotype effect (gene ID gw1.XII.1836.1) represents a property of the probe set as a whole, and is reflected by relatively constant signal variance
between genotypes for each probe across the probe set. Strong and/or highly heritable genotype effects correspond to potential GEMs.
(d) Significant genotype (probes 2–6), genotype by probe (probe 7) and probe effects (probe 1) within a single gene (gene ID eugene3.02350016).
1056 Derek R. Drost et al.
ª 2009 The AuthorsJournal compilation ª 2009 Blackwell Publishing Ltd, The Plant Journal, (2009), 58, 1054–1067
expression detected by a probe set between different
tissues, regardless of the genotype being profiled. The
probe effect detects the specific properties of a probe that
distinguish it from others in a probe set, independent of
parent genotype [Figure 1(a,d)]. Finally, the genotype-by-
probe interaction accounts for specific properties of a probe
that distinguish it from the rest of the probe set, depending
on the genotype being analyzed. Dependence on genotype
suggests that these probes contain SFP between the
parental genotypes that may segregate in the progeny
[Figure 1(b,d)].
To identify candidate probes for SFP genotyping, two
separate analyses were performed. In the first, a t-test was
used to contrast least-square mean estimates of the interac-
tion between the two parental genotypes at each probe
across all tissues. A probe within a probe set may be biased
towards one or the other parent due to differential hybrid-
ization (i.e. an SFP), and therefore is a candidate to be tested
for segregation in the progeny. Furthermore, only probes for
which the difference in least-square means between the
parental lines exceeded an arbitrary fourfold threshold were
selected. We identified 2875 probes meeting these criteria
(false-discovery rate < 0.1; P < 0.0085). When more than one
probe from a probeset was identified, we selected the most
significantly interacting probe. In total, candidate SFP probes
were identified for 912 genes. Among these, 770 exhibited
hybridization bias favoring the 52-225 hybrid parent, while
142 demonstrated stronger hybridization in the D124 P. del-
toides parent. These results are expected because the
microarray probes were designed based on the genome
sequence of P. trichocarpa (Tuskan et al., 2006), one of the
species contributing to the hybrid parent. Therefore, we
hypothesized that the majority of candidate SFPs may be
explained by species-level polymorphism between P. tricho-
carpa and P. deltoides alleles. Based on this hypothesis, and
the inter-specific pseudo-backcross pedigree structure, com-
prising one P. trichocarpa and three P. deltoides alleles, we
expected that most SFP and GEM alleles showing simple
Mendelian inheritance should segregate at a ratio of 1:1.
To identify additional candidate SFP probes for genotyp-
ing and mapping in the progeny, we re-analyzed the parental
expression data derived from secondary xylem in a separate
ANOVA. Similar to the previous analysis, we contrasted each
parent’s interaction with individual probes within a probe
set, and selected those that were significant (FDR < 0.1,
P < 0.0051) with at least a threefold difference in least-
square means estimates. The separate analysis focusing on
xylem tissue was conceived after previous work showed this
tissue to be among the most transcriptionally diverse in
Populus (Tuskan et al., 2006). From this dataset, we initially
identified 13 191 additional candidate SFP probes, including
8986 with hybridization bias favoring the hybrid parent and
4205 with hybridization bias favoring the P. deltoides parent.
By again selecting only the most significantly interacting
probe in each probe set, we identified an additional 11 172
genes harboring candidate SFPs. In total, our two analyses
identified single specific probes from 12 084 genes contain-
ing candidate SFPs, which were subsequently carried
forward for analysis of the progeny.
Identification of probes for transcript profiling
of family 52-124
A second objective of the microarray analysis of parental
genotypes was to identify a single optimal probe for
expression analysis of the 55 793 gene models in the 52-124
progeny. To identify probes that were unbiased for gene
expression analysis in both parental species backgrounds,
we assumed that the probe set mean best represents the
true expression value in each parent. Therefore, in contrast
to the previous analysis, the goal was to select the probe that
performs most consistently within the probe set in both
parents [Figure 1(a)].
To select the optimal probe for gene expression analysis,
an iterative selection process was implemented. First, for
each gene, probes were ranked based on the deviation of the
least-square mean estimate of each probe effect, relative to
the probe set mean. Lack of significant deviation from
the probe set mean suggest that inherent properties of the
probe do not contribute bias to the signal detected at that
probe. Next, the highest ranking probe was analyzed for its
sequence alignment uniqueness scores assigned during
probe design. Only probes with no more than one unique
match to the Populus genome sequence were further
considered. Finally, probes were evaluated for significant
genotype-by-probe interaction (FDR < 0.1). In cases where
the probe was not unique or showed a significant genotype-
by-probe interaction, the next highest ranked probe was
evaluated (i.e. next step of the iteration). After seven iterative
rounds of selection, all probes had been considered by these
criteria, and probes to measure gene expression were
selected for 46 001 genes.
Selection for the remaining 9792 genes was based on
a rank variable provided by NimbleGen (http://www.
nimblegen.com). The rank variable concurrently accounts
for probe chemical properties and probe uniqueness charac-
teristics. The highest ranked probe for each gene exhibiting a
non-significant probe effect and genotype-by-probe interac-
tion effect was selected. For 149 genes, all probes in the probe
set exhibited a significant probe effect or genotype-by-probe
interaction. Single probes were chosen for these genes solely
on the basis of the NimbleGen rank variable.
Genotyping SFP and GEM probes in the progeny
of family 52-124
To evaluate the candidate SFP probes identified in the parent
genotypes, we assayed RNA abundance in xylem tissue
Microarray-based Populus genotyping and mapping 1057
ª 2009 The AuthorsJournal compilation ª 2009 Blackwell Publishing Ltd, The Plant Journal, (2009), 58, 1054–1067
from 154 progeny of family 52-124. A modified microarray
was designed, comprising the single selected expression
probe per gene for each of the 55 793 gene models and the
12 084 candidate SFP probes. Loci were genotyped using a
k-means clustering allele-calling procedure (see Experi-
mental procedures). Normalized data for each of the 67 877
experimental probes was grouped into two separate clus-
ters, and frequency of cluster membership was tested for 1:1
segregation (v2d:f:¼1<3:84, P > 0.05). A total of 12 680 features
followed the expected Mendelian segregation pattern,
including 9782 probes selected for gene expression analysis
(17.5%) and 2898 of the candidate SFP probes (24.0%). Gene
expression probes that segregate in the mapping population
may be utilized as GEMs, and were therefore considered in
further analyses.
Next, signal separation between allelic classes was eval-
uated using a modified normal deviate (see Experimental
procedures), and probes resulting in >10% ambiguous allele
assignments were removed. Reliable genotypes in >90% of
the progeny were obtained for 1733 probes, including 1014
GEMs and 719 SFPs (1.8 and 6.0% of the total, respectively).
The 1733 segregating features correspond to 1610 indepen-
dent gene models – segregating probes corresponding to
both GEM and SFP were identified for 123 gene models.
Genetic mapping of genotype 52-225
The 1733 candidate SFP and GEM probes were utilized to
generate a genetic map of genotype 52-225. Marker group-
ing, ordering and mapping were performed as described
previously (West et al., 2006) with slight modifications (see
Experimental procedures). To correct for genotypic errors
and ambiguities in the resulting linkage groups, markers
were re-genotyped after localization of recombination
breakpoints using structural change analysis (Singer et al.,
2006). In addition to the 167 framework SSRs, we unam-
biguously localized 324 SFP and 117 GEM loci in the map of
52-225 (Table 1, Figure 2 and Table S1). For most linkage
groups, and the genome as a whole, the mean marker
intervals were <5 cM. The total genome length was
2798.5 cM, in good agreement with recently published
genetic maps for inter-specific crosses of Populus (Yin et al.,
2004). The overall rate of marker placement error was low:
for genes known to be physically located on specific chro-
mosomes in the P. trichocarpa WGS sequence assembly,
ten were not placed in their predicted linkage group – an
error rate of 3.52% (10/284). Of the misplaced markers, seven
corresponded to SFPs and three to GEMs. These ten markers
were subsequently excluded from the map.
Physical orientation of the 52-225 genetic map
We oriented and aligned the 52-225 genetic map to the
chromosome-level WGS assembly of P. trichocarpa Nisqu-
ally-1 based on physical positions of genes interrogated by
SFP and GEM probes (Tuskan et al., 2006) and our previously
anchored SSR loci. The predicted genetic orientation and
physical orientation were usually collinear; several small
inversions were detected that may be the result of error in
map ordering or may represent true differences in gene order
between various P. trichocarpa clones or between P. tricho-
carpa and P. deltoides (data not shown). Slight variations in
map order between Nisqually-1 and 52-225 have been
reported elsewhere (Yin et al., 2008). On average, the pre-
dicted physical intervals between ordered markers contain
84.4 genes; however, the range is wide (1–624 genes). The
mean physical distance spanned by marker intervals is
725 kb, and ranges from 146 bp to 5.31 million bp (Mbp).
Genetic mapping of the unassembled Populus genome
Approximately 7700 sequence scaffolds from the WGS
assembly are not assigned to specific linkage groups in
version 1.1 of the P. trichocarpa genome sequence. These
scaffolds vary in size from <100 bp to >3.5 Mbp (mean
approximately 16.8 kb), and represent 75 Mbp of unplaced
sequence (Tuskan et al., 2006). Much of this sequence was
postulated to be heterochromatic or derived from substan-
tially divergent haplotypes in the sequenced clone (Tuskan
et al., 2006; Kelleher et al., 2007). Our microarray-based
mapping results provided an unprecedented opportunity to
anchor a large amount of this unplaced sequence to poten-
tial genomic locations in P. trichocarpa based on the genes
physically localized within these sequence scaffolds. Of our
1733 candidate GEM and SFP markers, 783 were contained
in genes residing in 492 sequence scaffolds. We successfully
mapped 167 of these 783 loci, thereby locating 116 sequence
scaffolds to unique genetic positions in linkage groups
(Table 2 and Table S2). Five remaining scaffolds showed
linkage to other markers in the map, but could not be
unambiguously placed within a single linkage group (data
not shown). This error rate associated with scaffold mapping
(4.13%; 5/121) is congruent with the mapping error rate
observed for markers with known position in the linkage-
group WGS assembly (see above). The 116 sequence
scaffolds localized on the genetic map correspond to
35.7 Mbp of WGS sequence assembly, or nearly 50% of the
Table 1 Summary of F tests for fixed effects in the mixed ANOVA
performed on parent tree microarray data
Genotype TissueTissue bygenotype Probe
Genotypeby probe
Significant 7909 34 326 18 470 51 821 3355Non-significant 47 884 21 467 37 323 3972 52 438
Significance was judged at FDR < 0.025. Details of the significance ofF statistics for these fixed effects on a per gene basis (at FDR < 0.025)are given in Table S5.
1058 Derek R. Drost et al.
ª 2009 The AuthorsJournal compilation ª 2009 Blackwell Publishing Ltd, The Plant Journal, (2009), 58, 1054–1067
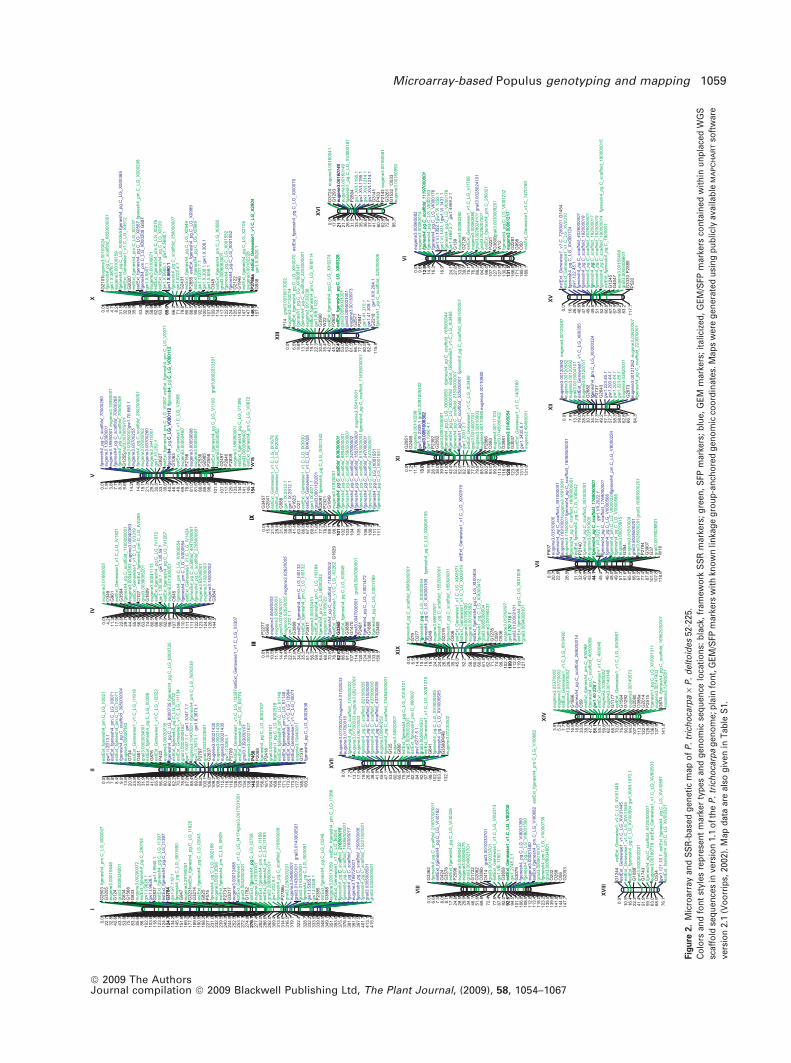
Fig
ure
2.
Mic
roar
ray
and
SS
R-b
ased
gen
etic
map
of
P.
tric
ho
carp
a·
P.
del
toid
es52
-225
.
Co
lors
and
fon
tst
yles
rep
rese
nt
mar
ker
typ
esan
dg
eno
mic
seq
uen
celo
cati
on
s:b
lack
,fr
amew
ork
SS
Rm
arke
rs;
gre
en,
SFP
mar
kers
;b
lue,
GE
Mm
arke
rs;
ital
iciz
ed,
GE
M/S
FPm
arke
rsco
nta
ined
wit
hin
un
pla
ced
WG
S
scaf
fold
seq
uen
ces
inve
rsio
n1.
1o
fth
eP
.tr
ich
oca
rpa
gen
om
e;p
lain
fon
t,G
EM
/SFP
mar
kers
wit
hkn
ow
nlin
kag
eg
rou
p-a
nch
ore
dg
eno
mic
coo
rdin
ates
.Map
sw
ere
gen
erat
edu
sin
gp
ub
licly
avai
lab
leM
AP
CH
AR
Tso
ftw
are
vers
ion
2.1
(Vo
orr
ips,
2002
).M
apd
ata
are
also
giv
enin
Tab
leS
1.
Microarray-based Populus genotyping and mapping 1059
ª 2009 The AuthorsJournal compilation ª 2009 Blackwell Publishing Ltd, The Plant Journal, (2009), 58, 1054–1067
unlinked sequence (Table 3). Among these mapped scaf-
folds, 34 (representing 23.3 Mbp) could be linked by two or
more markers, enabling orientation of the sequence strands
comprising the scaffolds (Table S2).
Verification of map position for unassembled sequence
scaffolds
To confirm that our assembly of genomic scaffolds using
SFPs and GEMs was reliable, we verified the position of a
subset of mapped scaffolds using SSRs. From the
P. trichocarpa version 1.1 sequence scaffolds (Tuskan et al.,
2006), we identified SSR loci within nine distinct scaffolds
mapped using GEM and SFP markers, and designed PCR
primers in their flanking sequences. After amplification and
genotyping, we mapped these SSR loci on the basis of the
original framework SSR map only, to eliminate any bias that
may be introduced due to genotyping error in linkage group-
anchored SFP and GEM alleles. For eight of the nine scaf-
folds, we successfully verified the putative map location of
the scaffold sequence with respect to the framework SSRs
(Table 4 and Figure S1). The relative genetic distances
between scaffold-anchored markers in both the SFP/GEM-
based map and the SSR framework map were also in
agreement (Table 4).
The only scaffold (scaffold_121) for which we could not
verify a map position using this technique was localized on
the basis of a single GEM to LG_XVIII, whereas data from
two SSR consistently positioned it within LG_VI. We spec-
ulated that this result was attributable to strong trans-acting
regulator on LG_XVIII acting on the gene characterized as a
GEM. As GEMs may be the result of either cis- or trans-acting
variation, we were interested to determine whether scaffolds
mapped based on single GEM loci were less reliable with
regard to genetic positioning. We studied the remaining 13
scaffolds that were localized on the basis of single GEMs in
our map, and identified informative SSR in 6 of these 13
scaffolds. Using the framework SSR map, we successfully
verified the predicted genetic placement of five of these six
GEM-anchored scaffolds (Figure S1 and Table S3). The
single unverified scaffold (scaffold_250) localized to the
same linkage group, but a different SSR bin, than predicted
by the GEM locus (Table S3).
Characterization of sequence-level allelic variation
represented by mapped SFPs
SFPs detected by short (£25-mer) oligonucleotide probes
often correspond to one or a few SNPs or small indels (Kirst
et al., 2006; Luo et al., 2007; Das et al., 2008). However, the
implication of sequence mismatches on signal detected
from long oligonucleotide probes has only recently been
described (Rennie et al., 2008). Thus, we characterized the
allelic variations present in a sample of mapped SFP probes
from the microarray platform. Using double-stranded cDNA
produced from xylem for each of the parent trees, we
amplified, cloned and sequenced regions corresponding to
five mapped SFP loci, and assayed polymorphisms between
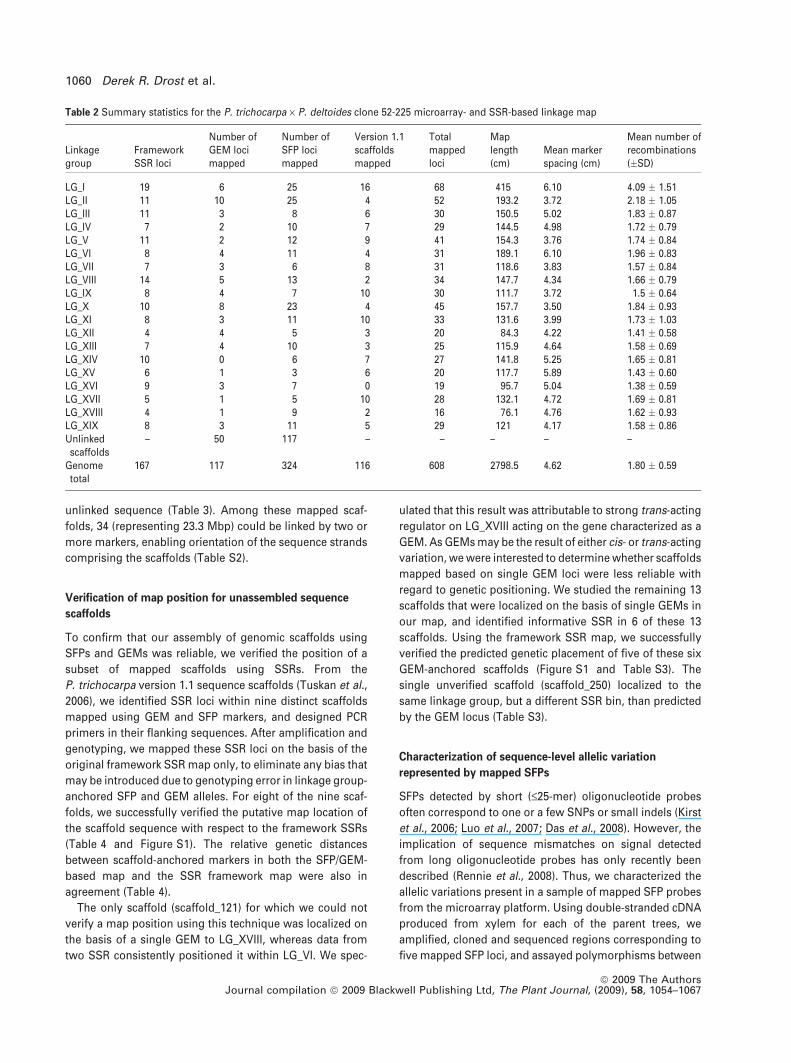
Table 2 Summary statistics for the P. trichocarpa · P. deltoides clone 52-225 microarray- and SSR-based linkage map
Linkagegroup
FrameworkSSR loci
Number ofGEM locimapped
Number ofSFP locimapped
Version 1.1scaffoldsmapped
Totalmappedloci
Maplength(cm)
Mean markerspacing (cm)
Mean number ofrecombinations(�SD)
LG_I 19 6 25 16 68 415 6.10 4.09 � 1.51LG_II 11 10 25 4 52 193.2 3.72 2.18 � 1.05LG_III 11 3 8 6 30 150.5 5.02 1.83 � 0.87LG_IV 7 2 10 7 29 144.5 4.98 1.72 � 0.79LG_V 11 2 12 9 41 154.3 3.76 1.74 � 0.84LG_VI 8 4 11 4 31 189.1 6.10 1.96 � 0.83LG_VII 7 3 6 8 31 118.6 3.83 1.57 � 0.84LG_VIII 14 5 13 2 34 147.7 4.34 1.66 � 0.79LG_IX 8 4 7 10 30 111.7 3.72 1.5 � 0.64LG_X 10 8 23 4 45 157.7 3.50 1.84 � 0.93LG_XI 8 3 11 10 33 131.6 3.99 1.73 � 1.03LG_XII 4 4 5 3 20 84.3 4.22 1.41 � 0.58LG_XIII 7 4 10 3 25 115.9 4.64 1.58 � 0.69LG_XIV 10 0 6 7 27 141.8 5.25 1.65 � 0.81LG_XV 6 1 3 6 20 117.7 5.89 1.43 � 0.60LG_XVI 9 3 7 0 19 95.7 5.04 1.38 � 0.59LG_XVII 5 1 5 10 28 132.1 4.72 1.69 � 0.81LG_XVIII 4 1 9 2 16 76.1 4.76 1.62 � 0.93LG_XIX 8 3 11 5 29 121 4.17 1.58 � 0.86Unlinkedscaffolds
– 50 117 – – – – –
Genometotal
167 117 324 116 608 2798.5 4.62 1.80 � 0.59
1060 Derek R. Drost et al.
ª 2009 The AuthorsJournal compilation ª 2009 Blackwell Publishing Ltd, The Plant Journal, (2009), 58, 1054–1067
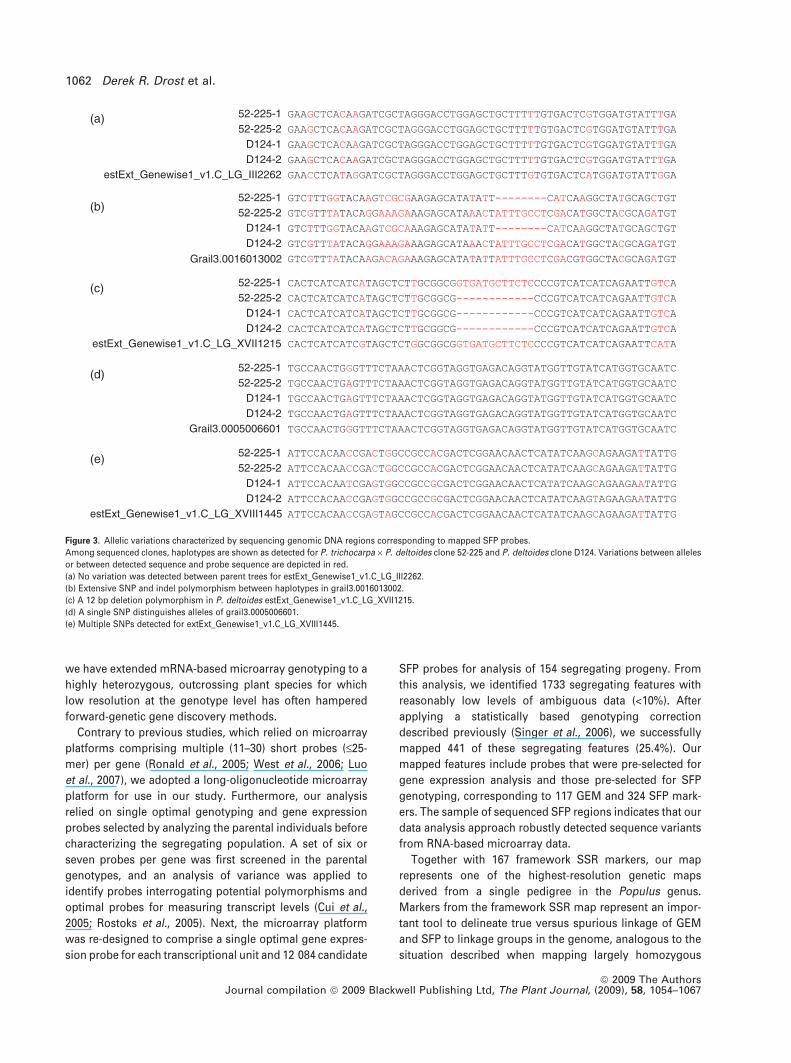
the alleles. We identified sequence-level variation ranging
from a single SNP in the 60-mer region to large indel poly-
morphisms affecting >10 bp [Figure 3(b–e)]. Of the five SFP
that we characterized, one showed no variation between
alleles within the sequence interrogated by the genotyping
probe, although sequence variation between the alleles and
probe was observed [Figure 3(a)]. Therefore, this probe may
correspond to an actual GEM that was mis-characterized as
an SFP, as previously described (Luo et al., 2007). As we
hypothesized, SFP we detected are primarily due to species-
level sequence polymorphisms between P. trichocarpa and
P. deltoides, although multiple haplotypes were identified at
two of the five probes [Figure 3(b,e)].
DISCUSSION
Parallel genotyping and gene expression quantification
using mRNA microarray hybridization data require accurate
classification of differences in signal intensity arising from
DNA sequence variants versus transcript level abundance
(Ronald et al., 2005). To separate genetic polymorphism
from differences in transcript abundance, candidate geno-
typing probes can subsequently be detected by identifying
individual probes that deviate significantly from the probe
set mean signal (which provides a balanced measure of
expression), and that segregate in the progeny. Although
first demonstrated in populations with simple genetic seg-
regation patterns (i.e. haploid, recombinant inbred line and
doubled-haploid) and species with limited genetic diversity,
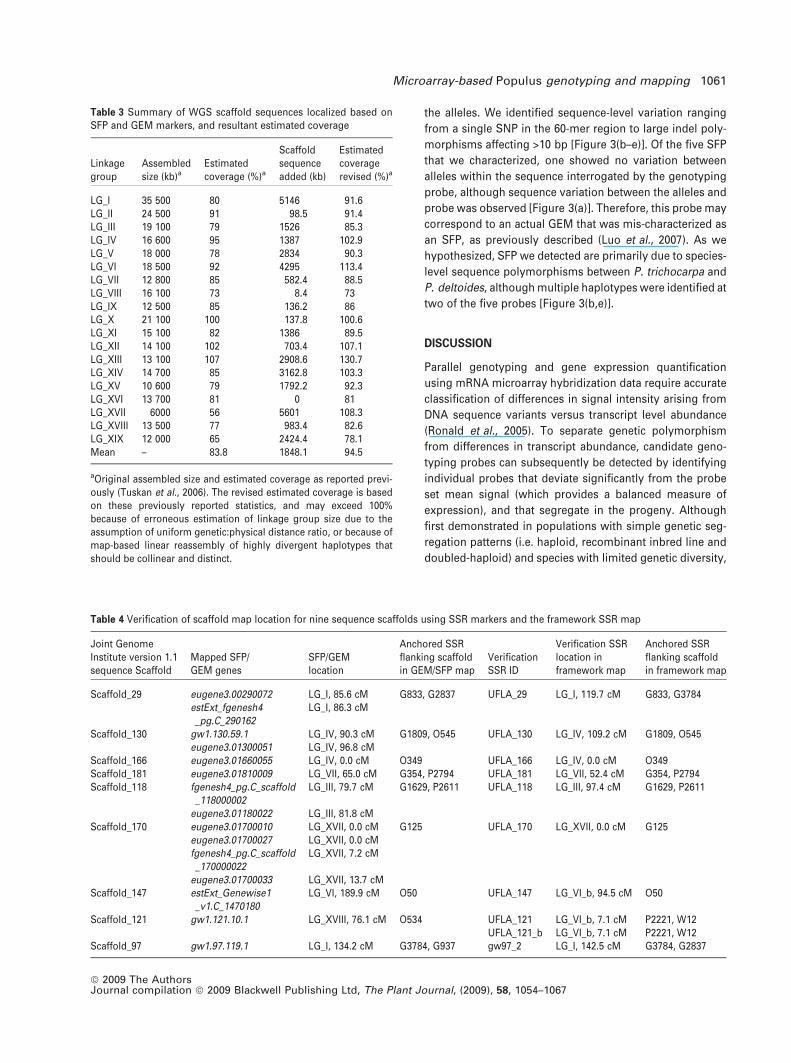
Table 3 Summary of WGS scaffold sequences localized based onSFP and GEM markers, and resultant estimated coverage
Linkagegroup
Assembledsize (kb)a
Estimatedcoverage (%)a
Scaffoldsequenceadded (kb)
Estimatedcoveragerevised (%)a
LG_I 35 500 80 5146 91.6LG_II 24 500 91 98.5 91.4LG_III 19 100 79 1526 85.3LG_IV 16 600 95 1387 102.9LG_V 18 000 78 2834 90.3LG_VI 18 500 92 4295 113.4LG_VII 12 800 85 582.4 88.5LG_VIII 16 100 73 8.4 73LG_IX 12 500 85 136.2 86LG_X 21 100 100 137.8 100.6LG_XI 15 100 82 1386 89.5LG_XII 14 100 102 703.4 107.1LG_XIII 13 100 107 2908.6 130.7LG_XIV 14 700 85 3162.8 103.3LG_XV 10 600 79 1792.2 92.3LG_XVI 13 700 81 0 81LG_XVII 6000 56 5601 108.3LG_XVIII 13 500 77 983.4 82.6LG_XIX 12 000 65 2424.4 78.1Mean – 83.8 1848.1 94.5
aOriginal assembled size and estimated coverage as reported previ-ously (Tuskan et al., 2006). The revised estimated coverage is basedon these previously reported statistics, and may exceed 100%because of erroneous estimation of linkage group size due to theassumption of uniform genetic:physical distance ratio, or because ofmap-based linear reassembly of highly divergent haplotypes thatshould be collinear and distinct.
Table 4 Verification of scaffold map location for nine sequence scaffolds using SSR markers and the framework SSR map
Joint GenomeInstitute version 1.1sequence Scaffold
Mapped SFP/GEM genes
SFP/GEMlocation
Anchored SSRflanking scaffoldin GEM/SFP map
VerificationSSR ID
Verification SSRlocation inframework map
Anchored SSRflanking scaffoldin framework map
Scaffold_29 eugene3.00290072 LG_I, 85.6 cM G833, G2837 UFLA_29 LG_I, 119.7 cM G833, G3784estExt_fgenesh4_pg.C_290162
LG_I, 86.3 cM
Scaffold_130 gw1.130.59.1 LG_IV, 90.3 cM G1809, O545 UFLA_130 LG_IV, 109.2 cM G1809, O545eugene3.01300051 LG_IV, 96.8 cM
Scaffold_166 eugene3.01660055 LG_IV, 0.0 cM O349 UFLA_166 LG_IV, 0.0 cM O349Scaffold_181 eugene3.01810009 LG_VII, 65.0 cM G354, P2794 UFLA_181 LG_VII, 52.4 cM G354, P2794Scaffold_118 fgenesh4_pg.C_scaffold
_118000002LG_III, 79.7 cM G1629, P2611 UFLA_118 LG_III, 97.4 cM G1629, P2611
eugene3.01180022 LG_III, 81.8 cMScaffold_170 eugene3.01700010 LG_XVII, 0.0 cM G125 UFLA_170 LG_XVII, 0.0 cM G125
eugene3.01700027 LG_XVII, 0.0 cMfgenesh4_pg.C_scaffold_170000022
LG_XVII, 7.2 cM
eugene3.01700033 LG_XVII, 13.7 cMScaffold_147 estExt_Genewise1
_v1.C_1470180LG_VI, 189.9 cM O50 UFLA_147 LG_VI_b, 94.5 cM O50
Scaffold_121 gw1.121.10.1 LG_XVIII, 76.1 cM O534 UFLA_121 LG_VI_b, 7.1 cM P2221, W12UFLA_121_b LG_VI_b, 7.1 cM P2221, W12
Scaffold_97 gw1.97.119.1 LG_I, 134.2 cM G3784, G937 gw97_2 LG_I, 142.5 cM G3784, G2837
Microarray-based Populus genotyping and mapping 1061
ª 2009 The AuthorsJournal compilation ª 2009 Blackwell Publishing Ltd, The Plant Journal, (2009), 58, 1054–1067
we have extended mRNA-based microarray genotyping to a
highly heterozygous, outcrossing plant species for which
low resolution at the genotype level has often hampered
forward-genetic gene discovery methods.
Contrary to previous studies, which relied on microarray
platforms comprising multiple (11–30) short probes (£25-
mer) per gene (Ronald et al., 2005; West et al., 2006; Luo
et al., 2007), we adopted a long-oligonucleotide microarray
platform for use in our study. Furthermore, our analysis
relied on single optimal genotyping and gene expression
probes selected by analyzing the parental individuals before
characterizing the segregating population. A set of six or
seven probes per gene was first screened in the parental
genotypes, and an analysis of variance was applied to
identify probes interrogating potential polymorphisms and
optimal probes for measuring transcript levels (Cui et al.,
2005; Rostoks et al., 2005). Next, the microarray platform
was re-designed to comprise a single optimal gene expres-
sion probe for each transcriptional unit and 12 084 candidate
SFP probes for analysis of 154 segregating progeny. From
this analysis, we identified 1733 segregating features with
reasonably low levels of ambiguous data (<10%). After
applying a statistically based genotyping correction
described previously (Singer et al., 2006), we successfully
mapped 441 of these segregating features (25.4%). Our
mapped features include probes that were pre-selected for
gene expression analysis and those pre-selected for SFP
genotyping, corresponding to 117 GEM and 324 SFP mark-
ers. The sample of sequenced SFP regions indicates that our
data analysis approach robustly detected sequence variants
from RNA-based microarray data.
Together with 167 framework SSR markers, our map
represents one of the highest-resolution genetic maps
derived from a single pedigree in the Populus genus.
Markers from the framework SSR map represent an impor-
tant tool to delineate true versus spurious linkage of GEM
and SFP to linkage groups in the genome, analogous to the
situation described when mapping largely homozygous
52-225-1 52-225-2
D124-1 D124-2
estExt_Genewise1_v1.C_LG_III2262
52-225-1 52-225-2
D124-1 D124-2
Grail3.0016013002
52-225-1 52-225-2
D124-1 D124-2
estExt_Genewise1_v1.C_LG_XVII1215
52-225-1 52-225-2
D124-1 D124-2
Grail3.0005006601
52-225-1 52-225-2
D124-1 D124-2
estExt_Genewise1_v1.C_LG_XVIII1445
(c)
(d)
(b)
(e)
(a)
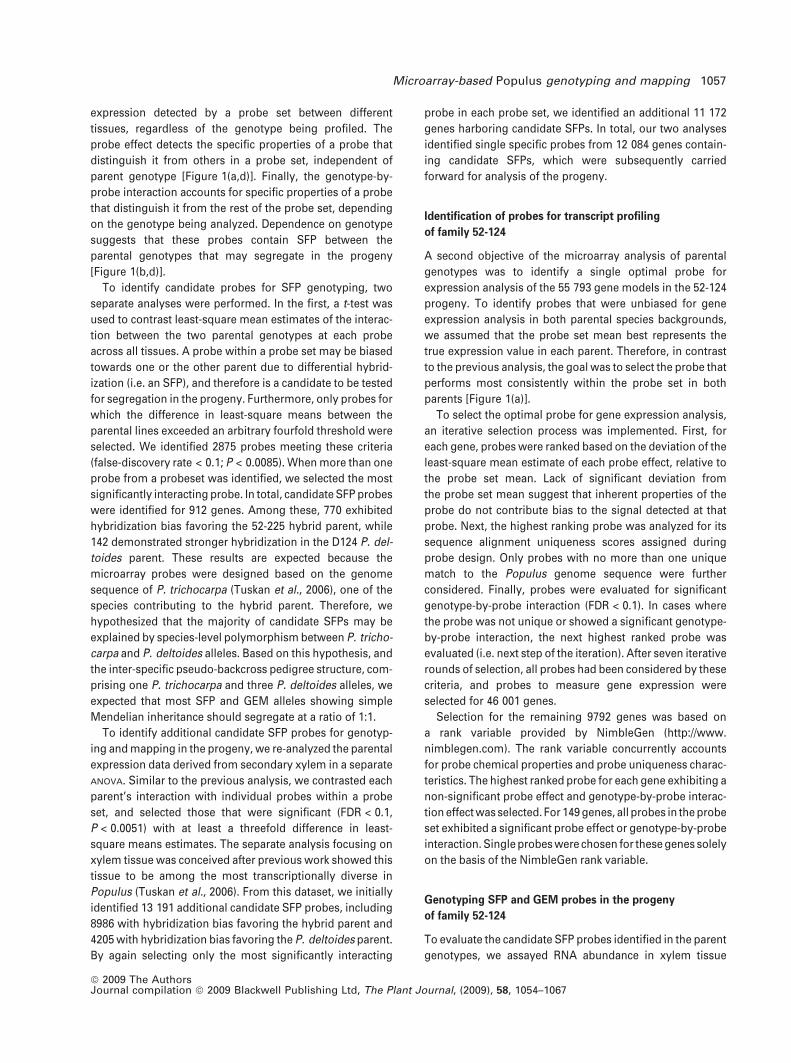
Figure 3. Allelic variations characterized by sequencing genomic DNA regions corresponding to mapped SFP probes.
Among sequenced clones, haplotypes are shown as detected for P. trichocarpa · P. deltoides clone 52-225 and P. deltoides clone D124. Variations between alleles
or between detected sequence and probe sequence are depicted in red.
(a) No variation was detected between parent trees for estExt_Genewise1_v1.C_LG_III2262.
(b) Extensive SNP and indel polymorphism between haplotypes in grail3.0016013002.
(c) A 12 bp deletion polymorphism in P. deltoides estExt_Genewise1_v1.C_LG_XVII1215.
(d) A single SNP distinguishes alleles of grail3.0005006601.
(e) Multiple SNPs detected for extExt_Genewise1_v1.C_LG_XVIII1445.
1062 Derek R. Drost et al.
ª 2009 The AuthorsJournal compilation ª 2009 Blackwell Publishing Ltd, The Plant Journal, (2009), 58, 1054–1067
barley RILs (Luo et al., 2007). Nonetheless, we have demon-
strated that GEM and SFP mapping in highly heterozygous
species is both beneficial and feasible, and may serve as a
supplement to traditional DNA-based markers. Our study
focused on an inter-specific cross, in which sequence and
gene expression variation may be extraordinary. However,
estimates of genetic variation and nucleotide diversity
within individual species of the Populus genus (Ingvarsson,
2008) and other economically significant outcrossing plants
(Ching et al., 2002; Tenaillon et al., 2002; Kolkman et al.,
2007; Novaes et al., 2008) suggest that our analysis
approach could also be adapted to identify genetically
informative variants from diverse intra-specific accessions.
However, it is expected that variables including probe length
and statistical thresholds associated with allele calling may
require optimization, and that the abundance of SFP and
GEM detected may be lower.
Establishing a high-density, gene-based genetic map also
provided an opportunity to position previously unlinked
sequence scaffolds from the WGS sequence assembly of
P. trichocarpa to putative genomic locations. The existing
genome assembly comprises 410 Mbp of a total estimated
genome size of 485 Mbp (Tuskan et al., 2006), but there is
substantial variation in estimated chromosome sequence
coverage, from 56% (chromosome XVII) and 65% (chromo-
some XIX) to estimated completion (chromosomes X, XII
and XIII). Of the 492 unplaced scaffolds in which we
identified a segregating GEM or SFP marker, we unambig-
uously positioned 116 on our genetic map (23.6%). Scaffold
sequences mapped using our GEM and SFP markers repre-
sent over 35 Mbp of previously unanchored sequence from
the WGS assembly of P. trichocarpa, including more than
23 Mbp localized by at least two independent markers in the
same scaffold.
Of a sample of 15 putatively placed genomic scaffolds,
the placement of 13 could be verified using independent
SSR markers, lending a good degree of confidence to our
map-based re-assembly of nearly 50% of the P. trichocarpa
scaffold sequence. In addition, 18 scaffolds that we have
mapped using SFPs or GEMs have been previously mapped
using SSRs and amplified fragment length polymorphisms
by other research groups (A. Rohde, Institute for Agriculture
and Fisheries Research, personal communication). Our
microarray-based markers verified the genetic position for
17 of these 18 scaffolds. Misplacement of sampled scaffolds
based on microarray marker data was generally due to
mapping based on single GEM loci. Because GEMs can
result from segregating cis- or trans-acting regulatory
variation, scaffolds mapped based only on GEMs should
be verified for their position using SSRs where possible.
Despite this fact, localization of a large proportion of the
previously unplaced genome sequence is a high-impact
result for the Populus genomics community, even given the
small degree of potential error in placements.
Interestingly, the newly mapped scaffolds are predom-
inantly located in chromosomes with low sequence cover-
age, where larger gaps exist in the current assembly. It is
unclear why there is bias towards mapping scaffolds in
chromosomes with poor assembly. There may be a higher
probability of mapping unassembled scaffolds to them
simply because of their higher expected abundance there.
Alternatively, smaller unmapped scaffolds could be more
prevalent in chromosomes that are populated by large
numbers of hypervariable regions, as high levels of
polymorphism are not favorable to long-range WGS
assembly of a consensus haplotype (Kelleher et al.,
2007). Such an observation was recently made in the
sex-determining telomeric region of Populus chromosome
XIX (Yin et al., 2008). Furthermore, chromosome XVII,
which has the lowest estimated percentage of sequence
fully assembled (56%, Tuskan et al., 2006), has the fourth
highest rate of sequence polymorphism (unpublished
data), and has the highest number of scaffolds mapped
and total sequence added in our study (Tables 1 and 2).
Although we can only speculate as to the basis for this
phenomenon, our study provides a significant improve-
ment to the WGS assembly of the P. trichocarpa sequence.
Additional mapping studies using SFP and GEM markers
that we have identified, and focusing on variation in the
sequenced clone Nisqually-1, could shed light on the
structural genomic nature of these scaffold sequences and
their proper designation in the genome assembly as
alternative haplotypes or bona fide unplaced WGS se-
quence segments. De novo sequencing and assembly of
other P. trichocarpa and P. deltoides genotypes will also
provide a better indication of whether specific regions
exist that are hypervariable within and between species
haplotypes, and their genome location.
Perhaps most importantly, our effort demonstrates the
power that microarray-based mapping may bring to future
map-based WGS reassemblies. We have shown that map-
ping based on physically positioned genes can rapidly
localize and orient large amounts of WGS-derived sequence
within the context of a physical assembly, even when the
sequence is scattered amongst a number of smaller
scaffolds whose assembly is not supported by traditional
WGS computerized assembly techniques or anonymous
sequence marker anchoring methods. Thus, further appli-
cation of microarray-based mapping in genetically diverse
species will not only increase resolution at the level of
genotype for forward-genetic analyses, but may drastically
improve the initial quality of draft WGS assemblies to the
community as a whole. In addition, providing a putative
location for an unplaced sequence can identify candidate
genes affecting quantitative phenotypes that would other-
wise go unconsidered if relying only upon the chromosome-
level sequence assembly for characterization of a genomic
interval.
Microarray-based Populus genotyping and mapping 1063
ª 2009 The AuthorsJournal compilation ª 2009 Blackwell Publishing Ltd, The Plant Journal, (2009), 58, 1054–1067
EXPERIMENTAL PROCEDURES
Plant growth conditions and RNA isolation
A pseudo-backcross population (family 52-124) derived from thecross of a female P. trichocarpa · P. deltoides hybrid (genotype 52-225) and a male P. deltoides (genotype D124) was obtained from theDepartment of Forestry at the University of Minnesota at Duluth ashardwood cuttings. After rooting, bud break and shoot elongation,fresh softwood terminal cuttings were harvested and placed inrooting media pellets (Jiffy Forestry Products, http://www.jiffypot.com) for 2 weeks. Rooted cuttings were planted in 9 L pots, andgrown for 6 weeks on ebb-and-flow benches in a greenhouse underlong-day conditions (16 h light/8 h dark) with a standard nutrientregime (Hocking’s modified complete fertilizer, Cooke et al., 2003)supplemented with 25 mM nitrogen (NH4NO3). Plants were distrib-uted in the greenhouse according to a partially balanced incompleteblock design, with three biological replications per genotype. Atharvest, the main plant organs (stems, roots, leaves and syllepticbranches) were collected separately. Stems were further dissectedinto secondary xylem tissue and phloem/bark/immature xylem.Samples of leaf, secondary xylem and root tissue from two bio-logical replicates of each genotype were used for gene expressionanalysis. All tissue was flash-frozen in liquid nitrogen immediatelyafter harvest, and stored at )80�C prior to lyophilization and sub-sequent RNA isolation (Chang et al., 1993). RNA samples weretreated with RQ1 DNase (Promega, http://www.promega.com/) andpurified using RNeasy Plant Mini Kit columns (Qiagen, http://www.qiagen.com/), and their integrity was evaluated using 1% w/vagarose gels.
Microsatellite (SSR) genotyping and framework map
construction
Parent trees and 418 progeny of family 52-124 were genotypedfor 167 framework SSR loci (http://www.ornl.gov/sci/ipgc/ssr_resource.htm, Smulders et al., 2001; Tuskan et al., 2004; van derSchoot et al., 2000). DNA was isolated from leaf samples using aQiagen DNeasy Plant Mini Kit according to the manufacturer’sprotocol. PCR reagents and concentrations were as describedpreviously (Tuskan et al., 2004), except that SSR loci were ampli-fied from 7.5 ng genomic DNA, and amplified fragments werelabeled by incorporation of 8 lM fluorescein-12-dUTP (RocheDiagnostics, http://www.roche.com). Amplification conditions were94�C initial denaturation for 5 min, nine cycles of touchdowncomprising denaturation at 94�C for 15 s, annealing for 15 s at 59–50�C for one cycle each with 1�C increments, and extension at 72�Cfor 30 s, followed by 21 cycles of denaturation at 94�C for 15 s,annealing at 50�C for 15 s, and extension at 72�C for 30 s, with afinal extension at 72�C for 3 min. Fragments were detected asdescribed previously (Tuskan et al., 2004) except that an AppliedBiosystems Prism 3730xl DNA analyzer (http://www.appliedbio-systems.com/) was used. Alleles were identified and genotypedusing GeneMapper 4.0 (Applied Biosystems) and/or GeneMar-ker 1.5 (SoftGenetics LLC, http://www.softgenetics.com).
Single-tree framework maps were constructed using MapMakerversion 3.0 (Lander et al., 1987) as described previously (Grattap-aglia and Sederoff, 1994; Ma et al., 2008), and were anchored to theP. trichocarpa genome assembly version 1.1 through Blastn anal-ysis (Altschul et al., 1990) of PCR primer sequences for each marker.Proper placement of markers was confirmed by comparison ofsequence-predicted and experimentally determined P. trichocarpaSSR amplicon lengths.
SSRs used to confirm map position sequence scaffolds wereidentified using MsatFinder version 2.0 (http://www.genomics.ceh.ac.uk/cgi-bin/msatfinder/msatfinder.cgi) based on scaffold se-quences from version 1.1 of the P. trichocarpa genome sequence.Primers were designed within the MsatFinder interface (Table S4),and SSR loci were amplified from 96 family 52-124 progeny asdescribed above. Thirteen of the 16 loci segregated highly hetero-zygous alleles between the P. trichocarpa and P. deltoidesbackgrounds, and were genotyped using 1% w/v agarose gelelectrophoresis. The remaining three loci were scored using poly-acrylamide gel electrophoresis as described previously (Bassamet al., 1991).
Microarray analysis of parental genotypes
RNA extracted from root, leaf and secondary xylem of the parents offamily 52-124 was converted to double-stranded cDNA (SuperScriptdouble strand cDNA synthesis kit, Invitrogen, http://www.invitrogen.com/) using oligo(dT) primers (Promega) as described bythe manufacturer, except that synthesis of first and second strandswas extended to 16 h. The resultant double-stranded cDNA waslabeled using cy3-tagged random 9-mers and Klenow fragment for2 h at 37�C, denatured at 95�C for 5 min, and hybridized to customin situ synthesized oligonucleotide microarrays (produced byNimbleGen) at 42�C overnight (16–20 h).
Microarray probe design. A total of 55 793 gene models derivedfrom annotation of the P. trichocarpa genome sequence were rep-resented in the microarray used in the analysis of the two parents offamily 52-124. Oligonucleotide probes (60-mer) were designedbased on NimbleGen standard procedures that optimize theuniqueness of the targeted genomic region and GC content, whileminimizing self-complementarity and homopolymer runs. Thehighest-ranking six or seven probes (probe set) were selected torepresent each gene model, with optimal probe spacing leading touniformly distributed, non-overlapping coverage. Twenty negativecontrol probes utilized in previous studies (Tuskan et al., 2006) werealso included for background quantification.
Statistical analyses. Raw signal data from all hybridizations werebackground-subtracted, log2-transformed, and quantile-normalized(Bolstad et al., 2003). The normalized signal detected for each probewas centered to zero and analyzed using a gene-by-gene mixedANOVA model in SAS 9.1 (SAS Institute, http://www.sas.com), withgenotype i (1 d.f.), tissue j (2 d.f.), tissue i by genotype j interaction(2 d.f.), probe k (5 or 6 d.f.) and genotype i by probe k interaction (5or 6 d.f.) as fixed effects:
yijkl ¼ lþ ai þ bj þ ck þ ðabÞij þ ðacÞik þ eijkl
F tests were performed for all fixed effects, and least-square meanestimates were obtained, and correction for multiple tests wasperformed using a modified false-discovery rate (FDR) threshold(FDR < 0.025, Table 1 and Table S5) (Storey and Tibshirani, 2003).Normalized log2-transformed signal values from microarraysderived from differentiating xylem tissue samples were analyzedseparately using a similar model that excluded tissue effects. Pair-wise t-tests were implemented to contrast least-square meansestimates of the interaction detected between the two parents foreach probe in a probe set. Resulting P values were corrected formultiple testing as above (FDR < 0.1).
1064 Derek R. Drost et al.
ª 2009 The AuthorsJournal compilation ª 2009 Blackwell Publishing Ltd, The Plant Journal, (2009), 58, 1054–1067
Microarray analysis of family 52-124
Based on the probes selected from the parent tree data, a modifiedmicroarray was designed for analysis of the progeny of family 52-124. The modified microarray comprised 67 897 probes, includingthe pre-selected 55 793 gene expression probes and 12 084 SFPgenotyping probes, plus 20 controls (Tuskan et al., 2006). Micro-arrays were synthesized using NimbleGen’s four-plex platform andutilized for analysis in the progeny. RNA isolated from one biolog-ical replicate of secondary xylem in 154 progeny genotypes wasconverted to double-stranded cDNA, labeled, and hybridized asdescribed above.
All 67 877 experimental probes were evaluated for Mendeliansegregation in the progeny, based on k-means clustering proce-dures modified from those described previously (Luo et al.,2007). Briefly, quantile-normalized, log2-transformed signal valuesdetected for each probe in the progeny of family 52-124 wereseparated into two clusters using ‘Proc Fastclus’ in SAS 9.1. Clustermembership was tested for the expected 1:1 segregation using achi-squared test. Probes for which cluster frequencies deviatedsignificantly (v2
d:f:¼1>3:84, P < 0.05) from the expected segregationwere discarded.
Subsequently, the probability that an individual assigned to onecluster is not a member of the other cluster was evaluated bycalculating the P value (Pi) associated with the modified normaldeviate:
zi ¼ xi �mj
� �=sj
�� ��
where xi is the signal at a given probe for an individual assigned tocluster i, and mj and sj are the mean and standard deviation of signalat that probe for all individuals assigned to cluster j (Luo et al.,2007). We used zi > 1.96 (Pi < 0.05) as evidence that the two allelicclasses were clearly distinguishable, and scored individuals belowthis threshold as missing data. Probes resulting in >10% missingdata (n ‡ 15) were not considered for mapping.
Grouping, ordering, and mapping of SSRs, GEMs and SFPs
to linkage groups
Selected GEM and SFP markers, in conjunction with SSR markersutilized for the framework mapping, were grouped and orderedusing MadMapper V248 linkage mapping software (http://cgpdb.ucdavis.edu/XLinkage/MadMapper/) essentially as de-scribed previously (West et al., 2006). However, because MadM-apper scripts were developed for marker grouping and ordering inadvanced-generation Arabidopsis recombinant inbred lines, theestimates of pairwise recombination frequency provided differfrom those experimentally observed in a first-generation back-cross pedigree structure (Haldane and Waddington, 1931). Inaddition, only microarray-based markers grouping together withat least one SSR from the established framework map weresubsequently included. Probes not linked to the framework arelikely to have an excess genotyping error and were subsequentlydiscarded.
Markers were re-genotyped after localization of recombinationbreakpoints using a structural change analysis method within theStrucchange statistical module in R (Zeileis et al., 2002), using astrategy initially described by Singer et al. (2006). Structural changeanalysis detects large pattern shifts in a dataset based on a Bayesianinformation criterion statistical threshold, and can be used to detectoverall change between phases of alleles that are characteristic ofrecombination breakpoints.
To contribute to the Strucchange analysis of breakpoint position-ing, the P value (Ps) associated with the standard normal distribu-tion for the cluster of assignment was determined:
zs ¼ xi �mið Þ=sij j
The P values for each distribution were compared by calculatingthe ratio R, which has a range from zero to one, analogous to theprocedure described previously (Singer et al., 2006):
R ¼ pi= pi þ psð Þ
If the alleles are highly distinct (i.e. clearly form separate distribu-tions), individuals from the population return values of R very closeto zero or one, depending on their allele. However, markers withlittle allelic distinction accumulate individuals at intermediate levelsof R. Utilizing a continuously distributed allele score such as R alsoprovides a direct assessment of confidence associated with an as-signed genotype on an individual-by-individual basis, and therebycontributes to more concretely defined breakpoints in the Struc-change analysis.
To verify proper placement of recombination breakpoints, agree-ment between Strucchange genotypic results and raw SSR geno-types was determined. Additional breakpoints supported by theStrucchange minimum Bayesian information criterion statistic, butnot present in the SSR data, were accepted if they included at leastthree microarray-based markers. Subsequently, genetic distancesfor the corrected genotypes were estimated using MapMakerversion 3.0 (Lander et al., 1987).
Sequence-level characterization of SFP alleles
A subset of mapped SFPs was arbitrarily selected for sequence-level characterization in each parent of family 52-124. PCR primerswere designed from the genome sequence surrounding fivemapped SFPs (Table S6). Alleles were amplified from each parenttree using approximately 50 ng of xylem double-stranded cDNA,200 lM dNTPs, and 2 ll 10· Advantage 2 PCR buffer and 0.4 llAdvantage 2 polymerase mix (both Clontech Laboratories Inc.,http://www.clontech.com/) in a total volume of 20 ll. PCR wasperformed in a two-step procedure with identical amplificationconditions for each step: 95�C initial denaturation for 5 min, 30cycles of denaturation at 95�C for 30 s, annealing at 58.5�C for 30 sand extension at 72�C for 1 min 45 s, with a final extension of72�C for 7 min. Secondary PCR was performed using identicalreagent concentrations, except that a 1:25 dilution of the primaryPCR was substituted as template. Amplicons from the secondaryreaction were gel-purified in 1% w/v agarose, and cloned intopGEM-T vector (Promega) according to the manufacturer’sprotocol. Eight to ten independent clones per construct wereisolated using a QIAprep miniprep kit (Qiagen), and sequencedbi-directionally from the SP6 and T7 promoters using an ABIPrism 3730xl. Resulting sequences were aligned and analyzedin SEQUENCHER version 4.6 (Gene Codes Corporation, http://www.genecodes.com) and CLUSTAL W version 2.0 (Larkin et al.,2007).
ACKNOWLEDGEMENTS
The authors wish to thank Alexander Kozik (Department of PlantScience, University of California at Davis Genome Center) forexcellent technical assistance in the implementation of MadMapper
Microarray-based Populus genotyping and mapping 1065
ª 2009 The AuthorsJournal compilation ª 2009 Blackwell Publishing Ltd, The Plant Journal, (2009), 58, 1054–1067
software. The authors are also grateful to Donald J. Lee (Depart-ment of Agronomy, University of Nebraska at Lincoln), A. MarkSettles (Department of Horticultural Sciences, University of Florida),Ronald R. Sederoff (Department of Forestry and EnvironmentalResources, North Carolina State University), and anonymousreviewers for constructive comments to improve the manuscript.This work was supported by the Department of Energy, Office ofScience, Office of Biological and Environmental Research grantaward number DE-FG02-05ER64114 (to M.K.), and the NationalScience Foundation, Genes and Genomes System Cluster in theDivision of Molecular and Cellular Biosciences (to M.K.).
SUPPORTING INFORMATION
Additional Supporting Information may be found in the onlineversion of this article:Figure S1. SSR-based framework map of P. trichocarpa · P. delto-ides genotype 52-225.Table S1. Genetic map data for the SSR, SFP and GEM-basedlinkage map of P. trichocarpa · P. deltoides genotype 52-225.Table S2. P. trichocarpa genome sequence version 1.1 scaffolds andmap location in the linkage map of genotype 52-225.Table S3. SSR-based verification of scaffold map location for sixsequence scaffolds localized based on single GEM loci.Table S4. Microsatellite loci and primers for scaffold verificationmapping.Table S5. Gene-by-gene F statistic significance for fixed effects inthe analysis of variance performed on parental genotype data.Table S6. Array probes and primer sequences used in sequence-level verification of a sample of mapped SFP.Please note: Wiley-Blackwell are not responsible for the content orfunctionality of any supporting materials supplied by the authors.Any queries (other than missing material) should be directed to thecorresponding author for the article.
REFERENCES
Altschul, S.F., Gish, W., Miller, W., Myers, E.W. and Lipman, D.J.
(1990) Basic local alignment search tool. J. Mol. Biol. 215, 403–410.Bassam, B.J., Caetanoanolles, G. and Gresshoff, P.M. (1991) Fast
and sensitive silver staining of DNA in polyacrylamide gels. Anal.Biochem. 196, 80–83.
Bolstad, B.M., Irizarry, R.A., Astrand, M. and Speed, T.P. (2003) Acomparison of normalization methods for high density oligonu-cleotide array data based on variance and bias. Bioinformatics,19, 185–193.
Borevitz, J.O., Liang, D., Plouffe, D., Chang, H.S., Zhu, T., Weigel, D.,
Berry, C.C., Winzeler, E. and Chory, J. (2003) Large-scale identi-fication of single-feature polymorphisms in complex genomes.Genome Res. 13, 513–523.
Brem, R.B., Yvert, G., Clinton, R. and Kruglyak, L. (2002) Geneticdissection of transcriptional regulation in budding yeast. Science,296, 752–755.
Cervera, M.T., Storme, V., Ivens, B., Gusmao, J., Liu, B.H., Hostyn,
V., Van Slycken, J., Van Montagu, M. and Boerjan, W. (2001)Dense genetic linkage maps of three Populus species (Populusdeltoides, P. nigra and P. trichocarpa) based on AFLP and mi-crosatellite markers. Genetics, 158, 787–809.
Chang, S., Puryear, J. and Cairney, J. (1993) A simple and efficentmethod for isolating RNA from pine trees. Plant Mol. Biol. Rep. 11,113–116.
Ching, A., Caldwell, K.S., Jung, M., Dolan, M., Smith, O.S., Tingey,
S., Morgante, M. and Rafalski, A.J. (2002) SNP frequency, hap-
lotype structure and linkage disequilibrium in elite maize inbredlines. BMC Genet. 3, 19.
Cooke, J.E.K., Brown, K.A., Wu, R. and Davis, J.M. (2003) Geneexpression associated with N-induced shifts in resource alloca-tion in poplar. Plant Cell Environ. 26, 757–770.
Coram, T.E., Settles, M.L., Wang, M. and Chen, X. (2008) Surveyingexpression level polymorphism and single-feature polymor-phism in near-isogenic wheat lines differing for the Yr5 stripe rustresistance locus. Theor. Appl. Genet. 117, 401–411.
Cui, X., Xu, J., Asghar, R., Condamine, P., Svensson, J.T.,
Wanamaker, S., Stein, N., Roose, M. and Close, T.J. (2005)Detecting single-feature polymorphisms using oligonucleotidearrays and robustified projection pursuit. Bioinformatics, 21,3852–3858.
Das, S., Bhat, P.R., Sudhakar, C., Ehlers, J.D., Wanamaker, S.,
Roberts, P.A., Cui, X. and Close, T.J. (2008) Detection and vali-dation of single feature polymorphisms in cowpea (Vigna ungu-iculata L. Walp) using a soybean genome array. BMC Genomics,9, 107.
Grattapaglia, D. and Sederoff, R. (1994) Genetic linkage maps ofEucalyptus grandis and Eucalyptus urophylla using a pseudo-testcross: mapping strategy and RAPD markers. Genetics, 137,1121–1137.
Haldane, J.B. and Waddington, C.H. (1931) Inbreeding and linkage.Genetics, 16, 357–374.
Ingvarsson, P.K. (2008) Multilocus patterns of nucleotide polymor-phism and the demographic history of Populus tremula. Genet-ics, 180, 329–340.
Jansen, R.C. and Nap, J.P. (2001) Genetical genomics: the addedvalue from segregation. Trends Genet. 17, 388–391.
Kelleher, C.T., Chiu, R., Shin, H. et al. (2007) A physical map of thehighly heterozygous Populus genome: integration with the gen-ome sequence and genetic map and analysis of haplotypevariation. Plant J. 50, 1063–1078.
Kirst, M., Caldo, R., Casati, P., Tanimoto, G., Walbot, V., Wise, R.P.
and Buckler, E.S. (2006) Genetic diversity contribution to errors inshort oligonucleotide microarray analysis. Plant Biotechnol. J. 4,489–498.
Kolkman, J.M., Berry, S.T., Leon, A.J., Slabaugh, M.B., Tang, S.,
Gao, W., Shintani, D.K., Burke, J.M. and Knapp, S.J. (2007) Singlenucleotide polymorphisms and linkage disequilibrium in sun-flower. Genetics, 177, 457–468.
Kumar, R., Qiu, J., Joshi, T., Valliyodan, B., Xu, D. and Nguyen, H.T.
(2007) Single feature polymorphism discovery in rice. PLoS ONE,2, e284.
Lander, E.S., Green, P., Abrahamson, J., Barlow, A., Daly, M.J.,
Lincoln, S.E. and Newburg, L. (1987) MAPMAKER: an interac-tive computer package for constructing primary genetic linkagemaps of experimental and natural populations. Genomics, 1,174–181.
Larkin, M.A., Blackshields, G., Brown, N.P. et al. (2007) Clustal Wand Clustal X version 2.0. Bioinformatics, 23, 2947–2948.
Luo,Z.W.,Potokina,E.,Druka,A.,Wise,R.,Waugh,R.andKearsey,M.J.
(2007) SFP genotyping from affymetrix arrays is robust but largelydetectscis-actingexpressionregulators.Genetics,176,789–800.
Ma, C.X., Yu, Q., Berg, A. et al. (2008) A statistical model for testingthe pleiotropic control of phenotypic plasticity for a count trait.Genetics, 179, 627–636.
Novaes, E., Drost, D.R., Farmerie, W.G., Pappas, G.J. Jr, Grattapa-
glia, D., Sederoff, R.R. and Kirst, M. (2008) High-throughput geneand SNP discovery in Eucalyptus grandis, an uncharacterizedgenome. BMC Genomics, 9, 312.
Rennie, C., Noyes, H.A., Kemp, S.J., Hulme, H., Brass, A. and Hoyle,
D.C. (2008) Strong position-dependent effects of sequence
1066 Derek R. Drost et al.
ª 2009 The AuthorsJournal compilation ª 2009 Blackwell Publishing Ltd, The Plant Journal, (2009), 58, 1054–1067
mismatches on signal ratios measured using long oligonucleo-tide microarrays. BMC Genomics, 9, 317.
Ronald, J., Akey, J.M., Whittle, J., Smith, E.N., Yvert, G. and
Kruglyak, L. (2005) Simultaneous genotyping, gene-expressionmeasurement, and detection of allele-specific expression witholigonucleotide arrays. Genome Res. 15, 284–291.
Rostoks, N., Borevitz, J.O., Hedley, P.E., Russell, J., Mudie, S.,
Morris, J., Cardle, L., Marshall, D.F. and Waugh, R. (2005) Single-feature polymorphism discovery in the barley transcriptome.Genome Biol. 6, R54.
van der Schoot, J., Pospiskova, M., Vosman, B. and Smulders,
M.J.M. (2000) Development and characterization of microsatellitemarkers in black poplar (Populus nigra L.). Theor. Appl. Genet.101, 317–322.
Singer, T., Fan, Y., Chang, H.S., Zhu, T., Hazen, S.P. and Briggs, S.P.
(2006) A high-resolution map of Arabidopsis recombinant inbredlines by whole-genome exon array hybridization. PLoS Genet. 2,e144.
Smulders, M.J.M., Van Der Schoot, J., Arens, P. and Vosman, B.
(2001) Trinucleotide repeat microsatellite markers for black pop-lar (Populus nigra L.). Mol. Ecol. Notes, 1, 188–190.
Storey, J.D. and Tibshirani, R. (2003) Statistical significance forgenomewide studies. Proc. Natl Acad. Sci. USA, 100, 9440–9445.
Tenaillon, M.I., Sawkins, M.C., Anderson, L.K., Stack, S.M., Doeb-
ley, J. and Gaut, B.S. (2002) Patterns of diversity and recombi-nation along chromosome 1 of maize (Zea mays ssp. mays L.).Genetics, 162, 1401–1413.
Tuskan, G.A., Gunter, L.E., Yang, Z.M.K., Yin, T.M., Sewell, M.M.
and DiFazio, S.P. (2004) Characterization of microsatellites
revealed by genomic sequencing of Populus trichocarpa. Can. J.For. Res. 34, 85–93.
Tuskan, G.A., Difazio, S., Jansson, S. et al. (2006) The genome ofblack cottonwood, Populus trichocarpa (Torr & Gray). Science,313, 1596–1604.
Voorrips, R.E. (2002) MapChart: software for the graphical presen-tation of linkage maps and QTLs. J. Hered. 93, 77–78.
West, M.A., van Leeuwen, H., Kozik, A., Kliebenstein, D.J., Doerge,
R.W., St Clair, D.A. and Michelmore, R.W. (2006) High-densityhaplotyping with microarray-based expression and single featurepolymorphism markers in Arabidopsis. Genome Res. 16, 787–795.
West, M.A., Kim, K., Kliebenstein, D.J., van Leeuwen, H., Michel-
more, R.W., Doerge, R.W. and St Clair, D.A. (2007) Global eQTLmapping reveals the complex genetic architecture of transcript-level variation in Arabidopsis. Genetics, 175, 1441–1450.
Winzeler, E.A., Richards, D.R., Conway, A.R. et al. (1998) Directallelic variation scanning of the yeast genome. Science, 281,1194–1197.
Yin, T.M., DiFazio, S.P., Gunter, L.E., Riemenschneider, D. and
Tuskan, G.A. (2004) Large-scale heterospecific segregation dis-tortion in Populus revealed by a dense genetic map. Theor. Appl.Genet. 109, 451–463.
Yin, T., Difazio, S.P., Gunter, L.E. et al. (2008) Genome structure andemerging evidence of an incipient sex chromosome in Populus.Genome Res. 18, 422–430.
Zeileis, A., Leish, F., Hornik, K. and Kleiber, C. (2002) Strucchange:an R package for testing structural change in linear regressionmodels. J. Stat. Softw. 7, 1–38.
Microarray-based Populus genotyping and mapping 1067
ª 2009 The AuthorsJournal compilation ª 2009 Blackwell Publishing Ltd, The Plant Journal, (2009), 58, 1054–1067
Related Documents