HIGHLIGHTED ARTICLE | INVESTIGATION Genetics of Skeletal Evolution in Unusually Large Mice from Gough Island Michelle D. Parmenter,* Melissa M. Gray,* Caley A. Hogan,* Irene N. Ford,* Karl W. Broman, † Christopher J. Vinyard, ‡ and Bret A. Payseur* ,1 *Laboratory of Genetics and † Department of Biostatistics and Medical Informatics, University of Wisconsin, Madison, Wisconsin 53706, and ‡ Department of Anatomy and Neurobiology, Northeast Ohio Medical University, Rootstown, Ohio 44272 ABSTRACT Organisms on islands often undergo rapid morphological evolution, providing a platform for understanding mechanisms of phenotypic change. Many examples of evolution on islands involve the vertebrate skeleton. Although the genetic basis of skeletal variation has been studied in laboratory strains, especially in the house mouse Mus musculus domesticus, the genetic determinants of skeletal evolution in natural populations remain poorly understood. We used house mice living on the remote Gough Island—the largest wild house mice on record—to understand the genetics of rapid skeletal evolution in nature. Compared to a mainland reference strain from the same subspecies (WSB/EiJ), the skeleton of Gough Island mice is considerably larger, with notable expansions of the pelvis and limbs. The Gough Island mouse skeleton also displays changes in shape, including elongations of the skull and the proximal vs. distal elements in the limbs. Quantitative trait locus (QTL) mapping in a large F 2 intercross between Gough Island mice and WSB/EiJ reveals hundreds of QTL that control skeletal dimensions measured at 5, 10, and/or 16 weeks of age. QTL exhibit modest, mostly additive effects, and Gough Island alleles are associated with larger skeletal size at most QTL. The QTL with the largest effects are found on a few chromosomes and affect suites of skeletal traits. Many of these loci also colocalize with QTL for body weight. The high degree of QTL colocalization is consistent with an important contribution of pleiotropy to skeletal evolution. Our results provide a rare portrait of the genetic basis of skeletal evolution in an island population and position the Gough Island mouse as a model system for understanding mechanisms of rapid evolution in nature. KEYWORDS island syndrome; skeletal evolution; phenotypic extreme; body size; complex trait; pleiotropy P OPULATIONS that colonize islands face a host of new en- vironmental conditions, including changes in resource avail- ability, predation risk, and competition (Losos and Ricklefs 2009). These shifts can stimulate the evolution of unusual or exaggerated traits over a short time scale. Insular populations of mammals are enriched for cases of rapid morphological evolu- tion, especially in traits related to body size (Foster 1964; Grant 1999; Pergams and Ashley 2001; Beheregaray et al. 2004; Lomolino 2005; Thomas et al. 2009; Durst and Roth 2015). Comparing island populations with their mainland relatives is a powerful approach for understanding the genetic basis of evolutionary change. Wild house mice offer a particularly useful system for re- vealing the mechanisms of rapid phenotypic evolution on is- lands. By virtue of their commensalism, house mice successfully colonized a diverse array of island environments (Bonhomme and Searle 2012). Insular house mice often display distinct skel- etal morphologies. Presence–absence or meristic polymorphisms of bones in the skull, humerus, pelvis, and vertebrae (in- cluding the tail) have been documented (Berry 1964, 1986; Berry and Jakobson 1975a; Berry et al. 1978; Davis 1983; Pergams and Ashley 2001; Renaud and Auffray 2010). Di- vergence in body size (Berry and Jakobson 1975b; Berry et al. 1978b, 1979, 1981, 1987; Rowe-Rowe and Crafford 1992; Adler and Levins 1994; Jones et al. 2003; Lomolino 2005; Durst and Roth 2012, 2015; Russell 2012; Gray et al. 2015; Cuthbert et al. 2016) suggests evolutionary changes to the skeleton in other island populations. As the scaffold for the body plan, the skeleton enables movement, provides sup- port for muscles, and protects internal organs (Pourquié 2009). Moreover, studying skeletal divergence can reveal the dynamics Copyright © 2016 by the Genetics Society of America doi: 10.1534/genetics.116.193805 Manuscript received July 12, 2016; accepted for publication September 26, 2016; published Early Online September 29, 2016. Supplemental material is available online at www.genetics.org/lookup/suppl/doi:10. 1534/genetics.116.193805/-/DC1. 1 Corresponding author: 425-G Henry Mall, Laboratory of Genetics, University of Wisconsin, Madison, WI 53706. E-mail: [email protected] Genetics, Vol. 204, 1559–1572 December 2016 1559

Welcome message from author
This document is posted to help you gain knowledge. Please leave a comment to let me know what you think about it! Share it to your friends and learn new things together.
Transcript
HIGHLIGHTED ARTICLE| INVESTIGATION
Genetics of Skeletal Evolution in Unusually Large Micefrom Gough Island
Michelle D. Parmenter,* Melissa M. Gray,* Caley A. Hogan,* Irene N. Ford,* Karl W. Broman,†
Christopher J. Vinyard,‡ and Bret A. Payseur*,1
*Laboratory of Genetics and †Department of Biostatistics and Medical Informatics, University of Wisconsin, Madison, Wisconsin53706, and ‡Department of Anatomy and Neurobiology, Northeast Ohio Medical University, Rootstown, Ohio 44272
ABSTRACT Organisms on islands often undergo rapid morphological evolution, providing a platform for understanding mechanismsof phenotypic change. Many examples of evolution on islands involve the vertebrate skeleton. Although the genetic basis of skeletalvariation has been studied in laboratory strains, especially in the house mouse Mus musculus domesticus, the genetic determinants ofskeletal evolution in natural populations remain poorly understood. We used house mice living on the remote Gough Island—thelargest wild house mice on record—to understand the genetics of rapid skeletal evolution in nature. Compared to a mainland referencestrain from the same subspecies (WSB/EiJ), the skeleton of Gough Island mice is considerably larger, with notable expansions of thepelvis and limbs. The Gough Island mouse skeleton also displays changes in shape, including elongations of the skull and the proximalvs. distal elements in the limbs. Quantitative trait locus (QTL) mapping in a large F2 intercross between Gough Island mice and WSB/EiJreveals hundreds of QTL that control skeletal dimensions measured at 5, 10, and/or 16 weeks of age. QTL exhibit modest, mostlyadditive effects, and Gough Island alleles are associated with larger skeletal size at most QTL. The QTL with the largest effects are foundon a few chromosomes and affect suites of skeletal traits. Many of these loci also colocalize with QTL for body weight. The high degreeof QTL colocalization is consistent with an important contribution of pleiotropy to skeletal evolution. Our results provide a rare portraitof the genetic basis of skeletal evolution in an island population and position the Gough Island mouse as a model system forunderstanding mechanisms of rapid evolution in nature.
KEYWORDS island syndrome; skeletal evolution; phenotypic extreme; body size; complex trait; pleiotropy
POPULATIONS that colonize islands face a host of new en-vironmental conditions, includingchanges in resourceavail-
ability, predation risk, and competition (Losos and Ricklefs2009). These shifts can stimulate the evolution of unusual orexaggerated traits over a short time scale. Insular populations ofmammals are enriched for cases of rapid morphological evolu-tion, especially in traits related to body size (Foster 1964; Grant1999; Pergams and Ashley 2001; Beheregaray et al. 2004;Lomolino 2005; Thomas et al. 2009; Durst and Roth 2015).Comparing island populations with their mainland relatives isa powerful approach for understanding the genetic basis ofevolutionary change.
Wild house mice offer a particularly useful system for re-vealing the mechanisms of rapid phenotypic evolution on is-lands. By virtue of their commensalism, housemice successfullycolonized a diverse array of island environments (Bonhommeand Searle 2012). Insular house mice often display distinct skel-etal morphologies. Presence–absence or meristic polymorphismsof bones in the skull, humerus, pelvis, and vertebrae (in-cluding the tail) have been documented (Berry 1964, 1986;Berry and Jakobson 1975a; Berry et al. 1978; Davis 1983;Pergams and Ashley 2001; Renaud and Auffray 2010). Di-vergence in body size (Berry and Jakobson 1975b; Berryet al. 1978b, 1979, 1981, 1987; Rowe-Rowe and Crafford1992; Adler and Levins 1994; Jones et al. 2003; Lomolino2005; Durst and Roth 2012, 2015; Russell 2012; Gray et al.2015; Cuthbert et al. 2016) suggests evolutionary changesto the skeleton in other island populations. As the scaffold forthe body plan, the skeleton enables movement, provides sup-port for muscles, and protects internal organs (Pourquié 2009).Moreover, studying skeletal divergence can reveal the dynamics
Copyright © 2016 by the Genetics Society of Americadoi: 10.1534/genetics.116.193805Manuscript received July 12, 2016; accepted for publication September 26, 2016;published Early Online September 29, 2016.Supplemental material is available online at www.genetics.org/lookup/suppl/doi:10.1534/genetics.116.193805/-/DC1.1Corresponding author: 425-G Henry Mall, Laboratory of Genetics, University ofWisconsin, Madison, WI 53706. E-mail: [email protected]
Genetics, Vol. 204, 1559–1572 December 2016 1559

of multi-trait evolution. Functional, developmental, and geneticinteractions among traits are expected to produce patterns ofcovariation across the skeleton (Lande 1980; Atchley and Hall1991; Lynch and Walsh 1998). Depending on its structure, this“modularity” may facilitate or constrain evolution comparedto predictions for single traits (Lande 1979; Schluter 1996;Klingenberg 2008; Parsons et al. 2012).
Although the genetic underpinnings of skeletal evolution inisland mice are unknown, considerable research has beendedicated to dissecting genetic differences in the skeleton inlaboratory mice. Quantitative trait loci (QTL) have been iden-tified for hundreds of skeletal components related to size andgrowth differences among classical inbred strains and amongstrains descended from artificial selection experiments (Leamyet al. 1999; Vaughn et al. 1999; Huang et al. 2004; Lang et al.2005; Kenney-Hunt et al. 2006, 2008; Norgard et al. 2008;Sanger et al. 2011; Carson et al. 2012), with evidence thatsome QTL affect multiple traits (Leamy et al. 2002; Ehrichet al. 2003; Schlosser and Wagner 2004; Wolf et al. 2005,2006; Christians and Senger 2007; Kenney-Hunt et al. 2008;Pavlicev et al. 2008; Roseman et al. 2009). QTL responsible forlocal skeletal shape variation also have been discovered, witha special emphasis on the mandible (Atchley et al.1985a,b;Klingenberg and Leamy 2001; Klingenberg et al. 2003;Klingenberg 2004; Wagner et al. 2007; Leamy et al. 2008;Willmore et al. 2009). These findings from laboratory miceprovide a rich comparative context for examining the geneticarchitecture of skeletal evolution in natural populations ofhouse mice, which experience evolutionary dynamics distinctfrom those in laboratory conditions.
The largest known wild house mice in the world inhabitGough Island, a remote volcanic island in the central SouthAtlantic Ocean (Rowe-Rowe andCrafford 1992). Themassiveevolutionary increase in body size of Gough Island mice—tobecome twice the weight of their mainland counterparts(Jones et al. 2003; Gray et al. 2015)—suggests a substantialexpansion of the skeleton. House mice likely colonizedGough Island a few hundred generations ago (Gray et al.2014), raising the prospect that morphological evolutionhas been accelerated. In this study, we use Gough Island miceto understand the genetic basis of rapid skeletal evolution innature.
Materials and Methods
Gough Island and its mice
Gough Island is part of theUnitedKingdomOverseasTerritoryof Tristan da Cunha and is located approximately halfwaybetweenSouthAmerica andSouthAfrica in theSouthAtlanticOcean (40� 199S and 9� 559W). Gough Island has an area of65 km2. Fifty mice, live trapped on Gough Island in Septem-ber 2009, were transferred to Charmany Instructional Facil-ity in the School of Veterinary Medicine at the University ofWisconsin–Madison. Four mice died and two litters consist-ing of five pups were born during transport from the island to
the facility. Upon their arrival, 46 mice (25 female and21 male) were used to establish a breeding colony.
Female and male mice were housed separately in micro-isolator cages with a maximum of four mice per cage. Groundcorn cobs (1/8th inch; Waldschmidt and Sons, Madison, WI)were used as bedding; irradiated sunflower seeds (HarlanLaboratories, Madison, WI) and nesting material were pro-vided for enrichment. The room was temperature controlled(68–72�F) and set on a 12-hr light/dark cycle. Water androdent chow (Teklad Global 6% fat mouse/rat diet; HarlanLaboratories) was provided ad libitum. Mice were mated af-ter 8 weeks of age. Breeding individuals were given addi-tional enrichments and were fed breeder chow (TekladGlobal 19% protein/9% fat; Harlan Laboratories) ad libitum.All mice were weaned between 3 and 4 weeks of age. Indi-vidual mice were toe tattooed (using sterile lancets and tat-too paste) at 1 week of age and ear punched at weaning forthe purposes of identification. All mice were weighed to thenearest milligram, beginning 1week after birth and ending at16 weeks. After the Gough Island mice (subsequently abbre-viated GI) arrived to the Charmany Instructional Facility, weperformed a random-mating common garden experiment us-ing the wild founders. This was done to determine that thelarge body size of the GI mice has a genetic basis and not duesolely to environmental factors.
Intercross experiments
Several partially inbred lines of GI mice were created throughfull-sib mating for four filial generations, a procedure expectedto reduce within-line heterozygosity by 60% (Silver 1995). Toincorporate variation segregating among GImice, two partiallyinbred GI lines were used for intercross experiments (denotedas crosses A and B). One pair of male and female siblings fromeach partially inbred line was crossed with WSB/EiJ (subse-quently abbreviated as WSB; The Jackson Laboratory, Bar Har-bor, ME) to generate four independent F2 intercrosses(Supplemental Material, Figure S1). WSB was chosen be-cause it is a wild-derived strain, has a body size typical ofwild house mice, is fully inbred, belongs to the same subspe-cies as GI mice, has a sequenced genome (Keane et al. 2011),and is featured in the Collaborative Cross (Threadgill andChurchill 2012). A total of 1374 F2 mice were generated:497 from cross A (WSB 3 GI = 279 and GI 3 WSB = 218)and 877 from cross B (WSB 3 GI = 494 and GI 3 WSB =383). From this F2 population, 827 mice were used for allskeletal phenotyping and analyses: 367 from cross A (WSB3GI = 206 and GI 3 WSB = 161) and 460 from cross B(WSB 3 GI = 252 and GI 3 WSB = 208).
Phenotyping
All mice were weighed to the nearest milligram every week,beginning 1 week after birth and ending at 16 weeks. DualenergyX-rayabsorptiometry (DXA)wasused tomeasurebonemorphology. Digital X-ray images (Carestream Health DXSPro 4000)were collected for 43 F1 and 827 F2 individuals andmice from the four parental strains of the cross. X-ray images
1560 M. D. Parmenter et al.
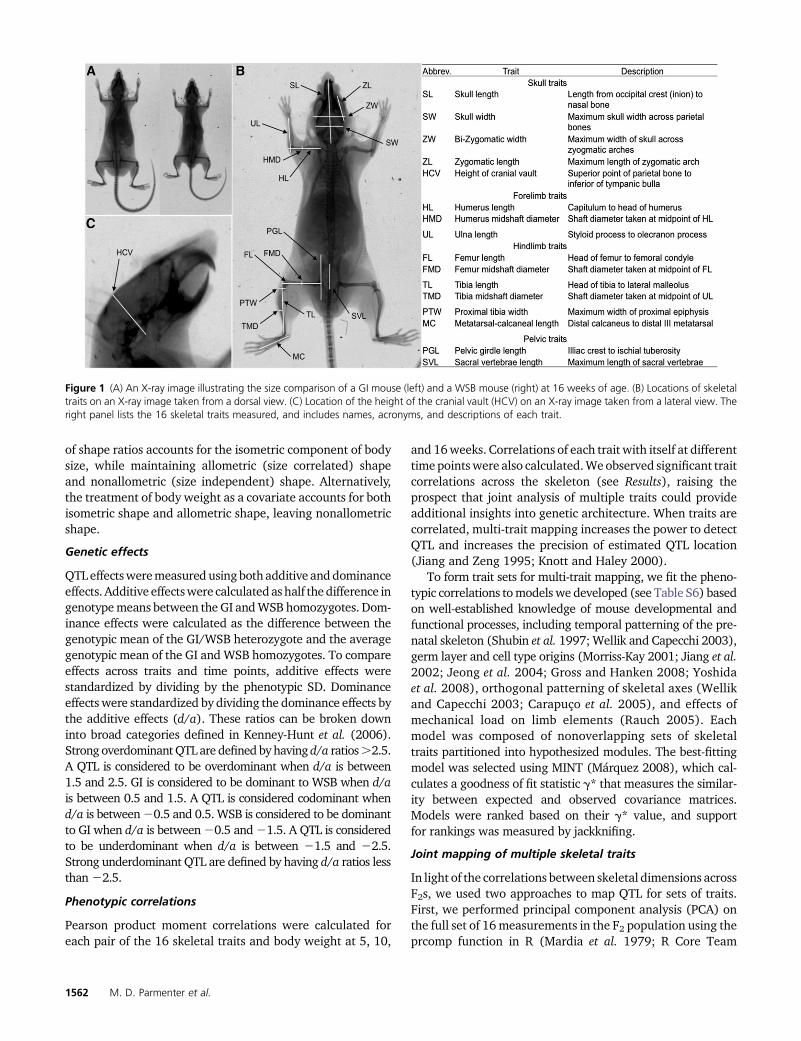
were taken at three postnatal time points (5, 10, 16 weeks ofage) for each animal. These time points were chosen to capturemultiple episodes of growth throughout postnatal develop-ment. X-ray imaging at 5 and 10 weeks of age was performedusing live animals. When individuals reached 16 weeks of age,they were either euthanized by CO2 asphyxiation followed byimaging, or imagingwas performed live followed by euthanasia(by decapitation). Liver samples were collected from all eutha-nized F2 individuals and stored at 280�. For imaging of livemice, an anesthetic (50–100 mg/kg ketamine/0.5–1.0 mg/kgdexmedetomidine) was administered via intraperitoneal injec-tion prior to X-ray imaging to allow for placement and X-rayexposure time. A dorsal and lateral X-ray image was taken ofeach individual. Skeletal dimensions were measured from theX-ray images using Carestream Molecular Imaging Software(Carestream Health). Measurements were chosen to captureaxes of known variation across laboratory mouse strains andacross species. A total of 16 measurements were used for phe-notyping, including lengths and diameters of long bones, pel-vis, and skull (see Figure 1).
Additional measurements were taken from the individualskeletal measurements to determine any changes in skeletalshape (described as nonproportional size changes), particu-larly of the limbs. These include forelimb-to-hindlimb ratios[intermembral index: (humerus length + radius length)/(femur length + tibia length) 3 100], the ratio of distaland proximal elements of the hindlimb [crural index: (tibialength/femur length) 3 100] and forelimb [brachial index:(radius length/humerus length) 3 100], and the ratio offorelimb and hindlimb proximal elements [humerofemoralindex: (humerus length/femur length) 3 100]. Althoughno data were collected on the radius, ulna length was usedas a substitute for the distal element of the forelimb.
Phenotypic distributions were inspected for extreme out-liers. When it was concluded that outliers reflected reducedmeasurement accuracy caused by improper placement ofanimals during X-ray imaging or a lack of X-ray resolution,theywere removed. These included six data points from theF2population [for sacral vertebrae length (SVL) at 5, 10, and16 weeks, skull length (SL) at 5 weeks, skull width (SW) at5 weeks, and SL at 10 weeks], one data point from the WSBpopulation [zygomatic length (ZL) at 16 weeks), and threedata points from the GI population [femur midshaft diameter(FMD) at 5 weeks, metatarsals and calcaneus length (MC) at5 weeks, ZL at 10 weeks].
Genotyping
All mice were genotyped using theMegaMouse Universal Geno-typing Array (MegaMUGA, Geneseek, Lincoln, NE). The Mega-MUGAisanIlluminaarrayplatformcontaining�77,800markers.Most of these markers are single nucleotide polymorphisms(SNPs), although some are structural variants and transgenicmarkers. The markers are densely and relatively evenly spacedat 33 kb across the genome, found across all autosomes, sexchromosomes, and the mitochondria. This array was designedto maximize the number of informative markers for the Collab-
orative Cross (Aylor et al. 2011; Threadgill and Churchill 2012),the diversity outbred cross (Svenson et al. 2012), andwild housemouse populations (Churchill et al. 2004; Collaborative CrossConsortium 2012). The Collaborative Cross features eight paren-tal strains, one of which is WSB. Liver tissue from all F2’s and theparents of the cross were sent to Geneseek (NeoGene Corpora-tion) forDNAextraction and genotyping. A total of 1536 sampleswere sent, including controls and samples from mice that diedbefore reaching 16 weeks of age.
Multiple controls were used for DNA extraction and geno-typing to identify technical and biological errors. Liver tissuewas organized into 16 (96 well) plates in such a way asto minimize array batch effects on related sets of samples.Tissue fromWSB was placed in identical wells on every plateto account for plate extraction effects. The four GI parentalsamples were replicated four times each across the 16 plates.Replicate samples of the first well of each plate were placed ina random well and run on different arrays.
We examined the genotypes for technical, biological, anddataentryerrors.Weomittedmarkers thatwerenot informativein the crosses and those with high levels of missing data. Weremoved a few individuals with high levels of missing data. Wealso removed a small number of individuals that had largenumbers of Mendelian inconsistencies or mismatched sex,which were most likely unresolved sample mix-ups. Followingthese initial screens, the cleaned data included the four GIparents of the crosses, 70 F1 individuals, 1346 F2 individuals,and 33,191 markers. In all subsequent analyses, we focused ona subset of 11,833 markers that were fixed in the four GI par-ents and therefore segregated as in a standard F2 intercrossbetween inbred lines. We estimated intermarker genetic dis-tances assuming a genotyping error rate of 0.2% and convertedestimated recombination fractions to map distances with theCarter–Falconer map function (Carter and Falconer 1951).
Single-trait QTL analysis
Single-trait QTL analysis was performed using Haley–Knottregression (Haley and Knott 1992) on a 0.5-cM grid acrossthe genome, as implemented in R/qtl (Broman and Sen 2009).Analysis was conducted separately for each of the 16 skeletaltraits at 5, 10, and 16 weeks with sex, mother, and observeras additive covariates. Genome-wide significance thresholdswere determined by permutation (Churchill and Doerge1994), with adjustments for the X chromosome (Bromanet al. 2006). Numbers of permutations were 47,840 and946,400 for the autosomes and the X chromosome, respec-tively. A QTL was considered significant if its maximum LODscore met a 5% genome-wide significance threshold.
Additional single-trait scans were performed on F2’s usingtwo different methods to control for effects of body size oneach skeletal trait: (1) by using relative skeletal sizes as ourtraits and (2) by treating bodyweight as an additive covariatein themodel. Relative skeletal size was calculated by dividingeach skeletal trait by the cube root of body weight for eachindividual (trait/body weight1/3) and is referred to as theshape ratio (Mosimann 1970; Jungers et al.1995). The use
Genetics of Skeletal Evolution 1561
of shape ratios accounts for the isometric component of bodysize, while maintaining allometric (size correlated) shapeand nonallometric (size independent) shape. Alternatively,the treatment of body weight as a covariate accounts for bothisometric shape and allometric shape, leaving nonallometricshape.
Genetic effects
QTLeffectsweremeasured usingbothadditive anddominanceeffects. Additive effectswere calculatedas half the difference ingenotypemeans between the GI andWSB homozygotes. Dom-inance effects were calculated as the difference between thegenotypic mean of the GI/WSB heterozygote and the averagegenotypic mean of the GI and WSB homozygotes. To compareeffects across traits and time points, additive effects werestandardized by dividing by the phenotypic SD. Dominanceeffects were standardized by dividing the dominance effects bythe additive effects (d/a). These ratios can be broken downinto broad categories defined in Kenney-Hunt et al. (2006).Strong overdominantQTL are defined by having d/a ratios.2.5.A QTL is considered to be overdominant when d/a is between1.5 and 2.5. GI is considered to be dominant to WSB when d/ais between 0.5 and 1.5. A QTL is considered codominant whend/a is between20.5 and 0.5. WSB is considered to be dominantto GI when d/a is between20.5 and21.5. A QTL is consideredto be underdominant when d/a is between 21.5 and 22.5.Strong underdominant QTL are defined by having d/a ratios lessthan22.5.
Phenotypic correlations
Pearson product moment correlations were calculated foreach pair of the 16 skeletal traits and body weight at 5, 10,
and 16weeks. Correlations of each trait with itself at differenttime pointswere also calculated.Weobserved significant traitcorrelations across the skeleton (see Results), raising theprospect that joint analysis of multiple traits could provideadditional insights into genetic architecture. When traits arecorrelated, multi-trait mapping increases the power to detectQTL and increases the precision of estimated QTL location(Jiang and Zeng 1995; Knott and Haley 2000).
To form trait sets for multi-trait mapping, we fit the pheno-typic correlations tomodels we developed (see Table S6) basedon well-established knowledge of mouse developmental andfunctional processes, including temporal patterning of the pre-natal skeleton (Shubin et al. 1997; Wellik and Capecchi 2003),germ layer and cell type origins (Morriss-Kay 2001; Jiang et al.2002; Jeong et al. 2004; Gross and Hanken 2008; Yoshidaet al. 2008), orthogonal patterning of skeletal axes (Wellikand Capecchi 2003; Carapuço et al. 2005), and effects ofmechanical load on limb elements (Rauch 2005). Eachmodel was composed of nonoverlapping sets of skeletaltraits partitioned into hypothesized modules. The best-fittingmodel was selected using MINT (Márquez 2008), which cal-culates a goodness of fit statistic g* that measures the similar-ity between expected and observed covariance matrices.Models were ranked based on their g* value, and supportfor rankings was measured by jackknifing.
Joint mapping of multiple skeletal traits
In light of the correlations between skeletal dimensions acrossF2s, we used two approaches to map QTL for sets of traits.First, we performed principal component analysis (PCA) onthe full set of 16measurements in the F2 population using theprcomp function in R (Mardia et al. 1979; R Core Team
Figure 1 (A) An X-ray image illustrating the size comparison of a GI mouse (left) and a WSB mouse (right) at 16 weeks of age. (B) Locations of skeletaltraits on an X-ray image taken from a dorsal view. (C) Location of the height of the cranial vault (HCV) on an X-ray image taken from a lateral view. Theright panel lists the 16 skeletal traits measured, and includes names, acronyms, and descriptions of each trait.
1562 M. D. Parmenter et al.
2016). Separate analyses were conducted for each time point(5, 10, and 16 weeks). We used single-trait QTL mapping tosearch for QTL for each of the 16 principal components; wereport results for PC1 and PC2. QTL significance thresholdswere established using permutation tests (1000 replicatesand 18,736 replicates for the autosomes and the X chromo-some, respectively).
We used multi-trait QTL analysis as a second method toidentify loci that affect suites of traits, as implemented inR/qtlpvl (Tian and Broman 2015). Separate analyses wereperformed on trait sets delineated using two criteria: (1)overlapping 1.5 LOD intervals in single-trait QTL analyses(Figure 3 and Table S3) and (2) membership in the samemodules of best-fitting models from MINT analyses of phe-notypic correlations (Table S6). Multi-trait mapping usedthe same genotype probabilities, informative markers, andcovariates used in single-trait QTL analyses. QTL significancethresholdswere established using permutation tests (1000 rep-licates and 18,736 replicates for the autosomes and the X chro-mosome, respectively).
Tests for pleiotropy
To evaluate whether each QTL associated with multiple traitsreflected the action of a single pleiotropic locus or two linkedloci, we conducted a statistical test for pleiotropy, as imple-mented in R/qtlpvl (Tian and Broman 2015; Tian et al. 2016).The test was performed separately on two data sets: (1) QTLfor skeletal traits from single-trait analyses and QTL for bodyweight fromGray et al. (2015) that have overlapping 1.5 LODintervals and (2) QTL for traits within each module of themost supported models from MINT analyses. In this frame-work, the null hypothesis (H0) is that one QTL controls alltraits (pleiotropy) and the alternative hypothesis (H1) is thattwo linked QTL control the traits (linkage), with each traitaffected by one of the two QTL. Multi-trait QTL mapping wasfirst performed under a single-QTL model, H0. Then a two-dimensional scan over the chromosome was performed, witha two-QTLmodel,H1, with each trait being affected by one orthe other QTL. This involved an approximation in which,rather than consider all possible allocations of the traits tothe two QTL, the traits were sorted based on their estimatedQTL location, when considered individually, and then eachpossible cut point of this list was considered. Each possiblecut point split the traits into two groups affected by the twodifferent QTL. The test statistic LOD2v1 was calculated bysubtracting the LOD score of H1 (maximizing over bothQTL positions and the split of the traits into two groups) fromthe LOD score of H0 (maximizing over QTL position). AP-value for the test of H0 was calculated by a parametricbootstrap, with a large P-value indicating that the data areconsistent with pleiotropy (H0).
Data availability
All phenotype and genotype data from this study are availablefrom the QTL Archive at the Jackson Laboratory, at http://qtlarchive.org.
Results
Phenotypic variation
GImice have larger skeletons thanWSBmice across postnataldevelopment, with all but one trait (height of the cranial vault(HCV) at 16weeks) showing significant expansions at all threetime points (t-test; maximum P-value = 0.005; Figure 2 andTable S1). GI and WSB mice were raised in the same environ-ment on a common diet; as a result, most differences should begenetic in origin. Averaging across traits, the GI skeleton is 14–15% (5 and 10 weeks of age) and 12% (at 16 weeks of age)larger than the WSB skeleton. Tibia midshaft diameter (TMD)shows the greatest proportional differences between GI andWSB (24% larger in female GImice at 5 weeks of age and 22%larger in male GI mice at 10 weeks of age). Substantial di-vergence is also seen in the humerus and pelvis in femalesand in the humerus, pelvis, and femur in males (.17% largerin GI averaged across 5, 10, and 16 weeks of age).
Some of the skeletal differences betweenGI andWSBmicerepresent changes in shape. The width and depth of the skullshow the smallest difference between GI andWSB, exhibitingonly a 3–6% increase in GI mice, whereas the skull is 12–15%longer in GI mice. Both humerus and femur lengths showproportionally greater expansion in GI than their respectivediameters late in postnatal development (Figure 2). Ratiosof hindlimb-to-forelimb lengths (intermembral indices) andhumerus-to-femur lengths (humerofemoral indices) aresimilar in GI and WSB mice. In contrast, brachial and cruralindices are smaller in GI mice, indicating disproportionateexpansion of proximal vs. distal limb elements relative toWSB (Table 1).
The majority of the skeleton increases in size across post-natal development in bothGI andWSBmice (Table S2).Moreskeletal elements show significant increases in size between5 and 10 weeks than between 10 and 16 weeks of age. Inhouse mice, males are typically larger than females (Snell1941). Although body weight and growth rate are sexuallydimorphic in GI mice (Gray et al. 2015), not all GI skeletalelements show statistically significant differences in size be-tween the sexes (see Figure 2). However, for all traits thereare at least some small differences in the means between thesexes, with male averages exceeding female averages.
The trait means of the F1 population from the GI and WSBintercross are closer to the GI means than the WSB means(data not shown). The trait means of the F2 population fromthe GI and WSB intercross are intermediate compared to theparents (Figure 2). All 16 skeletal traits follow normal andcontinuous distributions (Figure S2). All but two skeletaltraits [height of the cranial vault (HCV) at 5–10 weeks, meta-tarsal and calcaneus length (MC) at 10–16 weeks] in the F2population show significant increases in size over postnataldevelopment (t-test; maximum P-value = 0.016).
Single-trait QTL mapping
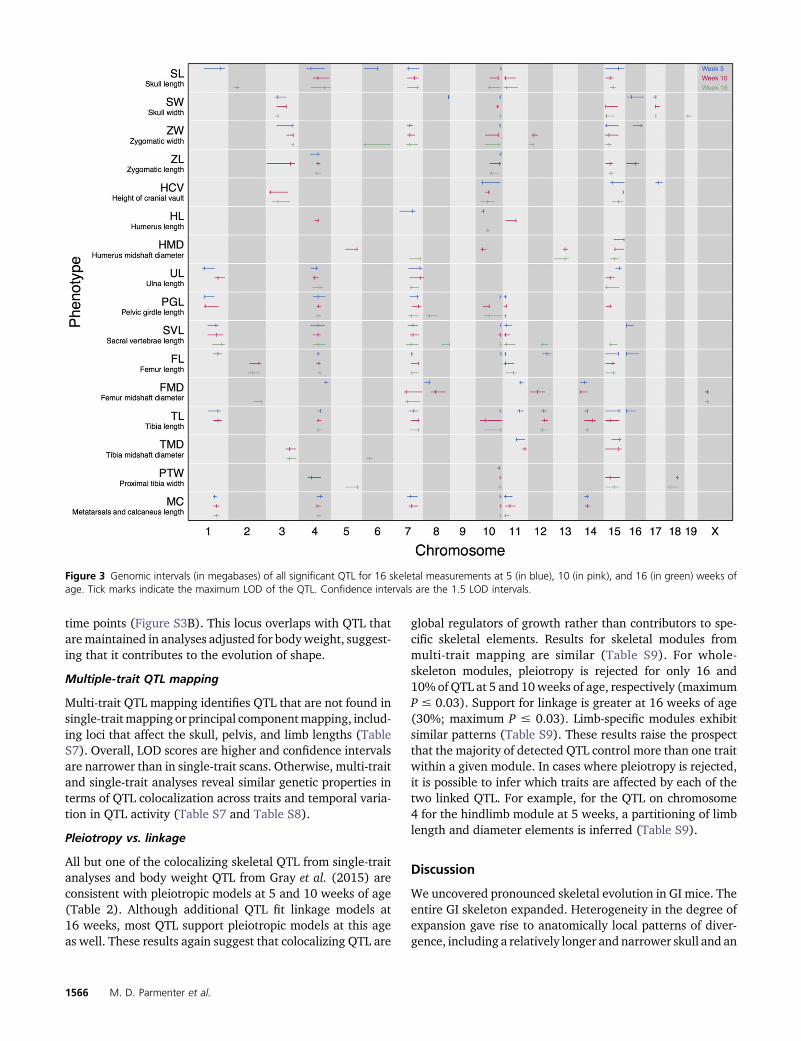
A total of 208 QTL are identified across 16 skeletal traits andthree time points (Figure 3 and Table S3). Multiple QTL are
Genetics of Skeletal Evolution 1563

detected for all traits, with the exception of humerus mid-shaft diameter (HMD) and proximal tibia width (PTW) at5 weeks of age. Nineteen of the 20 chromosomes contain atleast one significant QTL for at least one time point. A largeproportion of QTL for different traits colocalize, based onoverlapping confidence intervals. Over half of all QTL arefound on chromosomes 4, 7, 10, and 15, and span the entireskeleton, from skull to hindlimb. These highly colocalizingQTL are potentially pleiotropic and may act as global regula-tors of growth.
Effects of some QTL are restricted to specific regions of theskeleton (Figure 3), including the skull, femur, and otherhindlimb elements. Numbers of QTL are similar across thethree time points (69, 73, and 66 QTL at 5, 10, and 16 weeksof age, respectively). AlthoughQTL on chromosomes 4, 7, 10,11, and 15 are often found across all three time points, otherQTL are mostly or entirely restricted to one time point. QTLon chromosomes 2, 5, 6, 13, 18, and X for hindlimb diameters(PTW, HMD, FMD) are not identified at early time points,suggesting these loci contribute to variation in size occurring
later in postnatal development. In contrast, QTL on chromo-some16 (contributing to variation in skull widths andhindlimblengths) disappear with age, suggesting these loci conferearly growth differences between the two strains. There isa relative paucity of QTL for limb diameter traits, likely duein part to low repeatability. Because these traits are verysmall (,1 mm), they are more difficult to measure. Consis-tent with this idea, we observed higher standard deviationsfor limb diameter traits compared to longer measurements(data not shown).
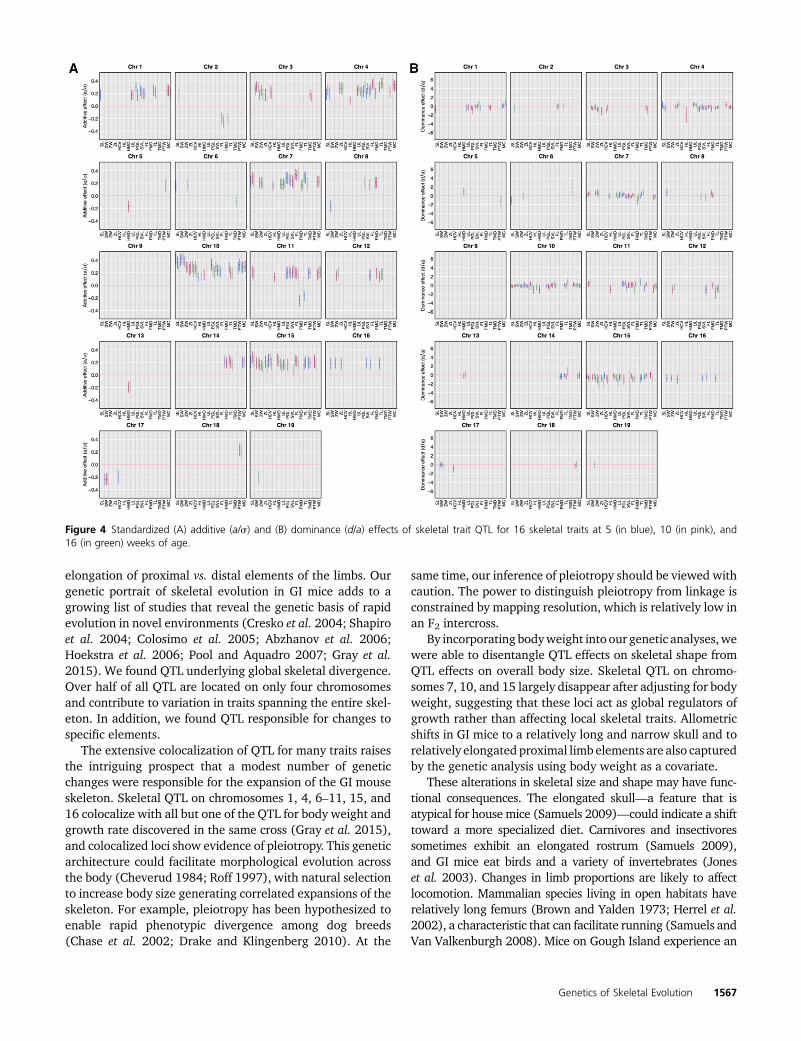
Standardized additive and dominance effects for all QTLare illustrated in Figure 4. Additive effects are small to mod-erate, ranging from 9 to 23% of the mean phenotypic differ-ences between GI and WSB mice. The largest additive effectis 0.48 mm for skull width (SW) (chromosome 10 QTL at10 weeks). Average values across traits of the standardizedadditive effect are also small: 0.23, 0.23, and 0.29 mm at 5,10, and 16 weeks of age, respectively. The GI allele is associ-ated with skeletal expansion at most QTL (93%); exceptionsare primarily QTL for widths and diameters.
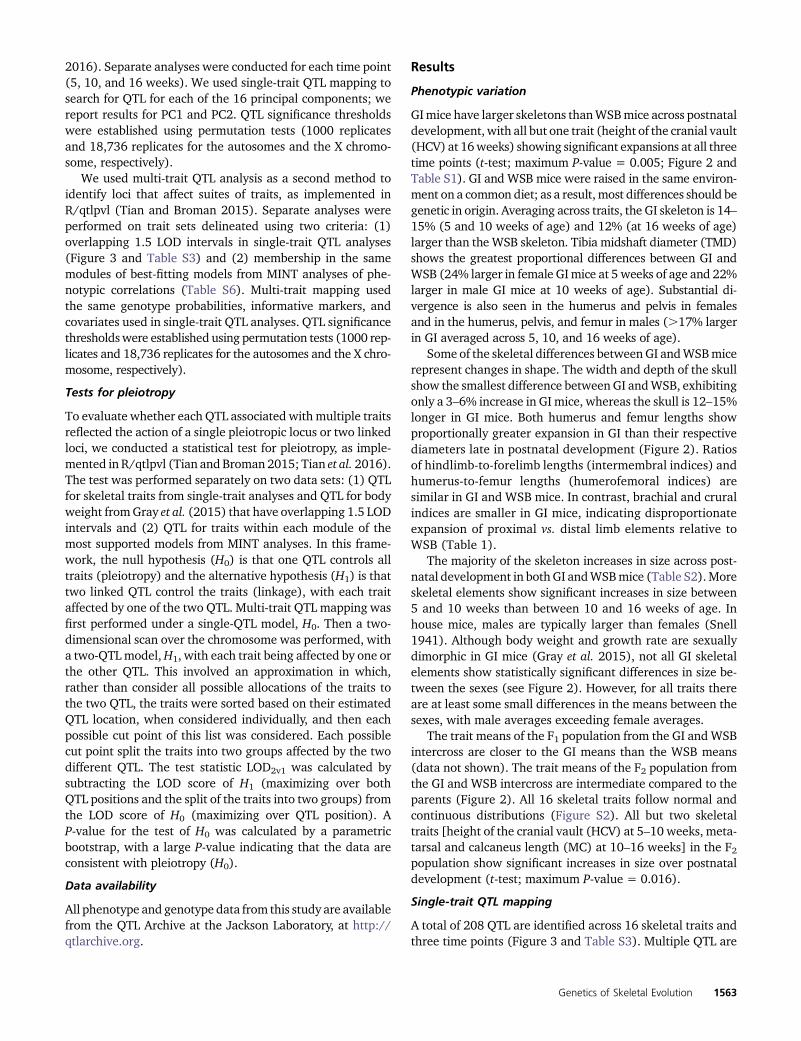
Figure 2 Phenotypic distributions of 16 skeletal traits (in millimeters) for female (pink) and male (blue) WSB, female (orange) and male (green) GI, andfemale (gray) and male (black) F2 animals at 5, 10, and 16 weeks of age. GI and WSB data are represented as scatter plots and F2 data are representedwith box plots.
1564 M. D. Parmenter et al.
Inspection of standardizeddominance values (d/a) revealsthat the majority (63%) of QTL are codominant (d/abetween 20.5 and 0.5). No QTL exhibit strong overdomi-nance. The largest d/a ratio is 1.9 for the diameter of thetibia (TMD) QTL on chromosome 6 at 16 weeks of age; thisis the only case of GI overdominance (d/a between 1.5and 2.5). The GI allele is at least partially dominant (d/abetween 0.5 and 1.5) at 6% of QTL. In contrast, WSB dom-inance (d/a between 20.5 and 21.5) is seen at 27% of theQTL. Only five QTL show values consistent with underdomi-nance (d/a between 21.5 and 22.5) or strong underdomi-nance (d/a , 22.5) of WSB alleles. The lowest d/a ratio(23.2) is for the sacral vertebrae length (SVL) QTL on chro-mosome 15 at 16 weeks of age.
Accounting for body weight has disparate effects acrossQTL (Table S4). Many QTL are no longer significant, includ-ing loci on chromosomes 7, 10, 11, and 15. Some QTL aremaintained, most of which map to chromosomes 4 and14 and underlie pelvic and hindlimb traits. New QTL areidentified in both weight-adjusted scans; many of theseQTL also map to chromosome 14 and contribute to pelvicand hindlimb dimensions. Results depend on the methodused to account for weight. QTL for skull and hindlimb traitson chromosome 7 are both maintained and acquired whenshape ratios (trait/body weight1/3) are used, but not whenbodyweight is used as a covariate. QTL for skull and hindlimbtraits on chromosomes 3 and 10 are maintained and acquiredwhen body weight is used as a covariate, but not when shaperatios are used. Although there are some differences in resultsacross the 5, 10, and 16week time points, the overall patternsin the weight-adjusted scans remain similar, both in the traitsinvolved and the chromosomal positions of QTL.
As a preliminary examination of epistasis, we tested forinteractions among all pairs of single-trait QTL identified foreach skeletal trait using the add.int function in R/qtl (Bromanand Sen 2009). Out of the 430 tested QTL pairs, only 20 (5%)show a statistically significant interaction at the uncorrectedP , 0.05 threshold, consistent with what we would expectbased on chance alone.
Phenotypic correlations
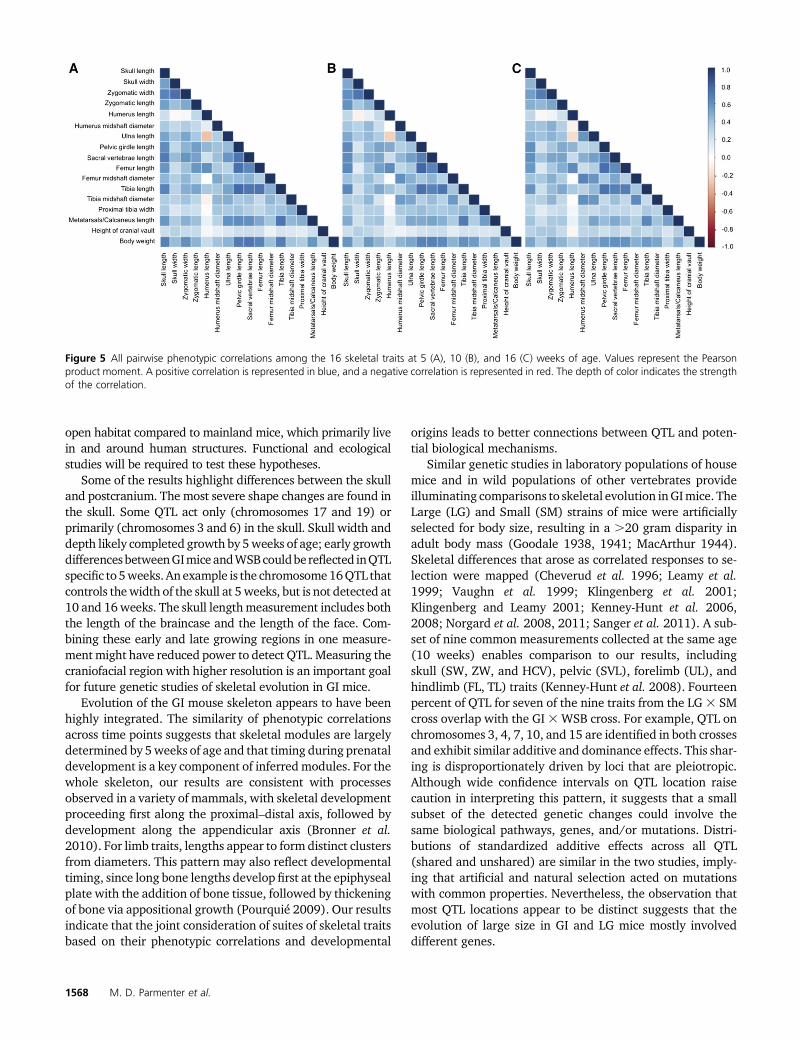
Most pairs of skeletal traits are positively correlated in the F2s(Figure 5). High correlations are observed between measure-ments of the skull, pelvis, and hindlimb (absolute average
Pearson’s r value = 0.54, 0.69, 0.62 at 5, 10, and 16 weeks,respectively; maximum P-value = 2.2e216). Humerus length(HL) shows the most divergent pattern: weaker than averagecorrelations with many traits and strong negative correla-tions with a few traits (absolute average Pearson’s r valueacross time points = 0.19; maximum P-value = 2.2e216).Body weight is also highly correlated with all skeletal traits.Although correlation patterns are similar across the threetime points, there are notable differences. The correlationbetween humerus length (HL) and the mid-shaft diameterof the humerus (HMD) changes during development, startingat 5 weeks as a positive correlation and ending at 16 weeksas a negative correlation (5 weeks: Pearson’s r = 0.11;P-value = 0.001; 10 weeks: Pearson’s r = 20.004; P-value =0.875; 16 weeks: Pearson’s r=20.08; P-value= 0.012). Thecorrelation between the mid-shaft diameter of the femur(FMD) with both the mid-shaft diameter of the humerus(HMD) and ulna length (HL) increases during development.Intratrait correlations across pairs of time points are high andpositive (Table S5). The earliest and latest time points (5 and16 weeks) show a lower correlation compared to the corre-lations among consecutive time points.
Analyses of phenotypic correlations using MINT revealevidence for modularity (nonrandom trait groupings) acrossthe skeleton (Table S6). Overall, the null hypothesis of in-dependence among traits fits the data poorly. Modules basedon developmental timing (H1) show the best fit at 5 and10 weeks of age. In contrast, modules that separate the skel-eton into axial and appendicular components (H3) receivethe most support at 16 weeks. Limb-specific analyses alsosupport modularity. For models H0–H5, the limb length vs.diameter model (H4) fits best for all three time points.
Principal component analysis
PC1 and PC2 collectively explain more than half of F2 skeletalvariation at each age (Figure S3A). Four QTL (on chromo-somes 4, 7, 10, and 15) contribute to PC1 at all three timepoints. Two lines of evidence suggest that these loci are in-volved in global size expansion. First, they overlap with theQTL that affect the largest number of traits. Second, PC1scores are highly positively correlated with body weight(Pearson’s r = 0.78; P , 0.0001), whereas PC2 scores areweakly correlated with body weight (r=20.10; P= 0.003).A single QTL (on chromosome 4) contributes to PC2 across
Table 1 Shape evolution in GI mice
F 5 wk F 10 wk F 16 wk M 5 wk M 10 wk M 16 wk
Shape index WSB GI WSB GI WSB GI WSB GI WSB GI WSB GI
Intermembral index 72.3 72.0 70.9 70.6 70.6 70.6 73.0 71.3 72.5 71.7 72.4 73.9Humerofemoral index 68.0 70.7 66.6 67.2 70.3 73.9 70.3 70.3 71.4 69.7 74.3 75.5Crural index 118.8 117.4 117.3 112.6 114.6 108.2 118.0 116.5 117.6 112.5 111.2 107.0Brachial index 132.5 121.5 131.6 123.3 115.6 104.1 126.4 119.4 121.0 118.8 106.0 102.4
Shape index values for GI and WSB mice for females (F) and males (M) at 5, 10, and 16 weeks of age. The intermembral index is the ratio of the forelimb to hindlimb [(HL +UL)/(FL + TL) 3 100], the humerofemoral index is the ratio of proximal elements of the limb [(HL/FL) 3 100], the crural index is the ratio of distal to proximal elements of thehindlimb [(TL/FL) 3 100], and the brachial index is the ratio of distal to proximal elements of the forelimb [(UL/HL) 3 100].
Genetics of Skeletal Evolution 1565
time points (Figure S3B). This locus overlaps with QTL thataremaintained in analyses adjusted for bodyweight, suggest-ing that it contributes to the evolution of shape.
Multiple-trait QTL mapping
Multi-trait QTL mapping identifies QTL that are not found insingle-traitmapping or principal componentmapping, includ-ing loci that affect the skull, pelvis, and limb lengths (TableS7). Overall, LOD scores are higher and confidence intervalsare narrower than in single-trait scans. Otherwise, multi-traitand single-trait analyses reveal similar genetic properties interms of QTL colocalization across traits and temporal varia-tion in QTL activity (Table S7 and Table S8).
Pleiotropy vs. linkage
All but one of the colocalizing skeletal QTL from single-traitanalyses and body weight QTL from Gray et al. (2015) areconsistent with pleiotropic models at 5 and 10 weeks of age(Table 2). Although additional QTL fit linkage models at16 weeks, most QTL support pleiotropic models at this ageas well. These results again suggest that colocalizing QTL are
global regulators of growth rather than contributors to spe-cific skeletal elements. Results for skeletal modules frommulti-trait mapping are similar (Table S9). For whole-skeleton modules, pleiotropy is rejected for only 16 and10% of QTL at 5 and 10weeks of age, respectively (maximumP # 0.03). Support for linkage is greater at 16 weeks of age(30%; maximum P # 0.03). Limb-specific modules exhibitsimilar patterns (Table S9). These results raise the prospectthat the majority of detected QTL control more than one traitwithin a given module. In cases where pleiotropy is rejected,it is possible to infer which traits are affected by each of thetwo linked QTL. For example, for the QTL on chromosome4 for the hindlimb module at 5 weeks, a partitioning of limblength and diameter elements is inferred (Table S9).
Discussion
We uncovered pronounced skeletal evolution in GI mice. Theentire GI skeleton expanded. Heterogeneity in the degree ofexpansion gave rise to anatomically local patterns of diver-gence, including a relatively longer and narrower skull and an
Figure 3 Genomic intervals (in megabases) of all significant QTL for 16 skeletal measurements at 5 (in blue), 10 (in pink), and 16 (in green) weeks ofage. Tick marks indicate the maximum LOD of the QTL. Confidence intervals are the 1.5 LOD intervals.
1566 M. D. Parmenter et al.
elongation of proximal vs. distal elements of the limbs. Ourgenetic portrait of skeletal evolution in GI mice adds to agrowing list of studies that reveal the genetic basis of rapidevolution in novel environments (Cresko et al. 2004; Shapiroet al. 2004; Colosimo et al. 2005; Abzhanov et al. 2006;Hoekstra et al. 2006; Pool and Aquadro 2007; Gray et al.2015). We found QTL underlying global skeletal divergence.Over half of all QTL are located on only four chromosomesand contribute to variation in traits spanning the entire skel-eton. In addition, we found QTL responsible for changes tospecific elements.
The extensive colocalization of QTL for many traits raisesthe intriguing prospect that a modest number of geneticchanges were responsible for the expansion of the GI mouseskeleton. Skeletal QTL on chromosomes 1, 4, 6–11, 15, and16 colocalize with all but one of the QTL for body weight andgrowth rate discovered in the same cross (Gray et al. 2015),and colocalized loci show evidence of pleiotropy. This geneticarchitecture could facilitate morphological evolution acrossthe body (Cheverud 1984; Roff 1997), with natural selectionto increase body size generating correlated expansions of theskeleton. For example, pleiotropy has been hypothesized toenable rapid phenotypic divergence among dog breeds(Chase et al. 2002; Drake and Klingenberg 2010). At the
same time, our inference of pleiotropy should be viewed withcaution. The power to distinguish pleiotropy from linkage isconstrained by mapping resolution, which is relatively low inan F2 intercross.
By incorporating bodyweight into our genetic analyses,wewere able to disentangle QTL effects on skeletal shape fromQTL effects on overall body size. Skeletal QTL on chromo-somes 7, 10, and 15 largely disappear after adjusting for bodyweight, suggesting that these loci act as global regulators ofgrowth rather than affecting local skeletal traits. Allometricshifts in GI mice to a relatively long and narrow skull and torelatively elongated proximal limb elements are also capturedby the genetic analysis using body weight as a covariate.
These alterations in skeletal size and shape may have func-tional consequences. The elongated skull—a feature that isatypical for house mice (Samuels 2009)—could indicate a shifttoward a more specialized diet. Carnivores and insectivoressometimes exhibit an elongated rostrum (Samuels 2009),and GI mice eat birds and a variety of invertebrates (Joneset al. 2003). Changes in limb proportions are likely to affectlocomotion. Mammalian species living in open habitats haverelatively long femurs (Brown and Yalden 1973; Herrel et al.2002), a characteristic that can facilitate running (Samuels andVan Valkenburgh 2008). Mice on Gough Island experience an
Figure 4 Standardized (A) additive (a/s) and (B) dominance (d/a) effects of skeletal trait QTL for 16 skeletal traits at 5 (in blue), 10 (in pink), and16 (in green) weeks of age.
Genetics of Skeletal Evolution 1567
open habitat compared to mainland mice, which primarily livein and around human structures. Functional and ecologicalstudies will be required to test these hypotheses.
Some of the results highlight differences between the skulland postcranium. The most severe shape changes are found inthe skull. Some QTL act only (chromosomes 17 and 19) orprimarily (chromosomes 3 and 6) in the skull. Skull width anddepth likely completed growth by 5weeks of age; early growthdifferencesbetweenGImiceandWSBcouldbereflected inQTLspecific to5weeks.Anexample is the chromosome16QTL thatcontrols thewidth of the skull at 5weeks, but is not detected at10 and 16weeks. The skull lengthmeasurement includes boththe length of the braincase and the length of the face. Com-bining these early and late growing regions in one measure-mentmight have reduced power to detect QTL.Measuring thecraniofacial region with higher resolution is an important goalfor future genetic studies of skeletal evolution in GI mice.
Evolution of the GI mouse skeleton appears to have beenhighly integrated. The similarity of phenotypic correlationsacross time points suggests that skeletal modules are largelydetermined by 5weeks of age and that timing during prenataldevelopment is a key component of inferred modules. For thewhole skeleton, our results are consistent with processesobserved in a variety of mammals, with skeletal developmentproceeding first along the proximal–distal axis, followed bydevelopment along the appendicular axis (Bronner et al.2010). For limb traits, lengths appear to form distinct clustersfrom diameters. This pattern may also reflect developmentaltiming, since long bone lengths develop first at the epiphysealplate with the addition of bone tissue, followed by thickeningof bone via appositional growth (Pourquié 2009). Our resultsindicate that the joint consideration of suites of skeletal traitsbased on their phenotypic correlations and developmental
origins leads to better connections between QTL and poten-tial biological mechanisms.
Similar genetic studies in laboratory populations of housemice and in wild populations of other vertebrates provideilluminating comparisons to skeletal evolution inGImice. TheLarge (LG) and Small (SM) strains of mice were artificiallyselected for body size, resulting in a .20 gram disparity inadult body mass (Goodale 1938, 1941; MacArthur 1944).Skeletal differences that arose as correlated responses to se-lection were mapped (Cheverud et al. 1996; Leamy et al.1999; Vaughn et al. 1999; Klingenberg et al. 2001;Klingenberg and Leamy 2001; Kenney-Hunt et al. 2006,2008; Norgard et al. 2008, 2011; Sanger et al. 2011). A sub-set of nine common measurements collected at the same age(10 weeks) enables comparison to our results, includingskull (SW, ZW, and HCV), pelvic (SVL), forelimb (UL), andhindlimb (FL, TL) traits (Kenney-Hunt et al. 2008). Fourteenpercent of QTL for seven of the nine traits from the LG3 SMcross overlap with the GI3WSB cross. For example, QTL onchromosomes 3, 4, 7, 10, and 15 are identified in both crossesand exhibit similar additive and dominance effects. This shar-ing is disproportionately driven by loci that are pleiotropic.Although wide confidence intervals on QTL location raisecaution in interpreting this pattern, it suggests that a smallsubset of the detected genetic changes could involve thesame biological pathways, genes, and/or mutations. Distri-butions of standardized additive effects across all QTL(shared and unshared) are similar in the two studies, imply-ing that artificial and natural selection acted on mutationswith common properties. Nevertheless, the observation thatmost QTL locations appear to be distinct suggests that theevolution of large size in GI and LG mice mostly involveddifferent genes.
Figure 5 All pairwise phenotypic correlations among the 16 skeletal traits at 5 (A), 10 (B), and 16 (C) weeks of age. Values represent the Pearsonproduct moment. A positive correlation is represented in blue, and a negative correlation is represented in red. The depth of color indicates the strengthof the correlation.
1568 M. D. Parmenter et al.

The threespine stickleback,Gasterosteus aculeatus, a targetof extensive genetic studies of skeletal evolution, also pro-vides useful context for our findings. Sticklebacks that re-cently adapted to new freshwater environments diverged inskeletal morphology, including bony plate armor loss andpelvic reduction (Peichel et al. 2001; Shapiro et al. 2004).In contrast to skeletal evolution in GI mice, changes in bothmeristic traits (e.g., bony lateral plate number, gill raker num-ber, and presence/absence of bony plates) and some contin-uous traits (e.g., spine length, pelvic size, and bony plate size)
involve loci with substantial phenotypic effects (Peichel et al.2001; Colosimo et al. 2004; Cresko et al. 2004; Shapiro et al.2004; Berner et al. 2014). However, genetic studies of smallercomponents of stickleback morphology have found hundredsof QTL with small to moderate effects (Miller et al. 2014;Conte et al. 2015). Therefore, some skeletal traits in stickle-back display genetic properties distinct from those observedin GI mice, but the breakdown of stickleback skeletal mor-phology into smaller components reveals a similar evolution-ary trajectory involving many mutations of modest effect.
Table 2 Tests of pleiotropy vs. close linkage
Week Chr Traits with overlapping QTL P LOD QTL 1 Pos QTL 2 Pos QTL 1 traits QTL 2 traits
5 1 SL, UL, PGL, SVL, FL, TL, MC,BW
0.13 12.0 73.7
3 SW, ZW, BW 0.52 6.3 58.34 SL, ZL, UL, PGL, SVL, FL, FMD,
TL, MC, BW,0.01* 24.7 93.6 133.0 SL, ZL, UL, PGL, SVL,
FL, TL, MC, BWFMD
7 SL, ZW, HL, UL, PGL, SVL, FL, TL,MC, BW
0.96 17.0 146.0
10P HCV, HL, BW 0.22 6.4 119.410D SL, SW, ZW, ZL, HCV, PGL, SVL,
FL, TL, PTW, MC, BW0.95 27.5 124.8
11P PGL, SVL, FL, MC, BW 0.23 8.1 19.311D FMD, TL, TMD, BW 0.19 16.8 96.512 FL, TL, BW 0.16 5.5 75.614 FMD, TL, MC, BW 0.87 7.9 71.915 SL, ZW, HCV, HMD, UL, FL, TL,
TMD, BW0.81 11.6 48.7
16 SL, ZW, SVL, FL, TL, BW 0.23 9.5 21.917 SW, HCV, BW 0.86 5.6 49.8
10 1 UL, PGL, SVL, TL, MC, BW 0.07 6.9 159.63 SW, ZW, ZL, HCV, TMD, BW 0.36 12.7 49.74 SL, ZL, HL, UL, PGL, SVL, FL, TL,
PTW, MC, BW0.38 24.0 104.1
7 SL, ZW, UL, PGL, SVL, FL, FMD,TL, MC, BW
0.25 14.9 95.4
10 SL, SW, ZW, ZL, HCV, HMD,PGL, SVL, TL, PTW, MC, BW
0.97 26.5 120.8
11 SL, HL, PGL, SVL, FL, MC, BW 0.06 6.8 19.312 ZW, FMD, TL, BW 0.02* 8.7 27.7 79.8 ZW, FMD TL, BW14 FMD, TL, MC, BW 0.06 6.0 40.015 SL, SW, ZW, ZL, HCV, HMD, UL,
PGL, FL, TL, TMD, PTW, BW0.10 16.2 51.5
16 1 SVL, MC, BW 0.04* 6.1 136.2 170.1 MC SVL, BW2 FL, FMD, BW 0.01* 10.4 120.7 161.3 FL, BW FMD3 SW, HCV, BW 0.19 7.1 47.74 SL, ZL, UL, PGL, SVL, FL, TL, MC,
BW,0.01* 32.2 86.5 105.0 UL, TL, BW SL, ZL, PGL, SVL,
FL, MC6 ZW, TMD, BW 0.03* 9.1 46.2 82.0 ZW, BW TMD7 SL, ZW, HMD, UL, PGL, SVL, FL,
FMD, TL, BW0.34 16.9 95.4
10 SL, SW, ZW, ZL, HCV, HL, PGL,SVL, TL, PTW, MC, BW
0.58 26.5 121.2
11 SL, PGL, SVL, FL, MC, BW 0.66 7.6 16.812 SVL, TL, BW 0.16 4.1 98.915 SL, SW, ZW, ZL, HCV, HMD, UL,
SVL, FL, PTW, BW0.38 14.6 51.5
Tests for the rejection of pleiotropy (H0) for sets of QTL for skeletal traits from single-trait analyses and QTL for body weight (from Gray et al. 2015) that have overlapping 1.5LOD intervals. QTL positions (in megabases), LOD scores, and P-values (P) are provided for each set of QTL on a given chromosome (Chr). A large P-value indicates that thedata are consistent with the pleiotropic model (H0). An asterisk indicates statistical significance to reject pleiotropy (H0), providing support for a model of close linkage. Iflinkage is supported, QTL 1 and QTL 2 positions, along with the partitioning of traits affected by each of the two linked QTL, are listed. Please see right panel in Figure 1 forthe 16 skeletal traits measured, including names, acronyms, and descriptions of each trait.
Genetics of Skeletal Evolution 1569
Finally, our results speak indirectly to the evolutionarycauses of skeletal divergence in GI mice. Evolution of the skel-etonwas presumably rapid andoccurred in anewenvironment,observations consistent with natural selection as a primaryevolutionary mechanism. The finding that QTL alleles fromGI mice increase skeletal size in almost all cases suggests thatnatural selection targeted the skeleton or a correlated trait (Orr1998). Body weight and body condition of GI mice correlatewith overwinter survival, and mice that prey upon nestlingseabird chicks maintain higher body weights during the winterseason (Cuthbert et al. 2016). These patterns raise the prospectthat natural selection targeted overall body size in GI mice,driving substantial and rapid evolution of the skeleton.
Acknowledgments
We thank Peter Ryan and Richard Cuthbert for arrangingthe trapping and shipment of mice from Gough Island toWisconsin. We thank Trevor Glass and the administrator ofTristan da Cunha for permission to live capture and removemice from Gough Island and Henk Louw and Paul Visser forcapturing mice. We thank Oren Feldman-Schultz, WilliamMatzke, Valeri Lapacek, Hannah Buchannan, Arielle Henderson,Elizabeth Linder, and Spencer Compton for their devotion tomouse husbandry and phenotyping. We thank the staff at theCharmany Instructional facility for mouse colony maintenanceand mouse care. Mark Nolte provided knowledge and guid-ance regarding the genetics of mouse development. Wethank Peter Ryan and Richard Cuthbert for critical feedbackon the manuscript. We also thank laboratory members AmyDapper, April Peterson, and Richard Wang for useful com-ments on the manuscript. We appreciate the support andencouragement from Payseur Laboratory members, includingMark Nolte, Amy Dapper, Leslie Turner, Richard Wang, LaurenBrooks, Ryan Haasl, John Hvala, April Peterson, Megan Frayer,and Peicheng Jing. This research was supported by NationalInstitutes of Health (NIH) grant R01-GM100426A to B.A.P., aNational Science Foundation graduate research fellowship toM.D.P., and NIH National Research Service Award 1F32-GM090685 to M.M.G.
Literature Cited
Abzhanov, A., W. P. Kuo, C. Hartmann, B. R. Grant, P. R. Grantet al., 2006 The Calmodulin pathway and evolution of elon-gated beak morphology in Darwin’s Finches. Nature 442(7102):563–567.
Adler, G. H., and R. Levins, 1994 The Island syndrome in rodentpopulations. Q. Rev. Biol. 69(4): 473–490.
Atchley, W. R., and B. K. Hall, 1991 A model for development andevolution of complex morphological structures. Biol. Rev. Camb.Philos. Soc. 66(2): 101–157.
Atchley, W. R., A. A. Plummer, and B. Riska, 1985a Genetic anal-ysis of size-scaling patterns in the mouse mandible. Genetics111: 579–595.
Atchley, W. R., A. A. Plummer, and B. Riska, 1985b Genetics ofmandible form in the mouse. Genetics 111: 555–577.
Aylor, D. L., W. Valdar, W. Foulds-Mathes, R. J. Buus, R. A. Verdugoet al., 2011 Genetic analysis of complex traits in the emergingcollaborative cross. Genome Res. 21(8): 1213–1222.
Beheregaray, L. B., J. P. Gibbs, N. Havill, T. H. Fritts, J. R. Powellet al., 2004 Giant tortoises are not so slow: rapid diversifica-tion and biogeographic consensus in the Galápagos. Proc. Natl.Acad. Sci. USA 101(17): 6514–6519.
Berner, D., D. Moser, M. Roesti, H. Buescher, and W. Salzburger,2014 Genetic architecture of skeletal evolution in Europeanlake and stream stickleback. Evolution 68(6): 1792–1805.
Berry, R. J., 1964 The evolution of an Island population of thehouse mouse. Evolution 18(3): 468–483.
Berry, R. J., 1986 Genetics of insular populations of mammals,with particular reference to differentiation and founder effectsin British small mammals. Biol. J. Linn. Soc. Lond. 28(1–2):205–230.
Berry, R. J., and M. E. Jakobson, 1975a Ecological genetics of anIsland population of the house mouse (Mus Musculus). J. Zool.175(4): 523–540.
Berry, R. J., andM. E. Jakobson, 1975b Adaptation and adaptability inwild‐living house mice (Mus Musculus). J. Zool. 176(3): 391–402.
Berry, R. J., M. E. Jakobson, and J. Peters, 1978a The house miceof the Faroe Islands: a study in microdifferentiation. J. Zool.185(1): 73–92.
Berry, R. J., J. Peters, and R. J. Van Aarde, 1978b Sub‐antarctichouse mice: colonization, survival and selection. J. Zool. 184(1):127–141.
Berry, R. J., W. N. Bonner, and J. Peters, 1979 Natural selection inhouse mice (Mus Musculus) from South Georgia (South AtlanticOcean). J. Zool. 189(3): 385–398.
Berry, R. J., R. D. Sage, W. Z. Lidicker, and W. B. Jackson,1981 Genetical variation in three pacific house mouse (MusMusculus). Populations. J. Zool. 193(3): 391–404.
Berry, R. J., M. E. Jakobson, and J. Peters, 1987 Inherited differ-ences within an Island population of the house mouse (MusDomesticus). J. Zool. (Lond.) 211(4): 605–618.
Bonhomme, F., and J. B. Searle, 2012 Evolution of the HouseMouse, edited by M. Macholan, S. Baird, P. Munclinger, and J.Pialek. Cambridge University Press, New York, NY.
Broman, K. W., and S. Sen, 2009 A Guide to QTL Mapping withR/qtl. Springer Science & Business Media, Berlin, Germany.
Broman, K. W., S. Sen, S. E. Owens, A. Manichaikul, E. M. Southard-Smith et al., 2006 The X chromosome in quantitative trait locusmapping. Genetics 174: 2151–2158.
Bronner, F., M. C. Farach-Carson, and H. I. Roach, 2010 Bone andDevelopment. Springer Science & Business Media, Berlin, Germany.
Brown, J. C., and D. W. Yalden, 1973 The description of mam-mals: 2 limbs and locomotion of terrestial mammals. MammalRev. 3(4): 107–134.
Carapuço, M., A. Nóvoa, N. Bobola, and M. Mallo, 2005 Hoxgenes specify vertebral types in the presomitic mesoderm. GenesDev. 19(18): 2116–2121.
Carson, E. A., J. P. Kenney-Hunt, M. Pavlicev, K. A. Bouckaert,A. J. Chinn et al., 2012 Weak genetic relationship betweentrabecular bone morphology and obesity in mice. Bone 51(1):46–53.
Carter, T. C., and D. S. Falconer, 1951 Stocks for detecting linkage inthe mouse, and the theory of their design. J. Genet. 50(2): 307–323.
Chase, K., D. R. Carrier, F. R. Adler, T. Jarvik, E. A. Ostrander et al.,2002 Genetic basis for systems of skeletal quantitative traits:principal component analysis of the canid skeleton. Proc. Natl.Acad. Sci. USA 99(15): 9930–9935.
Cheverud, J. M., 1984 Quantitative genetics and developmental con-straints on evolution by selection. J. Theor. Biol. 110(2): 155–171.
Cheverud, J. M., E. J. Routman, F. A. Duarte, B. van Swinderen, K.Cothran et al., 1996 Quantitative trait loci for murine growth.Genetics 142: 1305–1319.
1570 M. D. Parmenter et al.
Christians, J. K., and L. K. Senger, 2007 Fine mapping dissectspleiotropic growth quantitative trait locus into linked loci.Mamm. Genome 18(4): 240–245.
Churchill, G. A., and R. W. Doerge, 1994 Empirical thresholdvalues for quantitative trait mapping. Genetics 138: 963–971.
Churchill, G. A., D. C. Airey, H. Allayee, J. M. Angel, A. D. Attie et al.,2004 The collaborative cross, a community resource for the ge-netic analysis of complex traits. Nat. Genet. 36(11): 1133–1137.
Collaborative Cross Consortium, 2012 The genome architectureof the collaborative cross mouse genetic reference population.Genetics 190: 389–401.
Colosimo, P. F., C. L. Peichel, K. Nereng, B. K. Blackman, M. D.Shapiro et al., 2004 The genetic architecture of parallel armorplate reduction in threespine sticklebacks. PLoS Biol. 2(5): E109.
Colosimo, P. F., K. E. Hosemann, S. Balabhadra, G. Villarreal, M.Dickson et al., 2005 Widespread parallel evolution in stick-lebacks by repeated fixation of ectodysplasin alleles. Science307(5717): 1928–1933.
Conte, G. L., M. E. Arnegard, J. Best, Y. F. Chan, F. C. Jones et al.,2015 Extent of QTL reuse during repeated phenotypic divergenceof sympatric threespine stickleback. Genetics 201: 1189–1200.
Cresko, W. A., A. Amores, C. Wilson, J. Murphy, M. Currey et al.,2004 Parallel genetic basis for repeated evolution of armorloss in Alaskan threespine stickleback populations. Proc. Natl.Acad. Sci. USA 101(16): 6050–6055.
Cuthbert, R. J., R. M. Wanless, A. Angel, M.-H. Burle, G. M. Hiltonet al., 2016 Drivers of predatory behavior and extreme size inhouse mice Mus Musculus on Gough Island. J. Mammal. 97(2):533–545.
Davis, S. J. M., 1983 Morphometric variation of populations of housemice Mus Demesticus in Britain and Faroe. J. Zool. 199(4): 521–534.
Drake, A. G., and C. P. Klingenberg, 2010 Large-scale diversifica-tion of skull shape in domestic dogs: disparity and modularity.Am. Nat. 175(3): 289–301.
Durst, P. A. P., and V. L. Roth, 2012 Classification tree methodsprovide a multifactorial approach to predicting insular body sizeevolution in rodents. Am. Nat. 179(4): 545–553.
Durst, P. A. P., and V. L. Roth,2015 Mainland size variation in-forms predictive models of exceptional insular body size changein rodents. Proc. R. Soc. B 282: 1–7.
Ehrich, T. H., T. T. Vaughn, S. F. Koreishi, R. B. Linsey, L. S. Pletscheret al., 2003 Pleiotropic effects on mandibular morphology I. De-velopmental morphological integration and differential domi-nance. J. Exp. Zool. B Mol. Dev. Evol. 296(1): 58–79.
Foster, J. B., 1964 Evolution of mammals on islands. Nature202(4929): 234–235.
Goodale, H. D., 1938 A study of the inheritence of body weight inthe albino mouse by selection. J. Hered. 29(3): 101–112.
Goodale, H. D., 1941 Progress report on possibilities in projeny-test. Breed. Sci. 94(2445): 442–443.
Grant, P. R., 1999 Ecology and Evolution of Darwin’s Finches.Princeton University Press, Princeton, NJ.
Gray, M. M., D. Wegmann, R. J. Haasl, M. A. White, S. I. Gabriel et al.,2014 Demographic history of a recent invasion of house mice onthe isolated Island of Gough. Mol. Ecol. 23(8): 1923–1939.
Gray, M. M., M. D. Parmenter, C. Hogan, I. Ford, R. J. Cuthbertet al., 2015 Genetics of rapid and extreme size evolution inIsland mice. Genetics 201: 213–228.
Gross, J. B., and J. Hanken, 2008 Review of fate-mapping stud-ies of osteogenic cranial neural crest in vertebrates. Dev. Biol.317(2): 389–400.
Haley, C. S., and S. A. Knott, 1992 A simple regression method formapping quantitative trait loci in line crosses using flankingmarkers. Heredity 69(4): 315–324.
Herrel, A., J. J. Meyers, and B. VanHooydonck, 2002 Relationsbetween microhabitat use and limb shape in phrynosomatidlizards. Biol. J. Linn. Soc. Lond. 77(1): 149–163.
Hoekstra, H. E., R. J. Hirschmann, R. A. Bundey, P. A. Insel, andJ. P. Crossland, 2006 A single amino acid mutation contributesto adaptive beach mouse color pattern. Science 313: 101–104.
Huang, Q., F. H. Xu, H. Shen, H. Y. Deng, T. Conway et al.,2004 Genome scan for QTLs underlying bone size variationat 10 refined skeletal sites: genetic heterogeneity and the sig-nificance of phenotype refinement. Physiol. Genomics 17(3):326–331.
Jeong, J., J. Mao, T. Tenzen, A. H. Kottmann, and A. P. McMahon,2004 Hedgehog signaling in the neural crest cells regulates thepatterning and growth of facial primordia. Genes Dev. 18(8):937–951.
Jiang, C., and Z. Zeng, 1995 Multiple trait analysis of geneticmapping for quantitative trait loci. Genetics 140: 1111–1127.
Jiang, X., S. Iseki, R. E. Maxson, H. M. Sucov, and G. M. Morriss-Kay, 2002 Tissue origins and interactions in the mammalianskull vault. Dev. Biol. 241(1): 106–116.
Jones, A. G., S. L. Chown, and K. J. Gaston, 2003 Introducedhouse mice as a conservation concern on Gough Island. Atlantic12: 2107–2119.
Jungers, W. L., A. B. Falsetti, and C. E. Wall, 1995 Shape, relativesize, and size‐adjustments in morphometrics. Am. J. Phys.Anthropol. 38(S21): 137–161.
Keane, T. M., L. Goodstadt, P. Danecek, M. A. White, K. Wong et al.,2011 Mouse genomic variation and its effect on phenotypesand gene regulation. Nature 477(7364): 289–294.
Kenney-Hunt, J. P., T. T. Vaughn, L. S. Pletscher, A. Peripato, E. J.Routman et al., 2006 Quantitative trait loci for body size com-ponents in mice. Mamm. Genome 17(6): 526–537.
Kenney-Hunt, J. P., B. Wang, E. Norgard, G. Fawcett, D. Falk et al.,2008 Pleiotropic patterns of quantitative trait loci for 70 mu-rine skeletal traits. Genetics 178: 2275–2288.
Klingenberg, C., 2004 Integration and modularity of quantitativetrait locus effects on geometric shape in the mouse mandible.Genetics 166: 1909–1921.
Klingenberg, C., 2008 Morphological integration and develop-mental modularity. Annu. Rev. Ecol. Evol. Syst. 39(1): 115–132.
Klingenberg, C., and L. J. Leamy, 2001 Quantitative genetics ofgeometric shape in the mouse mandible. Evolution 55(11):2342–2352.
Klingenberg, C., L. J. Leamy, E. J. Routman, and J. M. Cheverud,2001 Genetic architecture of mandible shape in mice: effectsof quantitative trait loci analyzed by geometric morphometrics.Genetics 157: 785–802.
Klingenberg, C., K. Mebus, and J. C. Auffray, 2003 Developmentalintegration in a complex morphological structure: How distinct arethe modules in the mouse mandible? Evol. Dev. 5(5): 522–531.
Knott, S. A., and C. S. Haley, 2000 Multitrait least squares forquantitative trait loci detection. Genetics 156: 899–911.
Lande, R., 1979 Quantitative genetic analysis of multivariate evo-lution, applied to brain:body size allometry. Evolution 33(1):402–416.
Lande, R., 1980 The genetic covariance between characters main-tained by pleiotropic mutations. Genetics 94: 203–215.
Lang, D. H., N. A. Sharkey, H. A. Mack, G. P. Vogler, D. J. Vandenberghet al., 2005 Quantitative trait loci analysis of structural and mate-rial skeletal phenotypes in C57BL/6J and DBA/2 second-generationand recombinant inbred mice. J. Bone Miner. Res. 20(1): 88–99.
Leamy, L. J., E. J. Routman, and J. M. Cheverud, 1999 Quantitativetrait loci for early- and late-developing skull characters in mice: atest of the genetic independence model of morphological integra-tion. Am. Nat. 153(2): 201–214.
Leamy, L. J., D. Pomp, E. J. Eisen, and J. M. Cheverud,2002 Pleiotropy of quantitative trait loci for organ weightsand limb bone lengths in mice. Physiol. Genomics 10(1): 21–29.
Leamy, L. J., C. Klingenberg, E. Sherratt, J. B. Wolf, and J. M.Cheverud, 2008 A search for quantitative trait loci exhibiting
Genetics of Skeletal Evolution 1571
imprinting effects on mouse mandible size and shape. Heredity101(6): 518–526.
Lomolino, M. V., 2005 Body size evolution in insular vertebrates:generality of the Island rule. J. Biogeogr. 32(10): 1683–1699.
Losos, J. B., and R. E. Ricklefs, 2009 Adaptation and diversifica-tion on islands. Nature 457(7231): 830–836.
Lynch, M., and B. Walsh, 1998 Genetics and Analysis of Quantita-tive Traits. Sinauer, Sunderland, MA.
MacArthur, J. W., 1944 Genetics of body size and related charac-ters. I. Selecting small and large races of the laboratory mouse.Am. Nat. 78(775): 142–157.
Mardia, K. V., J. T. Kent, and J. M. Bibby, 1979 Multivariate Anal-ysis (Probability and Mathematical Statistics). Academic Press,London, UK.
Márquez, E. J., 2008 A statistical framework for testing modular-ity in multidimensional data. Evolution 62(10): 2688–2708.
Miller, C. T., A. M. Glazer, B. R. Summers, B. K. Blackman, A. R.Norman et al., 2014 Modular skeletal evolution in sticklebacksis controlled by additive and clustered quantitative trait loci.Genetics 197: 405–420.
Morriss-Kay, G. M., 2001 Derivation of the mammalian skullvault. J. Anat. 199: 143–151.
Mosimann, J. E., 1970 Size allometry: size and shape variableswith characterizations of the lognormal and generalized gammadistributions. J. Am. Stat. Assoc. 65(330): 930–945.
Norgard, E., C. C. Roseman, G. L. Fawcett, M. Pavlicev, C. D. Morganet al., 2008 Identification of quantitative trait loci affecting mu-rine long bone length in a two-generation intercross of LG/J andSM/J Mice. J. Bone Miner. Res. 23(6): 887–895.
Norgard, E., H. A. Lawson, L. S. Pletscher, B. Wang, V. R. Brookset al., 2011 Genetic factors and diet affect long-bone length inthe F34 LG. SM Advanced Intercross. Mamm. Genome 22(3–4):178–196.
Orr, H. A., 1998 Testing natural selection vs. genetic drift in phe-notypic evolution using quantitative trait locus data. Genetics149: 2099–2104.
Parsons, K. J., E. Márquez, and R. C. Albertson, 2012 Constraintand opportunity: the genetic basis and evolution of modularityin the cichlid mandible. Am. Nat. 179(1): 64–78.
Pavlicev, M., J. P. Kenney-Hunt, E. Norgard, C. C. Roseman, J. B. Wolfet al., 2008 Genetic variation in pleiotropy: differential Epistasisas a source of variation in the allometric relationship between longbone lengths and body weight. Evolution 62(1): 199–213.
Peichel, C. L., K. S. Nereng, K. A. Ohgi, B. L. Cole, P. F. Colosimoet al., 2001 The genetic architecture of divergence betweenthreespine stickleback species. Nature 414(6866): 901–905.
Pergams, O. R., and M. V. Ashley, 2001 Microevolution in Islandrodents. Genetica 112–113: 245–256.
Pool, J. E., and C. F. Aquadro, 2007 The genetic basis of adaptivepigmentation variation in Drosophila melanogaster. Mol. Ecol.16(14): 2844–2851.
Pourquié, O., 2009 The Skeletal System. Cold Spring Harbor Labo-ratory Press, Cold Spring Harbor, NY.
R Core Team, 2016 R: A Language and Environment for StatisticalComputing. Available at https://www.r-project.org/ (accessed July1, 2016).
Rauch, F., 2005 Bone growth in length and width: the Yin and Yangof bone stability. J. Musculoskel. Neuronal Interact. 5(3): 194–201.
Renaud, S., and J. C. Auffray, 2010 Adaptation and plasticity ininsular evolution of the house mouse mandible. J. ZoologicalSyst. Evol. Res. 48(2): 138–150.
Roff, D. A., 1997 Evolutionary Quantitative Genetics. Springer Sci-ence & Business Media. Berlin, Germany.
Roseman, C. C., J. P. Kenney-Hunt, and J. M. Cheverud,2009 Phenotypic integration without modularity: testing hy-potheses about the distribution of pleiotropic quantitative traitloci in a continuous space. Evol. Biol. 36(3): 282–291.
Rowe-Rowe, D. T., and J. E. Crafford, 1992 Density, body size,and reproduction of feral house mice on Gough Island. S. Afr.J. Zool. 27(1): 1–5.
Russell, J. C., 2012 Spatio-temporal patterns of introduced mice andinvertebrates on Antipodes Island. Polar Biol. 35(8): 1187–1195.
Samuels, J. X., 2009 Cranial morphology and dietary habits ofrodents. Zool. J. Linnean Soc. 156(4): 864–888.
Samuels, J. X., and B. Van Valkenburgh, 2008 Skeletal indicatorsof locomotor adaptations in living and extinct rodents.J. Morphol. 269(11): 1387–1411.
Sanger, T. J., E. Norgard, L. S. Pletscher, M. Bevilacqua, V. R.Brooks et al., 2011 Developmental and genetic origins of mu-rine long bone length variation. J. Exp. Zool. Part B. Mol. Dev.Evol. 316B(2): 146–161.
Schlosser, G., and G. P. Wagner, 2004 Modularity in Developmentand Evolution. University of Chicago Press, Chicago, IL.
Schluter, D., 1996 Adaptive radiation along genetic lines of leastresistance. Evolution 50(5): 1766–1774.
Shapiro, M. D., M. E. Marks, C. L. Peichel, B. K. Blackman, K. S.Nereng et al., 2004 Genetic and developmental basis of evo-lutionary pelvic reduction in threespine sticklebacks. Nature428(6984): 717–723.
Shubin, N., C. Tabin, and S. Carroll, 1997 Fossils, genes and theevolution of animal limbs. Nature 388(6643): 639–648.
Silver, L. M., 1995 Mouse Genetics: Concepts and Applications. Ox-ford University Press, New York, NY.
Snell, G. D., 1941 Biology of the Laboratory Mouse. Dover Publi-cations, New York, NY.
Svenson, K. L., D. M. Gatti, W. Valdar, C. E. Welsh, R. Cheng et al.,2012 High-resolution genetic mapping using the mouse diver-sity outbred population. Genetics 190: 437–447.
Thomas, G. H., S. Meiri, and A. B. Phillimore, 2009 Body sizediversification in Anolis: novel environment and Island effects.Evolution 63(8): 2017–2030.
Threadgill, D. W., and G. A. Churchill, 2012 Ten years of thecollaborative cross. G3 (Bethesda) 2(2): 153–156.
Tian, J., and K. W. Broman, 2015 Testing of Pleotropy vs. CloseLinkage. GitHub Repository. Available at: https://github.com/jianan/qtlpvl. Accessed August 20, 2016.
Tian, J., M. P. Keller, A. T. Broman, C. Kendziorski, B. S. Yandellet al., 2016 The dissection of expression quantitative trait lo-cus hotspots. Genetics 202: 1563–1574.
Vaughn, T. T., L. S. Pletscher, A. Peripato, K. King-Ellison, E. Adamset al., 1999 Mapping quantitative trait loci for murine growth: acloser look at genetic architecture. Genet. Res. 74(03): 313–322.
Wagner, G. P., M. Pavlicev, and J. M. Cheverud, 2007 The road tomodularity. Nat. Rev. Genet. 8(12): 921–931.
Wellik, D. M., and M. R. Capecchi, 2003 Hox10 and Hox11 genesare required to globally pattern the mammalian skeleton. Sci-ence 301(5631): 363–367.
Willmore, K. E., C. C. Roseman, J. Rogers, J. M. Cheverud, and J. T.Richtsmeier, 2009 Comparison of mandibular phenotypic andgenetic integration between baboon and mouse. Evol. Biol.36(1): 19–36.
Wolf, J. B., L. J. Leamy, E. J. Routman, and J. M. Cheverud,2005 Epistatic pleiotropy and the genetic architecture of co-variation within early and late-developing skull trait complexesin mice. Genetics 171: 683–694.
Wolf, J. B., D. Pomp, E. J. Eisen, J. M. Cheverud, and L. J. Leamy,2006 The contribution of Epistatic Pleiotropy to the geneticarchitecture of covariation among polygenic traits in mice. Evol.Dev. 8(5): 468–476.
Yoshida, T., P. Vivatbutsiri, G. M. Morriss-Kay, Y. Saga, and S. Iseki,2008 Cell lineage in mammalian craniofacial mesenchyme.Mech. Dev. 125(9–10): 797–808.
Communicating editor: J. B. Wolf
1572 M. D. Parmenter et al.


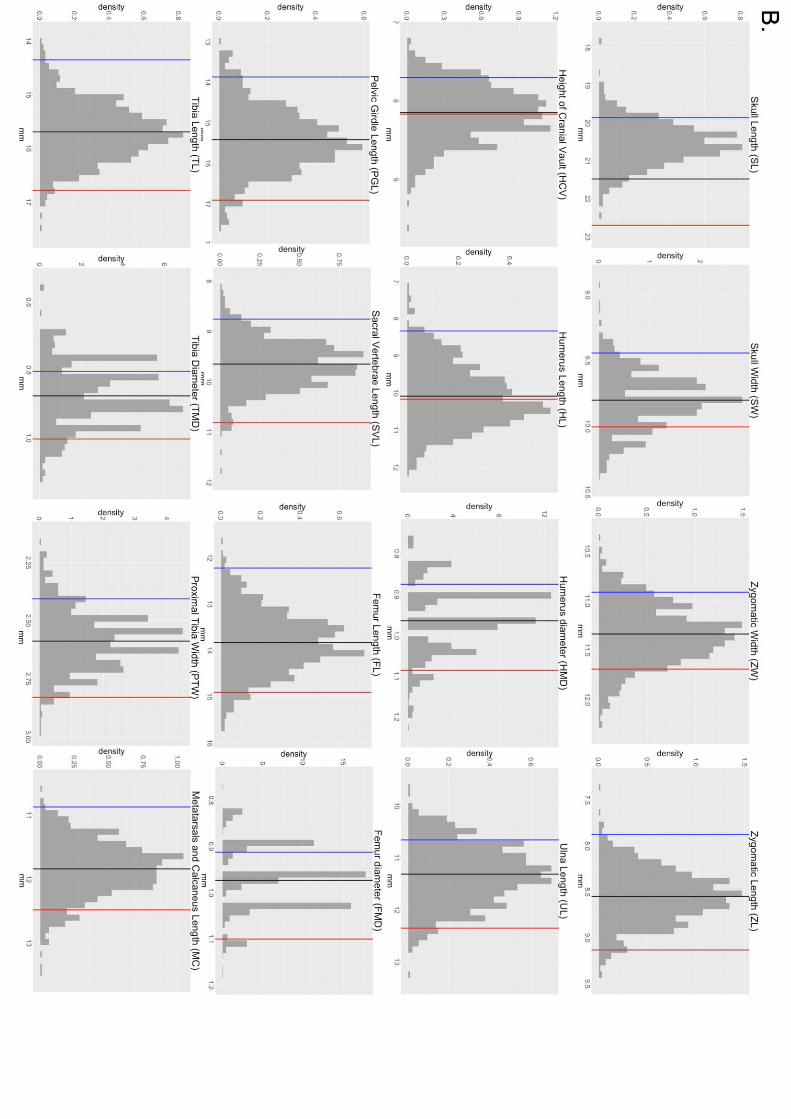
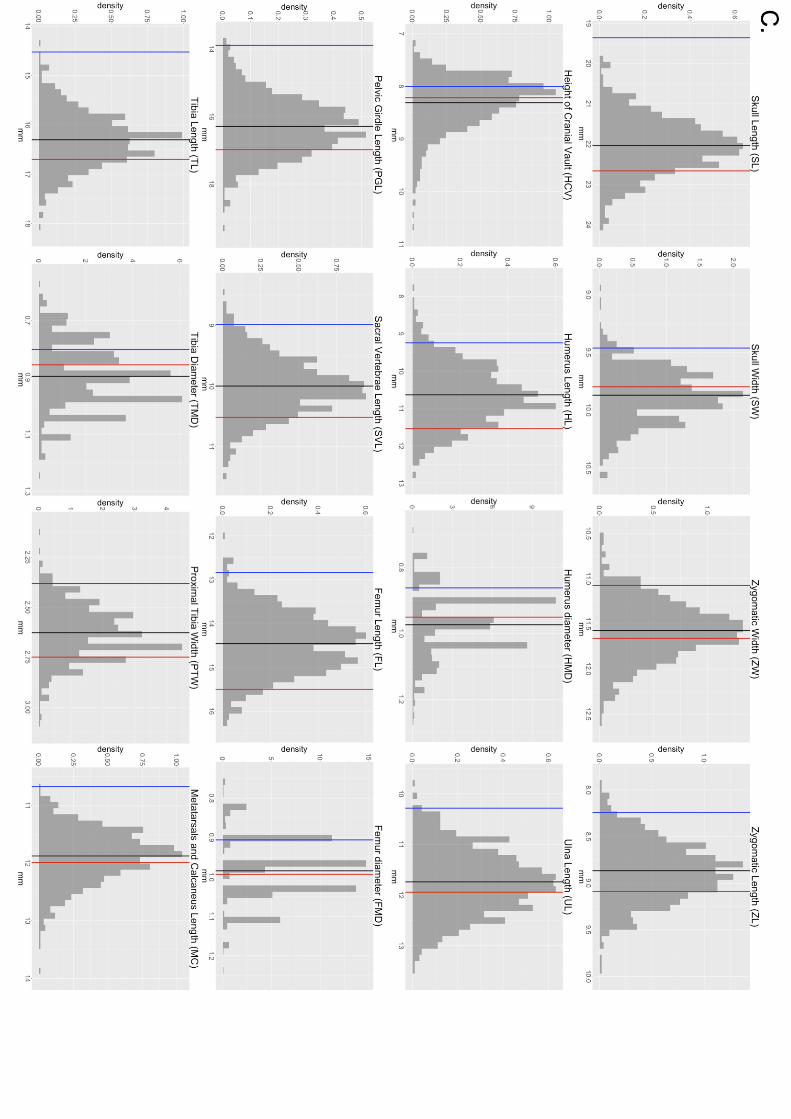

Table S1. Phenotypic means and standard deviations of GI and WSB at 5, 10 and 16 weeks. (.xlsx, 50 KB)
www.genetics.org/lookup/suppl/doi:10.1534/genetics.116.193805/-/DC1/TableS1.xlsx

Table S2. P-values of two-tailed T-tests performed for 16 skeletal traits between each time point within GI and within WSB. (.xlsx, 47 KB)
www.genetics.org/lookup/suppl/doi:10.1534/genetics.116.193805/-/DC1/TableS2.xlsx

Table S3. Genomic positions of single-trait QTL. (.xlsx, 69 KB)
www.genetics.org/lookup/suppl/doi:10.1534/genetics.116.193805/-/DC1/TableS3.xlsx

Table S4. Summary of size-corrected QTL. (.xlsx, 60 KB)
www.genetics.org/lookup/suppl/doi:10.1534/genetics.116.193805/-/DC1/TableS4.xlsx

Table S5. Phenotypic correlations among time points for each of the 16 skeletal traits. (.xlsx, 43 KB)
www.genetics.org/lookup/suppl/doi:10.1534/genetics.116.193805/-/DC1/TableS5.xlsx

Table S6. Evidence for modularity among GI skeletal traits using MINT analyses. (.xlsx, 53 KB)
www.genetics.org/lookup/suppl/doi:10.1534/genetics.116.193805/-/DC1/TableS6.xlsx

Table S7. Genomic positions of multi-trait QTL. (.xlsx, 47 KB)
www.genetics.org/lookup/suppl/doi:10.1534/genetics.116.193805/-/DC1/TableS7.xlsx

Table S8. Genomic positions of multi-trait QTL for skeletal modules. (.xlsx, 46 KB)
www.genetics.org/lookup/suppl/doi:10.1534/genetics.116.193805/-/DC1/TableS8.xlsx

Table S9. Tests for pleiotropy of skeletal modules. (.xlsx, 46 KB)
www.genetics.org/lookup/suppl/doi:10.1534/genetics.116.193805/-/DC1/TableS9.xlsx
Supplemental Figure Legends Figure S1. Design of F2 intercrosses for genetic mapping. WSB = parental WSB
individual; Gough = parental Gough (GI) individual (full-sib inbred for 3 generations);
F1 = first filial generation hybrid of WSBxGI; F2 = second filial generation hybrid of
F1xF1.
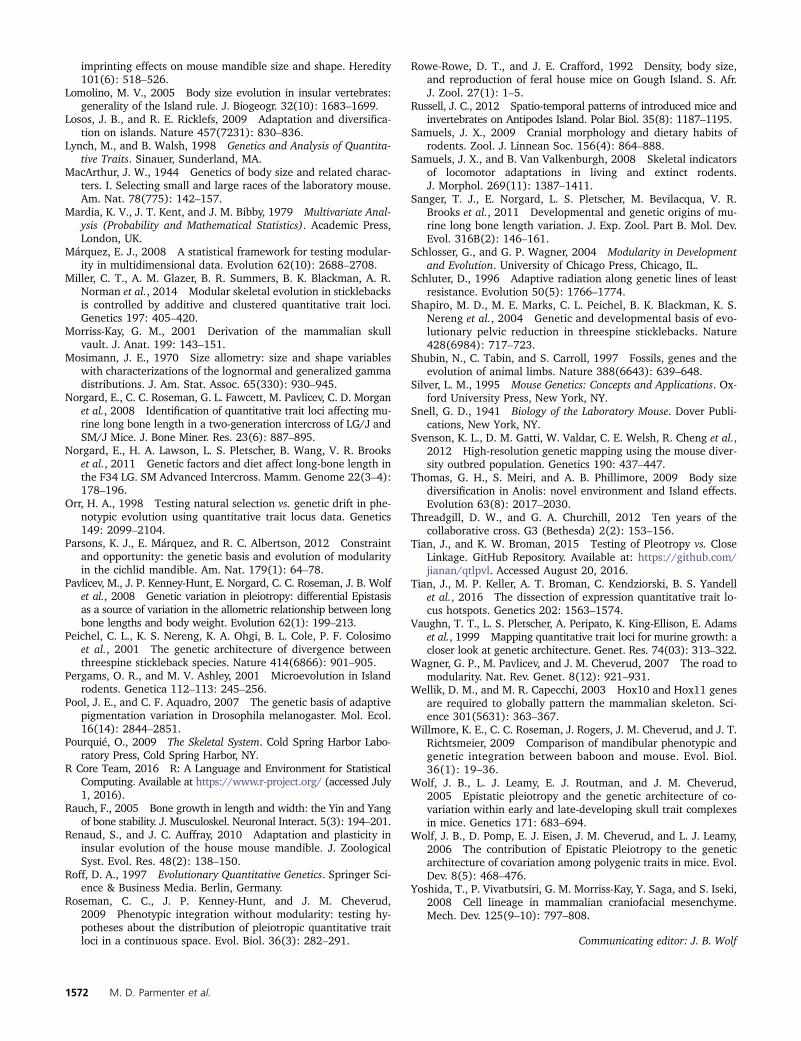
Figure S2. WSB, GI and F2 histograms representing the phenotypes of the 16 skeletal
traits. Vertical lines represent the means of the parents (blue = WSB, red = GI) and F2s
(green).
Figure S3. Principal Component Analyses on skeletal traits. A. Percent variance
explained by each principal component (PC) at 5, 10, and 16 weeks (left, center, and right
columns, respectively. B. QTL for PC1 and PC2 at 5, 10, and 16 weeks. Significance is
indicated with a dotted line.
Related Documents