Genetic variation in PCDH11X is associated with susceptibility to late onset Alzheimer's disease Minerva M. Carrasquillo 1 , Fanggeng Zou 1 , V. Shane Pankratz 2 , Samantha L. Wilcox 1 , Li. Ma 1 , Louise P. Walker 1 , Samuel G. Younkin 1 , Curtis S. Younkin 1 , Linda H. Younkin 1 , Gina D. Bisceglio 1 , Nilufer Ertekin-Taner 1,3 , Julia E. Crook 4 , Dennis W. Dickson 1 , Ronald C. Petersen 5 , Neill R. Graff-Radfor d 1,3 , and Steven G. Younkin 1 1 Department of Neuroscience, Mayo Clinic College of Medicine, Jacksonville, FL 32224, USA 2 Division of Biomedical Statistics and Informatics, Mayo Clinic and Mayo Foundation, Rochester, MN 55905, USA 3 Department of Neurology, Mayo Clinic College of Medicine, Jacksonville, FL 32224, USA 4 Biostatistics Unit, Mayo Clinic College of Medicine, Jacksonville, FL 32224, USA 5 Department of Neurology and the Mayo Alzheimer Disease Research Center, Mayo Clinic College of Medicine, Rochester, MN 55905, USA Abstract By analyzing late onset Alzheimer's disease (LOAD) in a genome wide association study (313,504 SNPs, 3 series, 844 cases/1,255 controls) and evaluating the 25 SNPs with most significant allelic association in 4 additional series (1,547 cases/1,209 controls), we identified a SNP (rs5984894) on Xq21.3 in PCDH11X that is strongly associated with LOAD in American Caucasians. Analysis of rs5984894 by multivariable logistic regression adjusted for sex gave global P values of 5.7×10 -5 in stage I, 4.8×10 -6 in stage II, and 3.9×10 -12 in the combined data. Odds ratios were 1.75 (95% CI 1.42-2.16) for female homozygotes ( P =2.0×10 -7 ) and 1.26 (95% CI 1.05-1.51) for female heterozygotes ( P =0.01) compared to female non-carriers. For male hemizygotes ( P =0.07) compared to male non-carriers the odds ratio was 1.18 (95% CI 0.99-1.41). Late onset Alzheimer's disease (LOAD) is a neurodegenerative disease characterized by large numbers of senile plaques and neurofibrillary tangles in the brain. LOAD is the most common cause of dementia in the elderly, affecting approximatel y 10% of those aged 65 years or older 1 . Multiple rare mutations in the genes encoding the amyloid ß protein precursor, presenilin 1, and presenilin 2 cause an early onset familial form of AD with autosomal dominant inheritance, but the only well established susceptibility allele for LOAD is the APOE İ4, To whom correspondence should be address: [email protected]. Author Contributions: M.M.C. spearheaded and participated in all aspects of this study, and drafted the manuscript along with Steven G. Younkin who is the lead investigator of this study. F.Z., S.L.W., L.M. and L.P.W. participated in the SEQUENOM genotyping. F.Z., L.M., L.H.Y. and G.D.B. were responsible for DNA sample preparation and quality control. L.M. also generated all DNA replica plates. Samuel G. Younkin and C.S.Y were instrumental in data management and analysis. N.E.T. participated in critical revisions of the manuscript. V.S.P and J.E.C. provided statistical expertise. N.R.G. and R.C.P. are the neurologists who diagnosed and provided samples for the Mayo Clinic Jacksonville (JS) and Mayo Clinic Rochester (RS) series, respecti vely. D.W.D. is the pathologist who diagnosed and provided brain samples for the autopsy-confirmed (AUT) series. URLs. PLINK, http://pngu.mgh.harvard.edu/purcell/plink/ Accession codes. RefSeq: PCDH11X mRNA isoform a precursor, NM_014522.1; PCDH11X mRNA isoform b precursor, NM_032967.1 ; PCDH11X mRNA isoform c, NM_032968.2; PCDH11X mRNA isoform d precursor, NM_032969.2. Entrez Gene: PCDH11X , 27328; PCDH11Y , 83259. NIH Public Access Author Manuscript Nat Genet . Author manuscript; available in PMC 2010 May 19. Published in final edited form as: Nat Genet . 2009 February ; 41(2): 192–198. doi:10.1038/ng.305. I P A A u t h o r a u s c r i p t I - P A A u t h o r a u s c r i p t I - P A A u t h o r a u s c r i p t

Welcome message from author
This document is posted to help you gain knowledge. Please leave a comment to let me know what you think about it! Share it to your friends and learn new things together.
Transcript

7/31/2019 Genetics and Alzheimers
http://slidepdf.com/reader/full/genetics-and-alzheimers 1/15
Genetic variation in PCDH11X is associated with susceptibility to
late onset Alzheimer's disease
Minerva M. Carrasquillo1, Fanggeng Zou1, V. Shane Pankratz2, Samantha L. Wilcox1, Li.
Ma1, Louise P. Walker 1, Samuel G. Younkin1, Curtis S. Younkin1, Linda H. Younkin1, Gina
D. Bisceglio1, Nilufer Ertekin-Taner 1,3, Julia E. Crook4, Dennis W. Dickson1, Ronald C.
Petersen5, Neill R. Graff-Radford1,3, and Steven G. Younkin1
1Department of Neuroscience, Mayo Clinic College of Medicine, Jacksonville, FL 32224, USA
2Division of Biomedical Statistics and Informatics, Mayo Clinic and Mayo Foundation, Rochester,
MN 55905, USA
3Department of Neurology, Mayo Clinic College of Medicine, Jacksonville, FL 32224, USA
4Biostatistics Unit, Mayo Clinic College of Medicine, Jacksonville, FL 32224, USA5Department of Neurology and the Mayo Alzheimer Disease Research Center, Mayo Clinic College
of Medicine, Rochester, MN 55905, USA
Abstract
By analyzing late onset Alzheimer's disease (LOAD) in a genome wide association study (313,504
SNPs, 3 series, 844 cases/1,255 controls) and evaluating the 25 SNPs with most significant allelic
association in 4 additional series (1,547 cases/1,209 controls), we identified a SNP (rs5984894) on
Xq21.3 in PCDH11X that is strongly associated with LOAD in American Caucasians. Analysis of
rs5984894 by multivariable logistic regression adjusted for sex gave global P values of 5.7×10⁻⁵ in
stage I, 4.8×10⁻⁶ in stage II, and 3.9×10⁻¹² in the combined data. Odds ratios were 1.75 (95% CI
1.42-2.16) for female homozygotes ( P =2.0×10⁻⁷) and 1.26 (95% CI 1.05-1.51) for female
heterozygotes ( P =0.01) compared to female non-carriers. For male hemizygotes ( P =0.07) compared
to male non-carriers the odds ratio was 1.18 (95% CI 0.99-1.41).
Late onset Alzheimer's disease (LOAD) is a neurodegenerative disease characterized by large
numbers of senile plaques and neurofibrillary tangles in the brain. LOAD is the most common
cause of dementia in the elderly, affecting approximately 10% of those aged 65 years or
older 1. Multiple rare mutations in the genes encoding the amyloid ß protein precursor,
presenilin 1, and presenilin 2 cause an early onset familial form of AD with autosomal dominant
inheritance, but the only well established susceptibility allele for LOAD is the APOE İ4,
To whom correspondence should be address: [email protected].
Author Contributions: M.M.C. spearheaded and participated in all aspects of this study, and drafted the manuscript along with StevenG. Younkin who is the lead investigator of this study. F.Z., S.L.W., L.M. and L.P.W. participated in the SEQUENOM genotyping. F.Z.,
L.M., L.H.Y. and G.D.B. were responsible for DNA sample preparation and quality control. L.M. also generated all DNA replica plates.
Samuel G. Younkin and C.S.Y were instrumental in data management and analysis. N.E.T. participated in critical revisions of the
manuscript. V.S.P and J.E.C. provided statistical expertise. N.R.G. and R.C.P. are the neurologists who diagnosed and provided samples
for the Mayo Clinic Jacksonville (JS) and Mayo Clinic Rochester (RS) series, respectively. D.W.D. is the pathologist who diagnosed
and provided brain samples for the autopsy-confirmed (AUT) series.
URLs. PLINK, http://pngu.mgh.harvard.edu/purcell/plink/
Accession codes. RefSeq: PCDH11X mRNA isoform a precursor, NM_014522.1; PCDH11X mRNA isoform b precursor,
NM_032967.1; PCDH11X mRNA isoform c, NM_032968.2; PCDH11X mRNA isoform d precursor, NM_032969.2. Entrez Gene:
PCDH11X , 27328; PCDH11Y , 83259.
NIH Public AccessAuthor Manuscript Nat Genet . Author manuscript; available in PMC 2010 May 19.
Published in final edited form as:
Nat Genet . 2009 February ; 41(2): 192–198. doi:10.1038/ng.305.
NI H-P A A u
t h or Manus c r i pt
NI H-P A A ut h or Manus c r i pt
NI H-P A A ut h or M
anus c r i pt
7/31/2019 Genetics and Alzheimers
http://slidepdf.com/reader/full/genetics-and-alzheimers 2/15
allele2-4. Twin studies indicate that susceptibility alleles contribute to as much as 80% of
LOAD cases5 but definitive identification of other genes with LOAD susceptibility alleles has
proven difficult.
To identify novel LOAD susceptibility genes, we performed a two-stage genome-wide
association study (GWAS) using Illumina HumanHap300 BeadChips. In stage I, after stringent
quality control, we analyzed 313,504 SNPs in 844 cases and 1,255 controls (Supplementary
Methods online, Supplementary Tables 1 and 2). Stage I subjects had ages at diagnosis/entryof 60-80 years and were drawn from three series. Two series were assembled from cases and
controls ascertained clinically at the Mayo Clinic in Jacksonville, FL (JS: 353 AD, 331 control)
and Rochester, MN (RS: 245 AD, 701 control). A third, autopsy-confirmed series (AUT: 246
AD, 223 control) was assembled from the Mayo brain bank (see Supplementary Methods online
for details). In stage I, SNPs were tested for allelic association using the Ȥ 2 test implemented
in PLINK 6 (Supplementary Table 3 online). After adjustment for population stratification using
EIGENSTRAT7 and Bonferroni correction for the 313,504 SNPs tested, only six APOE -linked
SNPs showed genome-wide significance in stage I (Supplementary Table 3 and 4, and
Supplementary Methods online).
In stage II, we employed SEQUENOM iPLEX technology to genotype the 25 SNPs with the
most significant association in stage I (Supplementary Table 3 online) in an additional 845
cases and 1,000 controls drawn from the same three series but with ages at diagnosis/entry of over 80 years (JS: 237 AD, 260 control; RS: 276 AD, 624 control; AUT: 332 AD, 116 control)
and from a National Cell Repository for AD series of 702 cases (1/family) and 209 controls
with ages at diagnosis/entry of over 60 years. The top 25 SNPs tested in stage II included 10
SNPs in the APOE region of chromosome 19 and 15 SNPs on other chromosomes. The allelic
association results for these 25 SNPs in stages I, II, and I + II are shown in Supplementary
Table 3 online. All 10 SNPs in the APOE region showed significant association in stage II with
P values ranging from 9.5×10-79 to 0.05. One of the two SNPs on the X chromosome,
rs5984894, also replicated well in the stage II follow-up series with a P value of 0.0006 that
retained significance ( P =0.015) even after conservative Bonferroni correction for 25 SNPs
tested in stage II. None of the other SNPs replicated in stage II. The second SNP on the X
chromosome, rs1279795, had a P value of 0.43 and the 13 additional SNPs had P values of
0.28-0.98 (Supplementary Table 3 online).
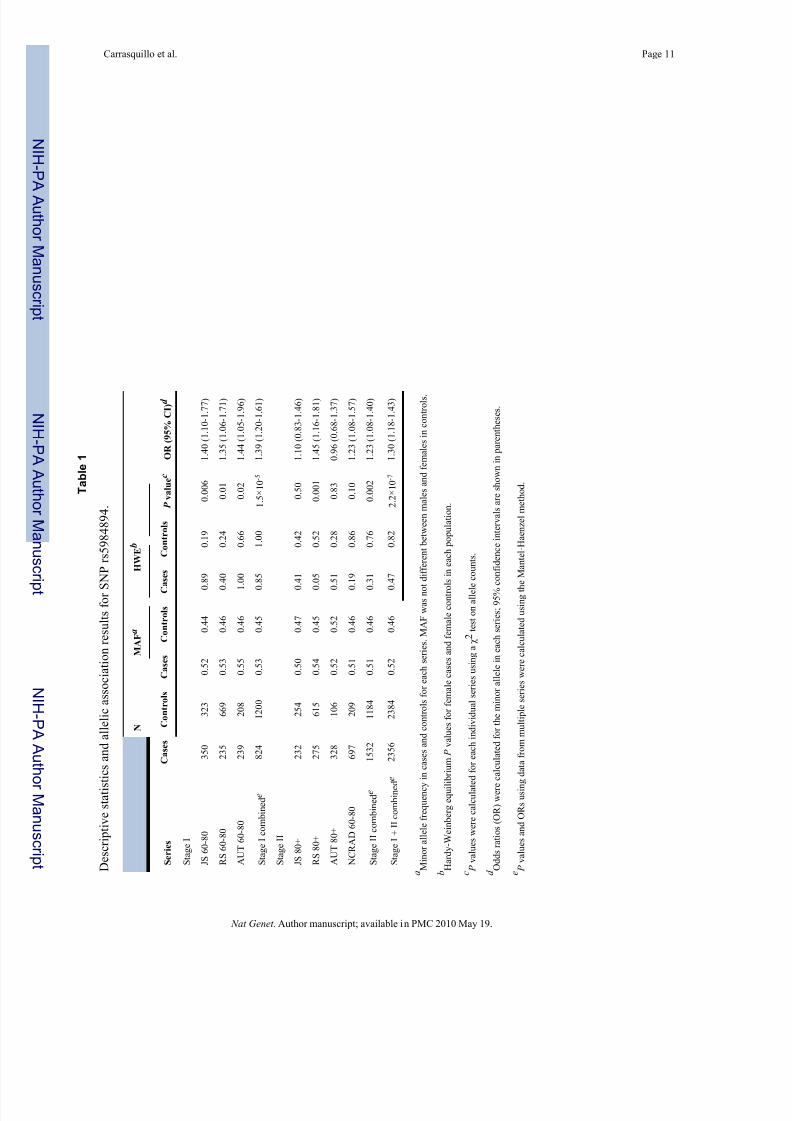
In stages I + II, rs5984894 was genotyped successfully in 2,356 of the 2,391 cases (99%) and
2,384 of the 2,464 controls (97%). Because our stage I and stage II subjects came from multiple
American Caucasian series, PLINK was employed to test rs5984894 for allelic association in
the combined stage I, II, and I + II datasets using the Mantel-Haenszel method (Table 1) in
addition to the Ȥ 2 test on combined allele counts (Supplementary Table 3 online). In the
combined stage I dataset, the P values were 1.2×10⁻⁵ and 1.5×10⁻⁵ for the allelic association
and the Mantel-Haenszel method respectively. Both methods showed highly significant
replication in the stage II dataset where the unadjusted P values were 0.0006 and 0.002
respectively and the Bonferroni-adjusted P values were 0.015 and 0.05. The overall unadjusted
P value for allelic association in stage I + II was 3.8×10⁻⁸ with an OR of 1.29 (95% CI
1.18-1.41), and 2.2×10⁻⁷ with an OR of 1.30 (95% CI 1.18-1.43) using the Mantel-Haenszel
method (Table 1). The Breslow Day P values calculated by PLINK to test for series to series
heterogeneity were 0.95, 0.22, and 0.43 in stages I, II, and I + II, indicating a lack of statisticalevidence for series to series heterogeneity among the seven series tested.
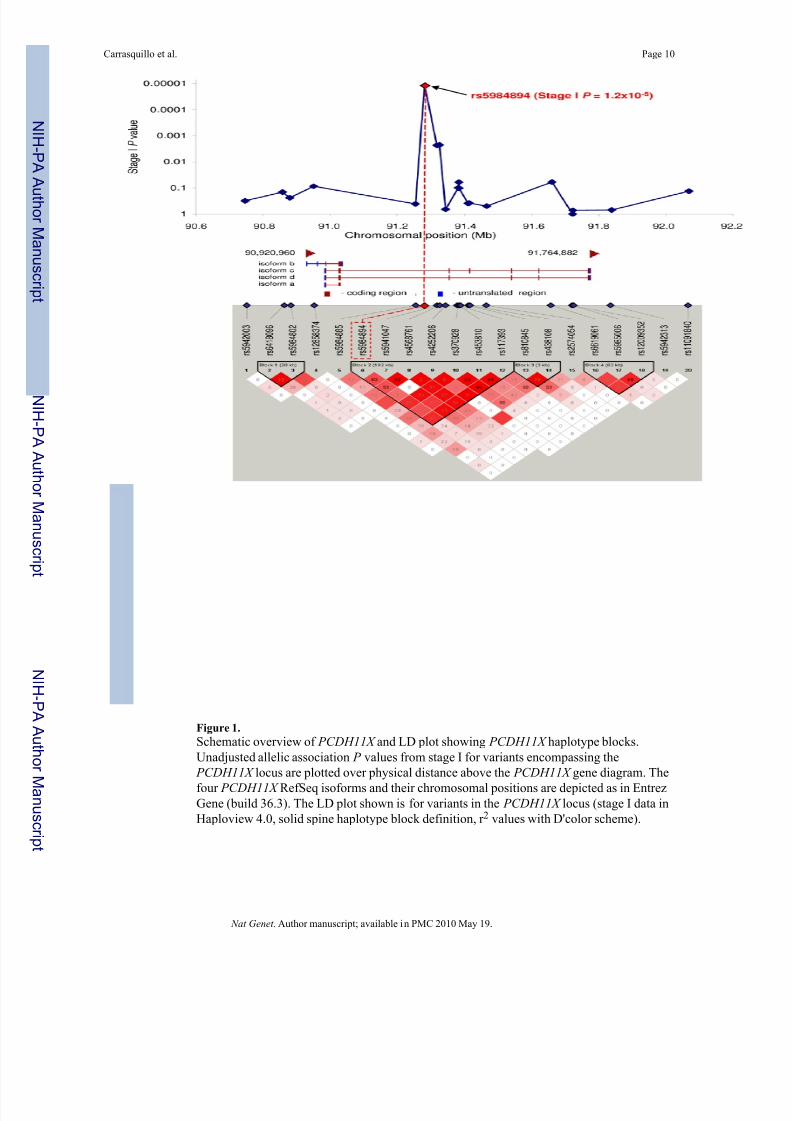
rs5984894 is within the gene ( PCDH11X ) encoding protocadherin 11, X-linked (Fig. 1).
PCDH11X is located in the hominid-specific non-pseudoautosomal homologous region
Xq21.3/Yp11.28. It has been proposed that known coding and expression level differences
between PCDH11X and PCDH11Y may have functional consequences that could lead to
Carrasquillo et al. Page 2
Nat Genet . Author manuscript; available in PMC 2010 May 19.
NI H-P A A
ut h or Manus c r i pt
NI H-P A A ut h or Manus c r i pt
NI H-P A A ut h or
Manus c r i pt

7/31/2019 Genetics and Alzheimers
http://slidepdf.com/reader/full/genetics-and-alzheimers 3/15
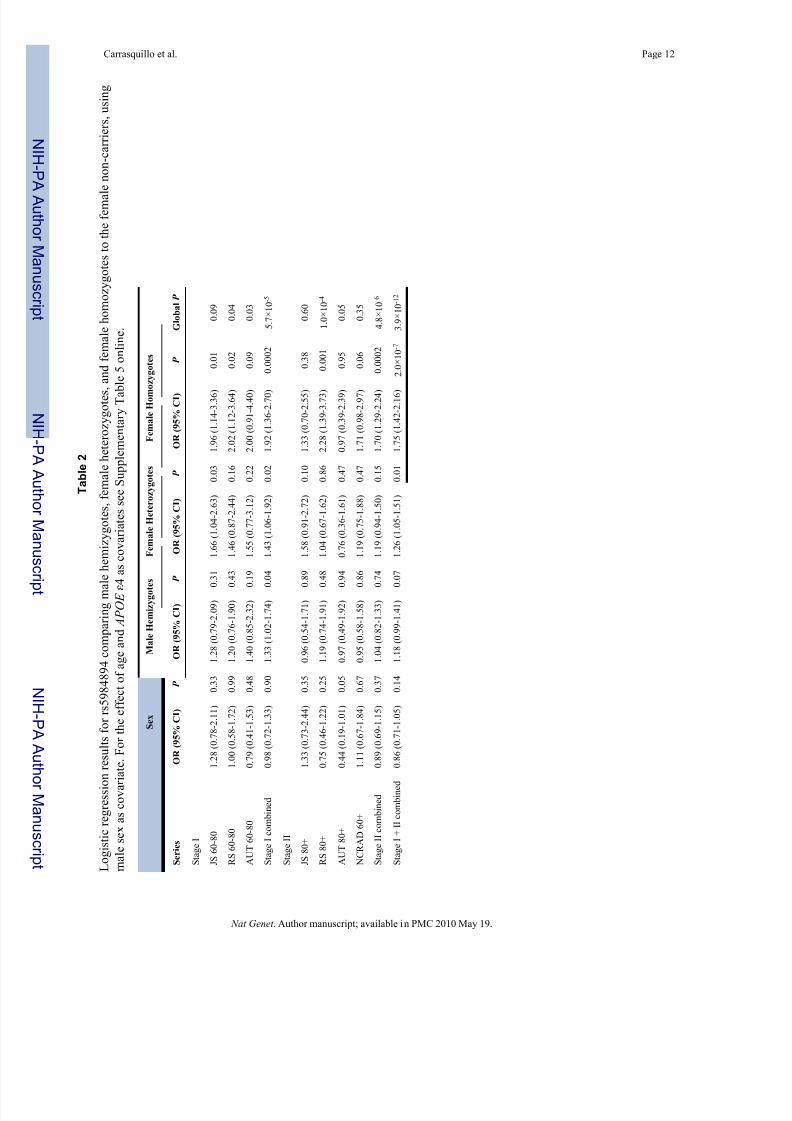
sexually dimorphic traits9. To explore this possibility, we analyzed rs5984894 by multivariable
logistic regression with sex as a covariate (Table 2). Using this approach, which specifically
models each carrier group, the global P value in the combined series improved substantially
to 3.9×10⁻¹² as compared to 3.8×10⁻⁸ for allelic association (Supplementary Table 3) and
2.2×10⁻⁷ using the Mantel-Haenszel method (Table 1). In the combined series, odds ratios were
1.75 (95% CI 1.42-2.16) for female homozygotes ( P =2.0×10⁻⁷) and 1.26 (95% CI 1.05-1.51)
for female heterozygotes ( P =0.01) compared to female non-carriers. For male hemizygotes
( P =0.07) compared to male non-carriers, the odds ratio was 1.18 (95% CI 0.99-1.41) (Table2). Male sex, which had an OR of 0.86 (95% CI 0.71-1.05) was not a significant covariate
( P =0.14) in the combined data. Female homozygotes in the combined series were at
significantly increased risk not only when compared to female non-carriers ( P =2.0×10⁻⁷) but
also when compared to female heterozygotes ( P =0.0005) or male hemizygotes ( P =1.4×10⁻⁷)
(Supplementary Table 5 online, model 3). The OR for female homozygotes in stage I was 1.92
(95% CI 1.36-2.70) with a P value of 0.0002. This association replicated well in stage II where
the OR was 1.70 (95% CI 1.29-2.24) with a P value of 0.0002 (Table 2). The global P value
of 5.7×10⁻⁵ in stage I also replicated well, improving to 4.8×10⁻⁶ on follow-up.
Replication for female homozygotes and heterozygotes was highly consistent when subjects
with ages at diagnosis/entry of 60-80 years were compared to subjects with ages at diagnosis/
entry of over 80 years; the ORs were 1.74 (95% CI 1.31-2.32) and 1.25 (95% CI 0.98-1.60)
vs. 1.76 (95% CI 1.29-2.40) and 1.26 (95% CI 0.97-1.65) respectively (Supplementary Table5 online, Stage I + II, model 1). Although male hemizygotes showed significant risk ( P =0.04)
in stage I with an OR of 1.33 (95% CI 1.02-1.74), in stage II ( P =0.74) or in all subjects with
ages at diagnosis/entry of over 80 years ( P =0.66) male hemizygotes showed no statistically
significant evidence for increased risk with ORs of 1.04 (95% CI 0.82-1.33) and 1.07 (95% CI
0.80-1.42) respectively (Table 2 and Supplementary Table 5 online, model 1; see section on
Power considerations in Supplementary Methods for additional discussion).
Logistic regression models that included sex, age at diagnosis/entry (years over 60) and the
presence of an APOE İ4 allele as covariates were also evaluated (Supplementary Methods and
Supplementary Table 5 online, model 4). In the combined data, age ( P =4.9×10⁻⁷) and APOE
İ4 ( P <2.2×10⁻¹⁶) were significant covariates with ORs of 1.02 (95% CI 1.01-1.03) and 6.21
(95% CI 5.45-7.08) respectively. When these two covariates were included (Supplementary
Table 5 online, model 4), the significant associations for female heterozygotes andhomozygotes persisted with ORs of 1.23 (95% CI 1.01-1.51) and 1.68 (95% CI 1.33-2.12)
respectively. We also investigated series-to-series heterogeneity by examining series ×
genotype interactions in our logistic regression analyses. Consistent with the results of the
Breslow Day tests described above, these analyses provided no significant evidence for
differences among series in the associations observed (data not shown).
Using stage I GWAS data, population stratification was evaluated using the principal
components approach implemented in EIGENSTRAT. Adjustment for population substructure
was performed by including the top ten axes of variation generated by EIGENSTRAT as
additional covariates in logistic regression analyses using an allelic dosage model and in
multivariable logistic regression analyses of rs5984894. These adjustments to the allelic dosage
(Supplementary Table 4 online) and multivariable logistic regression (Supplementary Table 5
online, model 5 vs. model 1) analyses had essentially no effect on the results obtained for thestage I GWAS data. Thus, population substructure did not inflate the significance of stage I
GWAS results, and given the similarity in the populations included in stages I and II it is
unlikely that it inflated the highly significant associations observed in stage II and in the
combined data.
Carrasquillo et al. Page 3
Nat Genet . Author manuscript; available in PMC 2010 May 19.
NI H-P A A
ut h or Manus c r i pt
NI H-P A A ut h or Manus c r i pt
NI H-P A A ut h or
Manus c r i pt

7/31/2019 Genetics and Alzheimers
http://slidepdf.com/reader/full/genetics-and-alzheimers 4/15
rs5984894 maps to a 102kb linkage disequilibrium (LD) block on chromosome Xq21.3 that
lies entirely within the gene ( PCDH11X ) encoding protocadherin 11, X-linked. This LD block
encompasses part of intron 2, exon 3 and part of intron 3 of PCDH11X isoforms c and d (Fig.
1). In the stage I GWAS, 2 of the 6 additional SNPs within this 102kb block (rs5941047 and
rs4568761) showed strong association with LOAD. Both SNPs had P values for allelic
association of 0.0023 and both are in strong LD with rs5984894 (Fig. 1). The 7 SNPs on the
102kb block form 7 haplotypes with frequencies above 1% that account for 98% of all
haplotypes. In the stage I GWAS, a Ȥ 2
test gave a global P value for haplotypic association of 0.0007. The most common haplotype (H1), which had major alleles at all 7 sites, showed highly
significant association ( P =3.3×10⁻⁶) with a protective OR of 0.72 (95% CI 0.62-0.83). The
minor allele of rs5984894 is included in haplotypes H2, H3, H4, and H6. Of these, H3 ( P =0.04)
and H4 ( P =0.01) showed significant association with ORs of 1.21 (95% CI 1.01-1.46) and 1.36
(95% CI 1.07-1.74) respectively (see legend of Table 3 for additional discussion).
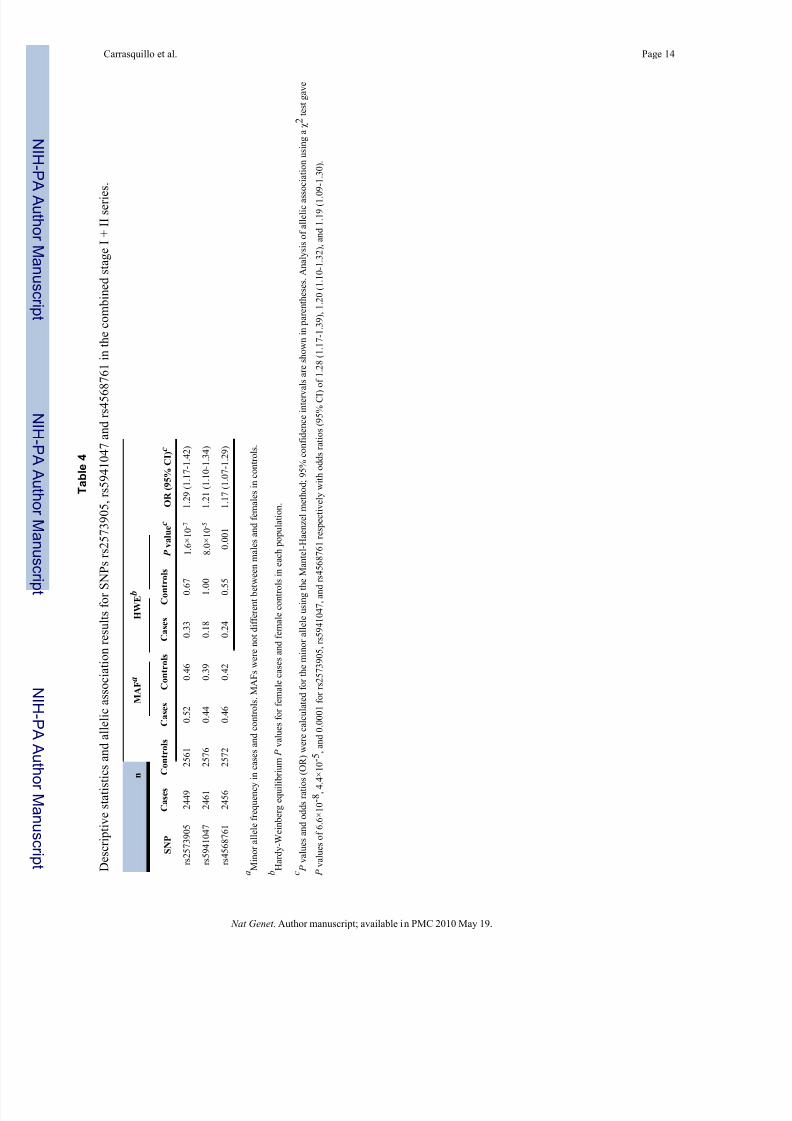
To extend our analysis of PCDH11X , three PCDH11X SNPs (rs5941047 and rs4568761 and
rs2573905) that reside on the same haplotype block as rs5984894 were genotyped in all stage
I + II subjects (2,524 AD, 2,698 control) from the JS (635 AD, 698 control), RS (577 AD, 1418
control), AUT (610 AD, 373 control), and NCRAD (702 AD, 209 control) series. rs5941047
and rs4568761 were followed-up in the stage II subjects because both had nominally significant
P values of 0.0023 for allelic association in stage I. rs2573905 is located 8,483 bp 3ƍ of
rs5984894. Both rs5984894 and rs2573905 reside deep in intron 2 of PCDH11X isoforms cand d, over 54 kb and 62 kb upstream of exon 3 respectively. rs2573905 was genotyped in the
combined series because it is in a 100 bp region that is 70% conserved between the human and
mouse sequence and therefore likely to be functionally relevant. All three SNPs were analyzed
for association with LOAD using the Mantel-Haenszel method (Table 4, see legend for results
of Ȥ 2 tests). In the combined dataset, highly significant associations were observed for all three
SNPs (Table 4) with P values for rs2573905, rs5941047, and rs4568761 of 1.6×10⁻⁷,
8.0×10⁻⁵ and 0.001 respectively. Breslow Day P values for rs2573905, rs5941047, and
rs4568761 were 0.55, 0.35, and 0.23 respectively indicating a lack of statistical evidence for
series to series heterogeneity among the seven series tested.
rs2573905 is in strong linkage disequilibrium with rs5984894 (r 2=0.98, D'=0.99) and the minor
alleles of these two SNPs occur on the same haplotypes (H2, H3, H4, and H6 in Table 3). Thus
functional changes caused by rs2573905 may account for the strong association of rs5984894with LOAD. Table 5 shows the results obtained when rs2573905 was analyzed by multivariable
regression with sex as a covariate. Because of the strong LD between rs2573905 and
rs5984894, this analysis of rs2573905 (Table 5) gave results for female heterozygotes, female
homozygotes and male hemizygotes that were nearly the same as those for rs5984894 (Table
4) although the global P value for rs2573905 was more significant in the combined series
(5.4×10⁻¹³ vs. 3.9×10⁻¹²) where rs2573905 was genotyped successfully in more subjects (5,010
vs. 4,740).
Lopes et al . have proposed that known coding and expression level differences between
PCDH11X and PCDH11Y may have functional consequences that could lead to sexually
dimorphic traits9. Durand. et al . tested this idea with respect to common psychiatric disorders
such as autism, ADHD, OCD and schizophrenia in which differences in risk/age of onset
between females and males have been observed10. Although they found no statisticallysignificant association with any of these traits, our data provide substantial evidence for an
association between genetic variation in the PCDH11X gene and increased risk of LOAD in
females.
PCDH11X/Y belong to the protocadherin gene subfamily of the cadherin superfamily of cell
surface receptor molecules. The cadherins mediate cell-cell adhesion and play a role in cell
Carrasquillo et al. Page 4
Nat Genet . Author manuscript; available in PMC 2010 May 19.
NI H-P A A
ut h or Manus c r i pt
NI H-P A A ut h or Manus c r i pt
NI H-P A A ut h or
Manus c r i pt

7/31/2019 Genetics and Alzheimers
http://slidepdf.com/reader/full/genetics-and-alzheimers 5/15
signaling that is critical in the development of the central nervous system11. The most recent
studies of the PCDH11X/Y gene structure and expression report that these genes consist of at
least 17 exons spanning over 700 kb. Alternative splicing produces multiple isoforms that are
mainly expressed in the brain12. Expression is particularly strong in the cortex and
hippocampus and weaker in the cerebellum10. Based on their splicing patterns and functional
domains, it has been proposed that PCDH11X/Y resemble cadherin related neural
receptors12 which are known to localize at the synaptic junction13. Interestingly, some
protocadherins are known to undergo presenilin-dependent processing14
.
In summary, the results of our two-stage GWAS provide the first evidence that genetic variation
in PCDH11X is strongly associated with LOAD susceptibility in a combined American
Caucasian sample of 2,391 cases and 2,464 controls. The SNP identified, rs5984894, resides
in a haplotype block that falls entirely within PCDH11X , and it is in strong linkage
disequilibrium with rs2573905, which is more likely to alter PCDH11X function since it resides
in a conserved region. To date, however, no functional variants have been identified in this
gene. Further study to determine how risk for LOAD is mediated by specific genetic variation
in PCDH11X should improve understanding of the molecular basis of LOAD and open new
therapeutic possibilities for this devastating disease.
Methods
Subjects
All case-control series consisted of Caucasian subjects from the United States ascertained at
the Mayo Clinic or through the National Cell Repository for Alzheimer's Disease (NCRAD).
This study was approved by the appropriate institutional review board and appropriate
informed consent was obtained from all participants. A complete description of the study
subjects can be found in the section on Study populations and ascertainment in the
Supplementary Methods.
Our stage I GWAS was performed on JS, RS, and AUT subjects with an age at diagnosis/entry
of 60-80 years. We genotyped 970 AD cases and 1,495 controls (JS: 381 AD, 350 control; RS:
291 AD, 787 control, AUT 298 AD, 358 CON). After stringent quality control (see Stage I
Quality Control section below), we analyzed 844 AD cases and 1,255 controls (JS: 353 AD,
331 control; RS: 245 AD, 701 control, AUT 246 AD and 223 control).
Our stage II follow-up analysis of the 25 SNPs with the most significant allelic association in
stage I was performed on JS, RS, and AUT subjects with an age at diagnosis/entry of over 80
years, and on additional samples obtained through the National Cell Repository for Alzheimer's
Disease (NCRAD) with an age at diagnosis/entry of over 60 years. In stage II, we genotyped
and analyzed 1,547 AD cases and 1,209 controls (JS: 237 AD, 260 control, RS: 276 AD, 624
control, AUT: 332 AD, 116 control, NCRAD: 702 AD, 209 control). One AD case from each
of the 702 late-onset NCRAD families was analyzed. NCRAD AD cases were selected based
on strength of diagnosis (autopsy-confirmed: 32% > probable: 45% > possible: 8% > family
report: 15%); the case with the earliest age at diagnosis was taken when several cases had
equally strong diagnoses. The 209 NCRAD controls that we employed are unrelated Caucasian
subjects from the United States with a Clinical Dementia Rating of 0, specifically collected for
inclusion in case-control series.
Age and gender data for the cases and controls in each series included in the stage I and stage
II analyses are shown in Supplementary Table 1.
Carrasquillo et al. Page 5
Nat Genet . Author manuscript; available in PMC 2010 May 19.
NI H-P A A
ut h or Manus c r i pt
NI H-P A A ut h or Manus c r i pt
NI H-P A A ut h or
Manus c r i pt

7/31/2019 Genetics and Alzheimers
http://slidepdf.com/reader/full/genetics-and-alzheimers 6/15
Sample collection, DNA isolation, and DNA amplification
Blood samples were collected in 10 ml EDTA tubes from subjects in the Mayo JS and RS
series, and genomic DNA was isolated from whole blood using an AutoGenFlex STAR
instrument (AutoGen, Inc, Holliston, MA). Genomic DNA from the cerebellum of subjects in
the AUT series was obtained by Wizard® Genomic DNA Purification Kit (Promega Corp.,
Madison, WI). DNA from the RS and AUT series was scarce, so samples from these two series
were subjected to whole genome amplification (WGA) using the Illustra GenomiPhi V2 DNA
Amplification Kit (GE Healthcare Bio-Sciences Corp., Piscataway, NJ). To attenuate randomamplification errors, we performed four 5 ul reactions for each sample, rather than a single 20
ul reaction. Each 5 ul reaction contained 5-15 ng of genomic DNA as template, according to
the quality of the genomic DNA. These four reactions were then combined. To evaluate the
quality of each WGA DNA sample, a TaqMan® SNP Genotyping Assay (Applied Biosystems,
Foster City, CA) was used to obtain genotypes for SNP rs2830072 in both the original genomic
(non-WGA) DNA and in the WGA DNA. Only WGA DNA samples that fell within well
defined genotype clusters and that had genotype calls for rs2830072 that were in agreement
with their non-WGA DNA genotypes were included in the series. In our hands, pooling four
5 ul reactions gave better genotype clusters and fewer miscalls than a single 20 ul reaction.
Genotyping Methods
The genotype data from stage I samples (n=2,465) was generated using HumanHap300-DuoGenotyping BeadChips processed with an Illumina BeadLab station (Illumina, SanDiego, CA)
at the Mayo Clinic Genotyping Shared Resource (Rochester, Minnesota) according to the
manufacturer's protocols. The HumanHap300-Duo chips allow simultaneous genotyping of
two independent samples for 318,237 SNPs across the genome. Genotype calls were made
using the auto-calling algorithm in Illumina's BeadStudio 2.0 software.
The genotype data from stage II samples (n=2,756) was generated using SEQUENOM's
MassArray iPLEX technology (SEQUENOM Inc, San Diego, CA) following the
manufacturers instructions. The follow up genotypes obtained for three SNPs (rs5941047 and
rs4568761 and rs2573905) in the combined stage I + II series (n=5,222) were also generated
using SEQUENOM's MassArray iPLEX technology. Genotype calls were made using the
default post-processing calling parameters in SEQUENOM's Typer 4.0 software, followed by
visual inspection to remove genotype calls that were obviously erroneous, based on the presence or absence of allele peaks in an individual sample's spectrogram.
Stage I Quality Control
In our stage I GWAS, we genotyped 318,237 SNPs in samples from 2,465 subjects. Genotype
clusters were determined using Illumina's BeadStudio 2.0 software after first eliminating 240
samples (9.7%) with call rates of <90% on the first pass. This initial quality control measure
eliminated a higher percentage of the WGA DNA samples. Of the 1,734 RS/AUT samples, all
of which were WGA DNA, 213 (12.3%) had call rates of < 90%. Of the 731 JS samples, all
of which were non-WGA DNA, 27 (3.7%) had call rates <90%.
We also eliminated 87 AUT samples (3.5%) with Braak stages of 3.0 or 3.5, so that all AUT
AD samples had a Braak stage of 4.0 or greater, and all AUT control samples had a Braak stage
of 2.5 or lower. Using filters available in PLINK 6, we eliminated all SNPs with call rates <90%,minor allele frequencies <0.01, and/or Hardy-Weinberg P values <0.001. Using the sex check
option provided by PLINK, we identified and removed 21 additional samples (0.9%) with a
mismatch between the recorded sex and the sex deduced by evaluating the heterozygosity of
SNPs on the X chromosome. We also checked for cryptic relatedness by using the --genome
option in PLINK to evaluate paired identity by descent in all samples genotyped in stage I.
This check revealed 16 pairs with PI_HAT over 99% thereby identifying 16 subjects for which
Carrasquillo et al. Page 6
Nat Genet . Author manuscript; available in PMC 2010 May 19.
NI H-P A A
ut h or Manus c r i pt
NI H-P A A ut h or Manus c r i pt
NI H-P A A ut h or
Manus c r i pt

7/31/2019 Genetics and Alzheimers
http://slidepdf.com/reader/full/genetics-and-alzheimers 7/15
two samples had been genotyped. Of these 32 samples, 14 were retained and 18 (0.8%) were
eliminated. We eliminated one sample from 14 subjects where all samples had identical subject
information and where we were able to confirm independently that the paired samples came
from the same subject. We eliminated four samples (two pairs) where key subject information
(e.g. gender, age) associated with the two samples was in conflict. Two DNA samples from
different blood draws were genotyped in one RS subject where only one of the two samples
was retained. The other 13 subjects that were retained had one DNA sample derived from the
brain at autopsy (AUT), which was retained, and one derived from blood taken during life (JSor RS), which was eliminated. The duplicates in these 13 subjects went undetected because the
identifiers for samples in the AUT samples, which mostly came from the brains of subjects
who were not seen at Mayo, were not linked to the identifiers in the JS or RS series.
These quality control measures left 2,099 subjects (85.2%) in whom 313,504 SNPs (98.5%)
were analyzed. Since rs5984894 was not successfully genotyped in all samples that met quality
control criteria, this SNP was analyzed in a total of 2,024 subjects (96.4%) in stage I.
Of the 2,099 samples that met our quality control criteria in stage I, 1,415 were RS or AUT
(WGA DNA) samples of good quality. The average call rate of 99.2% in the WGA samples
was essentially identical to the average call rate of 99.3% in the 684 DNA samples from the
JS series (non-WGA DNA). Thus the call rates using BeadChips were comparable for WGA
and non-WGA DNA once WGA samples of poor quality were identified and eliminated.
The genotype clusters for the 25 SNPs with the most significant P values in stage I
(Supplementary Table 3) were visually inspected as an additional quality control check. This
check showed that the three SNPs noted with an asterisk in Supplementary Table 3 (rs3858095,
rs2318144, and rs3007421) had unsatisfactory clusters that caused inaccurate genotyping of
many heterozygotes and minor allele homozygotes. This is evidenced by the much higher minor
allele frequencies observed in controls of the follow-up series where all three SNPs were
genotyped well using SEQUENOM iPLEX technology. Two of these SNPs (rs3858095 and
rs3007421) were eliminated by increasing the stage I call rate cut-off for samples and SNPs
from 90% to 95%, but rs2318144 was not eliminated even when the call rate cut-off for samples
and SNPs was increased to 98%. rs2318144 had a Hardy-Weinberg P value of 0.05 and
therefore also failed to be eliminated by our cut-off P value of 0.001. These results underscore
the importance of checking SNPs with highly significant association by visually inspectingtheir genotype clusters and by genotyping follow-up series on a different platform. The
genotype clusters for rs5984894, which had a 96.4% call rate in the samples that met quality
control criteria in stage I, are shown in Supplementary Figure 1a.
A subset of the stage I samples (total n=347: JS n=84, RS n=183, AUT n=80), for which the
HumanHap300 call rate was >0.90, were also genotyped using the iPLEX method employed
with the stage II samples, in order to test for genotype concordance between the two genotyping
platforms that were utilized. The genotype call concordance rate between iPLEX and BeadChip
for the 22 SNPs followed-up in stage II that had satisfactory BeadChip genotype clusters was
99.8%. The genotype call discordance rates for the JS samples (non-WGA) and the RS+AUT
samples (WGA) were essentially identical (JS=0.0022 vs. RS+AUT=0.0009).
The effect of eliminating samples and SNPs using call rate cut-offs of 95% as compared to90% (Supplementary Table 2) is discussed in Supplementary Methods online.
Stage II Quality Control
To be sure that each subject was sampled one time only, stage II samples were checked for
cryptic relatedness using 138 SNPs genotyped in all of those samples. Among the samples
chosen initially for analysis in stage II (1,594 ADs and 1,221 controls), there were 52 subjects
Carrasquillo et al. Page 7
Nat Genet . Author manuscript; available in PMC 2010 May 19.
NI H-P A A
ut h or Manus c r i pt
NI H-P A A ut h or Manus c r i pt
NI H-P A A ut h or
Manus c r i pt

7/31/2019 Genetics and Alzheimers
http://slidepdf.com/reader/full/genetics-and-alzheimers 8/15
in whom multiple samples had been genotyped (51 had two samples, one had three samples).
Of these 105 samples, 46 were retained and 59 were eliminated. We retained one sample from
46 subjects where all samples had identical subject information and where we were able to
confirm independently that all samples came from the same subject. For 6 subjects with
duplicate samples, key subject information (e.g. gender, age) associated with the two samples
was in conflict, so both samples were eliminated. Thus we assured that a single sample was
analyzed in the stage II subjects on which we report (1,547 ADs and 1,209 controls).
All of the iPLEX genotype cluster plots for the variants genotyped in the follow-up series were
visually inspected to be sure that each genotype that was called fell within a well defined cluster.
The overall call rate for the 25 SNPs was 98.3%. Nineteen SNPs including rs5984894, the SNP
in PCDH11X that showed highly significant association, had call rates of 99%. The remaining
SNPs had call rates of 93-98%. Call rates were similar in WGA (98.2%) and non-WGA (98.9%)
DNA samples. The genotype clusters for rs5984894 in stage II are shown in Supplementary
Figure 1b.
Statistical Analyses
Genotype reports produced by Illumina BeadStudio 2.0 software (stage I data) or SEQUENOM
Typer 4.0 software (stage II data) were used to generate lgen, map, and fam files that were
imported into PLINK. The SNP genotypes in stage I, stage II, and the combined datasets were
analyzed for allelic association with AD using the allelic association Ȥ 2 test implemented inPLINK. With Į=0.05 and Bonferroni correction for the 313,504 SNPs tested in stage I, a P
value of 1.6×10⁻⁷ is required for “genome-wide” significance. Using this criterion, the only
SNPs to achieve genome-wide significance in stage I were six APOE -linked SNPs. In the
combined stage I + II data, rs5984894 and one additional APOE -linked SNP also achieved this
level of significance (Supplementary Table 3).
Since rs5984894 showed highly significant association with LOAD in stages I, II, and I + II,
and this novel LOAD SNP was analyzed in seven distinct American Caucasian case-control
series, we analyzed it in PLINK using not only the Ȥ 2 test on combined allele counts but also
the Mantel-Haenszel method in which the Breslow Day option was employed to test for series
to series heterogeneity (Table 1). We also analyzed rs5984894 by multivariable logistic
regression (Table 2) as described in the Supplementary Methods.
The solid spine haplotype block definition in Haploview 4.015 was employed to generate a
linkage disequilibrium plot of the genomic region encompassing PCDH11X and to evaluate
the 7 haplotypes formed by the SNPs included in the haplotype block containing rs5984894.
Using haplotype counts provided by Haploview 4.0, ORs were calculated for each of the 7
haplotypes, and P values were obtained with a Ȥ 2 test. A Ȥ 2 test was also employed to calculate
a global P value for haplotypic association.
Supplementary Material
Refer to Web version on PubMed Central for supplementary material.
AcknowledgmentsSupport for this research was provided by the NIH grants: NIA R01 AG18023 (N.R.G-R, S.G.Y); Mayo Alzheimer's
Disease Research Center: P50 AG16574 (R.C.P, D.W.D, N.R.G-R, S.G.Y); Mayo Alzheimer's Disease Patient
Registry: U01 AG06576 (R.C.P); NIA AG25711, AG17216, AG03949 (D.W.D). Samples from the National Cell
Repository for Alzheimer's Disease (NCRAD), which receives government support under a cooperative agreement
grant (U24 AG21886) awarded by the National Institute on Aging (NIA), were used in this study. We thank
contributors, including the Alzheimer's Disease Centers who collected samples used in this study, as well as patients
and their families, whose help and participation made this work possible. This project was also generously supported
Carrasquillo et al. Page 8
Nat Genet . Author manuscript; available in PMC 2010 May 19.
NI H-P A A
ut h or Manus c r i pt
NI H-P A A ut h or Manus c r i pt
NI H-P A A ut h or
Manus c r i pt

7/31/2019 Genetics and Alzheimers
http://slidepdf.com/reader/full/genetics-and-alzheimers 9/15
by the Robert and Clarice Smith Postdoctoral Fellowship (M.M.C.); Robert and Clarice Smith and Abigail Van Buren
Alzheimer's Disease Research Program (R.C.P., D.W.D., N.R.G-R; S.G.Y) and by the Palumbo Professorship in
Alzheimer's Disease Research (S.G.Y.).
References
1. Evans DA, et al. Prevalence of Alzheimer's disease in a community population of older persons. Higher
than previously reported. Jama 1989;262:2551–6. [PubMed: 2810583]
2. Corder EH, et al. Gene dose of apolipoprotein E type 4 allele and the risk of Alzheimer's disease inlate onset families. Science 1993;261:921–3. [PubMed: 8346443]
3. Corder EH, et al. Protective effect of apolipoprotein E type 2 allele for late onset Alzheimer disease.
Nat Genet 1994;7:180–4. [PubMed: 7920638]
4. Farrer LA, et al. Effects of age, sex, and ethnicity on the association between apolipoprotein E genotype
and Alzheimer disease. A meta-analysis. APOE and Alzheimer Disease Meta Analysis Consortium.
Jama 1997;278:1349–56. [PubMed: 9343467]
5. Gatz M, et al. Role of genes and environments for explaining Alzheimer disease. Arch Gen Psychiatry
2006;63:168–74. [PubMed: 16461860]
6. Purcell S, et al. PLINK: a tool set for whole-genome association and population-based linkage analyses.
Am J Hum Genet 2007;81:559–75. [PubMed: 17701901]
7. Price AL, et al. Principal components analysis corrects for stratification in genome-wide association
studies. Nat Genet 2006;38:904–9. [PubMed: 16862161]
8. Williams NA, Close JP, Giouzeli M, Crow TJ. Accelerated evolution of Protocadherin11X/Y: acandidate gene-pair for cerebral asymmetry and language. Am J Med Genet B Neuropsychiatr Genet
2006;141:623–33. [PubMed: 16874762]
9. Lopes AM, et al. Inactivation status of PCDH11X : sexual dimorphisms in gene expression levels in
brain. Hum Genet 2006;119:267–75. [PubMed: 16425037]
10. Durand CM, et al. Expression and genetic variability of PCDH11Y , a gene specific to Homo sapiens
and candidate for susceptibility to psychiatric disorders. Am J Med Genet B Neuropsychiatr Genet
2006;141:67–70. [PubMed: 16331680]
11. Blanco P, Sargent CA, Boucher CA, Mitchell M, Affara NA. Conservation of PCDHX in mammals;
expression of human X/Y genes predominantly in brain. Mamm Genome 2000;11:906–14. [PubMed:
11003707]
12. Blanco-Arias P, Sargent CA, Affara NA. Protocadherin X ( PCDHX ) and Y ( PCDHY ) genes; multiple
mRNA isoforms encoding variant signal peptides and cytoplasmic domains. Mamm Genome
2004;15:41–52. [PubMed: 14727141]13. Senzaki K, Ogawa M, Yagi T. Proteins of the CNR family are multiple receptors for Reelin. Cell
1999;99:635–47. [PubMed: 10612399]
14. Haas IG, Frank M, Veron N, Kemler R. Presenilin-dependent processing and nuclear function of
gamma-protocadherins. J Biol Chem 2005;280:9313–9. [PubMed: 15611067]
15. Barrett JC, Fry B, Maller J, Daly MJ. Haploview: analysis and visualization of LD and haplotype
maps. Bioinformatics 2005;21:263–5. [PubMed: 15297300]
Carrasquillo et al. Page 9
Nat Genet . Author manuscript; available in PMC 2010 May 19.
NI H-P A A
ut h or Manus c r i pt
NI H-P A A ut h or Manus c r i pt
NI H-P A A ut h or
Manus c r i pt
7/31/2019 Genetics and Alzheimers
http://slidepdf.com/reader/full/genetics-and-alzheimers 10/15
Figure 1.
Schematic overview of PCDH11X and LD plot showing PCDH11X haplotype blocks.
Unadjusted allelic association P values from stage I for variants encompassing the
PCDH11X locus are plotted over physical distance above the PCDH11X gene diagram. The
four PCDH11X RefSeq isoforms and their chromosomal positions are depicted as in EntrezGene (build 36.3). The LD plot shown is for variants in the PCDH11X locus (stage I data in
Haploview 4.0, solid spine haplotype block definition, r 2 values with D'color scheme).
Carrasquillo et al. Page 10
Nat Genet . Author manuscript; available in PMC 2010 May 19.
NI H-P A A
ut h or Manus c r i pt
NI H-P A A ut h or Manus c r i pt
NI H-P A A ut h or
Manus c r i pt
7/31/2019 Genetics and Alzheimers
http://slidepdf.com/reader/full/genetics-and-alzheimers 11/15
NI H-P A
A ut h or Manus c r i pt
NI H-P A A ut h or Manus c r
i pt
NI H-P A A ut h
or Manus c r i pt
Carrasquillo et al. Page 11
T a b l e
1
D e s c r i p t i v e s t a t i s t i c s a n d a l l e l i c a s s o c i a t i o n r e s u l t s f o r S
N P r s 5 9 8 4 8 9 4 .
N
M A F a
H W E b
S e r i e s
C a s e s
C o n t r o l s
C a s e s
C o n t r o l s C
a s e s
C o n t r o l s
P
v a l u e c
O R ( 9 5 % C I ) d
S t a g e I
J S 6 0 - 8 0
3 5 0
3 2 3
0 . 5 2
0 . 4 4
0
. 8 9
0 . 1 9
0 . 0 0 6
1 . 4 0 ( 1 . 1 0 - 1 . 7 7 )
R S 6 0 - 8 0
2 3 5
6 6 9
0 . 5 3
0 . 4 6
0
. 4 0
0 . 2 4
0 . 0 1
1 . 3 5 ( 1 . 0 6 - 1 . 7 1 )
A U T 6 0 - 8 0
2 3 9
2 0 8
0 . 5 5
0 . 4 6
1
. 0 0
0 . 6 6
0 . 0 2
1 . 4 4 ( 1 . 0 5 - 1 . 9 6 )
S t a g e I c o m b i n e d e
8 2 4
1 2 0 0
0 . 5 3
0 . 4 5
0
. 8 5
1 . 0 0
1 . 5
× 1 0 - 5
1 . 3 9 ( 1 . 2 0 - 1 . 6 1 )
S t a g e I I
J S 8 0 +
2 3 2
2 5 4
0 . 5 0
0 . 4 7
0
. 4 1
0 . 4 2
0 . 5 0
1 . 1 0 ( 0 . 8 3 - 1 . 4 6 )
R S 8 0 +
2 7 5
6 1 5
0 . 5 4
0 . 4 5
0
. 0 5
0 . 5 2
0 . 0 0 1
1 . 4 5 ( 1 . 1 6 - 1 . 8 1 )
A U T 8 0 +
3 2 8
1 0 6
0 . 5 2
0 . 5 2
0
. 5 1
0 . 2 8
0 . 8 3
0 . 9 6 ( 0 . 6 8 - 1 . 3 7 )
N C R A D 6 0 - 8 0
6 9 7
2 0 9
0 . 5 1
0 . 4 6
0
. 1 9
0 . 8 6
0 . 1 0
1 . 2 3 ( 1 . 0 8 - 1 . 5 7 )
S t a g e I I c o m b i n e d e
1 5 3 2
1 1 8 4
0 . 5 1
0 . 4 6
0
. 3 1
0 . 7 6
0 . 0 0 2
1 . 2 3 ( 1 . 0 8 - 1 . 4 0 )
S t a g e I + I I c o m b i n e d
e
2 3 5 6
2 3 8 4
0 . 5 2
0 . 4 6
0
. 4 7
0 . 8 2
2 . 2
× 1 0 - 7
1 . 3 0 ( 1 . 1 8 - 1 . 4 3 )
a M i n o r a l l e l e f r e q u e n c y
i n c a s e s a n d c o n t r o l s f o r e a c h s e r i e s . M A F w a s n o
t d i f f e r e n t b e t w e e n m a l e s a n d f e m a l e s i n c o n t r o l s .
b H a r d y - W e i n b e r g e q u i l i b r i u m P v a l u e s f o r f e m a l e c a s e s a n d f e m a l e c o n t r o
l s i n e a c h p o p u l a t i o n .
cP v a l u e s w e r e c a l c u l a t e d f o r e a c h i n d i v i d u a l s e r i e s u s i n g a Ȥ 2 t e s t o n a l l e l e c o u n t s .
d O d d s r a t i o s ( O R ) w e r e
c a l c u l a t e d f o r t h e m i n o r a l l e l e i n e a c h s e r i e s ; 9 5 %
c o n f i d e n c e i n t e r v a l s a r e s h o w n i n p a r e n t h e s e s .
eP v a l u e s a n d O R s u s i n g d a t a f r o m m u l t i p l e s e r i e s w e r e c a l c u l a t e d u s i n g t h
e M a n t e l - H a e n z e l m e t h o d .
Nat Genet . Author manuscript; available in PMC 2010 May 19.
7/31/2019 Genetics and Alzheimers
http://slidepdf.com/reader/full/genetics-and-alzheimers 12/15
NI H-P A
A ut h or Manus c r i pt
NI H-P A A ut h or Manus c r
i pt
NI H-P A A ut h
or Manus c r i pt
Carrasquillo et al. Page 12
T a b l e
2
L o g i s t i c r e g r e s s i o
n r e s u l t s f o r r s 5 9 8 4 8 9 4 c o m p a r i n g m a
l e h e m i z y g o t e s , f e m a l e h e t e r o z y g o t e s , a n d f e m a l e h o m o z y g o t e s t o t h e f e m a l e n o n - c a r r i e r s , u s i n g
m a l e s e x a s c o v a r i a t e . F o r t h e e f f e c t o f a g e a n d A P O E İ
4 a s c o v a r i a t e s s e e S u p p l e m e n t a r y T a b l e 5 o n l i n e .
S e x
M a l e H e m i z y g o t e s
F e m a l e H e t e r o z y g o t e s
F e m a l e H o m
o z y g o t e s
S e r i e s
O R ( 9 5 % C I )
P
O R ( 9 5 % C I )
P
O R ( 9 5 % C I )
P
O R ( 9 5 % C I )
P
G l o b a l P
S t a g e I
J S 6 0 - 8 0
1 . 2 8 ( 0 . 7 8 - 2 . 1 1 )
0 . 3 3
1 . 2 8 ( 0 . 7 9 - 2 . 0 9 )
0 . 3 1
1 . 6 6 ( 1 . 0 4 - 2 . 6 3 )
0 . 0 3
1 . 9 6 ( 1 . 1 4 - 3 . 3 6 )
0 . 0 1
0 . 0 9
R S 6 0 - 8 0
1 . 0 0 ( 0 . 5 8 - 1 . 7 2 )
0 . 9 9
1 . 2 0 ( 0 . 7 6 - 1 . 9 0 )
0 . 4 3
1 . 4 6 ( 0 . 8 7 - 2 . 4 4 )
0 . 1 6
2 . 0 2 ( 1 . 1 2 - 3 . 6 4 )
0 . 0 2
0 . 0 4
A U T 6 0 - 8 0
0 . 7 9 ( 0 . 4 1 - 1 . 5 3 )
0 . 4 8
1 . 4 0 ( 0 . 8 5 - 2 . 3 2 )
0 . 1 9
1 . 5 5 ( 0 . 7 7 - 3 . 1 2 )
0 . 2 2
2 . 0 0 ( 0 . 9 1 - 4 . 4 0 )
0 . 0 9
0 . 0 3
S t a g e I c o m b i n e d
0 . 9 8 ( 0 . 7 2 - 1 . 3 3 )
0 . 9 0
1 . 3 3 ( 1 . 0 2 - 1 . 7 4 )
0 . 0 4
1 . 4 3 ( 1 . 0 6 - 1 . 9 2 )
0 . 0 2
1 . 9 2 ( 1 . 3 6 - 2 . 7 0 )
0 . 0 0 0 2
5 . 7
× 1 0 - 5
S t a g e I I
J S 8 0 +
1 . 3 3 ( 0 . 7 3 - 2 . 4 4 )
0 . 3 5
0 . 9 6 ( 0 . 5 4 - 1 . 7 1 )
0 . 8 9
1 . 5 8 ( 0 . 9 1 - 2 . 7 2 )
0 . 1 0
1 . 3 3 ( 0 . 7 0 - 2 . 5 5 )
0 . 3 8
0 . 6 0
R S 8 0 +
0 . 7 5 ( 0 . 4 6 - 1 . 2 2 )
0 . 2 5
1 . 1 9 ( 0 . 7 4 - 1 . 9 1 )
0 . 4 8
1 . 0 4 ( 0 . 6 7 - 1 . 6 2 )
0 . 8 6
2 . 2 8 ( 1 . 3 9 - 3 . 7 3 )
0 . 0 0 1
1 . 0
× 1 0 - 4
A U T 8 0 +
0 . 4 4 ( 0 . 1 9 - 1 . 0 1 )
0 . 0 5
0 . 9 7 ( 0 . 4 9 - 1 . 9 2 )
0 . 9 4
0 . 7 6 ( 0 . 3 6 - 1 . 6 1 )
0 . 4 7
0 . 9 7 ( 0 . 3 9 - 2 . 3 9 )
0 . 9 5
0 . 0 5
N C R A D 6 0 +
1 . 1 1 ( 0 . 6 7 - 1 . 8 4 )
0 . 6 7
0 . 9 5 ( 0 . 5 8 - 1 . 5 8 )
0 . 8 6
1 . 1 9 ( 0 . 7 5 - 1 . 8 8 )
0 . 4 7
1 . 7 1 ( 0 . 9 8 - 2 . 9 7 )
0 . 0 6
0 . 3 5
S t a g e I I c o m b i n e d
0 . 8 9 ( 0 . 6 9 - 1 . 1 5 )
0 . 3 7
1 . 0 4 ( 0 . 8 2 - 1 . 3 3 )
0 . 7 4
1 . 1 9 ( 0 . 9 4 - 1 . 5 0 )
0 . 1 5
1 . 7 0 ( 1 . 2 9 - 2 . 2 4 )
0 . 0 0 0 2
4 . 8
× 1 0 - 6
S t a g e I + I I c o m b i n e d
0 . 8 6 ( 0 . 7 1 - 1 . 0 5 )
0 . 1 4
1 . 1 8 ( 0 . 9 9 - 1 . 4 1 )
0 . 0 7
1 . 2 6 ( 1 . 0 5 - 1 . 5 1 )
0 . 0 1
1 . 7 5 ( 1 . 4 2 - 2 . 1 6 )
2 . 0
× 1 0 - 7
3 . 9
× 1 0 - 1 2
Nat Genet . Author manuscript; available in PMC 2010 May 19.

7/31/2019 Genetics and Alzheimers
http://slidepdf.com/reader/full/genetics-and-alzheimers 13/15
NI H-P A
A ut h or Manus c r i pt
NI H-P A A ut h or Manus c r
i pt
NI H-P A A ut h
or Manus c r i pt
Carrasquillo et al. Page 13
T a b l e
3
S t a g e I a s s o c i a t i o
n r e s u l t s f o r b l o c k 2 h a p l o t y p e s . T h e g
l o b a l P v a l u e f o r h a p l o t y p e a s s o c i a t i o n w a s 0 . 0 0 0 7 . F r o m l e f t t o r i g h t ( 5 ƍ t o
3 ƍ ) , t h e S N P s i n e a c h
h a p l o t y p e a r e r s 5 9 8 4 8 9 4 , r s 5 9 4 1 0 4 7 , r s 4 5 6 8 7 6 1 , r s 4 2 5 2
2 0 6 , r s 3 7 0 9 2 8 , r s 4 5 3 8 1 0 a n d r s 1 1 7 3 9 3 . M i n o r a l l e l e s a r e u n d e r l i n e d . A s n o t e
d i n t h e t e x t , t h e m i n o r
A a l l e l e o f r s 5 9 8 4
8 9 4 o c c u r s o n H 2 , H 3 , H 4 , a n d H 6 . H 3
a n d H 4 s h o w s i g n i f i c a n t a s s o c i a t i o n t h a t i s s t r o n g e r t h a n t h e a s s o c i a t i o n o f H
2 a n d H 6 w i t h L O A D .
T h i s c o u l d s u g g e s t t h a t t h e r e i s a n u n t y p e d f u n c t i o n a l a l l e l e a s s o c i a t e d w i t h H 3 a n d H 4 , b u t t h
e O R s f o r t h e f o u r h a p l o t y p e s a r e n o t s i g n i f i c a n t l y d i f f e r e n t
f r o m e a c h o t h e r . T h u s t h e d i f f e r e n c e s o b s e r v e d m a y h a v e o c c u r r e d b y c h a n c e a l o n e .
B l o c k 2 H a p l o t y p e s
H a p l o t y p e N a m e
S t a g e I H a p l o t y p e C o u n t s ( F r e q u e n c y )
O R ( 9 5 % C I )
P
v a l u e
A D
C o n t r o l
G A A A G C G
H 1
5 5 4 . 7 / 7 6 8 . 3 ( 0 . 4 1 9 )
9 4 9 . 0 / 9 4 0 . 0 ( 0 . 5 0 2 )
0 . 7 2 ( 0 . 6 2 t o 0 . 8 3 )
3 . 3 E - 0 6
A G G A A A A
H 2
2 6 6 . 7 / 1 0 5 6 . 3 ( 0 . 2 0 2 )
3 4
6 . 7 / 1 5 4 2 . 3 ( 0 . 1 8 4 )
1 . 1 2 ( 0 . 9 4 t o 1 . 3 5 )
0 . 2 0
A G G A G C G
H 3
2 6 4 . 9 / 1 0 5 8 . 1 ( 0 . 2 0 0 )
3 2
3 . 0 / 1 5 6 6 . 0 ( 0 . 1 7 1 )
1 . 2 1 ( 1 . 0 1 t o 1 . 4 6 )
0 . 0 4
A A A A G C G
H 4
1 4 6 . 9 / 1 1 7 6 . 1 ( 0 . 1 1 1 )
1 5
8 . 4 / 1 7 3 0 . 6 ( 0 . 0 8 4 )
1 . 3 6 ( 1 . 0 7 t o 1 . 7 4 )
0 . 0 1
G G G A G C G
H 5
2 2 . 0 / 1 3 0 1 . 0 ( 0 . 0 1 7 )
3 8 . 5 / 1 8 5 0 . 5 ( 0 . 0 2 0 )
0 . 8 1 ( 0 . 4 6 t o 1 . 4 2 )
0 . 4 4
A A G C G A G
H 6
1 6 . 7 / 1 3 0 6 . 3 ( 0 . 0 1 3 )
2 5 . 5 / 1 8 6 3 . 5 ( 0 . 0 1 4 )
0 . 9 3 ( 0 . 4 9 t o 1 . 8 6 )
0 . 8 3
G G G A G A G
H 7
1 6 . 1 / 1 3 0 6 . 9 ( 0 . 0 1 2 )
1 9 . 0 / 1 8 7 0 . 0 ( 0 . 0 1 0 )
1 . 2 1 ( 0 . 5 7 t o 2 . 4 7 )
0 . 5 7
Nat Genet . Author manuscript; available in PMC 2010 May 19.
7/31/2019 Genetics and Alzheimers
http://slidepdf.com/reader/full/genetics-and-alzheimers 14/15
NI H-P A
A ut h or Manus c r i pt
NI H-P A A ut h or Manus c r
i pt
NI H-P A A ut h
or Manus c r i pt
Carrasquillo et al. Page 14
T a b l e
4
D e s c r i p t i v e s t a t i s t i c s a n d a l l e l i c a s s o c i a t i o n r e s u l t s f o r S
N P s r s 2 5 7 3 9 0 5 , r s 5 9 4 1 0 4 7 a n d r s 4 5 6
8 7 6 1 i n t h e c o m b i n e d s t a g e I + I I s e r i e
s .
n
M A F a
H W E b
S N P
C a s e s
C o n t r o l s
C a s e s
C o n t r o l s
C a s e s
C o n t r o l s
P
v a l u e c
O R ( 9 5 % C I ) c
r s 2 5 7 3 9 0 5
2 4 4 9
2 5 6 1
0 . 5 2
0 . 4 6
0 . 3 3
0 . 6 7
1 . 6
× 1 0 - 7
1 . 2 9 ( 1 . 1 7 - 1 . 4 2 )
r s 5 9 4 1 0 4 7
2 4 6 1
2 5 7 6
0 . 4 4
0 . 3 9
0 . 1 8
1 . 0 0
8 . 0
× 1 0 - 5
1 . 2 1 ( 1 . 1 0 - 1 . 3 4 )
r s 4 5 6 8 7 6 1
2 4 5 6
2 5 7 2
0 . 4 6
0 . 4 2
0 . 2 4
0 . 5 5
0 . 0 0 1
1 . 1 7 ( 1 . 0 7 - 1 . 2 9 )
a M i n o r a l l e l e f r e q u e n c y
i n c a s e s a n d c o n t r o l s . M A F s w e r e n o t d i f f e r e n t b e t w e e n m a l e s a n d f e m a l e s i n c o n t r o l s .
b H a r d y - W e i n b e r g e q u i l i b r i u m P v a l u e s f o r f e m a l e c a s e s a n d f e m a l e c o n t r o
l s i n e a c h p o p u l a t i o n .
cP v a l u e s a n d o d d s r a t i o
s ( O R ) w e r e c a l c u l a t e d f o r t h e m i n o r a l l e l e u s i n g t h e M a n t e l - H a e n z e l m e t h o d ; 9 5 % c o n f i d e n c e i n t e r v
a l s a r e s h o w n i n p a r e n t h e s e s . A n a l y s i s o f a l l e l i c a s s o c i a t i o n u s i n g a Ȥ 2 t e s t g a v e
P v a l u e s o f 6 . 6
× 1 0 - 8 , 4 . 4
× 1 0 - 5 , a n d 0 . 0 0 0 1 f o r r s 2 5 7 3 9 0 5 , r s 5 9 4 1 0 4 7 , a n d
r s 4 5 6 8 7 6 1 r e s p e c t i v e l y w i t h o d d s r a t i o s ( 9 5 % C I )
o f 1 . 2 8 ( 1 . 1 7 - 1 . 3 9 ) , 1 . 2 0 ( 1 . 1 0 - 1 . 3 2 ) , a n d 1 . 1 9 ( 1 . 0 9 - 1 . 3 0 ) .
Nat Genet . Author manuscript; available in PMC 2010 May 19.

7/31/2019 Genetics and Alzheimers
http://slidepdf.com/reader/full/genetics-and-alzheimers 15/15
NI H-P A
A ut h or Manus c r i pt
NI H-P A A ut h or Manus c r
i pt
NI H-P A A ut h
or Manus c r i pt
Carrasquillo et al. Page 15
T a b l e
5
L o g i s t i c r e g r e s s i o
n r e s u l t s f o r r s 2 5 7 3 9 0 5 c o m p a r i n g m a
l e h e m i z y g o t e s , f e m a l e h e t e r o z y g o t e s
a n d f e m a l e h o m o z y g o t e s t o t h e f e m a l e n o n - c a r r i e r s , u s i n g
m a l e s e x a s c o v a r i a t e .
S e x
M a l e H e m i z y g o t e s
F e m a l e H e t e r o z y g o t e s
F e m a l e H o m o z y g o t e s
S e r i e s
O R ( 9 5 % C I )
P
O R ( 9 5 % C I )
P
O R ( 9 5 % C I )
P
O R ( 9 5 % C I )
P
G l o b a l P
S t a g e I
J S 6 0 - 8 0
1 . 1 8 ( 0 . 7 3 - 1 . 9 2 )
0 . 5 0
1 . 2 7 ( 0 . 7 9 - 2 . 0 4 )
0 . 3 3
1 . 4 8 ( 0 . 9 4 - 2 . 3 3 )
0 . 0 9
2 . 0 1 ( 1 . 1 9 - 3 . 4 2 )
0 . 0 0 9
0 . 0 8
R S 6 0 - 8 0
0 . 8 2 ( 0 . 5 1 - 0 . 3 2 )
0 . 4 2
1 . 2 2 ( 0 . 8 1 - 1 . 8 6 )
0 . 3 4
1 . 1 7 ( 0 . 7 4 - 1 . 8 5 )
0 . 4 9
1 . 6 1 ( 0 . 9 6 - 2 . 7 1 )
0 . 0 7
0 . 0 6
A U T 6 0 - 8 0
0 . 8 9 ( 0 . 4 7 - 1 . 6 8 )
0 . 7 2
1 . 3 9 ( 0 . 8 8 - 2 . 2 0 )
0 . 1 6
1 . 7 1 ( 0 . 8 9 - 3 . 3 0 )
0 . 1 1
2 . 4 8 ( 1 . 1 5 - 5 . 3 6 )
0 . 0 2
0 . 0 1
S t a g e I c o m b i n e d
0 . 9 3 ( 0 . 6 9 - 1 . 2 4 )
0 . 6 2
1 . 3 0 ( 1 . 0 1 - 1 . 6 7 )
0 . 0 4
1 . 3 2 ( 1 . 0 0 - 1 . 7 5 )
0 . 0 5
1 . 8 5 ( 1 . 3 4 - 2 . 5 5 )
0 . 0 0 0 2
3 . 2
× 1 0 - 5
S t a g e I I
J S 8 0 +
1 . 2 8 ( 0 . 7 0 - 2 . 3 3 )
0 . 4 2
0 . 9 6 ( 0 . 5 4 - 1 . 7 0 )
0 . 8 8
1 . 6 ( 0 . 9 2 - 2 . 7 6 )
0 . 0 9
1 . 4 1 ( 0 . 7 4 - 2 . 6 9 )
0 . 2 9
0 . 5 4
R S 8 0 +
0 . 7 6 ( 0 . 4 7 - 1 . 2 3 )
0 . 2 6
1 . 1 5 ( 0 . 7 2 - 1 . 8 6 )
0 . 5 5
1 . 0 1 ( 0 . 6 5 - 1 . 5 7 )
0 . 9 5
2 . 1 6 ( 1 . 3 2 - 3 . 5 3 )
0 . 0 0 2
2 . 5
× 1 0 - 4
A U T 8 0 +
0 . 4 6 ( 0 . 2 1 - 1 . 0 2 )
0 . 0 6
1 . 0 6 ( 0 . 5 4 - 2 . 0 7 )
0 . 8 6
0 . 8 0 ( 0 . 3 8 - 1 . 6 6 )
0 . 5 5
1 . 0 3 ( 0 . 4 3 - 2 . 4 7 )
0 . 9 4
0 . 0 7
N C R A D 6 0 +
1 . 0 9 ( 0 . 6 6 - 1 . 8 0 )
0 . 7 5
0 . 9 7 ( 0 . 5 8 - 1 . 6 1 )
0 . 9 1
1 . 1 9 ( 0 . 7 5 - 1 . 8 9 )
0 . 4 7
1 . 6 9 ( 0 . 9 7 - 2 . 9 3 )
0 . 0 6
0 . 3 5
S t a g e I I c o m b i n e d
0 . 8 7 ( 0 . 6 8 - 1 . 1 2 )
0 . 2 9
1 . 0 5 ( 0 . 8 2 - 1 . 3 4 )
0 . 6 9
1 . 1 7 ( 0 . 9 3 - 1 . 4 8 )
0 . 1 7
1 . 6 8 ( 1 . 2 7 - 2 . 2 0 )
0 . 0 0 0 2
3 . 9
× 1 0 - 6
S t a g e I + I I c o m b i n e d
0 . 8 4 ( 0 . 7 0 - 1 . 0 2 )
0 . 0 7
1 . 1 7 ( 0 . 9 8 - 1 . 3 9 )
0 . 0 8
1 . 2 2 ( 1 . 0 2 - 1 . 4 5 )
0 . 0 3
1 . 7 2 ( 1 . 4 0 - 2 . 1 2 )
0 . 0 0 0 1
5 . 4
× 1 0 - 1 3
Nat Genet . Author manuscript; available in PMC 2010 May 19.
Related Documents