BioMed Central Page 1 of 10 (page number not for citation purposes) Malaria Journal Open Access Research Genetic population structure of Anopheles gambiae in Equatorial Guinea Marta Moreno* 1 , Patricia Salgueiro 2 , José Luis Vicente 2 , Jorge Cano 1,3 , Pedro J Berzosa 1 , Aida de Lucio 1 , Frederic Simard 4,5 , Adalgisa Caccone 6 , Virgilio E Do Rosario 2 , João Pinto 2 and Agustín Benito 1 Address: 1 Centro Nacional de Medicina Tropical. Instituto de Salud Carlos III. C/Sinesio Delgado 4, 28029 Madrid, Spain, 2 Centro de Malária e outras Doenças Tropicais, Instituto de Higiene e Medicina Tropical, Universidade Nova de Lisboa, Lisbon, Portugal, 3 Centro de Referencia para el Control de Endemias. Centro Nacional de Medicina Tropical, Instituto de Salud Carlos III, Bata, Equatorial Guinea, 4 Institut de Recherche pour le Développement, Unité 016, Montpellier, France, 5 Organisation de Coordination pour la Lutte contre les Endémies en Afrique Centrale, Yaoundé, Cameroun and 6 Yale Institute for Biospheric Studies and Department of Ecology and Evolutionary Biology, Yale University, New Haven, USA Email: Marta Moreno* - [email protected]; Patricia Salgueiro - [email protected]; José Luis Vicente - [email protected]; Jorge Cano - [email protected]; Pedro J Berzosa - [email protected]; Aida de Lucio - [email protected]; Frederic Simard - [email protected]; Adalgisa Caccone - [email protected]; Virgilio E Do Rosario - [email protected]; João Pinto - [email protected]; Agustín Benito - [email protected] * Corresponding author Abstract Background: Patterns of genetic structure among mosquito vector populations in islands have received particular attention as these are considered potentially suitable sites for experimental trials on transgenic-based malaria control strategies. In this study, levels of genetic differentiation have been estimated between populations of Anopheles gambiae s.s. from the islands of Bioko and Annobón, and from continental Equatorial Guinea (EG) and Gabon. Methods: Genotyping of 11 microsatellite loci located in chromosome 3 was performed in three island samples (two in Bioko and one in Annobón) and three mainland samples (two in EG and one in Gabon). Four samples belonged to the M molecular form and two to the S-form. Microsatellite data was used to estimate genetic diversity parameters, perform demographic equilibrium tests and analyse population differentiation. Results: High levels of genetic differentiation were found between the more geographically remote island of Annobón and the continent, contrasting with the shallow differentiation between Bioko island, closest to mainland, and continental localities. In Bioko, differentiation between M and S forms was higher than that observed between island and mainland samples of the same molecular form. Conclusion: The observed patterns of population structure seem to be governed by the presence of both physical (the ocean) and biological (the M-S form discontinuity) barriers to gene flow. The significant degree of genetic isolation between M and S forms detected by microsatellite loci located outside the "genomic islands" of speciation identified in A. gambiae s.s. further supports the hypothesis of on-going incipient speciation within this species. The implications of these findings regarding vector control strategies are discussed. Published: 15 October 2007 Malaria Journal 2007, 6:137 doi:10.1186/1475-2875-6-137 Received: 18 June 2007 Accepted: 15 October 2007 This article is available from: http://www.malariajournal.com/content/6/1/137 © 2007 Moreno et al; licensee BioMed Central Ltd. This is an Open Access article distributed under the terms of the Creative Commons Attribution License (http://creativecommons.org/licenses/by/2.0 ), which permits unrestricted use, distribution, and reproduction in any medium, provided the original work is properly cited.

Welcome message from author
This document is posted to help you gain knowledge. Please leave a comment to let me know what you think about it! Share it to your friends and learn new things together.
Transcript
BioMed CentralMalaria Journal
ss
Open AcceResearchGenetic population structure of Anopheles gambiae in Equatorial GuineaMarta Moreno*1, Patricia Salgueiro2, José Luis Vicente2, Jorge Cano1,3, Pedro J Berzosa1, Aida de Lucio1, Frederic Simard4,5, Adalgisa Caccone6, Virgilio E Do Rosario2, João Pinto2 and Agustín Benito1Address: 1Centro Nacional de Medicina Tropical. Instituto de Salud Carlos III. C/Sinesio Delgado 4, 28029 Madrid, Spain, 2Centro de Malária e outras Doenças Tropicais, Instituto de Higiene e Medicina Tropical, Universidade Nova de Lisboa, Lisbon, Portugal, 3Centro de Referencia para el Control de Endemias. Centro Nacional de Medicina Tropical, Instituto de Salud Carlos III, Bata, Equatorial Guinea, 4Institut de Recherche pour le Développement, Unité 016, Montpellier, France, 5Organisation de Coordination pour la Lutte contre les Endémies en Afrique Centrale, Yaoundé, Cameroun and 6Yale Institute for Biospheric Studies and Department of Ecology and Evolutionary Biology, Yale University, New Haven, USA
Email: Marta Moreno* - [email protected]; Patricia Salgueiro - [email protected]; José Luis Vicente - [email protected]; Jorge Cano - [email protected]; Pedro J Berzosa - [email protected]; Aida de Lucio - [email protected]; Frederic Simard - [email protected]; Adalgisa Caccone - [email protected]; Virgilio E Do Rosario - [email protected]; João Pinto - [email protected]; Agustín Benito - [email protected]
* Corresponding author
AbstractBackground: Patterns of genetic structure among mosquito vector populations in islands havereceived particular attention as these are considered potentially suitable sites for experimentaltrials on transgenic-based malaria control strategies. In this study, levels of genetic differentiationhave been estimated between populations of Anopheles gambiae s.s. from the islands of Bioko andAnnobón, and from continental Equatorial Guinea (EG) and Gabon.
Methods: Genotyping of 11 microsatellite loci located in chromosome 3 was performed in threeisland samples (two in Bioko and one in Annobón) and three mainland samples (two in EG and onein Gabon). Four samples belonged to the M molecular form and two to the S-form. Microsatellitedata was used to estimate genetic diversity parameters, perform demographic equilibrium tests andanalyse population differentiation.
Results: High levels of genetic differentiation were found between the more geographicallyremote island of Annobón and the continent, contrasting with the shallow differentiation betweenBioko island, closest to mainland, and continental localities. In Bioko, differentiation between M andS forms was higher than that observed between island and mainland samples of the same molecularform.
Conclusion: The observed patterns of population structure seem to be governed by the presenceof both physical (the ocean) and biological (the M-S form discontinuity) barriers to gene flow. Thesignificant degree of genetic isolation between M and S forms detected by microsatellite loci locatedoutside the "genomic islands" of speciation identified in A. gambiae s.s. further supports thehypothesis of on-going incipient speciation within this species. The implications of these findingsregarding vector control strategies are discussed.
Published: 15 October 2007
Malaria Journal 2007, 6:137 doi:10.1186/1475-2875-6-137
Received: 18 June 2007Accepted: 15 October 2007
This article is available from: http://www.malariajournal.com/content/6/1/137
© 2007 Moreno et al; licensee BioMed Central Ltd. This is an Open Access article distributed under the terms of the Creative Commons Attribution License (http://creativecommons.org/licenses/by/2.0), which permits unrestricted use, distribution, and reproduction in any medium, provided the original work is properly cited.
Page 1 of 10(page number not for citation purposes)
Malaria Journal 2007, 6:137 http://www.malariajournal.com/content/6/1/137
BackgroundMalaria is an infectious disease that causes between 300–500 million annual clinical cases and 1.5–3 milliondeaths per year, mainly in children under five years old insub-Saharan Africa [1]. Classical strategies of vector con-trol developed in endemic areas of Africa, such as impreg-nated bed nets or indoor residual spraying, have not beenas effective as expected, and malaria incidence is increas-ing. Among the factors involved in this failure are the lackof sustainability of vector control programmes and theemergence of insecticide resistance in mosquitoes [2].
Genetically based methods have been proposed formalaria vector control. These methods focus mainly inaltering vectorial capacity through the genetic transforma-tion of natural vector populations by means of introduc-ing refractoriness genes or by sterile insect technologies[3]. Knowledge of the genetic structure of vector species is,therefore, an essential requirement as it should contributenot only to predict the spread of genes of interest, such asinsecticide resistance or refractory genes, but also to iden-tify heterogeneities in disease transmission due to distinctvector populations [4]. The most effective Afrotropicalmalaria vectors belong to the Anopheles gambiae complex,that comprises seven sibling species. Within the complex,A. gambiae sensu stricto (s.s.) is the most synanthropicspecies and shows remarkable genetic heterogeneity [5,6].Cytogenetic analysis has revealed different chromosomalarrangements associated with paracentric inversions [5].This has lead to the description of five chromosomalforms based in differences in the frequencies of polymor-phic arrangements, geographical distribution and ecolog-ical data [5,7]. Furthermore, analysis of the X-linkedribosomal DNA cluster suggested further genetic subdivi-sion within A. gambiae s.s. and led to the description oftwo molecular forms, provisionally named M and S,defined based on sequence differences in transcribed andnon-transcribed rDNA spacers (IGS and ITS) [8,9].Although the offspring between M and S forms are viableand fertile [10], M-S hybrids or cross-mating between thetwo forms are rarely observed in nature [6,11]. Geneticdifferentiation between molecular forms in this primaryvector is of paramount relevance for the implementationand monitoring of its control, as illustrated by the extremedifferences found in the distribution of knockdown resist-ance mutations among sympatric M and S form popula-tions [12,13].
Previous population genetic studies pointed to a shallowpopulation structure within major malaria vectorsthroughout the African continent, possibly as a result ofrecent population expansion leading to substantial reten-tion of ancestral polymorphism [14,15]. The few cases ofsignificant population differentiation have been attrib-uted to barriers to gene flow, either physical or biological
in the case of the M-S form partitioning in A. gambiae s.s.[16-19] However, recent studies suggest further subdivi-sion within each of the molecular forms, as evidenced bysignificant levels of genetic differentiation among popula-tions of different chromosomal forms, revealed by micro-satellites and AFLP markers [20,21].
In Equatorial Guinea, malaria is one of the main causes ofmorbidity and mortality, being transmitted mainly byvectors of the A. gambiae complex [22]. In the island ofBioko, as well as in mainland Equatorial Guinea, both Mand S forms are known to occur in sympatry. Differentvector control measures are being implemented, includ-ing insecticide treated bed nets and indoors residualspraying [23]. However, studies regarding the geneticstructure of A. gambiae s.s. remain scarce for EquatorialGuinea. The geography of the country, formed by bothinsular and continental regions, is likely to promote agreater biological heterogeneity among its vector popula-tions. This may have important implications for thedesign and implementation of nationwide malaria vectorcontrol programmes. In addition, islands are regarded aspotential sites for experimental releases of transgenic mos-quitoes for malaria control, increasing the need for furthergenetic studies of its populations [18,24].
In this study, microsatellite markers have been used toestimate levels of genetic differentiation between popula-tions of A. gambiae s.s. from the islands of Bioko andAnnobón and from continental localities of EquatorialGuinea and Gabon, in order to determine the extent ofpopulation substructuring and its association with barri-ers to gene flow.
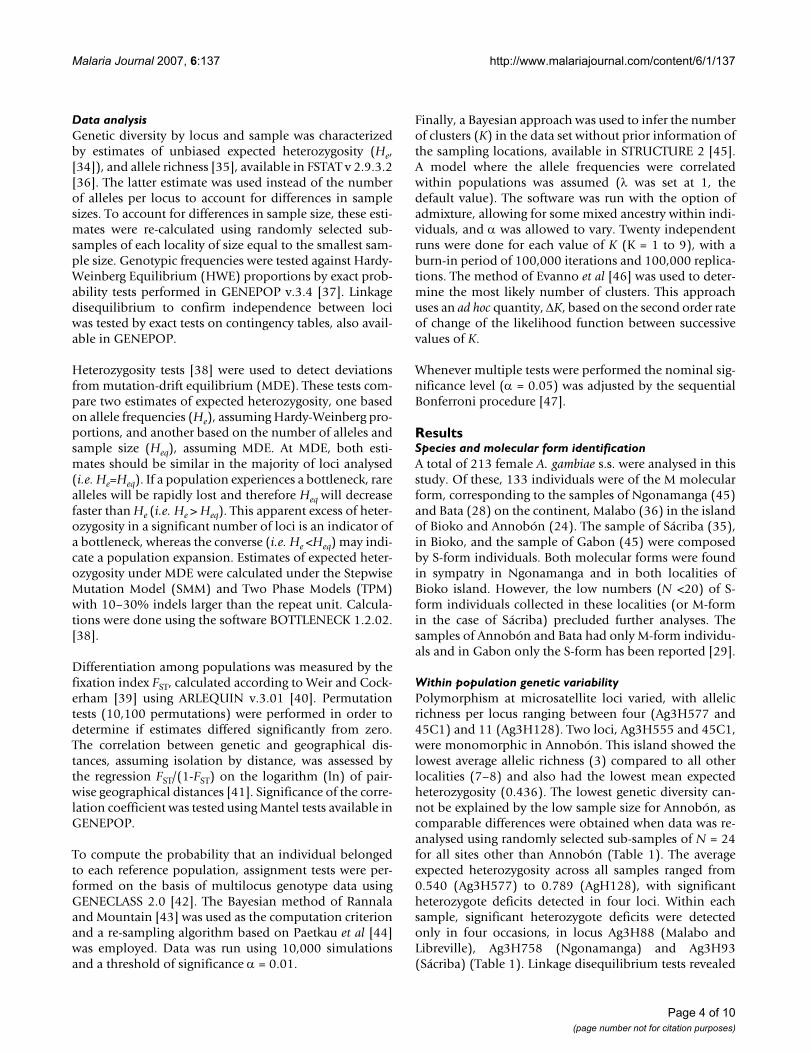
MethodsMosquito collections and species identificationEntomological surveys took place in five localities ofEquatorial Guinea, situated in the Gulf of Guinea, WestAfrica (Figure 1). In the island of Bioko, situated ca. 200km from mainland Equatorial Guinea, landing andindoors resting collections were conducted in 2003 inMalabo (3°45'N/8°46'E), capital of the country, and inthe village of Sácriba (3°42'N/8°43'E) 9 km away. On theisland of Annobón, located in the South hemisphere 670km away from Bioko and 585 km off mainland EquatorialGuinea, samples were collected by CDC light traps andlanding catches in 2004. In the mainland, collectionswere carried out in 2004 in Bata (1°52'N/9°46'E) andNgonamanga (2°08'N/9°46'E) 30 km apart, by the samesampling methods. Climatic and ecological data fromthese sites have been described elsewhere [22].
Mosquitoes were morphologically identified using theidentification keys of Gillies & Coetzee [25]. Specimenswere kept individually in silica gel filled tubes at 4°C,
Page 2 of 10(page number not for citation purposes)
Malaria Journal 2007, 6:137 http://www.malariajournal.com/content/6/1/137
until DNA extraction was performed according to Collinset al [26]. Species identification within the A. gambiaecomplex was done by PCR according to Scott et al [27].Anopheles gambiae s.s. molecular forms were determinedas described in Favia et al [28]. Although cytological anal-ysis was not performed, the Forest cytoform of A. gambiaes.s. is likely to be the only one present in these localities[5,22].
An additional sample from Libreville (0°23'N/9°27'E),Gabon, was also included in the analysis. This sample wascollected in 2000 and it is composed by S-form A. gambiaes.s. [29].
Microsatellite analysisEleven microsatellite loci [17,30] were genotyped:Ag3H128, Ag3H249, Ag3H119, Ag3H242, Ag3H577,Ag3H555, Ag3H59, Ag3H758, Ag3H88, Ag3H93 and45C1. Only loci of chromosome 3 were used to avoid pos-sible bias due to selective effects associated with paracen-tric inversions or reproductive isolation putative regionsthat are known to occur in chromosomes 2 and X [31,32].Each locus was amplified by PCR using fluorescentlylabelled (FAM, NED, or HEX) forward primers [33].Amplified fragments were separated by capillary electro-phoresis in an automatic sequencer (ABI 3730, AppliedBiosystems) and sizes scored using the software Gene-Marker (SoftGenetics, USA).
Collection sites in Equatorial Guinea and GabonFigure 1Collection sites in Equatorial Guinea and Gabon.
6 8 10 12
0
2
4
100 km
MalaboSácriba
Ngonamanga
Bata
Libreville
Bioko island(Equatorial Guinea)
Pale, Annobón island(Equatorial Guinea)
EquatorialGuinea
Gabon
6 8 10 12
0
2
4
100 km
MalaboSácriba
Ngonamanga
Bata
Libreville
Bioko island(Equatorial Guinea)
Pale, Annobón island(Equatorial Guinea)
EquatorialGuinea
Gabon
6 8 10 12
0
2
4
100 km
MalaboSácriba
Ngonamanga
Bata
Libreville
Bioko island(Equatorial Guinea)
Pale, Annobón island(Equatorial Guinea)
EquatorialGuinea
Gabon
Page 3 of 10(page number not for citation purposes)
Malaria Journal 2007, 6:137 http://www.malariajournal.com/content/6/1/137
Data analysisGenetic diversity by locus and sample was characterizedby estimates of unbiased expected heterozygosity (He,[34]), and allele richness [35], available in FSTAT v 2.9.3.2[36]. The latter estimate was used instead of the numberof alleles per locus to account for differences in samplesizes. To account for differences in sample size, these esti-mates were re-calculated using randomly selected sub-samples of each locality of size equal to the smallest sam-ple size. Genotypic frequencies were tested against Hardy-Weinberg Equilibrium (HWE) proportions by exact prob-ability tests performed in GENEPOP v.3.4 [37]. Linkagedisequilibrium to confirm independence between lociwas tested by exact tests on contingency tables, also avail-able in GENEPOP.
Heterozygosity tests [38] were used to detect deviationsfrom mutation-drift equilibrium (MDE). These tests com-pare two estimates of expected heterozygosity, one basedon allele frequencies (He), assuming Hardy-Weinberg pro-portions, and another based on the number of alleles andsample size (Heq), assuming MDE. At MDE, both esti-mates should be similar in the majority of loci analysed(i.e. He=Heq). If a population experiences a bottleneck, rarealleles will be rapidly lost and therefore Heq will decreasefaster than He (i.e. He > Heq). This apparent excess of heter-ozygosity in a significant number of loci is an indicator ofa bottleneck, whereas the converse (i.e. He <Heq) may indi-cate a population expansion. Estimates of expected heter-ozygosity under MDE were calculated under the StepwiseMutation Model (SMM) and Two Phase Models (TPM)with 10–30% indels larger than the repeat unit. Calcula-tions were done using the software BOTTLENECK 1.2.02.[38].
Differentiation among populations was measured by thefixation index FST, calculated according to Weir and Cock-erham [39] using ARLEQUIN v.3.01 [40]. Permutationtests (10,100 permutations) were performed in order todetermine if estimates differed significantly from zero.The correlation between genetic and geographical dis-tances, assuming isolation by distance, was assessed bythe regression FST/(1-FST) on the logarithm (ln) of pair-wise geographical distances [41]. Significance of the corre-lation coefficient was tested using Mantel tests available inGENEPOP.
To compute the probability that an individual belongedto each reference population, assignment tests were per-formed on the basis of multilocus genotype data usingGENECLASS 2.0 [42]. The Bayesian method of Rannalaand Mountain [43] was used as the computation criterionand a re-sampling algorithm based on Paetkau et al [44]was employed. Data was run using 10,000 simulationsand a threshold of significance α = 0.01.
Finally, a Bayesian approach was used to infer the numberof clusters (K) in the data set without prior information ofthe sampling locations, available in STRUCTURE 2 [45].A model where the allele frequencies were correlatedwithin populations was assumed (λ was set at 1, thedefault value). The software was run with the option ofadmixture, allowing for some mixed ancestry within indi-viduals, and α was allowed to vary. Twenty independentruns were done for each value of K (K = 1 to 9), with aburn-in period of 100,000 iterations and 100,000 replica-tions. The method of Evanno et al [46] was used to deter-mine the most likely number of clusters. This approachuses an ad hoc quantity, ∆K, based on the second order rateof change of the likelihood function between successivevalues of K.
Whenever multiple tests were performed the nominal sig-nificance level (α = 0.05) was adjusted by the sequentialBonferroni procedure [47].
ResultsSpecies and molecular form identificationA total of 213 female A. gambiae s.s. were analysed in thisstudy. Of these, 133 individuals were of the M molecularform, corresponding to the samples of Ngonamanga (45)and Bata (28) on the continent, Malabo (36) in the islandof Bioko and Annobón (24). The sample of Sácriba (35),in Bioko, and the sample of Gabon (45) were composedby S-form individuals. Both molecular forms were foundin sympatry in Ngonamanga and in both localities ofBioko island. However, the low numbers (N <20) of S-form individuals collected in these localities (or M-formin the case of Sácriba) precluded further analyses. Thesamples of Annobón and Bata had only M-form individu-als and in Gabon only the S-form has been reported [29].
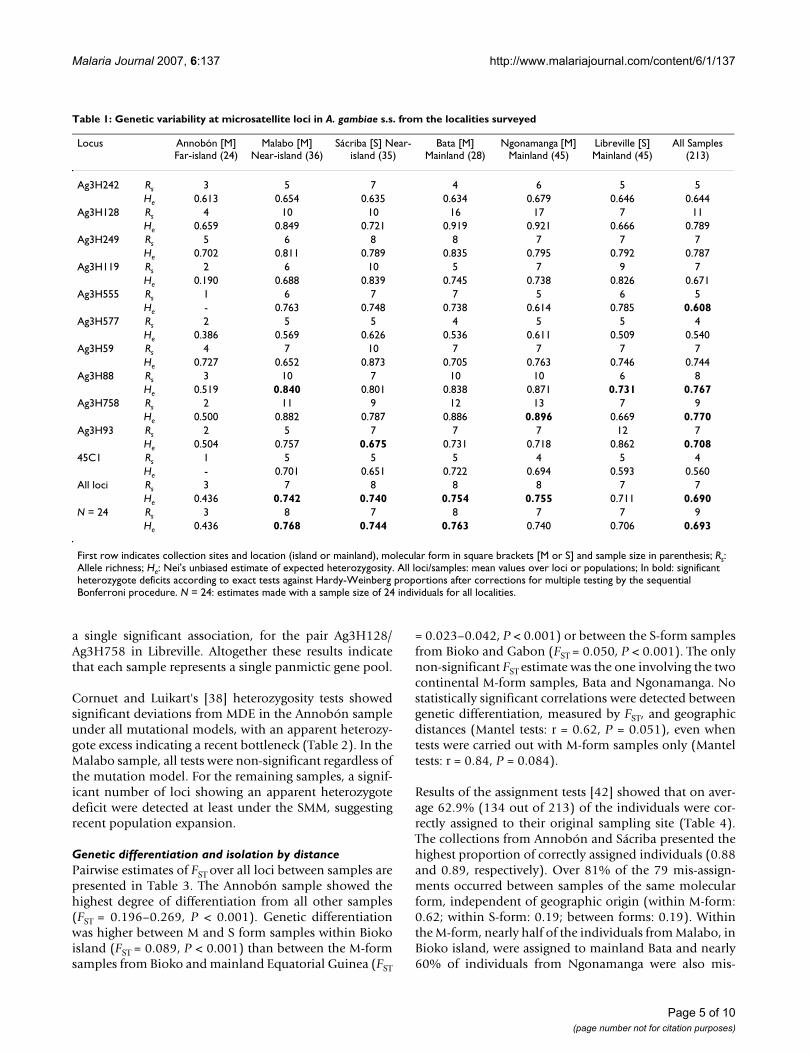
Within population genetic variabilityPolymorphism at microsatellite loci varied, with allelicrichness per locus ranging between four (Ag3H577 and45C1) and 11 (Ag3H128). Two loci, Ag3H555 and 45C1,were monomorphic in Annobón. This island showed thelowest average allelic richness (3) compared to all otherlocalities (7–8) and also had the lowest mean expectedheterozygosity (0.436). The lowest genetic diversity can-not be explained by the low sample size for Annobón, ascomparable differences were obtained when data was re-analysed using randomly selected sub-samples of N = 24for all sites other than Annobón (Table 1). The averageexpected heterozygosity across all samples ranged from0.540 (Ag3H577) to 0.789 (AgH128), with significantheterozygote deficits detected in four loci. Within eachsample, significant heterozygote deficits were detectedonly in four occasions, in locus Ag3H88 (Malabo andLibreville), Ag3H758 (Ngonamanga) and Ag3H93(Sácriba) (Table 1). Linkage disequilibrium tests revealed
Page 4 of 10(page number not for citation purposes)
Malaria Journal 2007, 6:137 http://www.malariajournal.com/content/6/1/137
a single significant association, for the pair Ag3H128/Ag3H758 in Libreville. Altogether these results indicatethat each sample represents a single panmictic gene pool.
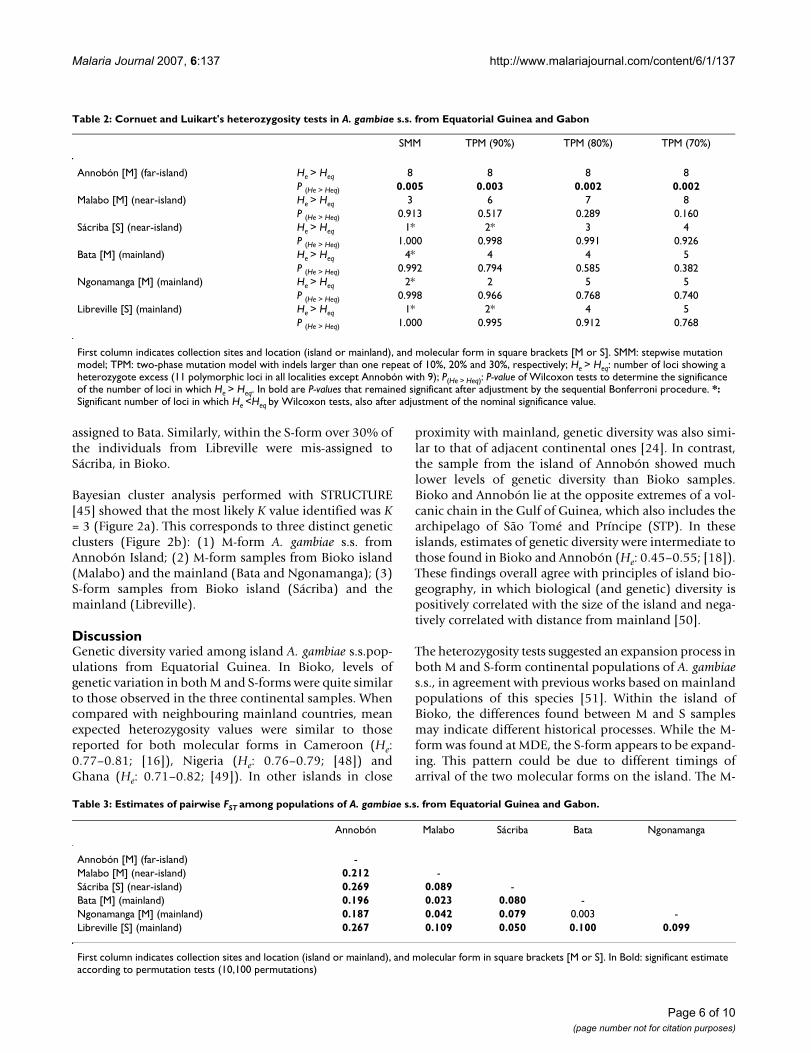
Cornuet and Luikart's [38] heterozygosity tests showedsignificant deviations from MDE in the Annobón sampleunder all mutational models, with an apparent heterozy-gote excess indicating a recent bottleneck (Table 2). In theMalabo sample, all tests were non-significant regardless ofthe mutation model. For the remaining samples, a signif-icant number of loci showing an apparent heterozygotedeficit were detected at least under the SMM, suggestingrecent population expansion.
Genetic differentiation and isolation by distancePairwise estimates of FST over all loci between samples arepresented in Table 3. The Annobón sample showed thehighest degree of differentiation from all other samples(FST = 0.196–0.269, P < 0.001). Genetic differentiationwas higher between M and S form samples within Biokoisland (FST = 0.089, P < 0.001) than between the M-formsamples from Bioko and mainland Equatorial Guinea (FST
= 0.023–0.042, P < 0.001) or between the S-form samplesfrom Bioko and Gabon (FST = 0.050, P < 0.001). The onlynon-significant FST estimate was the one involving the twocontinental M-form samples, Bata and Ngonamanga. Nostatistically significant correlations were detected betweengenetic differentiation, measured by FST, and geographicdistances (Mantel tests: r = 0.62, P = 0.051), even whentests were carried out with M-form samples only (Manteltests: r = 0.84, P = 0.084).
Results of the assignment tests [42] showed that on aver-age 62.9% (134 out of 213) of the individuals were cor-rectly assigned to their original sampling site (Table 4).The collections from Annobón and Sácriba presented thehighest proportion of correctly assigned individuals (0.88and 0.89, respectively). Over 81% of the 79 mis-assign-ments occurred between samples of the same molecularform, independent of geographic origin (within M-form:0.62; within S-form: 0.19; between forms: 0.19). Withinthe M-form, nearly half of the individuals from Malabo, inBioko island, were assigned to mainland Bata and nearly60% of individuals from Ngonamanga were also mis-
Table 1: Genetic variability at microsatellite loci in A. gambiae s.s. from the localities surveyed
Locus Annobón [M] Far-island (24)
Malabo [M] Near-island (36)
Sácriba [S] Near-island (35)
Bata [M] Mainland (28)
Ngonamanga [M] Mainland (45)
Libreville [S] Mainland (45)
All Samples (213)
Ag3H242 Rs 3 5 7 4 6 5 5He 0.613 0.654 0.635 0.634 0.679 0.646 0.644
Ag3H128 Rs 4 10 10 16 17 7 11He 0.659 0.849 0.721 0.919 0.921 0.666 0.789
Ag3H249 Rs 5 6 8 8 7 7 7He 0.702 0.811 0.789 0.835 0.795 0.792 0.787
Ag3H119 Rs 2 6 10 5 7 9 7He 0.190 0.688 0.839 0.745 0.738 0.826 0.671
Ag3H555 Rs 1 6 7 7 5 6 5He - 0.763 0.748 0.738 0.614 0.785 0.608
Ag3H577 Rs 2 5 5 4 5 5 4He 0.386 0.569 0.626 0.536 0.611 0.509 0.540
Ag3H59 Rs 4 7 10 7 7 7 7He 0.727 0.652 0.873 0.705 0.763 0.746 0.744
Ag3H88 Rs 3 10 7 10 10 6 8He 0.519 0.840 0.801 0.838 0.871 0.731 0.767
Ag3H758 Rs 2 11 9 12 13 7 9He 0.500 0.882 0.787 0.886 0.896 0.669 0.770
Ag3H93 Rs 2 5 7 7 7 12 7He 0.504 0.757 0.675 0.731 0.718 0.862 0.708
45C1 Rs 1 5 5 5 4 5 4He - 0.701 0.651 0.722 0.694 0.593 0.560
All loci Rs 3 7 8 8 8 7 7He 0.436 0.742 0.740 0.754 0.755 0.711 0.690
N = 24 Rs 3 8 7 8 7 7 9He 0.436 0.768 0.744 0.763 0.740 0.706 0.693
First row indicates collection sites and location (island or mainland), molecular form in square brackets [M or S] and sample size in parenthesis; Rs: Allele richness; He: Nei's unbiased estimate of expected heterozygosity. All loci/samples: mean values over loci or populations; In bold: significant heterozygote deficits according to exact tests against Hardy-Weinberg proportions after corrections for multiple testing by the sequential Bonferroni procedure. N = 24: estimates made with a sample size of 24 individuals for all localities.
Page 5 of 10(page number not for citation purposes)
Malaria Journal 2007, 6:137 http://www.malariajournal.com/content/6/1/137
assigned to Bata. Similarly, within the S-form over 30% ofthe individuals from Libreville were mis-assigned toSácriba, in Bioko.
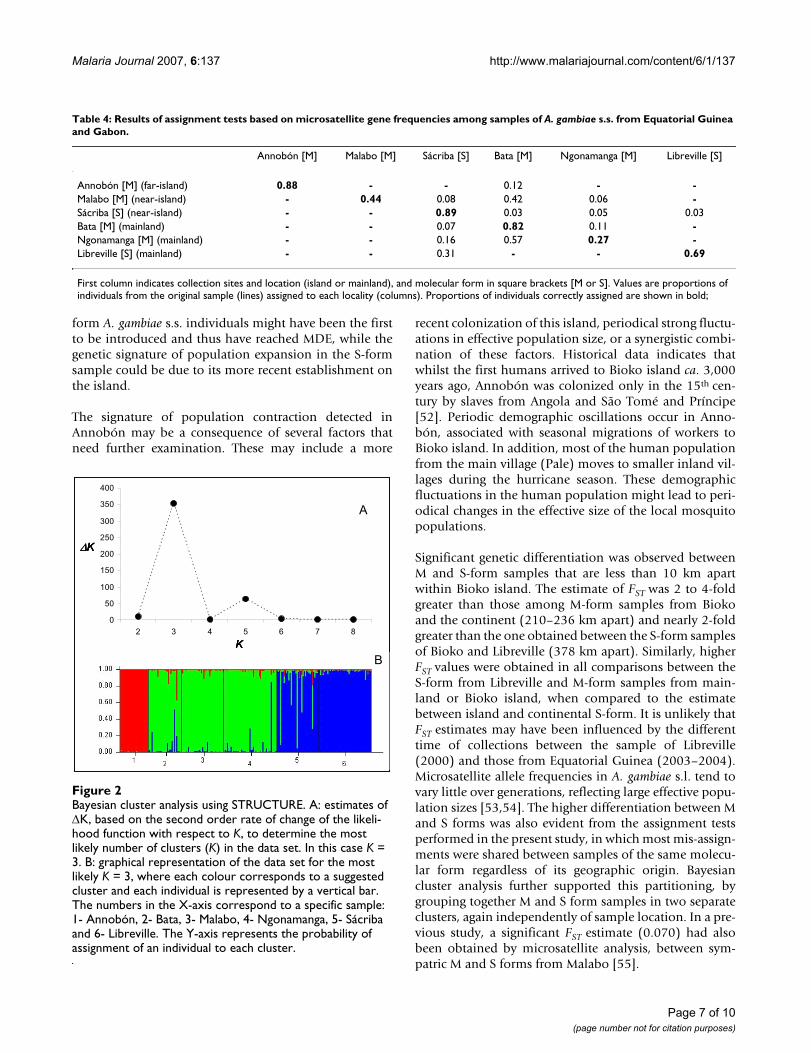
Bayesian cluster analysis performed with STRUCTURE[45] showed that the most likely K value identified was K= 3 (Figure 2a). This corresponds to three distinct geneticclusters (Figure 2b): (1) M-form A. gambiae s.s. fromAnnobón Island; (2) M-form samples from Bioko island(Malabo) and the mainland (Bata and Ngonamanga); (3)S-form samples from Bioko island (Sácriba) and themainland (Libreville).
DiscussionGenetic diversity varied among island A. gambiae s.s.pop-ulations from Equatorial Guinea. In Bioko, levels ofgenetic variation in both M and S-forms were quite similarto those observed in the three continental samples. Whencompared with neighbouring mainland countries, meanexpected heterozygosity values were similar to thosereported for both molecular forms in Cameroon (He:0.77–0.81; [16]), Nigeria (He: 0.76–0.79; [48]) andGhana (He: 0.71–0.82; [49]). In other islands in close
proximity with mainland, genetic diversity was also simi-lar to that of adjacent continental ones [24]. In contrast,the sample from the island of Annobón showed muchlower levels of genetic diversity than Bioko samples.Bioko and Annobón lie at the opposite extremes of a vol-canic chain in the Gulf of Guinea, which also includes thearchipelago of São Tomé and Príncipe (STP). In theseislands, estimates of genetic diversity were intermediate tothose found in Bioko and Annobón (He: 0.45–0.55; [18]).These findings overall agree with principles of island bio-geography, in which biological (and genetic) diversity ispositively correlated with the size of the island and nega-tively correlated with distance from mainland [50].
The heterozygosity tests suggested an expansion process inboth M and S-form continental populations of A. gambiaes.s., in agreement with previous works based on mainlandpopulations of this species [51]. Within the island ofBioko, the differences found between M and S samplesmay indicate different historical processes. While the M-form was found at MDE, the S-form appears to be expand-ing. This pattern could be due to different timings ofarrival of the two molecular forms on the island. The M-
Table 3: Estimates of pairwise FST among populations of A. gambiae s.s. from Equatorial Guinea and Gabon.
Annobón Malabo Sácriba Bata Ngonamanga
Annobón [M] (far-island) -Malabo [M] (near-island) 0.212 -Sácriba [S] (near-island) 0.269 0.089 -Bata [M] (mainland) 0.196 0.023 0.080 -Ngonamanga [M] (mainland) 0.187 0.042 0.079 0.003 -Libreville [S] (mainland) 0.267 0.109 0.050 0.100 0.099
First column indicates collection sites and location (island or mainland), and molecular form in square brackets [M or S]. In Bold: significant estimate according to permutation tests (10,100 permutations)
Table 2: Cornuet and Luikart's heterozygosity tests in A. gambiae s.s. from Equatorial Guinea and Gabon
SMM TPM (90%) TPM (80%) TPM (70%)
Annobón [M] (far-island) He > Heq 8 8 8 8P (He > Heq) 0.005 0.003 0.002 0.002
Malabo [M] (near-island) He > Heq 3 6 7 8P (He > Heq) 0.913 0.517 0.289 0.160
Sácriba [S] (near-island) He > Heq 1* 2* 3 4P (He > Heq) 1.000 0.998 0.991 0.926
Bata [M] (mainland) He > Heq 4* 4 4 5P (He > Heq) 0.992 0.794 0.585 0.382
Ngonamanga [M] (mainland) He > Heq 2* 2 5 5P (He > Heq) 0.998 0.966 0.768 0.740
Libreville [S] (mainland) He > Heq 1* 2* 4 5P (He > Heq) 1.000 0.995 0.912 0.768
First column indicates collection sites and location (island or mainland), and molecular form in square brackets [M or S]. SMM: stepwise mutation model; TPM: two-phase mutation model with indels larger than one repeat of 10%, 20% and 30%, respectively; He > Heq: number of loci showing a heterozygote excess (11 polymorphic loci in all localities except Annobón with 9); P(He > Heq): P-value of Wilcoxon tests to determine the significance of the number of loci in which He > Heq. In bold are P-values that remained significant after adjustment by the sequential Bonferroni procedure. *: Significant number of loci in which He <Heq by Wilcoxon tests, also after adjustment of the nominal significance value.
Page 6 of 10(page number not for citation purposes)
Malaria Journal 2007, 6:137 http://www.malariajournal.com/content/6/1/137
form A. gambiae s.s. individuals might have been the firstto be introduced and thus have reached MDE, while thegenetic signature of population expansion in the S-formsample could be due to its more recent establishment onthe island.
The signature of population contraction detected inAnnobón may be a consequence of several factors thatneed further examination. These may include a more
recent colonization of this island, periodical strong fluctu-ations in effective population size, or a synergistic combi-nation of these factors. Historical data indicates thatwhilst the first humans arrived to Bioko island ca. 3,000years ago, Annobón was colonized only in the 15th cen-tury by slaves from Angola and São Tomé and Príncipe[52]. Periodic demographic oscillations occur in Anno-bón, associated with seasonal migrations of workers toBioko island. In addition, most of the human populationfrom the main village (Pale) moves to smaller inland vil-lages during the hurricane season. These demographicfluctuations in the human population might lead to peri-odical changes in the effective size of the local mosquitopopulations.
Significant genetic differentiation was observed betweenM and S-form samples that are less than 10 km apartwithin Bioko island. The estimate of FST was 2 to 4-foldgreater than those among M-form samples from Biokoand the continent (210–236 km apart) and nearly 2-foldgreater than the one obtained between the S-form samplesof Bioko and Libreville (378 km apart). Similarly, higherFST values were obtained in all comparisons between theS-form from Libreville and M-form samples from main-land or Bioko island, when compared to the estimatebetween island and continental S-form. It is unlikely thatFST estimates may have been influenced by the differenttime of collections between the sample of Libreville(2000) and those from Equatorial Guinea (2003–2004).Microsatellite allele frequencies in A. gambiae s.l. tend tovary little over generations, reflecting large effective popu-lation sizes [53,54]. The higher differentiation between Mand S forms was also evident from the assignment testsperformed in the present study, in which most mis-assign-ments were shared between samples of the same molecu-lar form regardless of its geographic origin. Bayesiancluster analysis further supported this partitioning, bygrouping together M and S form samples in two separateclusters, again independently of sample location. In a pre-vious study, a significant FST estimate (0.070) had alsobeen obtained by microsatellite analysis, between sym-patric M and S forms from Malabo [55].
Bayesian cluster analysis using STRUCTUREFigure 2Bayesian cluster analysis using STRUCTURE. A: estimates of ∆K, based on the second order rate of change of the likeli-hood function with respect to K, to determine the most likely number of clusters (K) in the data set. In this case K = 3. B: graphical representation of the data set for the most likely K = 3, where each colour corresponds to a suggested cluster and each individual is represented by a vertical bar. The numbers in the X-axis correspond to a specific sample: 1- Annobón, 2- Bata, 3- Malabo, 4- Ngonamanga, 5- Sácriba and 6- Libreville. The Y-axis represents the probability of assignment of an individual to each cluster.
0
50
100
150
200
250
300
350
400
2 3 4 5 6 7 8
A
BK
K
0
50
100
150
200
250
300
350
400
2 3 4 5 6 7 8
A
BK
K
0
50
100
150
200
250
300
350
400
2 3 4 5 6 7 8
A
BK
K
0
50
100
150
200
250
300
350
400
2 3 4 5 6 7 8
A
BK
K
Table 4: Results of assignment tests based on microsatellite gene frequencies among samples of A. gambiae s.s. from Equatorial Guinea and Gabon.
Annobón [M] Malabo [M] Sácriba [S] Bata [M] Ngonamanga [M] Libreville [S]
Annobón [M] (far-island) 0.88 - - 0.12 - -Malabo [M] (near-island) - 0.44 0.08 0.42 0.06 -Sácriba [S] (near-island) - - 0.89 0.03 0.05 0.03Bata [M] (mainland) - - 0.07 0.82 0.11 -Ngonamanga [M] (mainland) - - 0.16 0.57 0.27 -Libreville [S] (mainland) - - 0.31 - - 0.69
First column indicates collection sites and location (island or mainland), and molecular form in square brackets [M or S]. Values are proportions of individuals from the original sample (lines) assigned to each locality (columns). Proportions of individuals correctly assigned are shown in bold;
Page 7 of 10(page number not for citation purposes)
Malaria Journal 2007, 6:137 http://www.malariajournal.com/content/6/1/137
Altogether, these results agree with the notion of a biolog-ical discontinuity within A. gambiae s.s., and that M and Sforms are likely to be the result of an on-going incipientspeciation process [6]. Evidence of limited gene flowbetween molecular forms has been described in otherWest African countries, with different genetic markers[4,8,13,56,57]. However, several studies, some of whichbased on microsatellites, suggest that the highest geneticdifferentiation between M and S forms appears to berestricted mainly to certain genomic regions, particularlyin the low-recombination centromeric regions of chromo-some X and chromosome 2L [32,58-61]. This led theauthors to hypothesise that these regions contain genesresponsible for reproductive isolation. In this study, highdifferentiation between M and S-forms was detected bythe analysis of microsatellites mapped in chromosome 3,i.e. outside regions where putative isolation genes arethought to occur, reinforcing the idea of high levels ofgenetic isolation between molecular forms in this geo-graphic region. Similarly, Wondji et al [16] also observedhigh differentiation between sympatric M and S-forms inCameroon, with the analysis of microsatellites locatedoutside the centromeric regions of chromosomes 2L andX. Whilst their results may appear conflicting with thosefrom Turner et al [59], given that both studies were basedon samples from Cameroon, this may not be case as dif-ferent genetic markers (i.e. microsatellites and microarrayprobes) were used. Microsatellites detect allele frequencydifferences in highly polymorphic regions of the genome,while hybridization approaches using microarrays willdetect differentiation in regions where polymorphism isrelatively low within each form relative to differencesbetween forms, such as the case of centromeric regions.On the other hand, in a recent microsatellite-based studycarried out in Ghana, levels of population differentiationin A. gambiae s.s.were more attributable to ecologicalzones rather than to the M-S molecular form partitioning[49]. These apparent differences may suggest that,although it is clear that incipient speciation is on-goingwithin A. gambiae s.s., the degree of isolation between itsreproductive units is likely to vary throughout the specieseco-geographic distribution range.
Within the M-form, the low levels of differentiationbetween the sample of Bioko and those from continentalEquatorial Guinea suggest that gene flow between thisisland and the mainland is likely to occur. Reimer et al[55] detected slightly higher levels of population differen-tiation between Bioko island (Malabo) and sites from thenearest continental country, Cameroon (FST: 0.038–0.057). Being the capital of the country, connections withcontinental Equatorial Guinea (Bata), by air or sea at adaily frequency, may promote gene flow through human-mediated transportation of mosquitoes. Several studiesprovided evidence of human activities promoting gene
flow in mosquito populations between islands orbetween islands and mainland [62]. Conversely, the high-est levels of population differentiation were found in allcomparisons that involved the M-form sample of Anno-bón island. This supports a higher degree of isolation ofthis island and agrees with previous studies demonstrat-ing the ocean and other extensive water-bodies as a phys-ical barrier to gene flow in anopheline species[18,19,24,63]. Similarly, microsatellite-based studies con-ducted in the neighbouring STP islands also showed highlevels of differentiation with the continent (FST: 0.118–0.250) [18] and subsequent sequencing analysis of rDNAand mitochondrial DNA regions suggests only two maincolonization events of A. gambiae s.s. into these islands[Marshal et al, unpublished].
ConclusionIn the present study, strong levels of population substruc-ture were detected in A. gambiae s.s. from EquatorialGuinea. Patterns of genetic differentiation are most likelygoverned by the presence of both physical/geographic(the ocean) and biological (the M-S form discontinuity)barriers to gene flow. These findings have important prac-tical implications for the management of vector controlstrategies. The biological partitioning between M and S-forms may influence the evolution of genes of interestsuch as insecticide resistance genes. An unusual frequencyof knockdown resistance (kdr) mutations has beendetected in the M-form population of Bioko, contrastingwith the absence of these alleles in the S-form of thisisland [55]. This implies that a detailed characterization ofthe distribution of M and S forms at a local level and con-tinuous monitoring of kdr mutations within each formwould be desirable for a rational management of insecti-cides for malaria control. The closest proximity and lowestdifferentiation with mainland coupled with the geneticisolation found between sympatric M and S form popula-tions in Bioko, could make this island inappropriate forinitial experimental releases of genetically modified mos-quitoes, as only part of the vector population might beaffected. On the other hand, in Annobón the presence ofa single molecular form coupled with its higher geo-graphic and genetic isolation, might render this islandcomparatively more suitable for transgenic-based malariacontrol.
Authors' contributionsMM was involved in the design of the survey, microsatel-lite genotyping, data analysis and manuscript prepara-tion. PS participated in data analysis and drafting themanuscript. JLV carried out microsatellite and data analy-sis. JC participated in field surveys and helped drafting themanuscript. PB and AL participated in molecular analysesand in the elaboration of the manuscript. FS and AC wereinvolved in sample collections, molecular analyses and
Page 8 of 10(page number not for citation purposes)
Malaria Journal 2007, 6:137 http://www.malariajournal.com/content/6/1/137
revised the manuscript. VER participated in the design ofthe study and revised the manuscript. JP conceived andco-supervised the study, assisted data analysis and coordi-nated the draft of the manuscript. AB participated in theconception and design of the study, revised the manu-script and provided overall supervision to the work. Allauthors read and approved the final manuscript.
AcknowledgementsWe would like to thank the National Malaria Control Program, Republic of Equatorial Guinea's Ministry of Health and Social Welfare, for its technical support. We are grateful to L. Bobuakasi, S. Nzambo, M. Ondó, JN Buatiché and J.C. Toto for helping in mosquito collections. This study received finan-cial support from the Spanish International Cooperation Agency (AECI), the Institute of Health Carlos III within the Network of Tropical Diseases Research Centers (RICET; Proj. Ro6/0021/0000) and from the UNICEF/UNDP/World Bank/WHO Special Programme for Research and Training in Tropical Diseases (TDR, A50239)
References1. WHO/UNICEF/RBM: World Malaria Report 2005. WHO/HTM/MAL/
2005.1102 World Health Organization, Geneva; 2005. 2. Brogdon WG, McAllister JC: Insecticide resistance and vector
control. Emerg Infect Dis 1998, 4:605-613.3. Brey PT: Anopheles gambiae genome: perspectives for malaria
control. Mol Cells 2003, 15:133-138.4. Lehmann T, Licht M, Elissa N, Maega BT, Chimumbwa JM, Watsenga
FT, Wondji CS, Simard F, Hawley WA: Population Structure ofAnopheles gambiae in Africa. J Hered 2003, 94:133-147.
5. Coluzzi M, Petrarca V, Di Deco M: Chromosomal inversionintergradation in incipient speciation in Anopheles gambiae.Boll Zool 1985, 52:45-63.
6. Della Torre A, Costantini C, Besansky NJ, Caccone A, Petrarca V,Powell JR, Coluzzi M: Speciation within Anopheles gambiae – theglass is half full. Science 2002, 298:115-117.
7. Touré YT, Petrarca V, Traoré SF, Coulibaly A, Maiga HM, Sankare O,Sow M, Di Deco MA, Coluzzi M: The distribution and inversionpolymorphism of chromosomally recognized taxa of theAnopheles gambiae complex in Mali, West Africa. Parassitologia1998, 40:477-511.
8. Della Torre A, Akogbeto M, Sou-Yovo J, Favia G, Petrarca V, ColuzziM: Molecular evidence of incipient speciation within Anophe-les gambiae s.s. in West Africa. Insect Mol Biol 2001, 10:9-18.
9. Gentile G, Slotman M, Ketmaier V, Powell JR, Caccone A: Attemptsto molecularly distinguish cryptic taxa in Anopheles gambiaes.s. Insect Mol Biol 2001, 10:25-32.
10. Diabate A, Dabire RK, Millogo N, Lehmann T: Evaluating the effectof postmating isolation between molecular forms of Anoph-eles gambiae (Diptera: Culicidae). J Med Entomol 2007, 44:60-64.
11. Tripet F, Toure YT, Taylor CE, Norris DE, Dolo G, Lanzaro GC:DNA analysis of transferred sperm reveals significant levelsof gene flow between molecular forms of Anopheles gambiae.Mol Ecol 2001, 10:1725-1732.
12. Fanello C, Petrarca V, della TA, Santolamazza F, Dolo G, Coulibaly M,Alloueche A, Curtis CF, Toure YT, Coluzzi M: The pyrethroidknock-down resistance gene in the Anopheles gambiae com-plex in Mali and further indication of incipient speciationwithin An. gambiae s.s. Insect Mol Biol 2003, 12:241-245.
13. Gentile G, Santolamazza F, Fanello C, Petrarca V, Caccone A, dellaTorre A: Variation in an intron sequence of the voltage-gatedsodium channel gene correlates with genetic differentiationbetween Anopheles gambiae s.s. molecular forms. Insect MolBiol 2004, 13:371-377.
14. Donnelly MJ, Simard F, Lehmann T: Evolutionary studies ofmalaria vectors. Trends Parasitol 2002, 18:75-80.
15. Krzywinski J, Besansky NJ: Molecular systematics of Anopheles :from subgenera to subpopulations. Annu Rev Entomol 2003,48:111-139.
16. Wondji C, Simard F, Fontenille D: Evidence for genetic differen-tiation between the molecular forms M and S within the For-
est chromosomal form of Anopheles gambiae in an area ofsympatry. Insect Mol Biol 2002, 11:11-19.
17. Lehmann T, Hawley WA, Kamau L, Fontenille D, Simard F, Collins FH:Genetic differentiation of Anopheles gambiae populationsfrom East and west Africa: comparison of microsatellite andallozyme loci. Heredity 1996, 77(Pt 2):192-200.
18. Pinto J, Donnelly MJ, Sousa CA, Gil V, Ferreira C, Elissa N, Do RosarioVE, Charlwood JD: Genetic structure of Anopheles gambiae(Diptera: Culicidae) in Sao Tome and Principe (WestAfrica): implications for malaria control. Mol Ecol 2002,11:2183-2187.
19. Simard F, Fontenille D, Lehmann T, Girod R, Brutus L, Gopaul R,Dournon C, Collins FH: High amounts of genetic differentiationbetween populations of the malaria vector Anopheles arabi-ensis from West Africa and eastern outer islands. Am J TropMed Hyg 1999, 60:1000-1009.
20. Slotman MA, Mendez MM, Torre AD, Dolo G, Toure YT, Caccone A:Genetic differentiation between the BAMAKO andSAVANNA chromosomal forms of Anopheles gambiae asindicated by amplified fragment length polymorphism anal-ysis. Am J Trop Med Hyg 2006, 74:641-648.
21. Slotman MA, Tripet F, Cornel AJ, Meneses CR, Lee Y, Reimer LJ,Thiemann TC, Fondjo E, Fofana A, Traore SF, Lanzaro GC: Evidencefor subdivision within the M molecular form of Anophelesgambiae. Mol Ecol 2007, 16:639-649.
22. Berzosa PJ, Cano J, Roche J, Rubio JM, Garcia L, Moyano E, Guerra A,Mateos JC, Petrarca V, Rosario VE, Benito A: Malaria vectors inBioko Island (Equatorial Guinea): PCR determination of themembers of Anopheles gambiae Giles complex (Diptera:Culicidae) and pyrethroid knockdown resistance (kdr) in An.gambiae sensu stricto. J Vector Ecol 2002, 27:102-106.
23. Pardo G, Descalzo MA, Molina L, Custodio E, Lwanga M, Mangue C,Obono J, Nchama A, Roche J, Benito A, Cano J: Impact of differentstrategies to control Plasmodium infection and anaemia onthe island of Bioko (Equatorial Guinea). Malar J 2006, 5:10.
24. Kayondo J, Mukwaya L, Stump A, Michel A, Coulibaly M, Besansky N,Collins FH: Genetic structure of Anopheles gambiae popula-tions on islands in northwestern Lake Victoria, Uganda.Malar J 2005, 4:59.
25. Gillies MT, Coetzee MT: A Supplement to the Anophelinae ofAfrica south of the Sahara (Ethiopian zoogeographicalregion). S Afr Ins Med Res 1987, 2:55.
26. Collins FH, Finnerty V, Petrarca V: Ribosomal DNA-probes dif-ferentiate five cryptic species in the Anopheles gambiae com-plex. Parassitologia 1988, 30:231-240.
27. Scott JA, Brogdon WG, Collins FH: Identification of single speci-mens of the Anopheles gambiae complex by the polymerasechain reaction. Am J Trop Med Hyg 1993, 49:520-529.
28. Favia G, Lanfracotti A, Spanos L, Siden K, Louis C: Molecular char-acterization of ribosomal DNA polymorphisms discriminat-ing among chromosomal forms of Anopheles gambiae s.s.Insect Mol Biol 2001, 10:19-23.
29. Pinto J, Lynd A, Elissa N, Donnelly MJ, Costa C, Gentile G, CacconeA, do Rosario VE: Co-occurrence of East and West African kdrmutations suggests high levels of resistance to pyrethroidinsecticides in Anopheles gambiae from Libreville, Gabon.Med Vet Entomol 2006, 20:27-32.
30. Zheng L, Benedict MQ, Cornel AJ, Collins FH, Kafatos FC: An inte-grated genetic map of the African human malaria vectormosquito, Anopheles gambiae. Genetics 1996, 143:941-952.
31. Lanzaro GC, Touré YT, Carnahan J, Zheng L, Dolo G, Traoré ,Petrarca V, Vernick KD, Taylor CE: Complexities in the geneticstructure of Anopheles gambiae populations in west Africa asrevealed by microsatellite DNA analysis. Proc Natl Acad Sci USA1998, 95:14260-14265.
32. Stump AD, Shoener JA, Costantini C, Sagnon N, Besansky NJ: Sex-linked differentiation between incipient species of Anophelesgambiae. Genetics 2005, 169:1509-1519.
33. Donnelly MJ, Cuamba N, Charlwood JD, Collins FH, Townson H:Population structure in the malaria vector, Anopheles arabi-ensis Patton, in East Africa. Heredity 1999, 83(Pt 4):408-417.
34. Nei M: Molecular Evolutionary Genetics New York: Columbia UniversityPress; 1987.
35. El Mousadik A, Petit R: High level of genetic differentiation forallelic richness among populations of the argan tree Argania
Page 9 of 10(page number not for citation purposes)
http://www.ncbi.nlm.nih.gov/entrez/query.fcgi?cmd=Retrieve&db=PubMed&dopt=Abstract&list_uids=9866736
http://www.ncbi.nlm.nih.gov/entrez/query.fcgi?cmd=Retrieve&db=PubMed&dopt=Abstract&list_uids=9866736
http://www.ncbi.nlm.nih.gov/entrez/query.fcgi?cmd=Retrieve&db=PubMed&dopt=Abstract&list_uids=8760401
http://www.ncbi.nlm.nih.gov/entrez/query.fcgi?cmd=Retrieve&db=PubMed&dopt=Abstract&list_uids=8760401
http://www.ncbi.nlm.nih.gov/entrez/query.fcgi?cmd=Retrieve&db=PubMed&dopt=Abstract&list_uids=8760401
http://www.ncbi.nlm.nih.gov/entrez/query.fcgi?cmd=Retrieve&db=PubMed&dopt=Abstract&list_uids=3271987
http://www.ncbi.nlm.nih.gov/entrez/query.fcgi?cmd=Retrieve&db=PubMed&dopt=Abstract&list_uids=3271987
http://www.ncbi.nlm.nih.gov/entrez/query.fcgi?cmd=Retrieve&db=PubMed&dopt=Abstract&list_uids=8214283
http://www.ncbi.nlm.nih.gov/entrez/query.fcgi?cmd=Retrieve&db=PubMed&dopt=Abstract&list_uids=8214283
http://www.ncbi.nlm.nih.gov/entrez/query.fcgi?cmd=Retrieve&db=PubMed&dopt=Abstract&list_uids=8725240
http://www.ncbi.nlm.nih.gov/entrez/query.fcgi?cmd=Retrieve&db=PubMed&dopt=Abstract&list_uids=9826688
Malaria Journal 2007, 6:137 http://www.malariajournal.com/content/6/1/137
Publish with BioMed Central and every scientist can read your work free of charge
"BioMed Central will be the most significant development for disseminating the results of biomedical research in our lifetime."
Sir Paul Nurse, Cancer Research UK
Your research papers will be:
available free of charge to the entire biomedical community
peer reviewed and published immediately upon acceptance
cited in PubMed and archived on PubMed Central
yours — you keep the copyright
Submit your manuscript here:http://www.biomedcentral.com/info/publishing_adv.asp
BioMedcentral
spinosa L.) Skeels endemic to Morocco. Theoret Appl Genet1996, 92:832-839.
36. Goudet J: FSTAT Version 1.2: A computer program to calcu-late F-statistics. J Hered 1995, 86:485.
37. Raymond M, Rousset F: GENEPOP (Version 1.2): Populationgenetics software for exact tests and ecumenism. J Hered1995, 86:248-249.
38. Cornuet JM, Luikart G: Description and power analysis of twotests for detecting recent population bottlenecks from allelefrequency data. Genetics 1996, 144:2001-2014.
39. Weir BS, Cockerham CC: Estimating F-statistics for the analysisof population structure. Evol 1984, 38:1358-1370.
40. Schneider S, Roessli D, Excoffier L: ARLEQUIN, Version 2 000: Asoftware for population genetics data analysis. 2000.
41. Rousset F: Genetic differentiation and estimation of gene flowfrom F-statistics under isolation by distance. Genetics 1997,145:1219-1228.
42. Piry S, Alapetite A, Cornuet JM, Paetkau D, Baudouin L, Estoup A:GENECLASS2: a software for genetic assignment and first-generation migrant detection. J Hered 2004, 95:536-539.
43. Rannala B, Mountain JL: Detecting immigration by using multi-locus genotypes. Proc Natl Acad Sci USA 1997, 94:9197-9201.
44. Paetkau D, Slade R, Burden M, Estoup A: Genetic assignmentmethods for the direct, real-time estimation of migrationrate: a simulation-based exploration of accuracy and power.Mol Ecol 2004, 13:55-65.
45. Pritchard JK, Stephens M, Donnelly P: Inference of populationstructure using multilocus genotype data. Genetics 2000,155:945-959.
46. Evanno G, Regnaut S, Goudet J: Detecting the number of clustersof individuals using the software STRUCTURE: a simulationstudy. Mol Ecol 2005, 14:2611-2620.
47. Holm S: A simple sequentially rejective multiple test proce-dure. Scand J Statistics 1979, 6:65-70.
48. Onyabe DY, Conn JE: Genetic differentiation of the malariavector Anopheles gambiae across Nigeria suggests that selec-tion limits gene flow. Heredity 2001, 87:647-658.
49. Yawson AE, Weetman D, Wilson MD, Donnelly MJ: Ecologicalzones rather than molecular forms predict genetic differen-tiation in the malaria vector Anopheles gambiae s.s. in Ghana.Genetics 2007, 175:751-761.
50. Gillespie RG, Roderick GK: Arthropods on islands: colonisation,speciation and conservation. Annu Rev Entomol 2002, 47:595-632.
51. Donnelly MJ, Licht MC, Lehmann T: Evidence for recent popula-tion expansion in the evolutionary history of the malaria vec-tors Anopheles arabiensis and Anopheles gambiae. Mol Biol Evol2001, 18:1353-1364.
52. Roche J, de Diego JA, Penin P, Santos M, del RJ: An epidemiologicalstudy of malaria in Bioko and Annobon islands (EquatorialGuinea). Ann Trop Med Parasitol 1991, 85:477-487.
53. Lehmann T, Hawley WA, Grebert H, Collins FH: The effectivepopulation size of Anopheles gambiae in Kenya: implicationsfor population structure. Mol Biol Evol 1998, 15:264-276.
54. Simard F, Lehmann T, Lemasson JJ, Diatta M, Fontenille D: Persist-ence of Anopheles arabiensis during the severe dry seasonconditions in Senegal: an indirect approach using microsat-ellite loci. Insect Mol Biol 2000, 9:467-479.
55. Reimer LJ, Tripet F, Slotman M, Spielman A, Fonjo E, Lanzaro GC: Anunusual distribution of the kdr gene among populations ofAnopheles gambiae on the island of Bioko, Equatorial Guinea.Insect Mol Biol 2005, 14:683-688.
56. Gentile G, della TA, Maegga B, Powell JR, Caccone A: Genetic dif-ferentiation in the African malaria vector, Anopheles gambiaes.s., and the problem of taxonomic status. Genetics 2002,161:1561-1578.
57. Boulesteix M, Simard F, Antonio-Nkondjio C, wono-Ambene HP,Fontenille D, Biemont C: Insertion polymorphism of transposa-ble elements and population structure of Anopheles gambiaeM and S molecular forms in Cameroon. Mol Ecol 2007,16:441-452.
58. Wang R, Zheng L, Touré YT, Danadekar T, Kafatos FC: Whengenetic distance matters: measuring genetic differentiationat microsatellite loci in whole genome scans of recent andincipient mosquito species. Proc Natl Acad Sci USA 2001,98:10769-10774.
59. Turner TL, Hahn MW, Nuzhdin SV: Genomic islands of specia-tion in Anopheles gambiae. PLoS Biol 2005, 3:e285.
60. Stump AD, Fitzpatrick MC, Lobo NF, Traore S, Sagnon N, CostantiniC, Collins FH, Besansky NJ: Centromere-proximal differentia-tion and speciation in Anopheles gambiae. Proc Natl Acad Sci USA2005, 102:15930-15935.
61. Slotman MA, Reimer LJ, Thiemann T, Dolo G, Fondjo E, Lanzaro GC:Reduced recombination rate and genetic differentiationbetween the M and S forms of Anopheles gambiae s.s. Genetics2006, 174:2081-2093.
62. Lounibos LP: Invasions by insect vectors of human disease.Annu Rev Entomol 2002, 47:233-266.
63. Ayala D, Goff GL, Robert V, de JP, Takken W: Population struc-ture of the malaria vector Anopheles funestus (Diptera: Culi-cidae) in Madagascar and Comoros. Acta Trop 2006,97:292-300.
Page 10 of 10(page number not for citation purposes)
http://www.ncbi.nlm.nih.gov/entrez/query.fcgi?cmd=Retrieve&db=PubMed&dopt=Abstract&list_uids=8978083
http://www.ncbi.nlm.nih.gov/entrez/query.fcgi?cmd=Retrieve&db=PubMed&dopt=Abstract&list_uids=8978083
http://www.ncbi.nlm.nih.gov/entrez/query.fcgi?cmd=Retrieve&db=PubMed&dopt=Abstract&list_uids=8978083
http://www.ncbi.nlm.nih.gov/entrez/query.fcgi?cmd=Retrieve&db=PubMed&dopt=Abstract&list_uids=9093870
http://www.ncbi.nlm.nih.gov/entrez/query.fcgi?cmd=Retrieve&db=PubMed&dopt=Abstract&list_uids=9093870
http://www.ncbi.nlm.nih.gov/entrez/query.fcgi?cmd=Retrieve&db=PubMed&dopt=Abstract&list_uids=9256459
http://www.ncbi.nlm.nih.gov/entrez/query.fcgi?cmd=Retrieve&db=PubMed&dopt=Abstract&list_uids=9256459
http://www.ncbi.nlm.nih.gov/entrez/query.fcgi?cmd=Retrieve&db=PubMed&dopt=Abstract&list_uids=1809240
http://www.ncbi.nlm.nih.gov/entrez/query.fcgi?cmd=Retrieve&db=PubMed&dopt=Abstract&list_uids=1809240
http://www.ncbi.nlm.nih.gov/entrez/query.fcgi?cmd=Retrieve&db=PubMed&dopt=Abstract&list_uids=1809240
http://www.ncbi.nlm.nih.gov/entrez/query.fcgi?cmd=Retrieve&db=PubMed&dopt=Abstract&list_uids=9501493
Related Documents