General framework of European Initiatives for Biofuels May 2004 Dr. Giuliano GRASSI EUBIA Secretary General [email protected] www.eubia.org T. +32 (0) 2 28 28 420 F. +32 (0) 2 28 28 424 Rond Point Schuman, 6 B-1040 Brussels Belgium European Biomass Industry Association

Welcome message from author
This document is posted to help you gain knowledge. Please leave a comment to let me know what you think about it! Share it to your friends and learn new things together.
Transcript
General framework of
European Initiatives for
Biofuels
May 2004
Dr. Giuliano GRASSIEUBIA Secretary General
T. +32 (0) 2 28 28 420F. +32 (0) 2 28 28 424
Rond Point Schuman, 6B-1040 Brussels Belgium
European Biomass Industry Association
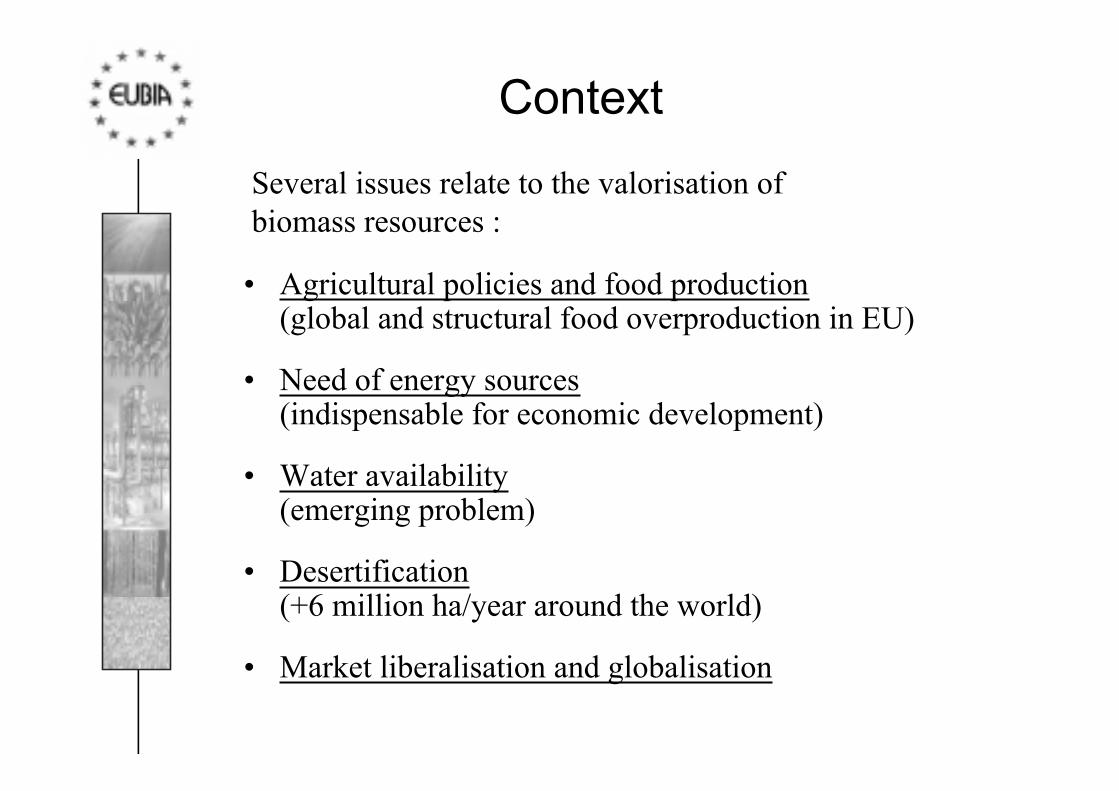
Several issues relate to the valorisation ofbiomass resources :
¥ Agricultural policies and food production(global and structural food overproduction in EU)
¥ Need of energy sources(indispensable for economic development)
¥ Water availability(emerging problem)
¥ Desertification(+6 million ha/year around the world)
¥ Market liberalisation and globalisation
Context
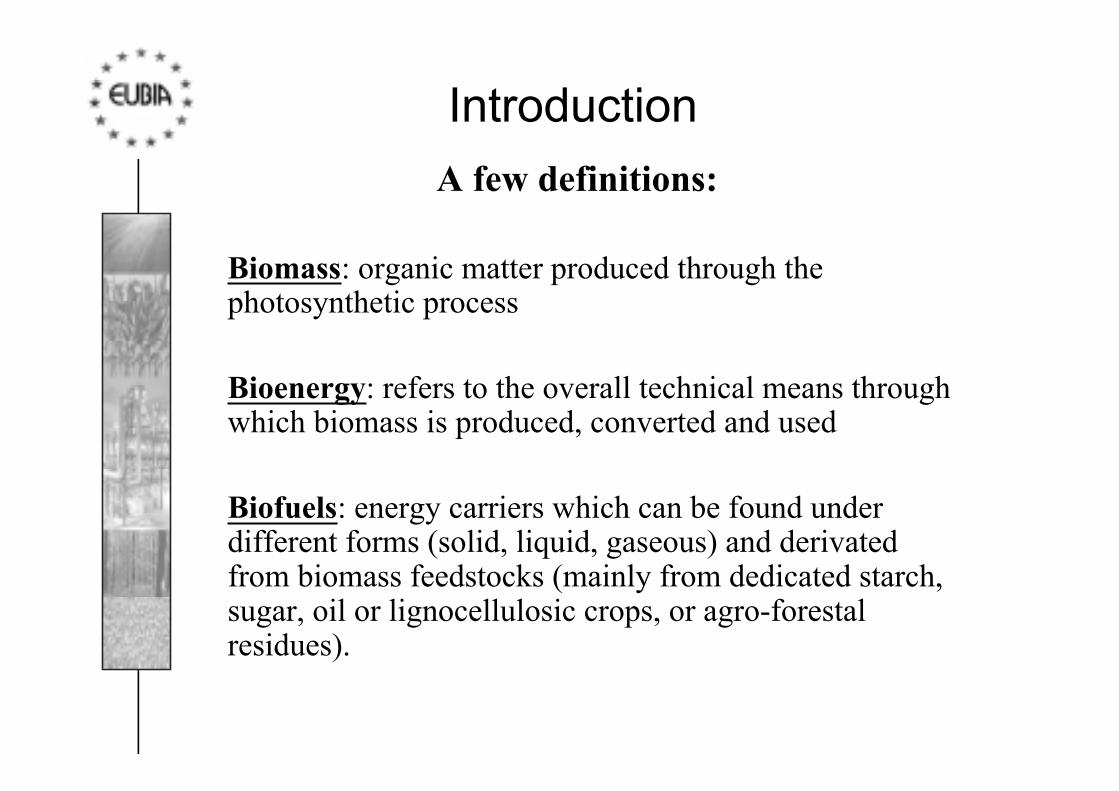
Biomass: organic matter produced through thephotosynthetic process
Bioenergy: refers to the overall technical means throughwhich biomass is produced, converted and used
Biofuels: energy carriers which can be found underdifferent forms (solid, liquid, gaseous) and derivatedfrom biomass feedstocks (mainly from dedicated starch,sugar, oil or lignocellulosic crops, or agro-forestalresidues).
Introduction
A few definitions:
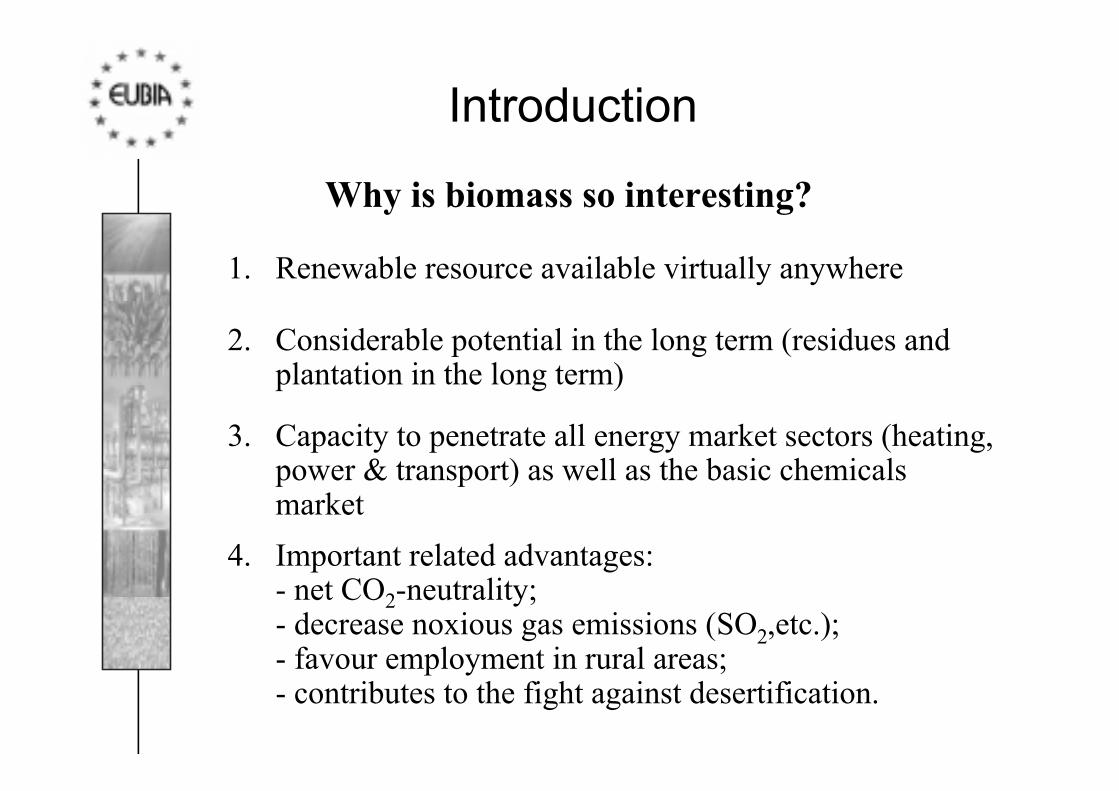
Why is biomass so interesting?
1. Renewable resource available virtually anywhere
2. Considerable potential in the long term (residues andplantation in the long term)
3. Capacity to penetrate all energy market sectors (heating,power & transport) as well as the basic chemicalsmarket
4. Important related advantages:- net CO2-neutrality;- decrease noxious gas emissions (SO2,etc.);- favour employment in rural areas;- contributes to the fight against desertification.
Introduction
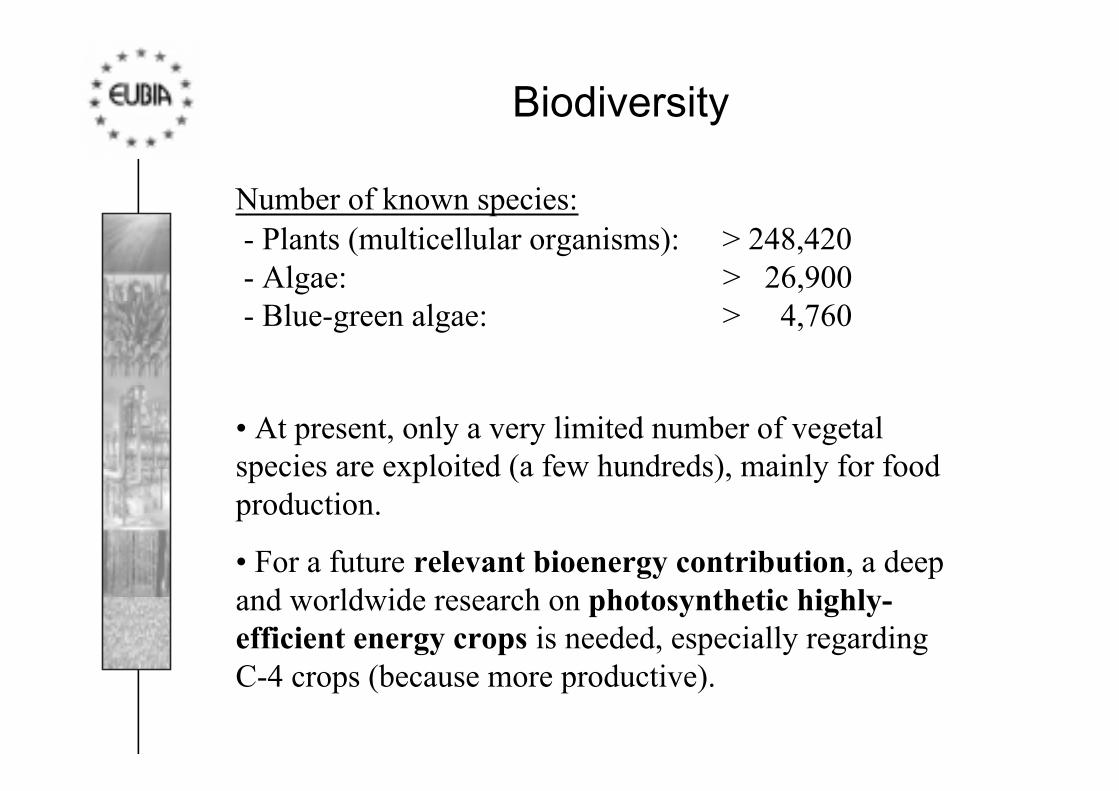
Biodiversity
- Plants (multicellular organisms): > 248,420- Algae: > 26,900- Blue-green algae: > 4,760
Number of known species:
¥ At present, only a very limited number of vegetalspecies are exploited (a few hundreds), mainly for foodproduction.
¥ For a future relevant bioenergy contribution, a deepand worldwide research on photosynthetic highly-efficient energy crops is needed, especially regardingC-4 crops (because more productive).
Biodiversity
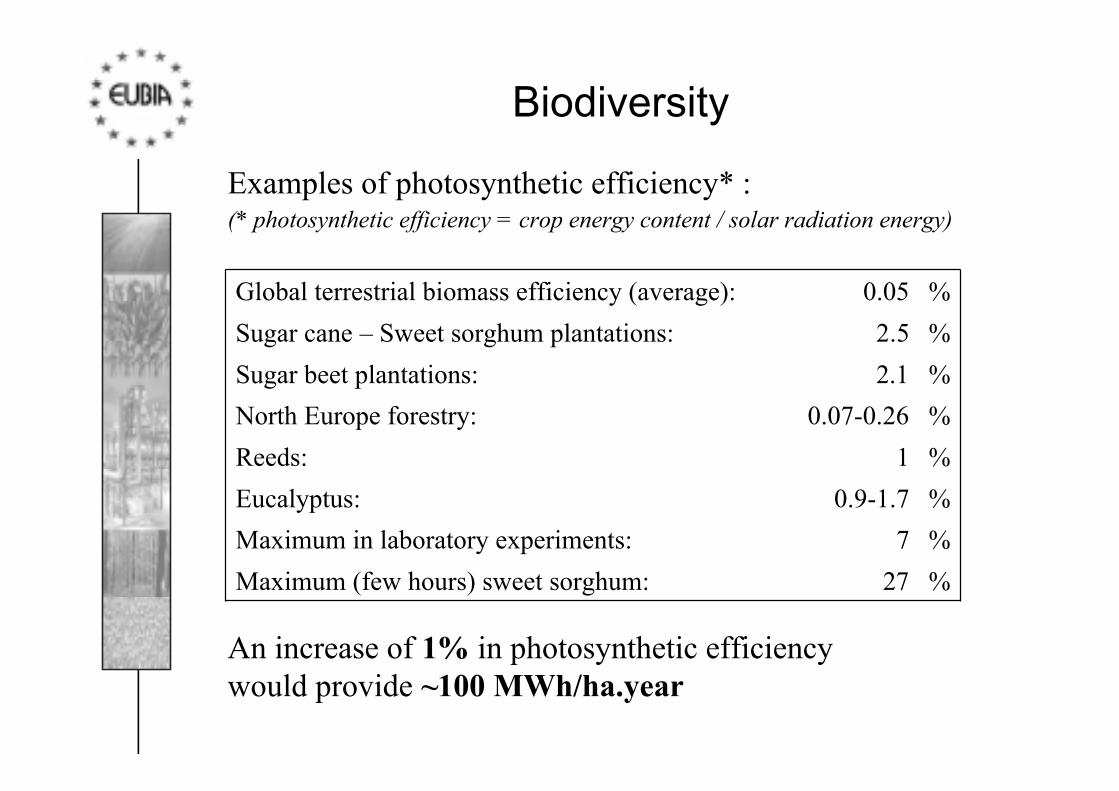
Examples of photosynthetic efficiency* :(* photosynthetic efficiency = crop energy content / solar radiation energy)
%27Maximum (few hours) sweet sorghum:
7
0.9-1.7
1
0.07-0.26
2.1
2.5
0.05
%Maximum in laboratory experiments:
%Eucalyptus:
%Reeds:
%North Europe forestry:
%Sugar beet plantations:
%Sugar cane Ð Sweet sorghum plantations:
%Global terrestrial biomass efficiency (average):
An increase of 1% in photosynthetic efficiencywould provide ~100 MWh/ha.year
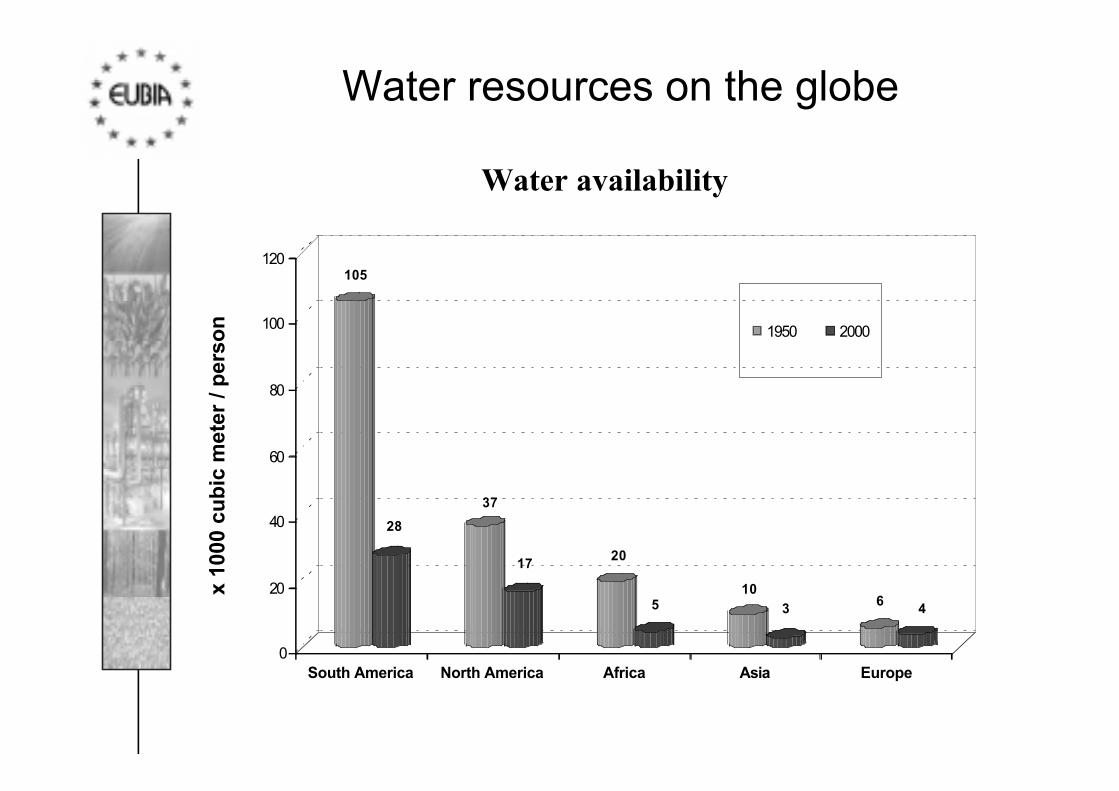
Water resources on the globe
Water availability
105
28
37
1720
510
3 6 4
0
20
40
60
80
100
120
South America North America Africa Asia Europe
1950 2000
x 10
00 c
ub
ic m
eter
/ p
erso
n
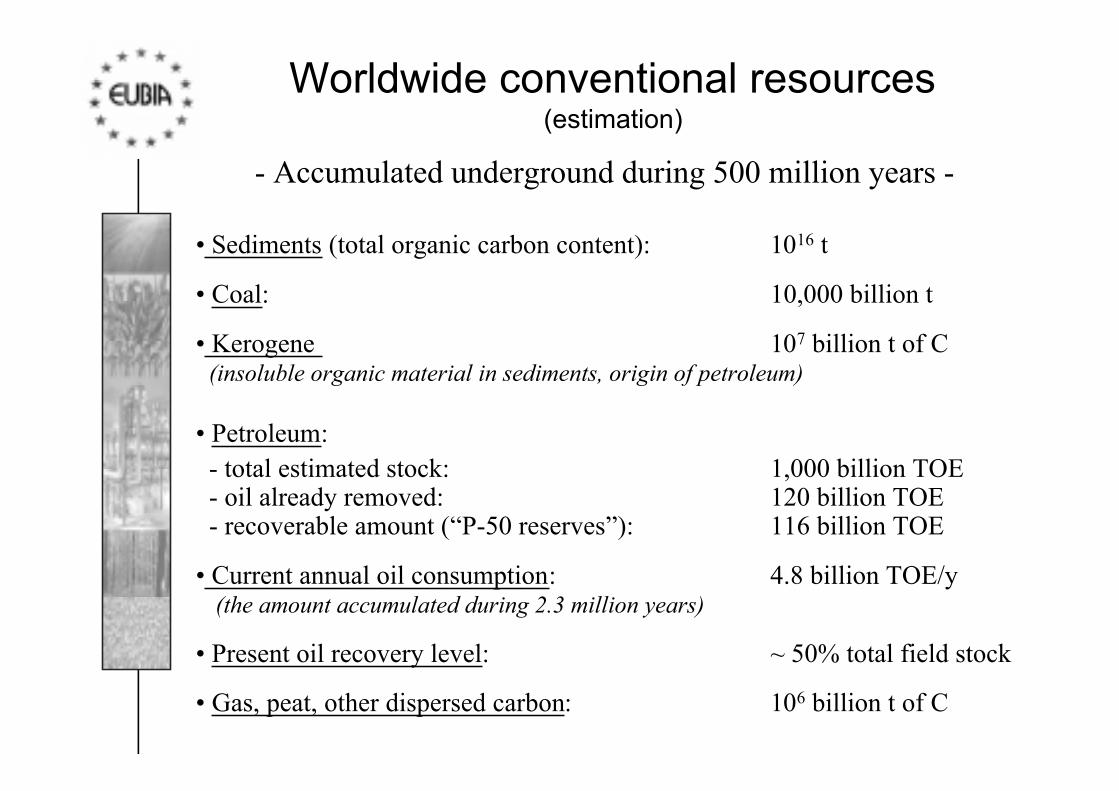
Worldwide conventional resources(estimation)
- Accumulated underground during 500 million years -
¥ Sediments (total organic carbon content): 1016 t
¥ Coal: 10,000 billion t
¥ Kerogene 107 billion t of C (insoluble organic material in sediments, origin of petroleum)
¥ Petroleum: - total estimated stock: 1,000 billion TOE - oil already removed: 120 billion TOE - recoverable amount (ÒP-50 reservesÓ): 116 billion TOE
¥ Current annual oil consumption: 4.8 billion TOE/y (the amount accumulated during 2.3 million years)
¥ Present oil recovery level: ~ 50% total field stock
¥ Gas, peat, other dispersed carbon: 106 billion t of C
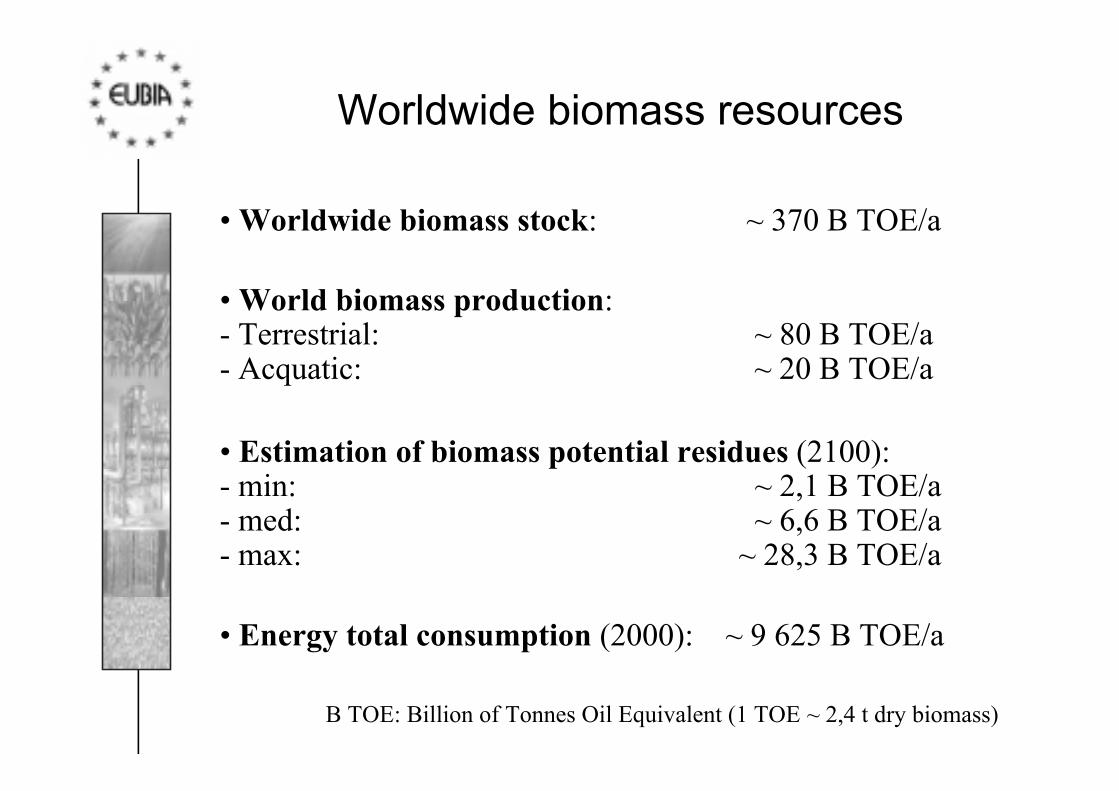
Worldwide biomass resources
¥ World biomass production:- Terrestrial: ~ 80 B TOE/a- Acquatic: ~ 20 B TOE/a
¥ Worldwide biomass stock: ~ 370 B TOE/a
¥ Estimation of biomass potential residues (2100):- min: ~ 2,1 B TOE/a- med: ~ 6,6 B TOE/a- max: ~ 28,3 B TOE/a
¥ Energy total consumption (2000): ~ 9 625 B TOE/a
B TOE: Billion of Tonnes Oil Equivalent (1 TOE ~ 2,4 t dry biomass)
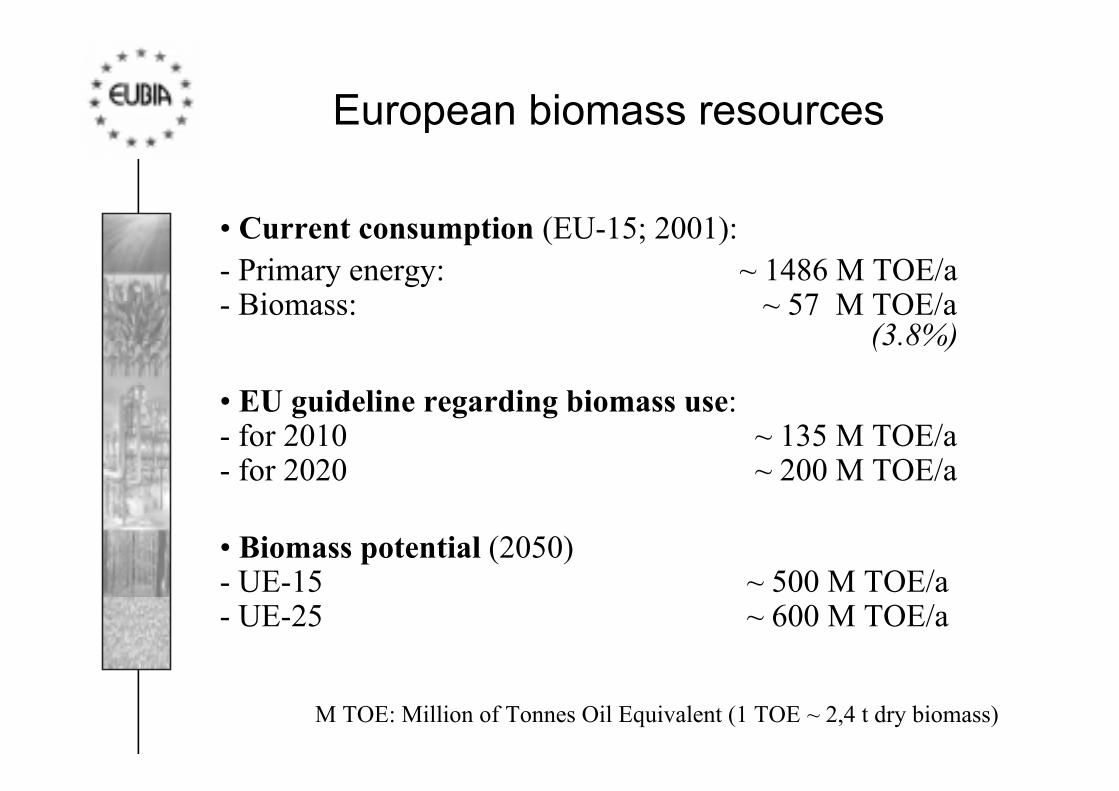
European biomass resources
¥ Biomass potential (2050)- UE-15 ~ 500 M TOE/a- UE-25 ~ 600 M TOE/a
¥ EU guideline regarding biomass use:- for 2010 ~ 135 M TOE/a- for 2020 ~ 200 M TOE/a
¥ Current consumption (EU-15; 2001):- Primary energy: ~ 1486 M TOE/a- Biomass: ~ 57 M TOE/a
M TOE: Million of Tonnes Oil Equivalent (1 TOE ~ 2,4 t dry biomass)
(3.8%)
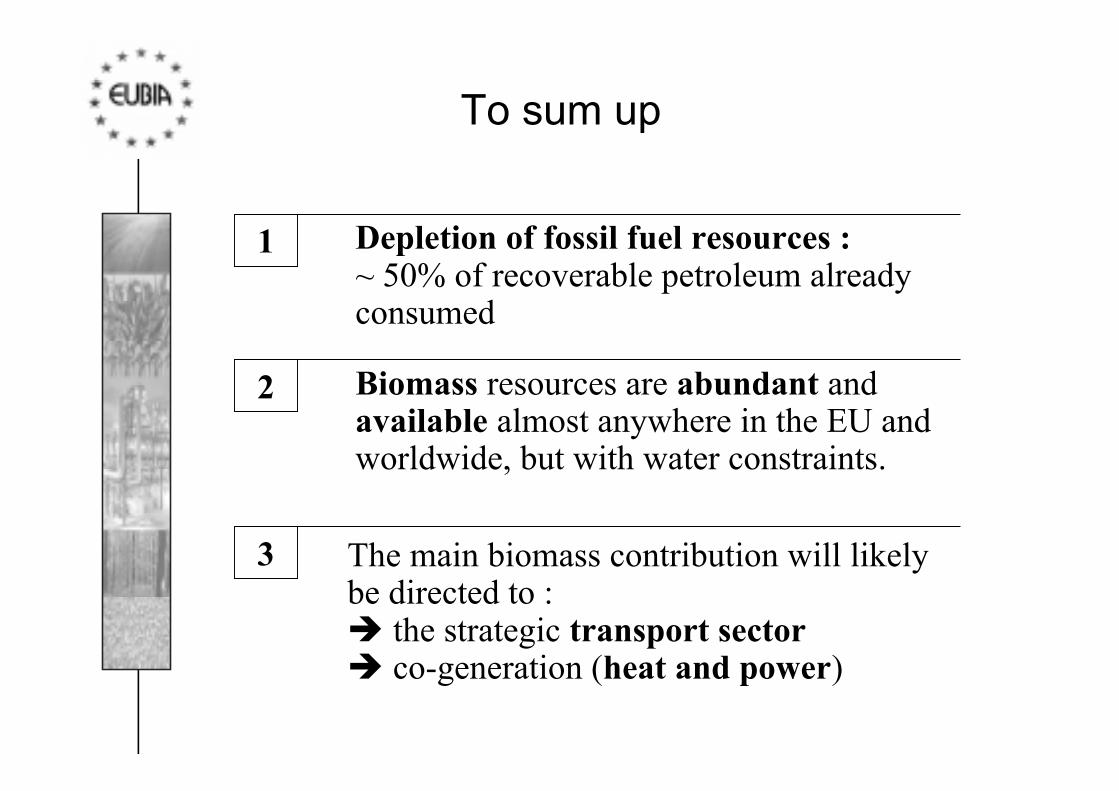
To sum up
Biomass resources are abundant andavailable almost anywhere in the EU andworldwide, but with water constraints.
The main biomass contribution will likelybe directed to :è the strategic transport sectorè co-generation (heat and power)
2
3
1 Depletion of fossil fuel resources :~ 50% of recoverable petroleum alreadyconsumed
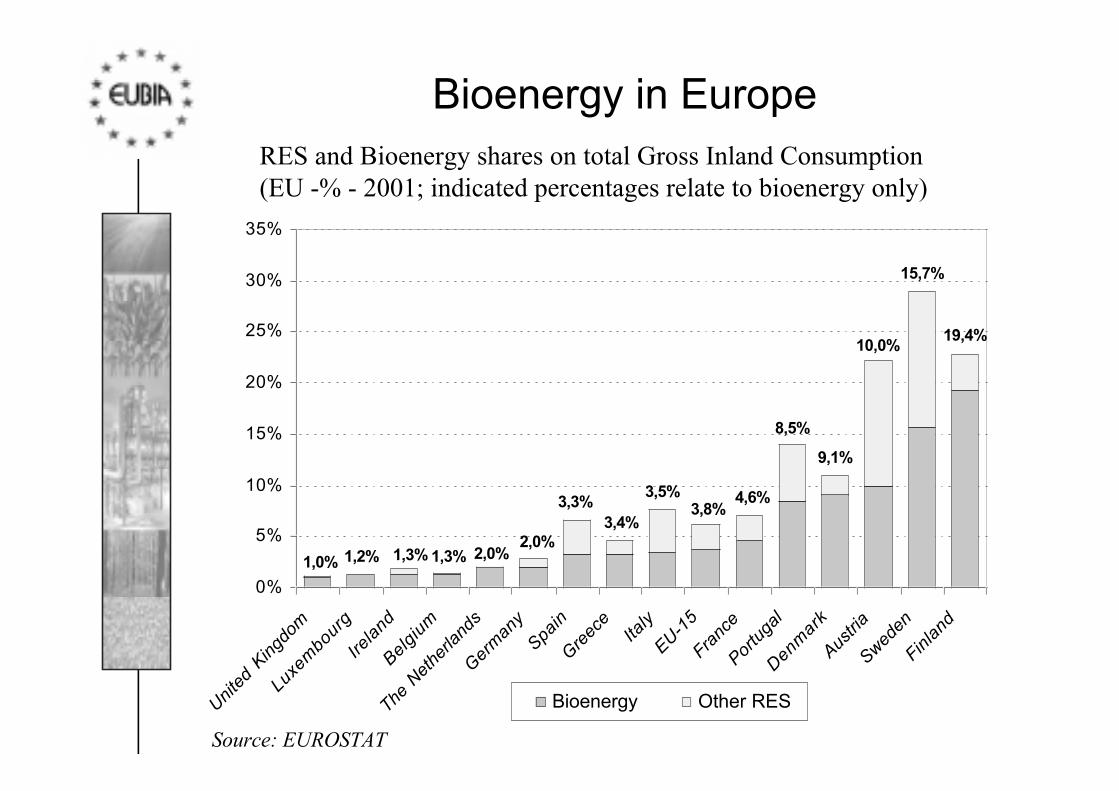
Bioenergy in EuropeRES and Bioenergy shares on total Gross Inland Consumption(EU -% - 2001; indicated percentages relate to bioenergy only)
Source: EUROSTAT
1,0% 1,2% 1,3% 1,3% 2,0%2,0%
3,3%3,4%
3,5%3,8%
4,6%
8,5%
9,1%
10,0%
15,7%
19,4%
0%
5%
10%
15%
20%
25%
30%
35%
Unite
d Kin
gdom
Luxem
bourgIre
land
Belgiu
m
The N
ethe
rland
sG
erm
any
Spain
Greec
e
Italy
EU-15
Franc
ePor
tuga
lDenm
arkAus
tria
Sweden
Finla
nd
Bioenergy Other RES
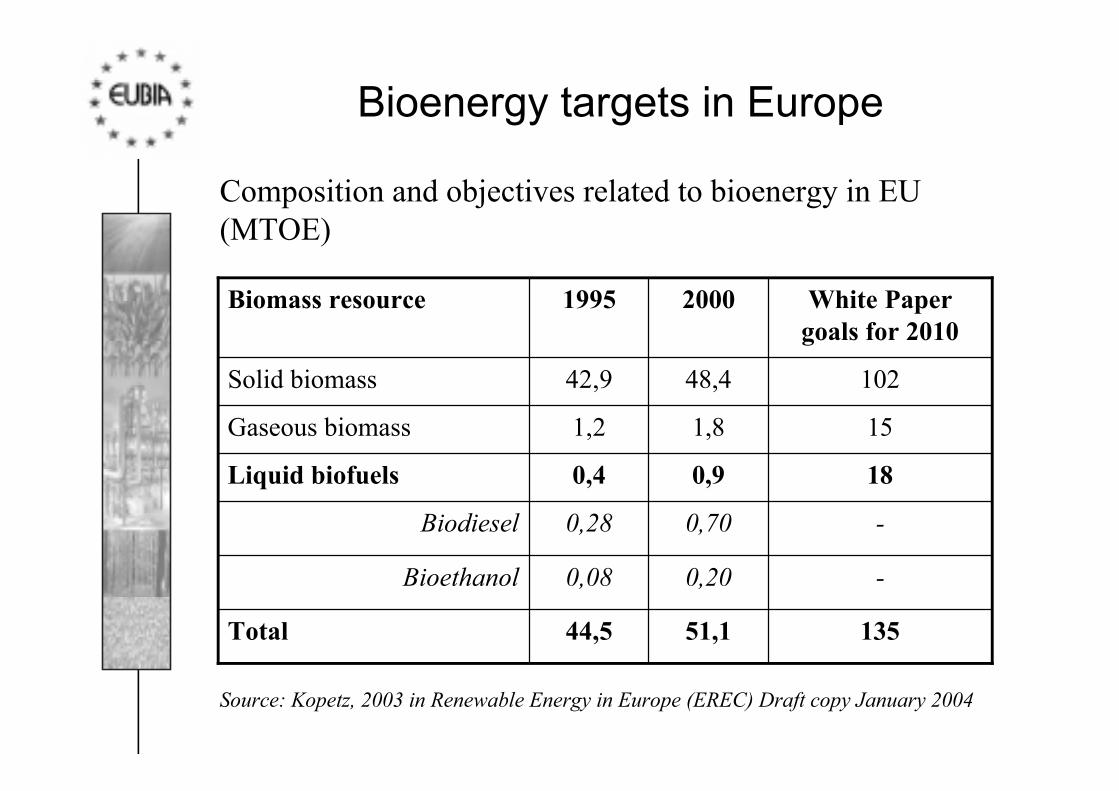
Bioenergy targets in Europe
13551,144,5Total
-0,200,08Bioethanol
-0,700,28Biodiesel
180,90,4Liquid biofuels
151,81,2Gaseous biomass
10248,442,9Solid biomass
White Papergoals for 2010
20001995Biomass resource
Composition and objectives related to bioenergy in EU(MTOE)
Source: Kopetz, 2003 in Renewable Energy in Europe (EREC) Draft copy January 2004
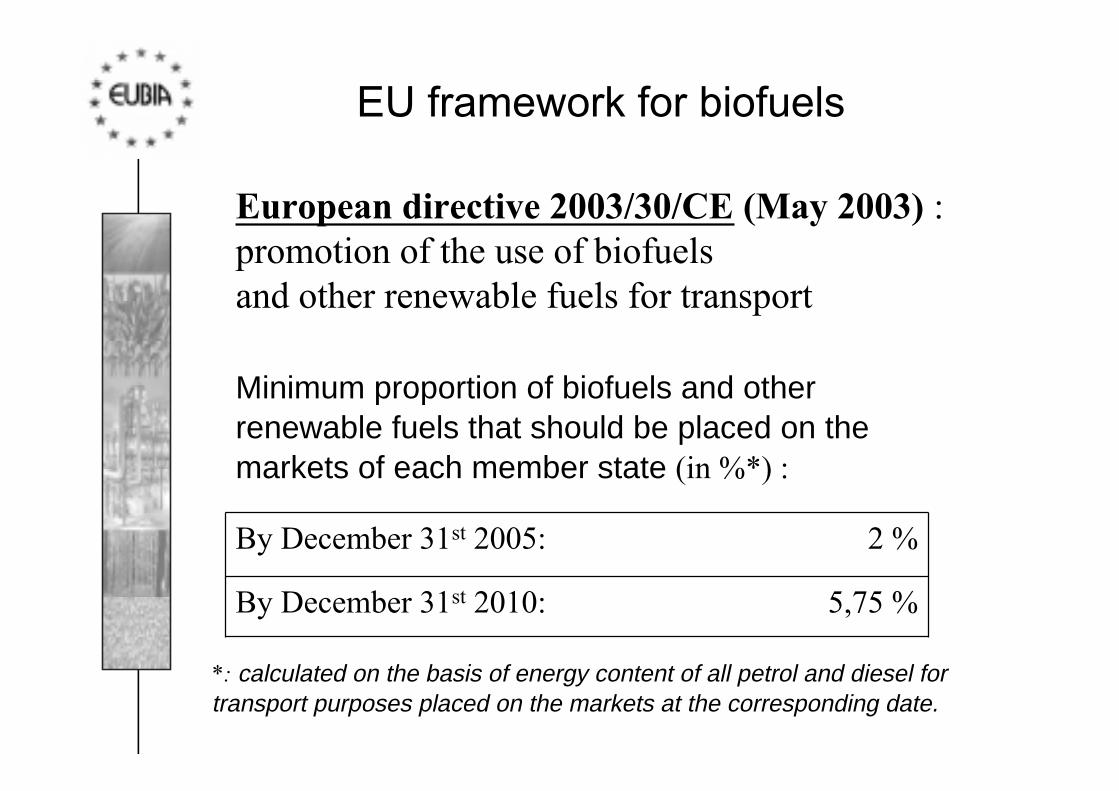
EU framework for biofuels
European directive 2003/30/CE (May 2003) :promotion of the use of biofuelsand other renewable fuels for transport
Minimum proportion of biofuels and otherrenewable fuels that should be placed on themarkets of each member state (in %*) :
5,75 %
2 %
By December 31st 2010:
By December 31st 2005:
*: calculated on the basis of energy content of all petrol and diesel fortransport purposes placed on the markets at the corresponding date.
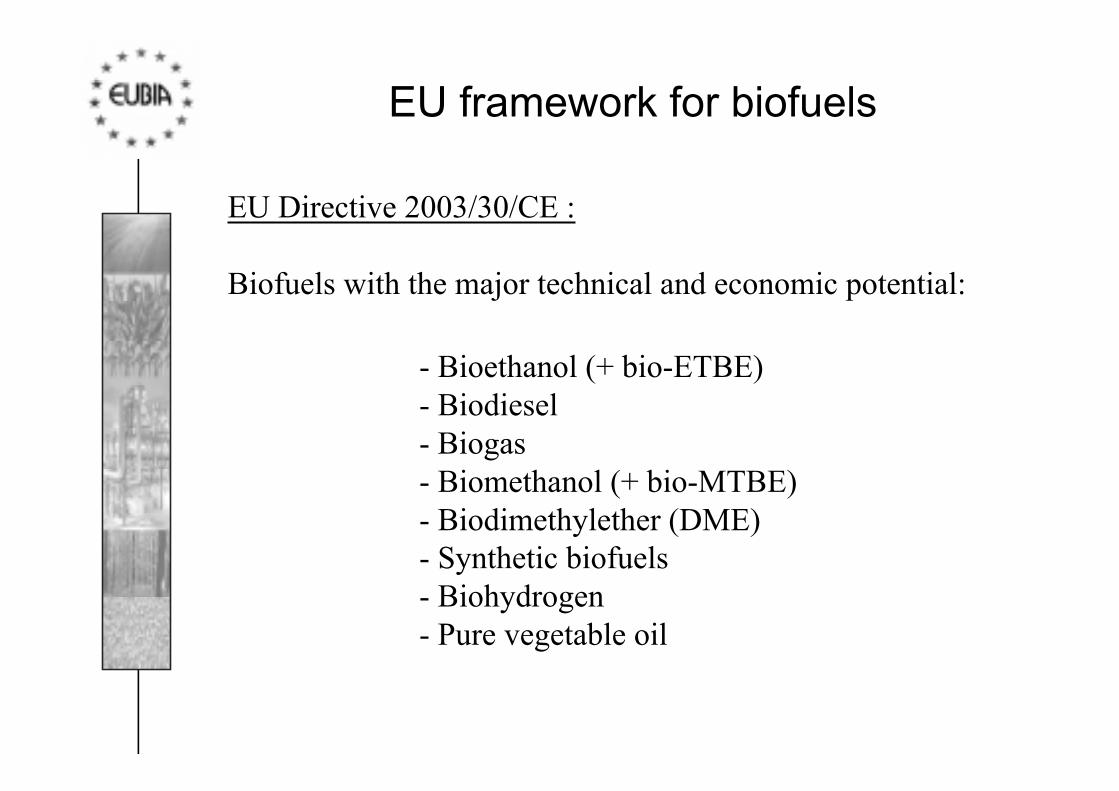
EU framework for biofuels
- Bioethanol (+ bio-ETBE)- Biodiesel- Biogas- Biomethanol (+ bio-MTBE)- Biodimethylether (DME)- Synthetic biofuels- Biohydrogen- Pure vegetable oil
EU Directive 2003/30/CE :
Biofuels with the major technical and economic potential:
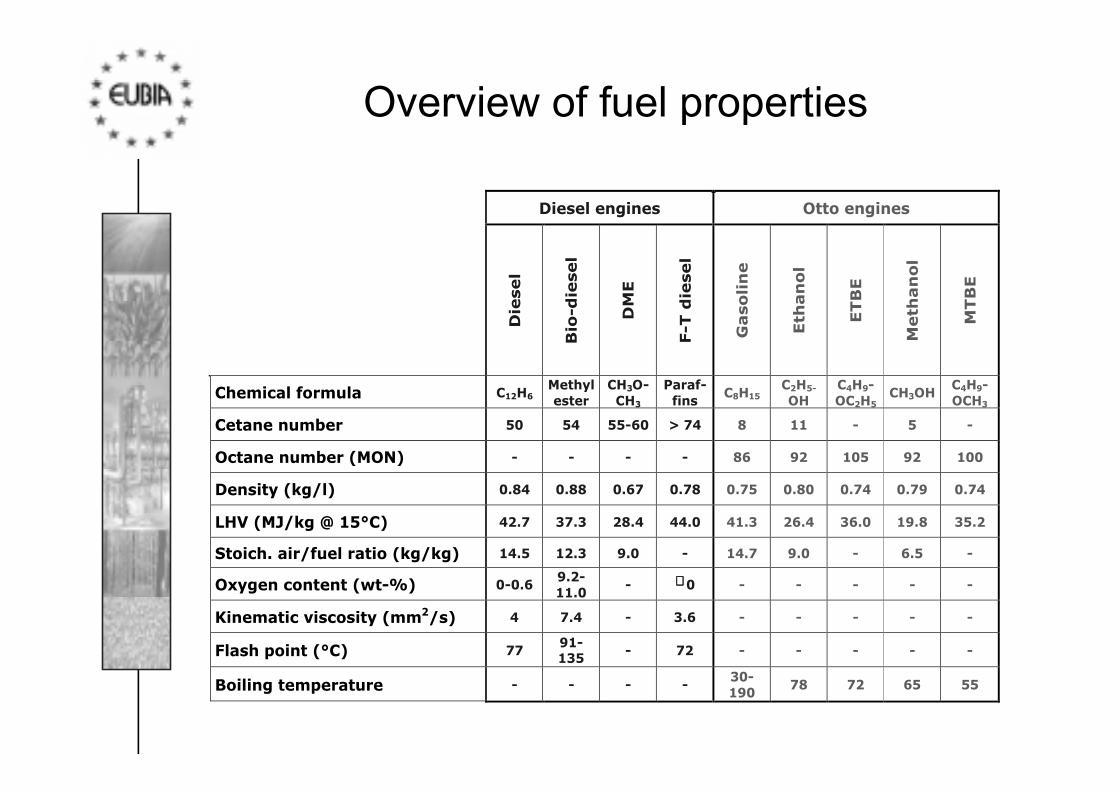
Overview of fuel properties
Diesel engines Otto engines
Die
sel
Bio
-die
sel
DM
E
F-T
die
sel
Gaso
lin
e
Eth
an
ol
ETB
E
Meth
an
ol
MTB
E
Chemical formula C12H6 Methyl ester
CH3O-CH3
Paraf-fins
C8H15 C2H5-
OH C4H9-OC2H5
CH3OH C4H9-OCH3
Cetane number 50 54 55-60 > 74 8 11 - 5 -
Octane number (MON) - - - - 86 92 105 92 100
Density (kg/l) 0.84 0.88 0.67 0.78 0.75 0.80 0.74 0.79 0.74
LHV (MJ/kg @ 15¡C) 42.7 37.3 28.4 44.0 41.3 26.4 36.0 19.8 35.2
Stoich. air/fuel ratio (kg/kg) 14.5 12.3 9.0 - 14.7 9.0 - 6.5 -
Oxygen content (wt-%) 0-0.6 9.2-11.0
- ∼∼∼∼ 0 - - - - -
Kinematic viscosity (mm2/s) 4 7.4 - 3.6 - - - - -
Flash point (¡C) 77 91-135 - 72 - - - - -
Boiling temperature - - - - 30-190
78 72 65 55
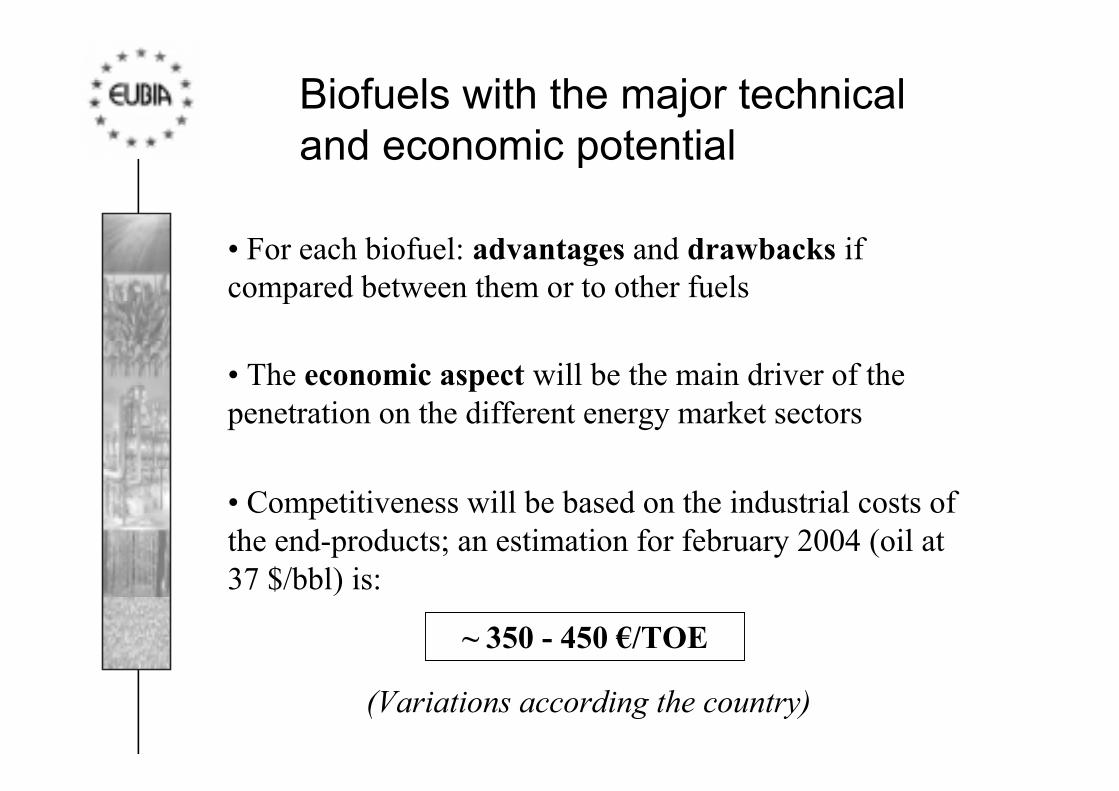
Biofuels with the major technicaland economic potential
¥ For each biofuel: advantages and drawbacks ifcompared between them or to other fuels
¥ The economic aspect will be the main driver of thepenetration on the different energy market sectors
¥ Competitiveness will be based on the industrial costs ofthe end-products; an estimation for february 2004 (oil at37 $/bbl) is:
(Variations according the country)
~ 350 - 450 Û/TOE
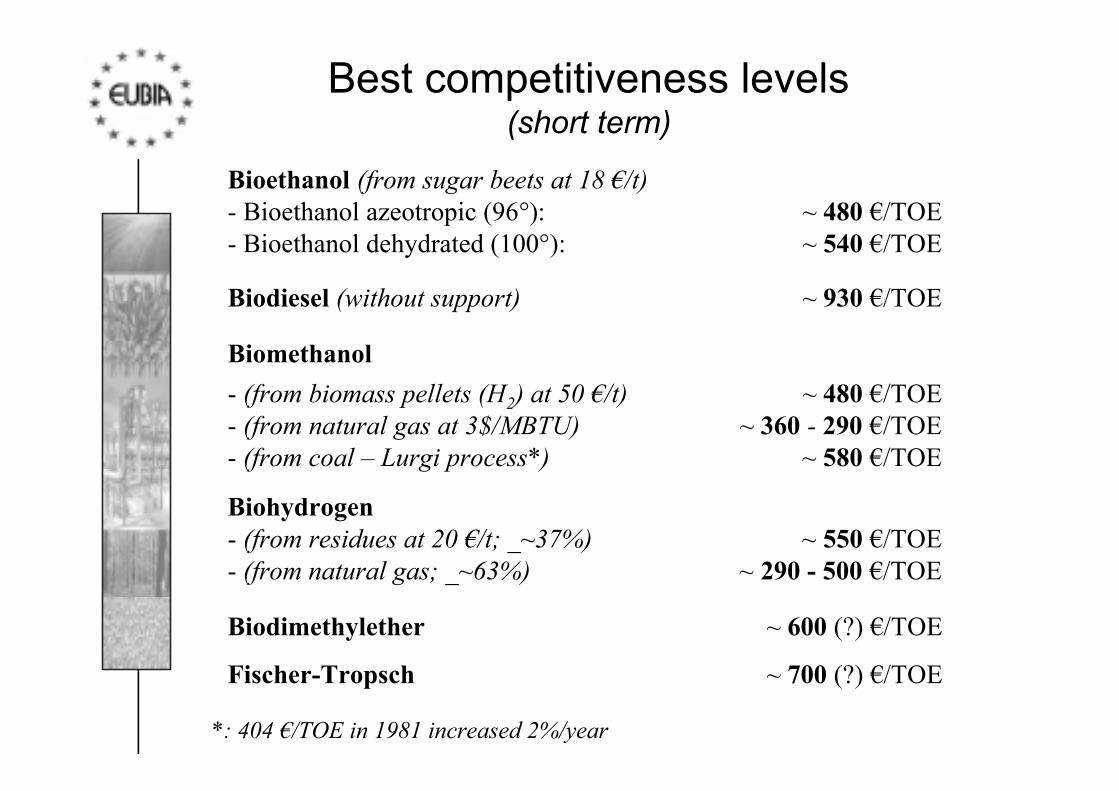
Best competitiveness levels(short term)
Bioethanol (from sugar beets at 18 Û/t)- Bioethanol azeotropic (96¡): ~ 480 Û/TOE- Bioethanol dehydrated (100¡): ~ 540 Û/TOE
Biodiesel (without support) ~ 930 Û/TOE
Biomethanol
- (from biomass pellets (H2) at 50 Û/t) ~ 480 Û/TOE- (from natural gas at 3$/MBTU) ~ 360 - 290 Û/TOE
Biohydrogen- (from residues at 20 Û/t; _~37%) ~ 550 Û/TOE- (from natural gas; _~63%) ~ 290 - 500 Û/TOE
Biodimethylether ~ 600 (?) Û/TOE
- (from coal Ð Lurgi process*) ~ 580 Û/TOE
*: 404 Û/TOE in 1981 increased 2%/year
Fischer-Tropsch ~ 700 (?) Û/TOE
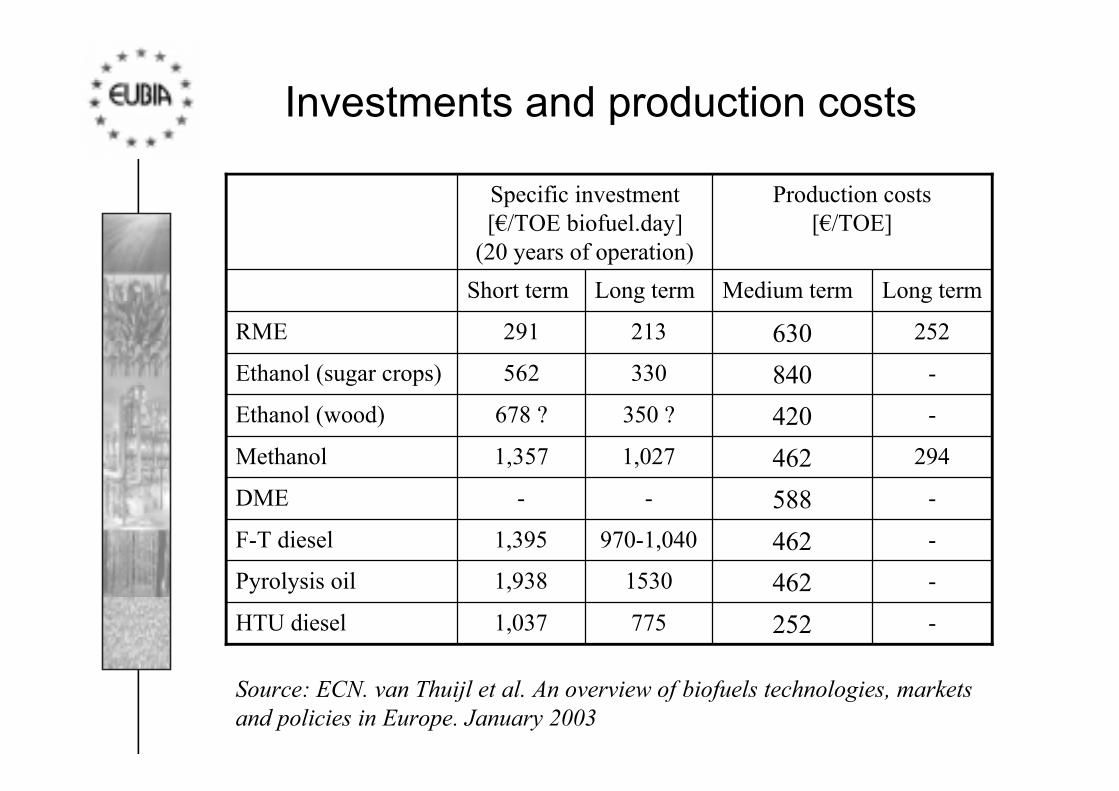
Investments and production costs
-2527751,037HTU diesel
-46215301,938Pyrolysis oil
-462970-1,0401,395F-T diesel
-588--DME
2944621,0271,357Methanol
-420350 ?678 ?Ethanol (wood)
-840330562Ethanol (sugar crops)
252630213291RME
Long termMedium termLong termShort term
Production costs[Û/TOE]
Specific investment[Û/TOE biofuel.day]
(20 years of operation)
Source: ECN. van Thuijl et al. An overview of biofuels technologies, marketsand policies in Europe. January 2003
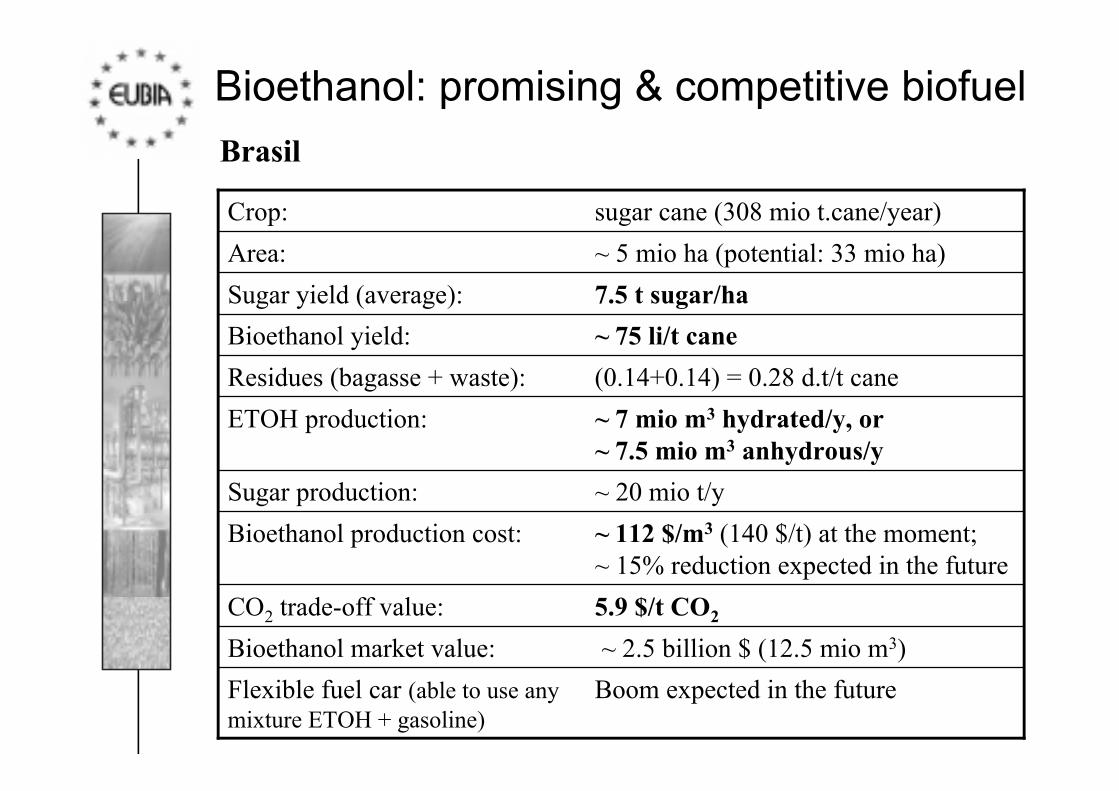
Bioethanol: promising & competitive biofuel
Brasil
Boom expected in the futureFlexible fuel car (able to use anymixture ETOH + gasoline)
~ 2.5 billion $ (12.5 mio m3)Bioethanol market value:
5.9 $/t CO2CO2 trade-off value:
~ 112 $/m3 (140 $/t) at the moment;~ 15% reduction expected in the future
Bioethanol production cost:
~ 20 mio t/ySugar production:
~ 7 mio m3 hydrated/y, or~ 7.5 mio m3 anhydrous/y
ETOH production:
(0.14+0.14) = 0.28 d.t/t caneResidues (bagasse + waste):
~ 75 li/t caneBioethanol yield:
7.5 t sugar/haSugar yield (average):
~ 5 mio ha (potential: 33 mio ha)Area:
sugar cane (308 mio t.cane/year)Crop:
Bioethanol: promising & competitive biofuel
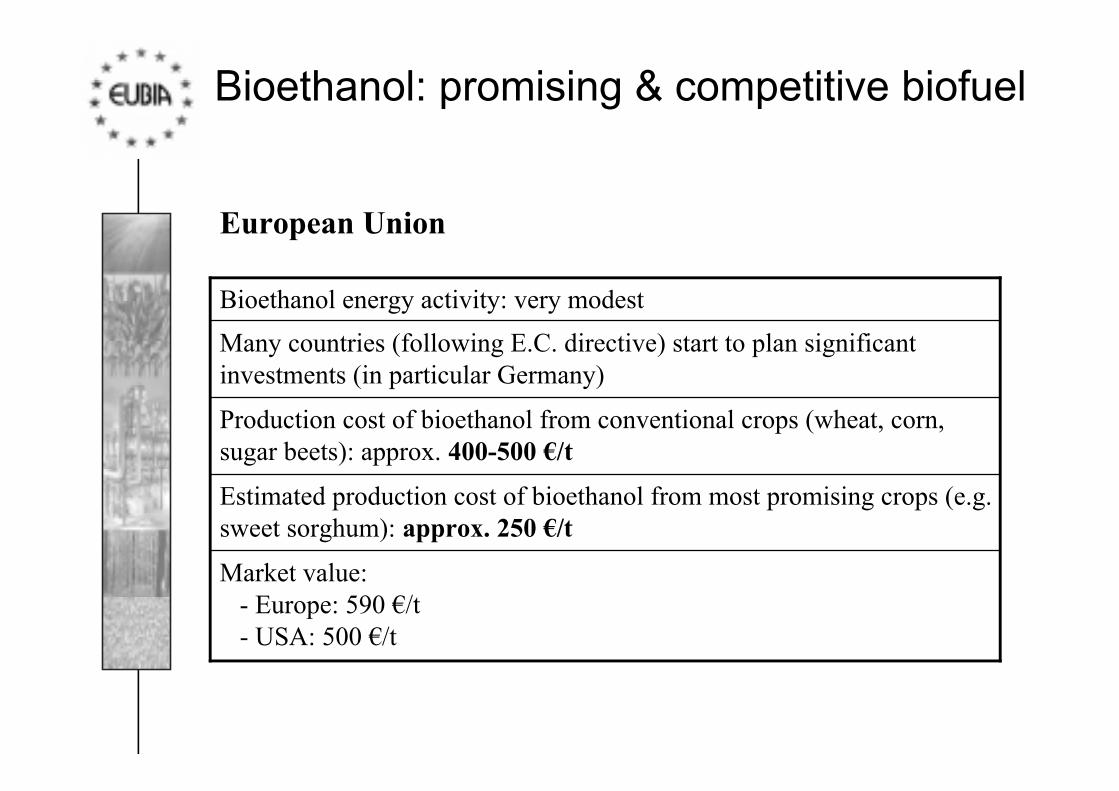
European Union
Market value: - Europe: 590 Û/t - USA: 500 Û/t
Estimated production cost of bioethanol from most promising crops (e.g.sweet sorghum): approx. 250 Û/t
Production cost of bioethanol from conventional crops (wheat, corn,sugar beets): approx. 400-500 Û/t
Many countries (following E.C. directive) start to plan significantinvestments (in particular Germany)
Bioethanol energy activity: very modest
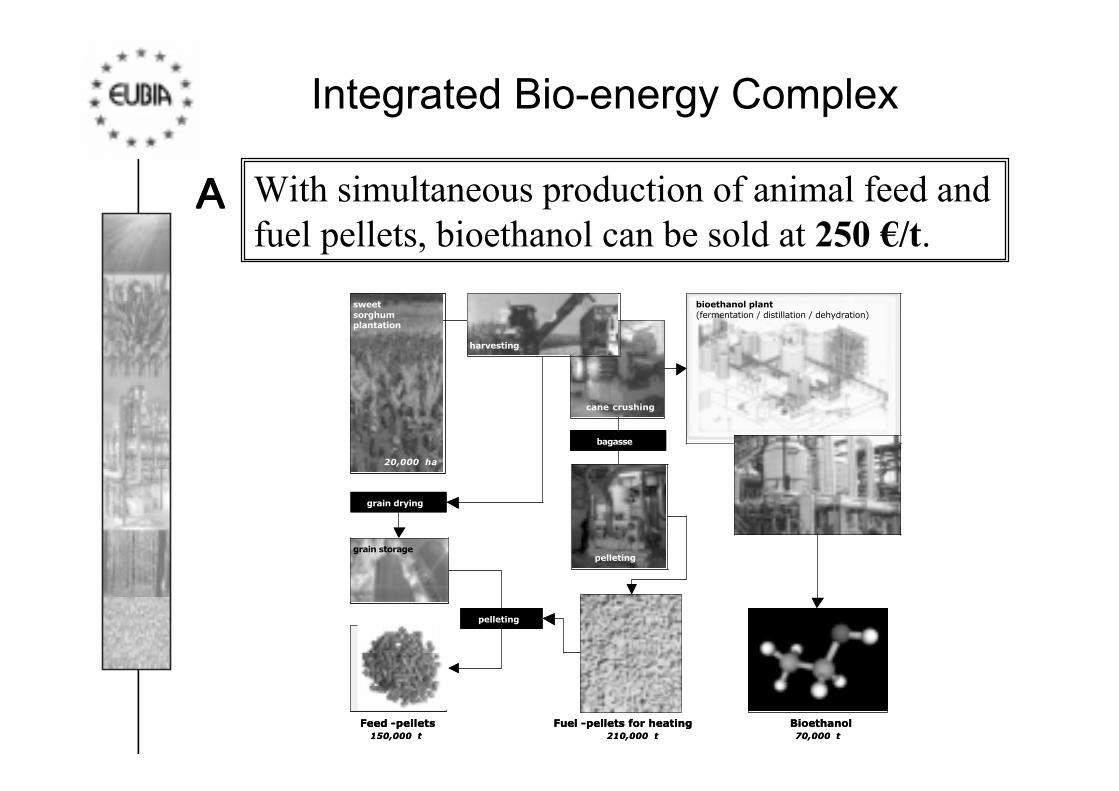
Integrated Bio-energy Complex
With simultaneous production of animal feed andfuel pellets, bioethanol can be sold at 250 Û/t.
ΑΑΑΑ
Fuel -pellets for heating BioethanolFeed -pellets150,000 t 210,000 t 70,000 t
sweet sorghum plantation
harvesting
cane crushing
grain storage
grain drying
pelleting
bagasse
pelleting
bioethanol plant(fermentation / distillation / dehydration)
20,000 ha
Fuel -pellets for heating BioethanolFeed -pellets150,000 t 210,000 t 70,000 t
sweet sorghum plantation
sweet sorghum plantation
harvesting
cane crushing
grain storagegrain storage
grain drying
pelleting
bagasse
pelleting
bioethanol plant(fermentation / distillation / dehydration)
20,000 ha
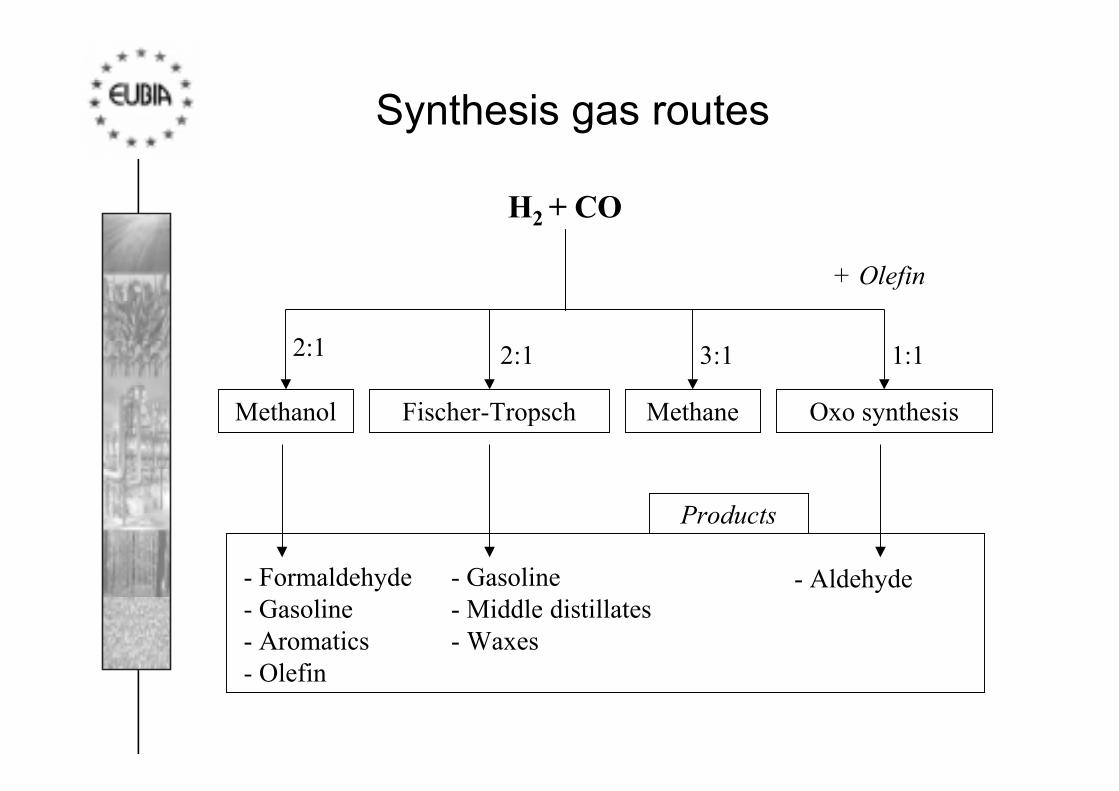
Synthesis gas routes
H2 + CO
2:1 3:12:1
Methanol Fischer-Tropsch Methane Oxo synthesis
1:1
+ Olefin
Products
- Formaldehyde- Gasoline- Aromatics- Olefin
- Gasoline- Middle distillates- Waxes
- Aldehyde
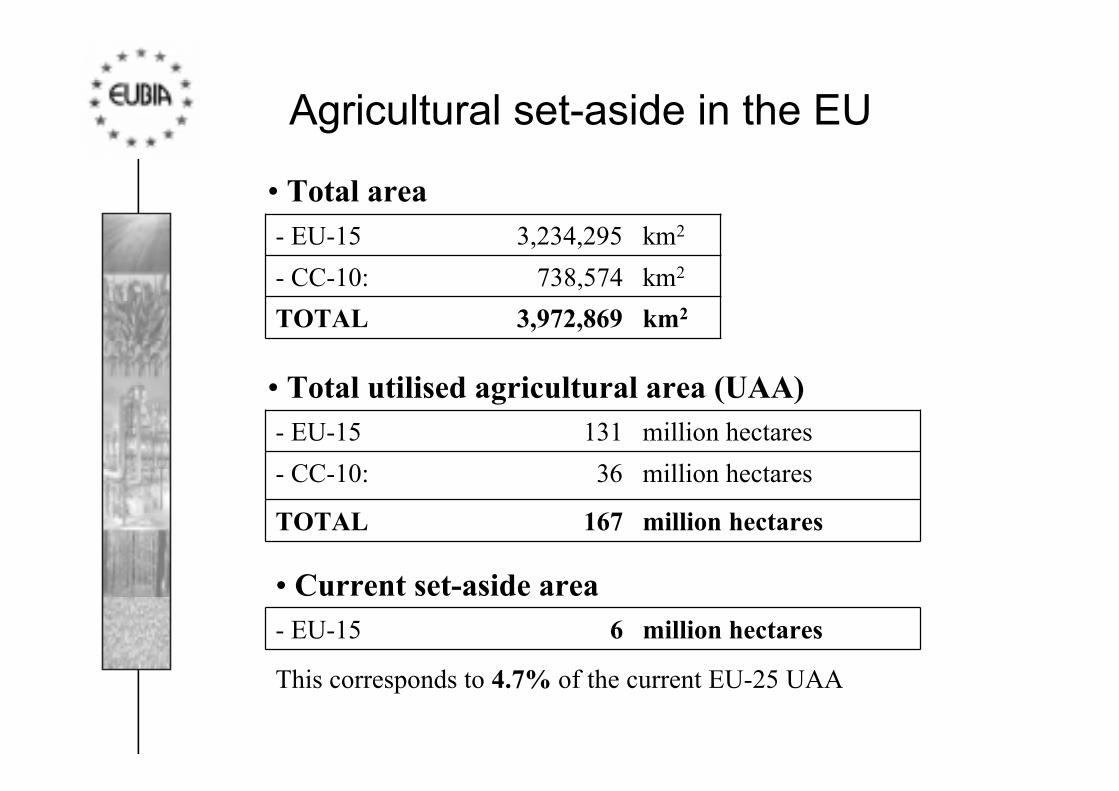
Agricultural set-aside in the EU
¥ Total utilised agricultural area (UAA)
million hectares167TOTAL
million hectares36- CC-10:
million hectares131- EU-15
¥ Current set-aside areamillion hectares6- EU-15
This corresponds to 4.7% of the current EU-25 UAA
¥ Total area
km23,972,869TOTAL
km2738,574- CC-10:
km23,234,295- EU-15
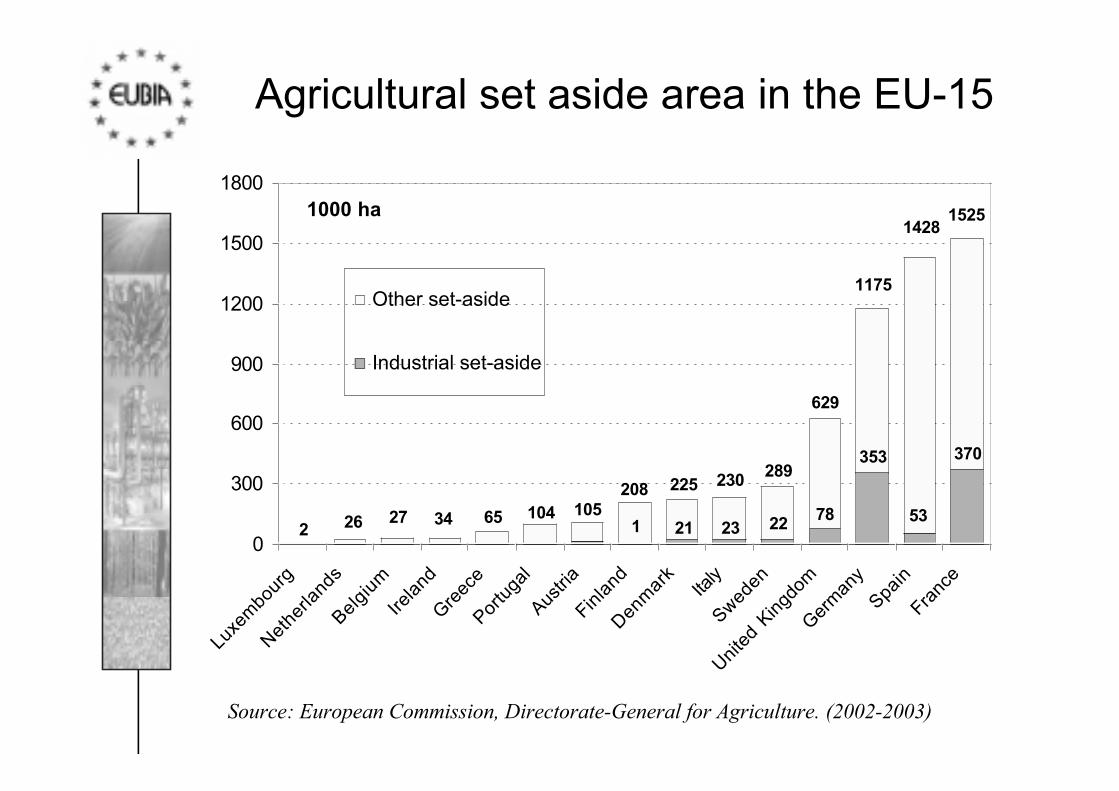
Agricultural set aside area in the EU-15
Source: European Commission, Directorate-General for Agriculture. (2002-2003)
1 21 23 22 78
353
53
370
629
14281525
1175
289230225208105104653427262
0
300
600
900
1200
1500
1800
Luxe
mbo
urg
Nethe
rland
sBelg
ium
Irela
ndGre
ece
Portu
gal
Austri
aFin
land
Denm
ark
Italy
Sweden
Unite
d Kin
gdom
Germ
any
Spain
Franc
e
1000 ha
Other set-aside
Industrial set-aside
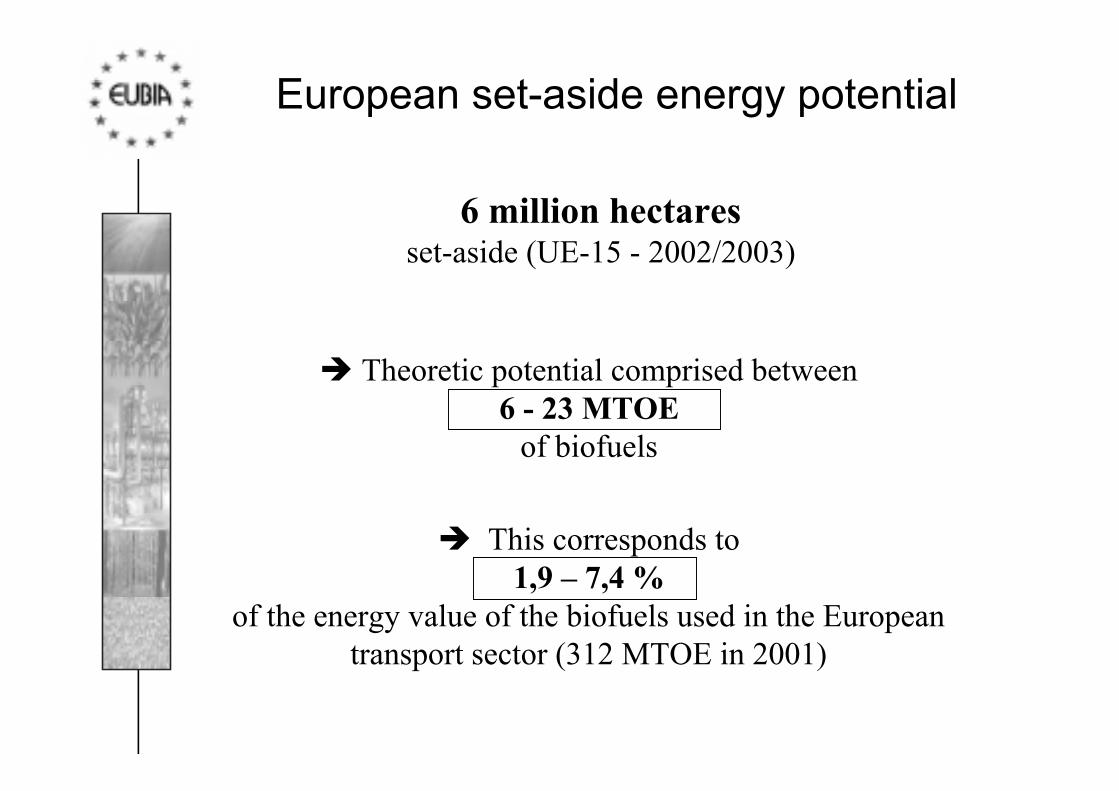
European set-aside energy potential
6 million hectaresset-aside (UE-15 - 2002/2003)
è Theoretic potential comprised between6 - 23 MTOE
of biofuels
è This corresponds to1,9 Ð 7,4 %
of the energy value of the biofuels used in the Europeantransport sector (312 MTOE in 2001)
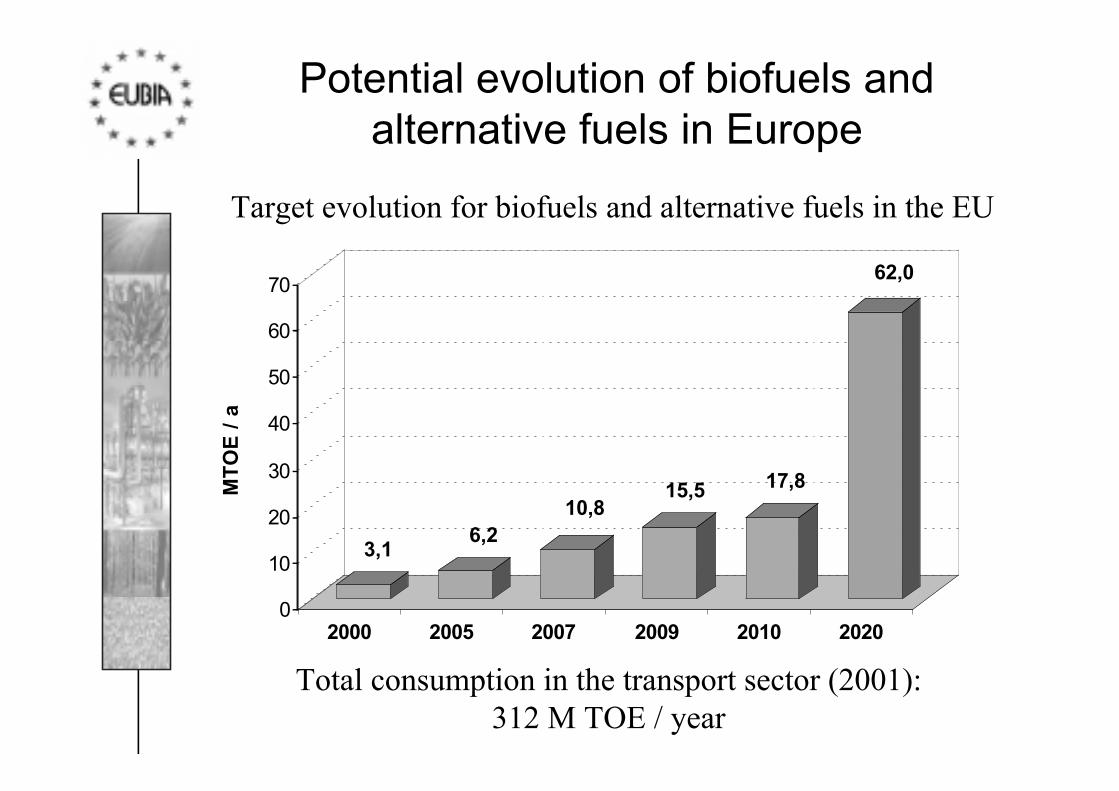
Potential evolution of biofuels andalternative fuels in Europe
Total consumption in the transport sector (2001):312 M TOE / year
Target evolution for biofuels and alternative fuels in the EU
3,16,2
10,815,5 17,8
62,0
0
10
20
30
40
50
60
70
MT
OE
/ a
2000 2005 2007 2009 2010 2020
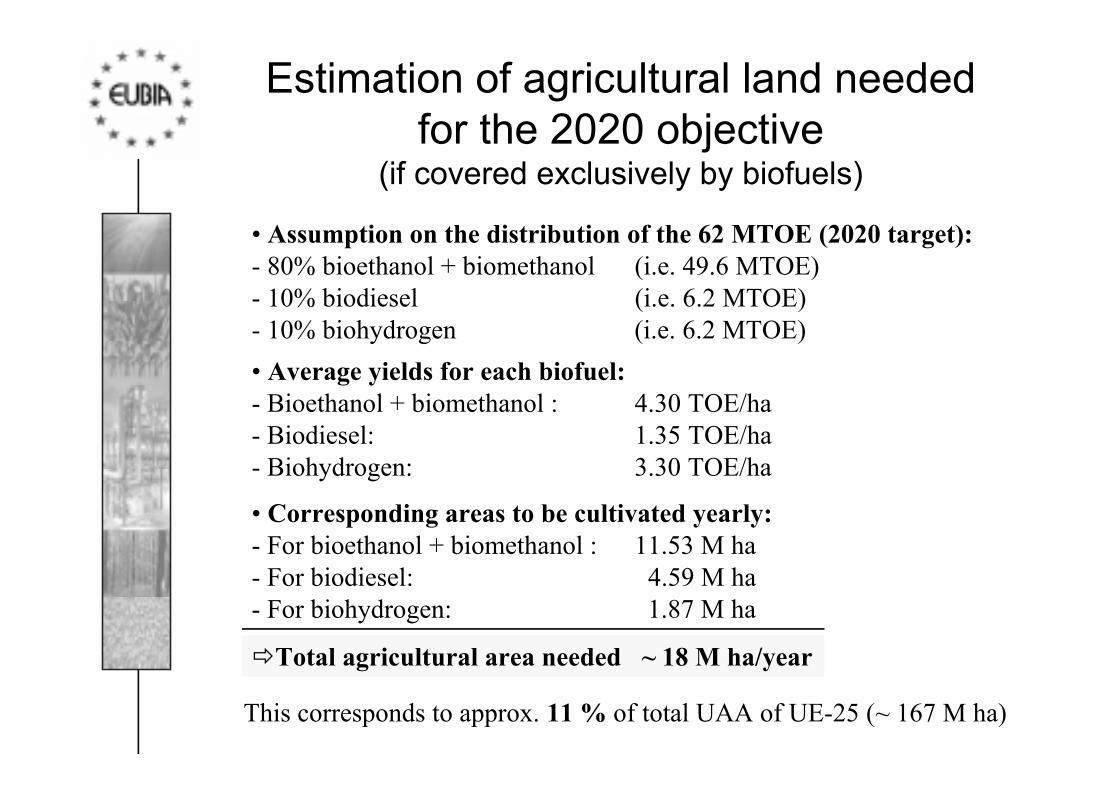
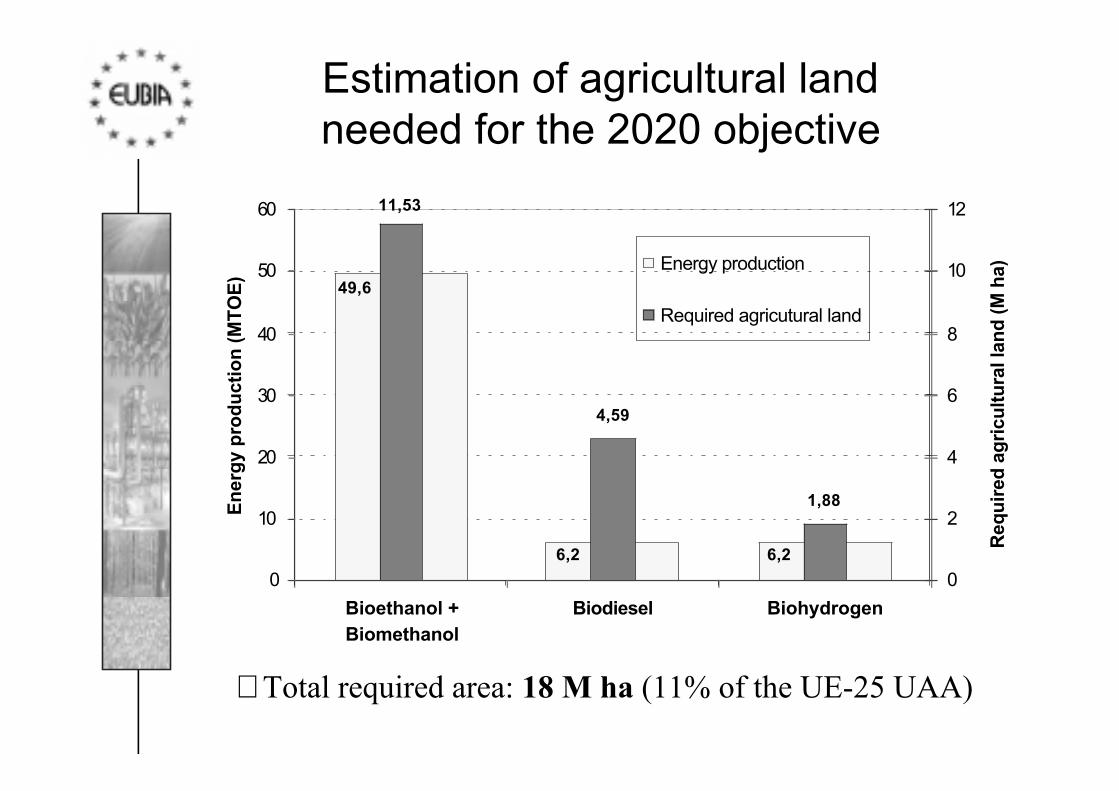
Estimation of agricultural land neededfor the 2020 objective
(if covered exclusively by biofuels)
This corresponds to approx. 11 % of total UAA of UE-25 (~ 167 M ha)
¥ Assumption on the distribution of the 62 MTOE (2020 target):- 80% bioethanol + biomethanol (i.e. 49.6 MTOE)- 10% biodiesel (i.e. 6.2 MTOE)- 10% biohydrogen (i.e. 6.2 MTOE)
¥ Average yields for each biofuel:- Bioethanol + biomethanol : 4.30 TOE/ha- Biodiesel: 1.35 TOE/ha- Biohydrogen: 3.30 TOE/ha
¥ Corresponding areas to be cultivated yearly:- For bioethanol + biomethanol : 11.53 M ha- For biodiesel: 4.59 M ha- For biohydrogen: 1.87 M ha
ðTotal agricultural area needed ~ 18 M ha/year
Estimation of agricultural landneeded for the 2020 objective
6,26,2
49,6
1,88
4,59
11,53
0
10
20
30
40
50
60
Bioethanol +Biomethanol
Biodiesel Biohydrogen
En
erg
y p
rod
uct
ion
(M
TO
E)
0
2
4
6
8
10
12
Req
uir
ed a
gri
cult
ura
l lan
d (
M h
a)Energy production
Required agricutural land
∨ Total required area: 18 M ha (11% of the UE-25 UAA)
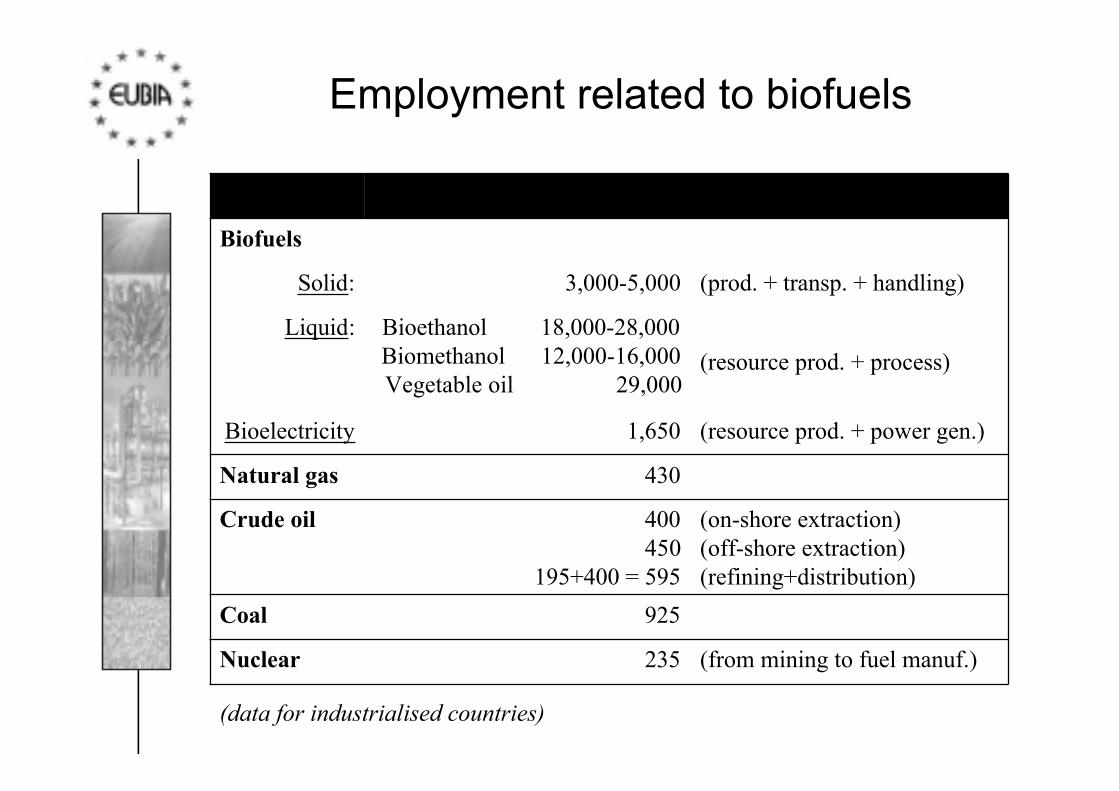
Employment related to biofuels
(resource prod. + power gen.)1,650Bioelectricity
(prod. + transp. + handling) 3,000-5,000Solid:
(resource prod. + process)
Bioethanol 18,000-28,000Biomethanol 12,000-16,000Vegetable oil 29,000
Liquid:
(from mining to fuel manuf.)235Nuclear
925Coal
(on-shore extraction)(off-shore extraction)(refining+distribution)
400450
195+400 = 595
Crude oil
430Natural gas
Biofuels
Nr. of direct jobs/MTOE produced per yearSector
(data for industrialised countries)
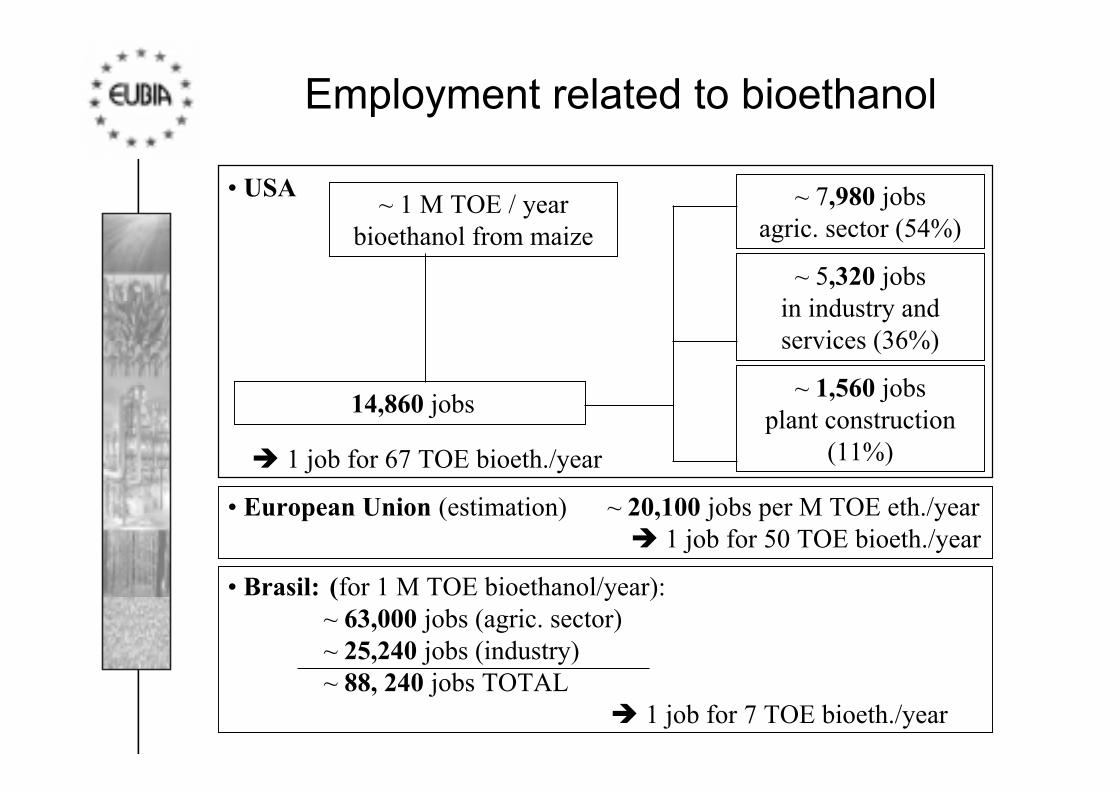
Employment related to bioethanol
¥ European Union (estimation) ~ 20,100 jobs per M TOE eth./year è 1 job for 50 TOE bioeth./year
¥ Brasil: (for 1 M TOE bioethanol/year): ~ 63,000 jobs (agric. sector)
~ 25,240 jobs (industry)~ 88, 240 jobs TOTAL
è 1 job for 7 TOE bioeth./year
~ 1 M TOE / yearbioethanol from maize
~ 7,980 jobsagric. sector (54%)
~ 5,320 jobsin industry andservices (36%)
~ 1,560 jobsplant construction
(11%)
¥ USA
14,860 jobs
è 1 job for 67 TOE bioeth./year
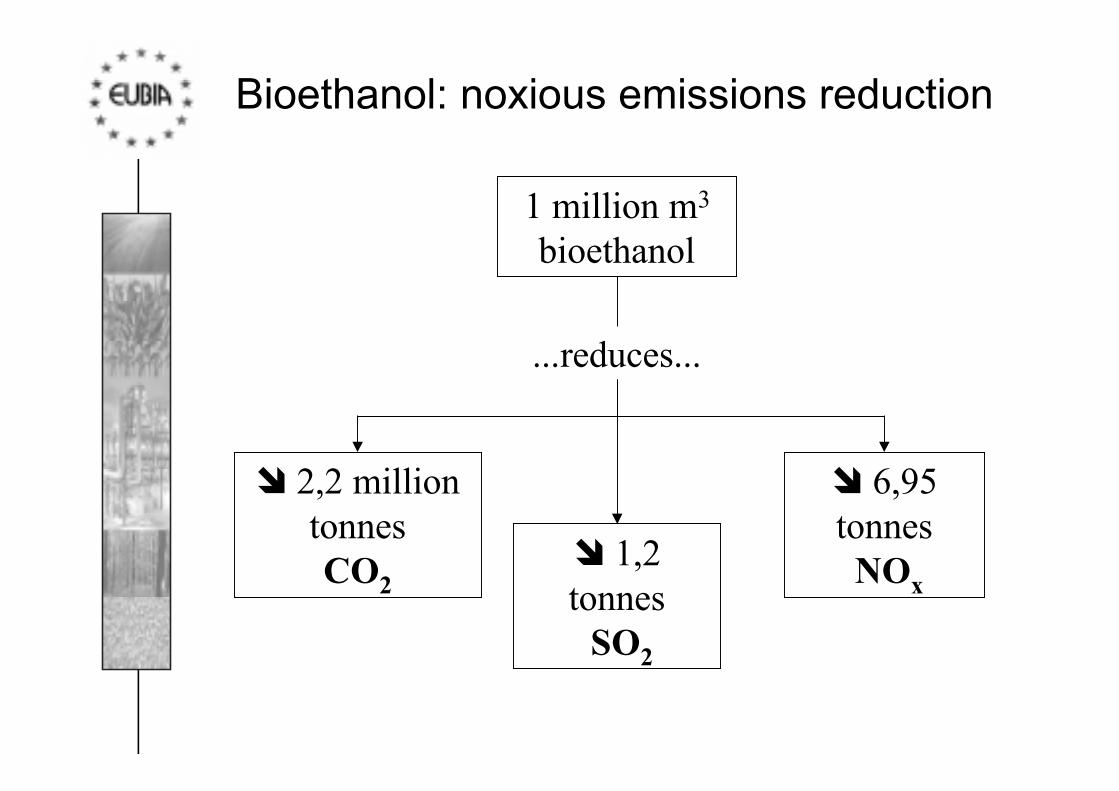
Bioethanol: noxious emissions reduction
1 million m3
bioethanol
...reduces...
î 2,2 milliontonnesCO2
î 1,2tonnes SO2
î 6,95tonnes NOx
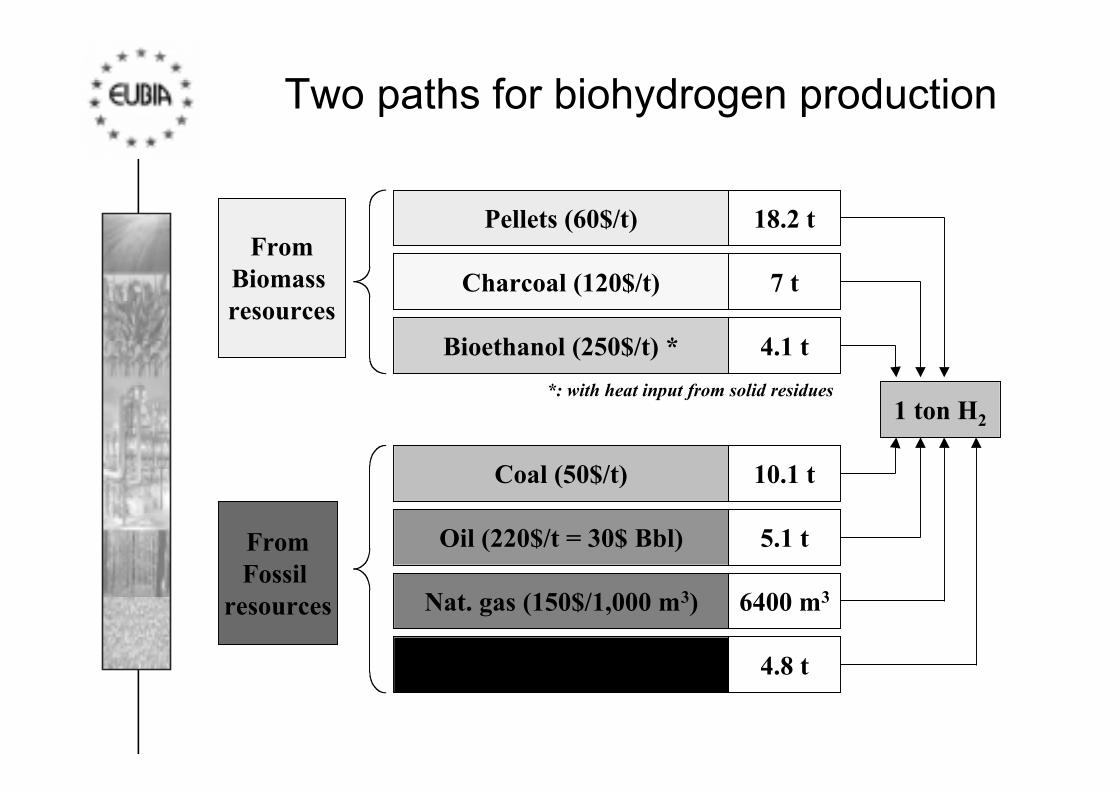
Two paths for biohydrogen production
Pellets (60$/t)
Charcoal (120$/t)
Bioethanol (250$/t) *
Coal (50$/t)
Oil (220$/t = 30$ Bbl)
Nat. gas (150$/1,000 m3)
Nafta (250$/t)
FromBiomass resources
FromFossil
resources
18.2 t
7 t
4.1 t
10.1 t
5.1 t
6400 m3
4.8 t
1 ton H2
*: with heat input from solid residues
Conclusion
¥ World-wide, the potential of biomassresources is very high and very promising.
¥ In particular, biofuels are expected toprovide a considerable contribution to thetransport sector (probably ~20% by 2020)
Thank youfor your attention
EUBIAEuropean Biomass Industry Association
www.eubia.org
Related Documents