500 NATURE MEDICINE • VOLUME 8 • NUMBER 5 • MAY 2002 ARTICLES Multiple sclerosis (MS) is a chronic inflammatory demyelinating disease of central nervous system (CNS) white matter. Environmental factors and a genetically determined susceptibil- ity are both implicated in a misdirected immune response against myelin antigens. Microarray technology provides an image of gene expression in MS lesions on an unprecedented scale. We analyzed samples of fresh frozen brain lesions obtained at early autopsy (1.5–4.0 h post mortem) from four MS patients, and compared the pattern of gene expression against two con- trols without nervous system pathology. Comparison of tran- scripts from acute and ‘chronic active’ lesions versus ‘chronic silent’ lesions revealed several genes not previously known to be important in MS, and they were differentially expressed in the acute/active versus chronic silent lesions. By targeting the prod- ucts of two of these new candidates, we were able to ameliorate experimental autoimmune encephalomyelitis (EAE) in mice, a model with similarities to MS. Histopathology of MS lesions obtained rapidly at autopsy The clinical characteristics of the MS subjects and controls are listed in Table 1. The MS lesions examined in this study fell into three categories: 1) acute MS lesions, comprising areas of recent inflammation and edema, ongoing demyelination, abundant as- troglial hypertrophy and an ill-defined margin showing myelin vacuolation but little or no fibrous astrogliosis (Fig. 1a and b); 2) chronic active MS lesions, comprising areas of long-term de- myelination and fibrous astrogliosis, the well-demarcated mar- gins of which had superimposed regions of recent inflammation and ongoing demyelination (Fig. 1c and d; and 3) chronic silent lesions, displaying no inflammatory activity, abundant gliosis and well-demarcated margins 1 . The neurologically normal cases examined displayed no CNS neuropathology, and were devoid of inflammatory lesions. Microarrays of MS lesions reveal patterns in transcripts Genes with at least a two-fold upregulation in expression in all four MS samples were clustered and visualized using cluster analysis 2 (Fig. 1). Cluster analysis determines correlation coeffi- cients betweens pairs of genes, and organizes genes by similari- ties in expression pattern. The numerical output consists of a color-coded table and dendrogram that are displayed by the pro- gram TreeView 2 . Genes with increased expression are colored red, whereas genes with decreased expression are colored green. Several regions were chosen from the clustering (Fig. 1), and genes having 2-fold or greater expression changes in 3 of 4 MS samples are provided (see Supplementary Tables A and B online). Genes that were increased (39) or decreased (49) in 4 of 4 MS samples were reclustered in Figs. 2 and 3. Gene-microarray analysis of multiple sclerosis lesions yields new targets validated in autoimmune encephalomyelitis CHRISTOPHER LOCK 1 , GUY HERMANS 1 , ROSETTA PEDOTTI 1 , ANDREA BRENDOLAN 2 , ERIC SCHADT 4 , HIDEKI GARREN 1 , ANNETTE LANGER-GOULD 1 , SAMUEL STROBER 2 , BARBARA CANNELLA 7 , JOHN ALLARD 8 , PAUL KLONOWSKI 8 , ANGELA AUSTIN 8 , NAGIN LAD 8 , NAFTALI KAMINSKI 6 , STEPHEN J. GALLI 3 ,JORGE R. OKSENBERG 5 , CEDRIC S.RAINE 7 , RENU HELLER 8 & LAWRENCE STEINMAN 1 Departments of 1 Neurology and Neurological Sciences, Beckman Center, 2 Medicine and 3 Pathology, Stanford University, Stanford, California, USA 4 Informatics, Rosetta Inpharmatics, Kirkland, Washington, USA 5 Department of Neurology and 6 Lung Biology Center and Cardiovascular Research Institute, University of California at San Francisco School of Medicine, San Francisco, California, USA 7 Department of Pathology (Neuropathology) and Neurology, Albert Einstein College of Medicine, Bronx, New York, USA 8 Roche Bioscience, Palo Alto, California, USA C.L., G.H., R.P. and A.B. contributed equally to this study. Correspondence should be addressed to R.H. or L.S.; email: [email protected] or [email protected] Microarray analysis of multiple sclerosis (MS) lesions obtained at autopsy revealed increased transcripts of genes encoding inflammatory cytokines, particularly interleukin-6 and -17, inter- feron-γ and associated downstream pathways. Comparison of two poles of MS pathology— acute lesions with inflammation versus ‘silent’ lesions without inflammation—revealed differentially transcribed genes. Some products of these genes were chosen as targets for ther- apy of experimental autoimmune encephalomyelitis (EAE) in mice. Granulocyte colony-stimulat- ing factor is upregulated in acute, but not in chronic, MS lesions, and the effect on ameliorating EAE is more pronounced in the acute phase, in contrast to knocking out the immunoglobulin Fc receptor common γ chain where the effect is greatest on chronic disease. These results in EAE corroborate the microarray studies on MS lesions. Large-scale analysis of transcripts in MS le- sions elucidates new aspects of pathology and opens possibilities for therapy. © 2002 Nature Publishing Group http://medicine.nature.com

Welcome message from author
This document is posted to help you gain knowledge. Please leave a comment to let me know what you think about it! Share it to your friends and learn new things together.
Transcript

500 NATURE MEDICINE • VOLUME 8 • NUMBER 5 • MAY 2002
ARTICLES
Multiple sclerosis (MS) is a chronic inflammatory demyelinatingdisease of central nervous system (CNS) white matter.Environmental factors and a genetically determined susceptibil-ity are both implicated in a misdirected immune response againstmyelin antigens. Microarray technology provides an image ofgene expression in MS lesions on an unprecedented scale.
We analyzed samples of fresh frozen brain lesions obtained atearly autopsy (1.5–4.0 h post mortem) from four MS patients,and compared the pattern of gene expression against two con-trols without nervous system pathology. Comparison of tran-scripts from acute and ‘chronic active’ lesions versus ‘chronicsilent’ lesions revealed several genes not previously known to beimportant in MS, and they were differentially expressed in theacute/active versus chronic silent lesions. By targeting the prod-ucts of two of these new candidates, we were able to ameliorateexperimental autoimmune encephalomyelitis (EAE) in mice, amodel with similarities to MS.
Histopathology of MS lesions obtained rapidly at autopsyThe clinical characteristics of the MS subjects and controls arelisted in Table 1. The MS lesions examined in this study fell intothree categories: 1) acute MS lesions, comprising areas of recentinflammation and edema, ongoing demyelination, abundant as-troglial hypertrophy and an ill-defined margin showing myelin
vacuolation but little or no fibrous astrogliosis (Fig. 1a and b); 2)chronic active MS lesions, comprising areas of long-term de-myelination and fibrous astrogliosis, the well-demarcated mar-gins of which had superimposed regions of recent inflammationand ongoing demyelination (Fig. 1c and d; and 3) chronic silentlesions, displaying no inflammatory activity, abundant gliosisand well-demarcated margins1. The neurologically normal casesexamined displayed no CNS neuropathology, and were devoidof inflammatory lesions.
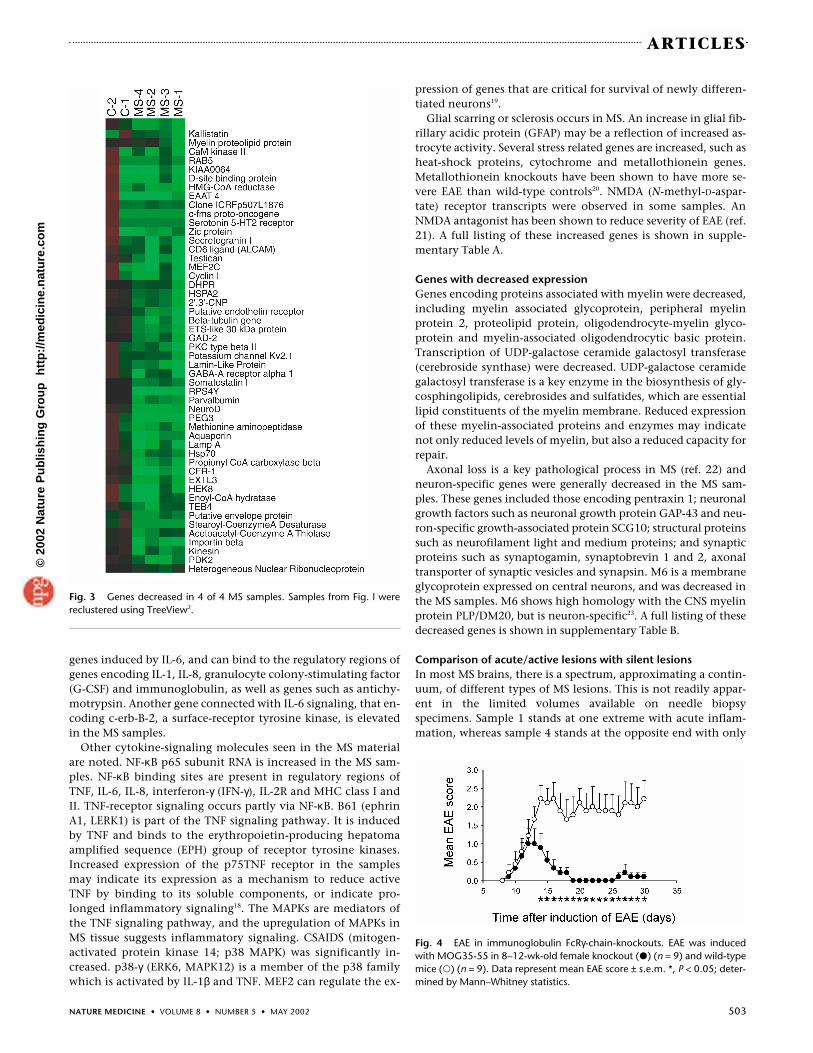
Microarrays of MS lesions reveal patterns in transcriptsGenes with at least a two-fold upregulation in expression in allfour MS samples were clustered and visualized using clusteranalysis2 (Fig. 1). Cluster analysis determines correlation coeffi-cients betweens pairs of genes, and organizes genes by similari-ties in expression pattern. The numerical output consists of acolor-coded table and dendrogram that are displayed by the pro-gram TreeView2. Genes with increased expression are coloredred, whereas genes with decreased expression are colored green.Several regions were chosen from the clustering (Fig. 1), andgenes having 2-fold or greater expression changes in 3 of 4 MSsamples are provided (see Supplementary Tables A and B online).Genes that were increased (39) or decreased (49) in 4 of 4 MSsamples were reclustered in Figs. 2 and 3.
Gene-microarray analysis of multiple sclerosis lesions yieldsnew targets validated in autoimmune encephalomyelitis
CHRISTOPHER LOCK1, GUY HERMANS1, ROSETTA PEDOTTI1, ANDREA BRENDOLAN2, ERIC SCHADT4,HIDEKI GARREN1, ANNETTE LANGER-GOULD1, SAMUEL STROBER2, BARBARA CANNELLA7, JOHN ALLARD8, PAUL KLONOWSKI8, ANGELA AUSTIN8, NAGIN LAD8, NAFTALI KAMINSKI6,
STEPHEN J. GALLI3, JORGE R. OKSENBERG5, CEDRIC S.RAINE7, RENU HELLER8 & LAWRENCE STEINMAN1
Departments of 1Neurology and Neurological Sciences, Beckman Center, 2Medicine and 3Pathology, Stanford University, Stanford, California, USA
4Informatics, Rosetta Inpharmatics, Kirkland, Washington, USA5Department of Neurology and 6Lung Biology Center and Cardiovascular Research Institute, University of California at San Francisco School of Medicine, San Francisco, California, USA
7Department of Pathology (Neuropathology) and Neurology,Albert Einstein College of Medicine, Bronx, New York, USA
8Roche Bioscience, Palo Alto, California, USAC.L., G.H., R.P. and A.B. contributed equally to this study.
Correspondence should be addressed to R.H. or L.S.; email: [email protected] or [email protected]
Microarray analysis of multiple sclerosis (MS) lesions obtained at autopsy revealed increasedtranscripts of genes encoding inflammatory cytokines, particularly interleukin-6 and -17, inter-feron-γ and associated downstream pathways. Comparison of two poles of MS pathology—acute lesions with inflammation versus ‘silent’ lesions without inflammation—revealeddifferentially transcribed genes. Some products of these genes were chosen as targets for ther-apy of experimental autoimmune encephalomyelitis (EAE) in mice. Granulocyte colony-stimulat-ing factor is upregulated in acute, but not in chronic, MS lesions, and the effect on amelioratingEAE is more pronounced in the acute phase, in contrast to knocking out the immunoglobulin Fcreceptor common γ chain where the effect is greatest on chronic disease. These results in EAEcorroborate the microarray studies on MS lesions. Large-scale analysis of transcripts in MS le-sions elucidates new aspects of pathology and opens possibilities for therapy.
©20
02 N
atu
re P
ub
lish
ing
Gro
up
h
ttp
://m
edic
ine.
nat
ure
.co
m

NATURE MEDICINE • VOLUME 8 • NUMBER 5 • MAY 2002 501
ARTICLES
One of the strengths of the Affymetrix GeneChip technologyis that there are multiple probes to detect each gene. Here we an-alyze four samples from the MS population and two samplesfrom the non-MS population. Although these sample sizes arenot large enough to obtain entirely reliable estimates of the truevariation structures of each of the genes tested in the respectivepopulations, it did allow us to obtain P values, which in this set-ting are useful in rank-ordering genes for further validation3–5.The last column in Supplementary Tables A and B summarizesthe P values for some of the relevant genes.
Genes with increased expressionWe observed a picture of active migration of lymphocytic cells.Both CD4+ and CD8+ T cells were present in lesions, but alter-ations in levels of transcription of T-cell receptor (TCR), CD4and CD8 genes were less than two-fold in the lesion material
studied. CD4+ and CD8+ T-cell counts in the four MS samples re-vealed some CD4+ and CD8+ T cells in samples MS 2, 3 and 4,with much larger numbers of these T cells in the highly activesample, MS 1. Other T-cell transcripts such as that for inter-leukin-17 (IL-17) were elevated.
Upregulation of immune response genes included class IImajor histocompatibility complex (MHC) molecules and im-munoglobulin G (IgG). Adhesion molecules integrin β4 and P-se-lectin ligand are increased. B-cell presence is reflected by a novelB-cell activation gene, BL34, which is characteristic of mitogen-activated B-cells6. Several genes provide evidence for the pres-ence of macrophages. Macrophage capping protein is agelsolin-like molecule expressed primarily by differentiatedmacrophages7. MCL1 is expressed in early differentiation of themonocyte/macrophage pathway and is similar to BCL2 in in-hibiting cell death8. Gp-39 is a secreted member of the chitinase
Fig. 1 Histopathology of analyzed MS plaques. a, Low-power image of anacute MS lesion. Note intense inflammation, edema and non-fibrotic natureof the tissue and the indistinct lesion margin showing myelin vacuolation.H&E preparation; magnification, ×175. b, Adjacent to a perivascular cuffcontaining small lymphocytes and plasma cells, hyptertrophic astrocytes arealso apparent in the edematous lesion parenchyma. H&E preparation; mag-nification, ×750. c, Chronic active MS lesion shows a well-demarcated edgeand a fibrotic, demyelinated center. H&E preparation; magnification, ×60.
d, Recent inflammation around the edge of the lesion in (c). H&E prepara-tion; magnification, ×250. In the left-hand panel is a cluster analysis of MSsamples and controls. Genes with at least a 2-fold change in expression in 4of 4 MS samples (1,080 genes) were clustered. The change in red or green inthe control columns indicates how much each control departs from the con-trol mean. Genes colored in red are more highly expressed in the MS samplethan in the controls, and genes colored green are more highly expressed inthe control samples.
a b
c d
©20
02 N
atu
re P
ub
lish
ing
Gro
up
h
ttp
://m
edic
ine.
nat
ure
.co
m

502 NATURE MEDICINE • VOLUME 8 • NUMBER 5 • MAY 2002
ARTICLES
family and is considered a marker for late stages of macrophagedifferentiation9. Complement activity is suggested by increasesin C1r and C3 and increases in several molecules involved in theregulation of the complement cascade. Complement is an im-portant mediator of damage to myelin and expression of a solu-ble inhibitor of complement activation, sCrry, prevents EAE inthe mouse10. CD59, or protectin, has a role particularly in inhibi-tion of the formation of complement membrane attack com-plexes11 and is involved in T-cell and natural killer–cell function.Pregnancy-associated plasma protein A (PAPPA) is a large zincglycoprotein whose function is not fully known. The sequenceshows conserved motifs resembling the short consensus repeatsof complement control proteins.
IL-1 receptor (IL-1R), IL-8 receptor type 2, IL-11 receptor α, IL-17 and p75 tumor necrosis factor–receptor transcripts were ele-vated reflecting pro-inflammatory cytokine activity. The type 1IL-1R mediates all biological responses to IL-1α and IL-1β, andthere are two or more signaling pathways leading to inductionof nuclear factor-κB (NF-κB) and mitogen-activated serine–thre-onine protein kinase (MAPK) activity. IL-1 is detected in cere-brospinal fluid (CSF) in MS (ref. 12), and IL-1 exacerbates EAEwhile soluble IL-1R suppresses EAE (ref. 13). There is an in-creased number of IL-17-expressing mononuclear cells (MNCs)in blood and CSF (ref. 14). Tumor necrosis factor (TNF) is a keycytokine in the pathogenesis of MS and EAE. We have previouslydemonstrated both TNF and TNF receptor with immunohisto-chemistry in MS plaques15.
A number of cytokine related signaling molecules and tran-scriptional activators are seen in the MS samples. Most intrigu-ing is the upregulation of nuclear factor-interleukin-6 (NF-IL6),also known as CCAAT/enhancing-binding protein (C/EBP). NF-IL6 is increased with a range of 3.6 to 12.9-fold in all four MSsamples. NF-IL6 was originally isolated as a DNA binding proteinmediating IL-1 induced IL-6 production16. NF-IL6 regulates tran-scription of IL-6 via a 14-bp palindromic binding site. Elevated
levels of IL-6 have been noted in autoimmune diseases such asrheumatoid arthritis and MS. A monoclonal antibody against IL-6 can reverse EAE (ref. 17). As well as regulating transcriptionof the gene encoding IL-6, NF-IL6 also controls downstream
Fig. 2 Genes increased in 4 of 4 MS samples. Samples from Fig. 1 werereclustered using TreeView2.
Table 1 MS and control subjects
Age/ethnicity/gender Diagnosis & Disease Past medication Lesion type Cause of death AutopsyHLA type clinical signs duration interval
MS 1 31/W/F Chronic progressive MS 11 y Prednisone Acute Respiratory failure 1.5 hDRB1*1501 with acute MS lesions, Solumedrol Chronic activeDRB5*0101 quadriparesis, seizures
MS 2 59/W/F Chronic MS, 35 y None Chronic active Bronchopneumonia 4 hDRB1*1504 secondary progressive Chronic silentDRB5*0101 quadriparesis
MS 3 38/W/F Secondary progressive MS 11 y Cytoxan Chronic active Bronchopneumonia 4 hwith chronic active lesions, Chronic silentdiplopia, ataxia, dysphagia
MS 4 46/W/M Chronic progressive MS, 15 y Lioresal Chronic silent Cardiac arrest 4 hDRB1*03 paraplegia Compazine
Control 1 84/B/F Bowel disease 4 mo Pulmonary 8 hembolism
Control 2 57/W/M Sudden death Trauma
Characteristics of the 4 MS and 2 control subjects studied are shown. Subject MS 1 had acute, active MS with widespread inflammatory involvement in the white matter. 2 sepa-rate samples of brain lesions were obtained from subject MS 1. All brain samples were rapidly frozen after early autopsy. Controls 1 and 2 died of non-neurologic illnesses. Full CNSautopsies were performed on all MS subjects and control 1. Control 2 was from a subject who died from trauma and was purchased as whole human brain polyA+ mRNA.
©20
02 N
atu
re P
ub
lish
ing
Gro
up
h
ttp
://m
edic
ine.
nat
ure
.co
m
NATURE MEDICINE • VOLUME 8 • NUMBER 5 • MAY 2002 503
ARTICLES
genes induced by IL-6, and can bind to the regulatory regions ofgenes encoding IL-1, IL-8, granulocyte colony-stimulating factor (G-CSF) and immunoglobulin, as well as genes such as antichy-motrypsin. Another gene connected with IL-6 signaling, that en-coding c-erb-B-2, a surface-receptor tyrosine kinase, is elevatedin the MS samples.
Other cytokine-signaling molecules seen in the MS materialare noted. NF-κB p65 subunit RNA is increased in the MS sam-ples. NF-κB binding sites are present in regulatory regions ofTNF, IL-6, IL-8, interferon-γ (IFN-γ), IL-2R and MHC class I andII. TNF-receptor signaling occurs partly via NF-κB. B61 (ephrinA1, LERK1) is part of the TNF signaling pathway. It is inducedby TNF and binds to the erythropoietin-producing hepatomaamplified sequence (EPH) group of receptor tyrosine kinases.Increased expression of the p75TNF receptor in the samplesmay indicate its expression as a mechanism to reduce activeTNF by binding to its soluble components, or indicate pro-longed inflammatory signaling18. The MAPKs are mediators ofthe TNF signaling pathway, and the upregulation of MAPKs inMS tissue suggests inflammatory signaling. CSAIDS (mitogen-activated protein kinase 14; p38 MAPK) was significantly in-creased. p38-γ (ERK6, MAPK12) is a member of the p38 familywhich is activated by IL-1β and TNF. MEF2 can regulate the ex-
pression of genes that are critical for survival of newly differen-tiated neurons19.
Glial scarring or sclerosis occurs in MS. An increase in glial fib-rillary acidic protein (GFAP) may be a reflection of increased as-trocyte activity. Several stress related genes are increased, such asheat-shock proteins, cytochrome and metallothionein genes.Metallothionein knockouts have been shown to have more se-vere EAE than wild-type controls20. NMDA (N-methyl-D-aspar-tate) receptor transcripts were observed in some samples. AnNMDA antagonist has been shown to reduce severity of EAE (ref.21). A full listing of these increased genes is shown in supple-mentary Table A.
Genes with decreased expressionGenes encoding proteins associated with myelin were decreased,including myelin associated glycoprotein, peripheral myelinprotein 2, proteolipid protein, oligodendrocyte-myelin glyco-protein and myelin-associated oligodendrocytic basic protein.Transcription of UDP-galactose ceramide galactosyl transferase(cerebroside synthase) were decreased. UDP-galactose ceramidegalactosyl transferase is a key enzyme in the biosynthesis of gly-cosphingolipids, cerebrosides and sulfatides, which are essentiallipid constituents of the myelin membrane. Reduced expressionof these myelin-associated proteins and enzymes may indicatenot only reduced levels of myelin, but also a reduced capacity forrepair.
Axonal loss is a key pathological process in MS (ref. 22) andneuron-specific genes were generally decreased in the MS sam-ples. These genes included those encoding pentraxin 1; neuronalgrowth factors such as neuronal growth protein GAP-43 and neu-ron-specific growth-associated protein SCG10; structural proteinssuch as neurofilament light and medium proteins; and synapticproteins such as synaptogamin, synaptobrevin 1 and 2, axonaltransporter of synaptic vesicles and synapsin. M6 is a membraneglycoprotein expressed on central neurons, and was decreased inthe MS samples. M6 shows high homology with the CNS myelinprotein PLP/DM20, but is neuron-specific23. A full listing of thesedecreased genes is shown in supplementary Table B.
Comparison of acute/active lesions with silent lesionsIn most MS brains, there is a spectrum, approximating a contin-uum, of different types of MS lesions. This is not readily appar-ent in the limited volumes available on needle biopsyspecimens. Sample 1 stands at one extreme with acute inflam-mation, whereas sample 4 stands at the opposite end with only
Fig. 3 Genes decreased in 4 of 4 MS samples. Samples from Fig. l werereclustered using TreeView2.
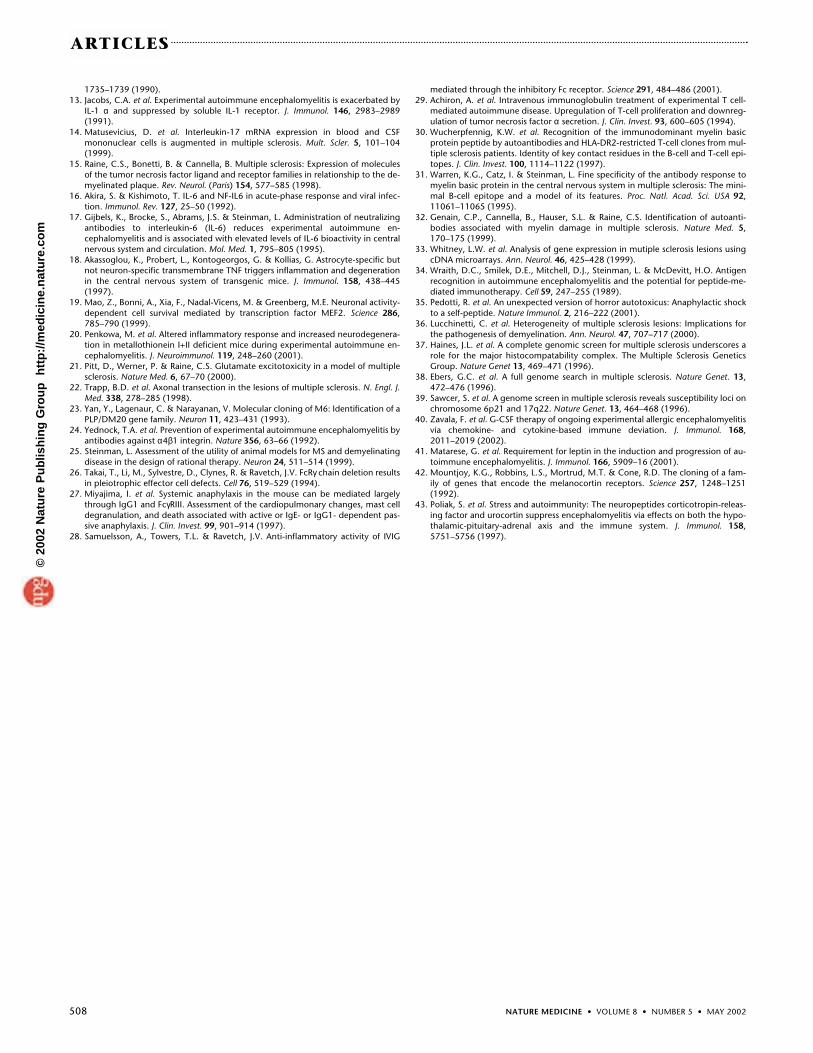
Fig. 4 EAE in immunoglobulin FcRγ-chain-knockouts. EAE was inducedwith MOG35-55 in 8–12-wk-old female knockout (�) (n = 9) and wild-typemice (�) (n = 9). Data represent mean EAE score ± s.e.m. *, P < 0.05; deter-mined by Mann–Whitney statistics.
©20
02 N
atu
re P
ub
lish
ing
Gro
up
h
ttp
://m
edic
ine.
nat
ure
.co
m

504 NATURE MEDICINE • VOLUME 8 • NUMBER 5 • MAY 2002
ARTICLES
Table 2 Genes differentially expressed in acute/active or chronic/silent lesions
Upregulated in acute/active plaques onlyAccession number Entrez definition MS-1 MS-3 MS-2 MS-4 Ratio P valueT cells/B cellsM63438 Ig rearranged γ chain mRNA 3265 1764 < 20 < 20 125.73 0.00000L05624 MAP kinase kinase mRNA 746 2123 < 20 < 20 71.72 0.11472X69398 mRNA for OA3 antigenic surface determinant 792 228 47 < 20 15.17 0.00192X05323 MRC OX-2 gene, signal sequence 385 679 110 < 20 8.18 0.52582U47686 Stat5B mRNA 590 264 91 < 20 7.72 0.29461Granulocytes/mast cellsU52518 Grb2-related adaptor protein (Grap) 1387 283 < 20 < 20 41.74 0.87836X55990 ECP gene for eosinophil cationic protein 1794 278 93 < 20 18.37 0.00000Scar tissue formation/remyelination/neurogenesisL32961 4-aminobutyrate aminotransferase (GABAT) 907 616 < 20 < 20 38.07 0.99603U50822 Neurogenic helix-loop-helix protein NEUROD gene 652 221 < 20 < 20 21.83 0.47202U64573 Connexin 43 gap junction protein (connexin43) gene 559 210 < 20 < 20 19.21 0.80434M19878 Calbindin 27 gene, exons 1 and 2, and Alu repeat 403 407 25 < 20 17.86 0.01671M86849 Connexin 26 (GJB2) mRNA 239 207 < 20 < 20 11.15 0.29995S38953 XA, genomic 481 417 188 < 20 4.33 0.08224Growth factors/cytokinesM13755 Interferon-induced 17-kD/15-kD protein mRNA 964 1043 < 20 < 20 50.16 0.37022X57025 IGF-I mRNA for insulin-like growth factor I 1141 211 < 20 < 20 33.80 0.00001X03656 G-CSF protein gene 1151 512 < 20 107 13.08 0.02625Z70276 mRNA for fibroblast growth factor 12 226 200 < 20 < 20 10.65 0.24924U66198 Fibroblast growth factor homologous factor 2 428 402 < 20 156 4.72 0.05970Endocrine factors/receptorsU55764 Estrogen sulfotransferase mRNA 1375 455 44 < 20 28.42 0.22099D49487 mRNA for obese gene 1200 299 172 59 6.51 0.54287S77415 Melanocortin-4 receptor 640 375 143 110 4.01 0.18428Pregnancy-relatedM23575 Pregnancy-specific β1 glycoprotein mRNA 559 244 153 < 20 4.65 0.05666Upregulated in chronic/silent plaques onlyAccession number Entrez definition MS-1 MS-3 MS-2 MS-4 Ratio P valueT-cells/B-cellsM14159 T-cell receptor β-chain J2.1 gene < 20 < 20 653 582 30.86 0.84407K02882 IGHD gene (IgD chain) < 20 54 402 355 10.29 0.33429M21934 Rearranged and truncated Ig γ heavy chain < 20 113 571 645 9.17 0.64176
disease (RIV) protein gene V-J6 regionL35253 p38 mitogen activated protein (MAP) kinase 103 151 359 1313 6.57 0.88474X92521 mRNA for MMP-19 protein < 20 127 219 710 6.32 0.75678Macrophages/microgliaZ48481 mRNA for membrane-type MMP-1 < 20 63 311 1456 21.41 0.08352M35999 Platelet glycoprotein IIIa (GPIIIa) mRNA < 20 < 20 335 264 14.98 0.18171U10492 Mox1 protein (MOX1) mRNA < 20 126 647 1462 14.43 0.05954D10202 mRNA for platelet-activating factor receptor < 20 129 379 920 8.73 0.37058M63835 IgG Fc receptor I gene < 20 157 350 1000 7.64 0.59965M34344 Platelet glycoprotein IIb (GPIIb) gene < 20 183 527 642 5.76 0.67570X13334 CD14 mRNA for myelid cell-specific < 20 195 270 798 4.96 0.54780
leucine-rich glycoproteinGranulocytes/mast cellsU30998 nmd mRNA, 3’UTR. < 20 < 20 276 919 29.90 0.60368M33493 Tryptase-III mRNA, 3′ end < 20 61 499 1170 20.53 0.30590D25303 mRNA for integrin a subunit < 20 49 595 794 20.15 0.36080M89796 High affinity IgE receptor β chain gene < 20 < 20 254 486 18.51 0.01804Y10205 mRNA for CD88 protein < 20 28 261 344 12.60 0.79376Z34897 mRNA for H1 histamine receptor < 20 110 266 330 4.59 0.00484Scar tissue formation/remyelination/neurogenesisM94250 Retinoic acid inducible factor (MK) gene exons 1-5 < 20 < 20 1008 1503 62.77 0.33031X78565 mRNA for tenascin-C < 20 56 412 1578 26.15 0.49690L41162 Collagen α 3 type IX (COL9A3) mRNA < 20 106 286 2755 24.20 0.00002HG2730-HT2827 Fibrinogen < 20 24 305 627 21.07 0.87339M26682 T-cell translocation gene 1 (Ttg-1) mRNA < 20 < 20 425 348 19.32 0.76570U26403 Receptor tyrosine kinase ligand LERK-7 precursor < 20 27 529 386 19.30 0.60340Y07683 mRNA for P2X3 purinoceptor < 20 119 580 2023 18.77 0.60841X14885 Gene for TGF-β 3 (TGFb 3) exon 1 50 < 20 266 986 17.91 0.41797HG3248-HT3425 Fibroblast growth factor, antisense mRNA < 20 125 393 425 5.64 0.03060X06700 mRNA 3′ region for pro-α1(III) collagen 181 42 229 519 3.36 0.91389Growth factors/cytokinesU32659 IL-17 mRNA < 20 39 211 841 17.71 0.01032Endocrine factors/receptorsX65633 adrenocorticotropic hormone receptor < 20 166 677 1767 13.12 0.49983X04707 c-erb-A mRNA for thyroid hormone receptor < 20 82 434 363 7.81 0.20754Pregnancy-relatedU25988 Pregnancy-specific glycoprotein 13 < 20 189 460 569 4.93 0.07192
List of genes whose transcripts were elevated 2-fold or more in either the acute/active cases 1 and 3 only, or in the chronic silent cases 2 and 4 only. A more detailed analysis of allof the genes uniquely transcribed in either the acute active or chronic silent cases will be made available online. Genes have been tentatively grouped according to known or sus-pected functions in MS lesions.
©20
02 N
atu
re P
ub
lish
ing
Gro
up
h
ttp
://m
edic
ine.
nat
ure
.co
m

NATURE MEDICINE • VOLUME 8 • NUMBER 5 • MAY 2002 505
ARTICLES
chronic silent lesions. Samples 2 and 3 had a mix of bothchronic active inflammatory plaques, and chronic silentplaques. Electronic cluster analysis of samples either increased inall four specimens or decreased in all four specimens, placedsamples 1 and 3 together, and samples 2 and 4 next to eachother and nearer to the controls, which had no inflammatory le-sions (Figs. 2 and 3).
Table 2 demonstrates some of the genes whose transcriptswere elevated two-fold or more in either the acute/active cases 1and 3 only, or in the chronic silent cases 2 and 4 only. Some ofthe highlights of Table 2 include rearranged variable-joining-constant region (VJC) immunoglobulin elevated 125-fold in the2 active samples. A MAP kinase kinase is elevated 72-fold in theacute active samples. Various growth factors are elevated in theacute active cases, including insulin growth factor-1, which mayfacilitate remyelination is elevated 34-fold. G-CSF is elevated 13-fold. Fibroblast growth factor-12 (FGF-12) and FGF-2 homologare elevated 10.7-fold and 4.7-fold, respectively.
Integrin α was elevated in chronic silent MS. We have shownpreviously that antibodies against α4 integrin reverses and re-duces relapses in relapsing EAE (ref. 24). A humanized antibodyto α4 integrin is now in phase 3 clinical trials.
Various gene transcripts associated with Th2 or allergic re-sponses are elevated in these studies: eosinophil cationic proteintranscripts are elevated 18-fold in acute MS, whereas IgE receptoris elevated 18-fold in the chronic silent cases. Histamine receptorH1 is elevated 4.6-fold in the chronic silent cases. IgG Fc receptor1 is elevated 7.6-fold in the chronic silent cases.
IL-17 was elevated 17.7-fold in the chronic silent cases, whiletransforming growth factor-β (TGF-β) is increased 17.9-fold inthe chronic silent cases, perhaps reflecting gliosis or suppressionof the inflammatory response. Matrix metalloprotease (MMP)inhibitors reverse EAE and MMP-2 and MMP-9 are elevated inMS (ref. 25). A distinct MMP, MMP-19, is elevated 19-fold inchronic silent MS lesions .
Various targets of neuroendocrinological interest are elevatedin MS brain, including leptin, melanocortin receptor type 4 andadrenocorticotropic hormone receptor (ACTH-R). Leptin is ele-vated 6.5-fold in acute/active MS versus chronic silent MS,melanocortin receptor type 4 is elevated 4-fold and ACTH-R is el-evated 13-fold in chronic MS versus acute. Some of these geneshave products that are targets for MS therapeutics, or have beensuccessfully modulated in treating EAE, an animal model of MS(ref. 25).
Validation of new targets in the EAE modelEAE has proven to be a durable model for validation of targetsfor therapy of MS (ref. 25). Currently the β interferons andCopaxone, all approved for treatment of MS in Europe and the
US, have proven effective in EAE (ref. 25). Various drugs in dif-ferent stages of clinical testing, including anti-α4 integrin and al-tered peptide ligands, have also proven effective in EAE. Wehave chosen two genes whose level of transcription was alteredin either acute/active or chronic silent MS lesions (Table 2), andhave explored the role of their gene products in EAE (see below).Such validation would be important before pursuing furtherclinical studies of these targets.
Ig FcR influences the recovery phase of EAETo assess the importance of FcγR and FcεR in the development ofEAE, we used mice with targeted mutations of the common γchain of the high-affinity receptor for IgE (FcεRI) and the low-affinity receptor for IgG (FcγRIII)26,27. In these mice, functionalexpression of the high affinity FcγRI is also diminished. EAE wasameliorated in immunoglobulin FcR γ-chain knockouts com-pared with wild type (Fig. 4). We demonstrate highly significantchanges in the disease score during the chronic or recovery stageof the disease, particularly from day 20 onwards, where disease isabsent in the immunoglobulin Fcγ-receptor knockout mice. Thisis concordant with microarray data on MS lesions, where Fc re-ceptor transcripts are elevated in chronic lesions, but not inacute lesions (Table 2). For example, the incidence of EAE (4/9 inthe FcRγ-chain knockout versus 9/9 in the wild type), the meandisease score at day 15 (0.56 ± 0.24 in the FcRγ-chain knockoutversus 2.11 ± 0.39 in the wild type; P < 0.0037) and the meanpeak of disease severity (1.0 ± 0.41 in the FcRγ-chain knockoutversus 2.89 ± 0.35 in the wild type; P < 0.012) were reduced inthe FcRγ chain-deficient mice compared with the wild type.Intravenous immunoglobulins may act via targeting the in-hibitory receptor FcγRIIb (ref. 28). Intravenous immunoglobulin(IVIG) has been shown to be therapeutic in EAE, with some evi-dence of efficacy in MS (ref. 29).
G-CSF influences the acute phase of EAEG-CSF is elevated in the acute active cases, 13-fold relative to thechronic silent cases. We have performed two experiments to an-alyze the influence of G-CSF on the development of EAE. G-CSFwas injected subcutaneously (s.c.) for 6 consecutive days at thedose of 250 µg/kg, before EAE was induced with MOG35-55. EAEwas prevented in the G-CSF-treated group compared with thecontrol (mean day of disease onset 19.2 ± 1.9 in G-CSF treatedgroup versus 13.1 ± 0.5 in vehicle-treated group, P < 0.0047;mean disease score at day 15, 0.4 ± 0.4 in G-CSF-treated groupversus 2.0 ± 0.38 in vehicle-treated group; P < 0.048) (Fig. 5a). Ina second experiment, G-CSF treatment still reduced the meanEAE score at day 15, albeit with a milder effect (0.63 ± 0.26 in G-CSF treated group versus 1.83 ± 0.4 in vehicle treated group; P< 0.0426) (Fig. 5b).
a bFig. 5 Effect of G-CSF on EAE,two consecutive experiments. a and b, EAE was induced withMOG35-55 after G-CSF (�) orvehicle (�) was injected s.c. for 6consecutive days from days –7 to–1 (a), or from days –14 to –8.(b), Data represent mean EAEscore ± s.e.m. *, P < 0.05; as de-termined by Mann–Whitney sta-tistics.
©20
02 N
atu
re P
ub
lish
ing
Gro
up
h
ttp
://m
edic
ine.
nat
ure
.co
m

506 NATURE MEDICINE • VOLUME 8 • NUMBER 5 • MAY 2002
ARTICLES
DiscussionIn MS, evidence points to an immune response against compo-nents of the myelin sheath. A widely accepted view of theprocess of demyelination suggests that T cells, immunoglobulinand complement components have roles in pathogenesis.Adhesion molecules, cytokines, chemokines, HLA moleculesand metalloproteases are critical participants in the develop-ment of the inflammatory response in brain. Autoantibodiesagainst myelin antigens, such as myelin basic protein andmyelin oligodendroglial glycoprotein also have an importantrole in demyelination30–32. Many of these participants in thepathogenesis of MS have been demonstrated at the sites of le-sions by standard methods of immunohistochemistry, in situ hy-bridization and reverse-transcriptase PCR. In each of theseapproaches, only one or at most a few genes or proteins were as-sessed. Here we compared the simultaneous transcriptional be-havior of thousands of genes, thus providing a comprehensivetranscriptional profile of MS.
Most microarray expression studies published to date haveused cell culture systems where conditions are more easily con-trolled and the cell population is homogeneous. Tissue samplesfrom MS have been used less frequently, with one report describ-ing two MS lesions from one brain33. In the paper studying twoMS lesions from one brain by Whitney et al.33, 29 genes werefound to have increased expression in acute MS plaques. These29 genes were represented on the HuGeneFL chip, except for α-2-chimerin, which was replaced by β chimerin. We found 8 ofthese 29 genes increased in at least 2 of the 4 MS samples.
Our investigation of MS brain tissue revealed several new tar-gets for potential therapy. Modulating these targets can lead toamelioration of EAE, and we will report soon on other examplesfrom Table 2. For instance, we examined the transcriptional pro-file of genes activated in encephalitogenic T cells. T cells specificfor the mouse encephalitogenic epitope myelin basic proteinamino acids 1 through 11, amino terminal acetylated (MBP Ac1-11) were obtained from naive non-immunized MBPAc1-11 T-cellreceptor-transgenic mice. After purification, the T cells were stim-ulated in vitro for various time periods with either the encephali-togenic peptide MBP Ac1–11 or the same peptide altered at thefourth position with a substitution of a tyrosine for a lysineresidue (MBP Ac1–11 (4Y)). 4Y is known to prevent the onset ofEAE and is generally considered a superagonist for MBP Ac1-11TCRs (ref. 34). One of the genes that was highly upregulated inMBP Ac1–11 stimulated T cells but not in 4Y stimulated T cells, isMAP kinase kinase 2, which is also known as Mek2. Expressionlevels were elevated approximately 7-fold over baseline unstimu-lated T cells after four hours of stimulation with the peptide MBPAc1–11, but was not significantly elevated after stimulation with4Y. Analogous findings are demonstrated in the human brainsamples. As shown in Table 2, MAPKK is elevated 72-fold in acuteactive demyelinating lesions versus chronic silent lesions. Thesefindings in mouse T cells and human brain plaques are consis-tent: MAPKK2, the mouse homolog of the related but not identi-cal MEK2, is elevated in encephalitogenic T cells stimulated withthe pathogenic peptide MBP Ac1–11, causing acute EAE, andwithin acutely diseased MS plaques (Table 2).
Histamine or serotonin is involved in the development of EAE(ref. 35). Cyproheptadine, an anti-histamine, anti-serotoninergicdrug, ameliorated clinical disease. Cyproheptadine has a Ki of 2.1nM for histamine H1 receptor, 4.1 for 5-HT2 receptor, 27 for mus-carinic cholinergic receptor and 94 for 5-HT1A receptor35.Muscarinic m5 acetylcholine receptor (AchR) that is also targeted
by cyproheptadine is also elevated 11-fold in chronic MS (Table2). Experiments with cleaner drugs more specific for histamine 1receptor or muscarinic M5 AChR are in progress, with positive re-sults to be reported for a pure histamine H1 antagonist in EAE(unpublished data). One of the potential virtues of medicationslike cyproheptadine is that they cross the blood–brain barrier.
Gene microarrays have revolutionized the pathological diag-nosis of cancer, and may similarly aid in the categorization ofMS lesions33. Further studies will elucidate how the lesions stud-ied here correspond to other classifications of MS pathology,using more classical techniques on paraffin-embedded biopsyand autopsy specimens36. Several whole-genome mapping pro-jects have identified a number of loci associated with susceptibil-ity to MS (refs. 37–39). Genes examined here can be correlatedwith linkage studies.
Our data implicate several new genes. We exemplified two ofthese new discoveries in MS lesions, with validating data fromEAE. We corroborated the EAE result with the transcriptionalanalysis of active and silent MS lesions: G-CSF is upregulated inacute, but not in chronic MS lesions, and the effect on EAE ismore pronounced in the acute phase of the disease, in contrastto FcRγ-chain where the reverse is true, again in concordancewith MS studies. Interestingly when given before the onset ofEAE, G-CSF has its major influence on the acute, rather than thechronic stage of the disease. Reversal of ongoing EAE with G-CSFhas been reported40. G-CSF production in acute EAE and acuteMS may be one of the regulatory molecules that naturally sup-press acute attacks.
Other genes in the neuroendocrine area are worthy of com-ment. We have recently found that serum from pregnant femalesreduces relapses of EAE, without inducing a Th1/Th2 shift (datanot shown). Two genes related to pregnancy, Pregnancy-associ-ated plasma protein A (PAPPA), and pregnancy related glycopro-tein, were described here. We are currently investigating whetherthese two proteins are the key factors in sera from pregnancy.
Leptin, melanocortin 4 receptor and ACTH-R are differentiallyelevated in either chronic or acute EAE (refs. 41–43). Lechler andcolleagues showed that leptin ameliorated EAE and induced aTh2 shift41. We have shown that corticotropin-releasing factor(CRF) and urocortin, which leads to ACTH secretion, suppressesEAE (ref. 43). ACTH and corticosteroids are somewhat successfulin reducing the intensity and duration of relapses of MS (ref. 42).
Finally some proteins associated with stress responses in neu-rodegeneration, such as IL-6 and metallothioneins, were shownto be elevated in MS lesions. Metallothioneins have a modulat-ing affect in EAE, where studies with knockouts have shownworsening of EAE (ref. 20). IL-6 is elevated in several neurode-generative diseases, and we have previously shown that anti-IL6ameliorates EAE (ref. 17).
Microarray studies provide a powerful technological innova-tion for the simultaneous imaging of large ensembles of genes inMS tissue. A variety of new therapeutic targets could possiblyemerge from such studies.
MethodsHuman brain samples. MS brain samples and control-1 were obtained atautopsy under an IRB approved protocol. Samples were snap frozen in liq-uid nitrogen and stored at –80 °C. Control-2 was purchased from Clontechas poly(A+) mRNA.
EAE. EAE was induced in 8–12-wk-old C57Bl/6 female mice (Jackson Labs,Bar Harbor, Maine) as described35. Briefly, MOG35-55 peptide was dis-solved in PBS to a concentration of 2 mg/ml and emulsified with an equal
©20
02 N
atu
re P
ub
lish
ing
Gro
up
h
ttp
://m
edic
ine.
nat
ure
.co
m

NATURE MEDICINE • VOLUME 8 • NUMBER 5 • MAY 2002 507
ARTICLES
volume of IFA supplemented with 4 mg/ml heat-killed mycobacterium tu-berculosis H37Ra (Difco Laboratories, Detroit, Michigan). Mice were in-jected s.c. with 0.1 ml of the peptide emulsion and on the same day and 48 h later, were injected intravenously with 0.2 ml of 1 µg/ml Bordetella per-tussis toxin in PBS. Mice were assessed daily for clinical signs of EAE. Thesame protocol was used to induce EAE in 8–12-wk-old female FcRγ-chaindeficient and wild-type (B6129PF2) mice (Jackson Laboratory, Bar Harbor,Maine). To evaluate the effect of G-CSF on the development of EAE, hrG-CSF (Neupogen; Amgen, Thousand Oaks, California) was given s.c. for 6 dbefore induction of EAE at a dose of 250 µg/kgs. Mice were maintained inthe Research Animal Facility at Stanford, or at Roche, and experiments wereconducted in accordance with NIH guidelines.
Sample preparation and chip hybridization. Brain was homogenized in TRIzol reagent (Invitrogen, Carlsbad, California) using a Polytron(Kinematica AG, Luzern, Switzerland) and total RNA prepared according tothe recommended protocol. mRNA was purified by 2 rounds of selectionusing oligo(dT) resin (Oligotex, Qiagen, Hilden, Germany). 2 µg mRNAwere used to prepare double-stranded cDNA (Superscript, Invitrogen). Theprimer for cDNA synthesis contained a T7 RNA polymerase promoter site. 1 µg cDNA was used for an in vitro transcription reaction (T7 Megascript,Ambion, Austin, Texas) with biotinylated CTP and UTP (Enzo Diagnostics,New York, New York). The labeling procedure amplified the mRNA popula-tion ∼ 60-fold. Microarray chips (GeneChip System, Affymetrix, Santa Clara,California) were hybridized for 16 h in a 45 °C incubator with constant ro-tation at 60g. Chips were washed and stained on a fluidics station, andscanned using a laser confocal microscope.
Data analysis. Affymetrix HuGeneFL7026 microarrays were analyzed withGeneChip v3.1 software, and scaled to a value of 150. Average differencevalues of less than 20 were arbitrarily rounded up to a value of 20. Themean average difference for each gene was calculated for the combinedcontrol samples C-1 and C-2. Then the average differences of C-1 and C-2,and the individual MS sample average differences, were then divided by thecontrol mean, to calculate fold-changes. 1,080 genes had a fold-change of≥ 2 in at least 2 of the 4 MS samples, and these genes were used for clusteranalysis. A mean average difference value for the 4 MS samples was also cal-culated and divided by the mean of the controls. Fold-changes were con-verted into a log2 value, and imported into the clustering program. Clusterand TreeView software was downloaded (http://rana.lbl.gov).
Statistics. To assign P values to gene presence and differential expressioncalls, we employed permutation tests described by Schadt et al.3–5. Beforethese tests were conducted to assess the significance of differential expres-sion calls, the arrays were normalized to the intensity differences of one ofthe control sample arrays using a nonlinear regression technique describedby Schadt et al.4. Each array was subdivided into 16 regions and normalizedregion by region to help control for spatial variation in intensity across thesurface of the array. The permutation test operates on the perfect match(PM) and mismatch (MM) pairs for a given probe set, and tests the simplehypotheses for gene presence and differential expression calls, respectively:
For i = 1..M, where M is the number of probe pairs for gene k, and D in-dicates the PM and MM intensities and ratios are equal in distribution.These hypotheses are tested by empirically estimating the distribution ofthe PM/MM intensity differences and ratios, and then comparing the ob-served intensity differences and ratios to the empirically derived distribu-tion, to obtain a quantitative measure of significance (P value). This testavoids the distribution assumptions made by parametric tests like thepaired t-test.
Genes that were detected as significantly present or significantly differ-entially expressed in at least one of the samples were put through an addi-tional analysis step using the Rosetta Resolver v3.0 Expression Data AnalysisSystem (see www.rosettabio.com for more details). In these cases, log ra-tios between the control and disease samples were computed by generat-ing all possible control-disease pairs, computing the log10 of the resultingexpression ratios for all probe pairs, and then averaging the log ratios of
these probe pairs, where the expression ratio for a probe pair was taken tobe the ratio between normalized, error-weighted PM/MM difference inten-sities. An error model for the log ratio was then applied to quantify the sig-nificance of expression changes between the control and disease samples.This error model assumed the log ratio statistic followed a standard normaldistribution. As discussed by Waring et al.5, the main purpose of such anerror model is to generate P values for the log ratio statistic so that genescan be rank-ordered according to the significance of this statistic. Using P values to rank order genes, as opposed to using P values in a classic hy-pothesis-testing context, is not sensitive to departures in normality. In addi-tion, this model allowed us to optimally combine the control and diseasesamples to assess the significance of differential expression, and it provideda somewhat independent assessment of the significance of differential ex-pression for each gene called differentially expressed using the permutationtest. The P values reported in Table 2 and Supplementary Table A and Bwere obtained using this error model.
Note: Supplementary information is available on the Nature Medicine website.
AcknowledgmentsWe thank J. Woody, R. Booth and H. Van Wart for support during the course ofthis work; H. Gmuender for help optimizing use of the technology; S. Wilsonfor developing methods to handle and isolate RNA from human samples; F.Zuo for helpful comments on the manuscript; J. Kumm for advice onbioinformatics; M.C. Jeong for technical help; and Roche Bioscience for supportand access to gene-chip technology. This study was supported in part by post-doctoral fellowships from the National Multiple Sclerosis Society to C.L., G.H.and R.P. J.O. is supported by grants from the NIH (NIHAI35761) and theNational Multiple Sclerosis Society (RG2901). C.S.R. is supported by NIHgrants NS08952 and NS11920. L.S. is supported by NIH grants NIH18235,30201, 41402 and 28579.
Competing interests statementThe authors declare competing financial interests: see the website(http://medicine.nature.com) for details.
RECEIVED 12 FEBRUARY; ACCEPTED 12 MARCH 2002
1. Raine, C.S. The neuropathology of multiple sclerosis. in Multiple Sclerosis: Clinicaland Pathogenetic Basis (eds. Raine, C.S., McFarland, H.F. & Tourtelotte, W.W)151–171 (Chapman and Hall, London, 1997).
2. Eisen, M.B., Spellman, P.T., Brown, P.O. & Botstein, D. Cluster analysis and dis-play of genome-wide expression patterns. Proc. Natl. Acad. Sci. USA 95,14863–14868 (1998).
3. Waring, J.F. et al. Clustering of hepatotoxins based on mechanism of toxicity usinggene expression profiles. Toxicol. Appl. Pharmacol. 175, 28–42 (2001).
4. Schadt, E.E., Li, C., Su, C. & Wong, W.H. Analyzing high-density oligonucleotidegene expression array data. J. Cell Biochem. 80, 192–202 (2000).
5. Schadt, E.E., Li, C., Ellis, B. & Wong, W.H. Feature extraction and normalization al-gorithms for high-density oligonucleotide gene expression array data. J. CellBiochem. Suppl., 120–125 (2001).
6. Hong, J.X., Wilson, G.L., Fox, C.H. & Kehrl, J.H. Isolation and characterization of anovel B cell activation gene. J. Immunol. 150, 3895–3904 (1993).
7. Dabiri, G.A., Young, C.L., Rosenbloom, J. & Southwick, F.S. Molecular cloning ofhuman macrophage capping protein cDNA. A unique member of thegelsolin/villin family expressed primarily in macrophages. J. Biol. Chem 267,16545–16552 (1992).
8. Kozopas, K.M., Yang, T., Buchan, H.L., Zhou, P. & Craig, R.W. MCL1, a gene ex-pressed in programmed myeloid cell differentiation, has sequence similarity toBCL2. Proc. Natl. Acad. Sci. USA 90, 3516–3520 (1993).
9. Rehli, M., Krause, S.W. & Andreesen, R. Molecular characterization of the gene forhuman cartilage gp-39 (CHI3L1), a member of the chitinase protein family andmarker for late stages of macrophage differentiation. Genomics 43, 221–225(1997).
10. Davoust, N. et al. Central nervous system-targeted expression of the complementinhibitor sCrry prevents experimental allergic encephalomyelitis. J. Immunol. 163,6551–6556 (1999).
11. Walsh, L.A., Tone, M., Thiru, S. & Waldmann, H. The CD59 antigen—a multifunc-tional molecule. Tissue Antigens 40, 213–220 (1992).
12. Hauser, S.L., Doolittle, T.H., Lincoln, R., Brown, R.H. & Dinarello, C.A. Cytokineaccumulations in CSF of multiple sclerosis patients: Frequent detection of inter-leukin-1 and tumor necrosis factor but not interleukin-6. Neurology 40,
i
i
i
i
iik
kD
k
kk
D
k PM
MM
MM
PM and/or MMPM ==
©20
02 N
atu
re P
ub
lish
ing
Gro
up
h
ttp
://m
edic
ine.
nat
ure
.co
m
508 NATURE MEDICINE • VOLUME 8 • NUMBER 5 • MAY 2002
ARTICLES
1735–1739 (1990).13. Jacobs, C.A. et al. Experimental autoimmune encephalomyelitis is exacerbated by
IL-1 α and suppressed by soluble IL-1 receptor. J. Immunol. 146, 2983–2989(1991).
14. Matusevicius, D. et al. Interleukin-17 mRNA expression in blood and CSFmononuclear cells is augmented in multiple sclerosis. Mult. Scler. 5, 101–104(1999).
15. Raine, C.S., Bonetti, B. & Cannella, B. Multiple sclerosis: Expression of moleculesof the tumor necrosis factor ligand and receptor families in relationship to the de-myelinated plaque. Rev. Neurol. (Paris) 154, 577–585 (1998).
16. Akira, S. & Kishimoto, T. IL-6 and NF-IL6 in acute-phase response and viral infec-tion. Immunol. Rev. 127, 25–50 (1992).
17. Gijbels, K., Brocke, S., Abrams, J.S. & Steinman, L. Administration of neutralizingantibodies to interleukin-6 (IL-6) reduces experimental autoimmune en-cephalomyelitis and is associated with elevated levels of IL-6 bioactivity in centralnervous system and circulation. Mol. Med. 1, 795–805 (1995).
18. Akassoglou, K., Probert, L., Kontogeorgos, G. & Kollias, G. Astrocyte-specific butnot neuron-specific transmembrane TNF triggers inflammation and degenerationin the central nervous system of transgenic mice. J. Immunol. 158, 438–445(1997).
19. Mao, Z., Bonni, A., Xia, F., Nadal-Vicens, M. & Greenberg, M.E. Neuronal activity-dependent cell survival mediated by transcription factor MEF2. Science 286,785–790 (1999).
20. Penkowa, M. et al. Altered inflammatory response and increased neurodegenera-tion in metallothionein I+II deficient mice during experimental autoimmune en-cephalomyelitis. J. Neuroimmunol. 119, 248–260 (2001).
21. Pitt, D., Werner, P. & Raine, C.S. Glutamate excitotoxicity in a model of multiplesclerosis. Nature Med. 6, 67–70 (2000).
22. Trapp, B.D. et al. Axonal transection in the lesions of multiple sclerosis. N. Engl. J.Med. 338, 278–285 (1998).
23. Yan, Y., Lagenaur, C. & Narayanan, V. Molecular cloning of M6: Identification of aPLP/DM20 gene family. Neuron 11, 423–431 (1993).
24. Yednock, T.A. et al. Prevention of experimental autoimmune encephalomyelitis byantibodies against α4β1 integrin. Nature 356, 63–66 (1992).
25. Steinman, L. Assessment of the utility of animal models for MS and demyelinatingdisease in the design of rational therapy. Neuron 24, 511–514 (1999).
26. Takai, T., Li, M., Sylvestre, D., Clynes, R. & Ravetch, J.V. FcRγ chain deletion resultsin pleiotrophic effector cell defects. Cell 76, 519–529 (1994).
27. Miyajima, I. et al. Systemic anaphylaxis in the mouse can be mediated largelythrough IgG1 and FcγRIII. Assessment of the cardiopulmonary changes, mast celldegranulation, and death associated with active or IgE- or IgG1- dependent pas-sive anaphylaxis. J. Clin. Invest. 99, 901–914 (1997).
28. Samuelsson, A., Towers, T.L. & Ravetch, J.V. Anti-inflammatory activity of IVIG
mediated through the inhibitory Fc receptor. Science 291, 484–486 (2001).29. Achiron, A. et al. Intravenous immunoglobulin treatment of experimental T cell-
mediated autoimmune disease. Upregulation of T-cell proliferation and downreg-ulation of tumor necrosis factor α secretion. J. Clin. Invest. 93, 600–605 (1994).
30. Wucherpfennig, K.W. et al. Recognition of the immunodominant myelin basicprotein peptide by autoantibodies and HLA-DR2-restricted T-cell clones from mul-tiple sclerosis patients. Identity of key contact residues in the B-cell and T-cell epi-topes. J. Clin. Invest. 100, 1114–1122 (1997).
31. Warren, K.G., Catz, I. & Steinman, L. Fine specificity of the antibody response tomyelin basic protein in the central nervous system in multiple sclerosis: The mini-mal B-cell epitope and a model of its features. Proc. Natl. Acad. Sci. USA 92,11061–11065 (1995).
32. Genain, C.P., Cannella, B., Hauser, S.L. & Raine, C.S. Identification of autoanti-bodies associated with myelin damage in multiple sclerosis. Nature Med. 5,170–175 (1999).
33. Whitney, L.W. et al. Analysis of gene expression in mutiple sclerosis lesions usingcDNA microarrays. Ann. Neurol. 46, 425–428 (1999).
34. Wraith, D.C., Smilek, D.E., Mitchell, D.J., Steinman, L. & McDevitt, H.O. Antigenrecognition in autoimmune encephalomyelitis and the potential for peptide-me-diated immunotherapy. Cell 59, 247–255 (1989).
35. Pedotti, R. et al. An unexpected version of horror autotoxicus: Anaphylactic shockto a self-peptide. Nature Immunol. 2, 216–222 (2001).
36. Lucchinetti, C. et al. Heterogeneity of multiple sclerosis lesions: Implications forthe pathogenesis of demyelination. Ann. Neurol. 47, 707–717 (2000).
37. Haines, J.L. et al. A complete genomic screen for multiple sclerosis underscores arole for the major histocompatability complex. The Multiple Sclerosis GeneticsGroup. Nature Genet 13, 469–471 (1996).
38. Ebers, G.C. et al. A full genome search in multiple sclerosis. Nature Genet. 13,472–476 (1996).
39. Sawcer, S. et al. A genome screen in multiple sclerosis reveals susceptibility loci onchromosome 6p21 and 17q22. Nature Genet. 13, 464–468 (1996).
40. Zavala, F. et al. G-CSF therapy of ongoing experimental allergic encephalomyelitisvia chemokine- and cytokine-based immune deviation. J. Immunol. 168,2011–2019 (2002).
41. Matarese, G. et al. Requirement for leptin in the induction and progression of au-toimmune encephalomyelitis. J. Immunol. 166, 5909–16 (2001).
42. Mountjoy, K.G., Robbins, L.S., Mortrud, M.T. & Cone, R.D. The cloning of a fam-ily of genes that encode the melanocortin receptors. Science 257, 1248–1251(1992).
43. Poliak, S. et al. Stress and autoimmunity: The neuropeptides corticotropin-releas-ing factor and urocortin suppress encephalomyelitis via effects on both the hypo-thalamic-pituitary-adrenal axis and the immune system. J. Immunol. 158,5751–5756 (1997).
©20
02 N
atu
re P
ub
lish
ing
Gro
up
h
ttp
://m
edic
ine.
nat
ure
.co
m
Related Documents


![Myelin oligodendrocyte glycoprotein-specific antibodies from ......protein (MBP)] used to induce experimental autoimmune encephalomyelitis (EAE) in rodent models through induction](https://static.cupdf.com/doc/110x72/60ff0b7639f1f130b4007123/myelin-oligodendrocyte-glycoprotein-specific-antibodies-from-protein-mbp.jpg)


