Gene Expression Patterns during the Early Stages of Chemically Induced Larval Metamorphosis and Settlement of the Coral Acropora millepora Nachshon Siboni 1 *, David Abrego 1 , Cherie A. Motti 1 , Jan Tebben 2 , Tilmann Harder 1,2 1 Australian Institute of Marine Science, Townsville, Australia, 2 School of Biological, Earth and Environmental Sciences, Centre for Marine Bio-Innovation, The University of New South Wales, Sydney, Australia Abstract The morphogenetic transition of motile coral larvae into sessile primary polyps is triggered and genetically programmed upon exposure to environmental biomaterials, such as crustose coralline algae (CCA) and bacterial biofilms. Although the specific chemical cues that trigger coral larval morphogenesis are poorly understood there is much more information available on the genes that play a role in this early life phase. Putative chemical cues from natural biomaterials yielded defined chemical samples that triggered different morphogenetic outcomes: an extract derived from a CCA-associated Pseudoalteromonas bacterium that induced metamorphosis, characterized by non-attached metamorphosed juveniles; and two fractions of the CCA Hydrolithon onkodes (Heydrich) that induced settlement, characterized by attached metamorphosed juveniles. In an effort to distinguish the genes involved in these two morphogenetic transitions, competent larvae of the coral Acropora millepora were exposed to these predictable cues and the expression profiles of 47 coral genes of interest (GOI) were investigated after only 1 hour of exposure using multiplex RT–qPCR. Thirty-two GOI were differentially expressed, indicating a putative role during the early regulation of morphogenesis. The most striking differences were observed for immunity-related genes, hypothesized to be involved in cell recognition and adhesion, and for fluorescent protein genes. Principal component analysis of gene expression profiles resulted in separation between the different morphogenetic cues and exposure times, and not only identified those genes involved in the early response but also those which influenced downstream biological changes leading to larval metamorphosis or settlement. Citation: Siboni N, Abrego D, Motti CA, Tebben J, Harder T (2014) Gene Expression Patterns during the Early Stages of Chemically Induced Larval Metamorphosis and Settlement of the Coral Acropora millepora. PLoS ONE 9(3): e91082. doi:10.1371/journal.pone.0091082 Editor: Hector Escriva, Laboratoire Arago, France Received October 16, 2013; Accepted February 6, 2014; Published March 14, 2014 Copyright: ß 2014 Siboni et al. This is an open-access article distributed under the terms of the Creative Commons Attribution License, which permits unrestricted use, distribution, and reproduction in any medium, provided the original author and source are credited. Funding: Funding was provided by the Australian Institute of Marine Science, Futures Project, Appropriation Fund 2233. TH was partially supported by a Research Fellowship awarded by the German Research Foundation (HA 3496/5-1). The funders had no role in study design, data collection and analysis, decision to publish, or preparation of the manuscript. Competing Interests: TH currently serves as an academic editor for PLOS ONE. This does not alter the authors’ adherence to all the PLOS ONE policies on sharing data and materials. * E-mail: [email protected] Introduction Among the cues that trigger the pelago-benthic transition of coral larvae, biomolecular cues associated with the natural habitat, such as coral rubble, crustose coralline algae (CCA) and marine bacteria, have received considerable attention in the literature [1– 4]. Previous investigations of gene expression profiles in coral larvae after exposure to these natural morphogenetic cues have focussed on the regulation of candidate genes with presumptive key functions in coral development, such as those implicated in cell proliferation, apoptosis, differentiation, migration, adhesion, biomineralization and immunity [5–11]. These investigations identified a large number of genes that were differentially expressed across the complete developmental transition, from competent swimming larvae to post-metamorphosis primary polyps [7], and that regulatory changes in gene expression occurred between 4 to 12 h post incubation (hpi) to a variety of morphogenetic stimuli [6–8,12]. The general conclusion was that, at the transcriptional level, coral larvae appear to anticipate metamorphosis [6]. Changes in gene expression profiles of larvae exposed to morphogenetic stimuli have mostly been investigated using non- targeted approaches [6,8] primarily due to the variable and complex composition of coral rubble obtained in the field, typically characterized by a mix of live and dead CCA, endolithic green algae, polychaetes, diatoms, protozoa and bacteria. Further compounding this issue is the likelihood that changes to the gene expression profiles of larvae exposed to CCA are in fact an integrated response to a multitude of qualitatively different triggers possibly affecting gene expression at multiple and unrelated levels. A bioassay-guided chemical isolation strategy was employed to generate chemically refined and quantifiable putative morphoge- netic cues from these natural biomaterials that would trigger larval morphogenesis in vitro. This strategy yielded (1) an organic and an aqueous fraction of the CCA Hydrolithon onkodes (Heydrich) that, under laboratory conditions, triggered in a highly reproducible manner, settlement, characterized by attached metamorphosed juveniles [13] and (2) a crude extract of Pseudoalteromonas strain J010 (J010-E) isolated from H. onkodes, known to contain tetrabromopyrrole (TBP), that triggered larval metamorphosis, characterized by non-attached metamorphosed juveniles [4,12]. PLOS ONE | www.plosone.org 1 March 2014 | Volume 9 | Issue 3 | e91082

Welcome message from author
This document is posted to help you gain knowledge. Please leave a comment to let me know what you think about it! Share it to your friends and learn new things together.
Transcript
Gene Expression Patterns during the Early Stages ofChemically Induced Larval Metamorphosis andSettlement of the Coral Acropora milleporaNachshon Siboni1*, David Abrego1, Cherie A. Motti1, Jan Tebben2, Tilmann Harder1,2
1 Australian Institute of Marine Science, Townsville, Australia, 2 School of Biological, Earth and Environmental Sciences, Centre for Marine Bio-Innovation, The University of
New South Wales, Sydney, Australia
Abstract
The morphogenetic transition of motile coral larvae into sessile primary polyps is triggered and genetically programmedupon exposure to environmental biomaterials, such as crustose coralline algae (CCA) and bacterial biofilms. Although thespecific chemical cues that trigger coral larval morphogenesis are poorly understood there is much more informationavailable on the genes that play a role in this early life phase. Putative chemical cues from natural biomaterials yieldeddefined chemical samples that triggered different morphogenetic outcomes: an extract derived from a CCA-associatedPseudoalteromonas bacterium that induced metamorphosis, characterized by non-attached metamorphosed juveniles; andtwo fractions of the CCA Hydrolithon onkodes (Heydrich) that induced settlement, characterized by attachedmetamorphosed juveniles. In an effort to distinguish the genes involved in these two morphogenetic transitions,competent larvae of the coral Acropora millepora were exposed to these predictable cues and the expression profiles of 47coral genes of interest (GOI) were investigated after only 1 hour of exposure using multiplex RT–qPCR. Thirty-two GOI weredifferentially expressed, indicating a putative role during the early regulation of morphogenesis. The most strikingdifferences were observed for immunity-related genes, hypothesized to be involved in cell recognition and adhesion, andfor fluorescent protein genes. Principal component analysis of gene expression profiles resulted in separation between thedifferent morphogenetic cues and exposure times, and not only identified those genes involved in the early response butalso those which influenced downstream biological changes leading to larval metamorphosis or settlement.
Citation: Siboni N, Abrego D, Motti CA, Tebben J, Harder T (2014) Gene Expression Patterns during the Early Stages of Chemically Induced Larval Metamorphosisand Settlement of the Coral Acropora millepora. PLoS ONE 9(3): e91082. doi:10.1371/journal.pone.0091082
Editor: Hector Escriva, Laboratoire Arago, France
Received October 16, 2013; Accepted February 6, 2014; Published March 14, 2014
Copyright: � 2014 Siboni et al. This is an open-access article distributed under the terms of the Creative Commons Attribution License, which permitsunrestricted use, distribution, and reproduction in any medium, provided the original author and source are credited.
Funding: Funding was provided by the Australian Institute of Marine Science, Futures Project, Appropriation Fund 2233. TH was partially supported by aResearch Fellowship awarded by the German Research Foundation (HA 3496/5-1). The funders had no role in study design, data collection and analysis, decisionto publish, or preparation of the manuscript.
Competing Interests: TH currently serves as an academic editor for PLOS ONE. This does not alter the authors’ adherence to all the PLOS ONE policies onsharing data and materials.
* E-mail: [email protected]
Introduction
Among the cues that trigger the pelago-benthic transition of
coral larvae, biomolecular cues associated with the natural habitat,
such as coral rubble, crustose coralline algae (CCA) and marine
bacteria, have received considerable attention in the literature [1–
4]. Previous investigations of gene expression profiles in coral
larvae after exposure to these natural morphogenetic cues have
focussed on the regulation of candidate genes with presumptive
key functions in coral development, such as those implicated in cell
proliferation, apoptosis, differentiation, migration, adhesion,
biomineralization and immunity [5–11]. These investigations
identified a large number of genes that were differentially
expressed across the complete developmental transition, from
competent swimming larvae to post-metamorphosis primary
polyps [7], and that regulatory changes in gene expression
occurred between 4 to 12 h post incubation (hpi) to a variety of
morphogenetic stimuli [6–8,12]. The general conclusion was that,
at the transcriptional level, coral larvae appear to anticipate
metamorphosis [6].
Changes in gene expression profiles of larvae exposed to
morphogenetic stimuli have mostly been investigated using non-
targeted approaches [6,8] primarily due to the variable and
complex composition of coral rubble obtained in the field,
typically characterized by a mix of live and dead CCA, endolithic
green algae, polychaetes, diatoms, protozoa and bacteria. Further
compounding this issue is the likelihood that changes to the gene
expression profiles of larvae exposed to CCA are in fact an
integrated response to a multitude of qualitatively different triggers
possibly affecting gene expression at multiple and unrelated levels.
A bioassay-guided chemical isolation strategy was employed to
generate chemically refined and quantifiable putative morphoge-
netic cues from these natural biomaterials that would trigger larval
morphogenesis in vitro. This strategy yielded (1) an organic and an
aqueous fraction of the CCA Hydrolithon onkodes (Heydrich) that,
under laboratory conditions, triggered in a highly reproducible
manner, settlement, characterized by attached metamorphosed
juveniles [13] and (2) a crude extract of Pseudoalteromonas strain
J010 (J010-E) isolated from H. onkodes, known to contain
tetrabromopyrrole (TBP), that triggered larval metamorphosis,
characterized by non-attached metamorphosed juveniles [4,12].
PLOS ONE | www.plosone.org 1 March 2014 | Volume 9 | Issue 3 | e91082
The conceptual approach taken in the present study targeted
genes of interest (GOI) putatively involved in the early stages of
coral larval morphogenesis (1–3 hpi), using multiplex RT-qPCR
[12] to measure the gene response after short-term exposure to the
chemically refined morphogenetic cues, and ultimately to
discriminate between their possible modes of action. This
approach had several advantages over previous studies: (1) it
reduced the variance within biological replicates [14], (2)
improved the resolution of gene expression levels, (3) lowered
possible interferences from other components normally present in
environmental biomaterials (see above) that may elicit non-specific
changes in gene expression levels [7], and (4) decreased secondary
time-related effects of cues on downstream gene expression.
Discussed here are the putative roles of GOI in the early stages of
coral larval settlement and metamorphosis based on changes in
their expression profiles prior to any observed morphogenetic
transformation.
Materials and Methods
Ethics StatementThis work was undertaken under permit G10/33440.1, issued
by the Great Barrier Reef Marine Park Authority. No ethical
approval was required for any of the experimental research
described herein.
Sample collections and larval maintenanceColonies of the scleractinian coral A. millepora were collected
from Pelorus Island on the Great Barrier Reef (GBR; 18u339S
146u299E) and transported to the Australian Institute of Marine
Science (AIMS) prior to the predicted spawning events in
November 2010 and November 2011. Chips of the CCA
Hydrolithon onkodes (Heydrich) were collected from Trunk Reef
(GBR; 18u249S, 146u489E) and transported to AIMS in November
of 2010, 2011 and 2012. The taxonomic identity of all CCA
samples was confirmed prior to use [15]. Each CCA chip was
carefully removed from the solid substrate using sterile bone
cutters creating a thin layer without any other visible algae or
invertebrates and subsequently washed with 0.2 mm filtered
seawater (FSW). Coral larvae were obtained after fertilization of
gametes as described previously [4]. Larvae were raised in flow-
through 500 L tanks containing FSW at 27–28uC until they
became fully competent, as characterised by at least 80% of larvae
displaying an elongated shape, exhibiting active benthic searching
behaviour and settlement upon exposure to CCA. In this
controlled environment larvae are deemed competent approxi-
mately four days after fertilisation and can remain in this state for
an additional ten days [12]. Their high lipid content is used for
buoyancy and as an energy source [16] allowing them to survive at
least three weeks after settlement without feeding.
Growth conditions and extraction of metamorphosis-inducing bacteria
The larval metamorphosis-inducing cue was isolated from
Pseudolalteromonas strain J010 (JF309049) [4]. Briefly, bacterial
colonies (3.2 g) were carefully scraped off agar plates, suspended in
50 mL ethanol (64 mg/mL) and sonicated for 20 min (Soniclean
500T, SA). The resulting bacterial extract (J010-E) was filtered
(0.2 mm) and stored in the dark at 220uC.
Preparation of CCA-derived settlement cuesTwo settlement-inducing cues, derived from an organic extract
and an aqueous extract, were isolated from H. onkodes. An ethanol
extract of H. onkodes (2300 g wet weight, November 2011) was
fractionated on reversed phase C-18 vacuum flash chromatogra-
phy (RP-18 VFC, 806600 mm) by elution with Milli-Q water
(MQW, 600 mL), 10% methanol in MQW (600 mL), 20%
methanol in MQW (600 mL), 80% methanol (600 mL) in
MQW and 100% methanol (1200 mL). The 80% methanol
fraction (0.95 mg/mL; herein referred to as HOorg) induced high
rates of larval settlement in preliminary bioassays and was stored
at 220uC [13].
The aqueous extract was prepared as follows: H. onkodes (500 g
wet weight, November 2011) was washed with 500 mL MQW
three times to remove salts. These washings were discarded. The
washed CCA were autoclaved at 121uC for 60 min in 250 mL
MQW. This aqueous extract was decanted and the algae
autoclaved twice more (121uC for 60 min in 250 mL). The
pooled extract was ultrafiltrated (Grace Microcon-100, .100 kD),
freeze-dried, resuspended in 250 mL 10% ethanol (56.1 mg/mL)
in MQW, herein referred to as HOaq, and stored in the dark at
4uC [13].
HOorg was extracted over three consecutive years (2010–2012);
HOaq was extracted over two consecutive years (2011–2012).
Comparison of the proton nuclear magnetic resonance spectra of
each of these samples confirmed their chemical composition was
consistent (data not shown).
Determination of minimum exposure time of larvae tocues that elicit settlement and/or metamorphosis
Preliminary experiments were conducted using 6–9 day-old
swimming larvae in 6-well plates. In 2010, larvae were exposed to
J010-E (Table 1) to assess the minimum required exposure time of
larvae to the metamorphosis-inducing cue. The extract J010-E
(2 mL; 128 mg/mL) or 100% ethanol (2 mL negative control) were
added to 10 mL of 0.2 mm FSW, mixed thoroughly and
transferred to 6-well plates (Nunclon Delta Surface, Thermo
Scientific, Denmark; final concentration 12.8 mg/mL). Larvae
were added to each well (n = 20 per well) and monitored hourly for
visible signs of metamorphosis without settlement, characterised by
flattening into discs and septal development in floating polyps.
Following the same protocol, swimming larvae were exposed to
settlement-inducing cues HOorg (evaporated on the dish surface
before adding FSW) or HOaq (aliquot added to FSW) in 2011. No
cue was added to the control treatments (n = 6). In a preliminary
experiment, addition to the well and evaporation of the carrier
solvents (10% ethanol, 100% ethanol, 80% methanol and MQW)
to dryness resulted in no settlement, as observed with the no
solvent (blank) control (A. Negri, personal communication), and
therefore only the blank control was used.
Experimental design and sample collectionGene expression profiles may vary considerably throughout the
different coral life phases; pre-settlement motile larvae to post-
settlement metamorphosed primary polyps [7]. To avoid any
variation due to differences in larval development and to
accomplish meaningful comparisons between larvae exposed to
control conditions versus J010-E or CCA-derived HOorg and
HOaq cues, all assays were terminated before the onset of visible
metamorphosis without attachment or settlement (as determined
above). Assays with J010-E were terminated 1, 2 and 3 hours post
incubation (hpi), whereas assays with HOorg and HOaq were
terminated after 1 hpi (see experimental parameters in Table 1).
The extract J010-E (60 mL; 3.84 mg/mL) or 100% ethanol
(60 mL, control) was mixed with 250 mL FSW in 400 mL glass
beakers (Boeco, Germany; 6 replicates per treatment) to ensure
homogeneous distribution prior to the addition of a further 50 mL
FSW containing competent swimming larvae (six days-old,
Larval Gene Expression during Metamorphosis
PLOS ONE | www.plosone.org 2 March 2014 | Volume 9 | Issue 3 | e91082
n,300, final concentration 12.8 mg/mL). Aliquots of HOorg
(25 mL; 23.8 mg/mL) were applied to the base of 400 mL glass
beakers and allowed to evaporate, while HOaq (25 mL; 1.4 mg/
mL) was applied directly into the seawater (6 replicates per
treatment). FSW (50 mL) was added to 400 mL glass beakers and
gently mixed prior to the addition of 50 mL of FSW containing
swimming larvae (nine days-old, n,200) to give a final volume of
100 mL (final concentration HOorg 238 ng/mL and HOaq 14 mg/
mL). Blank treatments (no cues or solvents) were used as the
negative controls.
In all experiments, an additional glass beaker containing each of
the cues was left for 24 hpi to monitor larval metamorphosis and
mortality. After each observation time point, larvae were collected
on 5 mm, 25 mm diameter sterile filters under vacuum. Retained
larvae were transferred into 1.5 mL cryovials, snap-frozen in
liquid nitrogen and stored at 280uC.
Multiplex RT-qPCR AssaysForty-seven genes of interest (GOI) were selected for their
putative role(s) in larval settlement or in coral immune defence
pathways, and incorporated in two multiplex RT-qPCR assays
(Assay 1; immunity-related genes potentially involved in ontogen-
esis, and Assay 2; genes reportedly involved in settlement;
kanamycin (Kanr) internal control gene in both assays) as previously
described (Tables S1 and S2 in [12]). The suggested roles of the
GOI in relation to marine invertebrate larval settlement and
metamorphosis have been summarised and reported previously
(Table 1 in [12]). One negative template (T2) and one negative
Reverse Transcriptase (RT2; Kanr only) control was used in each
assay to test for cDNA and RNA contaminants, respectively,
according to the GenomeLabTM GeXP manual (a detailed
description for this procedure is reported in [17]). For technical
reasons the number of genes in every multiplex assay is limited to
approximately 30 [12,17]. The protocols for extraction of mRNA,
preparation of cDNA, amplification by PCR and subsequent
electrophoresis were adopted from Siboni et al. [12] with
modifications: 1) larval mRNA was measured twice (NanoDrop
ND-1000, Thermo Scientific, USA), averaged and diluted to
5 ng/mL (according to the GenomeLabTM GeXP manual); 2)
10 ng of mRNA was used in the reverse transcription mix; and 3)
dilution of PCR products was changed to 1:40 for J010-E and 1:20
for HO cues. Diluted PCR products were analysed individually on
an automated capillary electrophoresis sequencer (CEQTM 8800
Genetic Analysis System, Beckman-Coulter, Fullerton, CA, USA)
as follows: diluted PCR products (1 mL) were loaded into a 96-
well plate with 0.2 mL of DNA size standard (400 bp; Beckman-
Coulter) and 38.8 mL of Genome-Lab Sample loading solution.
Electropherograms were visualized, filtered and matrices generat-
ed for further analyses following the GenomeLabTM GeXP
manual (a detailed description for this procedure is reported in
Souter et al. [17]).
Statistical AnalysisData were normalised against Kanr. An expression stability
measure for all genes in both assays was performed using the
GeNorm program (http://medgen.ugent.be/genorm/) according
to Vandesompele et al. [18]. The most stable pair of genes was
used to normalize the gene expression levels of the GOI in
Microsoft Excel (2007) using the Geomean function (Table 1).
Further interrogation of the data was undertaken by normalisation
using three of the most stable genes in every assay (Figure S1) and
results compared with those from the pair of stable genes. For data
analysis, only samples with at least two technical repeats and
coefficient of variation percentage (%CV) lower than 25% were
considered. Statistical analyses were conducted using Kruskal–
Wallis (non-parametric one way analysis of variance by ranks)
followed by multiple comparisons of mean ranks for all groups
with STATISTICA version 10.0 (StatSoft, Tulsa, OK). Percent-
age differences of those genes that were differentially regulated
from control were calculated. Further, data were analysed by
principal component analysis (PCA) with PAST [19]. All PCA’s
were performed on a variance-covariance matrix, as all variables
were measured in the same units, and without any group
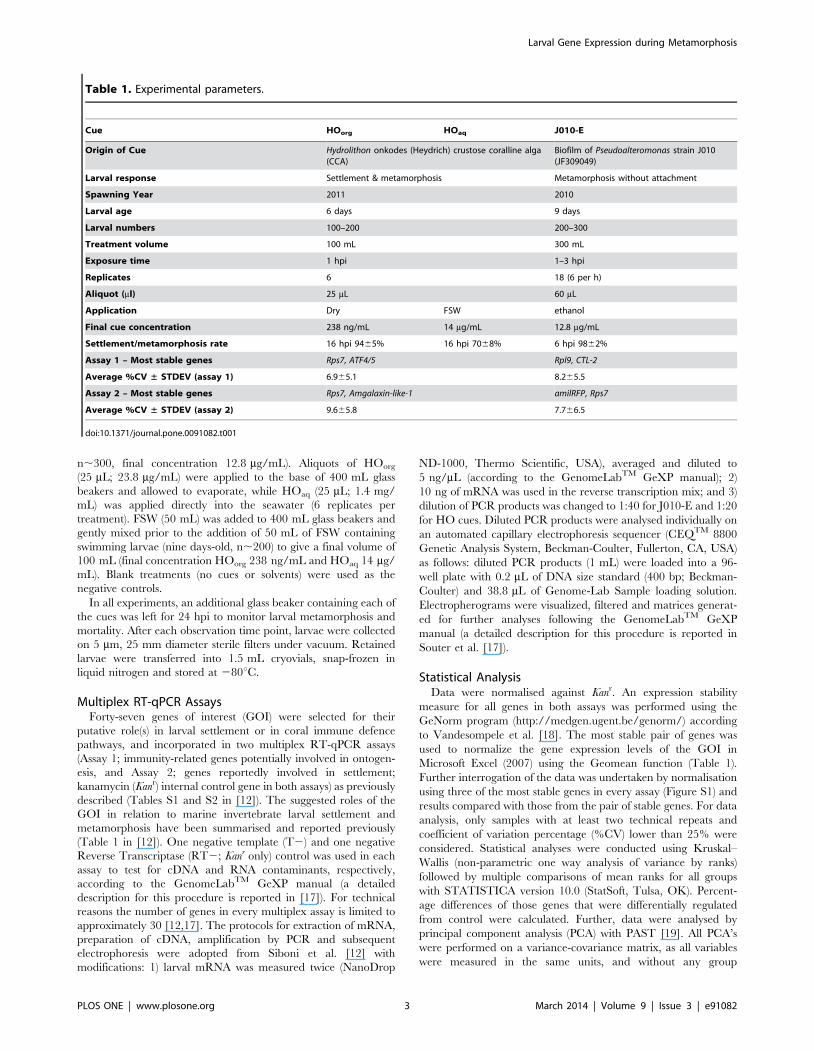
Table 1. Experimental parameters.
Cue HOorg HOaq J010-E
Origin of Cue Hydrolithon onkodes (Heydrich) crustose coralline alga(CCA)
Biofilm of Pseudoalteromonas strain J010(JF309049)
Larval response Settlement & metamorphosis Metamorphosis without attachment
Spawning Year 2011 2010
Larval age 6 days 9 days
Larval numbers 100–200 200–300
Treatment volume 100 mL 300 mL
Exposure time 1 hpi 1–3 hpi
Replicates 6 18 (6 per h)
Aliquot (ml) 25 mL 60 mL
Application Dry FSW ethanol
Final cue concentration 238 ng/mL 14 mg/mL 12.8 mg/mL
Settlement/metamorphosis rate 16 hpi 9465% 16 hpi 7068% 6 hpi 9862%
Assay 1 – Most stable genes Rps7, ATF4/5 Rpl9, CTL-2
Average %CV ± STDEV (assay 1) 6.965.1 8.265.5
Assay 2 – Most stable genes Rps7, Amgalaxin-like-1 amilRFP, Rps7
Average %CV ± STDEV (assay 2) 9.665.8 7.766.5
doi:10.1371/journal.pone.0091082.t001
Larval Gene Expression during Metamorphosis
PLOS ONE | www.plosone.org 3 March 2014 | Volume 9 | Issue 3 | e91082
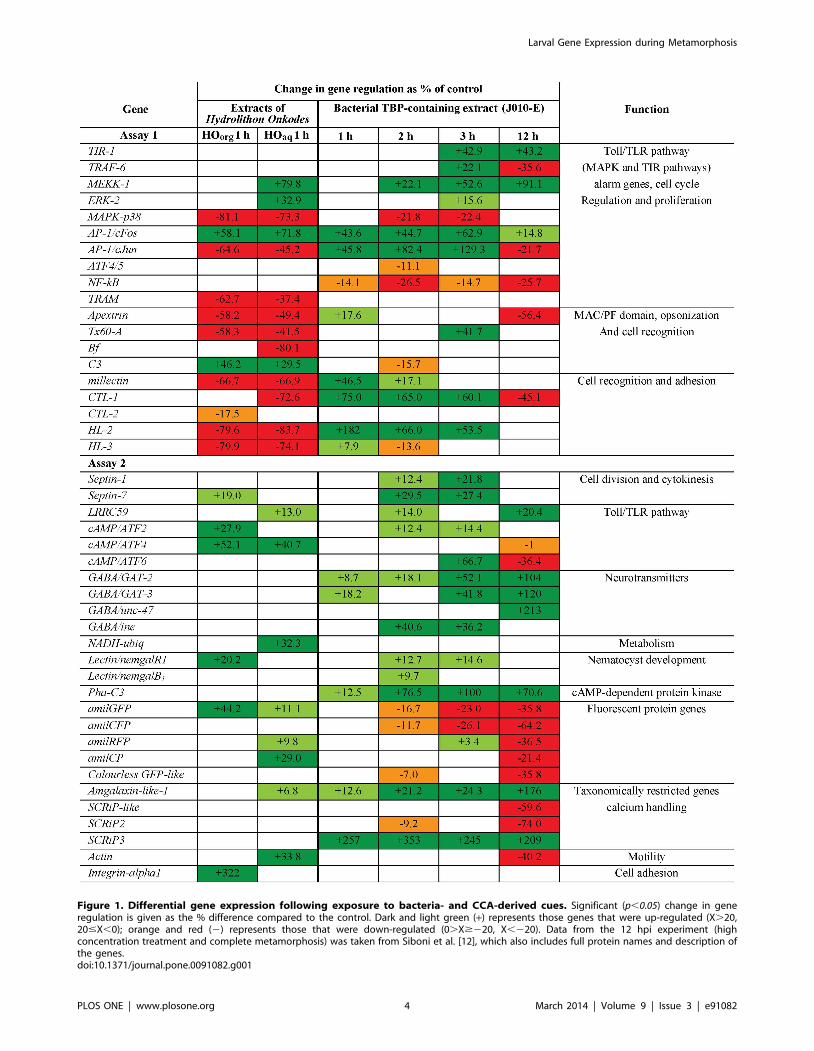
Figure 1. Differential gene expression following exposure to bacteria- and CCA-derived cues. Significant (p,0.05) change in generegulation is given as the % difference compared to the control. Dark and light green (+) represents those genes that were up-regulated (X.20,20#X,0); orange and red (2) represents those that were down-regulated (0.X$220, X,220). Data from the 12 hpi experiment (highconcentration treatment and complete metamorphosis) was taken from Siboni et al. [12], which also includes full protein names and description ofthe genes.doi:10.1371/journal.pone.0091082.g001
Larval Gene Expression during Metamorphosis
PLOS ONE | www.plosone.org 4 March 2014 | Volume 9 | Issue 3 | e91082
assumptions. PCA score plots are presented with convex hulls
highlighting groupings and showing PC1 and PC2.
Results
Determination of minimum exposure times of larvae tocues to elicit settlement or metamorphosis withoutattachment
The minimum exposure time to elicit larval responses varied
among the different cues. Visible signs of early metamorphosis
(flattening into discs and development forming floating polyps)
occurred 4 hpi with J010-E, whereas complete metamorphosis
without attachment of 9862% of larvae occurred 6 hpi. In order
to sample swimming larvae prior to any observable morphogenetic
changes, they were collected 1-3 hpi with J010-E (Table 1).
While no behavioural or developmental response was recorded
during the first 2 hpi with HOorg and HOaq, initial attachment was
observed after 3 hpi, and complete metamorphosis with attach-
ment was observed 16 hpi (settlement rates of 9465% (HOorg) and
7068% (HOaq), respectively). To reduce any variation in the
assays and to ensure that all larvae were sampled at the same
developmental phase, larvae were collected 1 hpi with HOorg or
HOaq (Table 1). It was noted that addition of the CCA-derived
cues directly to larvae in FSW resulted in ,5% mortality, as
determined by the release of mucus resulting from tissue
breakdown. This method of application was deemed unsuitable
for the current study. Pre-conditioning the FSW with the CCA-
derived cues followed by addition of larvae did not lead to any
mortality (as determined above by release of mucus); therefore
these conditions were used in the main experiment.
The larvae exposed to the three different cues displayed normal
swimming behaviour with no morphological signs of settlement at
the time of termination of experiments (1–3 hpi). With respect to
the two CCA-derived cues, no larval response was recorded during
the first 2 hpi. Furthermore, a subset of larvae settled, deposited a
calcareous skeleton, divided and underwent complete metamor-
phosis. These juveniles were successfully infected with Symbiodinium
(data not shown). No mucus resulting from tissue breakdown was
observed 24 hpi in response to any of the three cues.
Gene regulation/expressionGene pairs used to normalize expression levels and their
coefficients of variation (%CV) are listed in Table 1. For 11% of
the total number of data points in this study two technical
replicates were used instead of three, the third being unreliable.
The negative template (T2) control did not produce any
measureable products, as described by the GenomeLabTM GeXP
manual, while a clear measureable peak at 325 nucleotide size was
observed for the negative reverse transcriptase control (RT2; Kanr
only), confirming that electropherograms resulting from the larval
samples reflected transcribed gene amplification products. Only
genes that changed significantly (p,0.05, Kruskal–Wallis followed
by multiple comparisons of mean ranks) as compared to the
control were further analysed (Figures 1 and S1). Two boxplot
figures showing the variances, one for the CCA-derived cues,
HOorg and HOaq (Figure S2) and the other for the bacterial cue
J010-E (Figure S3), represent the complete data. The averaged
data is presented in Figure 1. The inclusion of a third gene in the
normalisation had only a minor impact on the results (Figure S1),
therefore only the two most stable genes, were used (Figure 1). It
should be noted that the original reference genes included in the
two assays [12] were not always the most stable genes according to
GeNorm program [18] (Table 1). In all instances at least one of
these stable genes was a ribosomal protein gene. Given that
significant differences in gene expression were observed at the
early time point and that no mucus strands, indicative of tissue
breakdown, were observed 24 hpi with any of the cues, the
concentrations used in this study were considered appropriate to
measure gene expression levels while maintaining larval compe-
tency.
Mutiplex RT-qPCR Assay 1; putative settlement/metamorphosis-related immunity genes
Expression levels of 16 GOI (MEKK-1, ERK-2, MAPK-p38, AP-
1/cFos, AP-1/cJun, NF-kB, TRAM, Apextrin, Tx60-A, Bf, C3,
millectin, CTL-1, CTL-2, HL-2 and HL-3; Figure 1) changed
significantly 1 hpi. During this time interval the lectins millectin,
CTL-1, CTL-2, HL-2 and HL-3 were predominately up-regulated
in response to the metamorphosis-inducing cue J010-E, whereas
their down-regulation was observed in response to one or both of
the settlement-inducing CCA-derived cues HOorg and HOaq. AP-
1/cFos was consistently up-regulated in response to J010-E, HOorg
and HOaq. The genes TIR-1, TRAF-6, MEKK-1, ERK-2, MAPK-
p38, ATF4/5, Tx60-A and C3 (Figure 1) caused significant
differences 2 and/or 3 hpi with J010-E, whereas AP-1/cFos, AP-
1/cJun, NF-kB, CTL-1 and HL-2 were significantly regulated at all
three sampling time points (Figure 1). Some genes were similarly
regulated following exposure to HOorg and HOaq (MAPK-p38, AP-
1/cFos, AP-1/cJun, TRAM, Apextrin, Tx60-A, C3, millectin, HL-2 and
HL-3) while others were differentially regulated (as compared to
control) after exposure to only one of the HO cues (MEKK-1, ERK-
2, Bf, CTL-1 and CTL-2; Figure 1). The PCA score plot (Figure 2A)
explained 79% of the variance and revealed clear differences in
gene regulation following exposure to J010-E or the CCA-derived
cues. Further PCA considering only the different exposure times to
J010-E (Figure 2C) and another comparing the organic and
aqueous CCA-derived cues (Figure 2E), explained 73% and 91%
of the variance, respectively. There were clear differences between
the time points, particularly 1–3 hpi compared to 12 hpi with
J010-E, and between the two CCA-derived cues. The associated
loading plots are available in (Figure S4).
Mutiplex RT-qPCR Assay 2; other putative settlement/metamorphosis-related genes
Similar to Assay 1, expression levels of 16 GOI changed
significantly after 1 hpi with at least one of the cues (Septin-7,
LRRC59, cAMP/ATF2, cAMP/ATF4, GABA/GAT-2, GABA/GAT-
3, NADH-ubiq, Lectin/nemgalR1, Pha-C3, amilGFP, amilRFP, amilCP,
Amgalaxin-like-1, SCRiP3, Actin and Integrin-alpha1; Figure 1). The
fluorescent protein genes (amilGFP, amilRFP and amilCP) were
significantly up-regulated in response to the CCA-derived cues 1
hpi, and all FP genes were significantly down-regulated in response
to J010-E but only after 2, 3 and/or 12 hpi (Figure 1). Some genes
presented significant differences only after 2 and/or 3 hpi with
J010-E (Septin-1, Septin-7, LRRC59, cAMP/ATF2, cAMP/ATF6,
GABA/ine, Lectin/nemgalR1, Lectin/nemgalB1, amilGFP, amilCFP,
amilRFP, Colorless GFP-like and SCRiP2; Figure 1), while others
presented constant significant differences at all three sampling time
points (GABA/GAT-2, Pha-C3, Amgalaxin-like-1 and SCRIP3;
Figure 1). Two genes (cAMP/ATF4 and amilGFP) were consistently
up-regulated following exposure to the two CCA-derived cues.
Four genes (Septin-7, cAMP/ATF2, Lectin/nemgalR1 and Integrin-
alpha1; Figure 1) were significantly up-regulated after exposure to
only HOorg, while six genes (LRRC59, NADH-ubiq, amilRFP,
amilCP, Amgalaxin-like-1 and Actin) were significantly up-regulated
following exposure to HOaq. As for Assay 1, the PCA score plot
(Figure 2B) explained 88% of the variance, and again revealed
Larval Gene Expression during Metamorphosis
PLOS ONE | www.plosone.org 5 March 2014 | Volume 9 | Issue 3 | e91082
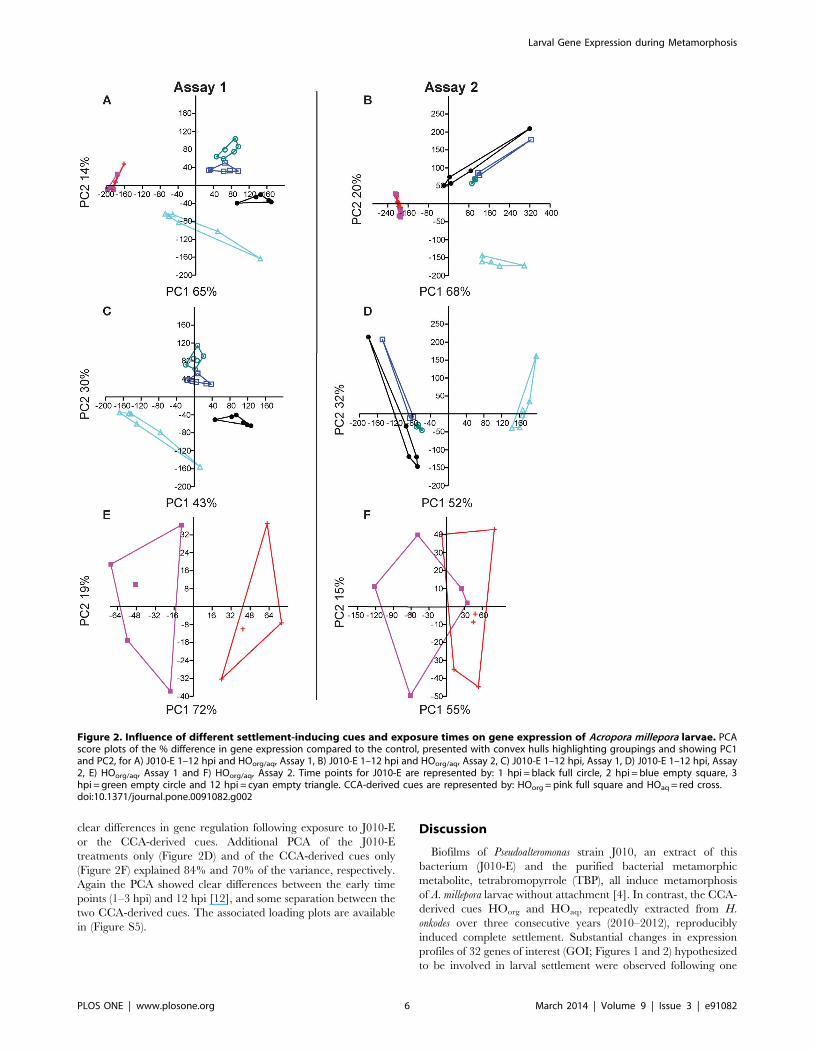
clear differences in gene regulation following exposure to J010-E
or the CCA-derived cues. Additional PCA of the J010-E
treatments only (Figure 2D) and of the CCA-derived cues only
(Figure 2F) explained 84% and 70% of the variance, respectively.
Again the PCA showed clear differences between the early time
points (1–3 hpi) and 12 hpi [12], and some separation between the
two CCA-derived cues. The associated loading plots are available
in (Figure S5).
Discussion
Biofilms of Pseudoalteromonas strain J010, an extract of this
bacterium (J010-E) and the purified bacterial metamorphic
metabolite, tetrabromopyrrole (TBP), all induce metamorphosis
of A. millepora larvae without attachment [4]. In contrast, the CCA-
derived cues HOorg and HOaq, repeatedly extracted from H.
onkodes over three consecutive years (2010–2012), reproducibly
induced complete settlement. Substantial changes in expression
profiles of 32 genes of interest (GOI; Figures 1 and 2) hypothesized
to be involved in larval settlement were observed following one
Figure 2. Influence of different settlement-inducing cues and exposure times on gene expression of Acropora millepora larvae. PCAscore plots of the % difference in gene expression compared to the control, presented with convex hulls highlighting groupings and showing PC1and PC2, for A) J010-E 1–12 hpi and HOorg/aq, Assay 1, B) J010-E 1–12 hpi and HOorg/aq, Assay 2, C) J010-E 1–12 hpi, Assay 1, D) J010-E 1–12 hpi, Assay2, E) HOorg/aq, Assay 1 and F) HOorg/aq, Assay 2. Time points for J010-E are represented by: 1 hpi = black full circle, 2 hpi = blue empty square, 3hpi = green empty circle and 12 hpi = cyan empty triangle. CCA-derived cues are represented by: HOorg = pink full square and HOaq = red cross.doi:10.1371/journal.pone.0091082.g002
Larval Gene Expression during Metamorphosis
PLOS ONE | www.plosone.org 6 March 2014 | Volume 9 | Issue 3 | e91082
hour post incubation (hpi) with each of these cues (J010-E, HOorg
or HOaq) and prior to any visible signs of morphogenesis. The
PCA score plots (Figure 2) show a clear separation between the
different cues and time of exposure, thus correlating the early
response of genes with downstream biological changes leading to
metamorphosis or settlement. Statistical separation of the J010-E
treatments from the CCA-derived cues HOorg and HOaq was
largely explained by the regulation of the immunity-related genes
MAPK-p38, AP-1/cJun, the lectins millectin, HL-2, tissue remodel-
ling genes Apextrin, Tx60-A, cysteine-rich protein genes SCRiP3,
Amgalaxin-like-1 and Pha-C3 (Figures 2A–B, S4A and S5A). It
should be noted that genes with a low expression difference as
compared to the control, even though significant, will most likely
have lower biological importance at that early time point in larval
development.
MAPK-p38 and AP-1/cJun form the AP-1 early response
transcription factor of the Toll/TLR pathway [20] and are
associated with the activating transcription factors cAMP-ATF. All
three cues showed a similar trend in the regulation of MEKK-1,
ERK-2, MAPK-p38, AP-1/cFos, and cAMP/ATF2 (Figure 1),
indicating common activation of the immunity response in the
early developmental (1–3 hpi) phase [5,6,8,10–12,21,22]. Howev-
er, AP-1/cJun exhibited an opposite response to J010-E over time
but showed the same response at 12 hpi and with the two CCA-
derived cues. TRAM and NF-kB (Figure 1) were also differently
expressed, with TRAM responding to both CCA-derived cues and
NF-kB responding to J010-E, suggesting different roles during the
early stages of settlement and metamorphosis.
Changes in swimming and searching behaviour followed by
larval settlement [1,6] involve cell-surface recognition mechanisms
mediated by lectins [23] including substrate selection [8],
activation of tissue remodelling [5,6,24], nematocyst development
[5] and establishment of symbiosis [5]. Initial gene expression
patterns in larvae exposed to the CCA-derived cues were
characterised by down-regulation of the lectins millectin, CTL-1,
CTL-2, HL-2 and HL-3 (Figure 1). Exposure to J010-E, however,
resulted mostly in up-regulation (1–3 hpi) with gene expression
returning to baseline levels after metamorphosis (12 hpi)
highlighting opposing roles of these genes in the early stages of
metamorphosis (1–3 hpi) and settlement.
Strong up-regulation of Apextrin and Tx60-A during larval
development correlates with tissue remodelling function
[5,7,8,10,25]. Exposure to both CCA-derived cues 1 hpi resulted
in down-regulation of both genes, indicating no initiation of tissue
re-modelling. Exposure to J010-E elicited the opposite response
suggesting tissue remodelling in preparation for metamorphosis
had commenced. After 12 hpi with J010-E down-regulation of
Apextrin was observed correlating with complete metamorphosis
without attachment [12].
Galaxin-related proteins are important structural proteins in the
calcifying organic matrix of scleractinian corals [26]. Amgalaxin-
like-1 is expressed strongly in larvae and settled primary polyps but
not in adult colonies [11]. The up-regulation of Amgalaxin-like-1 in
larvae exposed to J010-E and HOaq (1 hpi to 12 hpi) confirms its
involvement in early development. The expression of genes
encoding for other cysteine-rich proteins, the SCRiPs proteins,
also changed throughout the developmental transition suggesting
distinct roles in coral development [22] and bio-mineralization
[22]. SCRiP3 was up-regulated following 1-12 hpi with J010-E,
while SCRiP2 was down-regulated in response to J010-E, similar to
that reported previously [6-8,22] highlighting a role in metamor-
phosis. Pha-C3, known to mediate larval development and
settlement in Hydroides elegans [27] was up-regulated after exposure
to J010-E. The expression levels of SCRiPs, Amgalaxin-like-1 and
Pha-C3 genes did not return to baseline levels, even after
metamorphosis in the water column, but continued to be regulated
12 hpi with J010-E [12] correlating with continued development
of septa. No change in Pha-C3 or SCRiPs expression profiles was
observed after short term (1 hpi) exposure to either of the CCA-
derived cues.
Although Actin did not influence significantly the separation
between J010-E and the CCA-derived cues, long-term (12 hpi)
exposure to J010-E resulted in its down-regulation coinciding with
the formation of non-swimming floating metamorphosed larvae
[12], similar to that observed by Hayward et al. [7] while, up-
regulation occurred in larvae exposed to HOaq (1 hpi). Further-
more, the chemical composition of the two CCA-derived cues
elicited different gene expression profiles 1 hpi even though both
cues ultimately resulted in normal settlement 16 hpi. These results
provide further evidence that up-regulation of Actin, which is
linked to movement in coral larvae, likely drives larval settlement.
Differential gene expression of swimming larvae exposed to
J010-E over time (1–3 hpi and 12 hpi) enabled further decoupling
of GOI involved in different stages of metamorphosis. In both
assays, the PCA score plots associated with J010-E only
(Figure 2C–D), showed that the early time points were clearly
distinct from the 12 hpi time point and correlated with swimming
and metamorphosed larva, respectively. This separation was
strongly influenced by the regulation of several genes involved in
the Toll/TLR pathway, cell recognition, cell adhesion, neuro-
transmission, FP-related metabolism and calcium handling: AP-1/
cJun, MEKK-1, Apextrin, HL-2, GABA/GAT-3, Amgalaxin-like-1,
SCRiP2, SCRiP3, with a lesser influence by TIR-1, TRAF-6, AP-
1/cFos, millectin, CTL-2, Lectin/nemgalR1, Lectin/nemgalB1, amilGFP
and amilCFP (Figures 2C–D, S4B and S5B). This shift in gene
expression profiles suggests that their putative roles may change as
the larvae shift from the early (1–3 hpi) to later stage (12 hpi) of
coral morphogenesis. Furthermore, the 1 hpi treatments were
clearly distinct from those after 2–3 hpi, indicating that genes are
being regulated earlier than previously reported [6], thus further
supporting a progression through time with respect to gene
expression (Figure 2C–D).
In both assays, principal component analysis and the PCA score
plots associated with HOorg and HOaq (Figure 2E–F) showed a
clear distinction between the two treatments, even though both
ultimately resulted in settlement. While the expression profiles of
12 GOI (mostly immunity-related genes, Figure 1) were found to
be similar following exposure to the two chemically distinct CCA-
derived cues, the expression profiles of 15 GOI (Figure 1) were
different, that is they were regulated following exposure to only
one of the CCA-derived cues, but were never oppositely regulated.
The separation of the two treatments was influenced strongly by
the regulation of TIR-1, AP-1/cJun, AP-1/cFos, MEKK-1, ERK-2,
Colorless GFP-like, amilGFP and cAMP/ATF6, with a lesser influence
by NF-kb, MAPK-p38, C3, Apextrin, CTL-2 and Tx60-A (Figures 2E–
F, S4C and S5C). The immunity-related Toll/TLR pathway
genes contributed mostly to the separation of these treatments.
These observations raise the possibility that 1) more than one
component influenced/regulated the immunity-related processes
involved in both attachment and metamorphosis, or 2) that a
synergistic effect was causative for this observation. Since the
cnidarian gene cascade leading to settlement has not yet been fully
elucidated [10], it cannot be ruled out that numerous pathways
may be regulated by many different components within the
environment (i.e. bacterial biofilm, CCA).
Regulation of the fluorescent protein (FP) genes influenced
separation between the different time points for J010-E exposure
and also between the two settlement cues. While no initial
Larval Gene Expression during Metamorphosis
PLOS ONE | www.plosone.org 7 March 2014 | Volume 9 | Issue 3 | e91082
significant differences were observed 1 hpi with J010-E, there was
a downward trend in expression levels of amilGFP, amilCFP and
Colourless GFP-like (Figure 1), with all FP genes down-regulated
after 12 hpi [12]. FP genes (particularly RFP and CP) were
reportedly up-regulated in compromised corals, activating an
antioxidant response [28] and given the strong down-regulation of
FP genes following exposure to J010-E it is likely the larvae are
responding to TBP [29] in J010-E. FP genes amilGFP, amilRFP and
amilCP (Figure 1) were mostly up-regulated 1 hpi with HOaq
indicating a different role in the early stages of settlement
compared to metamorphosis. Similarly, Beltran-Ramirez [30]
reported a strong green FP (GFP) signal in swimming larvae, up-
regulation of FP in both the ectoderm and endoderm of A. millepora
larvae undergoing settlement and down-regulation in ectodermal
tissue after metamorphosis [30]. The current study corroborates
this, providing further evidence that FP genes are differentially
regulated in swimming larvae post exposure to metamorphosis- or
settlement-inducing cues and prior to visible metamorphic
changes. Up-regulation of amilCP 1 hpi with HOaq further
supports an earlier observation that chromoprotein (CP) gene
expression was detected primarily during gastrulation and was
mostly endodermal [30]. Furthermore, A. tenuis larvae exposed to
CCA chips showed an increase in red FP (RFP) expression prior to
but not after settlement, while cyan FP (CFP) expression increased
post settlement [21]. Exposure of A. millepora larvae to J010-E
resulted in down-regulation of these two FP genes 2-12 hpi which
correlated to complete metamorphosis.
The CCA-derived cue HOorg represents the organic-soluble,
hydrophobic, low molecular weight components of the H. onkodes
extract while HOaq was derived from an autoclaved aqueous
extract of CCA and contained high molecular weight compounds.
Both CCA-derived cues ultimately induced complete settlement,
producing competent polyps that were able to acquire Symbiodinium
and deposit a skeleton (data not shown). High specificity of large
molecule-mediated recognition has previously been observed in a
wide variety of biological systems [31]. Based on these observa-
tions HOaq may be acting similarly to lectins at the cell surface,
activating the downstream MAPK pathway, whereas HOorg
influences, possibly within the cell, changes in searching behav-
iour. It should also be noted that like any other surface, CCAs are
known to harbour bacterial biofilms [32] and that these may
indeed be the source of the observed inductive capacity of CCA
fractions on coral larval settlement. Our findings show that two
different and distinct chemical classes can elicit the same
settlement response by regulating a different set of genes,
highlighting that there is more than one pathway involved.
This study has enabled further elucidation of gene function(s)
through a time series investigation into their responses to CCA-
and bacteria-derived cues. Importantly, this gene regulation
differed not only with regard to the time of exposure but also to
the morphogenetic outcome; settlement (CCA-derived cues) or
metamorphosis without attachment (bacteria-derived cue). It
should be noted that while the genes investigated in this study
are known for A. millepora, the gene regulation pathways have not
been fully elucidated and are mostly based on vertebrate systems,
providing only putative functionality. Even so, the results of this
study support the notion that regulation of specific genes is driven
by environmental cues throughout the different phases of A.
millepora larval settlement, from initial induction to cellular
differentiation and complete metamorphosis resulting in settle-
ment.
Supporting Information
Figure S1 Differential gene expression following expo-sure to bacteria- and CCA-derived cues. Significant
(p,0.05) change in gene regulation is given as the % difference
compared to the control. Dark and light green (+) represents those
genes that were up-regulated (X.20, 20#X,0); orange and red
(2) represents those that were down-regulated (0.X$220,
X,220). Data normalised to the three most stable genes. Assay
1 CCA: Rps7, ATF4/5 and NF-kB, Assay 2 CCA: Rps7, Amgalaxin-
like-1 and Lectin/nemgalB2, Assay 1 J010-E: Rpl9, CTL-2 and
ATF4/5; Assay 2 J010-E: amilRFP, Rps7 and cAMP/ATF4. Data
from the 12 hpi experiment (high concentration treatment and
complete metamorphosis) was taken from Siboni et al. [12], which
also includes full protein names and description of the genes.
(TIF)
Figure S2 Differential gene expression following expo-sure to CCA-derived cues, HOorg and HOaq. The boxplots
represent change in gene regulation as % difference from control.
Only cases which present significant (p,0.05, Kruskal–Wallis
followed by multiple comparisons of mean ranks) differences from
control were included. For each gene, the left region represents
HOorg and the right region represents HOaq.
(TIF)
Figure S3 Differential gene expression following expo-sure to the bacterial cue J010-E over time (1–3 hpi). The
boxplots represent changes in gene regulation expressed as the %
difference from the control. Only cases that present significant
(p,0.05, Kruskal–Wallis followed by multiple comparisons of
mean ranks) differences from the control were included. For each
gene, the left region represents 1 hpi, the middle region represents
2 hpi and the right region represents 3 hpi. 12 hpi data is available
in Siboni et al. [12].
(TIF)
Figure S4 PCA loading plots of Assay 1 followingexposure to settlement and metamorphosis cues. PCA
loading plots (PC1 and PC2) of the % difference in gene
expression compared to the control for A) J010-E 1–12 hpi and
HOorg/aq, B) J010-E 1–12 hpi and C) HOorg/aq.
(TIF)
Figure S5 PCA loading plots of Assay 2 followingexposure to settlement and metamorphosis cues. PCA
loading plots (PC1 and PC2) of the percentage difference in gene
expression compared to the control for A) J010-E 1–12 hpi and
HOorg/aq. B) J010-E 1–12 hpi and C) HOorg/aq.
(TIF)
Acknowledgments
We thank A. Negri and E. Puill-Stephan for the help with sample
collections and taxonomic identification of crustose coralline algae.
Author Contributions
Conceived and designed the experiments: NS. Performed the experiments:
NS. Analyzed the data: NS CAM. Contributed reagents/materials/
analysis tools: NS DA JT TH. Wrote the paper: NS CAM.
Larval Gene Expression during Metamorphosis
PLOS ONE | www.plosone.org 8 March 2014 | Volume 9 | Issue 3 | e91082
References
1. Heyward AJ, Negri AP (1999) Natural inducers for coral larval metamorphosis.
Coral Reefs 18: 273–279.
2. Negri AP, Webster NS, Hill RT, Heyward AJ (2001) Metamorphosis of
broadcast spawning corals in response to bacteria isolated from crustose algae.
Marine Ecology Progress Series 223: 121–131.
3. Hadfield MG (2011) Biofilms and marine invertebrate larvae: what bacteria
produce that larvae use to choose settlement sites. Annual review of marine
science 3: 453–470.
4. Tebben J, Tapiolas DM, Motti CA, Abrego D, Negri AP, et al. (2011) Induction
of Larval Metamorphosis of the Coral Acropora millepora by Tetrabromopyrrole
Isolated from a Pseudoalteromonas Bacterium. PLoS ONE 6: e19082.
5. Grasso LC, Maindonald J, Rudd S, Hayward DC, Saint R, et al. (2008)
Microarray analysis identifies candidate genes for key roles in coral
development. BMC Genomics 9: 540.
6. Grasso LC, Negri AP, Foret S, Saint R, Hayward DC, et al. (2011) The biology
of coral metamorphosis: Molecular responses of larvae to inducers of settlement
and metamorphosis. Developmental Biology 353: 411–419.
7. Hayward DC, Hetherington S, Behm CA, Grasso LC, Foret S, et al. (2011)
Differential gene expression at coral settlement and metamorphosis - A
subtractive hybridization study. PLoS ONE 6.
8. Meyer E, Aglyamova GV, Matz MV (2011) Profiling gene expression responses
of coral larvae (Acropora millepora) to elevated temperature and settlement inducers
using a novel RNA-Seq procedure. Molecular Ecology 20: 3599–3616.
9. Meyer E, Davies S, Wang S, Willis BL, Abrego D, et al. (2009) Genetic variation
in responses to a settlement cue and elevated temperature in the reef-building
coral Acropora millepora. Marine Ecology Progress Series 392: 81–92.
10. Miller DJ, Hemmrich G, Ball EE, Hayward DC, Khalturin K, et al. (2007) The
innate immune repertoire in Cnidaria - ancestral complexity and stochastic gene
loss. Genome Biology 8.
11. Reyes-Bermudez A, Lin ZY, Hayward DC, Miller DJ, Ball EE (2009)
Differential expression of three galaxin-related genes during settlement and
metamorphosis in the scleractinian coral Acropora millepora. BMC Evolutionary
Biology 9: 178.
12. Siboni N, Abrego D, Seneca F, Motti CA, Andreakis N, et al. (2012) Using
Bacterial Extract along with Differential Gene Expression in Acropora millepora
Larvae to Decouple the Processes of Attachment and Metamorphosis. PLoS
ONE 7: e37774.
13. Tebben J (2013) Identification of inducers of settlement of invertebrate larvae.
PhD thesis, University of New South Wales – Centre of Marine Bio-Innovation,
Sydney, Australia.
14. Cheng W-C, Shu W-Y, Li C-Y, Tsai M-L, Chang C-W, et al. (2012) Intra- and
Inter-Individual variance of gene expression in clinical studies. PLoS ONE 7:
e38650.
15. Harrington L (2004) Ecology of crustose coralline algae; interactions with
scleractinian corals and responses to environmental conditions PhD thesis, Jams
Cook University, Townsville, Australia.
16. Harii S, Nadaoka K, Yamamoto M, Iwao K (2007) Temporal changes in
settlement, lipid content and lipid composition of larvae of the spawninghermatypic coral Acropora tenuis. Marine Ecology Progress Series 346: 89–96.
17. Souter P, Bay LK, Andreakis N, Csaszar N, Seneca FO, et al. (2011) Amultilocus, temperature stress-related gene expression profile assay in Acropora
millepora, a dominant reef-building coral. Molecular Ecology Resources 11: 328–
334.18. Vandesompele J, De Preter K, Pattyn F, Poppe B, Van Roy N, et al. (2002)
Accurate normalization of real-time quantitative RT-PCR data by geometricaveraging of multiple internal control genes. Genome Biology 3: 1–12.
19. Hammer Ø, Harper DAT, Ryan PD (2001) PAST: paleontological statistics
software package for education and data analysis. Palaeontologia Electronica 4.20. Hess J, Angel P, Schorpp-Kistner M (2004) AP-1 subunits: quarrel and harmony
among siblings. Journal of Cell Science 117: 5965–5973.21. Palmer CV, Graham E, Baird AH (2012) Immunity through early development
of coral larvae. Developmental & Comparative Immunology 38: 395–399.22. Sunagawa S, DeSalvo MK, Voolstra CR, Reyes-Bermudez A, Medina M (2009)
Identification and Gene Expression Analysis of a Taxonomically Restricted
Cysteine-Rich Protein Family in Reef-Building Corals. PLoS ONE 4: e4865.23. Robinson MJ, Sancho D, Slack EC, LeibundGut-Landmann S, Sousa CRe
(2006) Myeloid C-type lectins in innate immunity. Nature Immunology 7: 1258–1265.
24. Muller WA, Leitz T (2002) Metamorphosis in the Cnidaria. Canadian Journal of
Zoology-Revue Canadienne De Zoologie 80: 1755–1771.25. Ball EE, Hayward DC, Reece-Hoyes JS, Hislop NR, Samuel G, et al. (2002)
Coral development: from classical embryology to molecular control. Interna-tional Journal of Developmental Biology 46: 671–678.
26. Fukuda I, Ooki S, Fujita T, Murayama E, Nagasawa H, et al. (2003) Molecularcloning of a cDNA encoding a soluble protein in the coral exoskeleton.
Biochemical and Biophysical Research Communications 304: 11–17.
27. Li HL, Song LS, Qian PY (2008) Cyclic AMP concentration and protein kinasea (PKA) gene expression at different developmental stages of the polychaete
Hydroides elegans. Journal of Experimental Zoology Part B-Molecular andDevelopmental Evolution 310B: 417–427.
28. Palmer CV, Modi CK, Mydlarz LD (2009) Coral fluorescent proteins as
antioxidants. PLoS ONE 4: e7298.29. Orhan IE, Ozcelik B, Konuklugil B, Putz A, Kaban UG, et al. (2012) Bioactivity
screening of the selected Turkish marine sponges and three compounds fromAgelas oroides. Records of Natural Products 6: 356–367.
30. Beltran-Ramirez V (2010) Molecular aspects of the fluorescent proteinhomologues in Acropora millepora. PhD thesis, Jams Cook University, Townsville,
Australia.
31. Morse DE, Morse A (1991) Enzymatic characterization of the morphogenrecognized by Agaricia humilis (scleractinian coral) larvae. The Biological Bulletin
181: 104–122.32. Webster NS, Soo R, Cobb R, Negri AP (2011) Elevated seawater temperature
causes a microbial shift on crustose coralline algae with implications for the
recruitment of coral larvae. Isme Journal 5: 759–770.
Larval Gene Expression during Metamorphosis
PLOS ONE | www.plosone.org 9 March 2014 | Volume 9 | Issue 3 | e91082
Related Documents