RESEARCH Open Access Gender differences in healthy life expectancy among Brazilian elderly Ana Paula Belon 1,2* , Margareth G Lima 2 and Marilisa BA Barros 2 Abstract Background: This study examined gender differences in healthy life expectancy (HLE) and unhealthy life expectancy (UHLE) among people aged 60 years or older living in a large Brazilian city. Methods: Based on Chiang method, abridged life tables were constructed for men and for women. To calculate HLE, the Sullivan method was applied. Estimates of the prevalence of self-rated health and self-reported functional disability (global, mild/moderate, and severe) were obtained from a population-based household survey carried out in 2008, which involved non-institutionalized individuals. Results: Findings showed that women live longer and these extra years would be spent in good self-rated health. For example, women aged 60 would live, on average, 4 more years in good health in comparison to men. In terms of global limitations and mild/moderate limitations, no gender differences were detected for HLE. However, UHLE was statistically higher among women than among men at all ages in the global limitations and mild/moderate limitations (except for the age 80). Women at age 60, for instance, could expect to live 3.1 years longer with mild/moderate limitations compared to men. Gender differences were identified for severe limitations for either HLE or UHLE. In comparison to men, women at age 60, for example, would expect to live 2.5 and 2.0 more years without and with severe limitations. Conclusions: By showing that the advantage of longer life expectancy among women is not necessarily accompanied by worse health conditions, these findings add some evidence to the debate about male-female health-survival paradox. Policy efforts are necessary to reduce gender differences in the quantity and quality of years to be lived, providing equal opportunities to women and men live longer with quality of life, autonomy, and independence. Background Life expectancy in Brazil has increased steadily during the 20th century, rising from 33.7 years in 1900 [1] to 73.5 years in 2010 [2]. However, this considerable im- provement has been uneven between men and women. As in several other countries, in Brazil women live lon- ger than men and this gender gap in the life expectancy has widened over time. In 1940, women could expect to live 4.4 years more than men; this difference increased to 7.8 years in 2000 [3]. Although the gender gap had decreased to 7.6 years in 2010 [2], mainly due to the re- duction in the homicide rates among men, the mortality differences between sexes are still excessive. Among older people, the gender differentials in life ex- pectancy have increased over time. Between 2000 and 2010, the gender gap in life expectancy at age 60 wid- ened from 2.9 (18.8 years for men versus 21.7 years for women) to 3.4 years (19.6 years for men versus 23.0 years for women) [2]. Because of this male excess mortality, the accentuated aging process in Brazil has been characterized by an increasing proportion of women aged 60 or older; women constituted 55.5% of the total elderly population in 2010, which was estimated at 20,6 million people [4]. This proportion increases with age, reaching 61.4% of the population aged 80 years or older in 2010 (http://www. sidra.ibge.gov.br/bda/tabela/listabl.asp?c=200&z=t&o=3). Nevertheless, the female advantage in life expectancy does not necessarily mean that women are healthier than men. Studies using self-report health status measures in- dicate higher prevalence of functional limitations and poor health among women [5-8], suggesting that the additional years may not necessarily be lived in healthy conditions. * Correspondence: [email protected] 1 School of Public Health, University of Alberta, Edmonton, AB, Canada 2 Department of Public Health, School of Medical Sciences, State University of Campinas, Campinas, São Paulo, Brazil © 2014 Belon et al.; licensee BioMed Central Ltd. This is an Open Access article distributed under the terms of the Creative Commons Attribution License (http://creativecommons.org/licenses/by/2.0), which permits unrestricted use, distribution, and reproduction in any medium, provided the original work is properly credited. The Creative Commons Public Domain Dedication waiver (http://creativecommons.org/publicdomain/zero/1.0/) applies to the data made available in this article, unless otherwise stated. Belon et al. Health and Quality of Life Outcomes 2014, 12:88 http://www.hqlo.com/content/12/1/88

Welcome message from author
This document is posted to help you gain knowledge. Please leave a comment to let me know what you think about it! Share it to your friends and learn new things together.
Transcript
Belon et al. Health and Quality of Life Outcomes 2014, 12:88http://www.hqlo.com/content/12/1/88
RESEARCH Open Access
Gender differences in healthy life expectancyamong Brazilian elderlyAna Paula Belon1,2*, Margareth G Lima2 and Marilisa BA Barros2
Abstract
Background: This study examined gender differences in healthy life expectancy (HLE) and unhealthy lifeexpectancy (UHLE) among people aged 60 years or older living in a large Brazilian city.
Methods: Based on Chiang method, abridged life tables were constructed for men and for women. To calculateHLE, the Sullivan method was applied. Estimates of the prevalence of self-rated health and self-reported functionaldisability (global, mild/moderate, and severe) were obtained from a population-based household survey carried outin 2008, which involved non-institutionalized individuals.
Results: Findings showed that women live longer and these extra years would be spent in good self-rated health.For example, women aged 60 would live, on average, 4 more years in good health in comparison to men. In termsof global limitations and mild/moderate limitations, no gender differences were detected for HLE. However, UHLE wasstatistically higher among women than among men at all ages in the global limitations and mild/moderate limitations(except for the age 80). Women at age 60, for instance, could expect to live 3.1 years longer with mild/moderate limitationscompared to men. Gender differences were identified for severe limitations for either HLE or UHLE. In comparison to men,women at age 60, for example, would expect to live 2.5 and 2.0 more years without and with severe limitations.
Conclusions: By showing that the advantage of longer life expectancy among women is not necessarily accompanied byworse health conditions, these findings add some evidence to the debate about male-female health-survival paradox.Policy efforts are necessary to reduce gender differences in the quantity and quality of years to be lived, providingequal opportunities to women and men live longer with quality of life, autonomy, and independence.
BackgroundLife expectancy in Brazil has increased steadily duringthe 20th century, rising from 33.7 years in 1900 [1] to73.5 years in 2010 [2]. However, this considerable im-provement has been uneven between men and women.As in several other countries, in Brazil women live lon-ger than men and this gender gap in the life expectancyhas widened over time. In 1940, women could expect tolive 4.4 years more than men; this difference increasedto 7.8 years in 2000 [3]. Although the gender gap haddecreased to 7.6 years in 2010 [2], mainly due to the re-duction in the homicide rates among men, the mortalitydifferences between sexes are still excessive.Among older people, the gender differentials in life ex-
pectancy have increased over time. Between 2000 and
* Correspondence: [email protected] of Public Health, University of Alberta, Edmonton, AB, Canada2Department of Public Health, School of Medical Sciences, State University ofCampinas, Campinas, São Paulo, Brazil
© 2014 Belon et al.; licensee BioMed Central LCommons Attribution License (http://creativecreproduction in any medium, provided the orDedication waiver (http://creativecommons.orunless otherwise stated.
2010, the gender gap in life expectancy at age 60 wid-ened from 2.9 (18.8 years for men versus 21.7 years forwomen) to 3.4 years (19.6 years for men versus 23.0 yearsfor women) [2]. Because of this male excess mortality, theaccentuated aging process in Brazil has been characterizedby an increasing proportion of women aged 60 or older;women constituted 55.5% of the total elderly populationin 2010, which was estimated at 20,6 million people [4].This proportion increases with age, reaching 61.4% of thepopulation aged 80 years or older in 2010 (http://www.sidra.ibge.gov.br/bda/tabela/listabl.asp?c=200&z=t&o=3).Nevertheless, the female advantage in life expectancy
does not necessarily mean that women are healthier thanmen. Studies using self-report health status measures in-dicate higher prevalence of functional limitations andpoor health among women [5-8], suggesting that theadditional years may not necessarily be lived in healthyconditions.
td. This is an Open Access article distributed under the terms of the Creativeommons.org/licenses/by/2.0), which permits unrestricted use, distribution, andiginal work is properly credited. The Creative Commons Public Domaing/publicdomain/zero/1.0/) applies to the data made available in this article,
Belon et al. Health and Quality of Life Outcomes 2014, 12:88 Page 2 of 10http://www.hqlo.com/content/12/1/88
This contrast between female disadvantage in morbid-ity and female advantage in mortality is known as themale-female health-survival paradox [9-11]. The mostcommon explanations for this paradox are based on bio-logical differences and socio-cultural factors shapinggender roles and, by consequence, health behaviours anduse of health services [9,12,13]. Gender differences inself-reported health are another explanation, althoughthere is no evidence for this kind of information bias[14]. Gender differences in terms of survey participationare also considered a factor explaining the differencesamong men and women; however, a selection bias wouldhave only a small contribution to the male-femalehealth-survival paradox [14]. On the other hand, somestudies have questioned this paradox, by showing thatthe magnitude or even the existence of a female excessmorbidity depends on the health indicator and stage ofthe life course analyzed [15,16].A way of developing a comprehensive understanding
of gender inequalities in mortality and morbidity is toestimate the healthy life expectancy (HLE). By combin-ing information on death and prevalence of healthy andunhealthy states, the total life expectancy is divided intohealthy life expectancy (number of years that would bespent in good health) and unhealthy life expectancy (UHLE;number of years that would be lived in poor health). There-fore, this synthetic summary measure adds a qualitative di-mension to the life expectancy, identifying in the remainingnumber of years those that could be lived in healthy or un-healthy conditions.To date, there are few studies investigating HLE in
Brazil [8,17-23]. Most of these studies have pointed outa female advantage in terms of number of healthy yearsto be lived [21-23] without applying statistical tests toidentify if differences between men and women are sig-nificant. Therefore, the aim of this study was to estimategender differences in healthy life expectancy among resi-dents aged 60 years or older in a city in SoutheasternBrazil for the year 2008, using self-rated health and self-reported functional disabilities.We hypothesized that gender differences in UHLE
would be significant for both self-reported health andfunctional disability. Women would expect to live sig-nificantly more years in bad health than men due to thecombination of their health disadvantage and mortalityadvantage. In general, women report worse health condi-tions than men and they are more likely to survive tothe older ages when poor self-reported health and func-tional disabilities are more common [10].
MethodsHealthy life expectancyHealthy life expectancy refers to the number of yearsthat an individual could expect to live in a healthy state,
assuming that both mortality and morbidity rates remainconstant over time. Since this method combines morbid-ity and mortality data into a single indicator, it summa-rizes the length of healthy life.The concept of HLE has been proposed by Sanders [24]
and the first method was developed by Sullivan [25]. TheSullivan method is a prevalence-based method of estimat-ing HLE and UHLE. Another way to estimate HLE is themultistate model, which uses longitudinal data of inci-dence of health states. Life tables provide the basis toestimate HLE. In the Sullivan method, by applying age-specific prevalence rates of a particular unhealthy state(e.g., poor self-rated health) to a life table function(number of person-years lived in each age interval),the total life expectancy at exact age x is divided intoperson-years lived with good health (HLE) or poorhealth (UHLE). Thereby, this method adjusts the totallife expectancy for current health status of a popula-tion [26].
DataA priori, it is worth noting that Campinas is an economic-ally important city in the state of São Paulo and it is the14th most populous Brazilian city (among 5,570 cities)with a population of 1,080,113 inhabitants in 2010. Peopleaged 60 or older represented 12.4% of the total populationin Campinas (http://www.ibge.gov.br).The data on mortality by sex and age for 2007, 2008,
and 2009 were obtained from the Brazilian Mortality In-formation System (well known as SIM). Since 1989, aproject of mortality surveillance in the city of Campinas(developed through a partnership between the MunicipalHealth Department of Campinas and State University ofCampinas) has ensured high quality vital statistics data;only 3% of deaths are assigned to ill-defined causes inthis city in 2010. Population estimates for the year 2008were provided by SEADE Foundation (São Paulo StateData Analysis System Foundation).Data on health status were derived from the City of
Campinas Health Survey (ISACAMP), a health surveycarried out in 2008. ISACAMP 2008 was a cross-sectional, population-based household survey, whichcovered non-institutionalized individuals who were resi-dents in the urban areas of Campinas. The samplingpopulation was comprised of adolescents (10–19 years),adults (20–59 years) and older people (60 years or older).Independent samples of 1,000 individuals were carried outfor each of these three age groups. This sample size wascalculated considering the estimation of a prevalence of50%, 95% confidence intervals (95% CI), a sampling errorvarying from 4% to 5%, and an design effect (deff) of 2.The sample of households was drawn in two stages. In
the first stage, 50 census tracts were selected with prob-ability proportional to the number of households. In the
Belon et al. Health and Quality of Life Outcomes 2014, 12:88 Page 3 of 10http://www.hqlo.com/content/12/1/88
second stage, households within the selected censustracts were sampled. The quantity of households to bevisited was defined based on the probability of individualsin each age group living in the household (age structuredetermined by the demographic census of 2000; http://www.ibge.gov.br). Taking into account a loss of 20% dueto closed households and refusals, 2,150, 700 and 3,900households were selected to interview adolescents, adults,and older people, respectively. The present study analyzedthe data from people aged 60 or older (n = 1,519). Everyparticipant signed an informed consent form. Ethical ap-proval was granted by the Research Ethics Committee ofState University of Campinas (079/2007).In the survey, a pre-codified questionnaire encompass-
ing different health topics, (available at http://www.fcm.unicamp.br/fcm/sites/default/files/questionario_ingles.pdf ) was applied by trained interviewers. The proxy an-swers are not frequent among the older people of oursample (5.8%). Four measures of self-reported health sta-tus were applied to calculate HLE: self-rated health, glo-bal limitations, mild/moderate limitations, and severelimitations. The responses for the self-rated health vari-able were obtained from this question: “In general,would you say your health is …”. There were five pos-sible answers (“excellent”, “very good”, “good”, “fair”, and“poor”), which were divided into “poor” and “good” self-rated health. “Poor self-evaluation” involved respondentswho rated their health as “fair” and “poor”, and “goodself-rated” aggregated the other answers.The questions about functional disability refer to one of
the eight scales of SF-36-v2 questionnaire. The SF-36-v1was translated and validated in Brazil [27] and the secondversion of this instrument was submitted to validation byLaguardia et al. [28]. We selected four items from thephysical functional SF-36 scale in order to evaluate ifhealth conditions limit the following daily activities: walk-ing more than a mile (3 g), walking several hundred yards(3 h), walking one hundred yards (3i), and bathing ordressing (3j). Older people who answered “yes” for thequestions 3 g and/or 3 h, but replied “no” for 3i and/or 3j,were considered with mild/moderate limitations. Severelimitations were identified when people answered thattheir health conditions limit them walking one hundredyards (3i) and/or bathing or dressing themselves (3j). Glo-bal limitations refer to people who reported having diffi-culties to perform any of these activities. The selection ofthese questions and their operationalization were basedon the distribution of the prevalence data in the olderpopulation of our sample, as well as on the existent set ofBrazilian studies [5,19] that have used similar questions toclassify different levels of functional disability.Prevalence and 95% confidence intervals (95% CI) of
poor self-rated health, global limitations, mild/moderatelimitations, and severe limitations were calculated by sex
and age group (60–64, 65–69, 70–74, 75–79, and80 years or older). Pearson’s chi-square tests were usedto detect significant differences (p-value < 0.05) betweenage groups and sexes.
AnalysisTo measure the life expectancy for the year 2008, mor-tality rates were estimated using the average number ofdeaths for the 2007–2009 triennium and population for2008. Abridged life tables for 5-year age groups wereconstructed for men and women based on the Chiangmethod [29]. From probabilities of death in each agegroup, the life expectancies at exact ages were calcu-lated. In this study, the estimates were limited to thepopulation at ages above 60 and the final age group was80 years or older, as mentioned earlier.Healthy life expectancy was estimated using the method
developed by Sullivan [25]. Because the survey has a com-plex design, weighted prevalence each of the four measur-essures of self-reported health status was used [26]. Thelife expectancy obtained from the abridged life tables forwomen and men were divided into healthy years and un-healthy years using the age-specific prevalence of self-reported health obtained from ISACAMP. Expectedhealthy years at each age were calculated by summingyears lived in good self-reported health for that age andolder ages. The same process was repeated to the otherindicators, i.e., prevalence of global limitations, mild/moderate limitations, and severe limitations. Proportionof UHLE represents the relative portion of the life expect-ancy lived in unhealthy conditions; it was calculated basedon the ratio between UHLE and life expectancy at a spe-cific age.In order to estimate gender inequalities in HLE and
UHLE, absolute and relative differences between womenand men were calculated. For each indicator, statisticaldifferences between sexes were determined by approxi-mate 95% confidence intervals (95% CI), which were cal-culated using method described by Jagger et al. [26].
ResultsAmong older people, 24.4% (95% CI: 20.0-28.8) ratedtheir health as “excellent” or “very good”, whereas 63.5%(95% CI: 58.7-68.2) reported “good” health. The preva-lence of “fair” and “poor” self-reported health were11.1% (95% CI: 8.9-13.0) and 1.1% (95% CI: 0.6-1.7), re-spectively. In terms of mobility, 32.4% (95% CI: 25.8-39.7) of older people reported that their health limitsthem in walking more than one mile or several hundredyards. The self-reported prevalence of difficulties in walk-ing one hundred yards or in bathing or dressing was10.6% (95% CI: 8.2-13.1) among older people. For globalfunctional disability, the self-reported prevalence was43.0% (95% CI: 36.5-49.7) (data not shown).
Belon et al. Health and Quality of Life Outcomes 2014, 12:88 Page 4 of 10http://www.hqlo.com/content/12/1/88
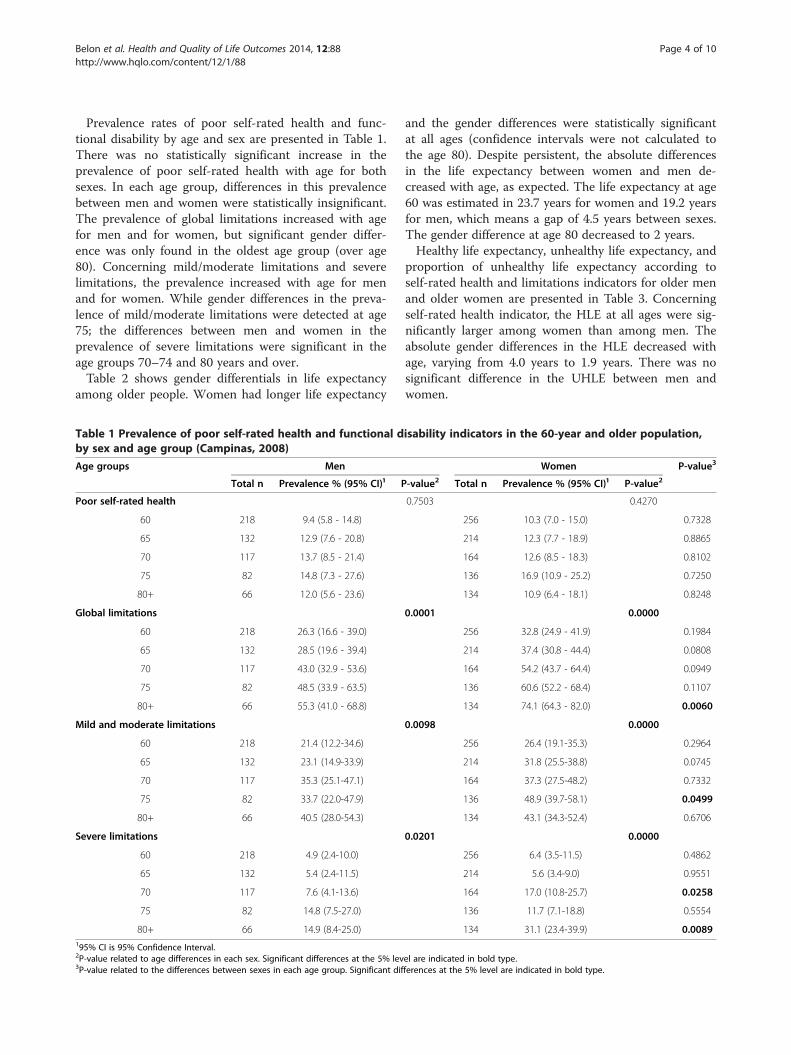
Prevalence rates of poor self-rated health and func-tional disability by age and sex are presented in Table 1.There was no statistically significant increase in theprevalence of poor self-rated health with age for bothsexes. In each age group, differences in this prevalencebetween men and women were statistically insignificant.The prevalence of global limitations increased with agefor men and for women, but significant gender differ-ence was only found in the oldest age group (over age80). Concerning mild/moderate limitations and severelimitations, the prevalence increased with age for menand for women. While gender differences in the preva-lence of mild/moderate limitations were detected at age75; the differences between men and women in theprevalence of severe limitations were significant in theage groups 70–74 and 80 years and over.Table 2 shows gender differentials in life expectancy
among older people. Women had longer life expectancy
Table 1 Prevalence of poor self-rated health and functional dby sex and age group (Campinas, 2008)
Age groups Men
Total n Prevalence % (95% CI)¹ P
Poor self-rated health
60 218 9.4 (5.8 - 14.8)
65 132 12.9 (7.6 - 20.8)
70 117 13.7 (8.5 - 21.4)
75 82 14.8 (7.3 - 27.6)
80+ 66 12.0 (5.6 - 23.6)
Global limitations
60 218 26.3 (16.6 - 39.0)
65 132 28.5 (19.6 - 39.4)
70 117 43.0 (32.9 - 53.6)
75 82 48.5 (33.9 - 63.5)
80+ 66 55.3 (41.0 - 68.8)
Mild and moderate limitations
60 218 21.4 (12.2-34.6)
65 132 23.1 (14.9-33.9)
70 117 35.3 (25.1-47.1)
75 82 33.7 (22.0-47.9)
80+ 66 40.5 (28.0-54.3)
Severe limitations
60 218 4.9 (2.4-10.0)
65 132 5.4 (2.4-11.5)
70 117 7.6 (4.1-13.6)
75 82 14.8 (7.5-27.0)
80+ 66 14.9 (8.4-25.0)195% CI is 95% Confidence Interval.2P-value related to age differences in each sex. Significant differences at the 5% lev3P-value related to the differences between sexes in each age group. Significant dif
and the gender differences were statistically significantat all ages (confidence intervals were not calculated tothe age 80). Despite persistent, the absolute differencesin the life expectancy between women and men de-creased with age, as expected. The life expectancy at age60 was estimated in 23.7 years for women and 19.2 yearsfor men, which means a gap of 4.5 years between sexes.The gender difference at age 80 decreased to 2 years.Healthy life expectancy, unhealthy life expectancy, and
proportion of unhealthy life expectancy according toself-rated health and limitations indicators for older menand older women are presented in Table 3. Concerningself-rated health indicator, the HLE at all ages were sig-nificantly larger among women than among men. Theabsolute gender differences in the HLE decreased withage, varying from 4.0 years to 1.9 years. There was nosignificant difference in the UHLE between men andwomen.
isability indicators in the 60-year and older population,
Women P-value3
-value2 Total n Prevalence % (95% CI)¹ P-value2
0.7503 0.4270
256 10.3 (7.0 - 15.0) 0.7328
214 12.3 (7.7 - 18.9) 0.8865
164 12.6 (8.5 - 18.3) 0.8102
136 16.9 (10.9 - 25.2) 0.7250
134 10.9 (6.4 - 18.1) 0.8248
0.0001 0.0000
256 32.8 (24.9 - 41.9) 0.1984
214 37.4 (30.8 - 44.4) 0.0808
164 54.2 (43.7 - 64.4) 0.0949
136 60.6 (52.2 - 68.4) 0.1107
134 74.1 (64.3 - 82.0) 0.0060
0.0098 0.0000
256 26.4 (19.1-35.3) 0.2964
214 31.8 (25.5-38.8) 0.0745
164 37.3 (27.5-48.2) 0.7332
136 48.9 (39.7-58.1) 0.0499
134 43.1 (34.3-52.4) 0.6706
0.0201 0.0000
256 6.4 (3.5-11.5) 0.4862
214 5.6 (3.4-9.0) 0.9551
164 17.0 (10.8-25.7) 0.0258
136 11.7 (7.1-18.8) 0.5554
134 31.1 (23.4-39.9) 0.0089
el are indicated in bold type.ferences at the 5% level are indicated in bold type.
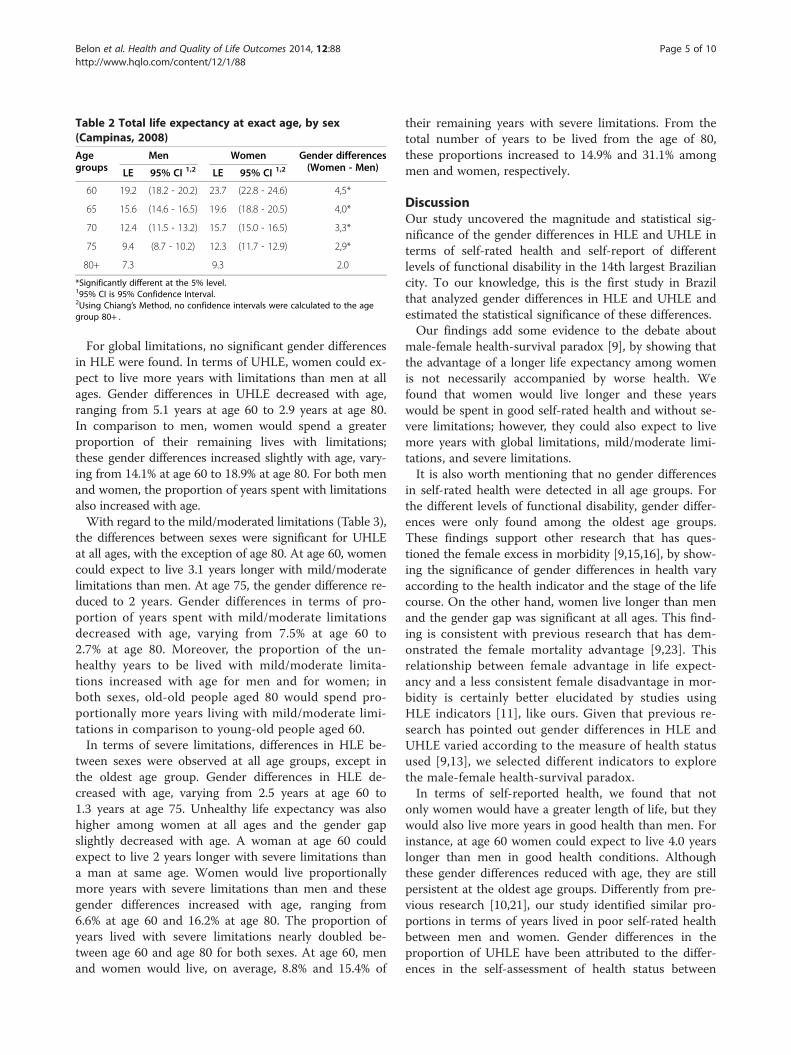
Table 2 Total life expectancy at exact age, by sex(Campinas, 2008)
Agegroups
Men Women Gender differences(Women - Men)LE 95% CI 1,2 LE 95% CI 1,2
60 19.2 (18.2 - 20.2) 23.7 (22.8 - 24.6) 4,5*
65 15.6 (14.6 - 16.5) 19.6 (18.8 - 20.5) 4,0*
70 12.4 (11.5 - 13.2) 15.7 (15.0 - 16.5) 3,3*
75 9.4 (8.7 - 10.2) 12.3 (11.7 - 12.9) 2,9*
80+ 7.3 9.3 2.0
*Significantly different at the 5% level.195% CI is 95% Confidence Interval.2Using Chiang’s Method, no confidence intervals were calculated to the agegroup 80+ .
Belon et al. Health and Quality of Life Outcomes 2014, 12:88 Page 5 of 10http://www.hqlo.com/content/12/1/88
For global limitations, no significant gender differencesin HLE were found. In terms of UHLE, women could ex-pect to live more years with limitations than men at allages. Gender differences in UHLE decreased with age,ranging from 5.1 years at age 60 to 2.9 years at age 80.In comparison to men, women would spend a greaterproportion of their remaining lives with limitations;these gender differences increased slightly with age, vary-ing from 14.1% at age 60 to 18.9% at age 80. For both menand women, the proportion of years spent with limitationsalso increased with age.With regard to the mild/moderated limitations (Table 3),
the differences between sexes were significant for UHLEat all ages, with the exception of age 80. At age 60, womencould expect to live 3.1 years longer with mild/moderatelimitations than men. At age 75, the gender difference re-duced to 2 years. Gender differences in terms of pro-portion of years spent with mild/moderate limitationsdecreased with age, varying from 7.5% at age 60 to2.7% at age 80. Moreover, the proportion of the un-healthy years to be lived with mild/moderate limita-tions increased with age for men and for women; inboth sexes, old-old people aged 80 would spend pro-portionally more years living with mild/moderate limi-tations in comparison to young-old people aged 60.In terms of severe limitations, differences in HLE be-
tween sexes were observed at all age groups, except inthe oldest age group. Gender differences in HLE de-creased with age, varying from 2.5 years at age 60 to1.3 years at age 75. Unhealthy life expectancy was alsohigher among women at all ages and the gender gapslightly decreased with age. A woman at age 60 couldexpect to live 2 years longer with severe limitations thana man at same age. Women would live proportionallymore years with severe limitations than men and thesegender differences increased with age, ranging from6.6% at age 60 and 16.2% at age 80. The proportion ofyears lived with severe limitations nearly doubled be-tween age 60 and age 80 for both sexes. At age 60, menand women would live, on average, 8.8% and 15.4% of
their remaining years with severe limitations. From thetotal number of years to be lived from the age of 80,these proportions increased to 14.9% and 31.1% amongmen and women, respectively.
DiscussionOur study uncovered the magnitude and statistical sig-nificance of the gender differences in HLE and UHLE interms of self-rated health and self-report of differentlevels of functional disability in the 14th largest Braziliancity. To our knowledge, this is the first study in Brazilthat analyzed gender differences in HLE and UHLE andestimated the statistical significance of these differences.Our findings add some evidence to the debate about
male-female health-survival paradox [9], by showing thatthe advantage of a longer life expectancy among womenis not necessarily accompanied by worse health. Wefound that women would live longer and these yearswould be spent in good self-rated health and without se-vere limitations; however, they could also expect to livemore years with global limitations, mild/moderate limi-tations, and severe limitations.It is also worth mentioning that no gender differences
in self-rated health were detected in all age groups. Forthe different levels of functional disability, gender differ-ences were only found among the oldest age groups.These findings support other research that has ques-tioned the female excess in morbidity [9,15,16], by show-ing the significance of gender differences in health varyaccording to the health indicator and the stage of the lifecourse. On the other hand, women live longer than menand the gender gap was significant at all ages. This find-ing is consistent with previous research that has dem-onstrated the female mortality advantage [9,23]. Thisrelationship between female advantage in life expect-ancy and a less consistent female disadvantage in mor-bidity is certainly better elucidated by studies usingHLE indicators [11], like ours. Given that previous re-search has pointed out gender differences in HLE andUHLE varied according to the measure of health statusused [9,13], we selected different indicators to explorethe male-female health-survival paradox.In terms of self-reported health, we found that not
only women would have a greater length of life, but theywould also live more years in good health than men. Forinstance, at age 60 women could expect to live 4.0 yearslonger than men in good health conditions. Althoughthese gender differences reduced with age, they are stillpersistent at the oldest age groups. Differently from pre-vious research [10,21], our study identified similar pro-portions in terms of years lived in poor self-rated healthbetween men and women. Gender differences in theproportion of UHLE have been attributed to the differ-ences in the self-assessment of health status between
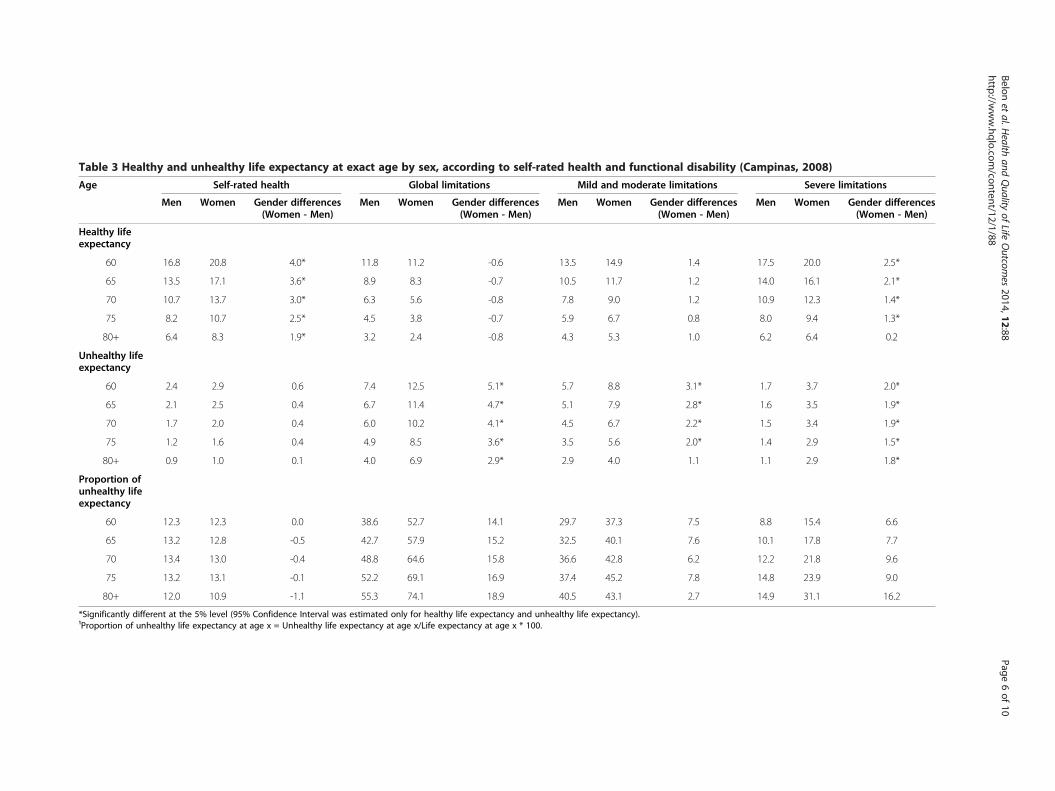
Table 3 Healthy and unhealthy life expectancy at exact age by sex, according to self-rated health and functional disability (Campinas, 2008)
Age Self-rated health Global limitations Mild and moderate limitations Severe limitations
Men Women Gender differences(Women - Men)
Men Women Gender differences(Women - Men)
Men Women Gender differences(Women - Men)
Men Women Gender differences(Women - Men)
Healthy lifeexpectancy
60 16.8 20.8 4.0* 11.8 11.2 -0.6 13.5 14.9 1.4 17.5 20.0 2.5*
65 13.5 17.1 3.6* 8.9 8.3 -0.7 10.5 11.7 1.2 14.0 16.1 2.1*
70 10.7 13.7 3.0* 6.3 5.6 -0.8 7.8 9.0 1.2 10.9 12.3 1.4*
75 8.2 10.7 2.5* 4.5 3.8 -0.7 5.9 6.7 0.8 8.0 9.4 1.3*
80+ 6.4 8.3 1.9* 3.2 2.4 -0.8 4.3 5.3 1.0 6.2 6.4 0.2
Unhealthy lifeexpectancy
60 2.4 2.9 0.6 7.4 12.5 5.1* 5.7 8.8 3.1* 1.7 3.7 2.0*
65 2.1 2.5 0.4 6.7 11.4 4.7* 5.1 7.9 2.8* 1.6 3.5 1.9*
70 1.7 2.0 0.4 6.0 10.2 4.1* 4.5 6.7 2.2* 1.5 3.4 1.9*
75 1.2 1.6 0.4 4.9 8.5 3.6* 3.5 5.6 2.0* 1.4 2.9 1.5*
80+ 0.9 1.0 0.1 4.0 6.9 2.9* 2.9 4.0 1.1 1.1 2.9 1.8*
Proportion ofunhealthy lifeexpectancy
60 12.3 12.3 0.0 38.6 52.7 14.1 29.7 37.3 7.5 8.8 15.4 6.6
65 13.2 12.8 -0.5 42.7 57.9 15.2 32.5 40.1 7.6 10.1 17.8 7.7
70 13.4 13.0 -0.4 48.8 64.6 15.8 36.6 42.8 6.2 12.2 21.8 9.6
75 13.2 13.1 -0.1 52.2 69.1 16.9 37.4 45.2 7.8 14.8 23.9 9.0
80+ 12.0 10.9 -1.1 55.3 74.1 18.9 40.5 43.1 2.7 14.9 31.1 16.2
*Significantly different at the 5% level (95% Confidence Interval was estimated only for healthy life expectancy and unhealthy life expectancy).¹Proportion of unhealthy life expectancy at age x = Unhealthy life expectancy at age x/Life expectancy at age x * 100.
Belonet
al.Health
andQuality
ofLife
Outcom
es2014,12:88
Page6of
10http://w
ww.hqlo.com
/content/12/1/88
Belon et al. Health and Quality of Life Outcomes 2014, 12:88 Page 7 of 10http://www.hqlo.com/content/12/1/88
men and women [21]. Researchers have suggested that,in addition to biological sex differences, social and cul-tural factors that shape gender roles may explain the dif-ferences in health perception between sexes. Not onlyfemale behaviours would be more conducive to goodhealth, but also women would have more knowledgeabout symptoms and diseases; by consequence, theywould be more likely to report poor health conditions[10,13,21]. However, our study did not detect differencesin the prevalence of poor self-rated health between oldermen and older women, and gender differences in HLEwere still found with women living more healthy lifeyears than men.Regarding global limitations and mild/moderate limi-
tations, no gender differences were identified for HLE.Nevertheless, for both indicators UHLE was statisticallygreater among women than among men at all ages; theonly exception was at age 80 when gender differences inUHLE for mild/moderate limitations were not signifi-cant. For instance, in comparison to men, women at age60 could expect to live more than 5.1 years with globallimitations; at age 80, the gender difference is smaller(2.9 years) but still significant. Comparisons among stud-ies are difficult due to the selection of different indicatorson limitations and variations in wording and scales. Des-pite these differences, our results are in accordance withother studies, by indicating that women could expect tolive a greater proportion of their remaining lives withmild/moderate limitations than men [23,30]. Camargoset al. [19], for instance, verified that proportion of years tobe lived with mild (difficult in walking one kilometer) andmoderate limitations (difficult in walking 100 meters) was56.3% and 31.5% among Brazilian women aged 60, re-spectively. Among men at age 60, the figures were only38.9% and 21%. Combining mild and moderate limitationsindicators (questions about difficulties in walking morethan a mile and several hundred yards), our study identi-fied that the proportion of unhealthy years would be37.3% and 29.7% for women and men aged 60 years,respectively.With regard to severe limitations, our research pointed
out statistically significant gender differences for HLEand UHLE. A 60 year-old woman would expect to live2.5 years longer without severe limitations than a man atthe same age. But, women at age 60 would also live2 years longer with severe limitations than their mencounterparts. That is, despite the advantage of a longerlife expectancy, women could expect to live more yearswith and without severe limitations. In general, mobilityindicators and activities of daily living (ADL) indicators,such as ability to dress and bathe, are frequently used tomeasure severe limitations [5,19]; however, the wide rangeof conceptualization and operationalization of these indi-cators hinder comparisons among studies. Despite this
diversity of measures and classifications, data from previ-ous studies have suggested that women spend proportion-ally more years living with severe limitations [19,23,30].Our data are consistent with these studies, by revealingthat the proportion of years lived with severe limitationswere higher for women than for men at all ages.The Sullivan method has some advantages. The first
one is its simplicity, since this method only requirescross-sectional data to estimate the HLE. Unlike multi-state method, the data availability of morbidity prevalencederived from surveys does not preclude the application ofSullivan method. Another advantage is that Sullivanmethod can be applied to any state of health, estimat-ing different HLE according to selected measurementsof health. As its measure is independent of the size ofpopulation and their age structure, HLE is also usefulto monitor population health and to make comparativeanalysis over time or among different populations.Moreover, the index is easily understood, representingthe number of healthy and unhealthy years that an in-dividual can expect, on average, to live, as mentionedelsewhere.Some limitations should be considered when evaluat-
ing our results. Firstly, our data came from a survey thatdid not include people living in institutions; therefore,our results for HLE might be somewhat higher than itwould be for the entire population. However, in Brazil,the proportion of older people living in institutions isvery small. According to the first Brazilian Census on in-stitutionalized population conducted in 2011 by the Na-tional Institute for Applied Economic Research (IPEA)[31], only 0.5% of the total elderly population lives ininstitutions.Secondly, due to the small sample size of this survey
and lack of information on mortality by socioeconomicindicators, it was not possible to take into account socio-economic factors that may influence self-reported healthconditions in different ways for men and women [16].Thirdly, although there is some evidence based on thecomparisons between subjective and objective measuresthat women are not more likely to over-report health re-lated problems than men [14], information bias intro-duced by gender differences in self-reported health maynot be ruled out in our study.Another limitation is that self-reported health status
may be affected by cross-cultural differences; therefore,special attention should be paid when comparing ourfindings with studies conducted in different regions. Never-theless, it is important to consider that previous studieshave shown the validity of self-reported function, by com-paring this data with performance measures of physio-logical impairment [32,33]. In turn, self-rated health iswidely recognized as a sensible measure of health condi-tions that predicts mortality and is associated with clinical

Belon et al. Health and Quality of Life Outcomes 2014, 12:88 Page 8 of 10http://www.hqlo.com/content/12/1/88
measures, engagement in self-care, and healthy lifestyles[34]. The self-rated health is a measure of health status thatreflects various dimensions of the everyday life (such as ill-nesses, functioning, well-being, and life satisfaction [34,35])and may be affected by engagement in preventive practices,personal skills to cope with diseases and functional disabil-ities, and performance of social roles in social networks[34,36]. Thereby, aside from providing a broad, full under-standing of years lived with quality of life, HLE based onself-rated health is a sensible and irreplaceable indicator be-cause it represents the view of global health status.On the other hand, our study showed that both older
men and older women would spend a smaller proportionof their remaining lives with poor self-rated health, al-though they would expect to live proportionally more yearswith limitations. Similar pattern was also found in a Brazil-ian study that used data from the World Health Survey,which was carried out in 2003 [18]. The low prevalence ofself-reported health among older people has been observedin two nationally representative Brazilian surveys. UsingBrazilian Household Sampling Survey (PNAD-2003),Dachs & Santos [37] found that only 11.8% and 2.6% ofBrazilian people aged 64–85 years had reported poor orvery poor health, respectively. Findings from a nationaltelephone survey (VIGITEL - Telephone-Based Surveil-lance of Risk and Protective Factors for Chronic Diseases)also showed a low prevalence of poor self-rated health(8.0%) among Brazilian people aged 65 years or older [38].In addition, research has found positive perception of well-being [39] and emotional health [6] among older Brazilianpeople, which may explain the low prevalence of poor self-rated health. In our study, the prevalence of poor self-ratedhealth did not increase with age; this is consistent withfindings from a prospective study of a large cohort ofBrazilian older people [40]. In contrast to other Brazilianstudies that have found that women are more likely toreport poor health than men [6,40], our study detected nogender differences. However, the absence of significancemay be due to the small sample size of our study.It is noteworthy that the response rate (for both adults
and older people) in our survey was high (85.6%). In theelderly sample, there was a loss of 14.2% (6.1% were re-fusals, 3.1% were non-contacts and 5.0% were non-response for some other reason). Among older peopleresiding in the selected households, there was a refusalrate of only 5.5% and a loss rate of 6.9% for other rea-sons; despite the low non-response rates, effects ofnon-response bias on our results cannot be excluded.However, a recent study conducted in Denmark showed asmall contribution of gender differences in terms of select-ive participation to the explanation of male-female health-survival paradox [14].A great advantage of our investigation is that it took
into account differences in performing some activities of
daily living (ADL; ability to “bathe and dress yourself”)and mobility (walking from one hundred yards to morethan a mile). In Brazil, most studies have classified func-tional disability if the respondents reported one or morelimitations to perform ADL [20]; others have defined thedegree of severity based on the number of answers toquestions about ADL [23]. Previous studies have demon-strated the importance of distinguishing mild, moderate,and severe limitations using different questions of ADLand mobility, assuming the functional disability as a con-tinuous and progressive process [5,30].Considering the paucity of studies analyzing the mag-
nitude of gender differences in HLE [9], our findingsmay contribute to the debate on male-female health-survival paradox for two reasons. First, by using a singleindicator that combines mortality and morbidity, thisstudy revealed the quality of these extra years lived bywomen. Assessing gender differences in health throughan indicator that synthesizes mortality and morbidity ratesmay shed light into the debate about the consistency ofthe paradox of women living longer than men but inpoorer health conditions [11,15,16]. Second, our studyis important because it focused on the magnitude ofthe gender differences in morbidity, mortality and HLE,instead of analyzing this data for women and men sep-arately [16].Based on our results, we suggest that more research
on gender differences in HLE and UHLE is needed inorder to provide a full understanding of the male-femalehealth-survival paradox. Additional step should also betaken towards the application of decomposition tech-niques to measure the contribution of mortality andmorbidity to the gender differences in HLE and UHLE[11,12]. An example of such analysis is the research con-ducted by Nusselder et al. [11] showing that gender gap inHLE and UHLE in two groups of European countries aremasked by gender differences in mortality and morbidity.Further research investigating the biological, behav-
ioural, and social mechanisms that shape gender differ-ences in life expectancy and HLE may also guide effortsnot only to improve male longevity, but also to promotea compression of disability and poor health in the yearslived, especially among women.
ConclusionsIn summary, our findings pointed out gender differencesin HLE in terms of self-reported health: women wouldhave longer HLE compared to the men, living moreyears in good health. With regard to global limitationsand mild/moderate limitations, our study identified sig-nificant differences in UHLE between sexes. Womenwould also spend more years with and without severelimitations than men. It was also verified that womenwould live a greater proportion of their lifetime with

Belon et al. Health and Quality of Life Outcomes 2014, 12:88 Page 9 of 10http://www.hqlo.com/content/12/1/88
functional limitations than men. Another important find-ing in our study is that no gender differences in the preva-lence data (except for a few age groups) were detected,while gender differences were found for life expectancy,HLE, and UHLE. This finding is especially importantgiven the debate questioning the male-female health-survival paradox, for which some research has shown nofemale excess in ill health when using specific health indi-cators [15,16].Investigations on gender differences in health among
older people are crucial given some facets of populationaging, such as premature mortality among men andfeminization of old age [41]. Considering that the advan-tages of a longer life expectancy is only fully achieved ifthe extra years are lived in good health, investigations ongender differences in HLE are clearly needed in order toprovide meaningful insights to the development of ac-tion plans that tackle gender inequalities in health andpromote healthy, active aging for both men and women.Indeed, more evidence may help inform policies andprograms aimed to reduce gender differences in thequantity and quality of years to be lived, providing equalopportunities for women and men to live longer withquality of life, autonomy, and independence.
Competing interestsThe authors declare that they have no competing interests.
Authors’ contributionsAPB conceived the study, estimated the life expectancy and healthy lifeexpectancy, and drafted the manuscript. MGL participated in the conceptionand drafting of the manuscript, as well as performed the statistical analysisusing survey data. MBAB advised on statistical analyses and participated inthe revision of the manuscript. All authors read and approved the finalmanuscript.
AcknowledgementsThe data used in this study came from a health survey (ISACAMP 2008)funded by CNPq (n. 409747/2006-8) and by a partnership between BrazilianMinistry of Health and Campinas Health Department (Partnership Unicamp/Funcamp/SMS n. 4300).MBA Barros is supported by a Research Productivity Grant from CNPq. APBelon was a recipient of a postdoctoral fellowship from CAPES at the time ofthis study.
Received: 4 September 2013 Accepted: 12 May 2014Published: 6 June 2014
References1. Santos JLF: Demografia: estimativas e projeções: medidas de fecundidade e
mortalidade para o Brasil no Século XX; 1978. PhD thesis. Universidade deSão Paulo, Faculdade de Arquitetura e Urbanismo.
2. Instituto Brasileiro de Geografia e Estatística (IBGE): Tábuas Completas deMortalidade 2010; Comunicação Social, Dec 01 2011. [http://www.ibge.gov.br/home/estatistica/populacao/tabuadevida/2010/notastecnicas.pdf]
3. Simões CCS: Perfis de saúde e de mortalidade no Brasil: uma análise de seuscondicionantes em grupos populacionais específicos. Brasília: OrganizaçãoPan-Americana da Saúde; 2002.
4. Instituto Brasileiro de Geografia e Estatística (IBGE): Síntese de IndicadoresSociais: Uma Análise das Condições de Vida da População Brasileira, 2010. Riode Janeiro: IBGE; 2010 [Estudos e Pesquisas: Informação Demográfica eSocioeconômica, n. 27].
5. Parahyba MI, Veras R, Melzer D: Disability among elderly women in Brazil.Rev Saude Publica 2005, 39(3):383–391.
6. Lima MG, Barros MBA, César CLG, Goldbaum M, Carandina L, Ciconelli RM:Health related quality of life among the elderly: a population-basedstudy using SF-36 survey. Cad Saúde Pública 2009, 25(10):2159–2167.
7. Zunzunegui MV, Alvarado BE, Béland F, Vissandjee B: Explaining healthdifferences between men and women in later life: a cross-citycomparison in Latin America and the Caribbean. Soc Sci Med 2009,68:235–242.
8. Szwarcwald CL, Mota JC, Damacena GN, Pereira TGS: Health inequalities inRio de Janeiro, Brazil: lower healthy life expectancy in socioeconomicallydisadvantaged areas. Am J Public Health 2011, 101(3):517–523.
9. Oksuzyan A, Brønnum-Hansen H, Jeune B: Gender gap in healthexpectancy. Eur J Ageing 2010, 7:213–218.
10. Gu D, Dupre ME, Warner DF, Zeng Y: Changing health status and healthexpectancies among older adults in China: gender differences from 1992to 2002. Soc Sci Med 2009, 68:2170–2179.
11. Nusselder W, Looman N, Van Oyen H, Robine J-M, Jagger C: Genderdifferences in health of EU10 and EU15 populations: the double burdenof EU10 men. Eur J Ageing 2010, 7(4):219–227.
12. Van Oyen H, Nusselder W, Jagger C, Kolip P, Cambois E, Robine J-M: Genderdifferences in healthy life years within the EU: an exploration of the“health-survival” paradox. Int J Public Health 2013, 58:143–155.
13. Christensen K, Doblhammer G, Rau R, Vaupel JW: Ageing populations: thechallenges ahead. Lancet 2009, 374:1196–1208.
14. Oksuzyan A, Petersen I, Stovring H, Bingley P, Vaupel JW, Christensen K: Themale-female health-survival paradox: a survey and register study of theimpact of sex-specific selection and information bias. Ann Epidemiol 2009,19:504–511.
15. Macintyre S, Hunt K, Sweeting H: Gender differences in health: are thingsreally as simple as they seem? Soc Sci Med 1996, 42(4):617–624.
16. Arber S, Cooper H: Gender differences in health in later life: the newparadox? Soc Sci Med 1999, 48:61–76.
17. Camargos MCS, Perpétuo IHO, Machado CJ: Life expectancy withfunctional disability in elderly persons in São Paulo Brazil. Rev PanamSalud Publica 2005, 17(5/6):379–386 [in Portuguese].
18. Romero DE, Leite IC, Szwarcwald CL: Healthy life expectancy in Brazil:applying the Sullivan method. Cad Saude Publica 2005, 21:S7–S18.
19. Camargos MCS, Machado CJ, Rodrigues RN: Life expectancy among elderlyBrazilians in 2003 according to different levels of functional disability.Cad Saúde Pública 2008, 24(4):845–852.
20. Camargos MCS, Machado CJ, Rodrigues RN: Disability life expectancy forthe elderly, City of São Paulo, Brazil, 2000: gender and educationaldifferences. J Biosocial Sci 2007, 39:455–463.
21. Camargos MCS, Machado CJ, Rodrigues RN: Sex differences in healthy lifeexpectancy from self-perceived assessments of health in the City of SãoPaulo, Brazil. Ageing Soc 2008, 28:35–48.
22. Camargos MCS, Rodrigues RN, Machado CJ: Healthy life expectancy toBrazilian elders, 2003. Ciênc Saúde Col 2009, 14:1903–1909 [in Portuguese].
23. Andrade FCD, Guevara PE, Lebrão ML, Duarte YAO, Santos JLF: Genderdifferences in life expectancy and disability-free life expectancyamong older adults in São Paulo Brazil. Women’s Health Issues 2011,21(1):64–70.
24. Sanders BS: Measuring community health levels. Am J Public Health 1964,54(7):1063–1070.
25. Sullivan DF: A single index of mortality and morbidity. Health Rep 1971,86(4):347–354.
26. Jagger C, Hauet E, Brouard N: Health Expectancy Calculation by the SullivanMethod: A Practical Guide. European concerted action on the harmonizationof health expectancy calculations in Europe. Leicester, Paris: EURO-REVES;2001 [REVES Paper no. 408].
27. Ciconelli RM, Ferraz MB, Santos W, Meinão I, Quaresma MR: Brazilian-Portugueseversion of the SF-36: a reliable and valid quality of life outcome measure.Rev Bras Reumatol 1999, 39:143–150 [in Portuguese].
28. Laguardia J, Campos MR, Travassos CM, Najar AL, Anjos LA, Vasconcellos MM:Psychometric evaluation sample of Brazilian households: results of thesurvey Pesquisa Dimensões Sociais das Desigualdades (PSDS), Brazil, 2008.Health Qual Life Outcomes 2011, 9:61.
29. Chiang CL: The life table and its applications. Malabar, Florida: Robert E.Krieger Publishing Company; 1984.
30. Tsuji I, Sauvaget C, Hisamichi S: Health expectancies in Japan: genderdifferences and policy implications for women. J Women Aging 2002,14(1–2):135–148.

Belon et al. Health and Quality of Life Outcomes 2014, 12:88 Page 10 of 10http://www.hqlo.com/content/12/1/88
31. Instituto de Pesquisa Econômica Aplicada (IPEA): Condições defuncionamento e infraestrutura das instituições de longa permanência paraidosos no Brasil. Brasília: IPEA; 2011 [Comunicado do IPEA n. 93].
32. Young Y, Boyd CM, Guralnik JM, Fried LP: Does self-reported functioncorrespond to objective measures of functional impairment? JAMDA2010, 11(9):645–653.
33. Van den Brink CL, Tijhuis M, Kalmijn S, Klazinga NS, Nissinen A, Giampaoli S,Kivinen P, Kromhout D, van den Bos GA: Self-reported disability and itsassociation with performance-based limitation in elderly men: a comparisonof three European countries. J Am Geriatrics Soc 2003, 51(6):782–788.
34. Idler EL, Benyamini Y: Self-rated health and mortality: a review of atwenty-seven community studies. J Health Soc Behav 1997, 38:21–37.
35. Almeida-Filho N: Saúde como medida. In O que é saúde?. Edited byAlmeida-Filho N. Rio de Janeiro: Fiocruz; 2011:53–71.
36. Benyaminini Y, Idler EL, Leventhal H, Leventhal EA: Positive affect andfunction as influences on self-assessment of health: expanding our viewbeyond illness and disability. J Gerontol Psychol Sci 2000, 55(2):107–116.
37. Dachs JN, Santos APR: Health self-rating in Brazil: analysis of data of thePNAD/2003. Cienc Saude Colet 2006, 11(4):887–894.
38. Brasil, Ministério da Saúde. Secretaria de Vigilância em Saúde. Secretaria deGestão Estratégica e Participativa: VIGITEL Brasil 2012: Vigilância de fatores derisco e proteção para doenças crônicas por inquérito telefônico. Brasília:Ministério da Saúde; 2013.
39. Lima MG, Barros MBA, Alves MCGP: Happiness in the elderly: anepidemiologic approach in the ISA-Camp 2008 study. Cad Saude Publica2012, 28(4):2280–2292.
40. Lima-Costa MF, Firmo JOA, Uchôa E: The structure of self-rated healthamong older adults: the Bambuí health and ageing study (BHAS).Rev Saude Publica 2004, 38(6):827–834.
41. WHO (World Health Organization): Active aging: a policy framework; 2002.WHO/NMP/NPH/02.8.
doi:10.1186/1477-7525-12-88Cite this article as: Belon et al.: Gender differences in healthy lifeexpectancy among Brazilian elderly. Health and Quality of Life Outcomes2014 12:88.
Submit your next manuscript to BioMed Centraland take full advantage of:
• Convenient online submission
• Thorough peer review
• No space constraints or color figure charges
• Immediate publication on acceptance
• Inclusion in PubMed, CAS, Scopus and Google Scholar
• Research which is freely available for redistribution
Submit your manuscript at www.biomedcentral.com/submit
Related Documents