GEA Group Düsseldorf, March 11, 2013 Q4 2012 Presentation Results FY 2012

Welcome message from author
This document is posted to help you gain knowledge. Please leave a comment to let me know what you think about it! Share it to your friends and learn new things together.
Transcript
GEA Group
Düsseldorf, March 11, 2013
Q4 2012 Presentation Results FY 2012

engineering for a better world
Disclaimer
Forward-looking statements are based on our current assumptions and forecasts. These statements naturally entail
risks and uncertainties, which may cause the actual results of operations, financial position or performance to diverge
significantly from the estimates given here. Factors that could cause such a divergence include changes in the
economic and business environment, fluctuations in exchange rates and interest rates, launches of competing
products, poor acceptance of new products or services, and changes in business strategy. We are under no obligation
to update forward-looking statements.
Due to rounding, the sum of percentages of order intake and sales by region as well as by customer industry may vary
from 100%.
2 Presentation Results FY 2012 - March 11, 2013
engineering for a better world
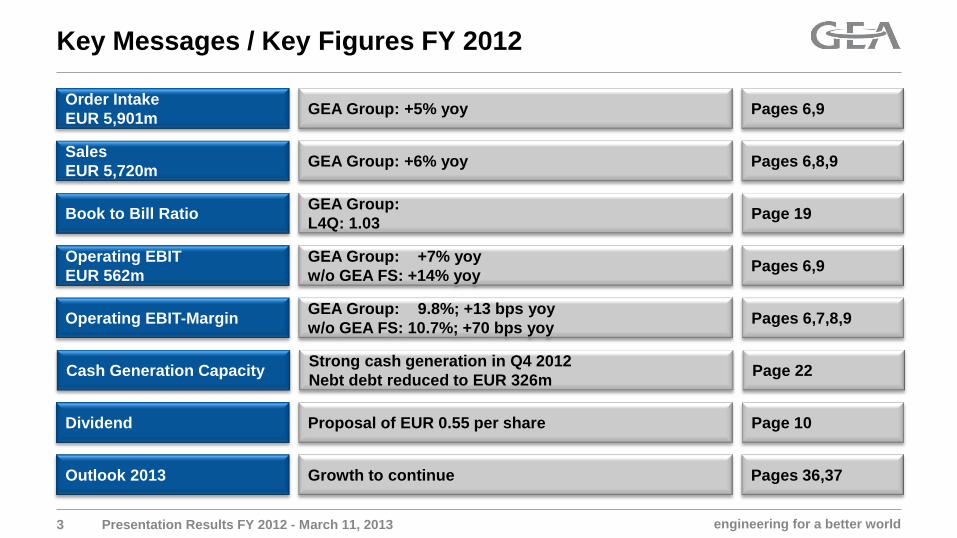
Order Intake
EUR 5,901m Pages 6,9 GEA Group: +5% yoy
Sales
EUR 5,720m Pages 6,8,9 GEA Group: +6% yoy
Operating EBIT
EUR 562m Pages 6,9
GEA Group: +7% yoy
w/o GEA FS: +14% yoy
Outlook 2013 Pages 36,37 Growth to continue
Key Messages / Key Figures FY 2012
3 Presentation Results FY 2012 - March 11, 2013
Operating EBIT-Margin Pages 6,7,8,9 GEA Group: 9.8%; +13 bps yoy
w/o GEA FS: 10.7%; +70 bps yoy
Book to Bill Ratio Page 19 GEA Group:
L4Q: 1.03
Dividend Proposal of EUR 0.55 per share Page 10
Cash Generation Capacity Page 22 Strong cash generation in Q4 2012
Nebt debt reduced to EUR 326m
engineering for a better world
Agenda
4
January – December 2012
I. Key Figures
II. Performance
Backup
Performance GEA Group and Segments
Presentation Results FY 2012 - March 11, 2013
III. Outlook

engineering for a better world
I. Key Figures Highlights FY 2012
5 Presentation Results FY 2012 - March 11, 2013
Order Intake growth: +5.2% yoy (at least +5%)
Strong growth from food business
Sales growth: +5.6% yoy (at least +5%)
Operating EBIT-margin: 9.8% (above FY 2011)
Highest EBIT-margin ever in three Segments
Strong focus on cash flow
Ongoing acquisitions in food applications
Completion of appraisal procedure from 1999
Close-out agreement with buyer of Lurgi
Sound
Operating
Results
Heading for
Strategic
Excellence
Resolution of
Legacy Issues

engineering for a better world
69 75 110 123
140 147
206 217
2011 2012
Q4
Q3
Q2
Q1 6.6% 5.9%
8.1% 8.8%
10.0% 10.2%
12.6% 13.4%
2011 2012
Q4
Q3
Q2
Q1
1,038 1,264
1,349 1,391
1,397 1,446
1,632 1,620
2011 2012
Q4
Q3
Q2
Q11,242 1,545
1,463 1,401
1,403 1,477
1,502 1,478
2011 2012
Q4
Q3
Q2
Q1
I. Key Figures GEA Group Q1 – Q4 2012 YoY
6 Presentation Results FY 2012 - March 11, 2013
[in EUR million]
Order Intake
+5%
Sales
+6%
Operating EBIT
+7%
( w/o FS: +14%)
5,610 5,901
-4%
+24%
0%
5,417 5,720
+3%
+22%
+12%
525 562
+12%
+9%
+48%
Operating EBIT-Margin
+13 bps
( w/o FS: +70 bps) 9.7%
+69 bps
-71 bps
9.8%
+5% +3%
+5% +16 bps
+324 bps
-2% -1%
+5% +78 bps
( w/o FS: +5%) ( w/o FS: +6%)
engineering for a better world
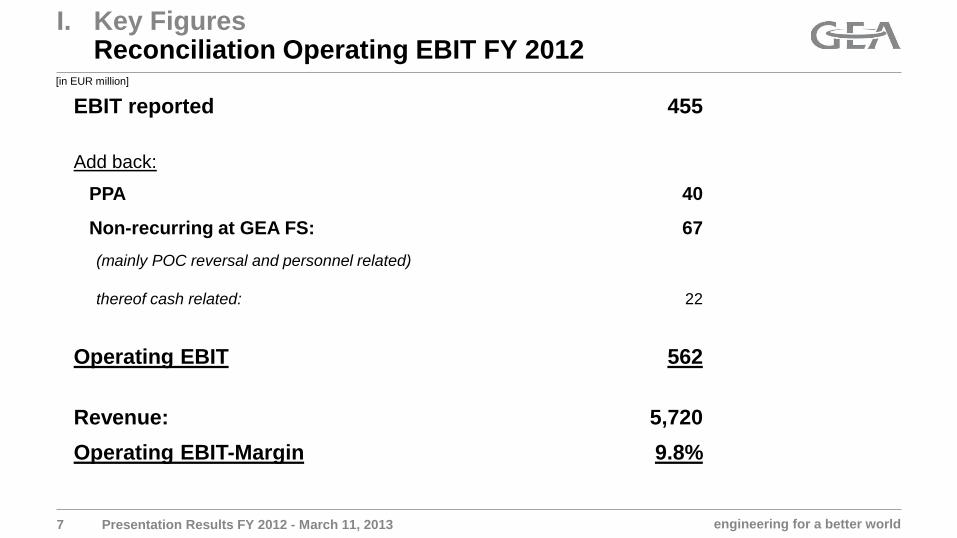
I. Key Figures Reconciliation Operating EBIT FY 2012
7 Presentation Results FY 2012 - March 11, 2013
EBIT reported 455
Add back:
PPA 40
Non-recurring at GEA FS: 67
(mainly POC reversal and personnel related)
thereof cash related:
22
Operating EBIT
562
Revenue:
5,720
Operating EBIT-Margin 9.8%
[in EUR million]
engineering for a better world
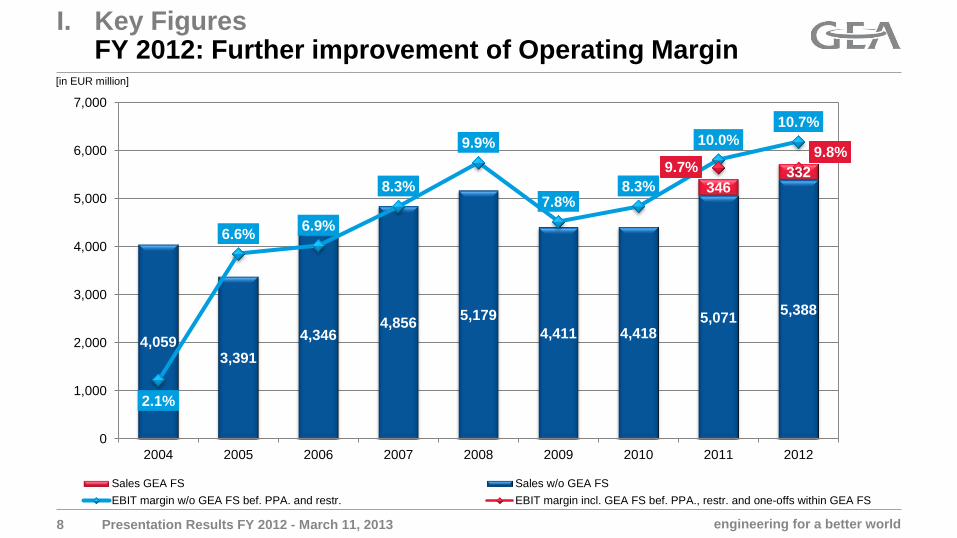
I. Key Figures FY 2012: Further improvement of Operating Margin
8 Presentation Results FY 2012 - March 11, 2013
4,059 3,391
4,346 4,856
5,179
4,411 4,418 5,071
5,388
346 332
2.1%
6.6% 6.9%
8.3%
9.9%
7.8% 8.3%
10.0%
10.7%
9.7% 9.8%
0%
2%
4%
6%
8%
10%
12%
0
1,000
2,000
3,000
4,000
5,000
6,000
7,000
2004 2005 2006 2007 2008 2009 2010 2011 2012
Sales GEA FS Sales w/o GEA FS
EBIT margin w/o GEA FS bef. PPA. and restr. EBIT margin incl. GEA FS bef. PPA., restr. and one-offs within GEA FS
[in EUR million]
engineering for a better world
650 756
1,710 1,850
875 972
1,653 1,510 527 584 330 376
2011 2012
GEA FS
GEA FT
GEA HX
GEA ME
GEA PE
GEA RT
51 56
148 163
162 188
122 135 34 46 20
-12 2011 2012
GEA FS
GEA FT
GEA HX
GEA ME
GEA PE
GEA RT
647 695
1,577 1,716
845 934
1,617 1,609 510 581 346 332
2011 2012
GEA FS
GEA FT
GEA HX
GEA ME
GEA PE
GEA RT
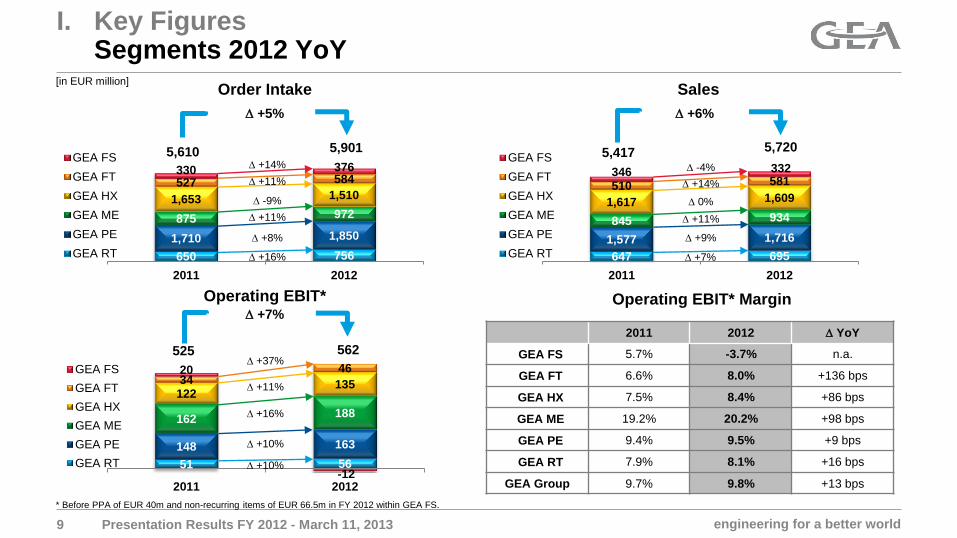
I. Key Figures Segments 2012 YoY
9 Presentation Results FY 2012 - March 11, 2013
+16%
+11%
+10%
+37%
Order Intake
+5%
Sales
+6%
5,610 5,901 5,417 5,720
Operating EBIT* +7%
525 562
+11%
-9%
+8%
+16%
+11%
+14%
+11%
0%
+9%
+7%
+14%
-4%
+10%
Operating EBIT* Margin
[in EUR million]
* Before PPA of EUR 40m and non-recurring items of EUR 66.5m in FY 2012 within GEA FS.
2011 2012 YoY
GEA FS 5.7% -3.7% n.a.
GEA FT 6.6% 8.0% +136 bps
GEA HX 7.5% 8.4% +86 bps
GEA ME 19.2% 20.2% +98 bps
GEA PE 9.4% 9.5% +9 bps
GEA RT 7.9% 8.1% +16 bps
GEA Group 9.7% 9.8% +13 bps

engineering for a better world
319.4
369.0
2011 2012
I. Key Figures GEA Group Q1 – Q4 2012 YoY
Cash Flow Driver +49.5
386.8
325.5
2011 2012
Net Debt -61.3
10
[in EUR million]
Presentation Results FY 2012 - March 11, 2013
€1.70 €1.69
2011 2012
EPS -0.01 €
0.55 € 0.55 €
2011 2012
Dividend +0.00 €
(proposed)
engineering for a better world
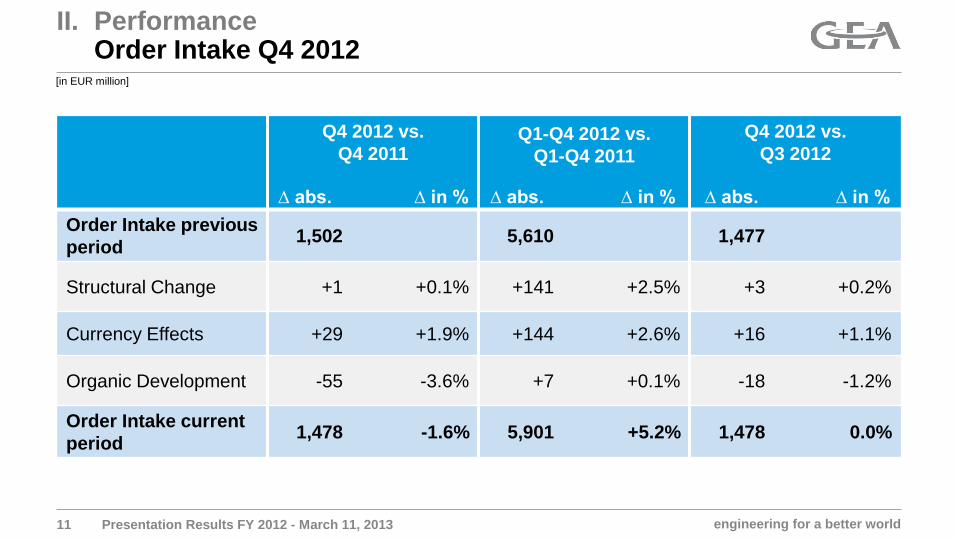
II. Performance Order Intake Q4 2012
11 Presentation Results FY 2012 - March 11, 2013
Q4 2012 vs.
Q4 2011
Q1-Q4 2012 vs.
Q1-Q4 2011
Q4 2012 vs.
Q3 2012
Order Intake previous
period 1,502 5,610 1,477
Structural Change +1 +0.1% +141 +2.5% +3 +0.2%
Currency Effects +29 +1.9% +144 +2.6% +16 +1.1%
Organic Development -55 -3.6% +7 +0.1% -18 -1.2%
Order Intake current
period 1,478 -1.6% 5,901 +5.2% 1,478 0.0%
∆ abs. ∆ in %
∆ abs. ∆ in %
∆ abs. ∆ in %
[in EUR million]

engineering for a better world
10%
-7%
2%
-4%
0%
-30%
-20%
-10%
0%
10%
20%
30%
GEA FS GEA FT GEA HX GEA ME GEA PE GEA RT GEA Group
II. Performance Organic Development Order Intake FY 2012 yoy
12 Presentation Results FY 2012 - March 11, 2013
Q1 2012 Q2 2012 Q3 2012 Q4 2012 FY 2012
GEA‘s organic development negative impacted by GEA FS and GEA HX
engineering for a better world
0 100 200 300 400 500 600
Q4 11
Q1 12
Q2 12
Q3 12
Q4 12
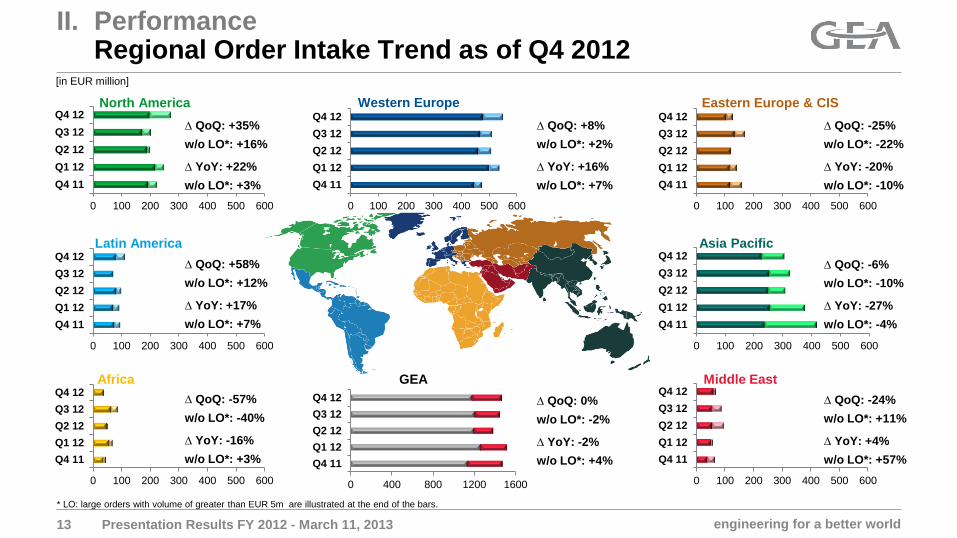
II. Performance Regional Order Intake Trend as of Q4 2012
13 Presentation Results FY 2012 - March 11, 2013
0 400 800 1200 1600
Q4 11
Q1 12
Q2 12
Q3 12
Q4 12
0 100 200 300 400 500 600
Q4 11
Q1 12
Q2 12
Q3 12
Q4 12
0 100 200 300 400 500 600
Q4 11
Q1 12
Q2 12
Q3 12
Q4 12
0 100 200 300 400 500 600
Q4 11
Q1 12
Q2 12
Q3 12
Q4 12
0 100 200 300 400 500 600
Q4 11
Q1 12
Q2 12
Q3 12
Q4 12
0 100 200 300 400 500 600
Q4 11
Q1 12
Q2 12
Q3 12
Q4 12
0 100 200 300 400 500 600
Q4 11
Q1 12
Q2 12
Q3 12
Q4 12
Eastern Europe & CIS Western Europe
* LO: large orders with volume of greater than EUR 5m are illustrated at the end of the bars.
North America
Asia Pacific
∆ QoQ: +35%
w/o LO*: +16%
∆ YoY: +22%
w/o LO*: +3%
∆ QoQ: +58%
w/o LO*: +12%
∆ YoY: +17%
w/o LO*: +7%
∆ QoQ: -57%
w/o LO*: -40%
∆ YoY: -16%
w/o LO*: +3%
∆ QoQ: -25%
w/o LO*: -22%
∆ YoY: -20%
w/o LO*: -10%
∆ QoQ: -6%
w/o LO*: -10%
∆ YoY: -27%
w/o LO*: -4%
∆ QoQ: -24%
w/o LO*: +11%
∆ YoY: +4%
w/o LO*: +57%
∆ QoQ: +8%
w/o LO*: +2%
∆ YoY: +16%
w/o LO*: +7%
∆ QoQ: 0%
w/o LO*: -2%
∆ YoY: -2%
w/o LO*: +4%
[in EUR million]
Latin America
Middle East Africa GEA

engineering for a better world
0 100 200 300
Q4 11
Q1 12
Q2 12
Q3 12
Q4 12
II. Performance Regional Food Order Trend as of Q4 2012
14 Presentation Results FY 2012 - March 11, 2013
0 300 600 900
Q4 11
Q1 12
Q2 12
Q3 12
Q4 12
0 100 200 300
Q4 11
Q1 12
Q2 12
Q3 12
Q4 12
0 100 200 300
Q4 11
Q1 12
Q2 12
Q3 12
Q4 12
0 100 200 300
Q4 11
Q1 12
Q2 12
Q3 12
Q4 12
0 100 200 300
Q4 11
Q1 12
Q2 12
Q3 12
Q4 12
0 100 200 300
Q4 11
Q1 12
Q2 12
Q3 12
Q4 12
0 100 200 300
Q4 11
Q1 12
Q2 12
Q3 12
Q4 12
* LO: large orders with volume of greater than EUR 5m are illustrated at the end of the bars.
∆ QoQ: +10%
w/o LO*: +17%
∆ YoY: -2%
w/o LO*: +7%
∆ QoQ: +88%
w/o LO*: +26%
∆ YoY: +24%
w/o LO*: -9%
∆ QoQ: -63%
w/o LO*: -37%
∆ YoY: +10%
w/o LO*: +10%
∆ QoQ: -18%
w/o LO*: -11%
∆ YoY: -3%
w/o LO*: +3%
∆ QoQ: -5%
w/o LO*: -15%
∆ YoY: -14%
w/o LO*: -13%
∆ QoQ: +63%
w/o LO*: +23%
∆ YoY: +109%
w/o LO*: +58%
∆ QoQ: +10%
w/o LO*: +4%
∆ YoY: +11%
w/o LO*: +8%
∆ QoQ: +3%
w/o LO*: 0%
∆ YoY: +4%
w/o LO*: +3%
[in EUR million]
Eastern Europe & CIS Western Europe
Middle East
North America
Asia Pacific Latin America
Africa GEA
engineering for a better world
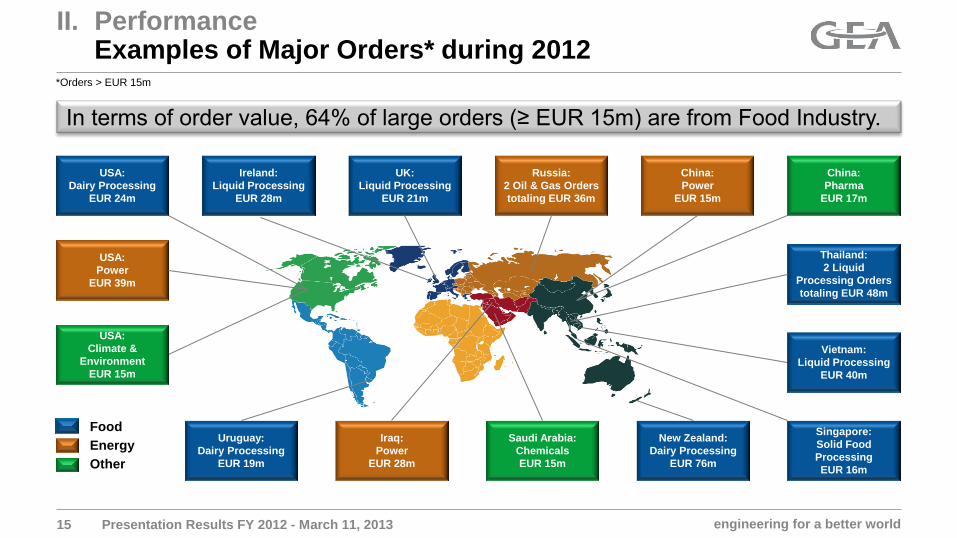
*Orders > EUR 15m
II. Performance Examples of Major Orders* during 2012
Presentation Results FY 2012 - March 11, 2013 15
Food
Energy
Other
Russia:
2 Oil & Gas Orders
totaling EUR 36m
China:
Pharma
EUR 17m
Singapore:
Solid Food
Processing
EUR 16m
New Zealand:
Dairy Processing
EUR 76m
Thailand:
2 Liquid
Processing Orders
totaling EUR 48m
Uruguay:
Dairy Processing
EUR 19m
Ireland:
Liquid Processing
EUR 28m
China:
Power
EUR 15m
Iraq:
Power
EUR 28m
Saudi Arabia:
Chemicals
EUR 15m
Vietnam:
Liquid Processing
EUR 40m
USA:
Dairy Processing
EUR 24m
UK:
Liquid Processing
EUR 21m
USA:
Power
EUR 39m
USA:
Climate &
Environment
EUR 15m
In terms of order value, 64% of large orders (≥ EUR 15m) are from Food Industry.
engineering for a better world
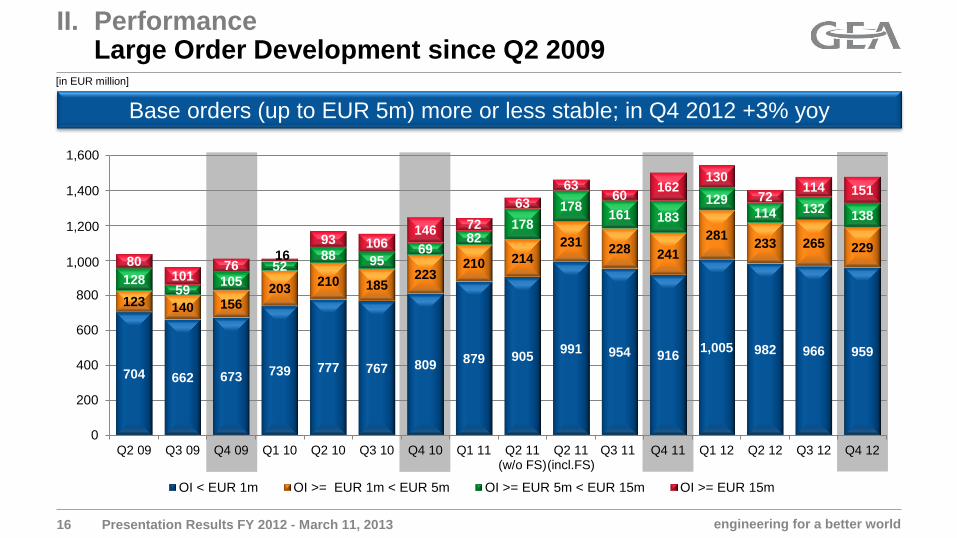
704 662 673 739 777 767 809 879 905 991 954 916
1,005 982 966 959
123 140 156
203 210 185
223 210 214
231 228 241
281 233 265 229
128 59
105 52
88 95 69
82 178
178 161 183
129 114 132
138
80 101
76 16
93 106 146 72
63
63 60
162 130
72 114 151
0
200
400
600
800
1,000
1,200
1,400
1,600
Q2 09 Q3 09 Q4 09 Q1 10 Q2 10 Q3 10 Q4 10 Q1 11 Q2 11(w/o FS)
Q2 11(incl.FS)
Q3 11 Q4 11 Q1 12 Q2 12 Q3 12 Q4 12
OI < EUR 1m OI >= EUR 1m < EUR 5m OI >= EUR 5m < EUR 15m OI >= EUR 15m
II. Performance Large Order Development since Q2 2009
16 Presentation Results FY 2012 - March 11, 2013
1,600
1,400
1,200
1,000
Base orders (up to EUR 5m) more or less stable; in Q4 2012 +3% yoy
[in EUR million]
engineering for a better world
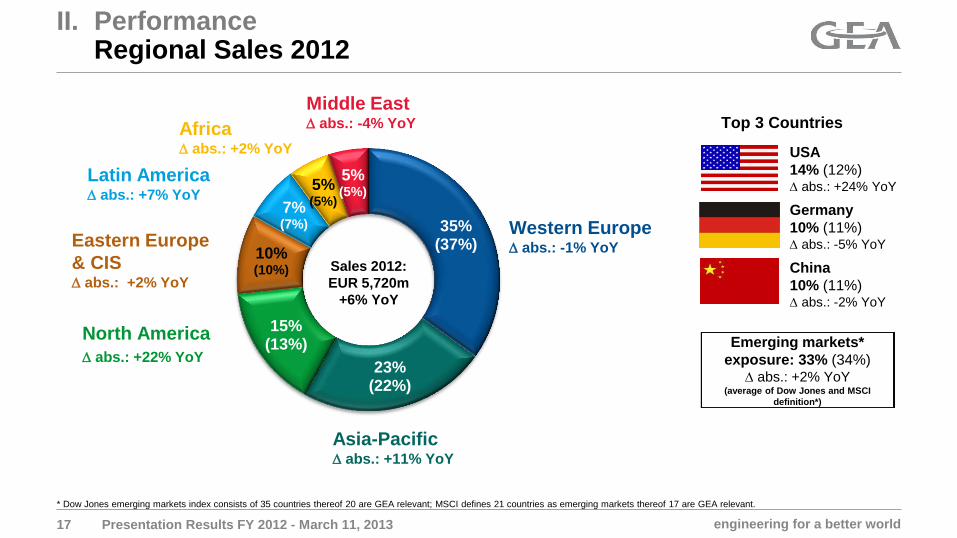
35% (37%)
23% (22%)
15% (13%)
10% (10%)
7% (7%)
5% (5%)
5% (5%)
Emerging markets*
exposure: 33% (34%) abs.: +2% YoY
(average of Dow Jones and MSCI
definition*)
Sales 2012:
EUR 5,720m
+6% YoY
II. Performance Regional Sales 2012
17 Presentation Results FY 2012 - March 11, 2013
Germany
10% (11%) abs.: -5% YoY
USA
14% (12%) abs.: +24% YoY
China
10% (11%) abs.: -2% YoY
Top 3 Countries
Western Europe abs.: -1% YoY
Asia-Pacific abs.: +11% YoY
North America
abs.: +22% YoY
Latin America abs.: +7% YoY
Eastern Europe
& CIS abs.: +2% YoY
Middle East abs.: -4% YoY Africa
abs.: +2% YoY
* Dow Jones emerging markets index consists of 35 countries thereof 20 are GEA relevant; MSCI defines 21 countries as emerging markets thereof 17 are GEA relevant.
engineering for a better world
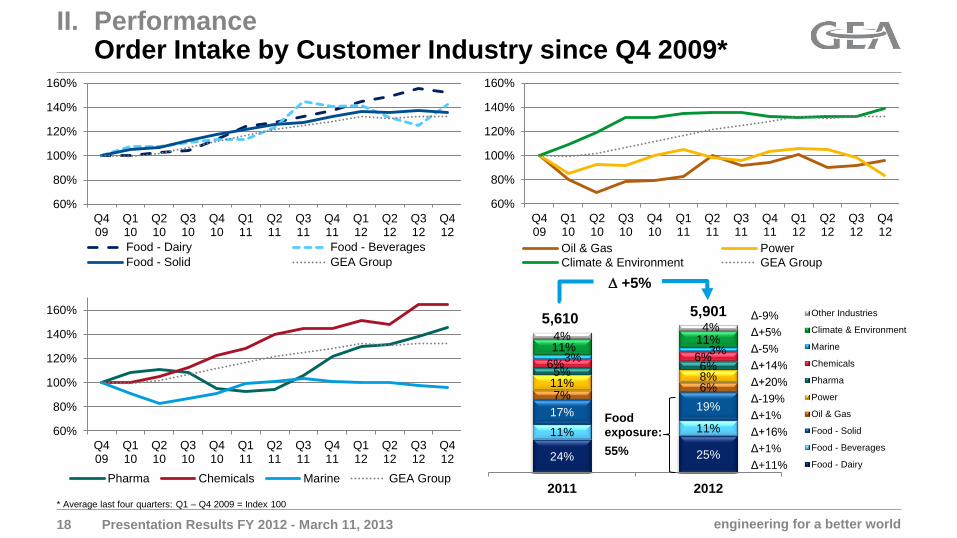
24% 25%
11% 11%
17% 19%
7% 6% 11% 8% 5% 6% 6%
6% 3% 3% 11%
11% 4% 4%
2011 2012
Other Industries
Climate & Environment
Marine
Chemicals
Pharma
Power
Oil & Gas
Food - Solid
Food - Beverages
Food - Dairy
18
II. Performance Order Intake by Customer Industry since Q4 2009*
* Average last four quarters: Q1 – Q4 2009 = Index 100
Δ+11%
Δ+5%
Δ+16%
Δ+1%
Δ-19%
Δ+1%
Δ+14%
Δ+20%
Δ-9%
Δ-5%
+5%
5,610 5,901
Presentation Results FY 2012 - March 11, 2013
60%
80%
100%
120%
140%
160%
Q409
Q110
Q210
Q310
Q410
Q111
Q211
Q311
Q411
Q112
Q212
Q312
Q412
Food - Dairy Food - Beverages
Food - Solid GEA Group
60%
80%
100%
120%
140%
160%
Q409
Q110
Q210
Q310
Q410
Q111
Q211
Q311
Q411
Q112
Q212
Q312
Q412
Pharma Chemicals Marine GEA Group
60%
80%
100%
120%
140%
160%
Q409
Q110
Q210
Q310
Q410
Q111
Q211
Q311
Q411
Q112
Q212
Q312
Q412
Oil & Gas Power
Climate & Environment GEA Group
Food
exposure:
55%
engineering for a better world
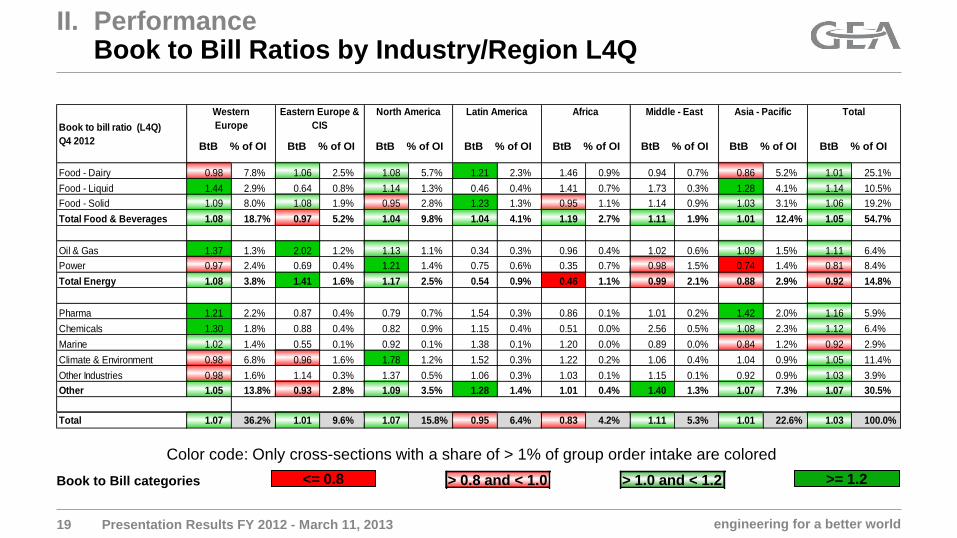
II. Performance Book to Bill Ratios by Industry/Region L4Q
19 Presentation Results FY 2012 - March 11, 2013
<= 0.8 > 0.8 and < 1.0 >= 1.2 > 1.0 and < 1.2
Color code: Only cross-sections with a share of > 1% of group order intake are colored
Book to Bill categories
BtB % of OI BtB % of OI BtB % of OI BtB % of OI BtB % of OI BtB % of OI BtB % of OI BtB % of OI
Book to bill ratio (L4Q)
Q4 2012
Food - Dairy 0.98 7.8% 1.06 2.5% 1.08 5.7% 1.21 2.3% 1.46 0.9% 0.94 0.7% 0.86 5.2% 1.01 25.1%
Food - Liquid 1.44 2.9% 0.64 0.8% 1.14 1.3% 0.46 0.4% 1.41 0.7% 1.73 0.3% 1.28 4.1% 1.14 10.5%
Food - Solid 1.09 8.0% 1.08 1.9% 0.95 2.8% 1.23 1.3% 0.95 1.1% 1.14 0.9% 1.03 3.1% 1.06 19.2%
Total Food & Beverages 1.08 18.7% 0.97 5.2% 1.04 9.8% 1.04 4.1% 1.19 2.7% 1.11 1.9% 1.01 12.4% 1.05 54.7%
Oil & Gas 1.37 1.3% 2.02 1.2% 1.13 1.1% 0.34 0.3% 0.96 0.4% 1.02 0.6% 1.09 1.5% 1.11 6.4%
Power 0.97 2.4% 0.69 0.4% 1.21 1.4% 0.75 0.6% 0.35 0.7% 0.98 1.5% 0.74 1.4% 0.81 8.4%
Total Energy 1.08 3.8% 1.41 1.6% 1.17 2.5% 0.54 0.9% 0.46 1.1% 0.99 2.1% 0.88 2.9% 0.92 14.8%
Pharma 1.21 2.2% 0.87 0.4% 0.79 0.7% 1.54 0.3% 0.86 0.1% 1.01 0.2% 1.42 2.0% 1.16 5.9%
Chemicals 1.30 1.8% 0.88 0.4% 0.82 0.9% 1.15 0.4% 0.51 0.0% 2.56 0.5% 1.08 2.3% 1.12 6.4%
Marine 1.02 1.4% 0.55 0.1% 0.92 0.1% 1.38 0.1% 1.20 0.0% 0.89 0.0% 0.84 1.2% 0.92 2.9%
Climate & Environment 0.98 6.8% 0.96 1.6% 1.78 1.2% 1.52 0.3% 1.22 0.2% 1.06 0.4% 1.04 0.9% 1.05 11.4%
Other Industries 0.98 1.6% 1.14 0.3% 1.37 0.5% 1.06 0.3% 1.03 0.1% 1.15 0.1% 0.92 0.9% 1.03 3.9%
Other 1.05 13.8% 0.93 2.8% 1.09 3.5% 1.28 1.4% 1.01 0.4% 1.40 1.3% 1.07 7.3% 1.07 30.5%
Total 1.07 36.2% 1.01 9.6% 1.07 15.8% 0.95 6.4% 0.83 4.2% 1.11 5.3% 1.01 22.6% 1.03 100.0%
Asia - Pacific TotalWestern
Europe
Eastern Europe &
CIS
North America Latin America Africa Middle - East

engineering for a better world
0
500
1000
1500
2000
2500
3000
3500
Q1 10 Q2 10 Q3 10 Q4 10 Q1 11 Q2 11 Q3 11 Q4 11 Q1 12 Q2 12 Q3 12 Q4 12
Order Intake Sales
3,000
2,500
2,000
1,500
1,000
500
0
3,500
II. Performance Top Line Trend / Order Backlog
20 Presentation Results FY 2012 - March 11, 2013
2,968
2,301 2,469 2,424 2,414
2,667 2,771
2,936 2,967
2,677 2,756
L4Q BtB ratio
1,9001
514
2,150²
527
2,200³
552
1.00 1.04 1.06 1.06 1.03 1.03 0.94 0.98 1.06 1.04 1.04
#
[in EUR million]
2,752
1.03
1 Order backlog invoicable in FY2011. ² Order backlog invoicable in FY2012. ³ Order backlog invoicable in FY2013.

engineering for a better world
657
482
567 555 566
445
647 707 720
577
772 764 741
533
17.2%
16.4%
15.0%
13.9%
13.1% 12.4% 12.4% 12.4% 12.6% 12.6% 12.9%
13.3% 13.3% 13.2%
0%
2%
4%
6%
8%
10%
12%
14%
16%
18%
0
100
200
300
400
500
600
700
800
900
Q3 09 Q4 09 Q1 10 Q2 10 Q3 10 Q4 10 Q1 11 Q2 11 Q3 11 Q4 11 Q1 12 Q2 12 Q3 12 Q4 12
Working Capital Working Capital (average LTM) as % of Sales (LTM)
II. Performance Working Capital Development
21 Presentation Results FY 2012 - March 11, 2013
- 405 bps
[in EUR million]
engineering for a better world
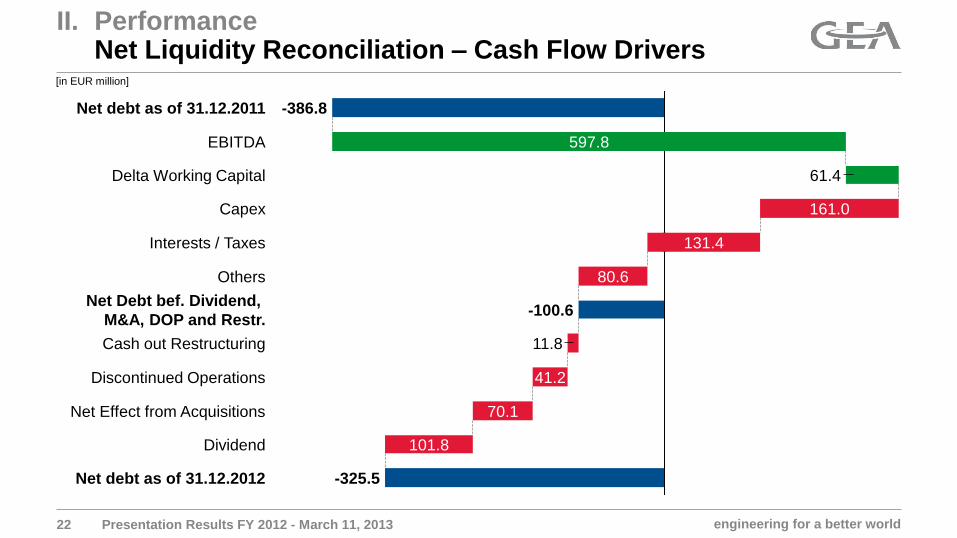
II. Performance Net Liquidity Reconciliation – Cash Flow Drivers
22 Presentation Results FY 2012 - March 11, 2013
Others 80.6
Interests / Taxes 131.4
Capex
Delta Working Capital 61.4
EBITDA 597.8
Net debt as of 31.12.2011 -386.8
Discontinued Operations
70.1
11.8
41.2
Cash out Restructuring
Net Debt bef. Dividend,
M&A, DOP and Restr.
-325.5
Dividend 101.8
Net Effect from Acquisitions
Net debt as of 31.12.2012
-100.6
161.0
[in EUR million]

engineering for a better world 23
II. Performance Service Business Q1-Q4 2012
1,066
102 113
178
271
206 196
1,217
141 139
203
308
234
193
GEA Group GEA FS GEA FT GEA HX GEA ME GEA PE GEA RT
2011 2012 Service business as % of sales
Growth in service sales Q1-Q4 2012 yoy: +14% to a total of EUR 1,217m
Share of service sales Q1-Q4 2012: 21.3% (Q1-Q4 2011: 19.7%)
22%
+14%
+22%
-2%
%
24%
20%
21%
38% 11%
13%
32%
33%
13% 14%
30% 28%
+14%
+14% +14%
30%
* Calculated without one-time POC-related accounting adjustments of EUR 42m (in the denominator)
*
+38%
Presentation Results FY 2012 - March 11, 2013
[in EUR million]

engineering for a better world
II. Performance GEA Food Solutions
24 Presentation Results FY 2012 - March 11, 2013
Order Intake
Q4
2011
Q4
2012 ∆
(%)
119.6 101.1 -15.6
thereof organic: -10.5
Sales
Q4 2011 Q4
2012 ∆
(%)
130.6 88.0 -32.6
thereof organic: -28.0
EBIT
before PPA*
Q4
2011
Q4
2012 ∆
(%)
10.2 -25.5 n.a.
EBIT Margin
before PPA (%)*
Q4
2011
Q4
2012 ∆
(bps)
7.8 -29.0 n.a.
Order Intake by Customer Industry Order Intake by Region
[in EUR million]
100%
100%
Q4 2011 Q4 2012
Food &Beverages
45% 44%
13% 17%
14% 16%
14%
11%
6%
9%
5%
2%
2%
1%
Q4 2011 Q4 2012
Africa
Middle - East
Latin America
Eastern Europe& CISAsia - Pacific
North America
Western Europe
Δ-16%
Δ-17%
Δ+11%
Δ-4%
Δ-35%
Δ-82%
Δ-61% Δ+19%
* including non-recurring items of EUR 20.9m in Q4 2012.
engineering for a better world
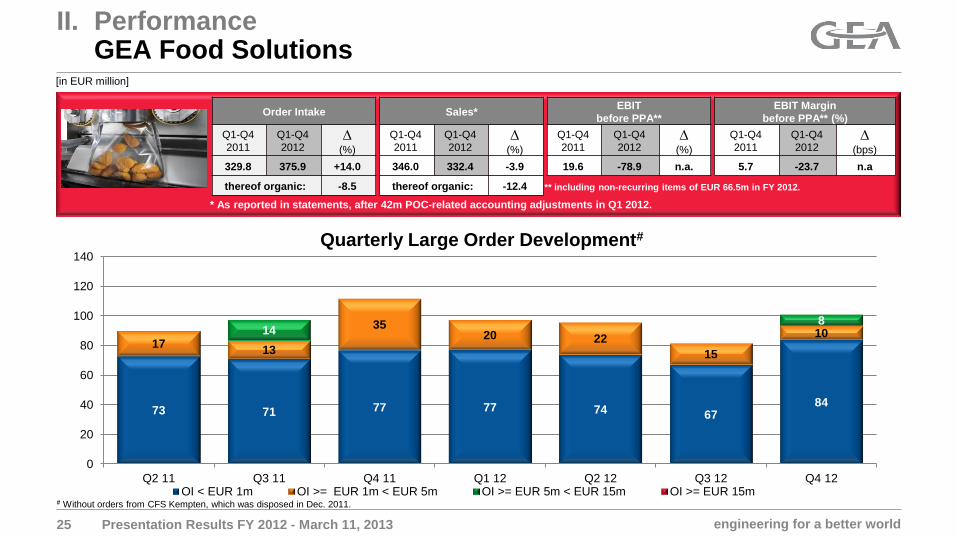
II. Performance GEA Food Solutions
25 Presentation Results FY 2012 - March 11, 2013
Order Intake
Q1-Q4
2011
Q1-Q4
2012 ∆
(%)
329.8 375.9 +14.0
thereof organic: -8.5
Sales*
Q1-Q4
2011
Q1-Q4
2012 ∆
(%)
346.0 332.4 -3.9
thereof organic: -12.4
EBIT
before PPA**
Q1-Q4
2011
Q1-Q4
2012 ∆
(%)
19.6 -78.9 n.a.
EBIT Margin
before PPA** (%)
Q1-Q4
2011
Q1-Q4
2012 ∆
(bps)
5.7 -23.7 n.a
73 71 77 77 74 67 84
17 13
35 20 22
15
10 14 8
0
20
40
60
80
100
120
140
Q2 11 Q3 11 Q4 11 Q1 12 Q2 12 Q3 12 Q4 12OI < EUR 1m OI >= EUR 1m < EUR 5m OI >= EUR 5m < EUR 15m OI >= EUR 15m
Quarterly Large Order Development#
# Without orders from CFS Kempten, which was disposed in Dec. 2011.
[in EUR million]
* As reported in statements, after 42m POC-related accounting adjustments in Q1 2012.
** including non-recurring items of EUR 66.5m in FY 2012.

engineering for a better world
30% 37%
39% 33%
12% 11% 7%
11% 11%
8%
Q4 2011 Q4 2012
Latin America
Asia - Pacific
Eastern Europe& CIS
North America
Western Europe
100% 100%
Q4 2011 Q4 2012
Food &Beverages
II. Performance GEA Farm Technologies
26 Presentation Results FY 2012 - March 11, 2013
Order Intake
Q4
2011
Q4
2012 ∆
(%)
131.7 142.6 +8.3
thereof organic: +3.5
Sales
Q4
2011
Q4
2012 ∆
(%)
153.8 172.3 +12.0
thereof organic: +8.6
EBIT
before PPA
Q4
2011
Q4
2012 ∆
(%)
14.0 21.6 +53.5
EBIT Margin
before PPA (%)
Q4
2011
Q4
2012 ∆
(bps)
9.1 12.5 +339
Order Intake by Customer Industry Order Intake by Region
Δ+8%
Δ+32%
Δ-9%
Δ-22%
Δ+60%
Δ+5%
[in EUR million]

engineering for a better world
II. Performance GEA Farm Technologies
27 Presentation Results FY 2012 - March 11, 2013
Order Intake
Q1-Q4
2011
Q1-Q4
2012 ∆
(%)
527.4 583.9 +10.7
thereof organic: +6.9
Sales
Q1-Q4
2011
Q1-Q4
2012 ∆
(%)
509.8 580.9 +13.9
thereof organic: +10.2
EBIT
before PPA
Q1-Q4
2011
Q1-Q4
2012 ∆
(%)
33.8 46.4 +37.4
EBIT Margin
before PPA (%)
Q1-Q4
2011
Q1-Q4
2012 ∆
(bps)
6.6 8.0 +136
Quarterly Large Order Development
[in EUR million]
95 101 94 99 100 116 115 116
126 130 140
129 147 144 146 143
1 1
3
1 1 1
0
20
40
60
80
100
120
140
160
Q1 09 Q2 09 Q3 09 Q4 09 Q1 10 Q2 10 Q3 10 Q4 10 Q1 11 Q2 11 Q3 11 Q4 11 Q1 12 Q2 12 Q3 12 Q4 12OI < EUR 1m OI >= EUR 1m < EUR 5m OI >= EUR 5m < EUR 15m OI >= EUR 15m

engineering for a better world
47%
38%
23%
30%
12%
14%
4%
6%
6%
5%
3%
3%
4%
4%
Q4 2011 Q4 2012
Other Industries
Marine
Chemicals
Food &Beverages
Oil & Gas
Climate &Environment
Power
32% 43%
36%
21%
6%
18%
9%
9%
4%
4%
4%
3%
9%
3%
Q4 2011 Q4 2012
Middle - East
Africa
Latin America
Eastern Europe& CISNorth America
Asia - Pacific
Western Europe
II. Performance GEA Heat Exchangers
28 Presentation Results FY 2012 - March 11, 2013
Order Intake
Q4
2011
Q4
2012 ∆
(%)
462.3 349.7 -24.4
thereof organic: -26.1
Sales
Q4
2011
Q4
2012 ∆
(%)
463.6 422.7 -8.8
thereof organic: -9.8
EBIT
before PPA
Q4
2011
Q4
2012 ∆
(%)
36.7 52.1 +41.9
EBIT Margin
before PPA (%)
Q4
2011
Q4
2012 ∆
(bps)
7.9 12.3 +441
Order Intake by Customer Industry Order Intake by Region
Δ-39%
Δ0%
Δ+29% Δ-38% Δ-30% Δ-18%
Δ+1%
Δ-55%
Δ+133%
Δ-26%
Δ-73% Δ-46% Δ-25%
Δ-11%
[in EUR million]
engineering for a better world
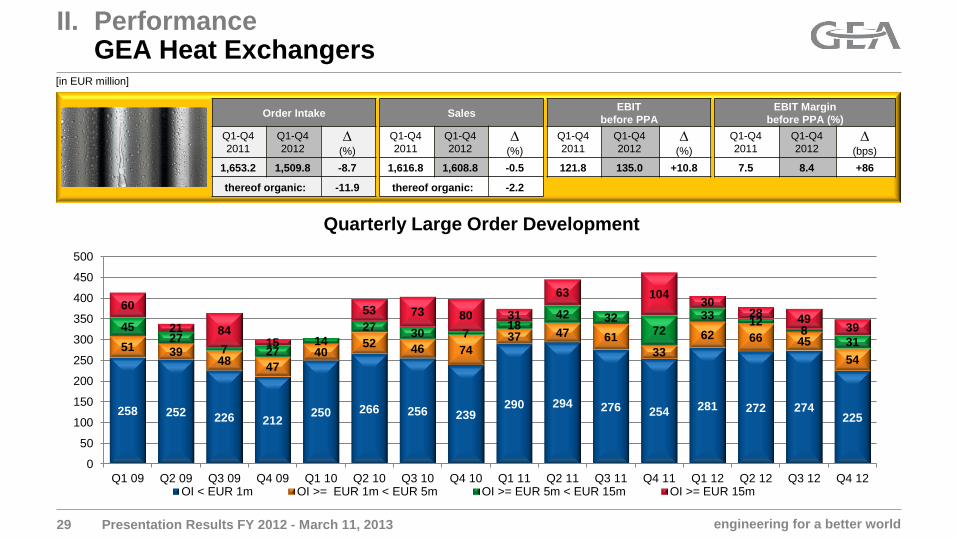
II. Performance GEA Heat Exchangers
29 Presentation Results FY 2012 - March 11, 2013
Order Intake
Q1-Q4
2011
Q1-Q4
2012 ∆
(%)
1,653.2 1,509.8 -8.7
thereof organic: -11.9
Sales
Q1-Q4
2011
Q1-Q4
2012 ∆
(%)
1,616.8 1,608.8 -0.5
thereof organic: -2.2
EBIT
before PPA
Q1-Q4
2011
Q1-Q4
2012 ∆
(%)
121.8 135.0 +10.8
EBIT Margin
before PPA (%)
Q1-Q4
2011
Q1-Q4
2012 ∆
(bps)
7.5 8.4 +86
Quarterly Large Order Development
[in EUR million]
258 252 226 212 250 266 256 239
290 294 276 254 281 272 274 225
51 39 48
47
40 52
46 74 37 47 61
33
62 66 45
54
45 27
7 27 14
27 30 7
18 42 32
72
33 12
8 31
60
21 84 15
53 73 80 31
63 104 30
28 49
39
0
50
100
150
200
250
300
350
400
450
500
Q1 09 Q2 09 Q3 09 Q4 09 Q1 10 Q2 10 Q3 10 Q4 10 Q1 11 Q2 11 Q3 11 Q4 11 Q1 12 Q2 12 Q3 12 Q4 12OI < EUR 1m OI >= EUR 1m < EUR 5m OI >= EUR 5m < EUR 15m OI >= EUR 15m
engineering for a better world
59% 50%
6%
13% 5%
12%
12%
10%
4%
5%
4%
5%
7%
4%
1%
1%
Q4 2011 Q4 2012
Other Industries
Power
Pharma
Chemicals
Marine
Climate &EnvironmentOil & Gas
Food &Beverages
30% 36%
24%
25% 30%
24% 6%
6%
2%
4%
5%
3%
2%
2%
Q4 2011 Q4 2012
Africa
Eastern Europe& CISMiddle - East
Latin America
Asia - Pacific
North America
Western Europe
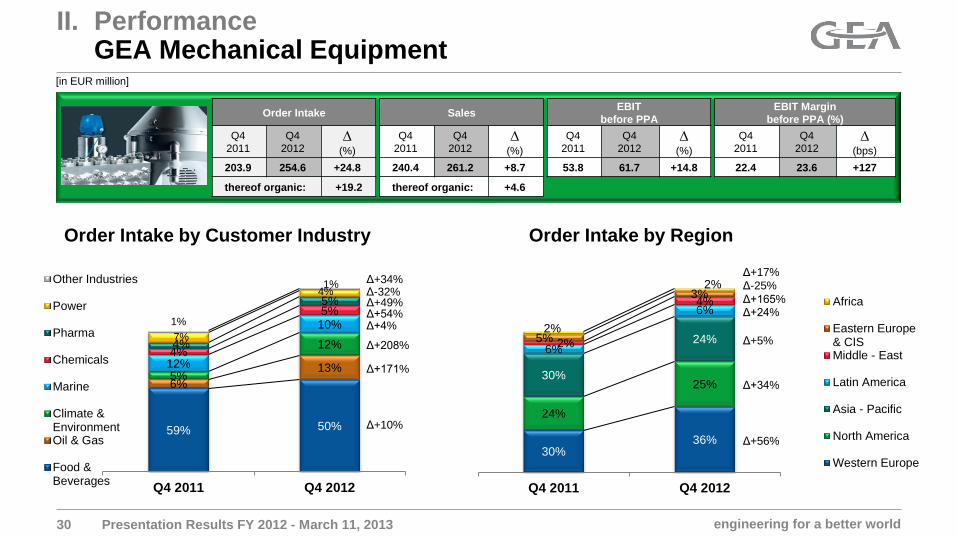
II. Performance GEA Mechanical Equipment
30 Presentation Results FY 2012 - March 11, 2013
Order Intake
Q4
2011
Q4
2012 ∆
(%)
203.9 254.6 +24.8
thereof organic: +19.2
Sales
Q4
2011
Q4
2012 ∆
(%)
240.4 261.2 +8.7
thereof organic: +4.6
EBIT
before PPA
Q4
2011
Q4
2012 ∆
(%)
53.8 61.7 +14.8
EBIT Margin
before PPA (%)
Q4
2011
Q4
2012 ∆
(bps)
22.4 23.6 +127
Order Intake by Customer Industry Order Intake by Region
Δ+10%
Δ+171%
Δ+4% Δ+54% Δ+49%
Δ+208%
Δ+56%
Δ+34%
Δ+5%
Δ+24% Δ+165%
Δ-25%
Δ+17% Δ+34%
[in EUR million]
Δ-32%
engineering for a better world
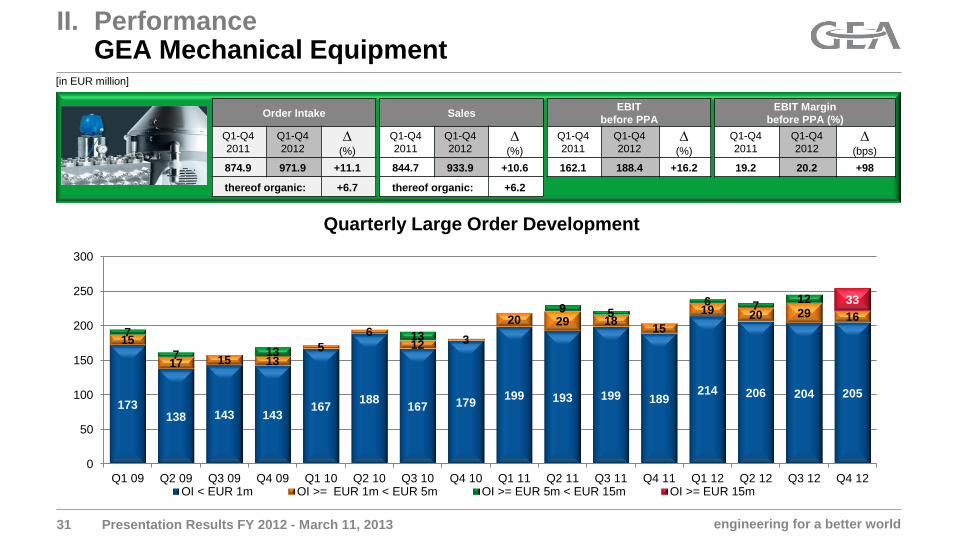
II. Performance GEA Mechanical Equipment
31 Presentation Results FY 2012 - March 11, 2013
Order Intake
Q1-Q4
2011
Q1-Q4
2012 ∆
(%)
874.9 971.9 +11.1
thereof organic: +6.7
Sales
Q1-Q4
2011
Q1-Q4
2012 ∆
(%)
844.7 933.9 +10.6
thereof organic: +6.2
EBIT
before PPA
Q1-Q4
2011
Q1-Q4
2012 ∆
(%)
162.1 188.4 +16.2
EBIT Margin
before PPA (%)
Q1-Q4
2011
Q1-Q4
2012 ∆
(bps)
19.2 20.2 +98
Quarterly Large Order Development
[in EUR million]
173 138 143 143
167 188
167 179 199 193 199 189
214 206 204 205
15
17 15 13 5
6 12 3
20 29 18 15
19 20 29 16
7
7 13
13
9 5 6 7
12 33
0
50
100
150
200
250
300
Q1 09 Q2 09 Q3 09 Q4 09 Q1 10 Q2 10 Q3 10 Q4 10 Q1 11 Q2 11 Q3 11 Q4 11 Q1 12 Q2 12 Q3 12 Q4 12OI < EUR 1m OI >= EUR 1m < EUR 5m OI >= EUR 5m < EUR 15m OI >= EUR 15m

engineering for a better world
74% 70%
16% 18%
6% 6% 2% 4%
3% 1%
Q4 2011 Q4 2012
Other Industries
Climate &Environment
Chemicals
Pharma
Food &Beverages
26% 30%
36% 27%
15% 13%
9% 13%
11% 9% 2% 6% 2%
2%
Q4 2011 Q4 2012
Africa
Middle - East
Eastern Europe& CISLatin America
North America
Asia - Pacific
Western Europe
II. Performance GEA Process Engineering
32 Presentation Results FY 2012 - March 11, 2013
Order Intake
Q4
2011
Q4
2012 ∆
(%)
449.0 469.2 +4.5
thereof organic: +2.9
Sales
Q4
2011
Q4
2012 ∆
(%)
496.6 518.3 +4.4
thereof organic: +1.9
EBIT
before PPA
Q4
2011
Q4
2012 ∆
(%)
69.4 71.4 +2.8
EBIT Margin
before PPA (%)
Q4
2011
Q4
2012 ∆
(bps)
14.0 13.8 -21
Order Intake by Customer Industry Order Intake by Region
Δ-1%
Δ+20%
Δ+22% Δ+171%
Δ-52%
Δ+20%
Δ -20%
Δ-8%
Δ+55%
Δ-16%
Δ+253% Δ+34%
[in EUR million]

engineering for a better world
II. Performance GEA Process Engineering
33 Presentation Results FY 2012 - March 11, 2013
Order Intake
Q1-Q4
2011
Q1-Q4
2012 ∆
(%)
1,709.9 1,850.2 +8.2
thereof organic: +4.5
Sales
Q1-Q4
2011
Q1-Q4
2012 ∆
(%)
1,577.2 1,716.3 +8.8
thereof organic: +4.5
EBIT
before PPA
Q1-Q4
2011
Q1-Q4
2012 ∆
(%)
148.2 162.8 +9.9
EBIT Margin
before PPA (%)
Q1-Q4
2011
Q1-Q4
2012 ∆
(bps)
9.4 9.5 +9
Quarterly Large Order Development
[in EUR million]
122 121 119 140 138 117 136 177 169 178 167 159 186 175 170 197
81 49 66
80 143
121 110
119 133 122 116 121 144
107 132 100 48
79 52 55
38 61 43
58 59 127
90 111 82
75 101 94
60 17
60 16 40 33
66 41 60
58
100
44
65 79
0
100
200
300
400
500
600
Q1 09 Q2 09 Q3 09 Q4 09 Q1 10 Q2 10 Q3 10 Q4 10 Q1 11 Q2 11 Q3 11 Q4 11 Q1 12 Q2 12 Q3 12 Q4 12OI < EUR 1m OI >= EUR 1m < EUR 5m OI >= EUR 5m < EUR 15m OI >= EUR 15m
engineering for a better world
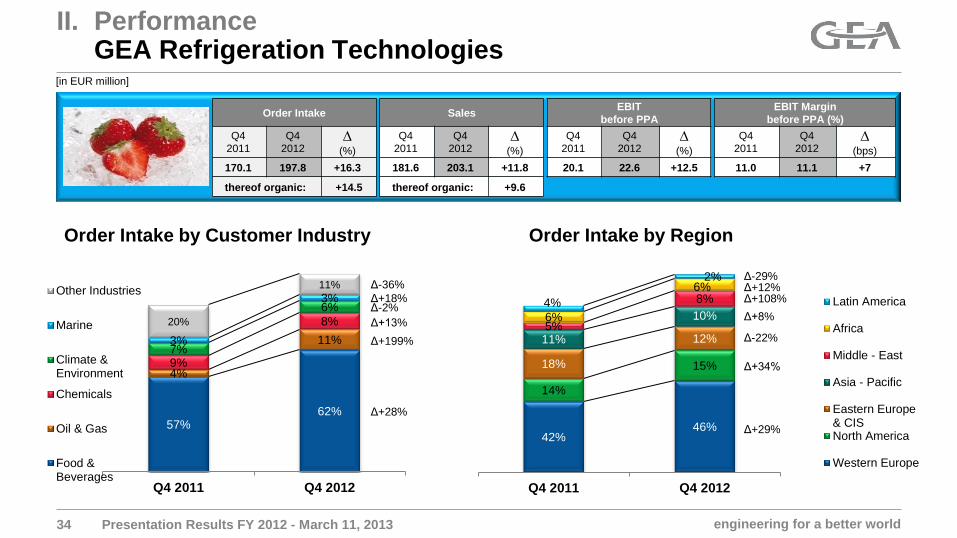
II. Performance GEA Refrigeration Technologies
34 Presentation Results FY 2012 - March 11, 2013
Order Intake
Q4
2011
Q4
2012 ∆
(%)
170.1 197.8 +16.3
thereof organic: +14.5
Sales
Q4
2011
Q4
2012 ∆
(%)
181.6 203.1 +11.8
thereof organic: +9.6
EBIT
before PPA
Q4
2011
Q4
2012 ∆
(%)
20.1 22.6 +12.5
EBIT Margin
before PPA (%)
Q4
2011
Q4
2012 ∆
(bps)
11.0 11.1 +7
57% 62%
4%
11%
9%
8%
7%
6%
3%
3%
20%
11%
Q4 2011 Q4 2012
Other Industries
Marine
Climate &Environment
Chemicals
Oil & Gas
Food &Beverages
42% 46%
14%
15% 18%
12% 11%
10% 5%
8%
6%
6%
4%
2%
Q4 2011 Q4 2012
Latin America
Africa
Middle - East
Asia - Pacific
Eastern Europe& CISNorth America
Western Europe
Δ+28%
Δ+199%
Δ-2% Δ+18%
Δ+13%
Δ+29%
Δ+34%
Δ-22%
Δ+8%
Δ+108% Δ+12%
Order Intake by Customer Industry Order Intake by Region
Δ-36% Δ-29%
[in EUR million]

engineering for a better world
II. Performance GEA Refrigeration Technologies
35 Presentation Results FY 2012 - March 11, 2013
Order Intake
Q1-Q4
2011
Q1-Q4
2012 ∆
(%)
650.4 756.2 +16.3
thereof organic: +10.9
Sales
Q1-Q4
2011
Q1-Q4
2012 ∆
(%)
647.2 694.8 +7.4
thereof organic: +2.5
EBIT
before PPA
Q1-Q4
2011
Q1-Q4
2012 ∆
(%)
51.3 56.2 +9.6
EBIT Margin
before PPA (%)
Q1-Q4
2011
Q1-Q4
2012 ∆
(bps)
7.9 8.1 +16
Quarterly Large Order Development
[in EUR million]
111 110 105 105 113 121 122 120 128 145
126 135 140 139 146 142
18 17 10 16
14 30 17 27 19
17
20 35 29 22
44 50
10 15 10
10 5 6 19
8 20
10 6
0
50
100
150
200
250
Q1 09 Q2 09 Q3 09 Q4 09 Q1 10 Q2 10 Q3 10 Q4 10 Q1 11 Q2 11 Q3 11 Q4 11 Q1 12 Q2 12 Q3 12 Q4 12OI < EUR 1m OI >= EUR 1m < EUR 5m OI >= EUR 5m < EUR 15m OI >= EUR 15m

engineering for a better world
III. Outlook Key Figures FY 2013
36 Presentation Results FY 2012 - March 11, 2013
Sales: moderate growth
Calculation Cash Flow Driver Margin:
EBITDA – Capex +/- Working Capital (LTM)
Sales
EBITDA: around EUR 700m
Assuming that there is no downturn in global economic growth, we are aiming at the
following in the current fiscal year
Cash Flow Driver Margin: at least 8%

engineering for a better world
III. Outlook Additional Financial Information for 2013
37 Presentation Results FY 2012 - March 11, 2013
Tax rate in P&L after impact from tax around 22.5%
loss carry forwards:
Impact from PPA in 2013 and in around EUR 25m p.a.
subsequent years: thereof GEA FS around EUR 14m p.a.
Sustainable capex level: around 2.0% of sales
Working Capital LTM: approx. 12% - 14% of sales LTM
Interest result: interest rate for financial liabilities
(excl. pensions) below 4% p.a.
Dividend policy: around 1/3 of net income
Depreciation & amortization in FY 2012: amounted to around EUR 145m in 2012
engineering for a better world
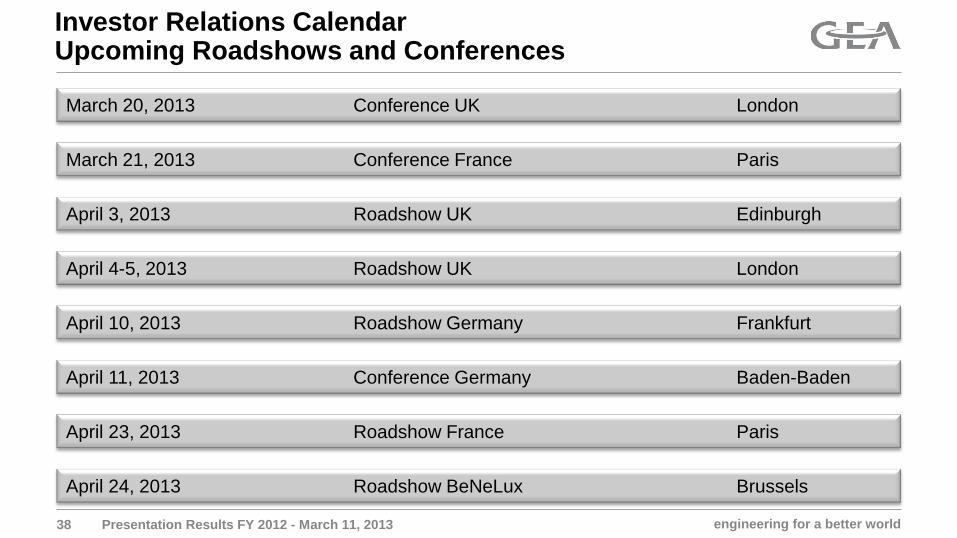
Investor Relations Calendar Upcoming Roadshows and Conferences
38 Presentation Results FY 2012 - March 11, 2013
March 20, 2013 Conference UK London
April 3, 2013 Roadshow UK Edinburgh
March 21, 2013 Conference France Paris
April 4-5, 2013 Roadshow UK London
April 11, 2013 Conference Germany Baden-Baden
April 23, 2013 Roadshow France Paris
April 24, 2013 Roadshow BeNeLux Brussels
April 10, 2013 Roadshow Germany Frankfurt

engineering for a better world
Financial Calendar
39 Presentation Results FY 2012 - March 11, 2013
April 18, 2013 Annual General Meeting
May 8, 2013 Interim Report Q1 2013
July 30, 2013 Interim Report Q2 2013
October 31, 2013 Interim Report Q3 2013

40
engineering for a better world
Agenda
41 Presentation Results FY 2012 - March 11, 2013
January – December 2012
I. Key Figures
II. Performance
Backup
Performance GEA Group and Segments
III. Outlook
engineering for a better world
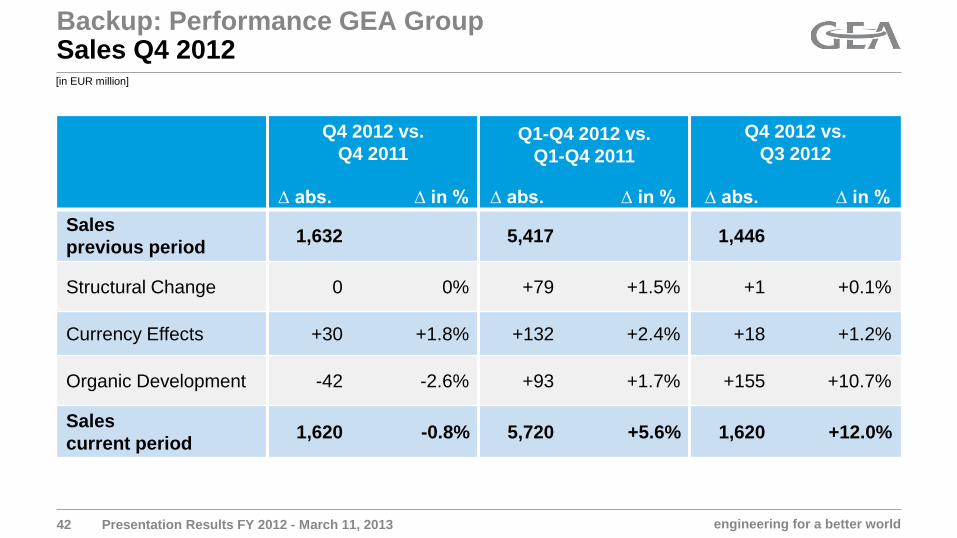
Backup: Performance GEA Group Sales Q4 2012
42 Presentation Results FY 2012 - March 11, 2013
Q4 2012 vs.
Q4 2011
Q1-Q4 2012 vs.
Q1-Q4 2011
Q4 2012 vs.
Q3 2012
Sales
previous period 1,632 5,417 1,446
Structural Change 0 0% +79 +1.5% +1 +0.1%
Currency Effects +30 +1.8% +132 +2.4% +18 +1.2%
Organic Development -42 -2.6% +93 +1.7% +155 +10.7%
Sales
current period 1,620 -0.8% 5,720 +5.6% 1,620 +12.0%
∆ abs. ∆ in %
∆ abs. ∆ in %
∆ abs. ∆ in %
[in EUR million]

engineering for a better world
743
833
752
1,357
1,278
1,250
903
683
839
620
688
629
577
741
533
Backup: Performance GEA Group Working Capital Development
43 Presentation Results FY 2012 - March 11, 2013
Trade
Receivables
Inven-
tories
Trade
Payables Advance
Payments
Working
Capital
Q3 2012
Q4 2012
-29
-2%
-80
-10%
+156
+23%
-58
-8%
-207
-28%
Q4 2011
-79
-6%
+90
+12%
-220
-24%
+68
+11%
+163
+28%
_
_
_
[in EUR million]
engineering for a better world
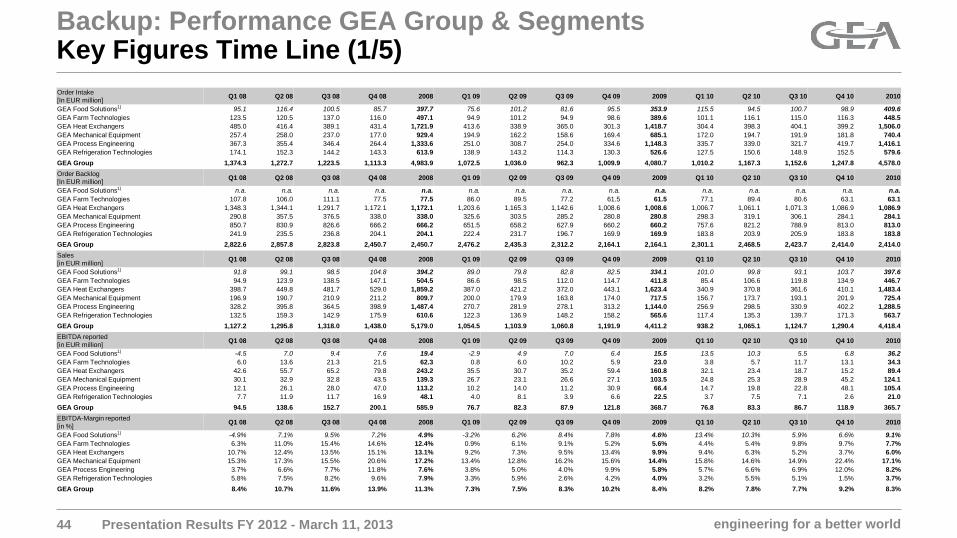
Backup: Performance GEA Group & Segments Key Figures Time Line (1/5)
Presentation Results FY 2012 - March 11, 2013 44
Order Intake
[In EUR million] Q1 08 Q2 08 Q3 08 Q4 08 2008 Q1 09 Q2 09 Q3 09 Q4 09 2009 Q1 10 Q2 10 Q3 10 Q4 10 2010
GEA Food Solutions1) 95.1 116.4 100.5 85.7 397.7 75.6 101.2 81.6 95.5 353.9 115.5 94.5 100.7 98.9 409.6
GEA Farm Technologies 123.5 120.5 137.0 116.0 497.1 94.9 101.2 94.9 98.6 389.6 101.1 116.1 115.0 116.3 448.5
GEA Heat Exchangers 485.0 416.4 389.1 431.4 1,721.9 413.6 338.9 365.0 301.3 1,418.7 304.4 398.3 404.1 399.2 1,506.0
GEA Mechanical Equipment 257.4 258.0 237.0 177.0 929.4 194.9 162.2 158.6 169.4 685.1 172.0 194.7 191.9 181.8 740.4
GEA Process Engineering 367.3 355.4 346.4 264.4 1,333.6 251.0 308.7 254.0 334.6 1,148.3 335.7 339.0 321.7 419.7 1,416.1
GEA Refrigeration Technologies 174.1 152.3 144.2 143.3 613.9 138.9 143.2 114.3 130.3 526.6 127.5 150.6 148.9 152.5 579.6
GEA Group 1,374.3 1,272.7 1,223.5 1,113.3 4,983.9 1,072.5 1,036.0 962.3 1,009.9 4,080.7 1,010.2 1,167.3 1,152.6 1,247.8 4,578.0
Order Backlog
[In EUR million] Q1 08 Q2 08 Q3 08 Q4 08 2008 Q1 09 Q2 09 Q3 09 Q4 09 2009 Q1 10 Q2 10 Q3 10 Q4 10 2010
GEA Food Solutions1) n.a. n.a. n.a. n.a. n.a. n.a. n.a. n.a. n.a. n.a. n.a. n.a. n.a. n.a. n.a.
GEA Farm Technologies 107.8 106.0 111.1 77.5 77.5 86.0 89.5 77.2 61.5 61.5 77.1 89.4 80.6 63.1 63.1
GEA Heat Exchangers 1,348.3 1,344.1 1,291.7 1,172.1 1,172.1 1,203.6 1,165.3 1,142.6 1,008.6 1,008.6 1,006.7 1,061.1 1,071.3 1,086.9 1,086.9
GEA Mechanical Equipment 290.8 357.5 376.5 338.0 338.0 325.6 303.5 285.2 280.8 280.8 298.3 319.1 306.1 284.1 284.1
GEA Process Engineering 850.7 830.9 826.6 666.2 666.2 651.5 658.2 627.9 660.2 660.2 757.6 821.2 788.9 813.0 813.0
GEA Refrigeration Technologies 241.9 235.5 236.8 204.1 204.1 222.4 231.7 196.7 169.9 169.9 183.8 203.9 205.9 183.8 183.8
GEA Group 2,822.6 2,857.8 2,823.8 2,450.7 2,450.7 2,476.2 2,435.3 2,312.2 2,164.1 2,164.1 2,301.1 2,468.5 2,423.7 2,414.0 2,414.0
Sales
[in EUR million] Q1 08 Q2 08 Q3 08 Q4 08 2008 Q1 09 Q2 09 Q3 09 Q4 09 2009 Q1 10 Q2 10 Q3 10 Q4 10 2010
GEA Food Solutions1) 91.8 99.1 98.5 104.8 394.2 89.0 79.8 82.8 82.5 334.1 101.0 99.8 93.1 103.7 397.6
GEA Farm Technologies 94.9 123.9 138.5 147.1 504.5 86.6 98.5 112.0 114.7 411.8 85.4 106.6 119.8 134.9 446.7
GEA Heat Exchangers 398.7 449.8 481.7 529.0 1,859.2 387.0 421.2 372.0 443.1 1,623.4 340.9 370.8 361.6 410.1 1,483.4
GEA Mechanical Equipment 196.9 190.7 210.9 211.2 809.7 200.0 179.9 163.8 174.0 717.5 156.7 173.7 193.1 201.9 725.4
GEA Process Engineering 328.2 395.8 364.5 398.9 1,487.4 270.7 281.9 278.1 313.2 1,144.0 256.9 298.5 330.9 402.2 1,288.5
GEA Refrigeration Technologies 132.5 159.3 142.9 175.9 610.6 122.3 136.9 148.2 158.2 565.6 117.4 135.3 139.7 171.3 563.7
GEA Group 1,127.2 1,295.8 1,318.0 1,438.0 5,179.0 1,054.5 1,103.9 1,060.8 1,191.9 4,411.2 938.2 1,065.1 1,124.7 1,290.4 4,418.4
EBITDA reported
[in EUR million] Q1 08 Q2 08 Q3 08 Q4 08 2008 Q1 09 Q2 09 Q3 09 Q4 09 2009 Q1 10 Q2 10 Q3 10 Q4 10 2010
GEA Food Solutions1) -4.5 7.0 9.4 7.6 19.4 -2.9 4.9 7.0 6.4 15.5 13.5 10.3 5.5 6.8 36.2
GEA Farm Technologies 6.0 13.6 21.3 21.5 62.3 0.8 6.0 10.2 5.9 23.0 3.8 5.7 11.7 13.1 34.3
GEA Heat Exchangers 42.6 55.7 65.2 79.8 243.2 35.5 30.7 35.2 59.4 160.8 32.1 23.4 18.7 15.2 89.4
GEA Mechanical Equipment 30.1 32.9 32.8 43.5 139.3 26.7 23.1 26.6 27.1 103.5 24.8 25.3 28.9 45.2 124.1
GEA Process Engineering 12.1 26.1 28.0 47.0 113.2 10.2 14.0 11.2 30.9 66.4 14.7 19.8 22.8 48.1 105.4
GEA Refrigeration Technologies 7.7 11.9 11.7 16.9 48.1 4.0 8.1 3.9 6.6 22.5 3.7 7.5 7.1 2.6 21.0
GEA Group 94.5 138.6 152.7 200.1 585.9 76.7 82.3 87.9 121.8 368.7 76.8 83.3 86.7 118.9 365.7
EBITDA-Margin reported
[in %] Q1 08 Q2 08 Q3 08 Q4 08 2008 Q1 09 Q2 09 Q3 09 Q4 09 2009 Q1 10 Q2 10 Q3 10 Q4 10 2010
GEA Food Solutions1) -4.9% 7.1% 9.5% 7.2% 4.9% -3.2% 6.2% 8.4% 7.8% 4.6% 13.4% 10.3% 5.9% 6.6% 9.1%
GEA Farm Technologies 6.3% 11.0% 15.4% 14.6% 12.4% 0.9% 6.1% 9.1% 5.2% 5.6% 4.4% 5.4% 9.8% 9.7% 7.7%
GEA Heat Exchangers 10.7% 12.4% 13.5% 15.1% 13.1% 9.2% 7.3% 9.5% 13.4% 9.9% 9.4% 6.3% 5.2% 3.7% 6.0%
GEA Mechanical Equipment 15.3% 17.3% 15.5% 20.6% 17.2% 13.4% 12.8% 16.2% 15.6% 14.4% 15.8% 14.6% 14.9% 22.4% 17.1%
GEA Process Engineering 3.7% 6.6% 7.7% 11.8% 7.6% 3.8% 5.0% 4.0% 9.9% 5.8% 5.7% 6.6% 6.9% 12.0% 8.2%
GEA Refrigeration Technologies 5.8% 7.5% 8.2% 9.6% 7.9% 3.3% 5.9% 2.6% 4.2% 4.0% 3.2% 5.5% 5.1% 1.5% 3.7%
GEA Group 8.4% 10.7% 11.6% 13.9% 11.3% 7.3% 7.5% 8.3% 10.2% 8.4% 8.2% 7.8% 7.7% 9.2% 8.3%

engineering for a better world
Backup: Performance GEA Group & Segments Key Figures Time Line (2/5)
Presentation Results FY 2012 - March 11, 2013 45
Order Intake
[In EUR million] Q1 11 Q2 11 Q3 11 Q4 11 2011 Q1 12 Q2 12 Q3 12 Q4 12 2012
GEA Food Solutions1) 125.5 102.3 107.9 119.6 329.8 97.4 95.8 81.7 101.0 375.9
GEA Farm Technologies 125.9 129.5 140.3 131.7 527.4 148.1 145.7 147.4 142.6 583.9
GEA Heat Exchangers 375.5 445.6 369.8 462.3 1,653.2 406.1 379.0 375.1 349.7 1,509.8
GEA Mechanical Equipment 219.2 230.1 221.6 203.9 874.9 238.7 233.2 245.4 254.6 971.9
GEA Process Engineering 401.5 426.2 433.3 449.0 1,709.9 511.3 401.2 468.5 469.2 1,850.2
GEA Refrigeration Technologies 152.7 162.8 164.8 170.1 650.4 177.9 180.4 200.1 197.8 756.2
GEA Group 1,242.1 1,462.5 1,402.8 1,502.2 5,609.7 1,544.9 1,401.0 1,477.3 1,477.9 5,901.1
Order Backlog
[In EUR million] Q1 11 Q2 11 Q3 11 Q4 11 2011 Q1 12 Q2 12 Q3 12 Q4 12 2012
GEA Food Solutions1) 104.4 109.2 105.0 85.5 85.5 122.8 111.2 97.4 107.3 107.3
GEA Farm Technologies 85.4 92.5 93.9 74.4 74.4 104.5 117.3 107.1 79.9 79.9
GEA Heat Exchangers 1,092.5 1,135.4 1,063.5 1,086.0 1,086.0 1,103.2 1,074.1 1,045.5 933.3 933.3
GEA Mechanical Equipment 304.1 322.0 340.9 309.7 309.7 323.7 341.7 345.1 331.1 331.1
GEA Process Engineering 888.2 927.4 972.2 951.2 951.2 1,082.3 1,104.5 1,142.5 1,069.6 1,069.6
GEA Refrigeration Technologies 210.4 206.6 206.1 197.0 197.0 224.4 245.8 265.4 257.0 257.0
GEA Group 2,666.6 2,770.6 2,755.7 2,677.3 2,677.3 2,935.6 2,967.4 2,967.8 2,751.6 2,751.6
Sales
[in EUR million] Q1 11 Q2 11 Q3 11 Q4 11 2011 Q1 12 Q2 12 Q3 12 Q4 12 2012
GEA Food Solutions1) 112.9 103.3 112.1 130.6 346.0 52.7 101.6 90.1 88.0 332.4
GEA Farm Technologies 99.6 118.3 138.1 153.8 509.8 117.8 133.1 157.8 172.3 580.9
GEA Heat Exchangers 338.1 390.9 424.2 463.6 1,616.8 389.7 404.3 392.1 422.7 1,608.8
GEA Mechanical Equipment 191.6 207.8 204.9 240.4 844.7 216.7 217.6 238.5 261.2 933.9
GEA Process Engineering 300.8 385.1 394.7 496.6 1,577.2 373.2 401.2 423.6 518.3 1,716.3
GEA Refrigeration Technologies 132.8 166.6 166.2 181.6 647.2 149.5 165.2 177.0 203.1 694.8
GEA Group 1,038.0 1,349.0 1,397.4 1,632.2 5,416.5 1,263.7 1,391.3 1,445.6 1,619.6 5,720.1
EBITDA reported
[in EUR million] Q1 11 Q2 11 Q3 11 Q4 11 2011 Q1 12 Q2 12 Q3 12 Q4 12 2012
GEA Food Solutions1) 6.2 -13.2 8.6 12.0 7.4 -43.1 -0.8 -4.8 -20.7 -69.4
GEA Farm Technologies 5.0 8.4 15.0 16.8 45.2 5.0 11.3 17.8 24.3 58.3
GEA Heat Exchangers 29.5 35.3 46.9 48.6 160.3 32.6 35.9 37.5 61.5 167.5
GEA Mechanical Equipment 32.7 44.6 43.5 57.9 178.7 40.2 44.5 53.2 66.9 204.8
GEA Process Engineering 20.0 31.2 38.6 73.4 163.2 20.1 39.4 42.7 76.0 178.3
GEA Refrigeration Technologies 8.9 14.3 14.1 21.7 59.0 11.0 13.4 16.0 24.9 65.2
GEA Group 91.9 116.0 167.4 234.9 610.2 64.9 142.6 163.1 227.2 597.8
EBITDA-Margin reported
[in %] Q1 11 Q2 11 Q3 11 Q4 11 2011 Q1 12 Q2 12 Q3 12 Q4 12 2012
GEA Food Solutions1) 5.5% -12.8% 7.7% 9.2% 2.1% -81.8% -0.7% -5.3% -23.5% -20.9%
GEA Farm Technologies 5.0% 7.1% 10.8% 10.9% 8.9% 4.2% 8.5% 11.3% 14.1% 10.0%
GEA Heat Exchangers 8.7% 9.0% 11.1% 10.5% 9.9% 8.4% 8.9% 9.6% 14.5% 10.4%
GEA Mechanical Equipment 17.1% 21.5% 21.2% 24.1% 21.2% 18.6% 20.4% 22.3% 25.6% 21.9%
GEA Process Engineering 6.6% 8.1% 9.8% 14.8% 10.3% 5.4% 9.8% 10.1% 14.7% 10.4%
GEA Refrigeration Technologies 6.7% 8.6% 8.5% 12.0% 9.1% 7.3% 8.1% 9.0% 12.2% 9.4%
GEA Group 8.9% 8.6% 12.0% 14.4% 11.3% 5.1% 10.3% 11.3% 14.0% 10.5%

engineering for a better world 46
Backup: Performance GEA Group & Segments Key Figures Time Line (3/5)
Presentation Results FY 2012 - March 11, 2013
EBIT before PPA & non-recurring items
[in EUR million] Q1 08 Q2 08 Q3 08 Q4 08 2008 Q1 09 Q2 09 Q3 09 Q4 09 2009 Q1 10 Q2 10 Q3 10 Q4 10 2010
GEA Food Solutions1) -8.6 3.4 6.1 4.4 5.3 -8.2 1.5 3.7 3.4 0.4 9.5 7.0 1.6 3.1 21.2
GEA Farm Technologies 4.3 11.9 19.5 19.5 55.2 -1.3 6.0 8.6 7.0 20.3 1.0 3.1 8.8 13.4 26.3
GEA Heat Exchangers 36.5 49.3 58.4 72.3 216.6 28.5 29.8 37.0 49.0 144.3 24.5 25.1 29.2 40.0 118.8
GEA Mechanical Equipment 27.2 29.9 29.6 39.7 126.4 23.3 19.4 24.7 32.8 100.2 20.8 22.8 33.6 39.7 117.0
GEA Process Engineering 9.5 23.5 25.2 43.6 101.8 8.0 14.2 18.0 35.5 75.7 11.5 17.2 19.8 44.7 93.2
GEA Refrigeration Technologies 5.9 10.0 9.9 15.4 41.2 2.5 6.6 3.1 8.9 21.1 1.9 6.3 7.3 13.9 29.4
GEA Group 77.1 120.6 133.6 179.1 510.4 57.9 73.3 89.4 121.4 341.9 54.4 73.6 94.5 144.3 366.8
EBIT-Margin before PPA & non-recurring items
[in %] Q1 08 Q2 08 Q3 08 Q4 08 2008 Q1 09 Q2 09 Q3 09 Q4 09 2009 Q1 10 Q2 10 Q3 10 Q4 10 2010
GEA Food Solutions1) -9.4% 3.4% 6.2% 4.2% 1.3% -9.2% 1.9% 4.5% 4.1% 0.1% 9.4% 7.0% 1.7% 3.0% 5.3%
GEA Farm Technologies 4.6% 9.6% 14.1% 13.2% 10.9% -1.5% 6.1% 7.6% 6.1% 4.9% 1.2% 2.9% 7.4% 9.9% 5.9%
GEA Heat Exchangers 9.2% 11.0% 12.1% 13.7% 11.7% 7.4% 7.1% 9.9% 11.1% 8.9% 7.2% 6.8% 8.1% 9.8% 8.0%
GEA Mechanical Equipment 13.8% 15.7% 14.0% 18.8% 15.6% 11.6% 10.8% 15.1% 18.8% 14.0% 13.3% 13.1% 17.4% 19.7% 16.1%
GEA Process Engineering 2.9% 5.9% 6.9% 10.9% 6.8% 3.0% 5.0% 6.5% 11.3% 6.6% 4.5% 5.8% 6.0% 11.1% 7.2%
GEA Refrigeration Technologies 4.5% 6.3% 6.9% 8.7% 6.8% 2.0% 4.8% 2.1% 5.6% 3.7% 1.6% 4.6% 5.3% 8.1% 5.2%
GEA Group 6.8% 9.3% 10.1% 12.5% 9.9% 5.5% 6.6% 8.4% 10.2% 7.8% 5.8% 6.9% 8.4% 11.2% 8.3%
EBIT before restructuring2)
[in EUR million] Q1 08 Q2 08 Q3 08 Q4 08 2008 Q1 09 Q2 09 Q3 09 Q4 09 2009 Q1 10 Q2 10 Q3 10 Q4 10 2010
GEA Food Solutions1) n.a. n.a. n.a. n.a. n.a. n.a. n.a. n.a. n.a. n.a. n.a. n.a. n.a. n.a. n.a.
GEA Farm Technologies 4.1 11.6 18.8 18.8 53.4 -1.6 5.6 7.9 6.6 18.5 0.5 2.5 8.2 12.6 23.9
GEA Heat Exchangers 36.4 49.1 58.1 71.8 215.4 27.9 29.2 36.4 48.5 142.0 23.9 24.5 28.6 37.2 114.3
GEA Mechanical Equipment 27.0 29.7 29.4 39.5 125.6 23.0 19.2 24.5 32.6 99.3 20.6 22.6 33.4 39.5 116.2
GEA Process Engineering 9.2 23.1 24.8 43.1 100.2 7.6 13.7 17.6 35.0 73.9 11.1 16.7 19.3 44.1 91.3
GEA Refrigeration Technologies 5.9 9.8 9.7 15.2 40.7 2.2 6.4 2.9 8.0 19.4 1.6 6.0 7.1 13.6 28.3
GEA Group 76.1 119.3 131.8 177.1 504.2 56.0 71.2 87.2 118.8 333.2 52.3 71.4 92.3 139.7 355.8
Capital Employed w/o goodwill3) (average LTM)
[in EUR million] Q1 08 Q2 08 Q3 08 Q4 08 2008 Q1 09 Q2 09 Q3 09 Q4 09 2009 Q1 10 Q2 10 Q3 10 Q4 10 2010
GEA Food Solutions1) n.a. n.a. n.a. n.a. n.a. n.a. n.a. n.a. n.a. n.a. n.a. n.a. n.a. n.a. n.a.
GEA Farm Technologies n.a. n.a. n.a. 204.0 204.0 219.7 235.5 241.7 241.4 241.4 250.5 260.9 271.3 284.0 284.0
GEA Heat Exchangers n.a. n.a. n.a. 707.3 707.3 757.2 789.7 793.4 752.0 752.0 711.8 687.1 677.7 672.8 672.8
GEA Mechanical Equipment n.a. n.a. n.a. 349.8 349.8 364.3 371.3 374.2 367.7 367.7 346.5 327.9 309.9 300.7 300.7
GEA Process Engineering n.a. n.a. n.a. 270.6 270.6 274.2 276.2 269.7 255.1 255.1 241.1 235.7 237.8 238.9 238.9
GEA Refrigeration Technologies n.a. n.a. n.a. 221.1 221.1 236.8 249.9 258.6 258.7 258.7 244.9 226.6 202.4 177.9 177.9
GEA Group n.a. n.a. n.a. 1,772.4 1,772.4 1,853.4 1,903.4 1,899.0 1,835.9 1,835.9 1,780.9 1,750.3 1,738.4 1,739.9 1,739.9
ROCE w/o goodwill4) LTM
[in%] Q1 08 Q2 08 Q3 08 Q4 08 2008 Q1 09 Q2 09 Q3 09 Q4 09 2009 Q1 10 Q2 10 Q3 10 Q4 10 2010
GEA Food Solutions1) n.a. n.a. n.a. n.a. n.a. n.a. n.a. n.a. n.a. n.a. n.a. n.a. n.a. n.a. n.a.
GEA Farm Technologies n.a. n.a. n.a. 26.2% 26.2% 21.7% 17.7% 12.7% 7.7% 7.7% 8.2% 6.7% 6.6% 8.4% 8.4%
GEA Heat Exchangers n.a. n.a. n.a. 30.5% 30.5% 27.3% 23.7% 20.8% 18.9% 18.9% 19.4% 19.4% 18.5% 17.0% 17.0%
GEA Mechanical Equipment n.a. n.a. n.a. 35.9% 35.9% 33.4% 29.9% 28.4% 27.0% 27.0% 28.0% 30.6% 35.2% 38.6% 38.6%
GEA Process Engineering n.a. n.a. n.a. 37.0% 37.0% 36.0% 32.3% 30.4% 29.0% 29.0% 32.1% 34.1% 34.6% 38.2% 38.2%
GEA Refrigeration Technologies n.a. n.a. n.a. 18.4% 18.4% 15.6% 13.4% 10.3% 7.5% 7.5% 7.7% 8.1% 11.2% 15.9% 15.9%
GEA Group n.a. n.a. n.a. 28.4% 28.4% 26.1% 22.9% 20.6% 18.2% 18.2% 18.5% 18.8% 19.3% 20.4% 20.4%

engineering for a better world 47
Backup: Performance GEA Group & Segments Key Figures Time Line (4/5)
Presentation Results FY 2012 - March 11, 2013
EBIT before PPA & non-recurring items
[in EUR million] Q1 11 Q2 11 Q3 11 Q4 11 2011 Q1 12 Q2 12 Q3 12 Q4 12 2012
GEA Food Solutions1) 2.8 4.0 5.5 10.2 19.6 -9.4 1.8 -0.2 -4.7 -12.4
GEA Farm Technologies 2.1 5.6 12.1 14.0 33.8 1.9 8.3 14.7 21.6 46.4
GEA Heat Exchangers 20.8 26.5 37.9 36.7 121.8 24.0 27.6 31.3 52.1 135.0
GEA Mechanical Equipment 28.6 40.5 39.3 53.8 162.1 36.3 40.9 49.5 61.7 188.4
GEA Process Engineering 16.5 27.6 34.6 69.4 148.2 16.6 35.8 39.1 71.4 162.8
GEA Refrigeration Technologies 7.1 12.3 11.9 20.1 51.3 8.7 11.1 13.8 22.6 56.2
GEA Group 69.0 109.7 139.8 206.1 524.6 74.9 122.7 146.9 217.1 561.6
EBIT-Margin before PPA & non-recurring items
[in %] Q1 11 Q2 11 Q3 11 Q4 11 2011 Q1 12 Q2 12 Q3 12 Q4 12 2012
GEA Food Solutions1) 2.5% 3.8% 4.9% 7.8% 5.7% -17.8% 1.8% -0.3% -5.3% -3.7%
GEA Farm Technologies 2.1% 4.7% 8.7% 9.1% 6.6% 1.6% 6.2% 9.3% 12.5% 8.0%
GEA Heat Exchangers 6.1% 6.8% 8.9% 7.9% 7.5% 6.2% 6.8% 8.0% 12.3% 8.4%
GEA Mechanical Equipment 14.9% 19.5% 19.2% 22.4% 19.2% 16.8% 18.8% 20.8% 23.6% 20.2%
GEA Process Engineering 5.5% 7.2% 8.8% 14.0% 9.4% 4.4% 8.9% 9.2% 13.8% 9.5%
GEA Refrigeration Technologies 5.3% 7.4% 7.2% 11.0% 7.9% 5.8% 6.7% 7.8% 11.1% 8.1%
GEA Group 6.6% 8.1% 10.0% 12.6% 9.7% 5.9% 8.8% 10.2% 13.4% 9.8%
EBIT before restructuring2)
[in EUR million] Q1 11 Q2 11 Q3 11 Q4 11 2011 Q1 12 Q2 12 Q3 12 Q4 12 2012
GEA Food Solutions1) n.a. -22.6 -0.2 6.8 -16.0 -48.5 -5.3 -9.8 -39.3 -102.8
GEA Farm Technologies 1.5 5.0 11.4 13.2 31.1 1.2 7.5 13.9 20.3 43.0
GEA Heat Exchangers 20.2 25.7 37.2 35.0 118.0 23.4 27.0 30.6 49.2 130.2
GEA Mechanical Equipment 28.4 40.3 39.1 53.5 161.2 35.9 39.9 48.5 61.2 185.4
GEA Process Engineering 16.1 27.2 34.1 68.8 146.1 15.9 35.0 38.1 71.0 159.9
GEA Refrigeration Technologies 6.8 10.6 11.1 18.0 46.6 8.2 10.6 13.3 22.0 54.0
GEA Group 66.8 79.3 131.3 197.2 474.6 32.8 111.9 133.3 176.8 454.8
Capital Employed w/o goodwill3) (average LTM)
[in EUR million] Q1 11 Q2 11 Q3 11 Q4 11 2011 Q1 12 Q2 12 Q3 12 Q4 12 2012
GEA Food Solutions1) n.a. n.a. n.a. n.a. n.a. 529.5 530.1 526.8 519.8 519.8
GEA Farm Technologies 288.6 289.7 292.5 297.7 297.7 302.1 308.2 314.8 319.3 319.3
GEA Heat Exchangers 680.7 684.2 691.6 694.6 694.6 690.5 688.2 675.9 669.9 669.9
GEA Mechanical Equipment 303.6 308.4 317.6 328.8 328.8 345.1 373.5 402.3 429.7 429.7
GEA Process Engineering 237.4 235.8 238.7 249.0 249.0 273.3 290.0 296.7 286.0 286.0
GEA Refrigeration Technologies 176.5 187.8 205.4 225.9 225.9 241.8 249.0 253.6 254.7 254.7
GEA Group 1,796.3 1,949.7 2,128.3 2,314.2 2,314.2 2,462.7 2,518.1 2,548.2 2,556.5 2,556.5
ROCE w/o goodwill4) LTM
[in%] Q1 11 Q2 11 Q3 11 Q4 11 2011 Q1 12 Q2 12 Q3 12 Q4 12 2012
GEA Food Solutions1) n.a. n.a. n.a. n.a. n.a. -12.2% -8.9% -10.8% -19.8% -19.8%
GEA Farm Technologies 8.6% 9.5% 10.5% 10.4% 10.4% 10.2% 10.8% 11.4% 13.5% 13.5%
GEA Heat Exchangers 16.2% 16.3% 17.4% 17.0% 17.0% 17.6% 17.8% 17.2% 19.4% 19.4%
GEA Mechanical Equipment 40.8% 45.9% 46.4% 49.0% 49.0% 48.9% 45.1% 44.2% 43.2% 43.2%
GEA Process Engineering 40.5% 45.2% 50.9% 58.7% 58.7% 53.4% 53.0% 53.2% 55.9% 55.9%
GEA Refrigeration Technologies 19.0% 20.3% 20.5% 20.6% 20.6% 19.8% 19.2% 19.7% 21.2% 21.2%
GEA Group 20.6% 19.4% 19.6% 20.5% 20.5% 17.9% 18.8% 18.6% 17.8% 17.8%

engineering for a better world 48
Backup: Performance GEA Group & Segments Key Figures Time Line (5/5): Remarks
Presentation Results FY 2012 - March 11, 2013
1) All historical figures for GEA FS before Q2 2011 are pro-forma figures only and haven't been audited due to the fact that GEA
FS's Financial Year was ending end of February. The listed historical figures before Q2 2011 are not included in the Group-
numbers of the corresponding period.
2) Restructuring only in FY 2009 and FY 2010.
3) Capital employed excluding goodwill from the acquisition of the former GEA AG by the former Metallgesellschaft AG in 1999.
4) ROCE LTM = EBIT before restructuring (LTM) / Capital employed excluding goodwill from the acquisition of the former GEA AG
by the former Metallgesellschaft AG in 1999 (average LTM).
2011 figures adjusted due to change in accounting policy for pension obligations and leasing obligations.
Related Documents


